Embed Size (px)
Citation preview
Cost of Processing in Cheese, Whey, Butter and Nonfat Dry Milk Plants
Mark Stephenson, Ph.D.Cornell Program on Dairy Markets and Policy
September 1, 2006
Cornell University has been conducting cost of processing studies in the dairy industry for more than 30 years. Original work back in the 1970s and 80s included the Dairy In-formation Management System, or DMIS, which was a project to collect and summarize monthly fluid milk plant processing costs. Later work by the Cornell Program on Dairy Markets and Policy (CPDMP) included studies on the cost of processing cheese1,2, whey3, butter, nonfat dry milk powder4,5, again fluid milk6 and more recently ultrafiltered milk. This project assesses the costs of processing in cheddar cheese, dry whey, butter and nonfat dry milk plants and builds on knowledge and background of these earlier ef-forts.
This report is considered to be a “working paper” and not the final report from this pro-ject. The data and observations reported here are not tentative but the final report will further explore reasons as to why costs vary from plant-to-plant. This paper will only document plant selection, data collection, methodology and processing cost summaries.
– 1 –
1 Mesa-Dishington, Jens K., Richard D. Aplin, and David M. Barbano., "Economic Performance of 11 Cheddar Cheese Manufacturing Plants in Northeast and North Central Regions, Part 1 of a Research Effort on Cheddar Cheese Manufacturing.", A.E. Res. 87-2, Dept. of Agr. Econ., Cornell Univ., January 1987.
2 Mesa-Dishington, Jens K., David M. Barbano, and Richard D. Aplin., "Cheddar Cheese Manufacturing Costs, Economies of Size and Effects of Different Current Technologies, Part 2 of a Research Effort on Cheddar Cheese Manufacturing.", A.E.Res. 87-3, Dept. of Agr. Econ., Cornell Univ., January 1987.
3 Hurst, Susan, Richard Aplin, and David Barbano., "Whey Powder and Whey Protein Concentrate Pro-duction Technology, Costs and Profitability, Part 4 of a Research Effort on Cheddar Cheese Manufactur-ing.", A.E.Res. 90-4, Dept. of Agr. Econ., Cornell Univ., April 1990.
4 Stephenson, Mark W. and Andrew M. Novakovic., "Manufacturing Costs in Ten Butter/Powder Process-ing Plants.", A.E.Res. 89-19, Dept. of Agr. Econ., Cornell Univ., September 1989.
5 Stephenson, Mark W. and Andrew M. Novakovic., "Determination of Butter/Powder Plant Manufacturing Costs Utilizing an Economic Engineering Approach.", A.E.Res. 90-6, Dept. of Agr. Econ., Cornell Univ., June 1990.
6 Erba, Eric M., Richard D. Aplin, and Mark W. Stephenson., "Labor Productivities and Costs in 35 of the Best Fluid Milk Plants in the U.S.", E.B. 97-03, Dept. of Agr., Res., and Mgrl. Econ., Cornell Univ., March 1997.
Plant Selection
In previous studies, participating plants were carefully selected to be “best practice” plants and plants with a fairly narrow product mix. We have always included plants of various sizes but we looked for plants that were considered by industry observers to be efficient, low-cost processors at any given size. One of the objectives of those studies was to determine the cost “frontier”, or the lowest possible costs over a range of plant capacities.
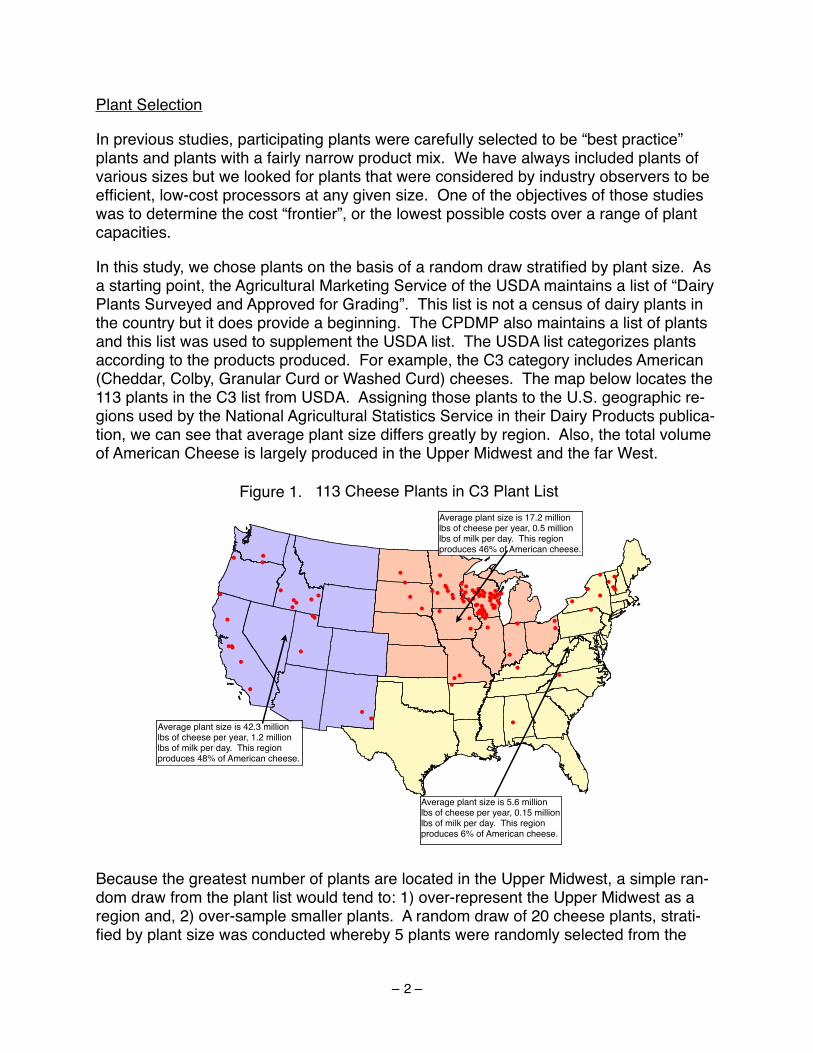
In this study, we chose plants on the basis of a random draw stratified by plant size. As a starting point, the Agricultural Marketing Service of the USDA maintains a list of “Dairy Plants Surveyed and Approved for Grading”. This list is not a census of dairy plants in the country but it does provide a beginning. The CPDMP also maintains a list of plants and this list was used to supplement the USDA list. The USDA list categorizes plants according to the products produced. For example, the C3 category includes American (Cheddar, Colby, Granular Curd or Washed Curd) cheeses. The map below locates the 113 plants in the C3 list from USDA. Assigning those plants to the U.S. geographic re-gions used by the National Agricultural Statistics Service in their Dairy Products publica-tion, we can see that average plant size differs greatly by region. Also, the total volume of American Cheese is largely produced in the Upper Midwest and the far West.
113 Cheese Plants in C3 Plant List
!
!
!
!
!
!
!
!!
!
!!
!
!!
!
!!
!
!
!
!
!
!
!
!
!
!!
!
!
!
!!
!
!
!
!
!
!
!
!
!
!
!!
!!
!
!
!
!
!
!
!
!!!
!
! !!
!
!
!
!
!! !
!!!
!
!!!!
!
!!
!
!!
!!!
!
!
!
!
!
!!
!
! !
!!!
!
!!
! !
!
!!!!
!!!
!
Average plant size is 42.3 million lbs of cheese per year, 1.2 million lbs of milk per day. This region produces 48% of American cheese.
Average plant size is 5.6 million lbs of cheese per year, 0.15 million lbs of milk per day. This region produces 6% of American cheese.
Average plant size is 17.2 million lbs of cheese per year, 0.5 million lbs of milk per day. This region produces 46% of American cheese.
Because the greatest number of plants are located in the Upper Midwest, a simple ran-dom draw from the plant list would tend to: 1) over-represent the Upper Midwest as a region and, 2) over-sample smaller plants. A random draw of 20 cheese plants, strati-fied by plant size was conducted whereby 5 plants were randomly selected from the
– 2 –
Figure 1.
largest 10 percent of plants in the country (outside of California7) and 15 were selected from the remaining 90 percent of plants.
Butter and nonfat dry milk plants were also selected by random draw but because the population of these plants is so much smaller, no stratification was done. The goal was to survey 8 nonfat dry milk plants and 10 butter operations.
In addition to plants producing cheddar cheese and/or dry whey, nonfat dry milk and/or butter, plants had to produce these products in one or more of the package sizes that are surveyed in the National Agricultural Statistics Service report on Dairy Product Prices. I.e., 40 lb. blocks of cheese, 500 lb. barrels of cheese, dry whey in bags, totes or bulk, butter in 68 lb. or 25 kg. boxes and nonfat dry milk in bags, totes or bulk.
As with previous cost of processing studies conducted by the CPDMP, voluntary partici-pation in this project has been excellent. Of all plants selected in the draw and invited to participate, only two have declined. In our experience, this is a fairly normal re-sponse rate. These two plants were replaced in a subsequent draw.
Data Collection
Previous projects had further narrowed plant participation to operations with a fairly nar-row product mix. If we were targeting cheddar cheese plants, then we sought plants producing almost exclusively cheddar cheese. This restriction has the advantage of easier cost allocation but increasingly, it is difficult to find such singular product produc-tion. This project was not restrictive to product mix except to note that one or more of the products of interest and package sizes had to be produced at the plant.
Earlier survey work was also conducted with a printed survey form. Using fixed formats, such as a printed survey, requires that you have enough pages to cover all possible products, package sizes, labor, utilities, etc. for all possible plant configurations. Al-though filling out such a survey might be relatively “sparse matrix” for any given plant, the document would be daunting and might diminish participation.
For this project, a computer program was developed that would build a questionnaire based on responses to previous questions. For example, first identifying products pro-duced at the plant generated subsequent questions about package sizes and monthly production of the individual products. And, identifying package sizes then generated questions about the packaging costs for those particular containers. Versions of the program are available for Windows 95 through XP, Macintosh Classic through OSX and Unix platforms.
When surveys were complete, they were submitted as an email attachment or directly from the program. The electronic data collection process streamlined the data entry
– 3 –
7 California plants are already surveyed by the California Department of Food and Agriculture.
and reduced possible re-entry errors from keying data into a computer from the paper forms. Anecdotal evidence from participants indicate that completing the survey re-quired between 4 and 8 hours of work depending on the complexity of the plant and the sophistication of the information retrieval systems of the company. Appendix A includes the directions for the Cost of Processing (COP) program with example screen shots for a cheese plant. This gives an idea of the questions that were asked and the data col-lected.
Methods
Key questions regarding methods include: 1) What is included in the cost of processing and 2) How are costs allocated across products produced?
The cost of processing is intended to capture the costs of transforming milk and other dairy ingredients into the dairy products of interest. There is no need to consider the cost of the milk or dairy ingredients purchased nor is there a need to know dollar value of the sales of the finished product. We are not trying to determine profitability of plants, just the cost of processing.
While it might seem as though this strict definition of product transformation would make the definition of included and excluded costs as different as black and white, there are grey areas. One of those areas includes sales and general administrative costs. We try to separate the overhead costs required to own and operate a processing plant from the marketing expense. Product must be sold for plants to be viable, however, and market-ing costs can vary tremendously depending on your target channel (e.g., are plants sell-ing consumer packages to higher end retailers or delivering bulk products to firms spe-cializing in final product marketing). For this reason, all sales expenses are excluded from the cost of processing figures. However, some plants are charged a “headquar-ters” expense. This expense often covers centralized services such as legal, account-ing, etc. that would otherwise be line items in a plant’s general ledger.
Anywhere plant expenses can be directly allocated to a particular products, plants are asked to do so. A good example is utility expense where individual electric or gas me-ters can be recorded and assigned to a product line such as cheese or powdered prod-ucts. Some expenses must be indirectly allocated to products.
Labor costs are identified by job function. Functional areas depend on the product mix but include such centers as receiving and tanker washing, cheese processing, cheese packaging, dryer labor, powder bagging, cold room, etc. Cheese processing or packag-ing labor are clearly assigned to cheese labor costs. However, job functions such as receiving and tanker washing should have labor apportioned to both cheese production, whey processing, etc. Any cost that cannot be clearly assigned to a single product line is apportioned according to the percent of milk solids processed in the various product lines. For example, a plant that brought in 100 pounds of raw milk and processed it into cheese, dry whey and whey cream might have sold 5.85 lbs of solids (fat and solids-not-
– 4 –
fat) in the cheese, 6.12 lbs of solids in the dry whey and 0.20 lbs of solids in the whey cream. This would mean that $10,000 of labor in the receiving and tanker washing cen-ter would be apportioned as $4,807 to cheese, $5,029 to dry whey and $164 to whey cream. Any other costs which are unallocated to specific product lines are apportioned indirectly in the same way as the labor cost example.
The California Department of Food and Agriculture’s (CDFA) Division of Marketing Serv-ices has compiled and published manufacturing cost data for many years. They utilize exactly the same method of allocating processing costs across product lines. This pro-ject follows CDFA’s procedures for determining processing costs with few exceptions. One exception is that the California data is audited. CPDMP has no such audit author-ity but the comparability of methods means that the CPDMP results can use the CDFA summaries as a useful benchmark. In other words, we would expect that comparable plants would have comparable processing costs across the two separate efforts. If there were questions about a plant’s costs, the plant was contacted and asked to verify their data.
Every plant’s data is scrutinized for completeness and accuracy relative to internal and external benchmarks. All data reported here have satisfied the researcher as to rea-sonable measures of accuracy and integrity. Moreover, nearly all plants in the survey have been visited by CPDMP for a visual assessment of plant layout, product flow and to note any unusual characteristics of the operations.
Another exception to CDFA’s procedures is in the calculation of return on investment (ROI). Normally, ROI is a calculation based on the profit of the firm relative to the value of the assets needed to generate the profit (the investment). We are not collecting in-formation on the sale of products nor on the cost of the major ingredients (milk) in this project. As such, we cannot calculate a firm’s profit nor the ROI. However, an allow-ance for a ROI is viewed as an opportunity cost for the firm. If the firm invested the value of the capital assets in another venture or in financial instruments, they would ex-pect a return.
CDFA calculates a ROI allowance based on the book value of individual assets depreci-ated by their own schedule. This is an attempt to determine a true economic deprecia-tion and not a tax value depreciation (which tends to undervalue older plant and equip-ment). Determining the original purchase price and setting up a depreciation schedule for every building and piece of equipment for each plant is beyond the scope of this pro-ject. Plant’s were asked to provide “market value of assets” for the plant and this is the value that is used to calculate a ROI allowance.
Valuation of assets is half of the information needed to calculate a ROI allowance—a suitable rate of return is the other. CDFA is currently using the Moody’s Baa corporate bond index as their rate and this project does also. This index is considered to be a medium-grade investment vehicle. It is comprised of bonds better than “junk” status but not as solid as "gilt edged" bonds—In other words, a middle of the road rate of return. Appendix B shows the monthly Moody’s Baa Corporate Bond Index values for the last three and a half years.
– 5 –
Processing Cost Results
At the time of publication of this report, a few plants had not completed all of their data entry or responded to questions about data submitted. There were 16 cheese and whey plants, 4 butter and 8 nonfat dry milk plants with completed data. Referencing the map on page 2 of this working paper, 6 cheese plants were in the Western region (ex-cluding California), 5 were in the Upper Midwestern region and the remaining 5 were in the Northeastern region. Of the butter and powder plants, 4 were in the Western region (again, not California), 1 was in the Upper Midwestern region and 3 were in the North-east.
Plants were asked to supply one year’s worth of data. Many of the values are re-quested as an annual summary but some are requested on a monthly basis. It is sug-gested that a plant select the most recent twelve-month period which corresponds to their fiscal year. Because the plants have some latitude for time period, the results do not correspond to a calendar year or even to the same twelve-month period. Participat-ing plant data span a 26 month period of time.
Plants may have processed several products but only cheddar cheese, dry whey, butter and nonfat dry milk powder results are presented here. The other products have had processing costs allocated to them in just the same way and those costs are not born by the products of interest.
The reporting format and the cost categories shown here are the same as CDFA’s. “Processing Labor” includes all direct and indirectly allocated labor except for plant management and clerical labor. “Processing Non-Labor” includes all utilities, deprecia-tion, taxes, cleaning, laboratory and general supplies, etc. “Other Ingredient” includes non-dairy additions to the product. Examples include starter culture, coloring, salt, etc. “General & Administrative” includes management and clerical labor (but not sales or marketing), dues, postage, legal & accounting, headquarters expense and short-term interest. The “Return on Investment” is calculated as the applicable Moody’s Baa rate times the market value of the directly and indirectly allocated market value of plant and equipment.
– 6 –
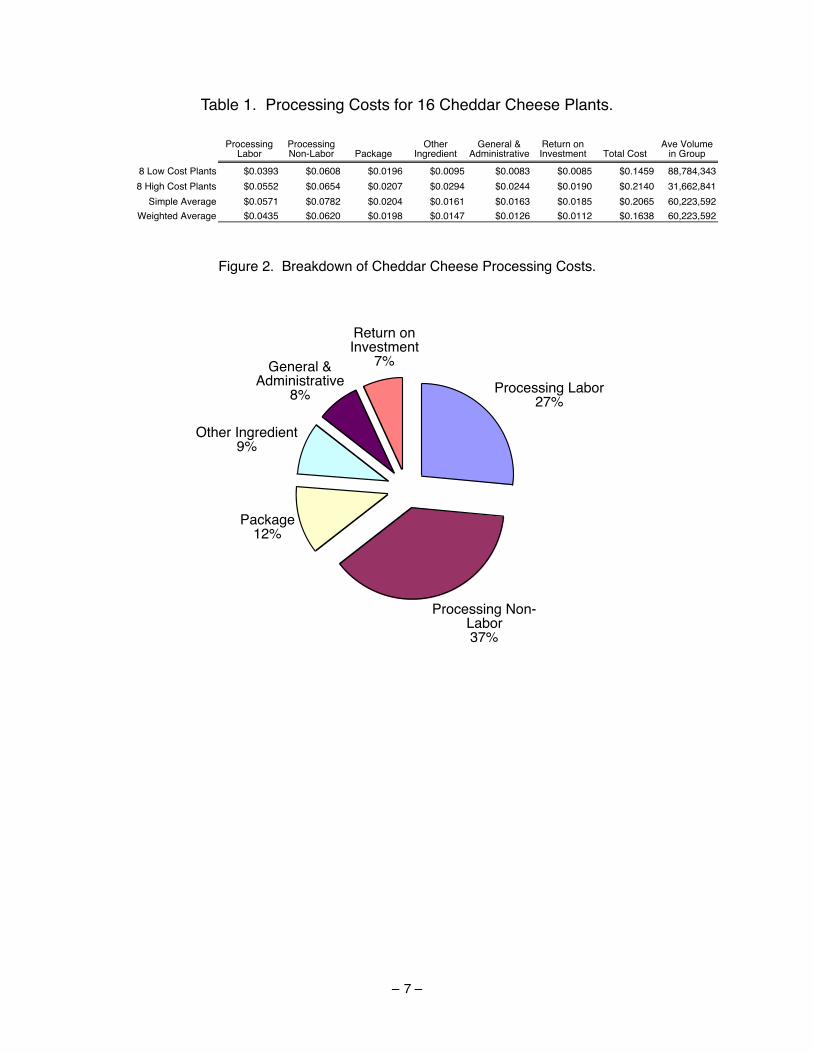
Table 1. Processing Costs for 16 Cheddar Cheese Plants.
Processing Labor
Processing Non-Labor Package
Other Ingredient
General & Administrative
Return on Investment Total Cost
Ave Volume in Group
8 Low Cost Plants $0.0393 $0.0608 $0.0196 $0.0095 $0.0083 $0.0085 $0.1459 88,784,3438 High Cost Plants $0.0552 $0.0654 $0.0207 $0.0294 $0.0244 $0.0190 $0.2140 31,662,841
Simple Average $0.0571 $0.0782 $0.0204 $0.0161 $0.0163 $0.0185 $0.2065 60,223,592Weighted Average $0.0435 $0.0620 $0.0198 $0.0147 $0.0126 $0.0112 $0.1638 60,223,592
Figure 2. Breakdown of Cheddar Cheese Processing Costs.
Processing Labor27%
Processing Non-Labor37%
Package12%
Other Ingredient9%
General & Administrative
8%
Return on Investment
7%
– 7 –
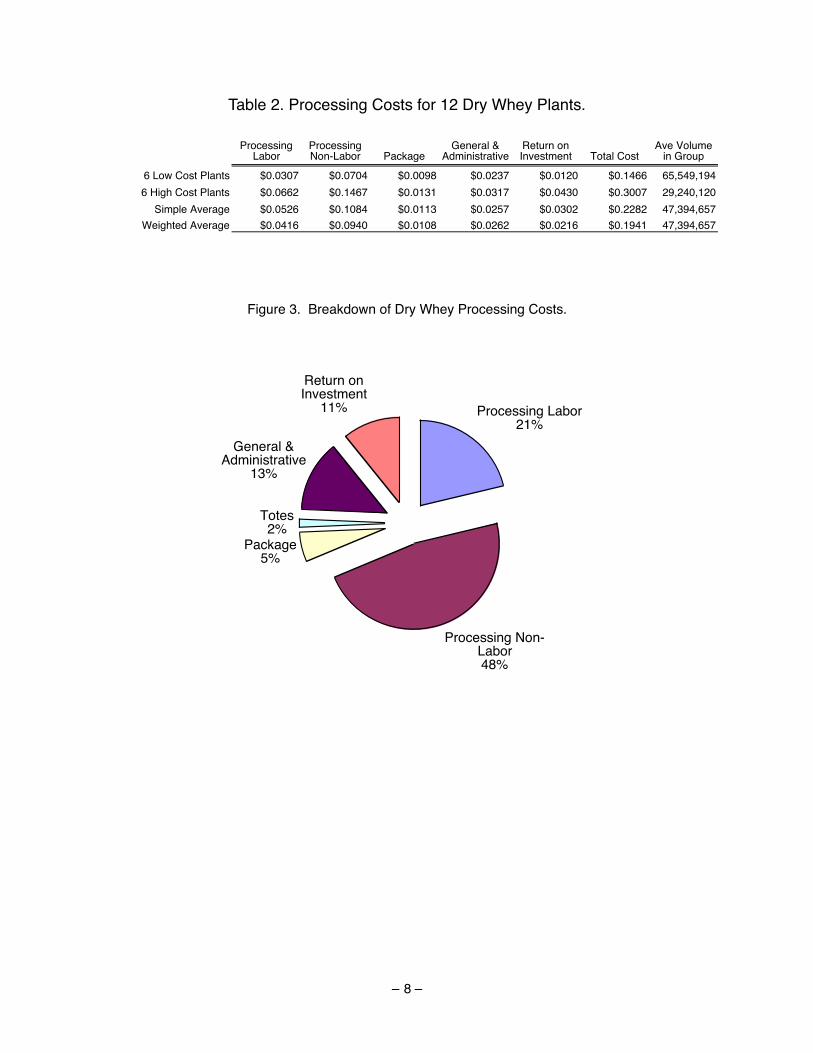
Table 2. Processing Costs for 12 Dry Whey Plants.
Processing Labor
Processing Non-Labor Package Totes
General & Administrative
Return on Investment Total Cost
Ave Volume in Group
6 Low Cost Plants $0.0307 $0.0704 $0.0098 $0.0237 $0.0120 $0.1466 65,549,1946 High Cost Plants $0.0662 $0.1467 $0.0131 $0.0317 $0.0430 $0.3007 29,240,120
Simple Average $0.0526 $0.1084 $0.0113 $0.0257 $0.0302 $0.2282 47,394,657Weighted Average $0.0416 $0.0940 $0.0108 $0.0262 $0.0216 $0.1941 47,394,657
Figure 3. Breakdown of Dry Whey Processing Costs.
Processing Labor21%
Processing Non-Labor48%
Package5%
Totes2%
General & Administrative
13%
Return on Investment
11%
– 8 –
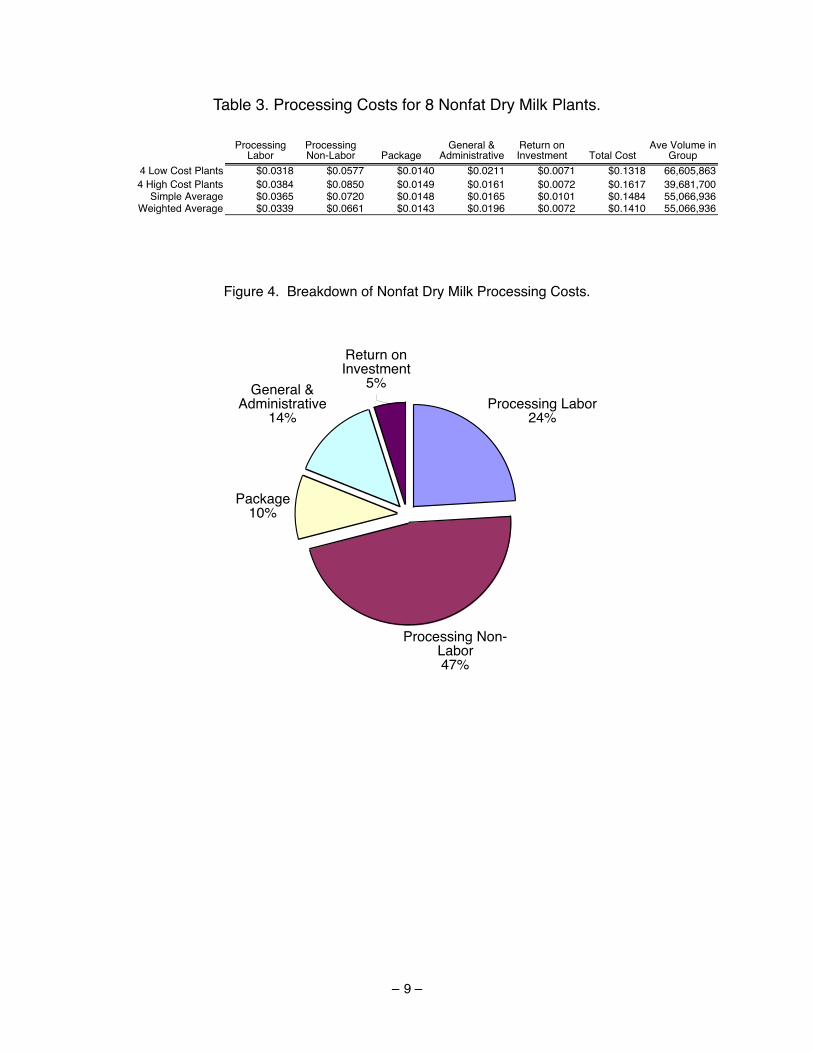
Table 3. Processing Costs for 8 Nonfat Dry Milk Plants.
Processing Labor
Processing Non-Labor Package
General & Administrative
Return on Investment Total Cost
Ave Volume in Group
4 Low Cost Plants $0.0318 $0.0577 $0.0140 $0.0211 $0.0071 $0.1318 66,605,8634 High Cost Plants $0.0384 $0.0850 $0.0149 $0.0161 $0.0072 $0.1617 39,681,700
Simple Average $0.0365 $0.0720 $0.0148 $0.0165 $0.0101 $0.1484 55,066,936Weighted Average $0.0339 $0.0661 $0.0143 $0.0196 $0.0072 $0.1410 55,066,936
Figure 4. Breakdown of Nonfat Dry Milk Processing Costs.
Processing Labor24%
Processing Non-Labor47%
Package10%
General & Administrative
14%
Return on Investment
5%
– 9 –
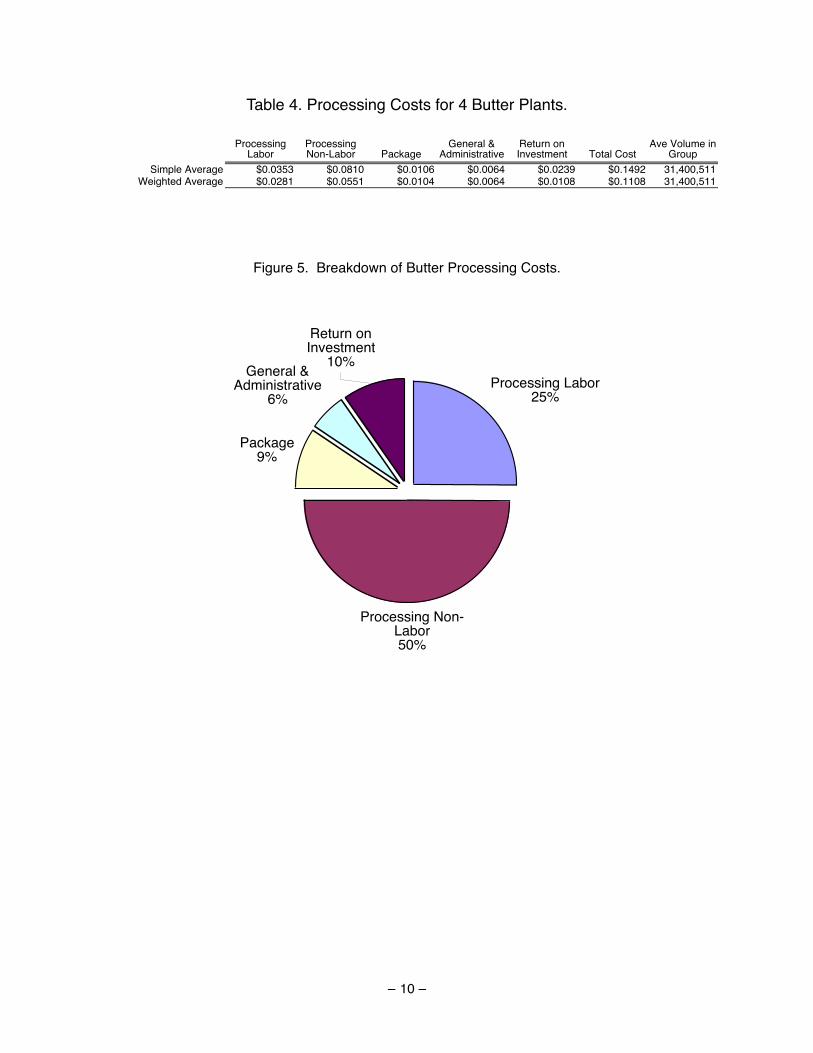
Table 4. Processing Costs for 4 Butter Plants.
Processing Labor
Processing Non-Labor Package
General & Administrative
Return on Investment Total Cost
Ave Volume in Group
Simple Average $0.0353 $0.0810 $0.0106 $0.0064 $0.0239 $0.1492 31,400,511Weighted Average $0.0281 $0.0551 $0.0104 $0.0064 $0.0108 $0.1108 31,400,511
Figure 5. Breakdown of Butter Processing Costs.
Processing Labor25%
Package9%
General & Administrative
6%
Processing Non-Labor50%
Return on Investment
10%
– 10 –
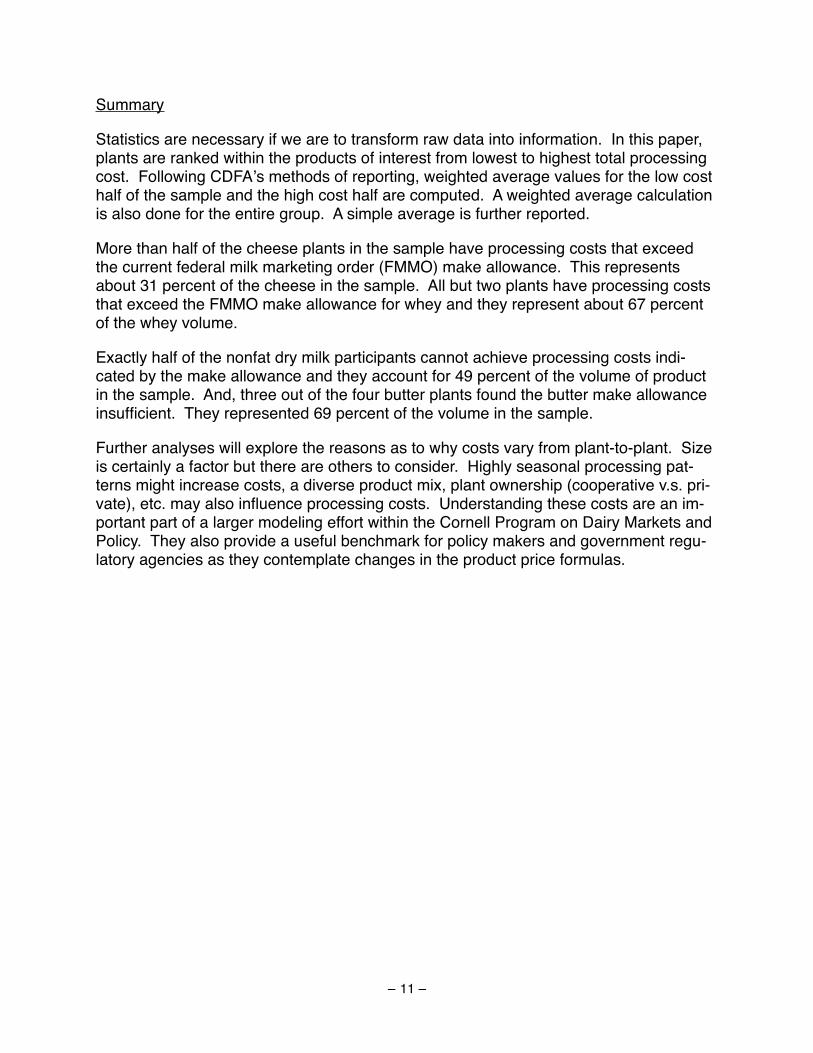
Summary
Statistics are necessary if we are to transform raw data into information. In this paper, plants are ranked within the products of interest from lowest to highest total processing cost. Following CDFA’s methods of reporting, weighted average values for the low cost half of the sample and the high cost half are computed. A weighted average calculation is also done for the entire group. A simple average is further reported.
More than half of the cheese plants in the sample have processing costs that exceed the current federal milk marketing order (FMMO) make allowance. This represents about 31 percent of the cheese in the sample. All but two plants have processing costs that exceed the FMMO make allowance for whey and they represent about 67 percent of the whey volume.
Exactly half of the nonfat dry milk participants cannot achieve processing costs indi-cated by the make allowance and they account for 49 percent of the volume of product in the sample. And, three out of the four butter plants found the butter make allowance insufficient. They represented 69 percent of the volume in the sample.
Further analyses will explore the reasons as to why costs vary from plant-to-plant. Size is certainly a factor but there are others to consider. Highly seasonal processing pat-terns might increase costs, a diverse product mix, plant ownership (cooperative v.s. pri-vate), etc. may also influence processing costs. Understanding these costs are an im-portant part of a larger modeling effort within the Cornell Program on Dairy Markets and Policy. They also provide a useful benchmark for policy makers and government regu-latory agencies as they contemplate changes in the product price formulas.
– 11 –
Appendix A—Directions for Using the Cost of Processing Program
– 12 –
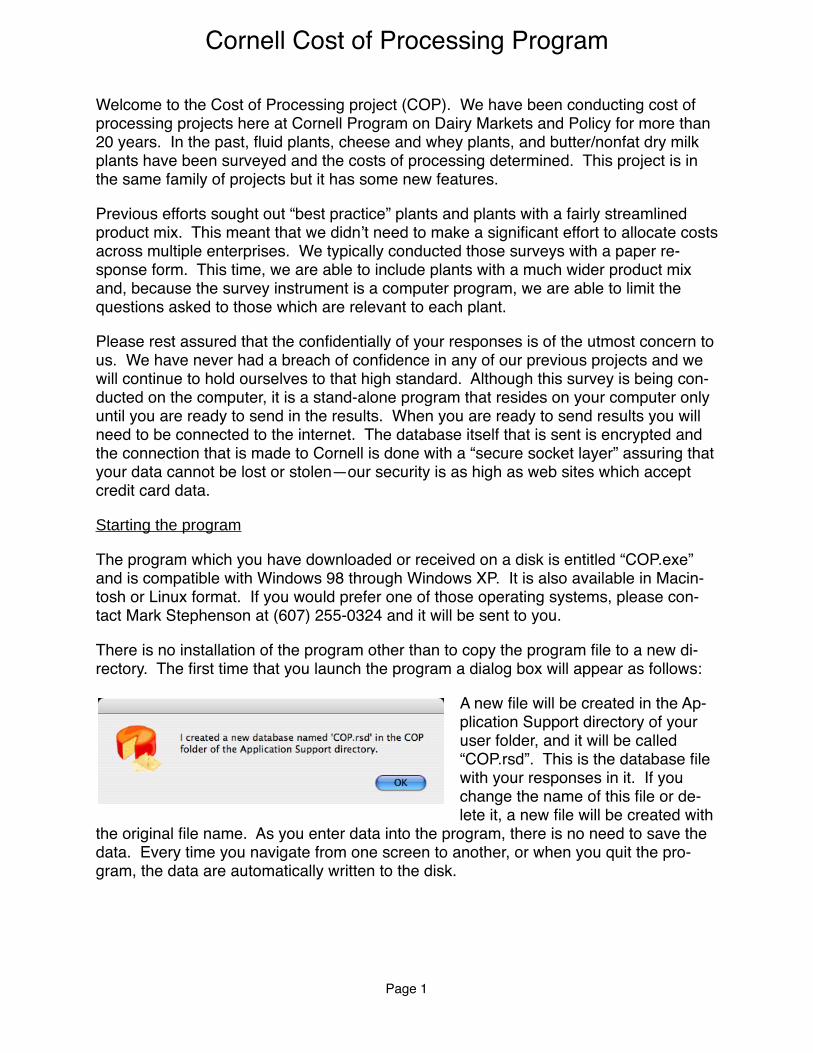
Welcome to the Cost of Processing project (COP). We have been conducting cost of processing projects here at Cornell Program on Dairy Markets and Policy for more than 20 years. In the past, fluid plants, cheese and whey plants, and butter/nonfat dry milk plants have been surveyed and the costs of processing determined. This project is in the same family of projects but it has some new features.
Previous efforts sought out “best practice” plants and plants with a fairly streamlined product mix. This meant that we didn’t need to make a significant effort to allocate costs across multiple enterprises. We typically conducted those surveys with a paper re-sponse form. This time, we are able to include plants with a much wider product mix and, because the survey instrument is a computer program, we are able to limit the questions asked to those which are relevant to each plant.
Please rest assured that the confidentially of your responses is of the utmost concern to us. We have never had a breach of confidence in any of our previous projects and we will continue to hold ourselves to that high standard. Although this survey is being con-ducted on the computer, it is a stand-alone program that resides on your computer only until you are ready to send in the results. When you are ready to send results you will need to be connected to the internet. The database itself that is sent is encrypted and the connection that is made to Cornell is done with a “secure socket layer” assuring that your data cannot be lost or stolen—our security is as high as web sites which accept credit card data.
Starting the program
The program which you have downloaded or received on a disk is entitled “COP.exe” and is compatible with Windows 98 through Windows XP. It is also available in Macin-tosh or Linux format. If you would prefer one of those operating systems, please con-tact Mark Stephenson at (607) 255-0324 and it will be sent to you.
There is no installation of the program other than to copy the program file to a new di-rectory. The first time that you launch the program a dialog box will appear as follows:
A new file will be created in the Ap-plication Support directory of your user folder, and it will be called “COP.rsd”. This is the database file with your responses in it. If you change the name of this file or de-lete it, a new file will be created with
the original file name. As you enter data into the program, there is no need to save the data. Every time you navigate from one screen to another, or when you quit the pro-gram, the data are automatically written to the disk.
Page 1
Cornell Cost of Processing Program
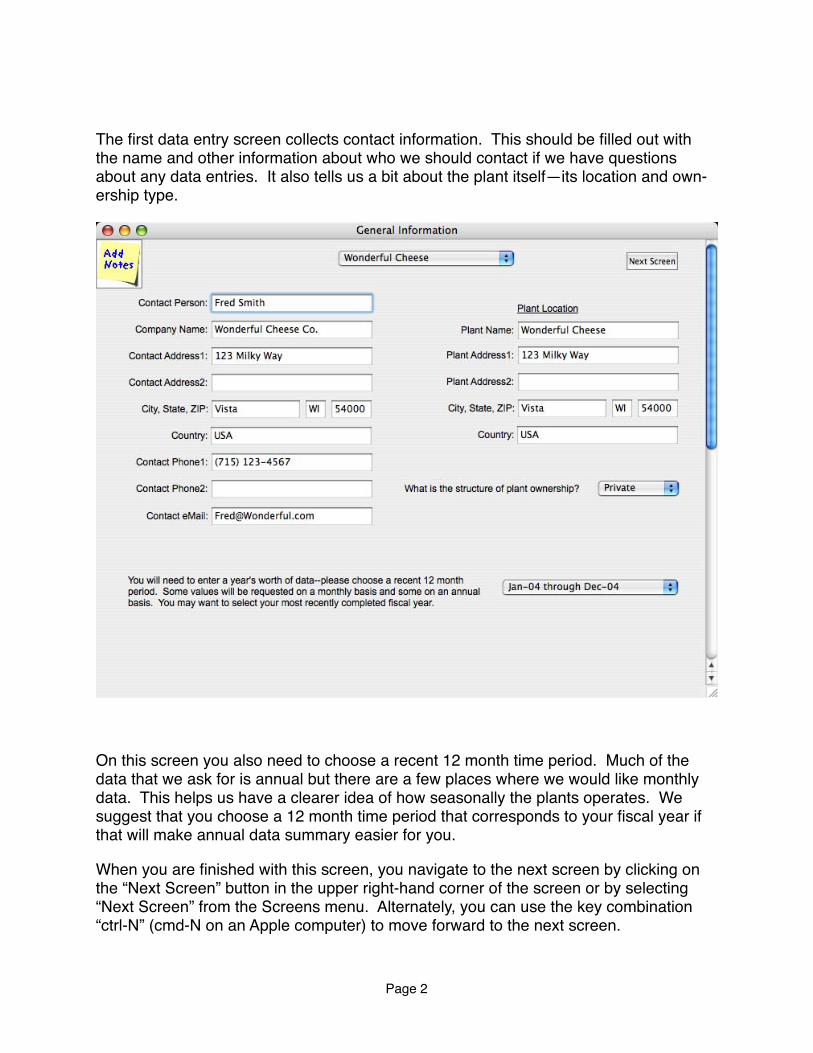
The first data entry screen collects contact information. This should be filled out with the name and other information about who we should contact if we have questions about any data entries. It also tells us a bit about the plant itself—its location and own-ership type.
On this screen you also need to choose a recent 12 month time period. Much of the data that we ask for is annual but there are a few places where we would like monthly data. This helps us have a clearer idea of how seasonally the plants operates. We suggest that you choose a 12 month time period that corresponds to your fiscal year if that will make annual data summary easier for you.
When you are finished with this screen, you navigate to the next screen by clicking on the “Next Screen” button in the upper right-hand corner of the screen or by selecting “Next Screen” from the Screens menu. Alternately, you can use the key combination “ctrl-N” (cmd-N on an Apple computer) to move forward to the next screen.
Page 2
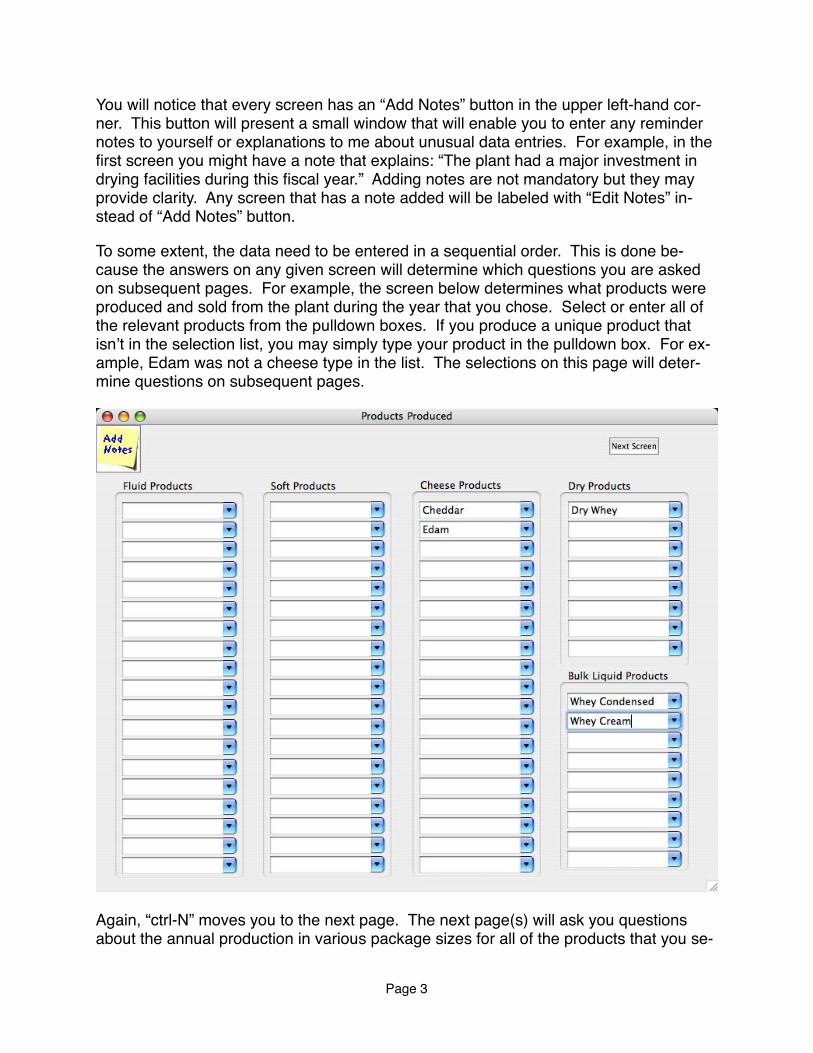
You will notice that every screen has an “Add Notes” button in the upper left-hand cor-ner. This button will present a small window that will enable you to enter any reminder notes to yourself or explanations to me about unusual data entries. For example, in the first screen you might have a note that explains: “The plant had a major investment in drying facilities during this fiscal year.” Adding notes are not mandatory but they may provide clarity. Any screen that has a note added will be labeled with “Edit Notes” in-stead of “Add Notes” button.
To some extent, the data need to be entered in a sequential order. This is done be-cause the answers on any given screen will determine which questions you are asked on subsequent pages. For example, the screen below determines what products were produced and sold from the plant during the year that you chose. Select or enter all of the relevant products from the pulldown boxes. If you produce a unique product that isn’t in the selection list, you may simply type your product in the pulldown box. For ex-ample, Edam was not a cheese type in the list. The selections on this page will deter-mine questions on subsequent pages.
Again, “ctrl-N” moves you to the next page. The next page(s) will ask you questions about the annual production in various package sizes for all of the products that you se-
Page 3
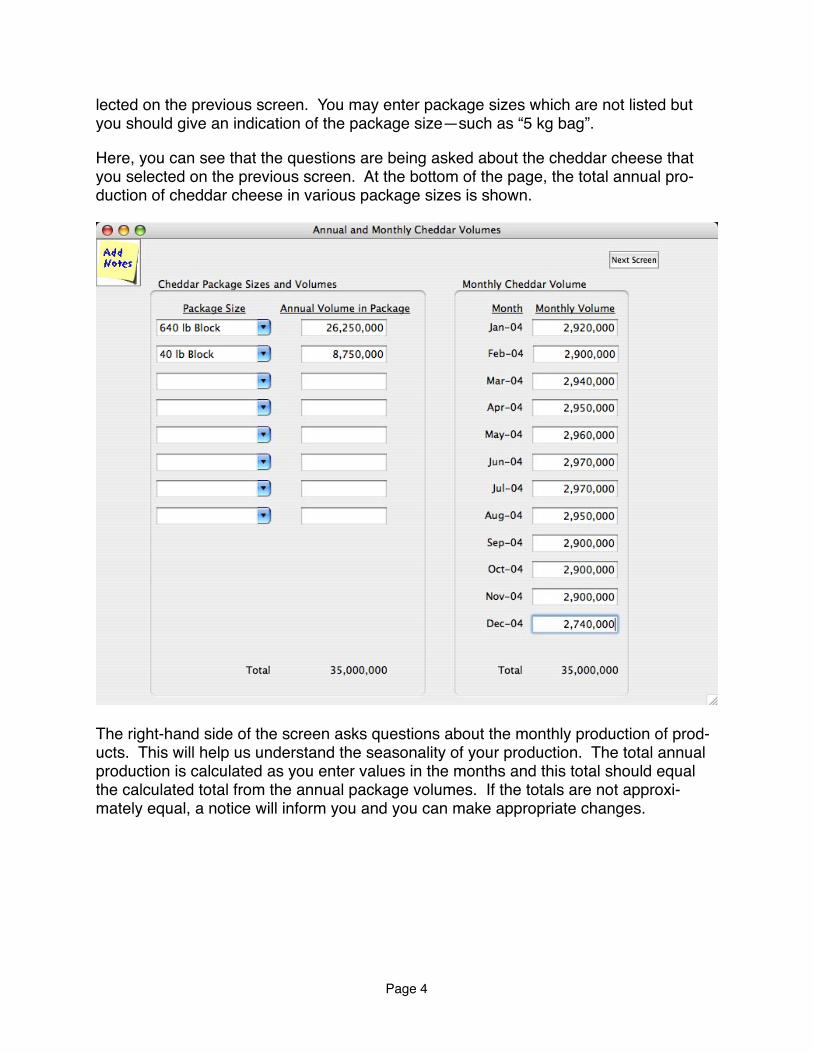
lected on the previous screen. You may enter package sizes which are not listed but you should give an indication of the package size—such as “5 kg bag”.
Here, you can see that the questions are being asked about the cheddar cheese that you selected on the previous screen. At the bottom of the page, the total annual pro-duction of cheddar cheese in various package sizes is shown.
The right-hand side of the screen asks questions about the monthly production of prod-ucts. This will help us understand the seasonality of your production. The total annual production is calculated as you enter values in the months and this total should equal the calculated total from the annual package volumes. If the totals are not approxi-mately equal, a notice will inform you and you can make appropriate changes.
Page 4
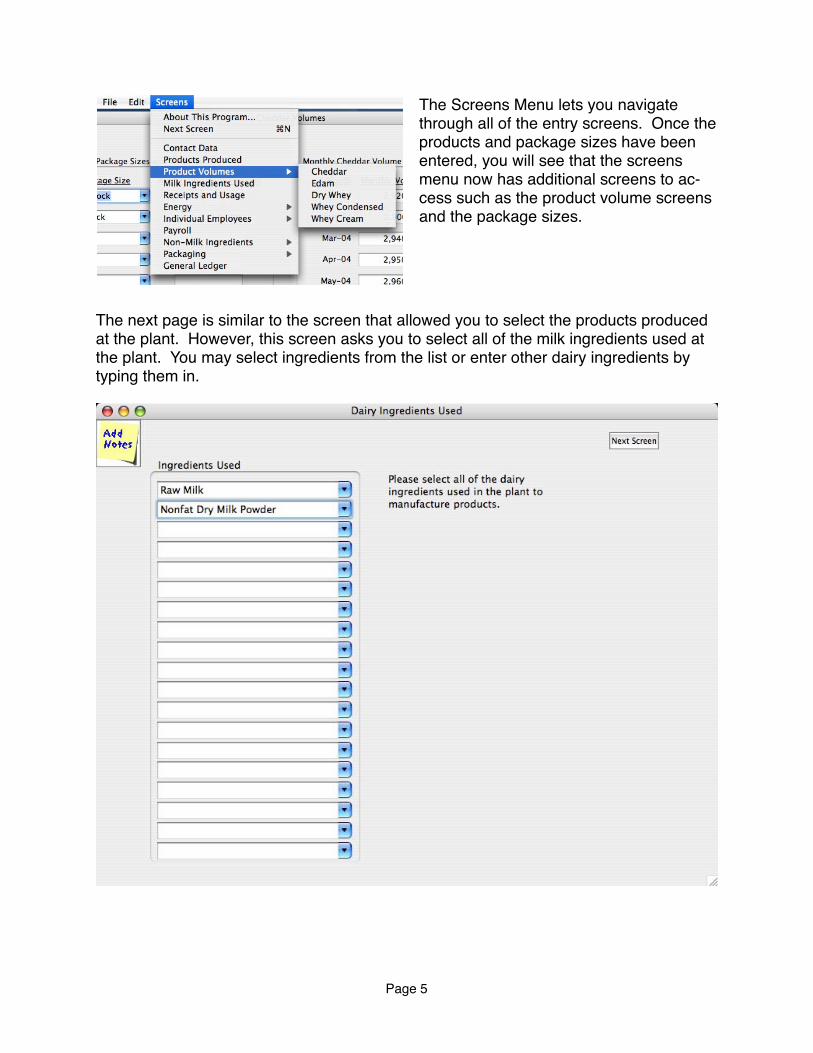
The Screens Menu lets you navigate through all of the entry screens. Once the products and package sizes have been entered, you will see that the screens menu now has additional screens to ac-cess such as the product volume screens and the package sizes.
The next page is similar to the screen that allowed you to select the products produced at the plant. However, this screen asks you to select all of the milk ingredients used at the plant. You may select ingredients from the list or enter other dairy ingredients by typing them in.
Page 5
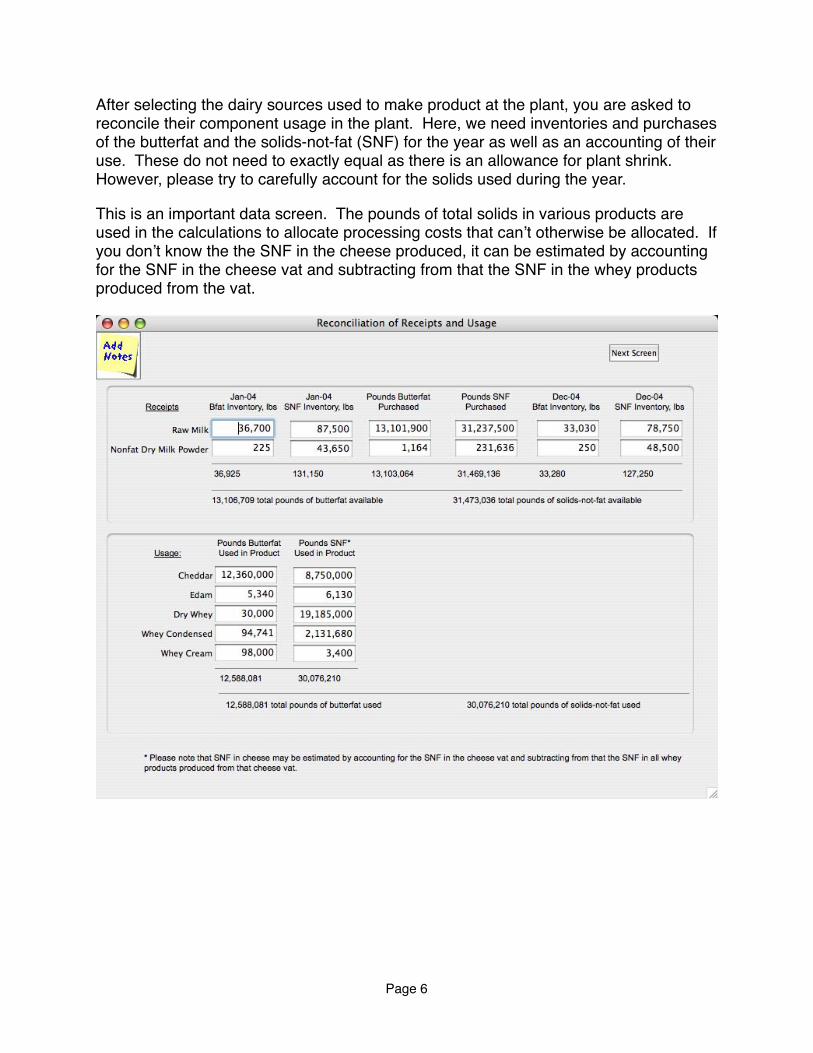
After selecting the dairy sources used to make product at the plant, you are asked to reconcile their component usage in the plant. Here, we need inventories and purchases of the butterfat and the solids-not-fat (SNF) for the year as well as an accounting of their use. These do not need to exactly equal as there is an allowance for plant shrink. However, please try to carefully account for the solids used during the year.
This is an important data screen. The pounds of total solids in various products are used in the calculations to allocate processing costs that can’t otherwise be allocated. If you don’t know the the SNF in the cheese produced, it can be estimated by accounting for the SNF in the cheese vat and subtracting from that the SNF in the whey products produced from the vat.
Page 6
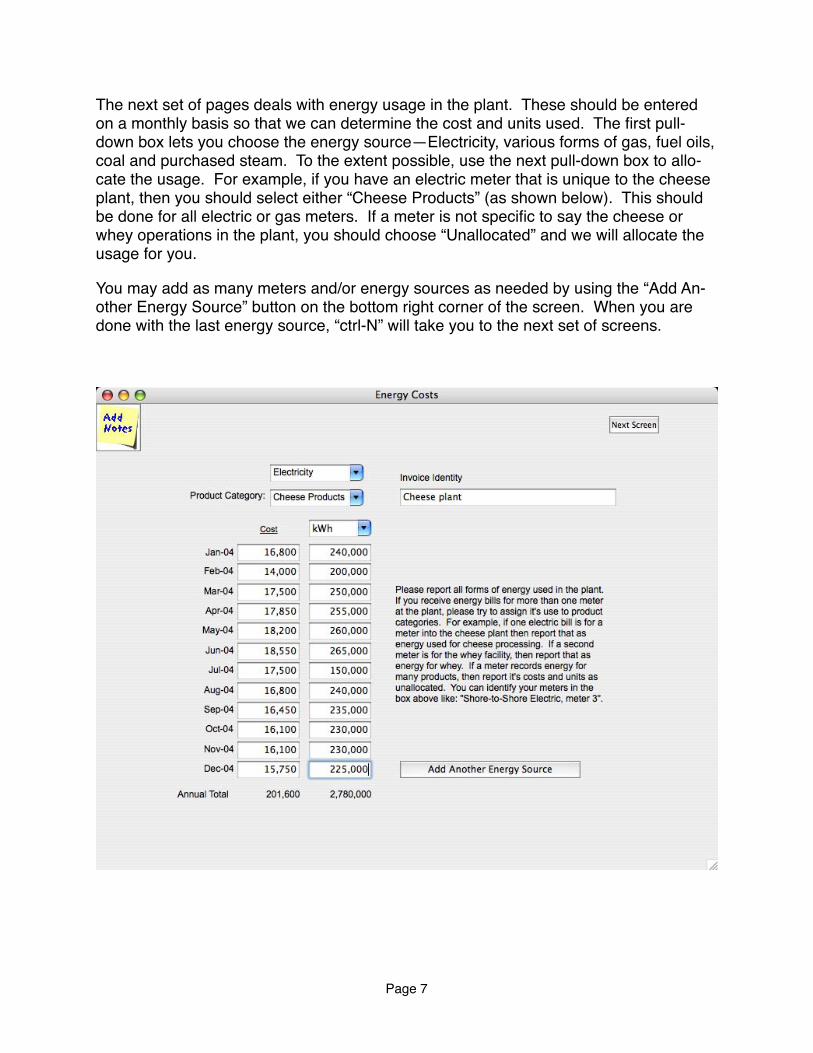
The next set of pages deals with energy usage in the plant. These should be entered on a monthly basis so that we can determine the cost and units used. The first pull-down box lets you choose the energy source—Electricity, various forms of gas, fuel oils, coal and purchased steam. To the extent possible, use the next pull-down box to allo-cate the usage. For example, if you have an electric meter that is unique to the cheese plant, then you should select either “Cheese Products” (as shown below). This should be done for all electric or gas meters. If a meter is not specific to say the cheese or whey operations in the plant, you should choose “Unallocated” and we will allocate the usage for you.
You may add as many meters and/or energy sources as needed by using the “Add An-other Energy Source” button on the bottom right corner of the screen. When you are done with the last energy source, “ctrl-N” will take you to the next set of screens.
Page 7
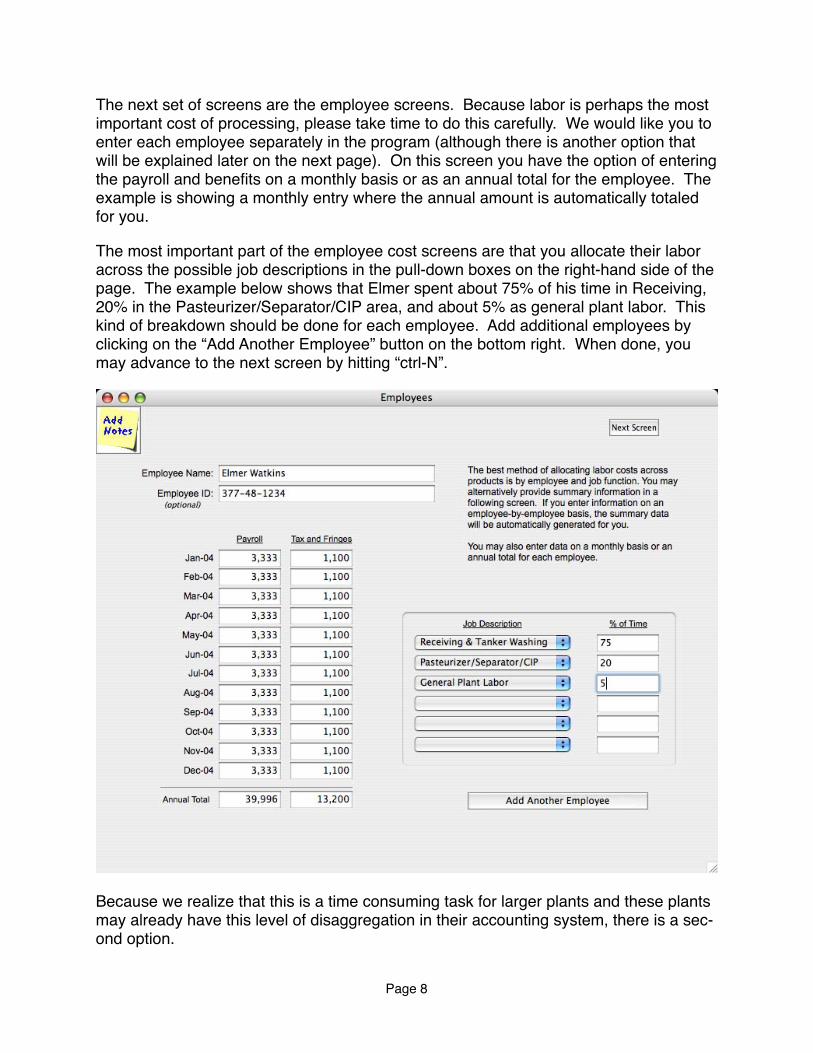
The next set of screens are the employee screens. Because labor is perhaps the most important cost of processing, please take time to do this carefully. We would like you to enter each employee separately in the program (although there is another option that will be explained later on the next page). On this screen you have the option of entering the payroll and benefits on a monthly basis or as an annual total for the employee. The example is showing a monthly entry where the annual amount is automatically totaled for you.
The most important part of the employee cost screens are that you allocate their labor across the possible job descriptions in the pull-down boxes on the right-hand side of the page. The example below shows that Elmer spent about 75% of his time in Receiving, 20% in the Pasteurizer/Separator/CIP area, and about 5% as general plant labor. This kind of breakdown should be done for each employee. Add additional employees by clicking on the “Add Another Employee” button on the bottom right. When done, you may advance to the next screen by hitting “ctrl-N”.
Because we realize that this is a time consuming task for larger plants and these plants may already have this level of disaggregation in their accounting system, there is a sec-ond option.
Page 8
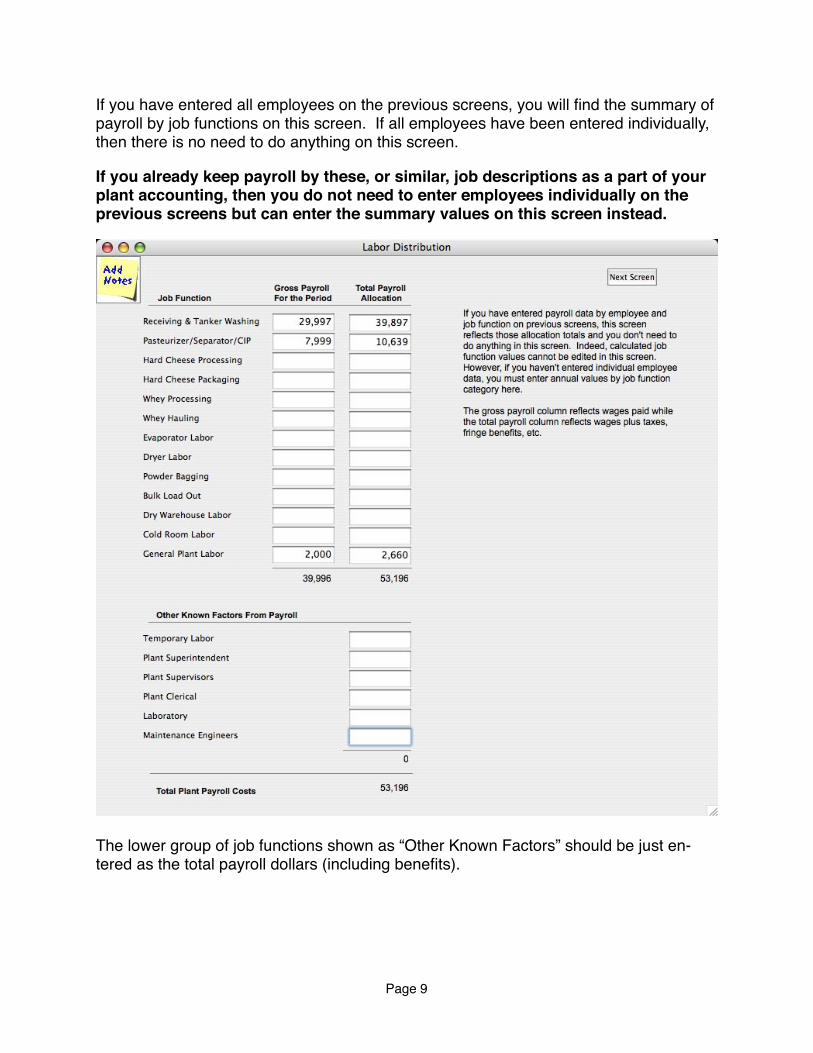
If you have entered all employees on the previous screens, you will find the summary of payroll by job functions on this screen. If all employees have been entered individually, then there is no need to do anything on this screen.
If you already keep payroll by these, or similar, job descriptions as a part of your plant accounting, then you do not need to enter employees individually on the previous screens but can enter the summary values on this screen instead.
The lower group of job functions shown as “Other Known Factors” should be just en-tered as the total payroll dollars (including benefits).
Page 9
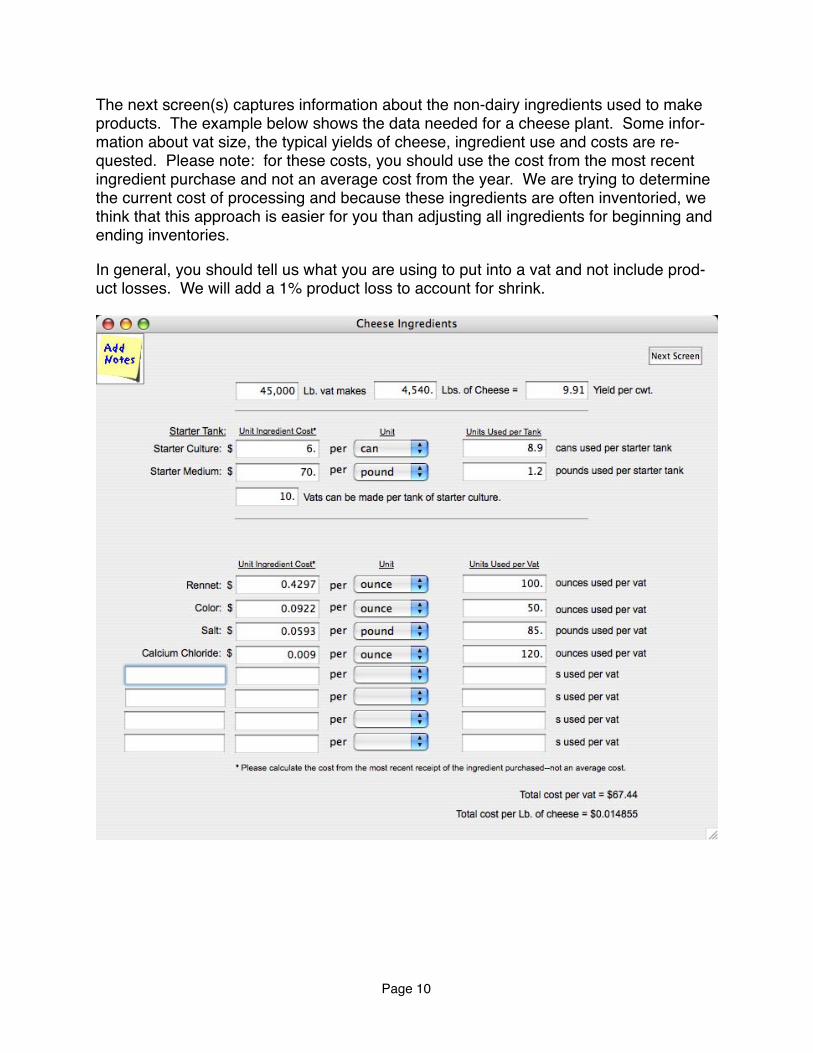
The next screen(s) captures information about the non-dairy ingredients used to make products. The example below shows the data needed for a cheese plant. Some infor-mation about vat size, the typical yields of cheese, ingredient use and costs are re-quested. Please note: for these costs, you should use the cost from the most recent ingredient purchase and not an average cost from the year. We are trying to determine the current cost of processing and because these ingredients are often inventoried, we think that this approach is easier for you than adjusting all ingredients for beginning and ending inventories.
In general, you should tell us what you are using to put into a vat and not include prod-uct losses. We will add a 1% product loss to account for shrink.
Page 10
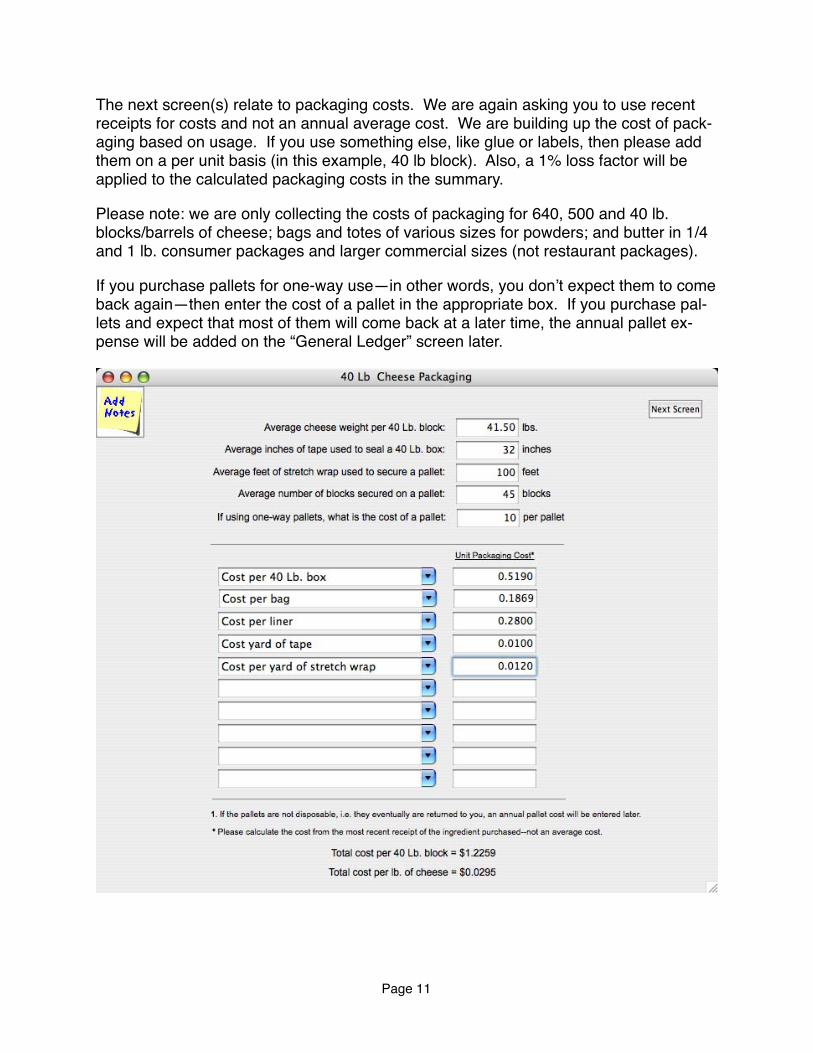
The next screen(s) relate to packaging costs. We are again asking you to use recent receipts for costs and not an annual average cost. We are building up the cost of pack-aging based on usage. If you use something else, like glue or labels, then please add them on a per unit basis (in this example, 40 lb block). Also, a 1% loss factor will be applied to the calculated packaging costs in the summary.
Please note: we are only collecting the costs of packaging for 640, 500 and 40 lb. blocks/barrels of cheese; bags and totes of various sizes for powders; and butter in 1/4 and 1 lb. consumer packages and larger commercial sizes (not restaurant packages).
If you purchase pallets for one-way use—in other words, you don’t expect them to come back again—then enter the cost of a pallet in the appropriate box. If you purchase pal-lets and expect that most of them will come back at a later time, the annual pallet ex-pense will be added on the “General Ledger” screen later.
Page 11
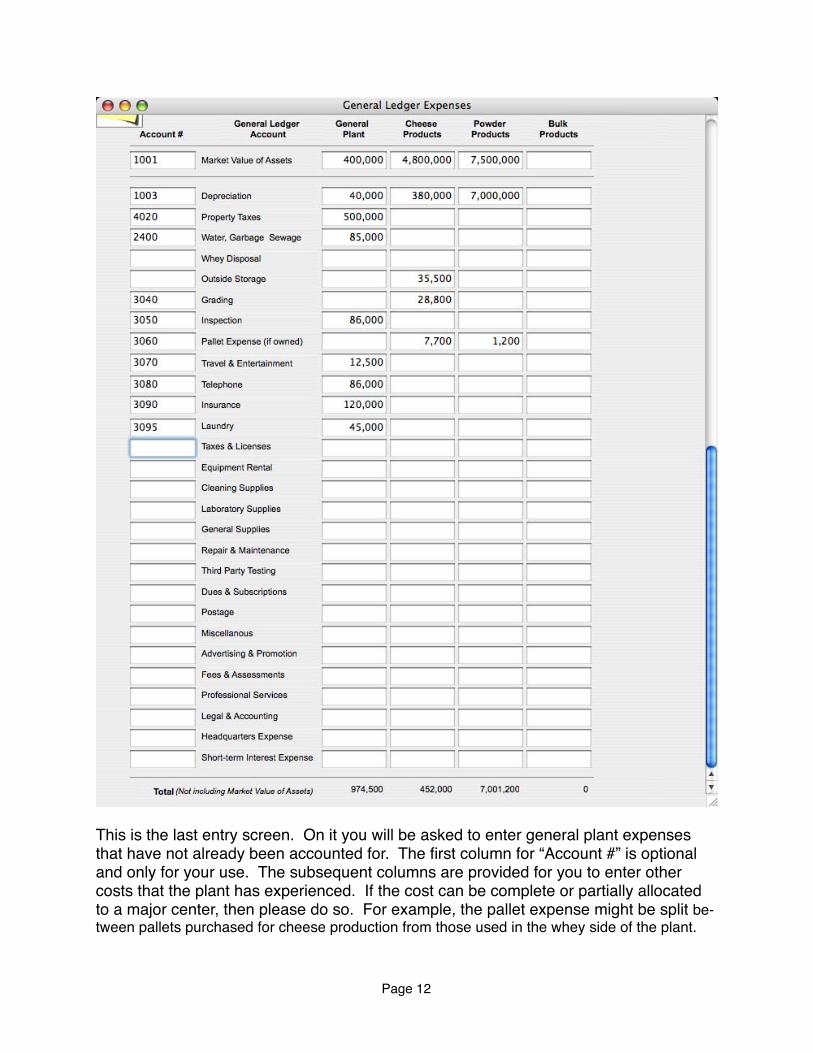
This is the last entry screen. On it you will be asked to enter general plant expenses that have not already been accounted for. The first column for “Account #” is optional and only for your use. The subsequent columns are provided for you to enter other costs that the plant has experienced. If the cost can be complete or partially allocated to a major center, then please do so. For example, the pallet expense might be split be-tween pallets purchased for cheese production from those used in the whey side of the plant.
Page 12
Some costs probably cannot be allocated such as the telephone or laundry expenses. Those should be just entered in the “General Plant” column.
The most accurate accounting of the costs of processing would include the consumption of your capital. In order to do this, we would have to look at an economic depreciation of the plant and equipment—this is beyond the scope of the study. Instead, we are asking for the depreciation that was claimed on your tax forms recognizing that it will overstate the consumption of newer equipment and understate the the loss of older (fully depreciated) equipment.
We are also asking you to provide a market value estimate of your plant and equipment. You probably haven’t considered the sale of your plant recently but you shouldn’t agonize over this number. The number will be used to calculate a return on investment as a legitimate cost of your business.
The bottom of the page also includes a short-term interest expense. This value should not in-clude the interest paid on long-term loans as this value will be captured in the return on invest-ment. However, it should include the interest on loans of one year or less and is meant to re-flect a cost of working capital.
Finishing Up
You may quit the program any time that you wish and return to entering values later. When you quit the program, all data are automatically saved to the file. We consider the current version of the program to be very workable but not final. If your computer is connected to the internet the program will check to see if a newer version is available. We have been correcting errors and adding features as we get feedback from users. If a newer version is available, you will be prompted as to whether you want to download the latest version. If you do, simply replace your existing program with the one you have downloaded. The data file will not have to be altered.
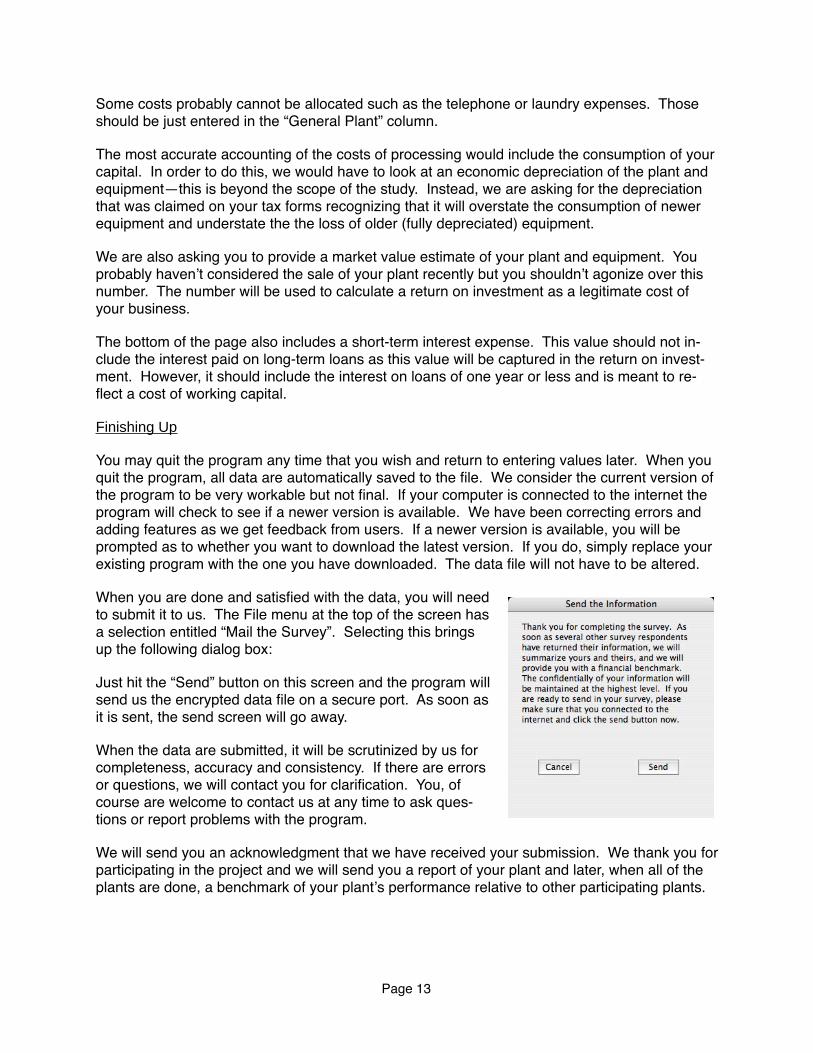
When you are done and satisfied with the data, you will need to submit it to us. The File menu at the top of the screen has a selection entitled “Mail the Survey”. Selecting this brings up the following dialog box:
Just hit the “Send” button on this screen and the program will send us the encrypted data file on a secure port. As soon as it is sent, the send screen will go away.
When the data are submitted, it will be scrutinized by us for completeness, accuracy and consistency. If there are errors or questions, we will contact you for clarification. You, of course are welcome to contact us at any time to ask ques-tions or report problems with the program.
We will send you an acknowledgment that we have received your submission. We thank you for participating in the project and we will send you a report of your plant and later, when all of the plants are done, a benchmark of your plant’s performance relative to other participating plants.
Page 13
Appendix B—Recent Monthly Values for Moody’s Baa Corporate Bond Index
– 14 –
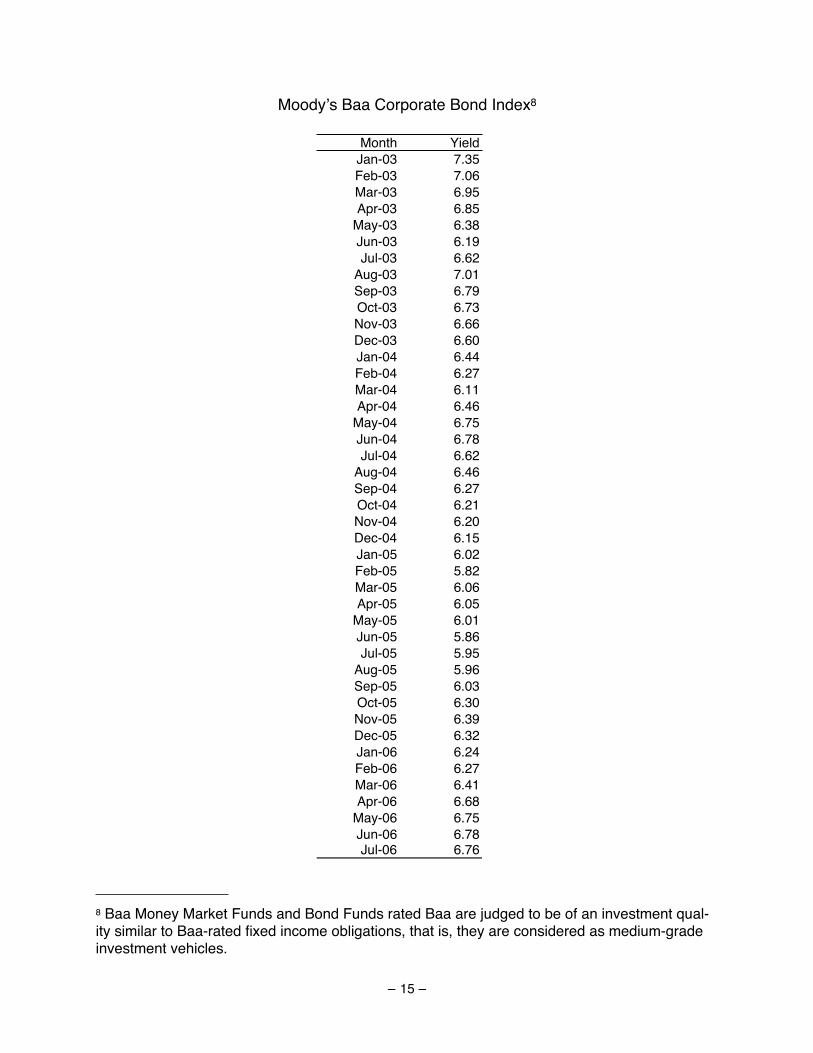
Moody’s Baa Corporate Bond Index8
– 15 –
8 Baa Money Market Funds and Bond Funds rated Baa are judged to be of an investment qual-ity similar to Baa-rated fixed income obligations, that is, they are considered as medium-grade investment vehicles.
Month YieldJan-03 7.35Feb-03 7.06Mar-03 6.95Apr-03 6.85May-03 6.38Jun-03 6.19Jul-03 6.62Aug-03 7.01Sep-03 6.79Oct-03 6.73Nov-03 6.66Dec-03 6.60Jan-04 6.44Feb-04 6.27Mar-04 6.11Apr-04 6.46May-04 6.75Jun-04 6.78Jul-04 6.62Aug-04 6.46Sep-04 6.27Oct-04 6.21Nov-04 6.20Dec-04 6.15Jan-05 6.02Feb-05 5.82Mar-05 6.06Apr-05 6.05May-05 6.01Jun-05 5.86Jul-05 5.95Aug-05 5.96Sep-05 6.03Oct-05 6.30Nov-05 6.39Dec-05 6.32Jan-06 6.24Feb-06 6.27Mar-06 6.41Apr-06 6.68May-06 6.75Jun-06 6.78Jul-06 6.76