Embed Size (px)
Citation preview

United Nations A/CONF.222/4
Thirteenth United Nations Congress on Crime Prevention and Criminal Justice Doha, 12-19 April 2015
Distr.: General 19 January 2015 Original: English
V.15-00369 (E) 060215 090215
*1500369*
Item 3 of the provisional agenda* Successes and challenges in implementing comprehensive crime prevention and criminal justice policies and strategies to promote the rule of law at the national and international levels, and to support sustainable development
State of crime and criminal justice worldwide
Report of the Secretary-General
Summary In its resolution 69/191, the General Assembly requested the Secretary-General, in accordance with past practice, to prepare an overview of the state of crime and criminal justice worldwide for presentation at the Thirteenth United Nations Congress on Crime Prevention and Criminal Justice.
The present report presents the major findings concerning global and regional trends of different types of crime. The analysis of intentional homicide, gender-based killing of women and girls, bribery, trafficking in persons and wildlife crime highlights that in countries where income levels are lower, citizens suffer the greatest threats to their security and well-being. Criminal justice systems vary greatly in terms of their efficiency and fairness. Such variations exist both between and within regions and, depending on the level of economic development of countries, have a direct impact on the access to justice afforded to citizens.
At the moment when the international community is discussing the proposals made by the Open Working Group of the General Assembly on Sustainable Development, this document provides further evidence that a number of targets included under the Open Working Group’s proposed goals 5, 15 and 16 are fully relevant for making sustainable development a reality for all citizens; furthermore, thanks to the advancements made by national and international institutions, metrics to monitor progress towards proposed targets are increasingly available and reliable.
__________________
* A/CONF.222/1.

2 V.15-00369
A/CONF.222/4
Contents Page
I. Introduction . . . . . . . . . . . . . . . . . . . . . . . . . . . . . . . . . . . . . . . . . . . . . . . . . . . . . . . . . . . . . . . . . . . 3
II. International crime trends . . . . . . . . . . . . . . . . . . . . . . . . . . . . . . . . . . . . . . . . . . . . . . . . . . . . . . . . 3
A. Global and regional crime trends . . . . . . . . . . . . . . . . . . . . . . . . . . . . . . . . . . . . . . . . . . . . . . 4
B. The linkage between crime, criminal justice and development . . . . . . . . . . . . . . . . . . . . . . 8
1. Intentional homicide . . . . . . . . . . . . . . . . . . . . . . . . . . . . . . . . . . . . . . . . . . . . . . . . . . . . 9
2. Gender-related killings . . . . . . . . . . . . . . . . . . . . . . . . . . . . . . . . . . . . . . . . . . . . . . . . . . 14
3. Corruption . . . . . . . . . . . . . . . . . . . . . . . . . . . . . . . . . . . . . . . . . . . . . . . . . . . . . . . . . . . . 16
4. Trafficking in persons . . . . . . . . . . . . . . . . . . . . . . . . . . . . . . . . . . . . . . . . . . . . . . . . . . 17
5. Wildlife crime . . . . . . . . . . . . . . . . . . . . . . . . . . . . . . . . . . . . . . . . . . . . . . . . . . . . . . . . . 19
III. Criminal justice systems . . . . . . . . . . . . . . . . . . . . . . . . . . . . . . . . . . . . . . . . . . . . . . . . . . . . . . . . . 20
A. Sentencing policies . . . . . . . . . . . . . . . . . . . . . . . . . . . . . . . . . . . . . . . . . . . . . . . . . . . . . . . . . 21
1. Prison population . . . . . . . . . . . . . . . . . . . . . . . . . . . . . . . . . . . . . . . . . . . . . . . . . . . . . . 21
2. Sentenced prisoners, by principal offence and length of sentence . . . . . . . . . . . . . . . 22
B. Efficiency . . . . . . . . . . . . . . . . . . . . . . . . . . . . . . . . . . . . . . . . . . . . . . . . . . . . . . . . . . . . . . . . 27
1. Suspected and convicted persons . . . . . . . . . . . . . . . . . . . . . . . . . . . . . . . . . . . . . . . . . 28
2. Rate of convictions to homicides . . . . . . . . . . . . . . . . . . . . . . . . . . . . . . . . . . . . . . . . . 28
3. Recidivism . . . . . . . . . . . . . . . . . . . . . . . . . . . . . . . . . . . . . . . . . . . . . . . . . . . . . . . . . . . 29
C. Fairness . . . . . . . . . . . . . . . . . . . . . . . . . . . . . . . . . . . . . . . . . . . . . . . . . . . . . . . . . . . . . . . . . . 30
1. Pretrial detention . . . . . . . . . . . . . . . . . . . . . . . . . . . . . . . . . . . . . . . . . . . . . . . . . . . . . . 31
2. Prison overcrowding . . . . . . . . . . . . . . . . . . . . . . . . . . . . . . . . . . . . . . . . . . . . . . . . . . . 32
3. Deaths in prison . . . . . . . . . . . . . . . . . . . . . . . . . . . . . . . . . . . . . . . . . . . . . . . . . . . . . . . 34
4. Child detention . . . . . . . . . . . . . . . . . . . . . . . . . . . . . . . . . . . . . . . . . . . . . . . . . . . . . . . . 35
IV. The improvements of statistical systems to monitor crime and criminal justice . . . . . . . . . . . . 36
V. Conclusions and recommendations . . . . . . . . . . . . . . . . . . . . . . . . . . . . . . . . . . . . . . . . . . . . . . . . 38
A. Conclusions . . . . . . . . . . . . . . . . . . . . . . . . . . . . . . . . . . . . . . . . . . . . . . . . . . . . . . . . . . . . . . . 38
B. Recommendations . . . . . . . . . . . . . . . . . . . . . . . . . . . . . . . . . . . . . . . . . . . . . . . . . . . . . . . . . . 39

V.15-00369 3
A/CONF.222/4
I. Introduction
1. 2015 is the time for taking stock of achievements with respect to attaining the Millennium Development Goals and the starting point of a new development agenda.
2. As stressed by the General Assembly in its resolution 68/188, rule of law and development are strongly interrelated and mutually reinforcing. Consistent with this approach, the proposal by the Open Working Group on Sustainable Development has included elements of public safety and security, rule of law and access to justice in the sustainable development agenda.
3. The capacity to monitor progress in crime prevention and criminal justice will be crucial for advancing the post-2015 international development agenda. The present report describes and analyses trends for a wide range of crime and criminal justice indicators, with a focus on some of the areas in which the Open Working Group has proposed sustainable development goals and targets.1
4. The report presents major findings concerning global and regional trends of different types of crime. The analysis of intentional homicide, gender-based killing of women and girls, bribery, trafficking in persons and wildlife crime shows that countries at the lower end of the range of income level are those where citizens suffer the greatest threats to their security and well-being. This report also highlights the fact that criminal justice systems vary in efficiency and fairness. Those variations exist at the regional level and, depending on the levels of economic development of countries, have a direct impact on the type of access to justice enjoyed by citizens.2
II. International crime trends
5. Available information on selected forms of violent crime (intentional homicide, robbery and rape) indicates that between 2003 and 2013 there has been a certain stability or a slight decrease in the level of such crimes. This global trend is, however, the result of tendencies that differ across regions and across countries at different levels of economic development. This is particularly evident when one considers recent trends and patterns of intentional homicide, which has a low and decreasing rate in Europe, Asia and Oceania (on average, ranging between 2 and 4 per 100,000 population) and substantially higher rates in the Americas (on
__________________
1 Areas that could be monitored through indicators presented in this document relate to goal 5 (Achieve gender equality and empower all women and girls), goal 15 (Protect, restore and promote sustainable use of terrestrial ecosystems, sustainably manage forests, combat desertification, and halt and reverse land degradation and halt biodiversity loss) and goal 16 (Promote peaceful and inclusive societies for sustainable development, provide access to justice for all and build effective, accountable and inclusive institutions at all levels) (see A/68/970 and Corr.1).
2 This report is based on information provided by Member States within the framework of the annual United Nations Survey of Crime Trends and Operations of Criminal Justice Systems administered by the United Nations Office on Drugs and Crime (UNODC), other official governmental sources or international organizations. Results from the Survey, by country, are available at www.unodc.org/unodc/en/data-and-analysis/statistics/crime.html.

4 V.15-00369
A/CONF.222/4
average, around 16 per 100,000 population, with much higher rates in Central and South America).
6. A comprehensive quantification of gender-related killing of women and girls is still lacking, due to the shortage of data. However, the killing of women by intimate partners and family members, a valid proxy of gender-related killing of women and girls, has a similar prevalence in all regions of the world, quite irrespective of levels of other types of lethal violence. Available information indicates that low-income countries are disproportionally affected by forms of corruption (bribery), while flows of illicit trafficking, whether of persons or of endangered species, typically originate in developing countries, with countries in richer regions being their final destination.
7. Trends in certain property crimes (burglary and motor vehicle theft) are less straightforward. The steady decrease seen at the global level is driven mainly by the trend in high-income countries, while diverse trends can be observed for low- and middle-income countries. Drug-related crimes have followed different trends, and criminal offences related to drug possession3 in particular have increased globally.
A. Global and regional crime trends
8. At the global level, violent crimes for which police-recorded data are available (intentional homicide, robbery and rape) have slightly decreased over the past decade (see figure 1). The decrease has clearly been more pronounced for property crimes: motor vehicle theft almost halved, and burglary has been reduced by more than a quarter. Criminal offences related to drug trafficking remained relatively stable over time, while drug possession offences showed a marked increase since 2003 (a 13 per cent increase).4
__________________
3 Drug possession refers to criminal offences for illicit drug use and possession for use. 4 Trends concerning recorded crimes should always be interpreted with caution given that a
significant, varying share of criminal offences remain undetected and/or unreported. This particularly applies to trends of reported cases of rape, an offence characterized by very low reporting levels: for example, a growth of reported cases might be linked to increased awareness of the crime and thus a higher rate of reporting by victims and/or detection by law enforcement authorities. Trends of drug-related offences can reflect either changing levels and patterns in the illicit drug market or changing priorities of drug law enforcement agencies, or both.

V.15-00369 5
A/CONF.222/4
Figure 1 Global trends of selected crimes, 2003-2013
40
60
80
100
120
2003 2004 2005 2006 2007 2008 2009 2010 2011 2012 2013
Inde
x: 2
003=
100
Rape (64 countries) Robbery (61 countries)
Motor vehicle theft (64 countries) Burglary (53 countries)
Homicide (81 countries) Drug trafficking (47 countries)
Drug possession (45 countries)
Source: United Nations Survey of Crime Trends and Operations of Criminal Justice Systems (UNODC). Notes: Trends are calculated as weighted crime rates per 100,000 population relative to the base year 2003. To produce global estimates, the estimated crime rates for each region were weighted according to the share of the region’s population in the global population. Data on drug trafficking and possession refer mostly to persons arrested or prosecuted for those types of crime.
9. Regional trends are to some extent consistent with the global picture, although there are some differences with respect to the intensity of decreases or increases (figure 2). In the Americas, over the decade 2003-2013, rates of the various crimes considered have fluctuated moderately or slightly declined, with the exception of the marked decline in motor vehicle theft. The decline in the rate of various forms of crime in Europe has been more pronounced, with the exception of the increase in offences related to drug possession and rape. In Asia and Oceania, declines in property crimes have not always been paralleled by similar trends in violent crimes, while drug trafficking offences have surged in recent years.

6 V.15-00369
A/CONF.222/4
Figure 2 Percentage change in different types of crime, by region, 2003-2013
-70%
-50%
-30%
-10%
10%
30%
50%
70%H
omic
ide
(30
coun
tries
)
Rap
e (1
3 co
untri
es)
Rob
bery
(14
coun
tries
)
Mot
or v
ehic
le th
eft (
13 c
ount
ries)
Burg
lary
(9 c
ount
ries)
Dru
g tra
ffick
ing
(8 c
ount
ries)
Dru
g po
sses
sion
(6 c
ount
ries)
Hom
icid
e (3
0 co
untri
es)
Rap
e (3
6 co
untri
es)
Rob
bery
(35
coun
tries
)
Mot
or v
ehic
le th
eft (
36 c
ount
ries)
Burg
lary
(33
coun
tries
)
Dru
g tra
ffick
ing
(24
coun
tries
)
Dru
g po
sses
sion
(28
coun
tries
)
Hom
icid
e (1
5 co
untri
es)
Rap
e (1
1 co
untri
es)
Rob
bery
(8 c
ount
ries)
Mot
or v
ehic
le th
eft (
12 c
ount
ries)
Burg
lary
(8 c
ount
ries)
Dru
g tra
ffick
ing
(11
coun
tries
)
Dru
g po
sses
sion
(7 c
ount
ries)
Hom
icid
e (8
1 co
untri
es)
Rap
e (6
4 co
untri
es)
Rob
bery
(61
coun
tries
)
Mot
or v
ehic
le th
eft (
67 c
ount
ries)
Burg
lary
(51
coun
tries
)
Dru
g tra
ffick
ing
(47
coun
tries
)
Dru
g po
sses
sion
(45
coun
tries
)
Americas Europe Asia and Oceania Global
Per
cent
age
chan
ge 2
003-
2013
Source: United Nations Survey of Crime Trends and Operations of Criminal Justice Systems. Note: The percentage change is calculated on the basis of the rates per 100,000 population. The latest figures for drug trafficking and possession in all regions refer to 2012. The latest figures for all types of crime in Asia and Oceania refer to 2012.
10. Figure 3 offers an alternative key for analysing crime trends by considering changes in crime rates in relation to the income level of countries.5 Over the period 2003-2013, high-income countries reported decreasing trends for both violent crimes and property crimes, whereas upper-middle-income countries had rising trends for most crimes except homicide, and low- and lower-middle-income countries had diverse trends over the period. Although the different levels of data quality and police practices should also be factored in, these data suggest that crime trends in the past decade are related to the countries’ income level.
__________________
5 See the World Bank categorization of countries by income levels (http://data.worldbank.org/about/country-and-lending-groups).

V.15-00369 7
A/CONF.222/4
Figure 3 Percentage change in different types of crime, by levels of income of countries, 2003-2013
-150% -100% -50% 0% 50% 100% 150%
Rape (9 countries)Robbery (7 countries)
Motor vehicle theft (9 countries)Burglary (4 countries)
Homicide (19 countries)Drug trafficking (4 countries)
Drug possession (5 countries)Rape (15 countries)
Robbery (14 countries)Motor vehicle theft (15 countries)
Burglary (11 countries)Homicide (22 countries)
Drug trafficking (8 countries)Drug possession (9 countries)
Rape (39 countries)Robbery (39 countries)
Motor vehicle theft (40 countries)Burglary (38 countries)
Homicide (40 countries)Drug trafficking (33 countries)
Drug possession (33 countries)
Low
- and
low
er-
mid
dle
inco
me
Upp
er-m
iddl
e in
com
eH
igh
inco
me
Percentage change 2003-2013
Source: United Nations Survey of Crime Trends and Operations of Criminal Justice Systems. Note: The percentage change is calculated on the basis of the rates per 100,000 population. The latest figures for drug trafficking and possession in all regions refer to 2012.
11. For a few countries in Europe and the Americas, it is possible to compare trends of selected crimes based respectively on victimization surveys and police data (see figure 4). While trends for car theft based on police data are usually similar to those recorded by victimization surveys, trends for burglary and robbery based on such surveys more often indicate an increase in crime levels that is higher than that indicated by police data. The set of countries for which both data series are available is still too limited to make broader evaluations, but this sample clearly shows that the narrative on crime trends could significantly change if more statistical information based on victimization surveys were available.

8 V.15-00369
A/CONF.222/4
Figure 4 Percentage change in victimization and police-recorded crime rates for different types of crime in selected countries, 2008-2013
-60%
-40%
-20%
0%
20%
40%
60%
80%
Chile
Uni
ted
Stat
es o
f Am
eric
a
Aust
ralia
Fran
ce
Swed
en
Uni
ted
King
dom
Mex
ico
Chile
Uni
ted
Stat
es o
f Am
eric
a
Aust
ralia
Fran
ce
Swed
en
Uni
ted
King
dom
Mex
ico
Chile
Uni
ted
Stat
es o
f Am
eric
a
Fran
ce
Swed
en
Uni
ted
King
dom
Mex
ico
Car theft Burglary Robbery
Perc
enta
ge c
hang
e, 2
008-
2013
Recorded by the police Victimization
Source: United Nations Survey of Crime Trends and Operations of Criminal Justice Systems. Note: Victimization data refer to the number of victims per 100,000 population (prevalence), with the exception of the United States of America, where they refer to the number of crimes (incidence). Data on robbery are not available for Australia. The data for Mexico refer to the period 2010-2013.
B. The linkage between crime, criminal justice and development
12. There is a compelling case for concluding that crime and criminal justice have a strong link to development.6 As recognized by the Open Working Group of the General Assembly on Sustainable Development Goals, reducing different forms of criminal acts that result in violence, environmental degradation or diversion of financial resources should form an integral part of the sustainable development goals and their related targets (see A/68/970 and Corr.1).
13. There is evidence of the connection between homicidal violence and socioeconomic development and evidence of the negative effects of corruption on development, including misuse of public funds, unfair competition, additional costs
__________________
6 UNODC, Accounting for Security and Justice in the Post-2015 Development Agenda (Vienna, October 2013).

V.15-00369 9
A/CONF.222/4
for service users, a reduction in public trust and the weakening of the rule of law. Those factors have pushed the international community to act vigorously to fight corruption, as testified to by the adoption and near-universal ratification of the United Nations Convention against Corruption.
14. In the following sections, this report analyses trends in some of the areas identified by the Open Working Group as relevant to the development agenda: homicide (one of the components of violence included in the proposed goal 16 (target 16.1)), gender-related killings (goal 5, target 5.2), corruption (goal 16, target 16.5), trafficking in persons (goal 5, target 5.2; and goal 16, target 16.2) and wildlife crime (goal 15, target 15.7). Further evidence relevant for monitoring targets under goal 16 of the Open Working Group is presented in section III, on criminal justice systems, including on the percentage of prisoners held in pretrial detention, the level of prison overcrowding, the rate of violent death in prison and the rate of child detention as indicators for the fairness of criminal justice systems as expressed in target 16.3 of goal 16 (rule of law and equal access to justice).
1. Intentional homicide
15. The analysis of intentional homicide is important not only for understanding levels and patterns of that crime; it is also frequently used as a proxy to measure levels of violence. Over the past decade, the United Nations Office on Drugs and Crime (UNODC) has made efforts to improve the availability and quality of information on homicide occurrence and the victims and perpetrators, which resulted in the publication of two issues of the Global Study on Homicide (2011 and 2013).
16. Based on data for 219 countries and territories, UNODC estimates that in 2012 approximately 437,000 persons worldwide were victims of intentional homicide, corresponding to a global homicide rate of 6.2 per 100,000 population.7
17. Figure 5 shows regional levels of intentional homicide (rates per 100,000 population) between 2008 and 2013, indicating that, over the period, the highest rates were consistently found in the Americas and the lowest in Europe, Asia and Oceania.
__________________
7 See UNODC, Global Study on Homicide 2013: Trends, Contexts, Data (United Nations publication, Sales No. 14.IV.1). The World Health Organization produced a slightly higher estimated global rate of homicide for 2014 (6.7 per 100,000 population) (see World Health Organization, United Nations Development Programme and UNODC, Global Status Report on Violence Prevention 2014 (Geneva, 2014)). The discrepancy is mainly due to the use of different data sources (public health data instead of criminal justice sources) and estimation methods.

10 V.15-00369
A/CONF.222/4
Figure 5 Trends in homicide rates, by region, 2008-2013
0
2
4
6
8
10
12
14
16
18
Africa (9 countries) Americas (33 countries) Europe (34 countries) Asia and Oceania (17countries)
Rat
e pe
r 100
,000
pop
ulat
ion
2008 2009 2010 2011 2012 2013
Source: UNODC Homicide Statistics and United Nations Survey of Crime Trends and Operations of Criminal Justice Systems.
18. The relationship between homicidal violence and levels of social and economic development has long been stressed by criminological research and, more recently, by a number of reports looking at factors hindering development.8 In particular, such research indicates that factors such as inequality, poverty and weak rule of law are interconnected with both conflict and non-conflict violence.
19. This relationship is confirmed by recent trends: patterns of homicide rates tend to differ according to the income level of countries (figure 6). Over the past decade, the homicide rate in high-income countries has been on average low and decreasing. It has fluctuated in upper-middle-income countries, at a substantially higher level, and it has steadily increased in low- and lower-middle-income countries. As a result, in 2013, the homicide rate in the group of low- and lower-middle-income countries is on average 2.5 times the rate in high-income countries. Groups of countries by income level can be very diverse geographically and can be characterized by different drivers associated with crime patterns. However, the consistent relationship between income levels and crime confirms the existence of a link between levels of economic development and citizens’ security, with low-income countries exposed to higher risks of violent crime.
__________________
8 See, for example, the Geneva Declaration on Armed Violence and Development, More Violence, Less Development: Examining the Relationship between Armed Violence and MDG Achievement (Geneva, September 2010); World Bank, World Development Report 2011 (Washington, D.C., 2011) and UNODC, Global Study on Homicide 2011:Trends, Contexts, Data (United Nations publication, Sales No. 11.IV.7).

V.15-00369 11
A/CONF.222/4
Figure 6 Average homicide rate, by levels of income of countries, 2003-2013
0
1
2
3
4
5
6
2003 2004 2005 2006 2007 2008 2009 2010 2011 2012 2013
Rat
e pe
r 100
,000
pop
ulat
ion
Low- and lower-middle-income countries (19 countries)Upper-middle-income countries (22 countries)High-income countries (40 countries)
Source: UNODC Homicide Statistics and the United Nations Survey of Crime Trends and Operations of Criminal Justice Systems.
20. In addition to their value in assessing levels and trends of violence, homicide data can also provide analytical information on types and contexts of killings and thus on the relative importance of different drivers of violence. An analytical classification of homicide based on elements such as premeditation, motivation, context, instrumentality and the victim-perpetrator relationship (see figure 7) has been developed by UNODC and is increasingly being used for statistical purposes.

12 V.15-00369
A/CONF.222/4
Figure 7 Classification of intentional homicide
Source: UNODC, Global Study on Homicide 2013: Trends, Contexts, Data.
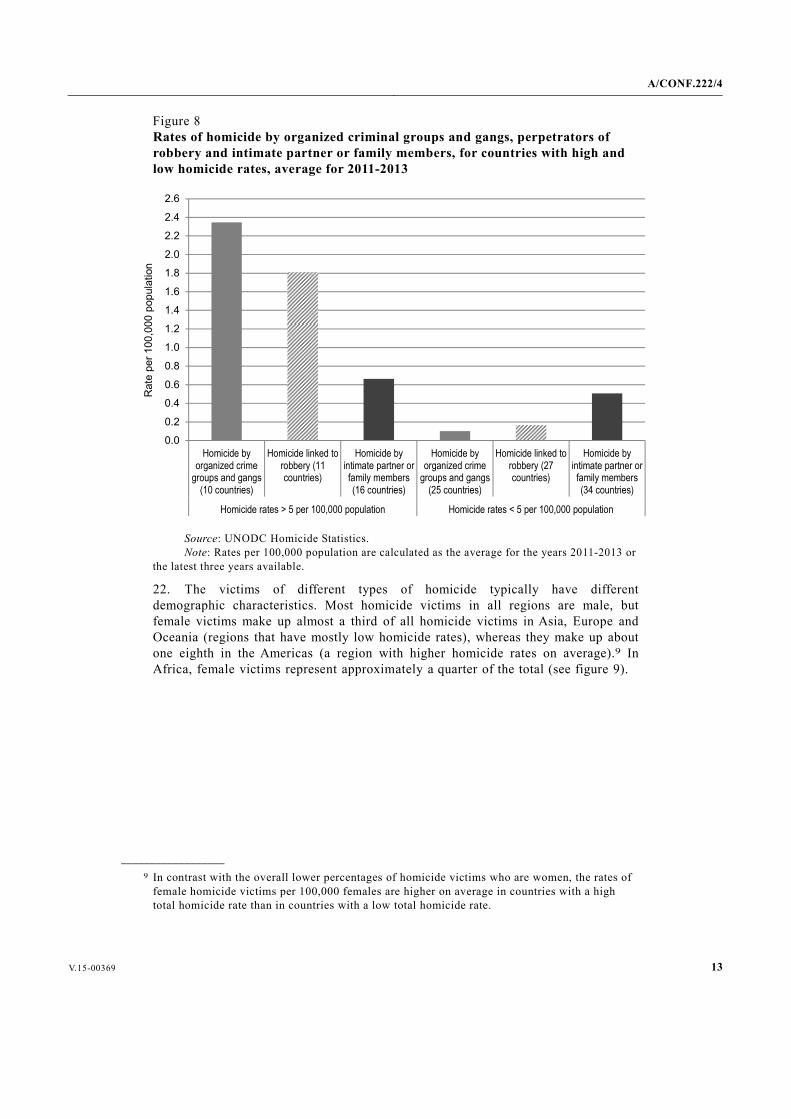
21. Although the availability of data on types of homicides is still limited, some initial insights can be provided. Figure 8 compares the rates of three different types of homicide, for both countries with homicide rates above 5 homicides per 100,000 population and those below. While rates of two types of homicides (those related to gangs/organized criminal groups and those committed during robberies) are consistently higher in countries where the total homicide rate is also higher, the rate of homicide by intimate partners or family members is very similar in the two groups of countries. This suggests that homicide related to intimate partner or family violence is a phenomenon driven by factors different from those at work in other types of homicide and which are often entrenched in social norms that are not closely correlated with other forms of crime and violence. Notably, killings by intimate partners or family members can make up to 60 per cent of all homicides in countries with lower homicide rates.
V.15-00369 13
A/CONF.222/4
Figure 8 Rates of homicide by organized criminal groups and gangs, perpetrators of robbery and intimate partner or family members, for countries with high and low homicide rates, average for 2011-2013
0.0
0.2
0.4
0.6
0.8
1.0
1.2
1.4
1.6
1.8
2.0
2.2
2.4
2.6
Homicide byorganized crime
groups and gangs(10 countries)
Homicide linked torobbery (11countries)
Homicide byintimate partner orfamily members(16 countries)
Homicide byorganized crime
groups and gangs(25 countries)
Homicide linked torobbery (27countries)
Homicide byintimate partner orfamily members(34 countries)
Homicide rates > 5 per 100,000 population Homicide rates < 5 per 100,000 population
Rat
e pe
r 100
,000
pop
ulat
ion
Source: UNODC Homicide Statistics. Note: Rates per 100,000 population are calculated as the average for the years 2011-2013 or the latest three years available.
22. The victims of different types of homicide typically have different demographic characteristics. Most homicide victims in all regions are male, but female victims make up almost a third of all homicide victims in Asia, Europe and Oceania (regions that have mostly low homicide rates), whereas they make up about one eighth in the Americas (a region with higher homicide rates on average).9 In Africa, female victims represent approximately a quarter of the total (see figure 9).
__________________
9 In contrast with the overall lower percentages of homicide victims who are women, the rates of female homicide victims per 100,000 females are higher on average in countries with a high total homicide rate than in countries with a low total homicide rate.

14 V.15-00369
A/CONF.222/4
Figure 9 Percentage distribution of male and female victims of homicide, by region, 2013 or latest year
80%
70%
72%
70%
88%
76%
20%
30%
28%
30%
12%
24%
0% 10% 20% 30% 40% 50% 60% 70% 80% 90% 100%
Global (193 countries)
Oceania (10 countries)
Europe (39 countries)
Asia (50 countries)
Americas (39 countries)
Africa (55 countries)
Males Females
Source: UNODC Homicide Statistics.
2. Gender-related killings
23. Female victims of homicide are frequently killed as a result of gender-related violence, in which they are targeted because they are women. Gender-related killing of women and girls10 can take several forms (for example, so-called honour killings and dowry-related killings), all poorly documented by existing statistics. However, an indirect estimate of the extent of the problem can be provided by considering homicides of women by intimate partners and family members as an indicator that could be directly used to assess the achievement of targets on violence against women included under goal 6 of the Open Working Group’s proposal. Such homicides are often a consequence of an unequal power relationship between men and women, and UNODC estimates that, at the global level, 43,600 women were killed by their intimate partner or a member of their family in 2012, which corresponds to 47 per cent of all women killed in that year (figure 10).11
__________________
10 As stated in General Assembly resolution 68/191, gender-related killing of women and girls is criminalized in some countries as “femicide” or “feminicide” and has been incorporated as such into national legislation in those countries.
11 UNODC, Global Study on Homicide 2013, p. 53.

V.15-00369 15
A/CONF.222/4
Figure 10 Female victims of intimate partner or family-related homicide as a percentage of total female homicide victims, by region, 2012 or latest year
0%
10%
20%
30%
40%
50%
60%
70%
80%
90%
100%
Africa (4countries)
Americas (14countries)
Asia (9countries)
Europe (21countries)
Oceania (3countries)
Global (51countries)
Source: UNODC Homicide Statistics.
24. Available data show that almost 60 per cent of suspected perpetrators of homicide and more than 40 per cent of homicide victims in the Americas were males under the age of 30 (see figure 11). Younger persons in the Americas have a much higher risk of being both victims and perpetrators of homicide. In Europe, the age structure for homicide perpetrators and victims is different, as it is skewed towards older perpetrators and victims. Although this is the result of the larger share of intimate partner/family-related homicides among all homicides committed in Europe, this pattern is also likely to reflect differences between Europe and the Americas in the overall population age structure.

16 V.15-00369
A/CONF.222/4
Figure 11 Homicide perpetrators by sex and age group, Americas and Europe, average for the period 2008-2013
0%
10%
20%
30%
40%
50%
60%
70%
80%
90%
100%
Perpetrators Victims Perpetrators Victims
Americas (6 countries) Europe (16 countries)
Perc
enta
ge o
f per
petra
tors
and
vic
tims
Males <30 Males 30+ Females <30 Females 30+
Source: UNODC Homicide Statistics and the United Nations Survey of Crime Trends and Operations of Criminal Justice Systems.
3. Corruption
25. Corruption includes a number of criminal offences defined in the Convention against Corruption, such as active and passive bribery, embezzlement, abuse of functions and trading in influence. One approach taken by national and international agencies, including UNODC,12 as well as by researchers and non-governmental organizations, is the measurement of one such offence, i.e., bribery, through surveys investigating experience of the crime (rather than its perception) by citizens or businesses. While research approaches need further refinement, patterns of bribery in countries across the world are becoming increasingly clear.
26. For example, in an experience-based survey carried out in several countries worldwide,13 estimates of the prevalence of bribery show a clear correlation with national income level, indicating that administrative bribery represents the biggest burden for those who can least afford it: the populations of poor countries. Findings
__________________
12 Over the past decade, UNODC has worked with Governments to implement corruption surveys in Afghanistan (2009 and 2012), Iraq (2013), Nigeria (2007) and the western Balkans (2011 and 2013) (available at www.unodc.org/unodc/en/data-and-analysis/statistics/corruption.html).
13 Transparency International, Global Corruption Barometer (available at www.transparency.org/gcb2013). As opposed to the Transparency International Corruption Perception Index, the Global Corruption Barometer focuses on the experience, rather than the perception, of bribery over the past 12 months.

V.15-00369 17
A/CONF.222/4
show a large variation in the experience of bribery, with a six-fold difference between high- and low-income countries. The burden of bribery on low-income countries is heavy, though a slight decrease between 2011 and 2013 should be viewed as a positive development (see figure 12). Corruption can hinder development because of the obstacles it poses to economic growth, including by deterring productive investments.14 At the same time, corruption tends to flourish in contexts of weak governance and where there is a lack of opportunities, creating a vicious circle between lack of economic growth and weak rule of law.
Figure 12 Prevalence rates of bribery, by levels of income of countries, 2011-2013
0%
10%
20%
30%
40%
50%
60%
70%
80%
90%
100%
High-incomeeconomies
(23 countries)
Upper-middle-incomeeconomies
(16 countries)
Lower-middle-incomeeconomies
(28 countries)
Low-incomeeconomies
(13 countries)
Pre
vale
nce
rate
s of
brib
ery
2011 2013
Source: UNODC calculations based on the Transparency International Global Corruption Barometer for 2011 and 2013. Note: Prevalence rates show the percentage of households paying at least one bribe over the last 12 months as a percentage of households in contact with selected public officials. The square corresponds to the median value within the groups of countries, upper and lower limits correspond to first and third quartiles.
4. Trafficking in persons
27. Trafficking in persons is strongly connected to development. Many trafficking flows are directed from poor areas towards more affluent ones (see figure 13).15 Factors of vulnerability to becoming a trafficking victim are often related to poverty, unemployment, inequality, discrimination and many other situations that have a link to development. For these reasons, the Open Working Group on
__________________
14 For example, according to a survey conducted by UNODC in 2013, 6 per cent of business representatives decided not to make a major investment out of fear of having to pay bribes to obtain services or permits.
15 UNODC, Global Report on Trafficking in Persons 2014.

18 V.15-00369
A/CONF.222/4
Sustainable Development Goals has made explicit reference to the fight against trafficking in persons by including relevant targets in its proposed goals 5 and 16.16
28. Current data collection at the global level is based on reported cases of trafficking in persons. While the analysis of such cases is key to understanding trafficking patterns and flows, the profiles of detected victims and offenders, different forms of exploitation and State responses, it does not allow us to estimate the extent of the phenomenon (prevalence).
Figure 13 Main destination areas of transregional trafficking flows and their significant origins, 2010-2012
Source: UNODC.
29. Trafficking in persons affects virtually every country in the world. It is a transnational crime that mainly involves foreign victims, even though they are mostly trafficked in a limited geographical area such as within the subregion. Offenders, however, are often nationals of the country where they are convicted. While most known victims are women who are trafficked for sexual exploitation, there is an increased share of detected victims who are children (see figure 14) and men and who are trafficked for forced labour or other forms of exploitation. Men comprise the vast majority of convicted offenders; nevertheless, the share of women offenders is nearly 30 per cent. Even though more than 90 per cent of countries criminalize trafficking, there are still low levels of convictions for trafficking in persons in many countries.17
__________________
16 A/68/970 and Corr.1. 17 UNODC, Global Report on Trafficking in Persons 2014.
The arrows show the flows that represent 5 per cent and more of the total victims detected in destination subregions

V.15-00369 19
A/CONF.222/4
Figure 14 Girls and boys as share of all victims of trafficking in persons detected at global level, 2004-2011
0%
5%
10%
15%
20%
25%
30%
35%
40%
45%
50%
2004 2006 2009 2011
Girls Boys
Source: UNODC, Global Report on Trafficking in Persons 2014.
5. Wildlife crime
30. It has long been recognized that development can be sustainable only if it progresses in an environmentally sound manner. One crime that directly impacts environmental sustainability is wildlife crime. This has been recognized by the Open Working Group, which urges, under goal 15, that the international community “take urgent action to end poaching and trafficking of protected species of flora and fauna and address both demand and supply of illegal wildlife products”.
31. There is presently no internationally accepted definition of wildlife crime, and there are no standardized indicators for measuring it. There is, however, an international agreement on wildlife with nearly universal accession: the Convention on International Trade in Endangered Species of Wild Fauna and Flora, which sets rules and procedures for international trade in species in need of protection.
32. Under the Convention, parties agree to submit data annually and biennially. Cooperating with the Convention secretariat under the aegis of the International Consortium on Combating Wildlife Crime, UNODC is currently building a database using this information, which could provide a basis for long-term tracking of wildlife crime trends.
33. Some Governments generate statistics on the poaching of animal species. For example, South Africa monitors rhinoceros poaching, a crime that has escalated greatly in recent years (see figure 15). On an international level, the foremost

20 V.15-00369
A/CONF.222/4
system for monitoring poaching is the “Minimising the Illegal Killing of Elephants and Other Endangered Species” (MIKES) system of the secretariat of the Convention on International Trade in Endangered Species of Wild Fauna and Flora.
Figure 15 Recorded number of rhinoceros poached in South Africa, 2000-2014
6 7 25 22 10 13 10 1383
122
333
448
668
1004
0
200
400
600
800
1 000
1 200
2000
2001
2002
2003
2004
2005
2006
2007
2008
2009
2010
2011
2012
2013
Source: South African Department of Environmental Affairs (see www.environment.gov.za/mediarelease/update_on_rhino_poaching).
III. Criminal justice systems
34. Criminal justice functions — the ability of the police, courts and the penal system to detect crime, investigate and prosecute fairly, and rehabilitate convicted offenders — are implemented by governmental structures created to administer justice and to ensure the enforcement of laws. Fairness, transparency, respect for human rights, effectiveness, speed, quality and efficiency are qualifying attributes of criminal justice systems, and such criteria can provide a direct indication of respect for the rule of law and the promotion of access to justice.
35. Over the past decade, progress has been made in producing data and developing indicators that can provide benchmarks to assess the performance of criminal justice systems. While challenges exist, due to limited data availability and issues of comparability related to the diversity of legal and organizational systems, this section presents findings on three aspects of criminal justice systems: sentencing policies, efficiency and fairness.
36. These aspects are crucial to assessing rule of law and access to justice, as they provide relevant information on both the effective and fair functioning of

V.15-00369 21
A/CONF.222/4
institutions and people’s access to them. The monitoring of targets on the promotion of rule of law and on ensuring equal access to justice (under goal 16 of the proposal by the Open Working Group) can greatly benefit from such analyses.
A. Sentencing policies
37. Sentencing policies refer to the responses of the criminal justice system to the various offences as regards the types of sentences, including non-custodial measures. A comparative assessment of sentencing policies of criminal justice systems would require the analysis of the type of sentences, including the length of custodial sentences handed out to convicted persons, while taking account of the seriousness of the criminal offences committed. At the international level, there are no available data on the length and type of sentences that allow this type of comparative analysis. Nevertheless, data on persons held in prisons and on the distribution of the offences for which they were convicted and the length of their sentences can provide insights into sentencing policies of penal systems around the world.
1. Prison population
38. At the global level, prison population rates have been stable over the past decade. The size of the prison population increased approximately 10 per cent since 2004, reaching more than 10.2 million people in the period 2011-2013. However, that growth was offset by the equally steep growth of the world population over the same period, thus resulting in stable average rates at the global level (148 per 100,000 population in the period 2011-2013).
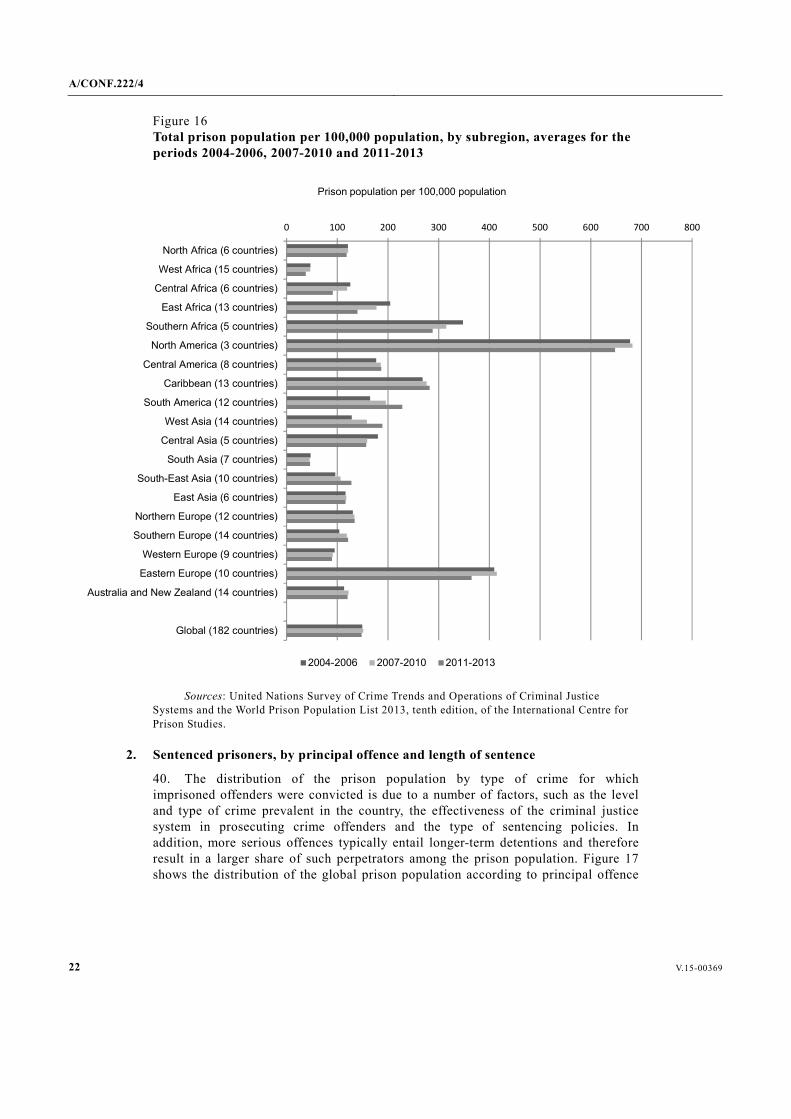
39. There are diverging trends at the regional level. While prison population rates are declining in all African subregions, North America and Western and Eastern Europe (see figure 16), they are increasing in Central and South America and the Caribbean, in South-East and West Asia and in Northern and Southern Europe. There continue to be large differences between subregions in terms of prison population rates, which varied from under 100 prisoners to more than 600 prisoners per 100,000 population in the period 2011-2013.
22 V.15-00369
A/CONF.222/4
Figure 16 Total prison population per 100,000 population, by subregion, averages for the periods 2004-2006, 2007-2010 and 2011-2013
0 100 200 300 400 500 600 700 800
North Africa (6 countries)
West Africa (15 countries)
Central Africa (6 countries)
East Africa (13 countries)
Southern Africa (5 countries)
North America (3 countries)
Central America (8 countries)
Caribbean (13 countries)
South America (12 countries)
West Asia (14 countries)
Central Asia (5 countries)
South Asia (7 countries)
South-East Asia (10 countries)
East Asia (6 countries)
Northern Europe (12 countries)
Southern Europe (14 countries)
Western Europe (9 countries)
Eastern Europe (10 countries)
Australia and New Zealand (14 countries)
Global (182 countries)
Prison population per 100,000 population
2004-2006 2007-2010 2011-2013
Sources: United Nations Survey of Crime Trends and Operations of Criminal Justice Systems and the World Prison Population List 2013, tenth edition, of the International Centre for Prison Studies.
2. Sentenced prisoners, by principal offence and length of sentence
40. The distribution of the prison population by type of crime for which imprisoned offenders were convicted is due to a number of factors, such as the level and type of crime prevalent in the country, the effectiveness of the criminal justice system in prosecuting crime offenders and the type of sentencing policies. In addition, more serious offences typically entail longer-term detentions and therefore result in a larger share of such perpetrators among the prison population. Figure 17 shows the distribution of the global prison population according to principal offence

V.15-00369 23
A/CONF.222/4
(i.e., the most serious crime for which offenders were sentenced).18 According to available information for 2012, 34 per cent of the prisoners were serving sentences that were principally tied to violent offences (including intentional homicides), less than 30 per cent to property crimes, 20 per cent to drug law offences, 3 per cent to financial crimes or corruption and 14 per cent to other types of crime.
Figure 17 Average distribution of the global prison population, by principal offence, 2012
Intentional homicide
14%
Violent offences
20%
Property offences
29%
Financial crimes or corruption
3%
Drug law offences
20%
Other14%
Source: United Nations Survey of Crime Trends and Operations of Criminal Justice Systems. Note: The global total is based on data from 53 countries.
41. In the Americas, Europe and Oceania, most prisoners were incarcerated for violent crime, while in Asia the majority were serving a sentence for property or drug-related offences (see figure 18).
__________________
18 Prisoners may be serving sentences for more than one offence, and in that case, reference is made to the most serious offence committed.

24 V.15-00369
A/CONF.222/4
Figure 18 Average distribution of the global prison population, by principal offence and by region, 2012
0%
10%
20%
30%
40%
50%
60%
70%
80%
90%
100%
Americas (13countries)
Asia (10 countries) Europe (25countries)
Oceania (2countries)
Global (53countries)
Per
cent
age
of p
rison
pop
ulat
ion,
by
prin
cipa
l offe
nce
Homicide and other violent crimes Property and financial crimes Drug law offences Other
Source: United Nations Survey of Crime Trends and Operations of Criminal Justice Systems. Note: The global total includes three countries in Africa.
42. Considering the different prison population rates (low, medium and high), figure 19 shows that the higher the rate of prison population, the larger the proportion of prisoners serving sentences related to violent crimes. The proportion of prisoners incarcerated for property crimes is relatively similar across countries with different prison population rates, while the share of prisoners convicted for drug-related offences is particularly high in countries with low prison populations.

V.15-00369 25
A/CONF.222/4
Figure 19 Percentage distribution of prison population, by principal offence in countries with low, medium and high prison population rates per 100,000 population
0%
10%
20%
30%
40%
50%
60%
Low (<100 – 15 countries)
Medium (100-200 – 20 countries)
High (>200 – 18 countries)
Global (53 countries)
Per
cent
age
of p
rison
pop
ulat
ion,
by
prin
cipa
l offe
nce
Homicide and other violent crimes Property and financial crimes Drug law offences Other
Source: United Nations Survey of Crime Trends and Operations of Criminal Justice Systems. Note: Data on principal offence refer to 2012. Data on the prison population rate refer to the average for the period 2011-2013.
43. When considering the length of sentence being served by detainees, at the global level, approximately one third of prisoners are serving sentences of up to 5 years, another 30 per cent sentences of between 5 and 10 years, and the rest (37 per cent) serving sentences longer than 10 years. Among the latter group, approximately 8 per cent were serving life sentences in 2012.
44. Different sentencing patterns and sanction implementation policies may exist in different regions, which may influence the regional distribution of the average length of the final sentence served by imprisoned offenders. Available data suggest that in 2012, the majority of prisoners in Europe and Oceania were serving sentences up to five years, while this was the case with 40 per cent of prisoners in the Americas and only 15 per cent of those in Asia, where the majority was serving much longer sentences (figure 20). The proportion of prisoners serving sentences between 5 and 10 years (between 22 and 31 per cent) is very similar across those regions.

26 V.15-00369
A/CONF.222/4
Figure 20 Distribution of prison population, by length of sentence and by region, 2012
0%
10%
20%
30%
40%
50%
60%
70%
80%
90%
100%
Americas (7countries)
Asia (12 countries) Europe (25countries)
Oceania (2countries)
Global (47countries)
Per
cent
age
of p
rison
pop
ulat
ion,
by
leng
th o
f sen
tenc
e
<5 years 5-10 years >10 years
Source: United Nations Survey of Crime Trends and Operations of Criminal Justice Systems. Note: The global total includes one country in Africa.
45. Different levels (low, medium and high) of prison population rates are not a predictor of the proportion of prisoners serving sentences of different length (see figure 21). In countries with low detention rates, the largest share of detainees serve sentences of up to five years, while in countries with medium-level imprisonment rates there is a high share of prisoners serving long-term sentences (more than 10 years). Notably, in systems with the highest detention rates, half of the prison population is serving short-term sentences (up to five years), while the share of long-term detentions is very low.

V.15-00369 27
A/CONF.222/4
Figure 21 Distribution of prison population, by length of sentence, in countries with low, medium and high prison population rates per 100,000 population
0%
10%
20%
30%
40%
50%
60%
70%
80%
90%
100%
Low (<100 – 15 countries)
Medium (100-200 – 20 countries)
High (>200 – 12 countries)
Global (47 countries)
Per
cent
age
of p
rison
pop
ulat
ion,
by
leng
th o
f sen
tenc
e
Prison population rate (per 100,000 population)
<5 years 5-10 years >10 years
Source: United Nations Survey of Crime Trends and Operations of Criminal Justice Systems. Note: Data on the length of sentence refers to 2012; the prison population rate refers to the average for the period 2011-2013.
B. Efficiency
46. The efficiency of a criminal justice system is understood as its capacity to apply available resources economically to accomplish statutory goals and improve public safety. One way to measure the efficiency of a criminal justice system is to compare the level of inputs in relation to the outputs achieved. From a criminal justice perspective, a comparison of the rate of persons suspected (persons in formal contact with the police or criminal justice system per 100,000 population) (inputs) with the rate of persons convicted (outputs) can give an indication of whether resources are applied efficiently at different stages of the criminal justice process. The concept of efficiency, measured in terms of persons convicted rather than cases resolved, does not provide any indication about whether the system is fair and equitable and complies with international standards of justice and human rights.

28 V.15-00369
A/CONF.222/4
1. Suspected and convicted persons
47. Rates of persons suspected and convicted provide a first indication of activities performed by law enforcement and criminal justice actors.19
Figure 22 Persons suspected and persons convicted of any type of crime per 100,000 population, by region, average for the periods 2004-2006 and 2011-2013
0%
10%
20%
30%
40%
50%
60%
0
200
400
600
800
1 000
1 200
1 400
1 600
Personssuspected
Personsconvicted
Personssuspected
Personsconvicted
Personssuspected
Personsconvicted
Americas (10 countries) Asia (17 countries) Europe (36 countries)
Pers
ons
conv
icte
d as
a s
hare
of p
erso
ns s
uspe
cted
Num
ber o
f per
sons
per
100
,000
pop
ulat
ion
2004-2006 2011-2013 Share of persons convicted 2011-2013 (right-hand scale)
Source: United Nations Survey of Crime Trends and Operations of Criminal Justice Systems.
48. Global and regional trends of apprehension and sentencing of offenders (figure 22) indicate stable rates for both persons brought into formal contact with the police and for persons convicted. Comparatively, rates of people suspected and people convicted are higher in Europe, followed by the Americas and then Asia.
49. The number of persons convicted as a share of persons suspected may be considered as an indicator of the efficiency of the system. Significant regional differences exist, and this share ranges from 25 per cent in the Americas, to 34 per cent in Asia and to 52 per cent in Europe (see figure 22).
2. Rate of convictions to homicides
50. In the case of homicide, it is possible to look at the efficiency of the criminal justice system by considering the ratio of the number of persons convicted of homicide compared with the total number of homicide victims recorded by the
__________________
19 Some limitations of this indicator, dictated by data availability, are that it uses persons as counting units (instead of cases) and that it is calculated using aggregated annual data even though persons may be brought into formal contact with the criminal justice system and adjudicated in different calendar years.
V.15-00369 29
A/CONF.222/4
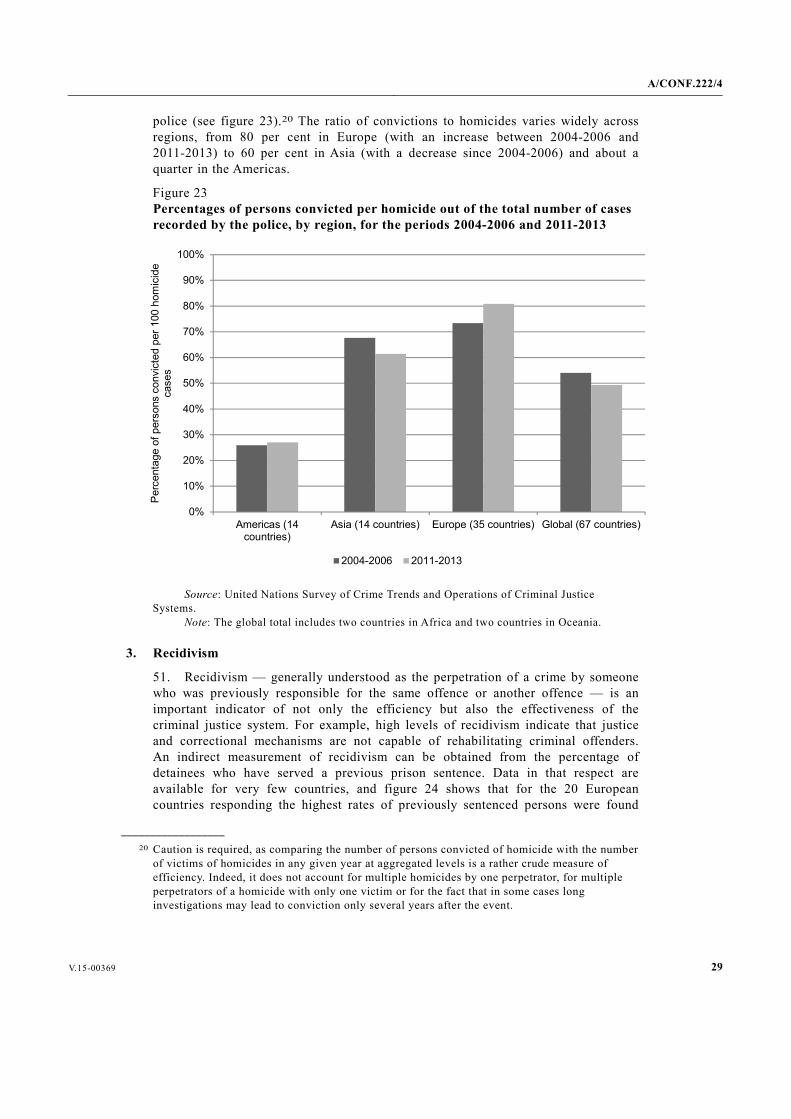
police (see figure 23).20 The ratio of convictions to homicides varies widely across regions, from 80 per cent in Europe (with an increase between 2004-2006 and 2011-2013) to 60 per cent in Asia (with a decrease since 2004-2006) and about a quarter in the Americas.
Figure 23 Percentages of persons convicted per homicide out of the total number of cases recorded by the police, by region, for the periods 2004-2006 and 2011-2013
0%
10%
20%
30%
40%
50%
60%
70%
80%
90%
100%
Americas (14countries)
Asia (14 countries) Europe (35 countries) Global (67 countries)
Per
cent
age
of p
erso
ns c
onvi
cted
per
100
hom
icid
e ca
ses
2004-2006 2011-2013
Source: United Nations Survey of Crime Trends and Operations of Criminal Justice Systems. Note: The global total includes two countries in Africa and two countries in Oceania.
3. Recidivism
51. Recidivism — generally understood as the perpetration of a crime by someone who was previously responsible for the same offence or another offence — is an important indicator of not only the efficiency but also the effectiveness of the criminal justice system. For example, high levels of recidivism indicate that justice and correctional mechanisms are not capable of rehabilitating criminal offenders. An indirect measurement of recidivism can be obtained from the percentage of detainees who have served a previous prison sentence. Data in that respect are available for very few countries, and figure 24 shows that for the 20 European countries responding the highest rates of previously sentenced persons were found
__________________
20 Caution is required, as comparing the number of persons convicted of homicide with the number of victims of homicides in any given year at aggregated levels is a rather crude measure of efficiency. Indeed, it does not account for multiple homicides by one perpetrator, for multiple perpetrators of a homicide with only one victim or for the fact that in some cases long investigations may lead to conviction only several years after the event.

30 V.15-00369
A/CONF.222/4
in prisons in Northern Europe (more than two thirds), followed by Eastern and Southern Europe, with around 50 per cent. Only in Western Europe did this group represent less than half of the prison population (40 per cent). However, caution is required in interpreting these data as some of these countries have prison populations below the global average, and high shares of recidivist prisoners might not only be due to low effectiveness of rehabilitation programmes but may also be linked to sentencing policies. For example, policies that favour alternatives to imprisonment for first-time offenders are likely to result in repeating offenders being overrepresented in the prison population.
Figure 24 Percentage of persons detained who previously served a prison sentence in European subregions, average for the period 2010-2012
0%
10%
20%
30%
40%
50%
60%
70%
80%
90%
100%
Eastern Europe(6 countries)
Northern Europe(6 countries)
Southern Europe(4 countries)
Western Europe(4 countries)
Europe (20countries)
Per
cent
age
of p
erso
ns h
eld
who
had
ser
ved
a pr
evio
us
sent
ence
Source: United Nations Survey of Crime Trends and Operations of Criminal Justice Systems.
C. Fairness
52. The concept of fairness in criminal justice systems entails a number of procedures and standards for the treatment of offenders and victims that States are expected to ensure. The concept thus comprises issues such as ensuring equal treatment before the law and giving equitable consideration to legally relevant factors in adjudicating and sentencing. One key element of fairness is equality of arms, which entails in particular that accused offenders should be adequately represented at trial.

V.15-00369 31
A/CONF.222/4
1. Pretrial detention
53. According to the United Nations Standard Minimum Rules for Non-Custodial Measures (the Tokyo Rules) (General Assembly resolution 45/110, annex), all efforts should be made to reduce to the minimum the length of the detention of persons awaiting trial, while alternatives to pretrial detention should be found as early as possible. Consistent with that, efforts are being made in many countries to reduce the length of pretrial detention and the proportion of inmates awaiting trial.
54. Globally, over a quarter of persons in prison have not received a sentence or are awaiting trial (see figure 25). The highest rates were observed in Asia (approximately 40 per cent in the period 2011-2013) and Africa (35 per cent in the period 2011-2013), both with decreasing trends since 2004-2006.
Figure 25 Prison population in pretrial detention as a share of total prison population, by region, average for the periods 2004-2006, 2007-2010 and 2011-2013
0%
5%
10%
15%
20%
25%
30%
35%
40%
45%
50%
Africa (10countries)
Americas (22countries)
Asia (19countries)
Europe (39countries)
Oceania (2countries)
Global (92countries)
Per
cent
age
of p
rison
pop
ulat
ion
bein
g he
ld in
pre
trial
de
tent
ion
2004-2006 2007-2010 2011-2013
Source: United Nations Survey of Crime Trends and Operations of Criminal Justice Systems.
55. In all regions, pretrial detainees represent less than half of the prison population (see figure 25). However, these regional averages mask the fact that in each region there are a significant number of countries where pretrial detainees constitute the majority of the prison population. This was still the case in the period 2011-2013, when pretrial detainees constituted the majority of persons detained in 40 per cent of the reporting countries in Africa (a proportion that remained stable over time), 36 per cent of those in the Americas (an increase since the period 2004-2006) and 15 per cent of those in Asia (a decrease since the period 2004-2006). In contrast, all European countries have consistently reported less than 50 per cent of pretrial detainees in their institutions since 2004.

32 V.15-00369
A/CONF.222/4
56. The shares of pretrial detainees are highest, on average, in countries at the lower end of income levels and lowest in countries with higher income levels (see figure 26). This may point to possible resource constraints in the criminal justice system that prevent expeditious processing of crime suspects in pretrial detention. High levels of pretrial detention may point to shortcomings of the criminal justice system.
Figure 26 Prison population in pretrial detention as a share of total prison population, by levels of income of countries, averages for the periods 2004-2006, 2007-2010 and 2011-2013
0%
10%
20%
30%
40%
50%
60%
Low- and lower-middle-incomecountries (19 countries)
Upper-middle-income countries(29 countries)
High-income countries (47countries)
Per
cent
age
of p
rison
pop
ulat
ion
bein
g he
ld in
pre
trial
de
tent
ion
2004-2006 2007-2010 2011-2013 Source: United Nations Survey of Crime Trends and Operations of Criminal Justice Systems.
2. Prison overcrowding
57. In most regions of the world, the capacity of prisons is frequently exceeded, resulting in overcrowding (see figure 27). Overcrowding seriously affects prison conditions, limiting prisoners’ access to basic services (adequate living space, food and health care) and to serve their sentences within a rehabilitative framework. Despite some improvements, the global rate of prison occupation remained well above 100 per cent of capacity in the period 2011-2013. Levels of overcrowding have diminished most significantly in the nine African countries for which data are available.

V.15-00369 33
A/CONF.222/4
Figure 27 Prison population as a share of prison capacity, by region, average for the periods 2004-2006, 2007-2010 and 2011-2013
0%
50%
100%
150%
200%
250%
Africa (9 countries) Americas (22countries)
Asia (18 countries) Europe (42countries)
Global (92countries)
Per
cent
age
of p
rison
pop
ulat
ion
as a
sha
re o
f pris
on
capa
city
2004-2006 2008-2010 2011-2013
Source: United Nations Survey of Crime Trends and Operations of Criminal Justice Systems. Note: The global total includes one country in Oceania.
58. However, prison overcrowding remains an issue for many correctional systems in the world. While 15 per cent of reporting countries (14 out of 92) are experiencing a problem of extreme overcrowding (above 150 per cent of capacity), about one third of countries report slightly less overcrowding (between 115 per cent and 150 per cent of prison capacity). The number of countries facing overcrowding issues is particularly significant in the Americas (see figure 28).

34 V.15-00369
A/CONF.222/4
Figure 28 Percentage of countries where the adult prison population exceeds capacity by 115 per cent and 150 per cent, by region, average for the periods 2004-2006 and 2011-2013
0%
10%
20%
30%
40%
50%
60%
70%
80%
90%
100%
2004
-200
6
2011
-201
3
2004
-200
6
2011
-201
3
2004
-200
6
2011
-201
3
2004
-200
6
2011
-201
3
2004
-200
6
2011
-201
3
Africa (9 countries) Americas (22countries)
Asia (18 countries) Europe (42 countries) Global (92 countries)
Pris
on p
opul
atio
n as
per
cent
age
of c
apac
ity
<115 per cent 115-150 per cent >150 per cent
Source: United Nations Survey of Crime Trends and Operations of Criminal Justice Systems. Note: The global total includes one country in Oceania.
3. Deaths in prison
59. Correctional systems are responsible for ensuring the health and safety of their inmates. Data on deaths in prison can provide valuable information on the quality of living conditions in detention.21 Based on available data for 33 countries, about 7.4 prisoners per 100,000 persons held in prisons were victims of homicide while serving a sentence, a higher rate than the rate of homicide among the total population. Deaths in prisons were particularly prevalent in the Americas, where the rate of prisoners killed was 8.5 per 100,000. In some countries of Central and South America, homicides in prison show levels between 60 and 137 homicides per 100,000 prisoners (see figure 29).
60. Suicide among prisoners seems to be more frequent in Europe compared with other regions, with suicide rates among prisoners averaging 62 per 100,000,
__________________
21 According to principle 34 of the Body of Principles for the Protection of All Persons under Any Form of Detention or Imprisonment, “whenever the death or disappearance of a detained or imprisoned person occurs during his detention or imprisonment, an inquiry into the cause of death or disappearance shall be held by a judicial or other authority”.

V.15-00369 35
A/CONF.222/4
accounting for over 13 per cent of all deaths in prison. A number of stress factors may influence high rates of suicide in prison, including overcrowding, length of pretrial detention and harshness of treatment. Profiling the prison population at risk of suicide may be crucial to preventing further episodes, as recommended by the World Health Organization.22
Figure 29 Total deaths, homicides and suicides of prisoners, per 100,000 prison population, by region, average for the period 2010-2012 (logarithmic scale)
189.0
424.8 466.0280.4
8.5
3.6
2.0
7.4
21.417.0
62.5
32.5
1
10
100
1000
Dea
ths
per 1
00,0
00 p
opul
atio
n (lo
garit
hmic
sca
le)
Total deaths Homicide Suicide
Americas (12 countries)
Asia(11 countries)
Europe(29 countries)
Global (55 countries)
Source: United Nations Survey of Crime Trends and Operations of Criminal Justice Systems. Note: The global total includes one country in Africa and two countries in Oceania.
4. Child detention
61. The number of children in detention per 100,000 child population is one of the key juvenile justice indicators.23 In line with international standards and norms, deprivation of liberty and arrest of children should be taken as a last resort and for the shortest period of time.24
62. Globally, between the period 2004-2006 and the period 2011-2013, the rate of children in prison fell from 12 to 10 per 100,000 children (see figure 30). Such changes may be affected by sudden changes in policies in different countries and a greater reliance on alternatives to imprisonment and the promotion of rehabilitation
__________________
22 See www.who.int/mental_health/prevention/suicide/resource_jails_prisons.pdf. 23 See Manual for the Measurement of Juvenile Justice Indicators (United Nations publication,
Sales No. E.07.V.7). 24 See the Convention on the Rights of the Child, article 37 (b); and United Nations Rules for the
Protection of Juveniles Deprived of their Liberty (General Assembly resolution 45/113, annex).

36 V.15-00369
A/CONF.222/4
measures within the juvenile justice system in many countries. In particular, significant increases can be observed in Central America and Western Asia, while in Europe, rates of juvenile prison populations fell by more than 30 per cent in most subregions, with the exception of Southern Europe.
Figure 30 Juvenile prison population, per 100,000 juvenile population, by region (average for the periods 2004-2006 and 2011-2013)
0
5
10
15
20
25
30
35
40
45
50
Africa (10countries)
Americas (11countries)
Asia (16countries)
Europe (37countries)
Oceania (2countries)
Global (76countries)
Rat
e pe
r 100
,000
juve
nile
pop
ulat
ion
2004-2006 2011-2013
Source: United Nations Survey of Crime Trends and Operations of Criminal Justice Systems.
IV. The improvements of statistical systems to monitor crime and criminal justice
63. As the focal point for statistics related to crime and criminal justice in the United Nations system, over the past few years UNODC has carried out a number of activities to strengthen data collection and analysis on crime and criminal justice. As laid out in a 2013 report on a road map to improve the quality and availability of crime statistics (E/CN.3/2013/11) presented to and supported by the Commission on Crime Prevention and Criminal Justice and the Statistical Commission, such activities broadly fall into three categories: developing new standards and methodology on crime statistics, improving the capacity to produce and disseminate crime data, and improving international data collection and analysis.
64. In the area of improving standards, UNODC has led the global effort to address the lack of common definitions and concepts to describe criminal offences through the development of the international classification of crime for statistical purposes. After more than five years of development that have been marked by

V.15-00369 37
A/CONF.222/4
extensive methodological work, several rounds of testing and extended consultations with Member States, as well as substantive and statistical experts, the first comprehensive classification of crime at the international level will finally be presented to the Statistical Commission and the Commission on Crime Prevention and Criminal Justice in 2015. Further activities by UNODC are planned to support the implementation and use of the classification.
65. Methodologies for measuring crime through sample surveys have been strengthened through the further development and promotion of crime victimization surveys. In the Latin American and Caribbean region, UNODC and the Centre of Excellence for Statistical Information on Governance, Victims of Crime, Public Security and Justice, operated by the National Institute of Statistics and Geography of Mexico and UNODC, are leading a regional initiative (the Latin American and Caribbean crime victimization survey initiative), together with a number of international and national organizations to create a common victimization survey toolkit, including a methodological framework and a harmonized questionnaire, to implement comparable crime victimization surveys in the region.
66. Over the past few years, UNODC has undertaken a number of initiatives to support countries in the production of crime statistics, through advisory services, training tools, direct technical assistance activities and training and the organization of seminars and meetings. In particular, training courses on victimization surveys have been provided to countries in Latin America and Asia, and direct technical assistance has been provided on the compilation of the United Nations Survey of Crime Trends and Operations of Criminal Justice Systems.
67. Fundamental tools to promote the quality and consistency of crime and criminal justice statistics have been the creation of a regional hub on crime statistics in Mexico City — the Centre of Excellence for Statistical Information on Governance, Victims of Crime, Public Security and Justice — in close collaboration with the National Institute of Statistics of Mexico. In collaboration with the same institutes (the Centre of Excellence and the National Institute of Statistics of Mexico) and other organizations, two large international conferences on crime statistics were held: first International Conference on Government, Public Safety, Victimization and Justice Statistics, held in Aguascalientes in 2012, and the second International Conference on Governance, Crime and Justice Statistics, held in Mexico City in 2014.
68. As requested by the Economic and Social Council and the General Assembly in a number of resolutions,25 UNODC has been carrying out a programme of global data collection through the United Nations Survey on Crime Trends and Operations of Criminal Justice Systems since the 1970s. Data are collected annually from Member States, disseminated for public use on the UNODC website and used for analytical publications. In recent years, efforts have focused on building up a network of national focal points and on establishing collaborative relations with regional organizations such as Eurostat and the Organization of American States.
69. Building on the data collected through the United Nations Survey on Crime Trends and Operations of Criminal Justice Systems and supplemented by an
__________________
25 General Assembly resolutions 65/232 and 66/181 and Economic and Social Council resolutions 2009/25 and 2012/18.
38 V.15-00369
A/CONF.222/4
extended data collection for its global homicide statistics database, UNODC produced and published two editions of the Global Study on Homicide (2011 and 2013).26 The 2013 study included data on patterns and trends of intentional homicide for 219 countries and territories, examined homicide and violence in the wake of conflict, the roles played by firearms and other mechanisms and analysed the criminal justice response to homicide.
70. Progress has been made in the measurement of corruption through the implementation of surveys focusing on the experience of bribery, both within the general population and within the business sector. Over the past few years, UNODC supported a number of countries in developing methodological tools, survey questionnaires and analytical publications on corruption.27
V. Conclusions and recommendations
A. Conclusions
71. Analyses presented in this report indicate that several challenges remain in ensuring that all citizens in the world can live safely and in contexts where the rule of law is respected and promoted. Homicidal violence, while slowly decreasing at the global level, remains higher and continues to increase in countries at the lower end of the income scale. In that context, the killing of women by intimate partners and family members, a proxy of gender-related killing of women and girls, shows a similar prevalence in all regions of the world, quite irrespective of levels of other types of lethal violence.
72. Available information also indicates that low-income countries are disproportionately affected by bribery, while flows of illicit trafficking, whether of persons or of endangered species, typically originate in developing countries and have countries in richer regions as their final destination. Some indicators of fairness of the criminal justice system, such as pretrial detention or prison overcrowding, similarly suggest that weaker rule of law tends to be associated with lower levels of economic development.
73. Regular monitoring of crime trends and the operations of criminal justice systems is thus key to measuring progress in strengthening the rule of law and advancing towards sustainable development. An increasing set of statistical data and indicators on crime trends and the operations of criminal justice systems meet the requirements of relevance, methodological robustness and geographical coverage, which could support the assessment of progress towards sustainable development. As the present report shows, indicators on homicide, gender-related killings, corruption, trafficking in persons, wildlife crime, sentencing policies and efficiency
__________________
26 Available at www.unodc.org/gsh/. 27 See the regional report, Corruption in the Western Balkans: Bribery as Experienced by the
Population (Vienna, 2011) and seven national-level reports: “Corruption in Afghanistan: bribery as reported by the victims” (Vienna, 2010); “Corruption in Afghanistan: recent patterns and trends - summary findings” (Vienna, 2012); Corruption and Integrity Challenges in the Public Sector of Iraq (Vienna, 2013); the regional report Business, Corruption and Crime in the Western Balkans: The Impact of Bribery and other Crime on Private Enterprise (Vienna, 2013), and seven national-level reports.
V.15-00369 39
A/CONF.222/4
and fairness of the criminal justice system have become, to different degrees, more robust and more available, and can support the monitoring of aspects related to violence and security, violence against women, access to justice, and rule of law, as expressed in goals 5, 15 and 16 proposed by the Open Working Group (A/68/970 and Corr.1).
74. The progress being made in the quality, international comparability and availability of crime statistics is an encouraging development to consider for the selection of indicators for the post-2015 agenda. For example, the international classification of crime for statistical purposes represents an important advancement at the international level, with the potential to serve as a common definitional framework for both the initial recording and/or subsequent sharing of data.
B. Recommendations
75. The Congress may wish to take note of the progress made at the global level in reducing certain types of crime (such as property crime), while challenges remain for other crimes (including homicide) in certain regions and in countries with lower levels of income. While noting the gaps remaining in terms of the quality and availability of data, the Congress may wish to recommend further work to analyse the links between crime, criminal justice and development.
76. Over the past few years, the international community has been engaged in fine-tuning proposals for goals and targets to be included in the post-2015 framework. In parallel, considerable work has been carried out at the national and international levels to improve statistics on crime and criminal justice, for which a set of indicators conducive to overall assessment is now available. The Congress may wish to acknowledge the progress made in improving the statistical evidence on crime and criminal justice, including in view of the finalization of the post-2015 development agenda.
77. With the finalization of the international classification of crime for statistical purposes, a milestone in the road towards better and more comparable data on crime has been achieved, building the basis for more robust analyses of crime trends. National authorities could be encouraged to gradually adopt the new classification when producing statistics on crime. In parallel, UNODC should provide technical and methodological guidance to support such efforts, while commensurate resources should be made available to develop technical assistance programmes in support of the implementation of the international classification of crime for statistical purposes.
78. International monitoring and analysis of crime trends and of criminal justice operations is key to further improving the understanding of patterns and drivers of crime, and of the quality of the responses to crime, including of crime prevention programmes. Building on the successful experience of the Global Study on Homicide, the Congress may wish to encourage UNODC to further strengthen its activities of data collection and analysis on crime. It could explore forms of collaboration with other regional and international agencies in order to streamline data collection and to further improve quality and comprehensiveness of the analysis, which should aim to provide indications on effectiveness of crime prevention and reduction policies.