Embed Size (px)
Citation preview
United Kingdom 1502017The annual report on the most valuable British brandsApril 2017
Brand Finance United Kingdom 150 April 2017 3.Brand Finance Australia 100 March 2016 2. 3.Brand Finance Global 500 February 2016 2. Brand Finance Airlines 30 30 February 2015 2.
Brand Finance United Kingdom 150 April 2017 2.
Foreword.
Foreword 2
Definitions 4
Methodology 6
Excecutive Summary 8
Full Tables (GPBm & USDm) 14
Understand Your Brand’s Value 20
How We Can Help 22
Contact Details 23
Contents
David Haigh, CEO, Brand Finance
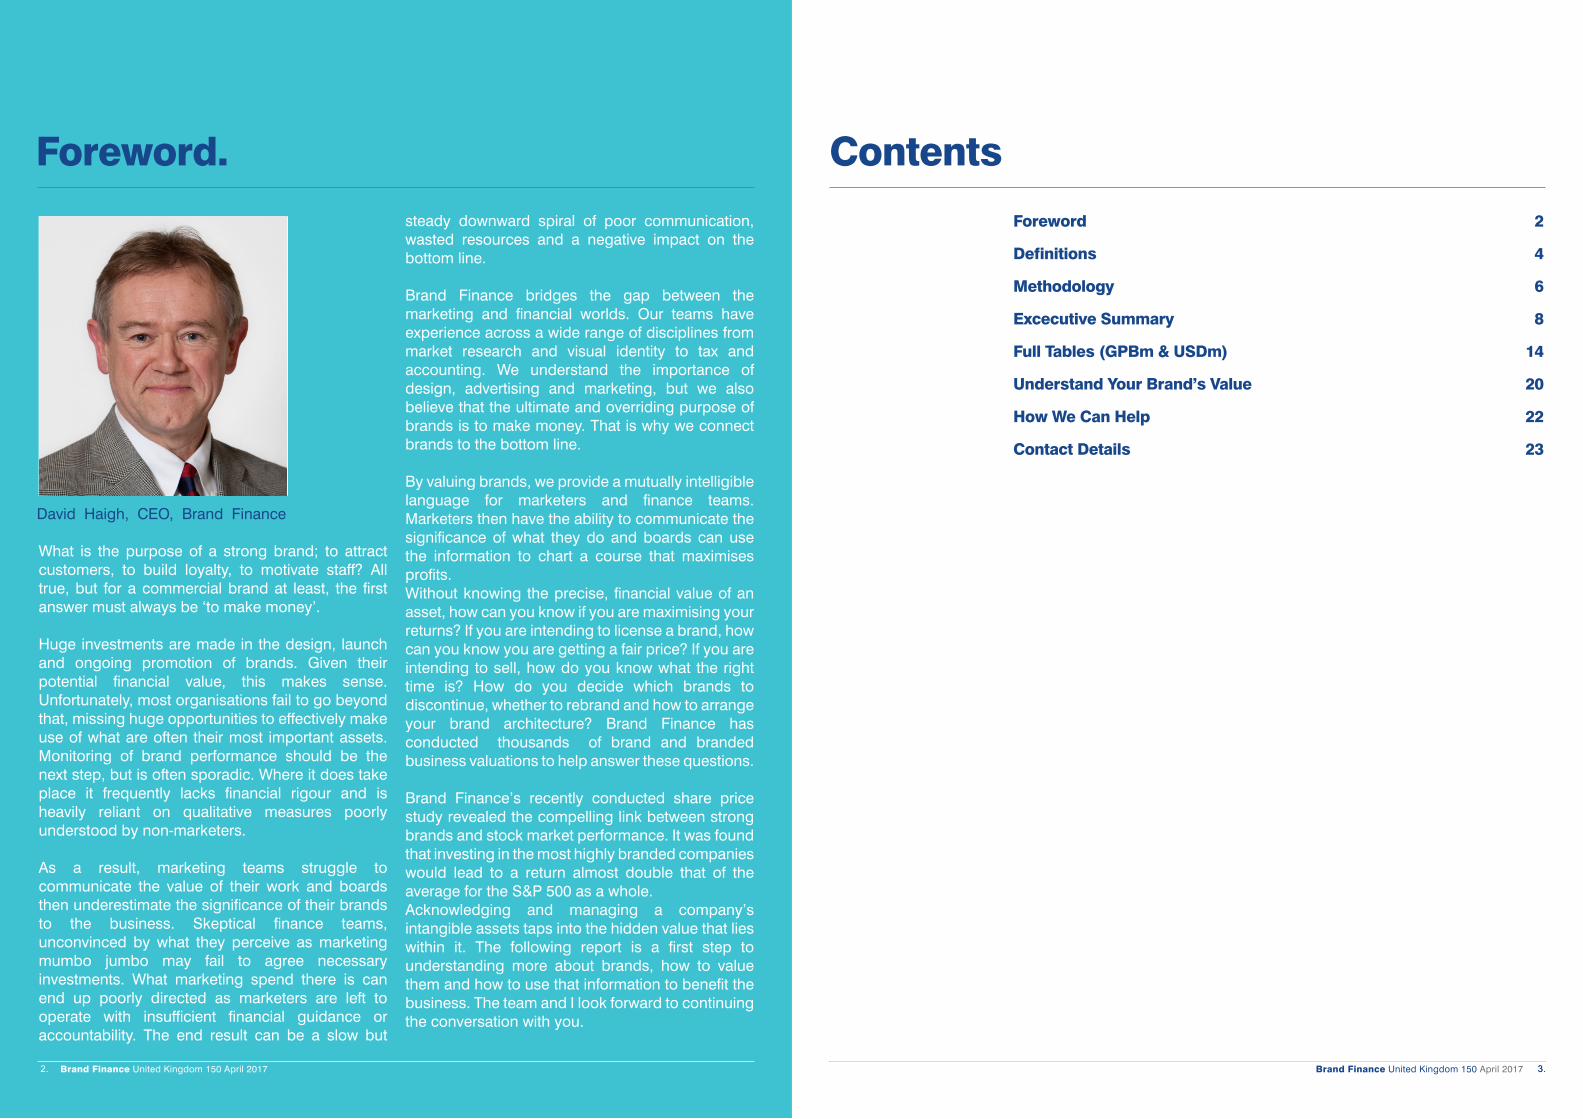
What is the purpose of a strong brand; to attract customers, to build loyalty, to motivate staff? All true, but for a commercial brand at least, the first answer must always be ‘to make money’.
Huge investments are made in the design, launch and ongoing promotion of brands. Given their potential financial value, this makes sense. Unfortunately, most organisations fail to go beyond that, missing huge opportunities to effectively make use of what are often their most important assets. Monitoring of brand performance should be the next step, but is often sporadic. Where it does take place it frequently lacks financial rigour and is heavily reliant on qualitative measures poorly understood by non-marketers.
As a result, marketing teams struggle to communicate the value of their work and boards then underestimate the significance of their brands to the business. Skeptical finance teams, unconvinced by what they perceive as marketing mumbo jumbo may fail to agree necessary investments. What marketing spend there is can end up poorly directed as marketers are left to operate with insufficient financial guidance or accountability. The end result can be a slow but
steady downward spiral of poor communication, wasted resources and a negative impact on the bottom line.
Brand Finance bridges the gap between the marketing and financial worlds. Our teams have experience across a wide range of disciplines from market research and visual identity to tax and accounting. We understand the importance of design, advertising and marketing, but we also believe that the ultimate and overriding purpose of brands is to make money. That is why we connect brands to the bottom line.
By valuing brands, we provide a mutually intelligible language for marketers and finance teams. Marketers then have the ability to communicate the significance of what they do and boards can use the information to chart a course that maximises profits. Without knowing the precise, financial value of an asset, how can you know if you are maximising your returns? If you are intending to license a brand, how can you know you are getting a fair price? If you are intending to sell, how do you know what the right time is? How do you decide which brands to discontinue, whether to rebrand and how to arrange your brand architecture? Brand Finance has conducted thousands of brand and branded business valuations to help answer these questions.
Brand Finance’s recently conducted share price study revealed the compelling link between strong brands and stock market performance. It was found that investing in the most highly branded companies would lead to a return almost double that of the average for the S&P 500 as a whole. Acknowledging and managing a company’s intangible assets taps into the hidden value that lies within it. The following report is a first step to understanding more about brands, how to value them and how to use that information to benefit the business. The team and I look forward to continuing the conversation with you.
Brand Finance United Kingdom 150 April 2017 5.Brand Finance United Kingdom 150 April 2017 4.
Definitions
Definitions+ Enterprise Value – the value of the
entire enterprise, made up of multiple branded businesses
+ Branded Business Value – the value of a single branded business operating under the subject brand
+ Brand Contribution– The total economic benefit derived by a business from its brand
+ Brand Value – the value of the trade marks (and relating marketing IP and ‘goodwill’ attached to it) within the branded business
‘Branded Business’
‘Branded Enterprise’
E.g.Unilever
E.g.Dove
E.g.Dove
‘Brand Value’
‘Branded Business’
‘Branded Enterprise’
‘Brand’ Contribution’
E.g.Dove
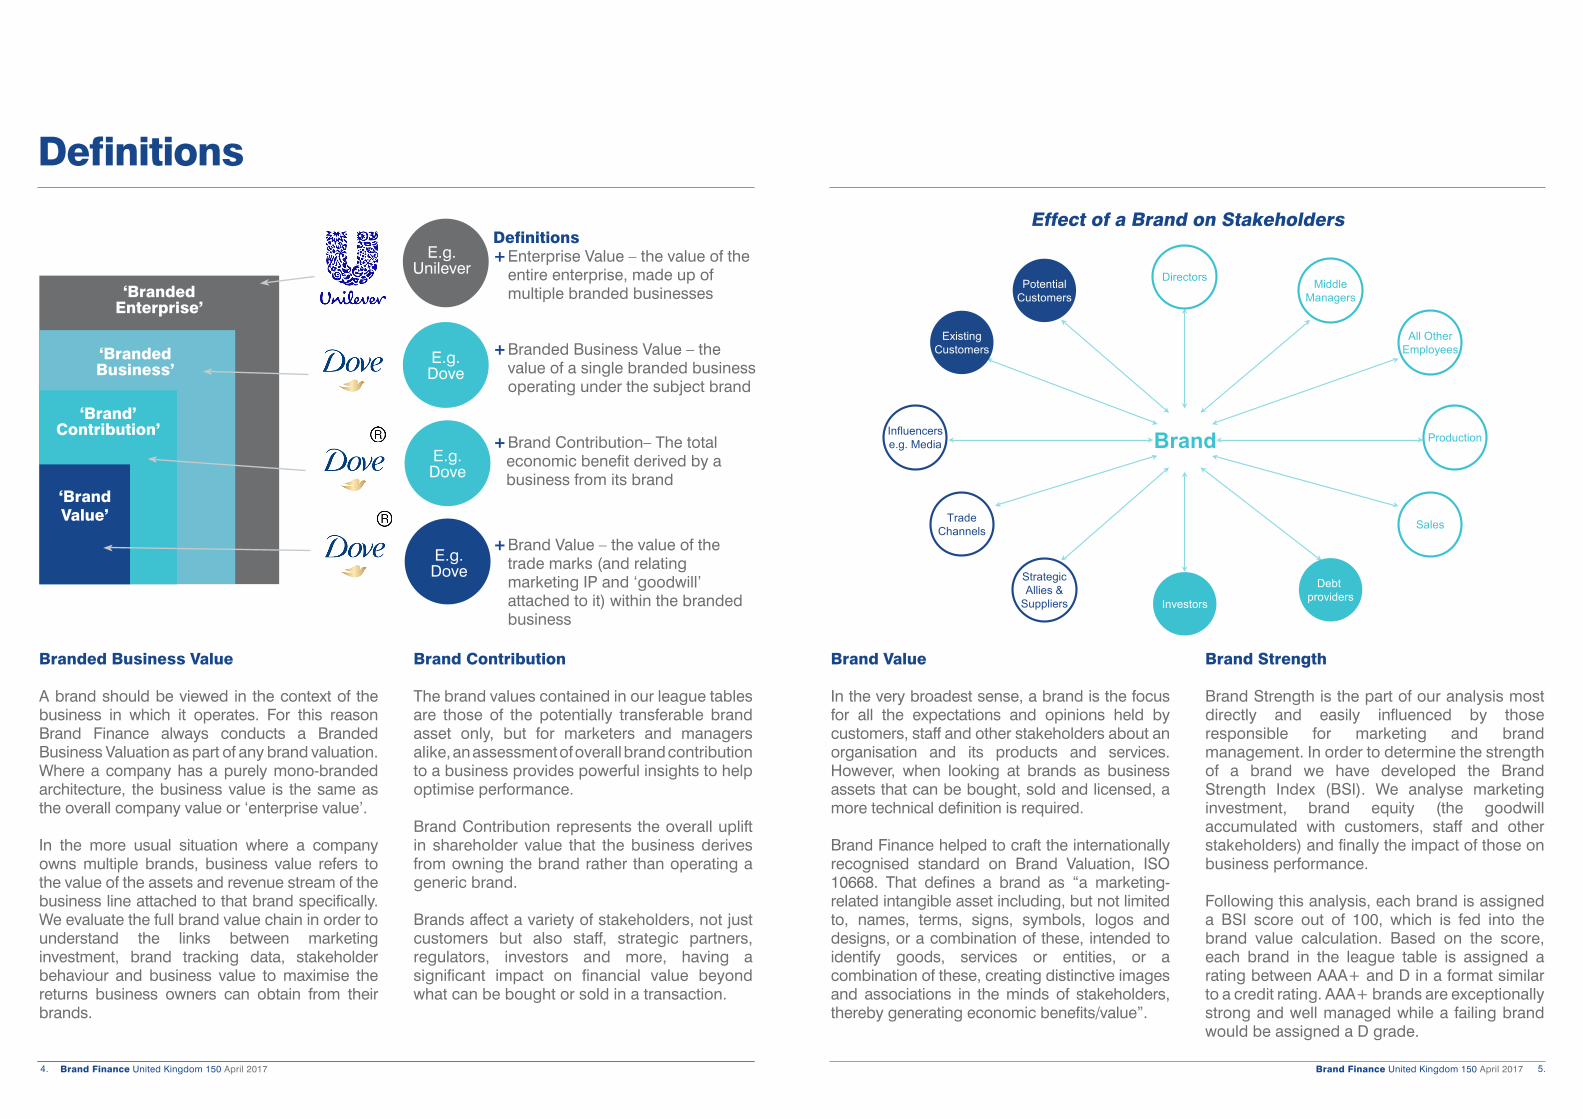
Branded Business Value
A brand should be viewed in the context of the business in which it operates. For this reason Brand Finance always conducts a Branded Business Valuation as part of any brand valuation. Where a company has a purely mono-branded architecture, the business value is the same as the overall company value or ‘enterprise value’.
In the more usual situation where a company owns multiple brands, business value refers to the value of the assets and revenue stream of the business line attached to that brand specifically. We evaluate the full brand value chain in order to understand the links between marketing investment, brand tracking data, stakeholder behaviour and business value to maximise the returns business owners can obtain from their brands.
Brand Contribution
The brand values contained in our league tables are those of the potentially transferable brand asset only, but for marketers and managers alike, an assessment of overall brand contribution to a business provides powerful insights to help optimise performance.
Brand Contribution represents the overall uplift in shareholder value that the business derives from owning the brand rather than operating a generic brand.
Brands affect a variety of stakeholders, not just customers but also staff, strategic partners, regulators, investors and more, having a significant impact on financial value beyond what can be bought or sold in a transaction.
Brand Value
In the very broadest sense, a brand is the focus for all the expectations and opinions held by customers, staff and other stakeholders about an organisation and its products and services. However, when looking at brands as business assets that can be bought, sold and licensed, a more technical definition is required.
Brand Finance helped to craft the internationally recognised standard on Brand Valuation, ISO 10668. That defines a brand as “a marketing-related intangible asset including, but not limited to, names, terms, signs, symbols, logos and designs, or a combination of these, intended to identify goods, services or entities, or a combination of these, creating distinctive images and associations in the minds of stakeholders, thereby generating economic benefits/value”.
Brand Strength
Brand Strength is the part of our analysis most directly and easily influenced by those responsible for marketing and brand management. In order to determine the strength of a brand we have developed the Brand Strength Index (BSI). We analyse marketing investment, brand equity (the goodwill accumulated with customers, staff and other stakeholders) and finally the impact of those on business performance.
Following this analysis, each brand is assigned a BSI score out of 100, which is fed into the brand value calculation. Based on the score, each brand in the league table is assigned a rating between AAA+ and D in a format similar to a credit rating. AAA+ brands are exceptionally strong and well managed while a failing brand would be assigned a D grade.
Effect of a Brand on Stakeholders
PotentialCustomers
ExistingCustomers
Influencerse.g. Media
TradeChannels
StrategicAllies &
Suppliers Investors
Debt providers
Sales
Production
All OtherEmployees
MiddleManagers
Directors
Brand
Brand Finance United Kingdom 150 April 2017 7.Brand Finance United Kingdom 150 April 2017 6.
Methodology
Inputs StakeholderBehaviour PerformanceBrand Equity
Value DriversBrand
Contribution
Audit the impact of brand management and investment on brand equity
Run analytics to understand how perceptions link to behaviour
Link stakeholder behaviour with key financial value drivers
Model the impact of behaviour on core financial performance and isolating the value of the brand contribution
Brand Audit Trial & Preference Acquisition & Retention
Valuation Modelling
1 2 3 4
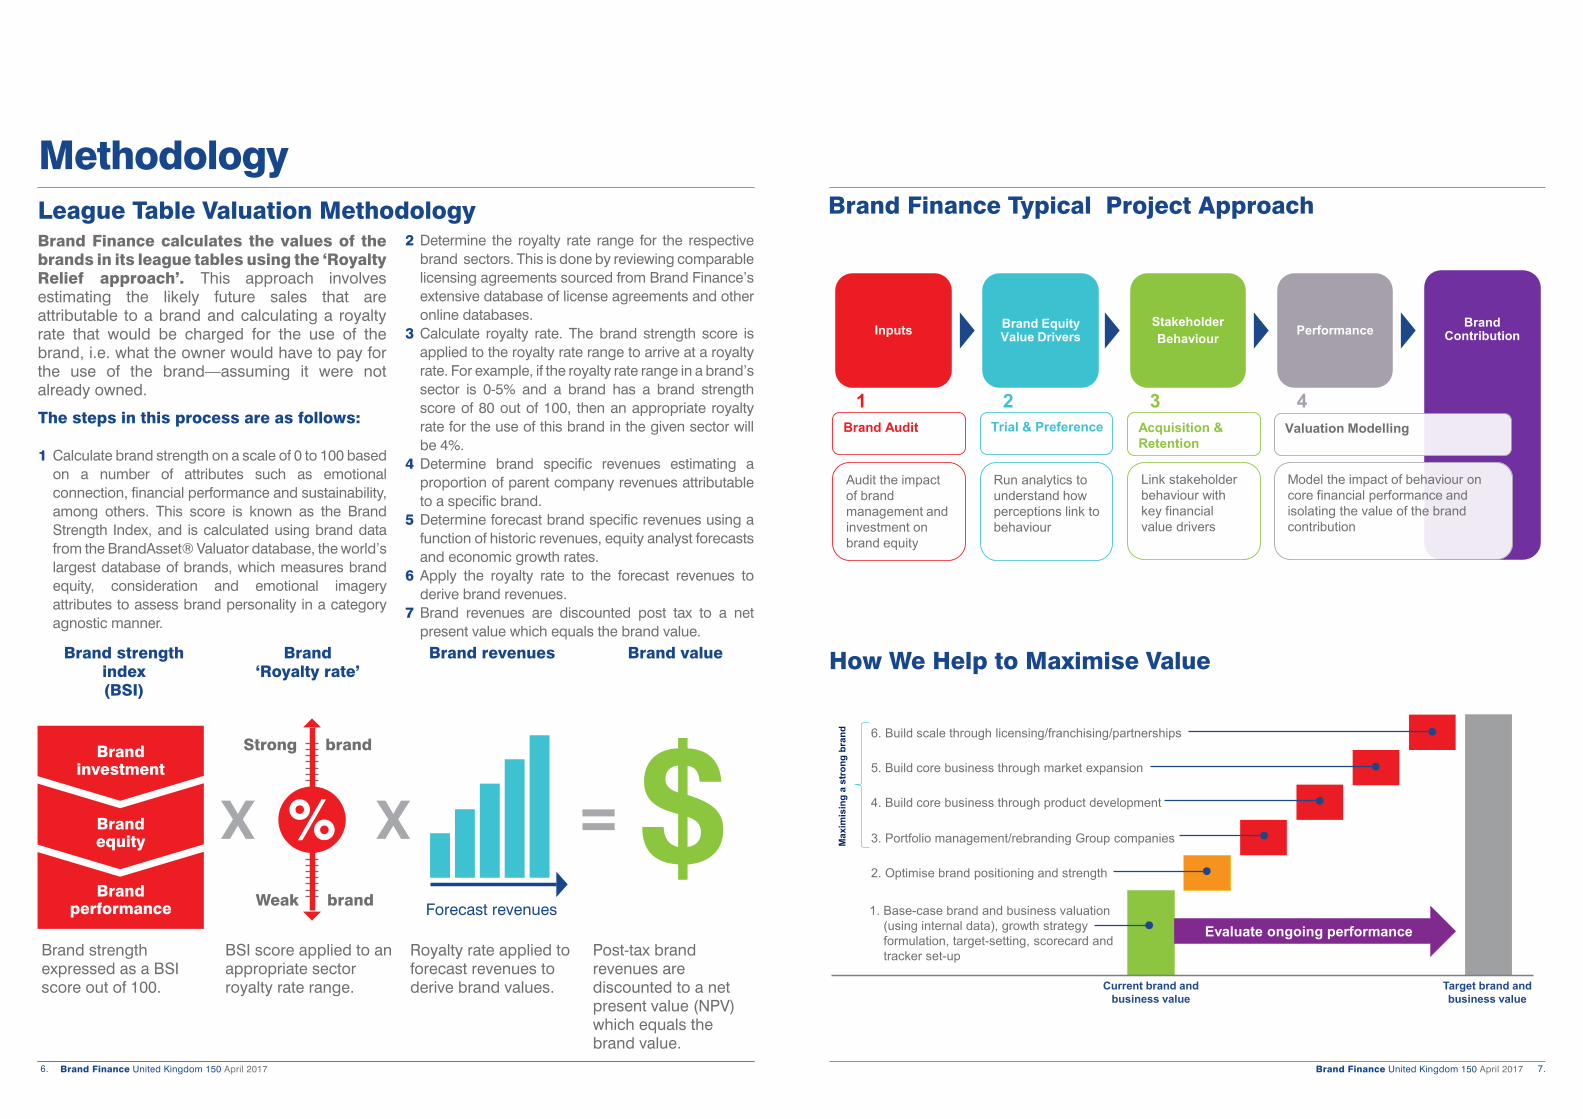
Brand Finance Typical Project ApproachBrand Finance calculates the values of the brands in its league tables using the ‘Royalty Relief approach’. This approach involves estimating the likely future sales that are attributable to a brand and calculating a royalty rate that would be charged for the use of the brand, i.e. what the owner would have to pay for the use of the brand—assuming it were not already owned.
Brand strength expressed as a BSI score out of 100.
BSI score applied to an appropriate sector royalty rate range.
Royalty rate applied to forecast revenues to derive brand values.
Post-tax brand revenues are discounted to a net present value (NPV) which equals the brand value.
The steps in this process are as follows:
1 Calculate brand strength on a scale of 0 to 100 based on a number of attributes such as emotional connection, financial performance and sustainability, among others. This score is known as the Brand Strength Index, and is calculated using brand data from the BrandAsset® Valuator database, the world’s largest database of brands, which measures brand equity, consideration and emotional imagery attributes to assess brand personality in a category agnostic manner.
Strong brand
Weak brand
Brand strength index(BSI)
Brand‘Royalty rate’
Brand revenues Brand value
Forecast revenues
Brand investment
Brand equity
Brand performance
2 Determine the royalty rate range for the respective brand sectors. This is done by reviewing comparable licensing agreements sourced from Brand Finance’s extensive database of license agreements and other online databases.
3 Calculate royalty rate. The brand strength score is applied to the royalty rate range to arrive at a royalty rate. For example, if the royalty rate range in a brand’s sector is 0-5% and a brand has a brand strength score of 80 out of 100, then an appropriate royalty rate for the use of this brand in the given sector will be 4%.
4 Determine brand specific revenues estimating a proportion of parent company revenues attributable to a specific brand.
5 Determine forecast brand specific revenues using a function of historic revenues, equity analyst forecasts and economic growth rates.
6 Apply the royalty rate to the forecast revenues to derive brand revenues.
7 Brand revenues are discounted post tax to a net present value which equals the brand value.
League Table Valuation Methodology
How We Help to Maximise Value
6. Build scale through licensing/franchising/partnerships
5. Build core business through market expansion
4. Build core business through product development
3. Portfolio management/rebranding Group companies
2. Optimise brand positioning and strength
1. Base-case brand and business valuation(using internal data), growth strategyformulation, target-setting, scorecard andtracker set-up
Evaluate ongoing performance
Current brand and business value
Target brand and business value
Max
imis
ing
a st
rong
bra
nd
Brand Finance United Kingdom 150 April 2017 9.Brand Finance United Kingdom 150 April 2017 8.
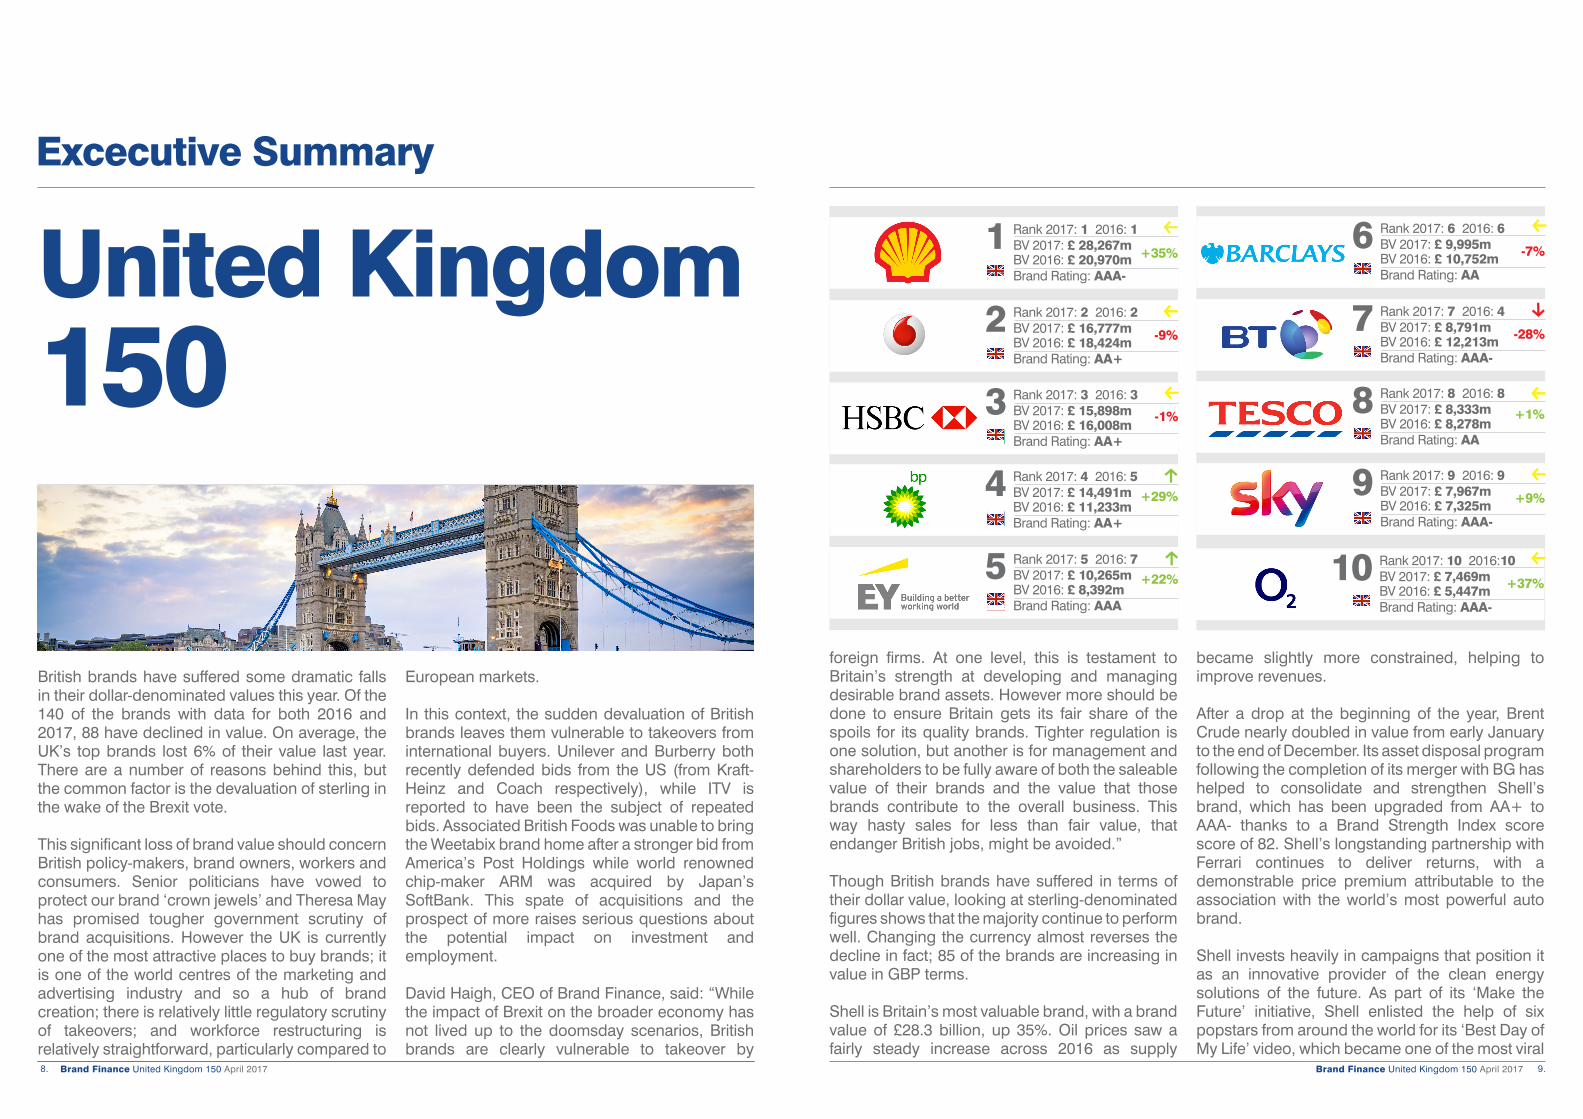
British brands have suffered some dramatic falls in their dollar-denominated values this year. Of the 140 of the brands with data for both 2016 and 2017, 88 have declined in value. On average, the UK’s top brands lost 6% of their value last year. There are a number of reasons behind this, but the common factor is the devaluation of sterling in the wake of the Brexit vote.
This significant loss of brand value should concern British policy-makers, brand owners, workers and consumers. Senior politicians have vowed to protect our brand ‘crown jewels’ and Theresa May has promised tougher government scrutiny of brand acquisitions. However the UK is currently one of the most attractive places to buy brands; it is one of the world centres of the marketing and advertising industry and so a hub of brand creation; there is relatively little regulatory scrutiny of takeovers; and workforce restructuring is relatively straightforward, particularly compared to
European markets.
In this context, the sudden devaluation of British brands leaves them vulnerable to takeovers from international buyers. Unilever and Burberry both recently defended bids from the US (from Kraft-Heinz and Coach respectively), while ITV is reported to have been the subject of repeated bids. Associated British Foods was unable to bring the Weetabix brand home after a stronger bid from America’s Post Holdings while world renowned chip-maker ARM was acquired by Japan’s SoftBank. This spate of acquisitions and the prospect of more raises serious questions about the potential impact on investment and employment.
David Haigh, CEO of Brand Finance, said: “While the impact of Brexit on the broader economy has not lived up to the doomsday scenarios, British brands are clearly vulnerable to takeover by
United Kingdom 150
Excecutive Summary
Rank 2017: 1 2016: 1 BV 2017: £ 28,267m BV 2016: £ 20,970mBrand Rating: AAA-
Rank 2017: 2 2016: 2 BV 2017: £ 16,777m BV 2016: £ 18,424mBrand Rating: AA+
Rank 2017: 5 2016: 7 BV 2017: £ 10,265m BV 2016: £ 8,392mBrand Rating: AAA
1
2
5
+35%
-9%
Rank 2017: 6 2016: 6 BV 2017: £ 9,995m BV 2016: £ 10,752mBrand Rating: AA
Rank 2017: 7 2016: 4 BV 2017: £ 8,791m BV 2016: £ 12,213mBrand Rating: AAA-
Rank 2017: 8 2016: 8 BV 2017: £ 8,333m BV 2016: £ 8,278mBrand Rating: AA
Rank 2017: 9 2016: 9 BV 2017: £ 7,967m BV 2016: £ 7,325mBrand Rating: AAA-
6
7
8
9
-7%
-28%
+9%
+22%
foreign firms. At one level, this is testament to Britain’s strength at developing and managing desirable brand assets. However more should be done to ensure Britain gets its fair share of the spoils for its quality brands. Tighter regulation is one solution, but another is for management and shareholders to be fully aware of both the saleable value of their brands and the value that those brands contribute to the overall business. This way hasty sales for less than fair value, that endanger British jobs, might be avoided.”
Though British brands have suffered in terms of their dollar value, looking at sterling-denominated figures shows that the majority continue to perform well. Changing the currency almost reverses the decline in fact; 85 of the brands are increasing in value in GBP terms.
Shell is Britain’s most valuable brand, with a brand value of £28.3 billion, up 35%. Oil prices saw a fairly steady increase across 2016 as supply
became slightly more constrained, helping to improve revenues.
After a drop at the beginning of the year, Brent Crude nearly doubled in value from early January to the end of December. Its asset disposal program following the completion of its merger with BG has helped to consolidate and strengthen Shell’s brand, which has been upgraded from AA+ to AAA- thanks to a Brand Strength Index score score of 82. Shell’s longstanding partnership with Ferrari continues to deliver returns, with a demonstrable price premium attributable to the association with the world’s most powerful auto brand.
Shell invests heavily in campaigns that position it as an innovative provider of the clean energy solutions of the future. As part of its ‘Make the Future’ initiative, Shell enlisted the help of six popstars from around the world for its ‘Best Day of My Life’ video, which became one of the most viral
Rank 2017: 3 2016: 3 BV 2017: £ 15,898m BV 2016: £ 16,008mBrand Rating: AA+
3
Rank 2017: 4 2016: 5 BV 2017: £ 14,491m BV 2016: £ 11,233mBrand Rating: AA+
4 +29%
Rank 2017: 10 2016:10 BV 2017: £ 7,469m BV 2016: £ 5,447mBrand Rating: AAA-
10 +37%
-1% +1%
Brand Finance United Kingdom 150 April 2017 11.Brand Finance United Kingdom 150 April 2017 10.
Excecutive Summary
0
5
10
15
20
25
30
EY
BP
HSBC
Vodafone
Shell
2017201620152014201320122011
Bra
nd
val
ue
(GB
Pb
n)
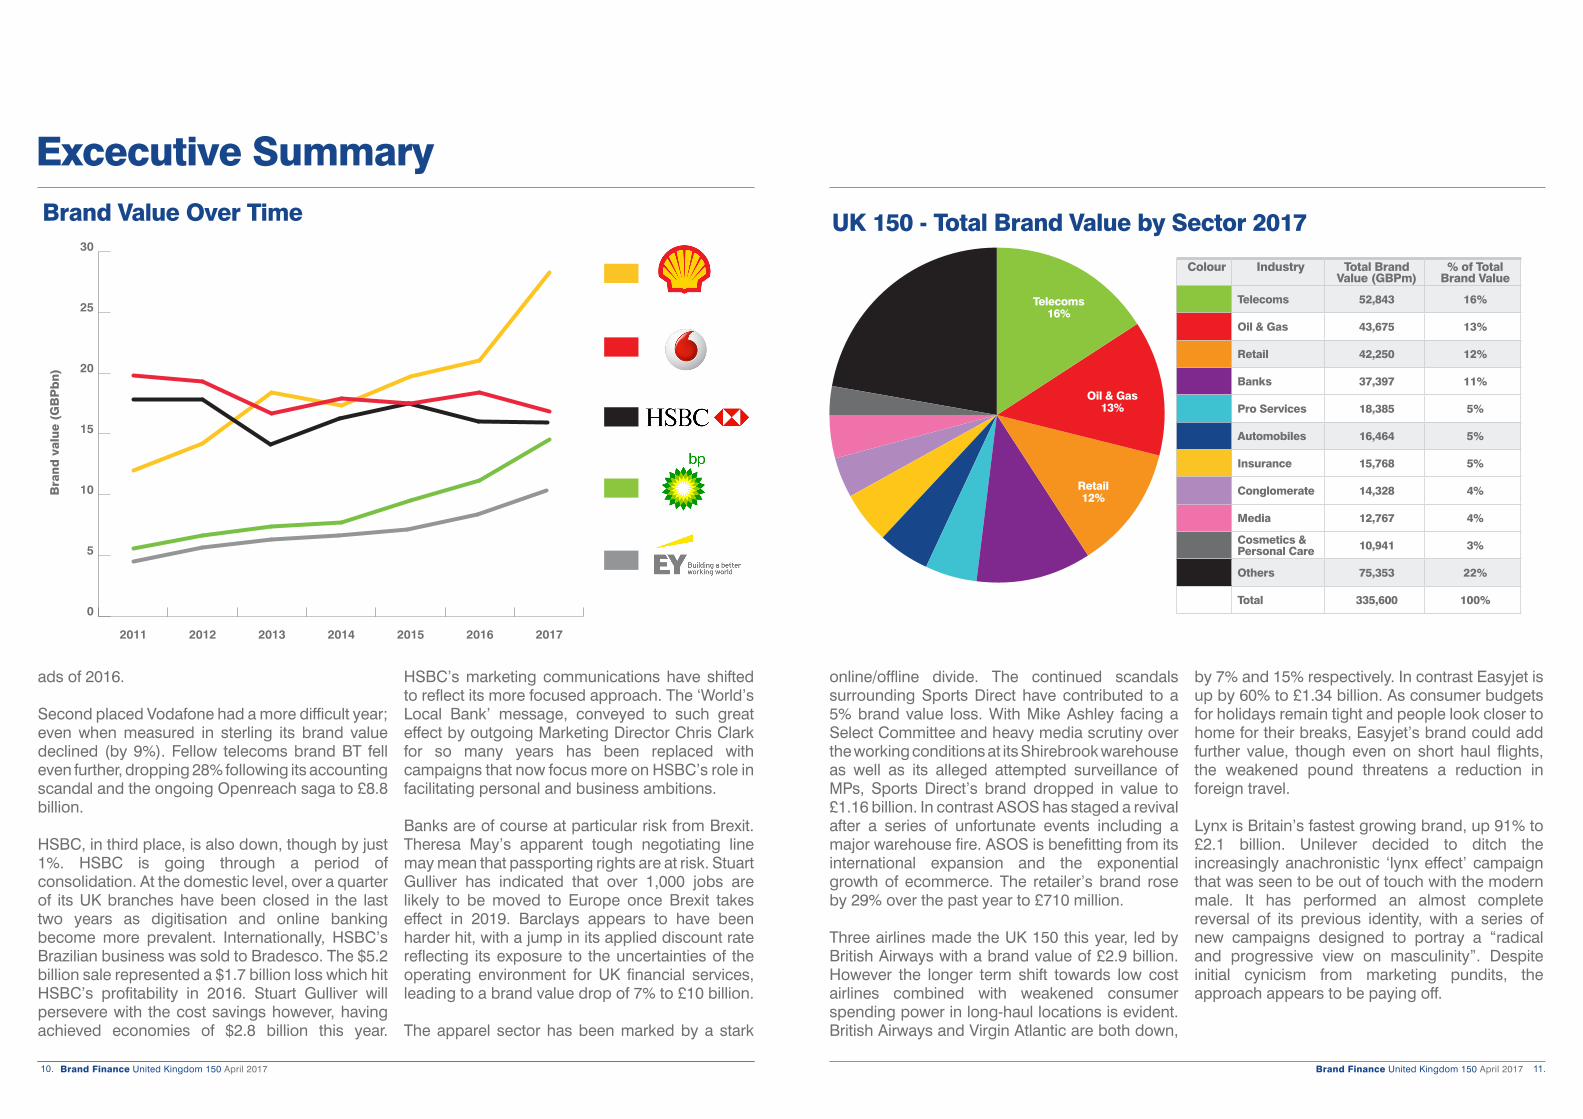
Brand Value Over Time
Colour Industry Total Brand Value (GBPm)
% of Total Brand Value
Telecoms 52,843 16%
Oil & Gas 43,675 13%
Retail 42,250 12%
Banks 37,397 11%
Pro Services 18,385 5%
Automobiles 16,464 5%
Insurance 15,768 5%
Conglomerate 14,328 4%
Media 12,767 4%
Cosmetics & Personal Care 10,941 3%
Others 75,353 22%
Total 335,600 100%
UK 150 - Total Brand Value by Sector 2017
Telecoms16%
Banks11%
Oil & Gas13%
Retail12%
ads of 2016.
Second placed Vodafone had a more difficult year; even when measured in sterling its brand value declined (by 9%). Fellow telecoms brand BT fell even further, dropping 28% following its accounting scandal and the ongoing Openreach saga to £8.8 billion.
HSBC, in third place, is also down, though by just 1%. HSBC is going through a period of consolidation. At the domestic level, over a quarter of its UK branches have been closed in the last two years as digitisation and online banking become more prevalent. Internationally, HSBC’s Brazilian business was sold to Bradesco. The $5.2 billion sale represented a $1.7 billion loss which hit HSBC’s profitability in 2016. Stuart Gulliver will persevere with the cost savings however, having achieved economies of $2.8 billion this year.
HSBC’s marketing communications have shifted to reflect its more focused approach. The ‘World’s Local Bank’ message, conveyed to such great effect by outgoing Marketing Director Chris Clark for so many years has been replaced with campaigns that now focus more on HSBC’s role in facilitating personal and business ambitions.
Banks are of course at particular risk from Brexit. Theresa May’s apparent tough negotiating line may mean that passporting rights are at risk. Stuart Gulliver has indicated that over 1,000 jobs are likely to be moved to Europe once Brexit takes effect in 2019. Barclays appears to have been harder hit, with a jump in its applied discount rate reflecting its exposure to the uncertainties of the operating environment for UK financial services, leading to a brand value drop of 7% to £10 billion.
The apparel sector has been marked by a stark
online/offline divide. The continued scandals surrounding Sports Direct have contributed to a 5% brand value loss. With Mike Ashley facing a Select Committee and heavy media scrutiny over the working conditions at its Shirebrook warehouse as well as its alleged attempted surveillance of MPs, Sports Direct’s brand dropped in value to £1.16 billion. In contrast ASOS has staged a revival after a series of unfortunate events including a major warehouse fire. ASOS is benefitting from its international expansion and the exponential growth of ecommerce. The retailer’s brand rose by 29% over the past year to £710 million.
Three airlines made the UK 150 this year, led by British Airways with a brand value of £2.9 billion. However the longer term shift towards low cost airlines combined with weakened consumer spending power in long-haul locations is evident. British Airways and Virgin Atlantic are both down,
by 7% and 15% respectively. In contrast Easyjet is up by 60% to £1.34 billion. As consumer budgets for holidays remain tight and people look closer to home for their breaks, Easyjet’s brand could add further value, though even on short haul flights, the weakened pound threatens a reduction in foreign travel.
Lynx is Britain’s fastest growing brand, up 91% to £2.1 billion. Unilever decided to ditch the increasingly anachronistic ‘lynx effect’ campaign that was seen to be out of touch with the modern male. It has performed an almost complete reversal of its previous identity, with a series of new campaigns designed to portray a “radical and progressive view on masculinity”. Despite initial cynicism from marketing pundits, the approach appears to be paying off.
Brand Finance United Kingdom 150 April 2017 13.Brand Finance United Kingdom 150 April 2017 12.
Excecutive Summary
-4000.000000-2285.714286-571.4285711142.8571432857.1428574571.4285716285.714286
BT
Vodafone
Pall Mall
Pearson
EE
Thomas Cook
The Co-operative
Barclays
Babcock
Twinings
Compass Group
Dove
Lynx
ASDA
3MINI
EY
O2
BP
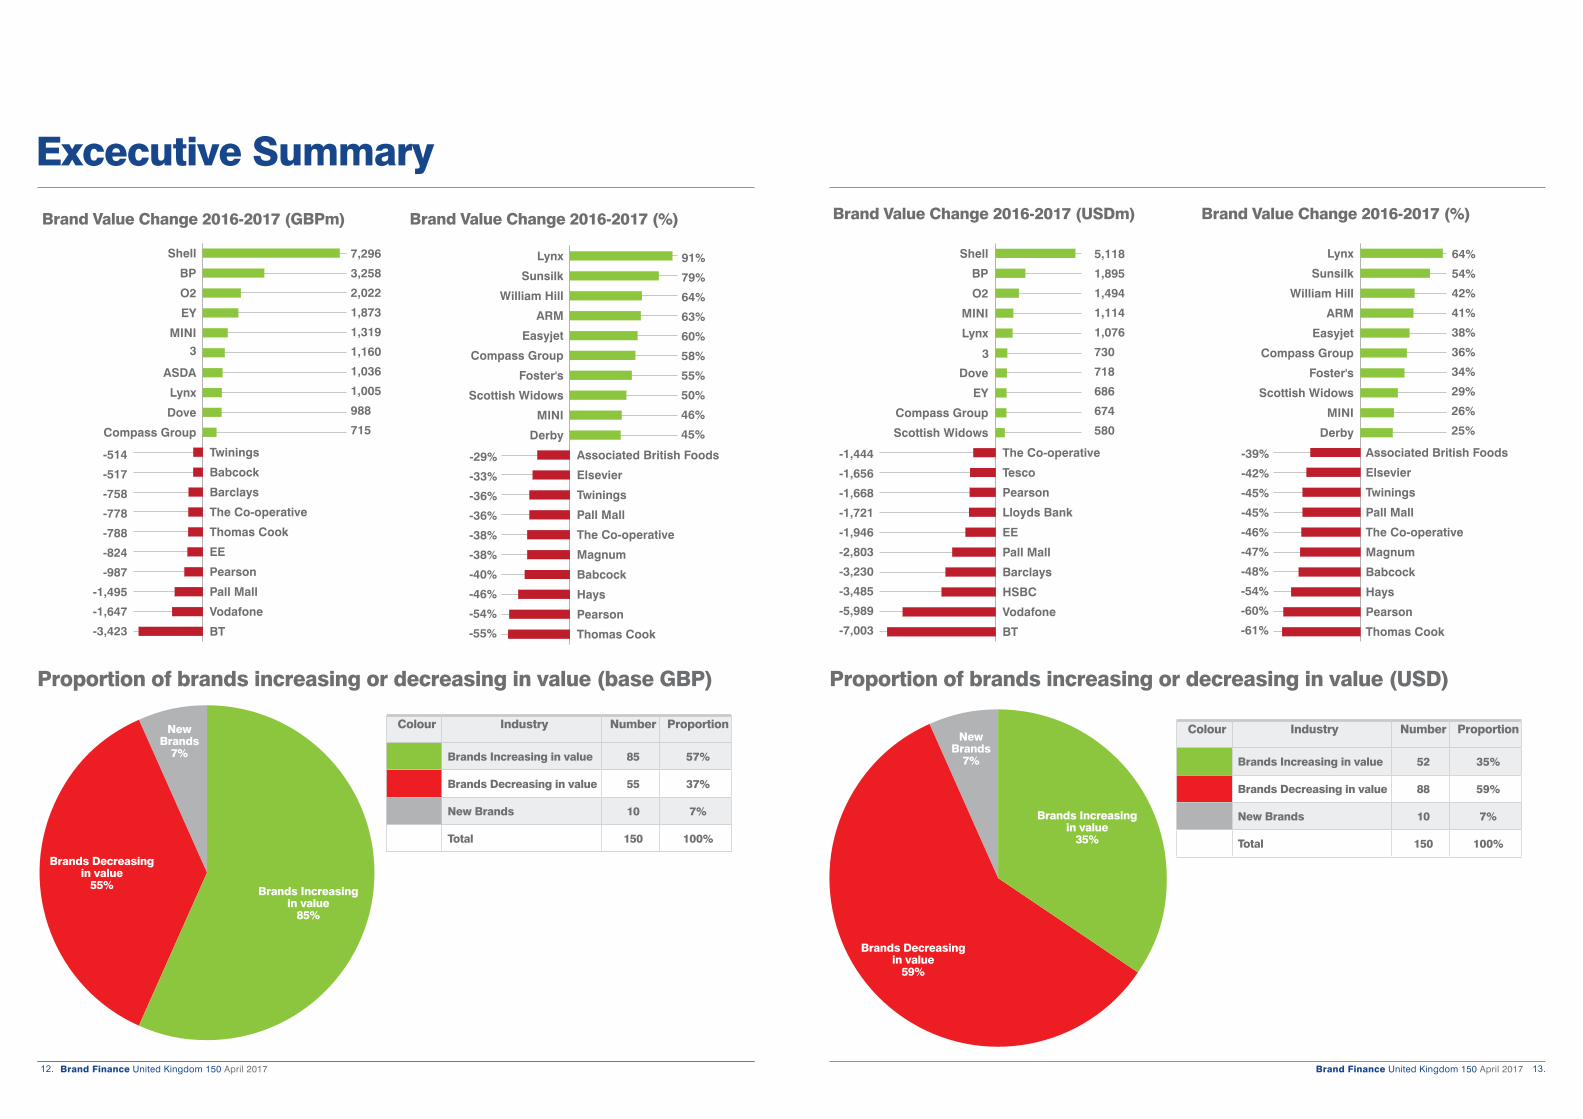
Shell 7,296
3,258
2,022
1,873
1,319
1,160
1,036
1,005
988
715
-70 -50 -30 -10 10 30 50 70 90 110 130
Thomas Cook
Pearson
Hays
Babcock
Magnum
The Co-operative
Pall Mall
Twinings
Elsevier
Associated British Foods
Derby
MINI
Scottish Widows
Foster's
Compass Group
Easyjet
ARM
William Hill
Sunsilk
Lynx
-514
-517
-758
-778
-788
-824
-987
-1,495
-1,647
-3,423
91%
79%
64%
63%
60%
58%
55%
50%
46%
45%
-29%
-33%
-36%
-36%
-38%
-38%
-40%
-46%
-54%
-55%
Brand Value Change 2016-2017 (GBPm) Brand Value Change 2016-2017 (%)
-4000.000000-2285.714286-571.4285711142.8571432857.1428574571.4285716285.714286
BT
Vodafone
Pall Mall
Pearson
EE
Thomas Cook
The Co-operative
Barclays
Babcock
Twinings
Compass Group
Dove
Lynx
ASDA
3MINI
EY
O2
BP
Shell 7,296
3,258
2,022
1,873
1,319
1,160
1,036
1,005
988
715
-70 -50 -30 -10 10 30 50 70 90 110 130
Thomas Cook
Pearson
Hays
Babcock
Magnum
The Co-operative
Pall Mall
Twinings
Elsevier
Associated British Foods
Derby
MINI
Scottish Widows
Foster's
Compass Group
Easyjet
ARM
William Hill
Sunsilk
Lynx
-514
-517
-758
-778
-788
-824
-987
-1,495
-1,647
-3,423
91%
79%
64%
63%
60%
58%
55%
50%
46%
45%
-29%
-33%
-36%
-36%
-38%
-38%
-40%
-46%
-54%
-55%
-8000.000000-5928.571429-3857.142857-1785.714286285.7142862357.1428574428.571429
BT
Vodafone
HSBC
Barclays
Pall Mall
EE
Lloyds Bank
Pearson
Tesco
The Co-operative
Scottish Widows
Compass Group
EY
Dove
3
Lynx
MINI
O2
BP
Shell 5,118
1,895
1,494
1,114
1,076
730
718
686
674
580
-75.0-57.5-40.0-22.5-5.012.530.047.565.082.5100.0
Thomas Cook
Pearson
Hays
Babcock
Magnum
The Co-operative
Pall Mall
Twinings
Elsevier
Associated British Foods
Derby
MINI
Scottish Widows
Foster's
Compass Group
Easyjet
ARM
William Hill
Sunsilk
Lynx
-1,444
-1,656
-1,668
-1,721
-1,946
-2,803
-3,230
-3,485
-5,989
-7,003
64%
54%
42%
41%
38%
36%
34%
29%
26%
25%
-39%
-42%
-45%
-45%
-46%
-47%
-48%
-54%
-60%
-61%
Brand Value Change 2016-2017 (USDm) Brand Value Change 2016-2017 (%)
-8000.000000-5928.571429-3857.142857-1785.714286285.7142862357.1428574428.571429
BT
Vodafone
HSBC
Barclays
Pall Mall
EE
Lloyds Bank
Pearson
Tesco
The Co-operative
Scottish Widows
Compass Group
EY
Dove
3
Lynx
MINI
O2
BP
Shell 5,118
1,895
1,494
1,114
1,076
730
718
686
674
580
-75.0-57.5-40.0-22.5-5.012.530.047.565.082.5100.0
Thomas Cook
Pearson
Hays
Babcock
Magnum
The Co-operative
Pall Mall
Twinings
Elsevier
Associated British Foods
Derby
MINI
Scottish Widows
Foster's
Compass Group
Easyjet
ARM
William Hill
Sunsilk
Lynx
-1,444
-1,656
-1,668
-1,721
-1,946
-2,803
-3,230
-3,485
-5,989
-7,003
64%
54%
42%
41%
38%
36%
34%
29%
26%
25%
-39%
-42%
-45%
-45%
-46%
-47%
-48%
-54%
-60%
-61%
Colour Industry Number Proportion
Brands Increasing in value 52 35%
Brands Decreasing in value 88 59%
New Brands 10 7%
Total 150 100%
Proportion of brands increasing or decreasing in value (USD)
Brands Increasing in value
35%
Brands Decreasing in value
59%
New Brands
7%
Colour Industry Number Proportion
Brands Increasing in value 85 57%
Brands Decreasing in value 55 37%
New Brands 10 7%
Total 150 100%
Proportion of brands increasing or decreasing in value (base GBP)
Brands Increasing in value
85%
Brands Decreasing in value
55%
New Brands
7%
Brand Finance United Kingdom 150 April 2017 15.Brand Finance United Kingdom 150 April 2017 14.
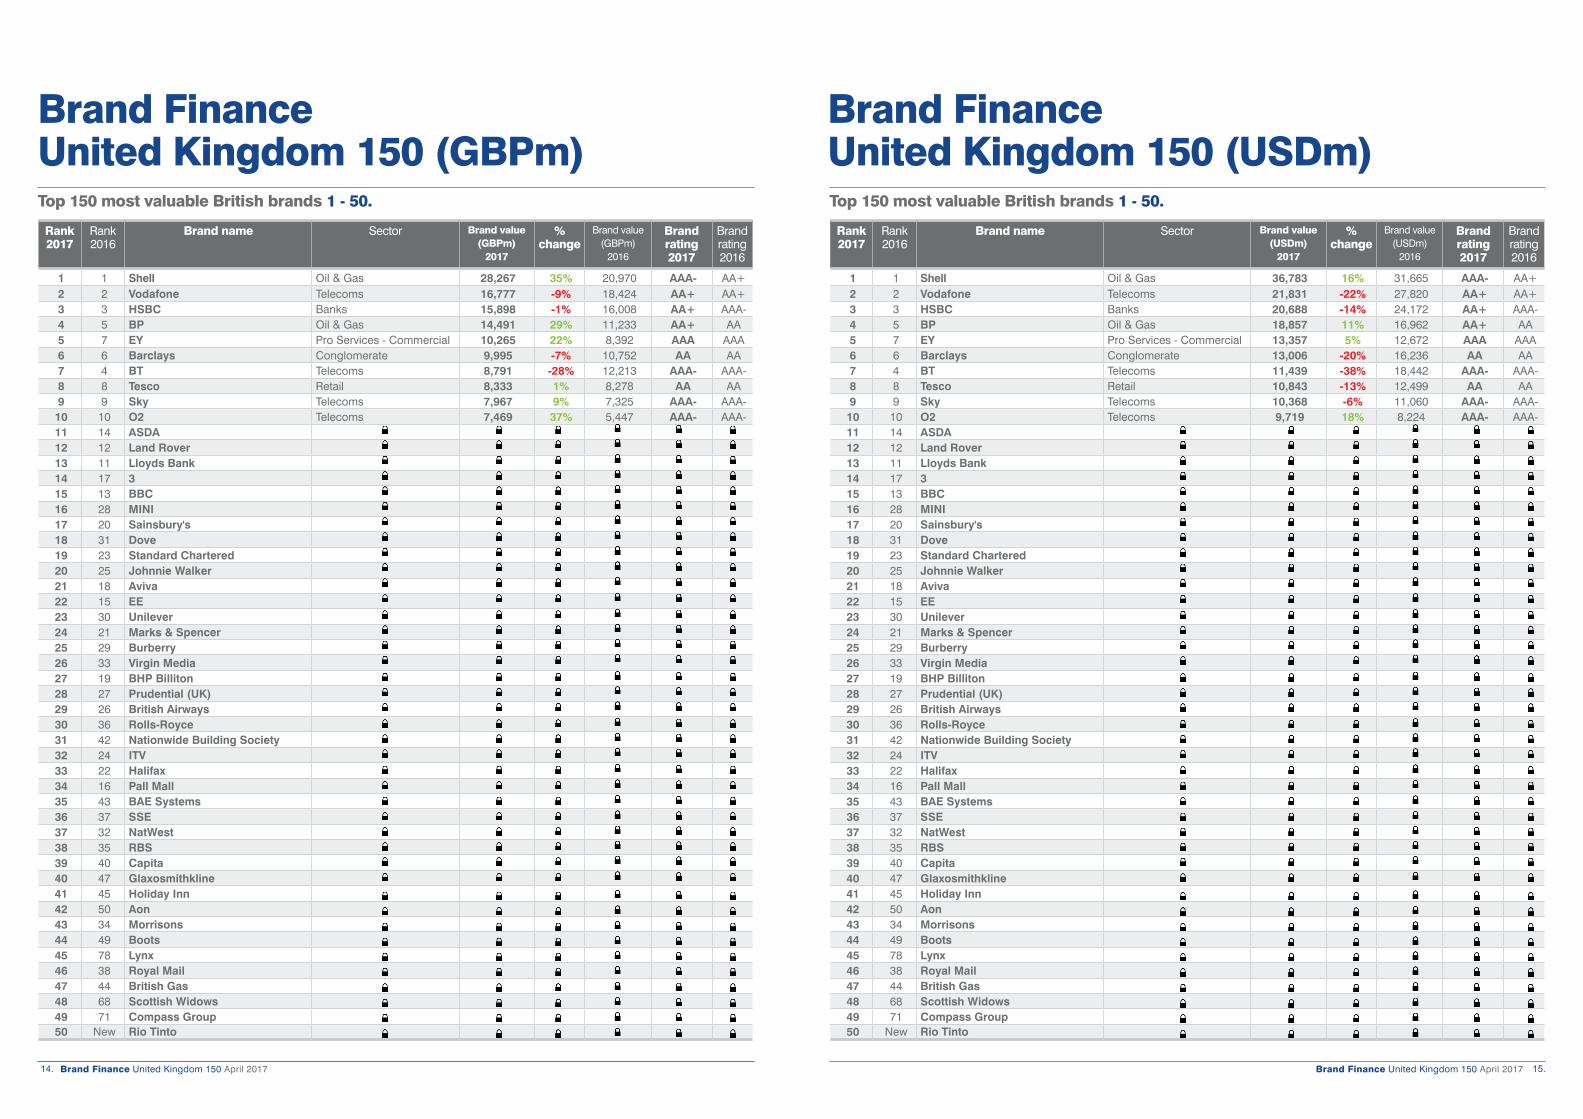
Brand Finance United Kingdom 150 (GBPm)Top 150 most valuable British brands 1 - 50.
Rank2017
Rank2016
Brand name Sector Brand value (GBPm)
2017
%change
Brand value (GBPm)
2016
Brand rating 2017
Brandrating2016
1 1 Shell Oil & Gas 28,267 35% 20,970 AAA- AA+2 2 Vodafone Telecoms 16,777 -9% 18,424 AA+ AA+3 3 HSBC Banks 15,898 -1% 16,008 AA+ AAA-4 5 BP Oil & Gas 14,491 29% 11,233 AA+ AA5 7 EY Pro Services - Commercial 10,265 22% 8,392 AAA AAA6 6 Barclays Conglomerate 9,995 -7% 10,752 AA AA7 4 BT Telecoms 8,791 -28% 12,213 AAA- AAA-8 8 Tesco Retail 8,333 1% 8,278 AA AA9 9 Sky Telecoms 7,967 9% 7,325 AAA- AAA-10 10 O2 Telecoms 7,469 37% 5,447 AAA- AAA-11 14 ASDA12 12 Land Rover13 11 Lloyds Bank14 17 315 13 BBC16 28 MINI17 20 Sainsbury's18 31 Dove19 23 Standard Chartered20 25 Johnnie Walker21 18 Aviva22 15 EE23 30 Unilever24 21 Marks & Spencer25 29 Burberry26 33 Virgin Media27 19 BHP Billiton28 27 Prudential (UK)29 26 British Airways30 36 Rolls-Royce31 42 Nationwide Building Society32 24 ITV33 22 Halifax34 16 Pall Mall35 43 BAE Systems36 37 SSE37 32 NatWest38 35 RBS39 40 Capita40 47 Glaxosmithkline41 45 Holiday Inn42 50 Aon43 34 Morrisons44 49 Boots45 78 Lynx46 38 Royal Mail47 44 British Gas48 68 Scottish Widows49 71 Compass Group50 New Rio Tinto
Brand Finance United Kingdom 150 (USDm)Top 150 most valuable British brands 1 - 50.
Rank2017
Rank2016
Brand name Sector Brand value (USDm)
2017
%change
Brand value (USDm)
2016
Brandrating2017
Brandrating2016
1 1 Shell Oil & Gas 36,783 16% 31,665 AAA- AA+2 2 Vodafone Telecoms 21,831 -22% 27,820 AA+ AA+3 3 HSBC Banks 20,688 -14% 24,172 AA+ AAA-4 5 BP Oil & Gas 18,857 11% 16,962 AA+ AA5 7 EY Pro Services - Commercial 13,357 5% 12,672 AAA AAA6 6 Barclays Conglomerate 13,006 -20% 16,236 AA AA7 4 BT Telecoms 11,439 -38% 18,442 AAA- AAA-8 8 Tesco Retail 10,843 -13% 12,499 AA AA9 9 Sky Telecoms 10,368 -6% 11,060 AAA- AAA-10 10 O2 Telecoms 9,719 18% 8,224 AAA- AAA-11 14 ASDA12 12 Land Rover13 11 Lloyds Bank14 17 315 13 BBC16 28 MINI17 20 Sainsbury's18 31 Dove19 23 Standard Chartered20 25 Johnnie Walker21 18 Aviva22 15 EE23 30 Unilever24 21 Marks & Spencer25 29 Burberry26 33 Virgin Media27 19 BHP Billiton28 27 Prudential (UK)29 26 British Airways30 36 Rolls-Royce31 42 Nationwide Building Society32 24 ITV33 22 Halifax34 16 Pall Mall35 43 BAE Systems36 37 SSE37 32 NatWest38 35 RBS39 40 Capita40 47 Glaxosmithkline41 45 Holiday Inn42 50 Aon43 34 Morrisons44 49 Boots45 78 Lynx46 38 Royal Mail47 44 British Gas48 68 Scottish Widows49 71 Compass Group50 New Rio Tinto
Brand Finance United Kingdom 150 April 2017 17.Brand Finance United Kingdom 150 April 2017 16.
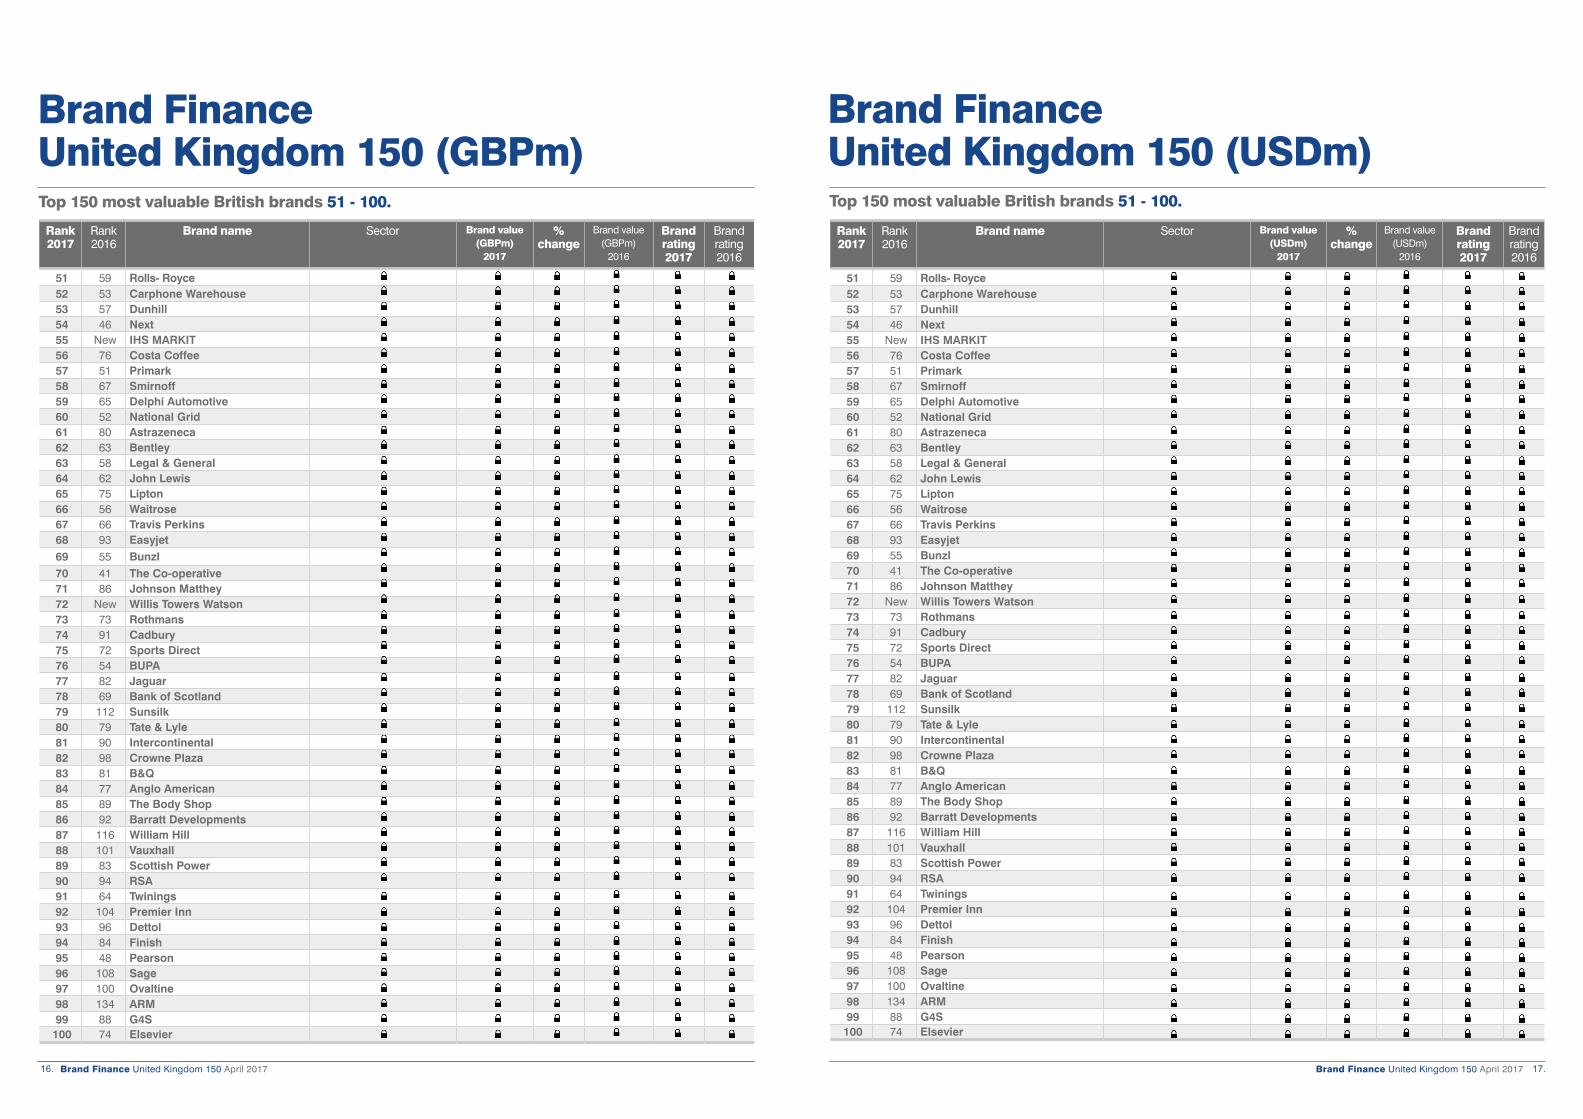
Brand Finance United Kingdom 150 (USDm)Top 150 most valuable British brands 51 - 100.
Rank2017
Rank2016
Brand name Sector Brand value (USDm)
2017
%change
Brand value (USDm)
2016
Brandrating2017
Brandrating2016
51 59 Rolls- Royce52 53 Carphone Warehouse53 57 Dunhill54 46 Next55 New IHS MARKIT56 76 Costa Coffee57 51 Primark58 67 Smirnoff59 65 Delphi Automotive60 52 National Grid61 80 Astrazeneca62 63 Bentley63 58 Legal & General64 62 John Lewis65 75 Lipton66 56 Waitrose67 66 Travis Perkins68 93 Easyjet69 55 Bunzl70 41 The Co-operative71 86 Johnson Matthey72 New Willis Towers Watson73 73 Rothmans74 91 Cadbury75 72 Sports Direct76 54 BUPA77 82 Jaguar78 69 Bank of Scotland79 112 Sunsilk80 79 Tate & Lyle81 90 Intercontinental82 98 Crowne Plaza83 81 B&Q84 77 Anglo American85 89 The Body Shop86 92 Barratt Developments87 116 William Hill88 101 Vauxhall89 83 Scottish Power90 94 RSA91 64 Twinings92 104 Premier Inn93 96 Dettol94 84 Finish95 48 Pearson96 108 Sage97 100 Ovaltine98 134 ARM99 88 G4S100 74 Elsevier
Top 150 most valuable British brands 51 - 100.
Rank2017
Rank2016
Brand name Sector Brand value (GBPm)
2017
%change
Brand value (GBPm)
2016
Brandrating2017
Brandrating2016
51 59 Rolls- Royce52 53 Carphone Warehouse53 57 Dunhill54 46 Next55 New IHS MARKIT56 76 Costa Coffee57 51 Primark58 67 Smirnoff59 65 Delphi Automotive60 52 National Grid61 80 Astrazeneca62 63 Bentley63 58 Legal & General64 62 John Lewis65 75 Lipton66 56 Waitrose67 66 Travis Perkins68 93 Easyjet69 55 Bunzl70 41 The Co-operative71 86 Johnson Matthey72 New Willis Towers Watson73 73 Rothmans74 91 Cadbury75 72 Sports Direct76 54 BUPA77 82 Jaguar78 69 Bank of Scotland79 112 Sunsilk80 79 Tate & Lyle81 90 Intercontinental82 98 Crowne Plaza83 81 B&Q84 77 Anglo American85 89 The Body Shop86 92 Barratt Developments87 116 William Hill88 101 Vauxhall89 83 Scottish Power90 94 RSA91 64 Twinings92 104 Premier Inn93 96 Dettol94 84 Finish95 48 Pearson96 108 Sage97 100 Ovaltine98 134 ARM99 88 G4S100 74 Elsevier
Brand Finance United Kingdom 150 (GBPm)
Brand Finance United Kingdom 150 April 2017 19.Brand Finance United Kingdom 150 April 2017 18.
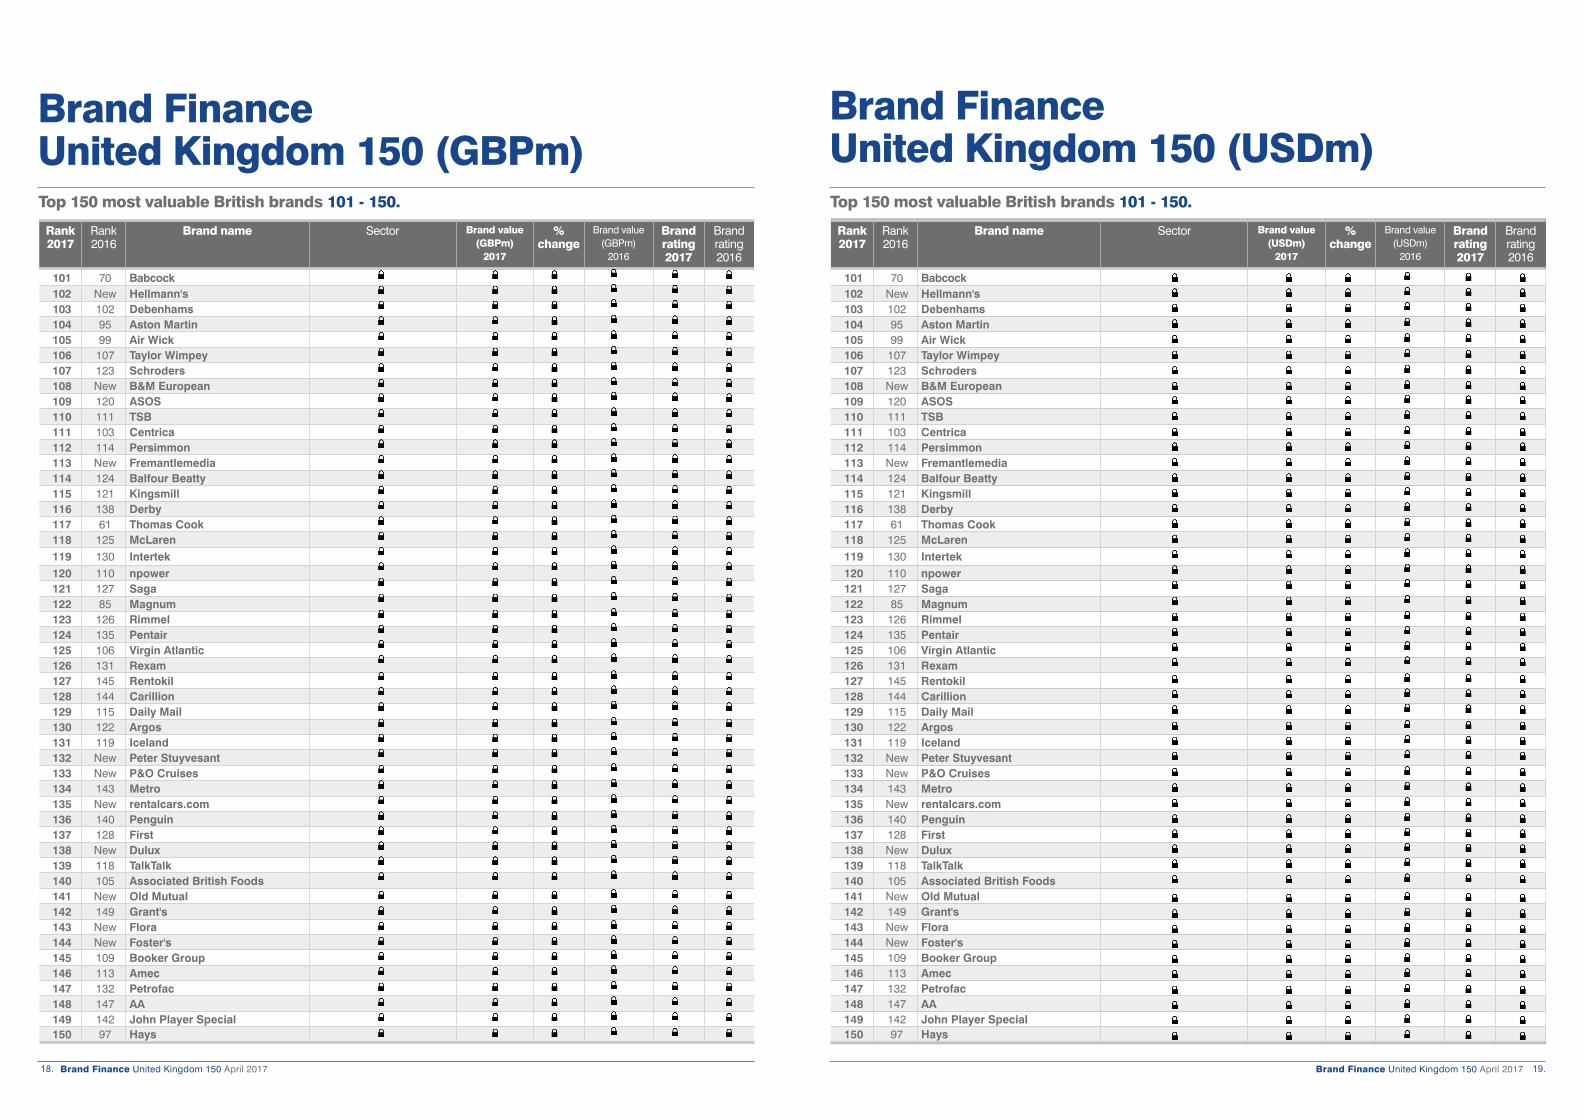
Top 150 most valuable British brands 101 - 150.
Rank2017
Rank2016
Brand name Sector Brand value (USDm)
2017
%change
Brand value (USDm)
2016
Brandrating2017
Brandrating2016
101 70 Babcock102 New Hellmann's103 102 Debenhams104 95 Aston Martin105 99 Air Wick106 107 Taylor Wimpey107 123 Schroders108 New B&M European109 120 ASOS110 111 TSB111 103 Centrica112 114 Persimmon113 New Fremantlemedia114 124 Balfour Beatty115 121 Kingsmill116 138 Derby117 61 Thomas Cook118 125 McLaren119 130 Intertek120 110 npower121 127 Saga122 85 Magnum123 126 Rimmel124 135 Pentair125 106 Virgin Atlantic126 131 Rexam127 145 Rentokil128 144 Carillion129 115 Daily Mail130 122 Argos131 119 Iceland132 New Peter Stuyvesant133 New P&O Cruises134 143 Metro135 New rentalcars.com136 140 Penguin137 128 First138 New Dulux139 118 TalkTalk140 105 Associated British Foods141 New Old Mutual142 149 Grant's143 New Flora144 New Foster's145 109 Booker Group146 113 Amec147 132 Petrofac148 147 AA149 142 John Player Special150 97 Hays
Brand Finance United Kingdom 150 (USDm)
Top 150 most valuable British brands 101 - 150.
Rank2017
Rank2016
Brand name Sector Brand value (GBPm)
2017
%change
Brand value (GBPm)
2016
Brandrating2017
Brandrating2016
101 70 Babcock102 New Hellmann's103 102 Debenhams104 95 Aston Martin105 99 Air Wick106 107 Taylor Wimpey107 123 Schroders108 New B&M European109 120 ASOS110 111 TSB111 103 Centrica112 114 Persimmon113 New Fremantlemedia114 124 Balfour Beatty115 121 Kingsmill116 138 Derby117 61 Thomas Cook118 125 McLaren119 130 Intertek120 110 npower121 127 Saga122 85 Magnum123 126 Rimmel124 135 Pentair125 106 Virgin Atlantic126 131 Rexam127 145 Rentokil128 144 Carillion129 115 Daily Mail130 122 Argos131 119 Iceland132 New Peter Stuyvesant133 New P&O Cruises134 143 Metro135 New rentalcars.com136 140 Penguin137 128 First138 New Dulux139 118 TalkTalk140 105 Associated British Foods141 New Old Mutual142 149 Grant's143 New Flora144 New Foster's145 109 Booker Group146 113 Amec147 132 Petrofac148 147 AA149 142 John Player Special150 97 Hays
Brand Finance United Kingdom 150 (GBPm)
Brand Finance United Kingdom 150 April 2017 21.Brand Finance United Kingdom 150 April 2017 20.
Understand Your Brand’s Value
$707
$6,265
$3,031 $2,328 $1,913
213 275
320
607
729
650
0
100
200
300
400
500
600
700
800
2011 2012 2013 2014 2015 2016
58%
37%
4%
Nutrition
Performance Materials
Other Activities
Brand Value Dashboard
$707m AA+78/100
$10,216m
Peer Group Comparison (USDm)Historic brand value performance
Brand Value by Product Segment
7%
Brand Value
€650mEnterprise Value
€9,399m(EUR) (EUR)
(EURm)
$882mBrand Value
€729m(EUR)[XXX]
[XXX]
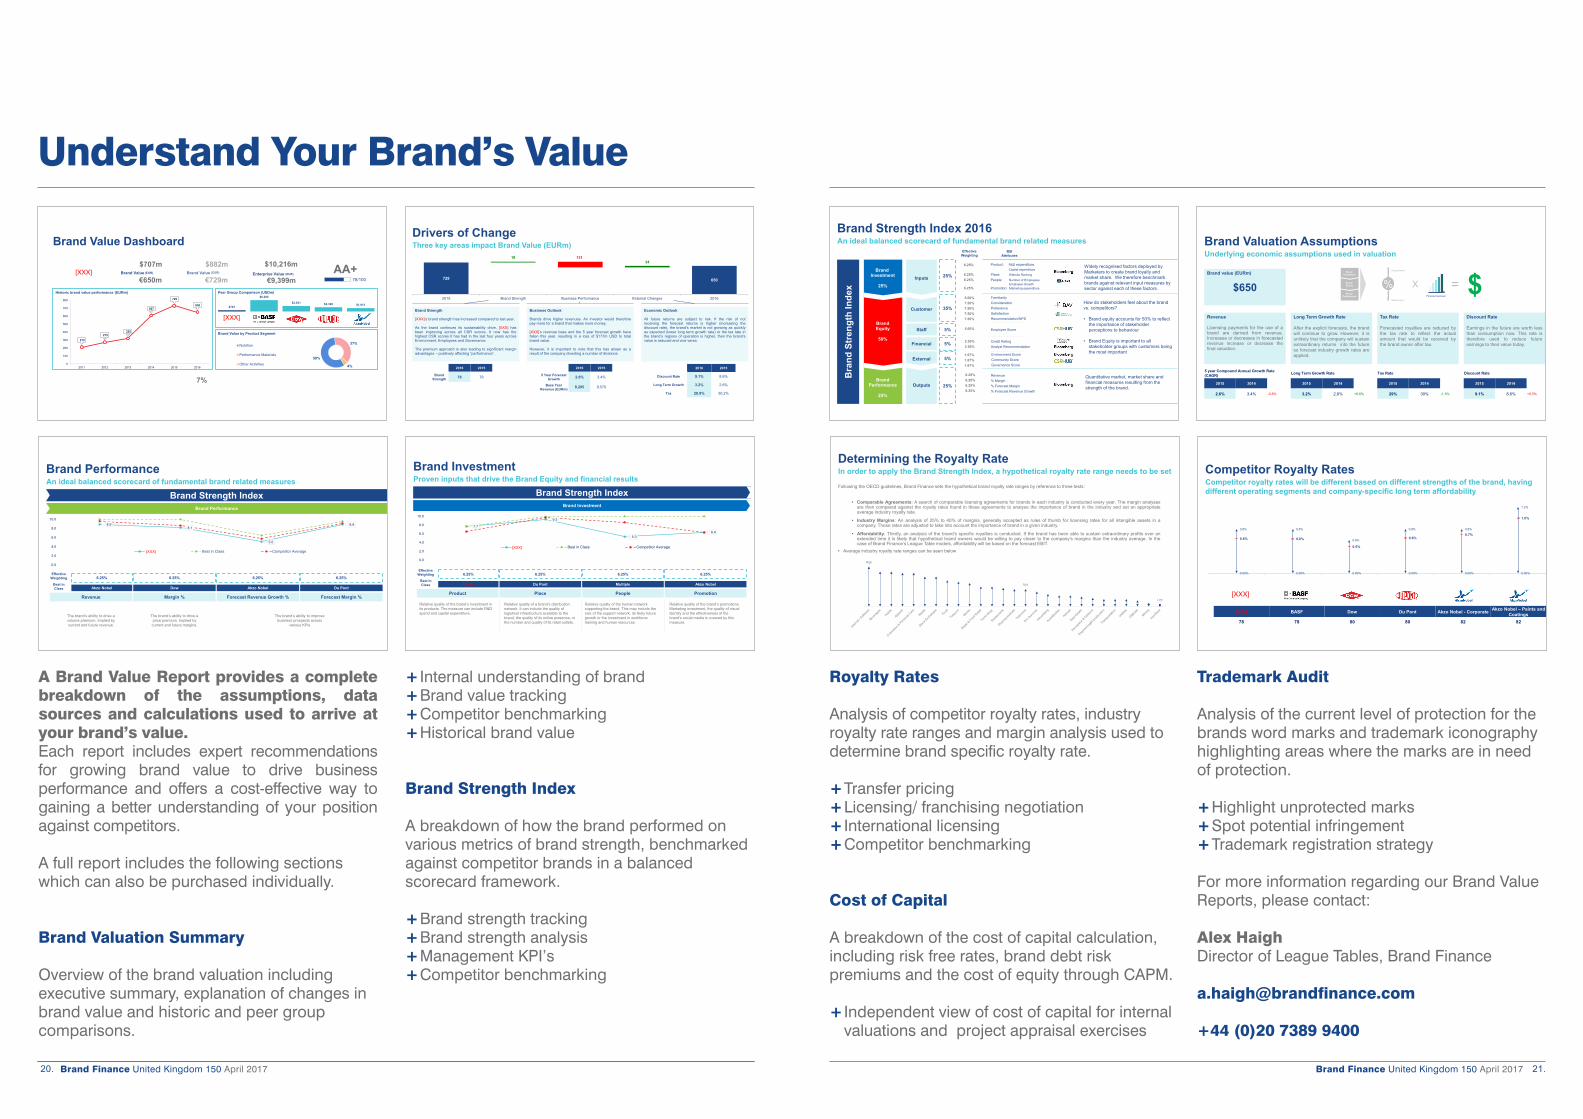
A Brand Value Report provides a complete breakdown of the assumptions, data sources and calculations used to arrive at your brand’s value. Each report includes expert recommendations for growing brand value to drive business performance and offers a cost-effective way to gaining a better understanding of your position against competitors.
A full report includes the following sections which can also be purchased individually.
Brand Valuation Summary Overview of the brand valuation including executive summary, explanation of changes in brand value and historic and peer group comparisons.
+ Internal understanding of brand+ Brand value tracking+ Competitor benchmarking+ Historical brand value
Brand Strength Index
A breakdown of how the brand performed on various metrics of brand strength, benchmarked against competitor brands in a balanced scorecard framework.
+ Brand strength tracking+ Brand strength analysis+ Management KPI’s+ Competitor benchmarking
Brand PerformanceAn ideal balanced scorecard of fundamental brand related measures
Brand Performance
Brand Strength Index
The brand’s ability to drive a volume premium. Implied by current and future revenue.
The brand’s ability to drive a price premium. Implied by current and future margins.
The brand’s ability to improve business prospects across
various KPIs
Revenue Margin % Forecast Revenue Growth % Forecast Margin %
6.25% 6.25% 6.25%
Dow Akzo Nobel Du Pont
Effective Weighting
Best in Class
6.25%
Akzo Nobel
8.98.1
5.0
8.9
0.0
2.0
4.0
6.0
8.0
10.0
DSM Best in Class Competitor Average[XXX]
Drivers of ChangeThree key areas impact Brand Value (EURm)
Brand Strength
[XXX]’s brand strength has increased compared to last year.
As the brand continues its sustainability drive, [XXX] hasbeen improving across all CSR scores. It now has thehighest CSR scores it has had in the last four years acrossEnvironment, Employees and Governance.
The premium approach is also leading to significant marginadvantages – positively affecting “performance”.
Business Outlook
Brands drive higher revenues. An investor would thereforepay more for a brand that makes more money.
[XXX]’s revenue base and the 5 year forecast growth havefallen this year, resulting in a loss of $177m USD to totalbrand value.
However, it is important to note that this has arisen as aresult of the company divesting a number of divisions.
Economic Outlook
All future returns are subject to risk. If the risk of notreceiving the forecast returns is higher (increasing thediscount rate), the brand’s market is not growing as quicklyas expected (lower long term growth rate) or the tax rate inthe brand’s regions of operation is higher, then the brand’svalue is reduced and vice versa.
2016 2015
Discount Rate 9.1% 8.6%
Long Term Growth 3.2% 2.6%
Tax 28.9% 30.2%
2016 2015
5 Year Forecast Growth 2.6% 3.4%
Base Year Revenue (EURm) 8,205 9,570
2016 2015
BrandStrength 78 76
729 729 616 616 650
18 13134
2015 Brand Strength Business Performance External Changes 2016
Brand InvestmentProven inputs that drive the Brand Equity and financial results
Relative quality of the brand’s investment in its products. The measure can include R&D spend and capital expenditure.
Relative quality of a brand’s distribution network. It can include the quality of logistical infrastructure available to the brand, the quality of its online presence, or the number and quality of its retail outlets.
Relative quality of the human network supporting the brand. This may include the size of the support network, its likely future growth or the investment in workforce training and human resources.
Relative quality of the brand’s promotions. Marketing investment, the quality of visual identity and the effectiveness of the brand’s social media is covered by this measure.
Product Place People Promotion
Brand Investment
Brand Strength Index
6.25% 6.25% 6.25%
Du Pont Multiple Akzo Nobel
Effective Weighting
Best in Class
6.25%
[XXX]
7.7
9.3
5.36.4
0.0
2.0
4.0
6.0
8.0
10.0
DSM Best in Class Competitor Average[XXX]
Royalty Rates
Analysis of competitor royalty rates, industry royalty rate ranges and margin analysis used to determine brand specific royalty rate.
+ Transfer pricing+ Licensing/ franchising negotiation+ International licensing+ Competitor benchmarking
Cost of Capital
A breakdown of the cost of capital calculation, including risk free rates, brand debt risk premiums and the cost of equity through CAPM.
+ Independent view of cost of capital for internal valuations and project appraisal exercises
Trademark Audit
Analysis of the current level of protection for the brands word marks and trademark iconography highlighting areas where the marks are in need of protection.
+ Highlight unprotected marks + Spot potential infringement+ Trademark registration strategy
For more information regarding our Brand Value Reports, please contact:
Alex HaighDirector of League Tables, Brand Finance
+44 (0)20 7389 9400
Brand Strength Index 2016An ideal balanced scorecard of fundamental brand related measures
Widely recognised factors deployed by Marketers to create brand loyalty and market share. We therefore benchmark brands against relevant input measures by sector against each of these factors.
How do stakeholders feel about the brand vs. competitors?
• Brand equity accounts for 50% to reflect the importance of stakeholder perceptions to behaviour
• Brand Equity is important to all stakeholder groups with customers being the most important
Quantitative market, market share and financial measures resulting from the strength of the brand.
BSI Attributes
Product: R&D expenditure,Capital expenditure
Place: Website Ranking
People: Number of Employees,Employee Growth
Promotion: Marketing expenditure
FamiliarityConsiderationPreferenceSatisfactionRecommendation/NPS
Employee Score
Credit RatingAnalyst Recommendation
Environment ScoreCommunity ScoreGovernance Score
Revenue% Margin% Forecast Margin% Forecast Revenue Growth
Bra
nd S
tren
gth
Inde
x
35%
25%
5%
5%
5%
Effective Weighting
25%Brand
Investment
25%
BrandEquity
50%
BrandPerformance
25%
Customer
Outputs
Inputs
Staff
Financial
External
6.25%
6.25%6.25%
6.25%
5.00%7.50%7.50%7.50%7.50%
5.00%
2.50%2.50%
1.67%1.67%1.67%
6.25% 6.25% 6.25% 6.25%
Determining the Royalty RateIn order to apply the Brand Strength Index, a hypothetical royalty rate range needs to be set
Following the OECD guidelines, Brand Finance sets the hypothetical brand royalty rate ranges by reference to three tests:
• Comparable Agreements: A search of comparable licensing agreements for brands in each industry is conducted every year. The margin analysesare then compared against the royalty rates found in these agreements to analyse the importance of brand in the industry and set an appropriateaverage industry royalty rate.
• Industry Margins: An analysis of 25% to 40% of margins, generally accepted as rules of thumb for licensing rates for all intangible assets in acompany. These rates are adjusted to take into account the importance of brand in a given industry.
• Affordability: Thirdly, an analysis of the brand’s specific royalties is conducted. If the brand has been able to sustain extraordinary profits over anextended time it is likely that hypothetical brand owners would be willing to pay closer to the company’s margins than the industry average. In thecase of Brand Finance’s League Table models, affordability will be based on the forecast EBIT.
• Average industry royalty rate ranges can be seen below
High
Mid
Low
Brand Valuation AssumptionsUnderlying economic assumptions used in valuation
Brand value (EURm)
$650
Discount Rate
Earnings in the future are worth lessthan consumption now. This rate istherefore used to reduce futureearnings to their value today.
Long Term Growth Rate
After the explicit forecasts, the brandwill continue to grow. However, it isunlikely that the company will sustainextraordinary returns into the futureso forecast industry growth rates areapplied.
Revenue
Licensing payments for the use of abrand are derived from revenue.Increases or decreases in forecastedrevenue increase or decrease thefinal valuation.
Tax Rate
Forecasted royalties are reduced bythe tax rate to reflect the actualamount that would be received bythe brand owner after tax.
5 year Compound Annual Growth Rate (CAGR)
2015 2014
2.6% 3.4% -0.8%
Discount Rate
2015 2014
9.1% 8.6% +0.5%
Long Term Growth Rate
2015 2014
3.2% 2.6% +0.6%
Tax Rate
2015 2014
29% 30% -1.3%
Brand Investment
Brand Equity
Brand Performance
X = $Forecast revenues
%Strong brand
Weak brand
0.00% 0.00% 0.00% 0.00% 0.00% 0.00%
0.8% 0.8%
0.6%
0.8% 0.8%
1.2%
0.6% 0.6%
0.5%
0.6%0.7%
1.0%
DSM BASF Dow Du Pont Akzo Nobel Akzo Nobel
Competitor Royalty RatesCompetitor royalty rates will be different based on different strengths of the brand, having different operating segments and company-specific long term affordability
[XXX] BASF Dow Du Pont Akzo Nobel - Corporate Akzo Nobel – Paints and Coatings
78 78 80 80 82 82
[XXX]
Brand Finance United Kingdom 150 April 2017 23.Brand Finance United Kingdom 150 April 2017 22.
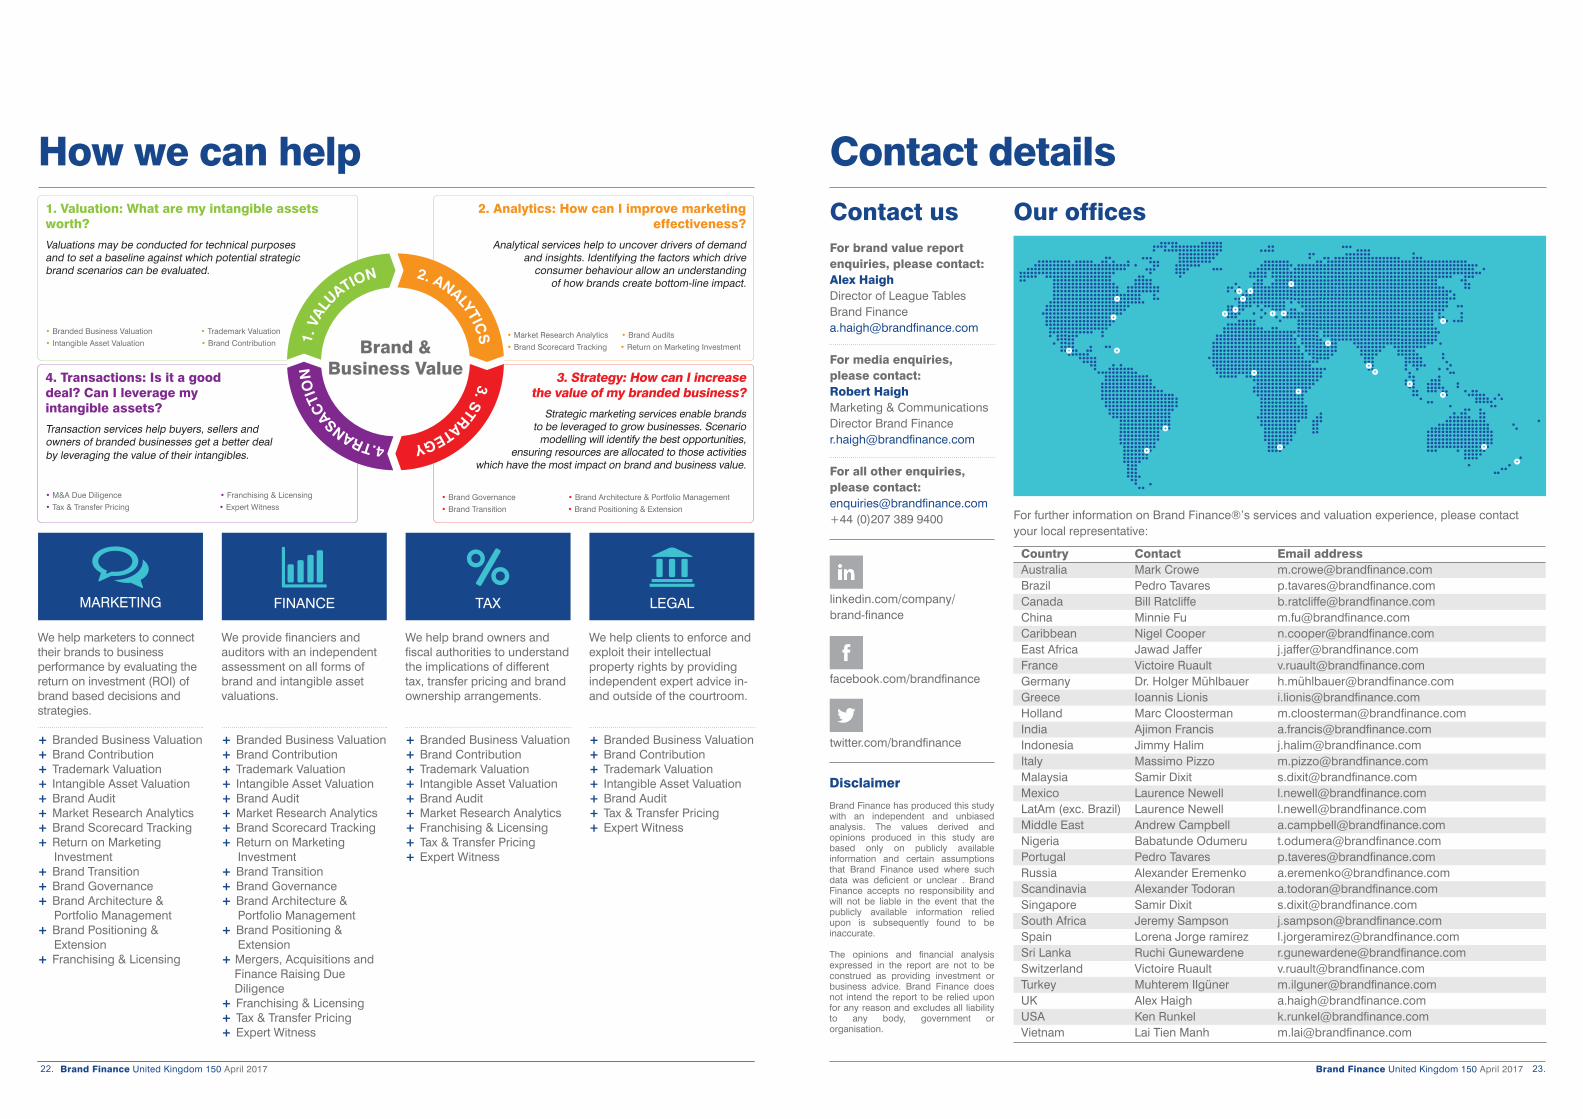
How we can help
MARKETING FINANCE TAX LEGAL
Contact usFor brand value report enquiries, please contact:Alex HaighDirector of League Tables Brand Finance [email protected]
For media enquiries, please contact:Robert HaighMarketing & Communications Director Brand Finance [email protected]
For all other enquiries, please contact:[email protected]+44 (0)207 389 9400
linkedin.com/company/brand-finance
facebook.com/brandfinance
twitter.com/brandfinance
For further information on Brand Finance®’s services and valuation experience, please contact your local representative:
Country Contact Email addressAustralia Mark Crowe [email protected] Pedro Tavares [email protected] Bill Ratcliffe [email protected] Minnie Fu [email protected] Nigel Cooper [email protected] Africa Jawad Jaffer [email protected] Victoire Ruault [email protected] Dr. Holger Mühlbauer h.mü[email protected] Ioannis Lionis [email protected] Marc Cloosterman [email protected] Ajimon Francis [email protected] Jimmy Halim [email protected] Massimo Pizzo [email protected] Samir Dixit [email protected] Laurence Newell [email protected] (exc. Brazil) Laurence Newell [email protected] East Andrew Campbell [email protected] Babatunde Odumeru [email protected] Pedro Tavares [email protected] Alexander Eremenko [email protected] Alexander Todoran [email protected] Samir Dixit [email protected] Africa Jeremy Sampson [email protected] Lorena Jorge ramirez [email protected] Lanka Ruchi Gunewardene [email protected] Victoire Ruault [email protected] Muhterem Ilgüner [email protected] Alex Haigh [email protected] Ken Runkel [email protected] Lai Tien Manh [email protected]
Contact detailsOur offices
Disclaimer
Brand Finance has produced this study with an independent and unbiased analysis. The values derived and opinions produced in this study are based only on publicly available information and certain assumptions that Brand Finance used where such data was deficient or unclear . Brand Finance accepts no responsibility and will not be liable in the event that the publicly available information relied upon is subsequently found to be inaccurate.
The opinions and financial analysis expressed in the report are not to be construed as providing investment or business advice. Brand Finance does not intend the report to be relied upon for any reason and excludes all liability to any body, government or organisation.
We help marketers to connect their brands to business performance by evaluating the return on investment (ROI) of brand based decisions and strategies.
+ Branded Business Valuation+ Brand Contribution+ Trademark Valuation+ Intangible Asset Valuation+ Brand Audit+ Market Research Analytics+ Brand Scorecard Tracking+ Return on Marketing Investment+ Brand Transition+ Brand Governance+ Brand Architecture & Portfolio Management+ Brand Positioning & Extension+ Franchising & Licensing
We provide financiers and auditors with an independent assessment on all forms of brand and intangible asset valuations.
+ Branded Business Valuation+ Brand Contribution+ Trademark Valuation+ Intangible Asset Valuation+ Brand Audit+ Market Research Analytics+ Brand Scorecard Tracking+ Return on Marketing Investment+ Brand Transition+ Brand Governance+ Brand Architecture & Portfolio Management+ Brand Positioning & Extension+ Mergers, Acquisitions and Finance Raising Due Diligence+ Franchising & Licensing+ Tax & Transfer Pricing+ Expert Witness
We help brand owners and fiscal authorities to understand the implications of different tax, transfer pricing and brand ownership arrangements.
+ Branded Business Valuation+ Brand Contribution+ Trademark Valuation+ Intangible Asset Valuation+ Brand Audit+ Market Research Analytics+ Franchising & Licensing+ Tax & Transfer Pricing+ Expert Witness
We help clients to enforce and exploit their intellectual property rights by providing independent expert advice in- and outside of the courtroom.
+ Branded Business Valuation+ Brand Contribution+ Trademark Valuation+ Intangible Asset Valuation+ Brand Audit+ Tax & Transfer Pricing+ Expert Witness
2. Analytics: How can I improve marketing effectiveness?
Analytical services help to uncover drivers of demand and insights. Identifying the factors which drive
consumer behaviour allow an understanding of how brands create bottom-line impact.
• Market Research Analytics • Brand Audits
• Brand Scorecard Tracking • Return on Marketing Investment
3. Strategy: How can I increase the value of my branded business?
Strategic marketing services enable brands to be leveraged to grow businesses. Scenario
modelling will identify the best opportunities, ensuring resources are allocated to those activities
which have the most impact on brand and business value.
• Brand Governance • Brand Architecture & Portfolio Management
• Brand Transition • Brand Positioning & Extension
4. Transactions: Is it a good deal? Can I leverage my intangible assets?
Transaction services help buyers, sellers and owners of branded businesses get a better deal by leveraging the value of their intangibles.
• M&A Due Diligence • Franchising & Licensing
• Tax & Transfer Pricing • Expert Witness
1. Valuation: What are my intangible assets worth?
Valuations may be conducted for technical purposes and to set a baseline against which potential strategic brand scenarios can be evaluated.
• Branded Business Valuation • Trademark Valuation
• Intangible Asset Valuation • Brand Contribution
2. ANALYTICS
3. STRATEGY 4.TRANSACTI
ON
1. V
ALUATION
Brand & Business Value
Contact us.
The World’s Leading Independent Branded Business Valuation and Strategy ConsultancyT: +44 (0) 20 7389 9400E: [email protected] www.brandfinance.com
Bridging the gap between marketing and finance