Embed Size (px)
Citation preview

UNITE Group analyst session
Tuesday 28 June

Agenda
1. Strategy and positioning
2. The UNITE brand
3. Valuation
4. Balance sheet/modelling
5. Q&As

Strategy
4
Effectively aligned to market dynamics
- Investment focused in strongest student locations, particularly London
- Financial capacity and in-house expertise to undertake attractive
developments
- Half of London development pipeline positioned at value end of spectrum
Intent to grow NPC and NAV sustainably over time
- Portfolio well positioned for continued rental growth
- Numerous accretive asset management opportunities over time
- Selective development activity accretive to future NAV and earnings
Will hold greater proportion of portfolio in future
- Supports growth in NPC
- Increases London weighting to c.50%
- Congruent with USAF objectives
Visibility of NPC growth supports reinstatement of dividend in 2011

Strategy
Development Capital growth Income
Focus on London and other high-growth markets
Target low double-digit total returns,
with modest risk

Development strategy post 2009 placing
• c. 4,000 bed pipeline in London
• mix of product, price points and location
• clusters (central) and more affordable product (well-located
zone 2/3 sites near transport hubs)
• Target 9% yield on cost
Development
Rental comparables Per Week
£
Moonraker Great Suffolk Street 215 OCB
Waterloo Road Great Suffolk Street 215 OCB
Hale Village 2 Emily Bowes Court 155 USAF
Glasgow Gibson Street 141 USAF
Site A Beaumont Court 195 UCC
Site B Poland House 145 Wholly owned
Beds
Development cost
Forecast Yield on
Cluster Rent
(2010/11)
%
Clusters Stabilised
NAV to
go
Land Build Other TDC NOI cost per week value Dec-10
£m £m £m £m £m % £ £m £m
Secured with planning
Moonraker Alley, London SE1 671 32 34 9 77 7.0 9.5% 210 81% 106 23
268 Waterloo Rd, London SE1 146 5 8 3 16 1.4 9.0% 207 94% 20 4
Hale Village Phase 2, London N17 524 6 23 3 32 2.9 9.6% 146 100% 44 9
Secured subject to planning
Site A, London 550 24 27 7 58 5.0 8.6% 195 93% 73 15
Site B, London 902 12 42 8 62 5.6 9.0% 139 94% 82 12
Total 2012-14 Pipeline 2,793 78 134 30 245 21.9 8.9% 325 63
Per bed £k 28 48 11 88 8 116
Development
London – progressing in line with plan2012-14 pipeline

• Selective activity to date, where warranted by returns
• Total Capex committed outside London = £92m currently,
falling to £26m next year (10% of total)
• Delivering three schemes for 2011/12 academic year –
Glasgow, Manchester and Reading – all on track
• One further project in Glasgow opening 2012/13
Development
Regions

• 1,200 beds to secure in London by end 2011 (PC 2013 & 2014)
• Development opportunities remain for foreseeable future
• c. £100m pa to be invested
• Funded through disposals of mature assets and recurring
cashflows over time
• £100-150m disposals targeted by end 2012
• Likely balance 60/40 London/regions
• Selective opportunities in regions:
• High-growth markets
• Affordable price points
Development
Future strategy

Capital growth
Overview
• Market fundamentals underpin robust rental growth outlook
• UNITE positioned to outperform broader student
accommodation market:
• London focus
• High quality locations due to first mover advantage
• Asset management opportunities
• Brand platform

Capital growth
Demand still exceeds supply
• Student numbers doubled
since early 1990s
• Significant excess demand
for university places –
c. 160,000 in 2011
• Historic growth in
accommodation supply has
not kept pace
• Ratio of 1st year and
international students to
purpose-built beds:
• Regions: 1.5:1
• London: 2.8:1
Source: HESA 2008/09; King Sturge Research 2010
UK Full-time students
Source: King Sturge
September 2005
/000s
September 2009
/000s
University PBSA 312 314
Corporate PBSA 91 149
Total PBSA 403 463
Historic supply growth
Student number growth

0%
10%
20%
30%
40%
50%
Russell Group 1994 Group Million+ Guild HE Uni Alliance Unassigned / AOC
% TOTAL UNITE % FT STUDENTS (HESA 0910)
21.0
14.2
27.3
11.8
25.7
8.1 9.5
24.4
11.6
46.5
8.5 10.7
28.7
7.2
44.9
Hard Pressed Moderate Means Comfortably Off Urban Prosperity Wealthy Achievers
UK Average 2010 UNITE AY1011 - London UNITE AY1011 - excl London
Demand outlook
• Student number outlook broadly flat from
2013 – in-built growth for next two years
• University winners and losers
• London growth c. 2.8% pa in medium
term
• UNITE resilient customer base
• UK customer base affluent
• 46% of customers non-UK; 70% in
London
• Only 5% of portfolio revenue in “at risk”
category
• Immigration policy limited impact on
UNITE
• Focus on non-degree study
• Of UNITE‟s 40,000 customers, less
that 400 are considered „at risk‟.
UNITE UK customer base % of total
UNITE customer base by University grouping
Source: Education at a Glance, OECD, Paris (2010)
Capital growth
International student mobility

Supply outlook
• New supply in regions limited for next few years. Development focus in London
• Significant constraints to new accommodation supply persist:
• Debt funding constraints (max. 70-75% LTC with preference for University agreements)
• Planning policy tougher – affordable housing requirements in most London boroughs
• Identifiable pipeline of London supply totals c. 20,000 bed spaces:
• Review of scheme viability suggests new supply of c. 14,000 bed spaces by 2015
• UNITE share of new pipeline 20-25%
Capital growth
Beds UNITE Other Total
Under construction 1,493 5,915 7,408
Planning consent - 6,608 6,608
Planning application 1,510 4,921 6,431
TOTAL 3,003 17,444 20,447
Adjustment for unviable schemes - (6,523) (6,523)
UNITE forecast 3,003 10,921 13,924

London focus
Capital growth

Total beds (including
under construction)
Operators > 1,000
beds
Existing
beds
No.
schemes
No of
Beds
Total PBSA
market
share %
UNITE Group 6,508 4 1,493 8,001 23.2
IQ 876 4 1,804 2,680 7.8
OPAL 2,562 0 0 2,562 7.4
Nido 2,249 1 272 2,249 6.5
Berkeley First 0 4 1,945 1,945 5.6
Shaftesbury Housing 1,907 0 0 1,907 5.5
Urbanest 220 2 822 1,042 3.0
Liberty Living 1,014 0 0 1,014 2.9
London market overview
Capital growth

Rent: £18,300
Adj. 51-week all inclusive rent: £20,400
Source: www.unite-students.com
Capital growth
Affordability (Central London)
Plus:
Flatscreen TV and 2Mb Wi-Fi internet
All utilities and contents insurance included
City support teams including maintenance
Front page on Google search engine
£500 TDPS registered deposit
Fully furnished with study facilities
Start dates aligned to term dates
Simple online booking
Student community
No barriers for international students
Flexible payment options
Private rented studios, Bloomsbury
Source: www.rentright.co.uk
Plus, typically:
× Bills and utilities on top
× No onsite or local presence; 3rd party maintenance
× Not listed as student accommodation in Google
× 1 to 3 month‟s rent as deposit
× Maybe unfurnished
× Start dates not aligned to term dates
× Rental agents and offline reservations
× Mixed community
× International students require references
Ave. rent (excl. bills): £18,500 pa
UNITE – Studio, Woburn Place, Bloomsbury

Capital growth
Affordability (London Zone 2)
UNITE – 2 bed flat, Wedgwood Court, Holloway
Plus:
Flatscreen TV, 2Mb internet and Wi-Fi common area
All utilities and contents insurance included
City support teams including maintenance
Front page on Google search engine
£250 each TDPS registered deposit
Fully furnished with study facilities and ¾ size beds
Start dates aligned to term dates
Simple online booking
Student community
No barriers for international students
Flexible payment options
Private rented 2 bed properties, Holloway
Source: www.home.co.uk
Plus, typically:
× Bills and utilities on top
× No onsite or local presence; 3rd party maintenance
× Not listed as student accommodation in Google
× 1 to 3 month‟s rent as deposit
× Maybe unfurnished
× Start dates not aligned to term dates
× Rental agents and offline reservations
× Mixed community
× International students require references
Rent: £19,600
Adj. 51-week all inclusive rent: £22,900Ave. rent (excl. bills): £25,100 pa
Source: www.unite-students.com

Capital growth
Asset Management initiatives
RefurbishmentsExtensions &
Conversions
• Adding value
• 10 sites
refurbished in past
3 years
• Two properties to
be refurbished
before September
2011 (Capex
spend £3m)
• Opportunities to
extend in urban
properties
• 20% commercial
portfolio vacant –
9% forecast by end
year
• c. 700 beds
potential over 3
years (UNITE
share c. 50%)
University
agreements
• Periodic
opportunities for
lease re-gear
• Long term
relationships
underpin rental
growth

Income
Growing recurring profits
• Co-investment strategy has been successful
• But dilutive impact on earnings – low recurring profit
• We plan to step up the income component of returns
through:
• Rental growth
• Growing portfolio and proportion we own
• Seeking cost efficiencies
• Target overheads less fees as % of GAV of c. 80 bps by 2014
(current level 120bps)
• Supports planned reinstatement of dividend in 2011

Capital structureDebt
• Target gearing 100% - 130%
• 71% at 31 December 2010
• Will operate towards bottom end of range
on built-out basis
• Proactive approach to debt requirements
• New finance and tackling debt maturities
• £200m new facilities in 2010
• £120m facilities restructured/extended
• Continuing engagement through 2011
• Financing strategy must match asset
management strategy
Funds and JVs
• Important part of funding historic growth and
managing balance sheet effectively
• Management fees and performance fees
• USAF now has desired scale and diversification
• £1.2bn GAV across 17 cities
• Secondary market emerging
• „Core plus‟ strategy
• Strategy for UCC, OCB and USV a 2011 priority
• Seeking to simplify and extend
• Increasing ownership share of portfolio over 2-3 years
0
100
200
300
400
500
2009 2010 2011 2012 2013 2014 2015 2016+
£'m
2008 drawn 2009 drawn 2010 drawn
2008 available 2009 available 2010 available
Debt maturity profile – co-investment vehicles
£‟m
Debt maturity profile

Leveraging the UNITE brand
Overview
RelationshipsOperations
Customers

Overview – Knowledge and expertise
Property
ManagementDevelopment
Asset
Management
Sales
Service Affordable product
London programme
Value-added
initiatives
CAPEX
City strategies
Facilities
managementRegions
Acquisitions &
disposals

Overview – Scale of operations
Company Current beds
UNITE 40,000
UPP 20,000
Opal 16,000
Liberty Living 15,000
iQ 4,500
Derwent Living 4,000
Operational support
centre
Total beds 41,191
2011 beds 1,275
Properties 136
London beds 6,779
London
properties
35
Cities 23
Sky Plaza, Leeds
1497 rooms
Average =
300 rooms
600 operational
employees

Overview - history
2001 2011
Be
ds
Fin
an
cia
lP
rod
uc
tsS
erv
ice
Clusters Pods
USAF JVs
4,000
Bowen specLondon Studios/micro-flats
Uni agreements / leases Direct let Blueprint FM serviceContact Centre
Modular

Customers – understanding
• Focus groups, real-time pulse surveys, conjoint
analysis, research and metrics
• International study in 2011, use of agents
• Segmentation analysis, tracking evolution of demographic
• Understanding of decision-making process
UK 30%
EU 25%
Non -EU
45%
UNITE London
UK 60%EU
15%
Non -EU
25%
UNITE RoUK
UK 77%
EU 6%
Non -EU
17%
HESA RoUK

Customers – solutions
• Online
booking/payments
• Wi-fi
• Mobile apps
• 24/7 contact centre
• Customer portal

Operations – Specialist business
Sales
Service
Facilities
management
40,000
customers
moved in over
summer
2,700 false fire
alarms dealt
with in 2010
Security - 200
incidents per
night – peace
of mind for
parents
182,000 calls
to contact
centre p.a. /
94,000 in 10-
week period
70% online
booking
1,000 more
beds in
London than
largest
hotelier
We process
112,000
payment
transactions
per year
1.28m unique
visitors to
website in
2010
UNITE
customers
come from
168 countries;
12% are
Chinese
140,000
maintenance
jobs per year
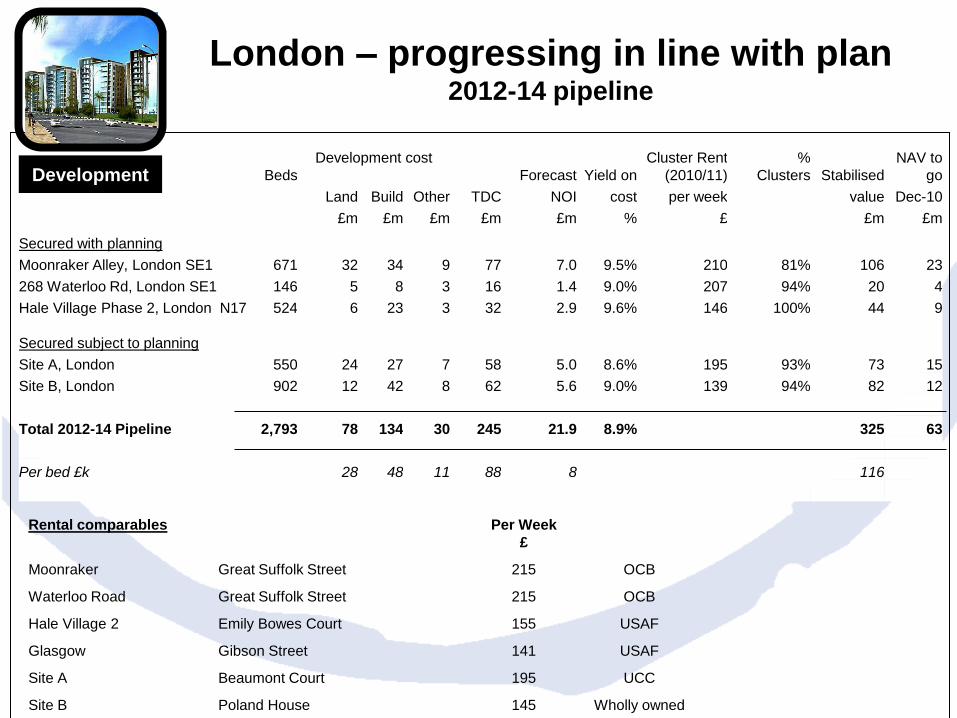
Operations – How we do it
Sales ServiceFacilities
management
People Systems Infrastructure
• Training – 1,312
training days 2010
• 120 FM staff taking
NVQs
• UCAS deal gives
us access to
647,000 applicants
• Unprompted brand
awareness at 32%
- next biggest
competitor at 11%
• UBS online
booking platform
• Bespoke
maintenance
systems
• Mobile applications
• Security –incident
management
process
• Fire
• Call points
• CCTV
• Contact Centre

Relationships – leveraging brand
strength
Sales
Service
Facilities
management
DevelopersPlanning
AuthoritiesBanks Universities
Trusted partner,
able to work off-
market
Faster consents
as regs tighten;
engagement
programme
Securing and
extending debt
facilities
Agreements with
40 HEIs; survey
and engagement
programme

Summary – leveraging brand strength
Development Capital growth Income
Insight, market
knowledge,
expertise – right
product, place &
price
Customer insight;
sales & operational
capability; market
knowledge and
presence
Performance
platform;
investment in
technology

Neil Armstrong – Knight Frank
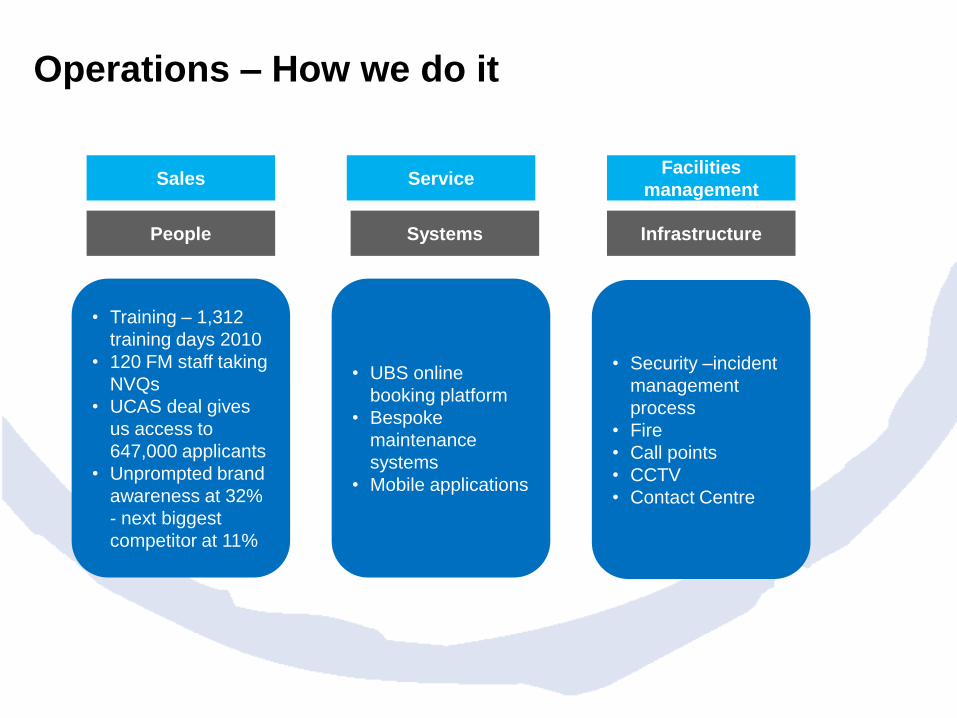
Understanding UNITE’s accounts
1. Understanding proportionally consolidated balance sheet and P&L
2. Reconciling NPC and EPRA adjusted results to IFRS reported results
3. Some added complexities
Property definition
Finance costs
Minority interest
4. Forecasting UNITE

Section 1
Understanding proportionally
consolidated balance sheet
and P&L

Property Owning Structure
Wholly
owned
assetsUSAF UCC OCB USV
Investment assets Investment assetsInvestment assetsInvestment assets Changed from
Development
assets to
investment
in 2010
Development
assets
UNITE
ownership
Other
investors
100%
none
16.3%*
100+ unit
holders
30%
GIC
25%
OCB
51%
Lehmans (PwC)
Asset
Definitions
*16.3% represents our beneficial interest, ie excluding the minority interest (legal interest is 19%)

JV Accounting
Primary Statements
Principle: driven by accounting standards
Show JV interests on a single line in P&L and balance sheet
Includes our beneficial interest and a minority investors‟ interest in USAF
Minority interest item then reversed out
Segmental /Proportionally Consolidated Reporting
Principle: show our %age of all items in the balance sheet and P+L
Provides an analysis of what we own
Includes only our beneficial interest in USAF (16.3%)
The JV accounting adds complexity to our reporting

Summarised balance sheet
31 December 2010 UNITE
£’m
USAF
£’m
UCC
£’m
USV
£’m
OCB
£’m
Total
£’m
Property Gross 631 1,232 379 63 180 2,485
UNITE
share631 201 114 32 45 1,022
Share of Adjusted
net debt(335) (94) (74) (20) (24) (547)
Other
assets7 (3) (2) (1) (1) -
Adjusted net assets 303 104 38 10 20 475
Equates to pps 188p 65p 24p 6p 12p 295p
UNITE’s interest is the aggregate of shareholder loans and equity

2010 Report & Accounts (p 61)

Net Portfolio Contribution
Period to 31 December 2010 UNITE
£’m
USAF
£’m
UCC
£’m
USV
£’m
OCB
£’m
Total
£’m
Revenue 63.5 91.7 23.5 5.4 3.4 187.5
Cost (20.3) (25.5) (6.2) (1.7) (1.0) (54.7)
Net operating income 43.2 66.2 17.3 3.7 2.4 132.8
UNITE Share of NOI 43.2 10.7 5.7 1.9 0.6 62.1
Management fees 8.9 - (0.5) - - 8.4
Property management overheads (13.8) - - - - (13.8)
Financing (including operating
lease rentals)(36.5) (4.4) (4.1) (1.3) (0.5) (46.8)
Investment segment result 1.8 6.3 1.1 0.6 0.1 9.9
Corporate costs/jv overheads (5.4) (0.1) (0.2) - (0.1) (5.8)
Net Portfolio Contribution (3.6) 6.2 0.9 0.6 - 4.1
Management fees payable do not appear under USAF/JVs as they are eliminated in the consolidation
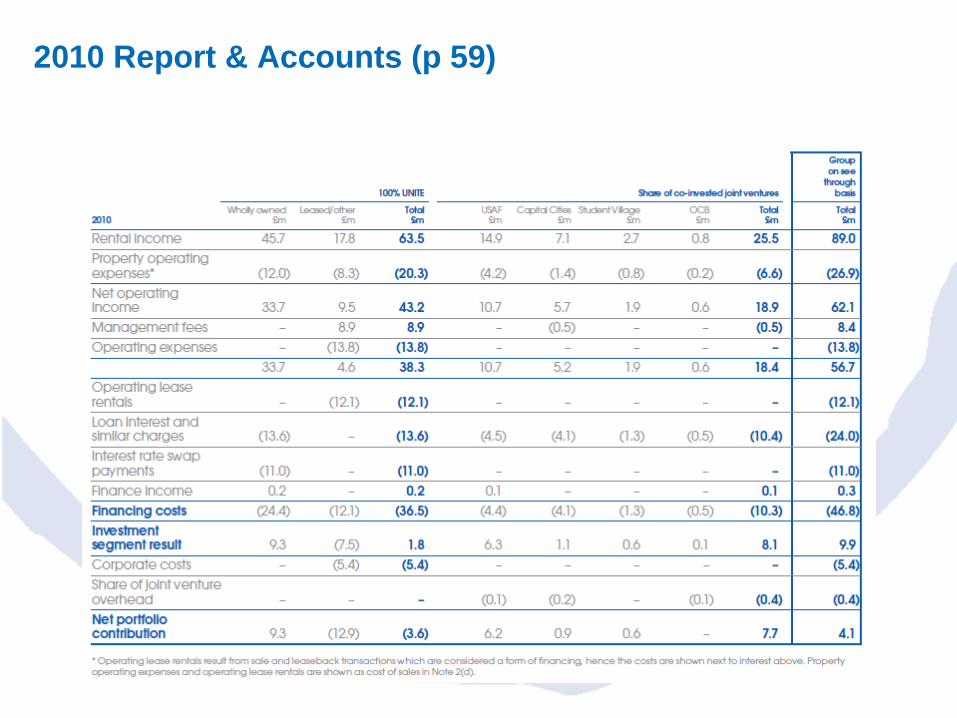
2010 Report & Accounts (p 59)

Section 2
Reconciling EPRA adjusted results
to IFRS reported results

Adjusted vs Reported
£m
Adjusted NAV 475
Unbooked development
profit(37)
Swap mark to market (50)
Deferred tax -
Reported NAV – UNITE
shareholders388
- Minority shareholders 16
Total reported NAV 404
Profit £m
NPC 4.1
Development pre-contract (3.2)
Development trading profits 6.9
UMS loss (4.8)
Other (0.6)
Adjusted profit 2.4
Valuation movement 29.3
Mark to market (7.9)
Deferred tax (4.2)
Reported profit* 19.6
* Attributable to UNITE Group plc Shareholders
The numbers that we quote are ‘Adjusted’ largely according to EPRA guidelines to provide
consistency across quoted real estate companies
NAV Profit

2010 Report & Accounts (p 61)

2010 Report & Accounts (p 64)

Section 3
Some added complexities
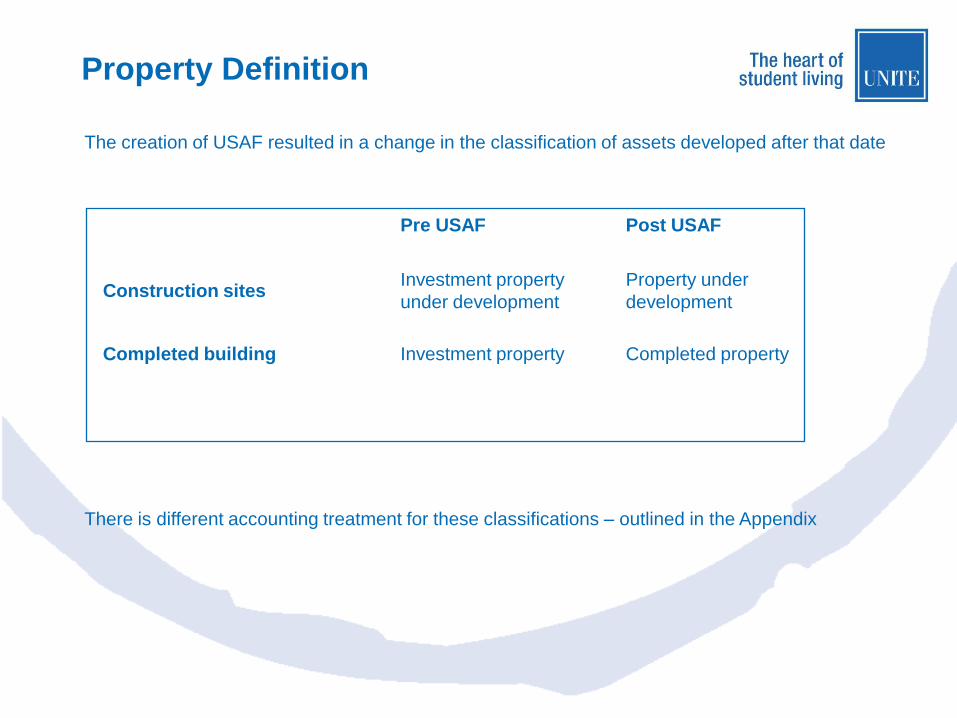
Property Definition
Pre USAF Post USAF
Construction sitesInvestment property
under development
Property under
development
Completed building Investment property Completed property
The creation of USAF resulted in a change in the classification of assets developed after that date
There is different accounting treatment for these classifications – outlined in the Appendix

2010 Finance Costs
UNITE
£’m
USAF
£’m
UCC
£’m
USV
£’m
OCB
£’m
Total
£’mInterest paid including effective
swaps(16.3) (4.5) (4.1) (1.3) (1.0) (27.2)
Swap payments on ineffective
hedges(11.0) - - - - (11.0)
Interest capitalised 2.5 - - - 0.5 3.0
Development segment interest 0.2 - - - - 0.2
Operating lease rentals (12.1) - - - - (12.1)
Finance income 0.2 0.1 - - - 0.3
Investment segment interest (36.5) (4.4) (4.1) (1.3) (0.5) (46.8)
• All swaps are commercially effective, but some are ineffective under IAS rules
- Interest on ineffective swaps is not included in basic interest charge
- Included in interest as a separate line
• Development is financed by:
- Specific development loans
- Allocation of debt from investment loans
• Properties sold as sale and leaseback transaction, have rent payable treated as a financing cost
Interest on both is capitalised into development projects
and included as a cost of development

Minority Interest
Primary Statements
• Principle: driven by accounting standards
• One USAF investor invested through UNITE group subsidiary to simplify their tax
• Includes our beneficial and investor‟s interest in USAF (18.9%)
• Investor interest shown as belonging to minority
• Their interest amounts to £1.7m of JV income in P+L in 2010, and;
• £16.2m of investment in joint venture in balance sheet
Segmental Reporting
• Principle: show our %age of all items in the balance sheet and P+L
• Provides an analysis of what we own
• Includes only our beneficial interest in USAF (16.3%)

Section 4
Forecasting UNITE

Forecasting UNITE NAV
Rental Growth GAV
£‟m
Rental
Growth
NAV Growth
£‟m
Investment assets
(wholly owned and share of JVs)
- Stabilised
- Stabilising
730
154
3 – 4 %
-
25
-
Development NAV NAV to book
£‟m
% in year NAV Growth
£‟m
2011 completions
2012 completions
2013-14 completions
6
29
34
100%
30-50%
0-20%
6
9-14
0-7
Yield movement GAV
£‟m
Yield Shift NAV Growth
Yield compression/expansion 884 - -
P&L items NAV Growth
Net Portfolio Contribution See NPC forecast
Pre-contract development costs Based on development activity
UMS Based on modular production
Tax Based on USAF performance
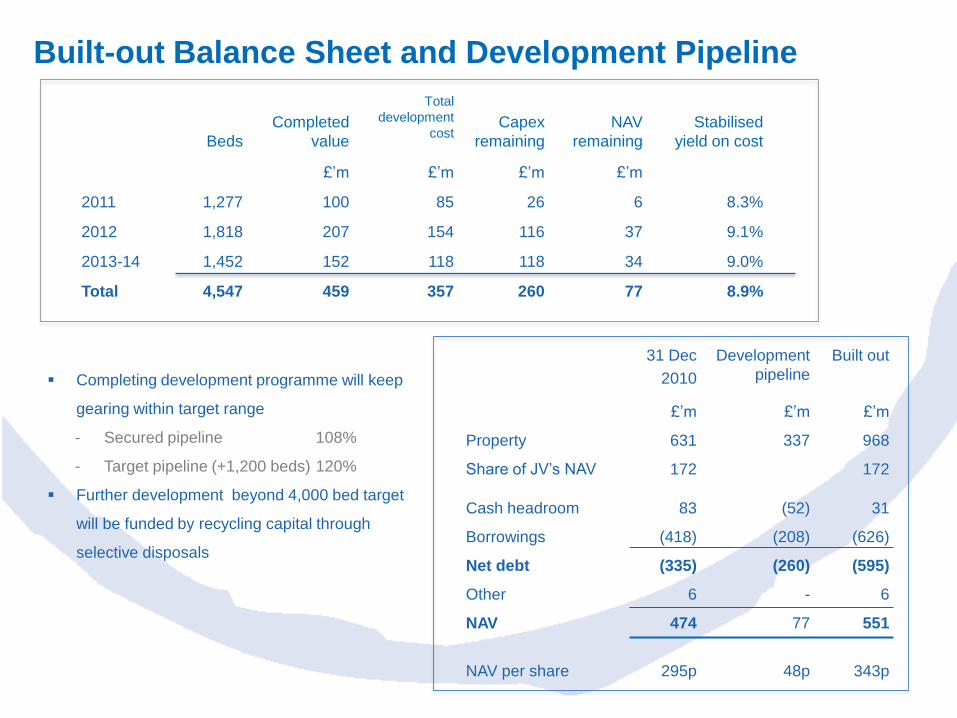
Built-out Balance Sheet and Development Pipeline
Beds
Completed
value
Total
development
costCapex
remaining
NAV
remaining
Stabilised
yield on cost
£‟m £‟m £‟m £‟m
2011 1,277 100 85 26 6 8.3%
2012 1,818 207 154 116 37 9.1%
2013-14 1,452 152 118 118 34 9.0%
Total 4,547 459 357 260 77 8.9%
31 Dec
2010
Development
pipeline
Built out
£‟m £‟m £‟m
Property 631 337 968
Share of JV‟s NAV 172 172
Cash headroom 83 (52) 31
Borrowings (418) (208) (626)
Net debt (335) (260) (595)
Other 6 - 6
NAV 474 77 551
NAV per share 295p 48p 343p
Completing development programme will keep
gearing within target range
- Secured pipeline 108%
- Target pipeline (+1,200 beds) 120%
Further development beyond 4,000 bed target
will be funded by recycling capital through
selective disposals

Forecasting UNITE NPC
NOI GAV
£‟m
NIY Stabilisation
factor
Annualisation NOI
£‟m
Investment assets
(wholly owned and
share of JVs)
- Stabilised
- Stabilising
- 2011 completions
- Leased assets
730
154
100
6.6%
6.6%
6.6%
2/3
2/3 1/4
48.2
6.8
1.1
9.3
65.4
Fees GAV
£‟m
Fee UNITE share Annualisation NOI
£‟m
AM fees - USAF
- UCC
- OCB
1,232
379
180
60 bps
50 bps
70 bps
83%
70%
75%
6.1
1.3
0.9
8.4
Finance costs Debt Cost of debt Annualisation NOI
£‟m
Interest - Wholly owned
- 2011 completions
- Share of JVs
- Capitalised
- Lease costs
293
60
223
6.8%
6.0 - 6.5%
5.5%
1/4
(19.6)
(0.9 -1.0)
(12.3)
2.0 - 3.0
(12.2)
(42.1) – (43.1)
Overheads
Disposals
Based on prior year plus inflation
£150m forecast in 2011 and 2012

Built-out P&L
£‟m Assumptions
2011 Analysts consensus NPC 8.5
NOI on development pipeline 32.1 9% development yield on £357m capex
Interest on development pipeline debt (16.1) 75% LTC at 6% cost of debt
Built-out NPC (before rental growth) 24.5
Rental growth impact on NPC 5.8 3% growth at in 2010 NOI for 3 years
Built-out NPC (including rental growth) 30.3
Assumes interest cost on existing debt remains at current level (6.2% on see through basis)
Assumes overhead can be maintained at current level
Overheads less fees as a proportion of GAV falls to c.80bps on build out of portfolio

Summary / Q&As
Development Capital growth Income
Focus on London and other high-growth markets
Leveraging the power of the UNITE brand
TARGETING LOW DOUBLE DIGIT TOTAL RETURNS

Appendix

Consequences of Property Definitions
Operating income/costs Investment segment P&L Development segment P&L
Revaluation
above cost - Balance sheet Fixed asset value up Unbooked (but in adjusted NAV)
- P&L Valuation gain on property Unbooked
Revaluation
below cost - Balance sheet Fixed asset value down Stock value down
- P&L Valuation loss on property Cost of sales
DisposalsProceeds less carrying value
in P&L (P&L on disposal)
Proceeds in sales
Carrying cost in Cost of sales
This leads to different treatments in the accounts
Accounts treatment