Embed Size (px)
Citation preview

Unit A: Experimental Design - Learning Goals Name:
Period:
Instructions: Use the performance expectations sheet to document your current level of understanding (1-4) for each learning goal
after completing an activity.
Unit A: Experimental Design Learning Goals
Pre
-Ass
ess
men
t
Act
ivit
y 1:
Sav
e Fr
ed!
Act
ivit
y 2
: P
ella
gra
Sto
ry
Wo
rld
of
Var
iab
les
Agg
ress
ive
Beh
avio
r o
f B
etta
s
Situ
atio
nal
An
alys
es
Wal
l/Ed
ge S
eeki
ng
Beh
avio
r o
f M
ice
Erro
r in
Exp
erim
ents
Act
ivit
y 8:
Div
ing
Sub
mar
ines
Po
st-A
sse
ssm
ent
Controlled Experiments
1. I can plan and conduct a controlled experiment.
Analyzing Data
2. I am able to correctly analyze data from a scientific investigation.
Use of Evidence to Support Reasoning
3. I am able to use evidence and reasoning to create a proper scientific conclusion.
Using Evidence to Support Reasoning
4. I can correctly analyze an experiment scenario

Learning Goals - Performance Expectations
Unit A:
Experimental Design Level 1 Level 2 Level 3 Level 4
Learning Goal #1:
I can plan & conduct a
controlled experiment.
I can accurately define key vocabulary: Study Subject
Manipulated Variable
Responding Variable
Control Trial
Experimental Trial
Controlled Variables
Observation
Data
Scientific Question
Prediction
Hypothesis
I can create a proper:
Scientific Question
Prediction
Hypothesis
I can identify & set up:
Control Trial(s)
Experimental Trials
I can complete an experiment that: is safe
controls variables
answers a scientific question
includes all teammates as
equal members
is properly cleaned up &
restocked
I can explain & show others how to: safely conduct a lab
answer a scientific question
monitor to ensure all team members
are able to properly complete a lab.
properly clean & reset a lab.
Learning Goal #2:
I am able to correctly
analyze data from a
scientific investigation.
I can accurately define key vocabulary: Error (all types)
Data
Qualitative Measurement
Quantitative Measurement
Reliability
Uncontrolled Variable
Average (mean)
I am able to:
Identify which data to use as
evidence
Identify errors in data
display data in data tables &
graphs
tell if reliability was properly
tested for in a lab
I can explain how to:
use data as evidence
Identify the type(s) of errors
present in data
identify similarities, differences,
trends & patterns in my results
tell If an experiment is reliable
I can explain to others how to: use data for evidence for a lab
compare & contrast data
from multiple groups to identify
sources of error.
control uncontrolled variables that
cause error
how to make data more reliable
Learning Goal #3:
I am able to use
evidence and reasoning
to create a proper
scientific conclusion.
I can accurately define key vocabulary: Conclusion
Infer
Evidence
Reasoning
Trade Offs
Trend
Validity (Challenge)
I can:
Identify an experiment’s data
tell what the hypothesis is
write a claim
complete all steps in a
conclusion
I can use reasons & evidence to:
explain why the data answers the
scientific question/hypothesis.
write and support my claim(s).
identify trends & patterns in
Control & Experimental Trials.
use evidence to tell different
solutions to a problem.
I am able to explain to others:
how to create an argument that
supports a hypothesis
how to modify a model experiment
based on test results to improve the
design.
I can analyze multiple solutions by
evaluating the trade-offs.
Learning Goal #4:
I can correctly analyze
an experiment scenario
I can accurately define key vocabulary:
Analyze Scenario Variables
I can correctly identify all variables in an experiment scenario.
I can identify all scenario variables
Study subject
Manipulated variable
Responding variable
Experimental Trial
Control trial
Controlled variables
Uncontrolled variables
Scientific Question
Hypothesis
I am able to:
explain to others how to identify all
the variables in a scenario
write my own experiment scenario

Student Leadership, Participation & Teamwork Self-Assessment Tell 2 examples of your LPT skills per area to support your score 1 – Below Standard, 2 – Approaching Standard, 3 – Standard, 4 – Above Standard
1. Leadership: Explain w/2 examples:
2. Participation: Explain w/2 examples:
3. Teamwork: Explain w/2 examples:
Student Growth, Learning Progress and Goal Setting. Please complete each section as indicated below.
4. Tell three concepts/learning goals that you have shown growth in. Explain.
a.
b.
c.
5. Tell three concepts/learning goals you still need more growth in. Explain.
a.
b.
c.
Parent Signature Date:
Comments:
Teacher Review - To be completed by your teacher 1 – Below Standard, 2 – Approaching Standard, 3 – Standard, 4 – Above Standard
1. Activities completed ………………………………….………..………………
2. Corrections made in red pen …………………………….……….…...….
3. Self-assessment & learning goals completed above.…………..
4. Parent review completed ……………………………………………………
FINAL SCORE ………………………………………………………….............
Leadership, Participation & Teamwork rating…………………..
Voc

Saving Fred Purpose: To identify the steps involved in a scientific investigation.
Vocabulary: Scientific Question – A testable question that asks how the responding
variable will be affected by a change in the manipulated variable.
Scientific method – A process used to conduct investigations. The process generally involves making a question, developing an hypothesis, performing an experiment, analyzing data, drawing a conclusion, and communicating the results publicly. 1. What question is your team trying to answer? 2. What are the three rules you must follow to successfully save Fred? a. b. c. 3. Brainstorm ways to save Fred with your team. Test your ideas to see what works. 4. Give step-by-step procedures for how to save Fred? Draw Key Figures Below Step 1.
Step 2.
Step 3.
Step 4.
Step 5.
Step 6.
Step 7.
Step 8.
Step 9.

Step 10.
5. Exchange your procedure with another team. They will complete the Quality Review.
Save Fred Quality Review Reviewers Name Reviewers Name 1. Follow the procedure on the front side of this sheet. 2. Which key steps of this procedure worked well? Explain using step numbers.
3. Tell which key step(s) of this procedure did not work well? Tell why using step numbers.
4. Describe how the step(s) discussed in 3 above could be improved? Be specific
5. With your group, analyze your own procedure. Make corrections with a red pen.

Activity 2: The Pellagra Story Purpose: To compare the steps of a real scientific investigation to that of the scientific method.
Vocabulary: Observation – the gathering of information using our 5 senses (see, smell,
taste, hear, feel)
Inference – a reasonable conclusion made from observations
Background: Although scientists use many methods to solve problems, scientists in the same field frequently use similar approaches. Often these involve doing an experiment. For example, if a botanist (someone who studies plants) wanted to develop plants that resist drought, the botanist would use many plants and follow procedures common to many botanical experiments. A materials
scientist working to develop a new type of plastic for an artificial limb would use a different procedure. What kinds of experiments are possible when you study human beings? How can you collect evidence in these situations? Begin to consider these issues as you watch the story of the disease called pellagra (puh-LAY-gra), which affected poor rural families of the South.
Notes on video:
What were the problems caused by pellagra? What did people think caused pellagra? 1.
2.
3.
4.
What evidence did Dr. Goldberger observe or collect about pellagra? What did Dr. Goldberger conclude about the cause of pellagra?

Observations & Inferences: Identify each of the following statements as either an observation of an inference that was made about pellagra.
Observation Inference _____ _____ a. Corn causes pellagra.
_____ _____ b. Only children in the orphanage developed pellagra. The staff did not.
_____ _____ c. Changing the orphans’ diets cured those who had pellagra.
_____ _____ d. Only people who lived in the South got pellagra.
_____ _____ e. Pellagra is not an infectious disease.
_____ _____ f. Pellagra causes skin rashes and, eventually, insanity.
_____ _____ g. People get pellagra because they are poor.
_____ _____ h. Pellagra is caused by diet.
_____ _____ i. Orphans and prisoners who ate a balanced diet did not develop pellagra.
_____ _____ j. The Southern way of life caused pellagra.
1. Next, look at the statements that you marked as inferences. Based on the evidence that Dr. Goldberger found, put a star next to each inference that is faulty.
2. Choose one of the inferences that you put a star next to, and explain how that inference could have been made based on observations.
Analysis Questions: Answer the questions below in complete, quality, and correct sentences using facts, reasons, evidence, or data to support your answer.
1. Tell Dr. Goldberger’s hypothesis about the cause of pellagra.

2. Describe the two key experiments Dr. Goldberger did to provide evidence of the relationship
between pellagra and nutrition. Be sure to explain if the results provided evidence that supported
or disproved his hypothesis.
3. T
e
l
l
w
h
a
t Dr Goldberger could have done to provide more convincing evidence of the relationship between
pellagra and nutrition.
4. a. Tell which steps of Dr. Goldberger’s investigation were the same as the scientific method.
b. Next describe the steps that were different. Use evidence from the video.
a. State the problem. b. Create a hypothesis. c. Do a investigation. d. Record & Analyze data. e. Make a conclusion. f. Repeat & Recheck. g. Communicate Results
a.
b.

The World of Variables Purpose(s): To identify and describe the different variables that can be in a scientific investigation.
Instructions: Using Figure 1, answer the following questions regarding the different variable types in complete, quality, & correct sentences reflecting the questions. Figure 1. World of Variables
Answer the following questions in complete, quality sentences. 1. What does it mean to vary something?
2. What are two things that can vary during the day that you can’t keep from varying?
3. What kind of variable would these be? 4. Tell two things that don’t vary during the day, but could. What kind of variable would these be?

5. Identify the variable Dr. Goldberger changed for the purpose of testing out his hypothesis in the Pellagra experiment.
6. What type of variable would the answer to Question 5 be?
7. Identify the variable Dr. Goldberger measured in his Pellagra experiments with prisoners. What type of variable would these be?
8. How many Manipulated and Responding Variables can be in an experiment?
9. Tell two ways to control variables.
10. Tell two of the variables that Dr. Goldberger controlled during his experiment with the prisoners.
11. What category and type of variable is the most undesirable to have in an experiment?
12. What is a Control trial and why do scientists have control (trials) in their experiments? 13. What is an Experimental Trial and what is different about an Experimental Trial and a Control Trial?
14. Identify the experimental and control trials Dr. Goldberger used in his experiment with prisoners.

Unit A - Aggressive Behavior of Siamese Fighting Fish Lab (Betta splendens)
Purpose: I can complete a laboratory investigation involving Bettas.
Background: In this laboratory investigation Bettas are tested to discover their aggressiveness.
SS = _____________________________ CT =(CT contains SS!)______________________
MV= _____________________________ ET = ___________________________________
RV = _____________________________ (ET Contains SS & MV)
CV1 = _____________________________ UCV1 =_________________________________
CV2 = _____________________________ UCV2 =_________________________________
Question: How will ... (verb?)... Manipulated Variable .... Study Subject.. (either order) affect the Responding Variable ?
___________________________________________________________________________________
Prediction/Hypothesis IF (ss/mv)___________________________________________________________
Then (et-predict)________________________________________________________________________
Compared to (ct)________________________________________________________________________
Because (ss,mv,rv & why)_________________________________________________________________
______________________________________________________________________________________
Therefore______________________________________________________________________________
Data Analysis: Use the data from your Data Table to create Bar Graph 1 below.
a. Use two spaces for each behavior bar, with one between the next.
b. Neatly Graph the frequency of each behavior on the graph below.
Bar Graph One - Aggressive Behavior of Bettas*
Number
of
Occurrences
Behavior Type C-Avoid C-Display C-Attack E-Avoid E-Display E-Attack

Analysis: Answer these questions in CQC sentences. Attach a separate sheet of paper as needed
1. Show the total of each aggressive behavior in both trials as a three number ratio for your Betta.
Avoid : Display : Attack
Control Trial _____ : ______ : ______
Experimental Trial _____ : ______ : ______
2. Based upon your data, did your fish show more aggressive behaviors in the Control Trial, in the Experimental trial
or are the same in each? Use data as evidence in your response.
3. Based upon your Experimental data, did your fish show more aggressive behaviors compared to the rest of the
fish? Tell the high / lows in your response.
Conclusion
4. Was your hypothesis accepted or rejected? (circle) a. Accepted b. Rejected
5. Explain why the hypothesis was accepted or rejected. Use data as evidence.
(Challenge or EC Regular) In the wild animals that are hurt are easy prey for predators.
6. Which aggressive behavior(s) might be most important for Betta survival? Tell Why.
7. Which aggressive behavior(s) might be the worst to use if a Betta was to survive? Tell Why.

Scientific Method Scenarios 1. Plunging into Science!
Purpose: To identify and analyze the variables found in a scientific investigation, scenario, or environment.
Instructions: Identify experimental design information for the following scenarios, beginning with the plunger “Stool Hang Time” lab.
Procedure:
1. Using Plunger 1, have one group member press the plunger down onto the lab stool. 2. Once the plunger is secured, have a time-keeper monitor the clock as the plunger handler lifts the stool off
the ground! 3. Repeat for all three lab members that are not the time keeper. 4. Record data for Plunger 1 in Data Table 1 after each trial. 5. Repeat Steps 1-4 using Plunger 2.
Data:
Data Table 1. Stool hang time for plunger 1 and plunger 2
Plunger Student 1 Time (sec) Student 2 Time (sec) Student 3 Time (sec) Average
1
2
SS = _____________________________ CT =(CT contains SS!) __________________________
MV= _____________________________ ET = ___________________________________
RV = _____________________________ (ET Contains SS & MV!)
CV1 = _____________________________ UCV1 =_________________________________
CV2 = _____________________________ UCV2 =_________________________________
Question: How will ... (verb?)... Manipulated Variable .... Study Subject.. (either order) affect the Responding Variable ?
___________________________________________________________________________________
Prediction/Hypothesis IF (ss/mv)____________________________________________________________
Then (et-predict)________________________________________________________________________
Compared to (ct)________________________________________________________________________
Because (ss,mv,rv & why)_________________________________________________________________
______________________________________________________________________________________
Therefore_____________________________________________________________________________

2. The Hot and Cold 2 Liter bottle Scenario In this exciting experiment students decided to investigate if cooling down the temperature of a 2 Liter bottle affected the air pressure inside the 2 Liter bottle. Then the students will check their results by heating the 2L bottle. Here’s the scenario:
Student teams have two sealed 2 Liter bottles. Both are at room temperature.
In the experiment one 2 Liter bottle remains at room temperature.
The students pour cold water over the other 2 Liter bottle for 2 minutes.
Afterwards the students squeeze the two bottles and compare the air pressure in the cooled 2 liter bottle to the room temperature 2 liter bottle by giving each bottle a “squeeze test”. After the trials were complete, all data was recorded in the class data table for further analysis. During the trial students notice that some of the bottles are colored green, some are clear in color. The
room air temperature remained steady at 26C throughout the experiment.
Data Table 1. Effect of temperature on bottle pressure
Bottle Temp. Trial 1 Trial 2 Trial 3 Average
Room Temp.
Hot
Cold
SS = _____________________________ CT =(CT contains SS!) __________________________
MV= _____________________________ ET = ___________________________________
RV = _____________________________ (ET Contains SS & MV!)
CV1 = _____________________________ UCV1 =_________________________________
CV2 = _____________________________ UCV2 =_________________________________
Question: How will ... (verb?)... Manipulated Variable .... Study Subject.. (either order) affect the Responding Variable ?
___________________________________________________________________________________
Prediction/Hypothesis IF (ss/mv)____________________________________________________________
Then (et-predict)________________________________________________________________________
Compared to (ct)________________________________________________________________________
Because (ss,mv,rv & why)_________________________________________________________________
______________________________________________________________________________________
Therefore_____________________________________________________________________________
Room Temp Hot Cold

3. Pellegra in the South In Dr. Goldberger’s effort in the South to solve the pellagra problem, the good doctor chose to test his hypothesis on prisoners. Dr. Goldberger, with permission of the Governor, isolated 11 prisoner volunteers to test his hypothesis.
The prisoners were all kept in the same building.
The building’s floors and walls were scrubbed regularly.
The prisoner’s clothes were new and washed frequently.
Insect nets were placed on the screens to keep the
insects out.
All prisoners were fed a “traditional Southern diet of
cornbread, fatback and syrup.
Over time 7 of the 11 prisoners developed pellagra.
All the other the prisoners at the prison were fed a balanced diet.
SS = _____________________________ CT =(CT contains SS!) __________________________
MV= _____________________________ ET = ___________________________________
RV = _____________________________ (ET Contains SS & MV!)
CV1 = _____________________________ UCV1 =_________________________________
CV2 = _____________________________ UCV2 =_________________________________
Question: How will ... (verb?)... Manipulated Variable .... Study Subject.. (either order) affect the Responding Variable ?
___________________________________________________________________________________
Prediction/Hypothesis IF (ss/mv)____________________________________________________________
Then (et-predict)________________________________________________________________________
Compared to (ct)________________________________________________________________________
Because (ss,mv,rv & why)_________________________________________________________________
______________________________________________________________________________________
Therefore_____________________________________________________________________________
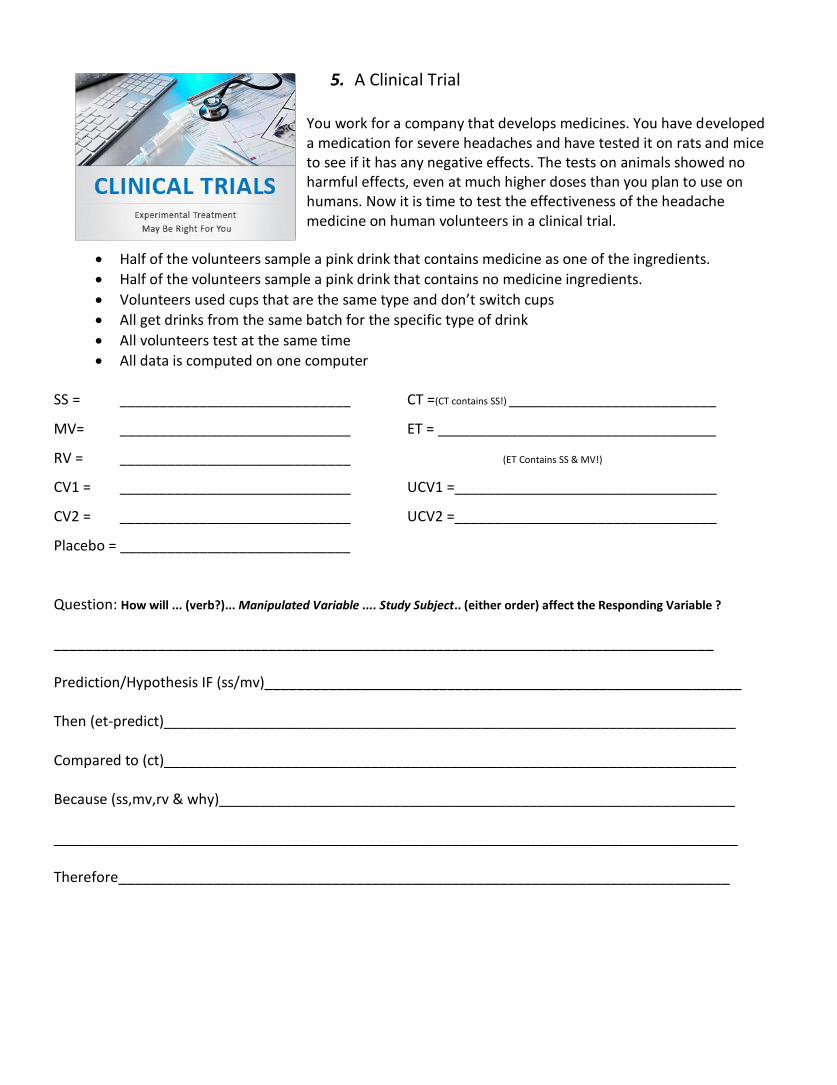
5. A Clinical Trial You work for a company that develops medicines. You have developed a medication for severe headaches and have tested it on rats and mice to see if it has any negative effects. The tests on animals showed no harmful effects, even at much higher doses than you plan to use on humans. Now it is time to test the effectiveness of the headache medicine on human volunteers in a clinical trial.
Half of the volunteers sample a pink drink that contains medicine as one of the ingredients.
Half of the volunteers sample a pink drink that contains no medicine ingredients.
Volunteers used cups that are the same type and don’t switch cups
All get drinks from the same batch for the specific type of drink
All volunteers test at the same time
All data is computed on one computer
SS = _____________________________ CT =(CT contains SS!) __________________________
MV= _____________________________ ET = ___________________________________
RV = _____________________________ (ET Contains SS & MV!)
CV1 = _____________________________ UCV1 =_________________________________
CV2 = _____________________________ UCV2 =_________________________________
Placebo = _____________________________
Question: How will ... (verb?)... Manipulated Variable .... Study Subject.. (either order) affect the Responding Variable ?
___________________________________________________________________________________
Prediction/Hypothesis IF (ss/mv)____________________________________________________________
Then (et-predict)________________________________________________________________________
Compared to (ct)________________________________________________________________________
Because (ss,mv,rv & why)_________________________________________________________________
______________________________________________________________________________________
Therefore_____________________________________________________________________________
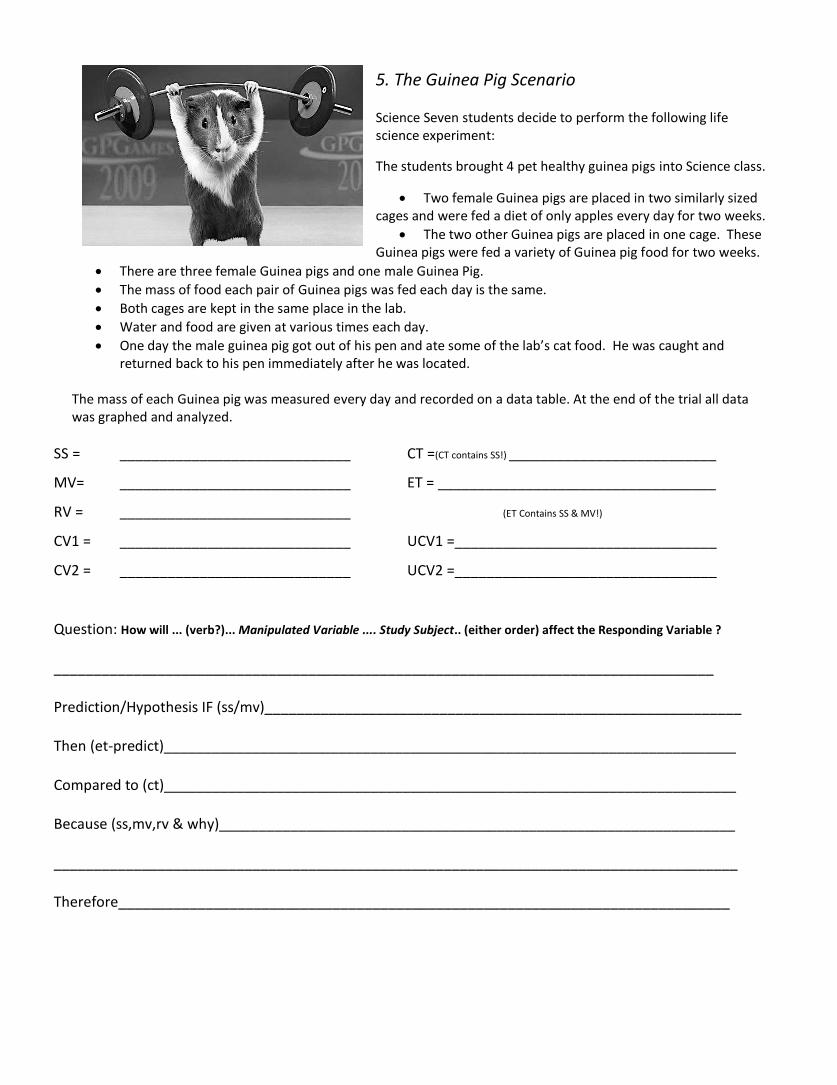
5. The Guinea Pig Scenario Science Seven students decide to perform the following life science experiment:
The students brought 4 pet healthy guinea pigs into Science class.
Two female Guinea pigs are placed in two similarly sized cages and were fed a diet of only apples every day for two weeks.
The two other Guinea pigs are placed in one cage. These Guinea pigs were fed a variety of Guinea pig food for two weeks.
There are three female Guinea pigs and one male Guinea Pig.
The mass of food each pair of Guinea pigs was fed each day is the same.
Both cages are kept in the same place in the lab.
Water and food are given at various times each day.
One day the male guinea pig got out of his pen and ate some of the lab’s cat food. He was caught and returned back to his pen immediately after he was located.
The mass of each Guinea pig was measured every day and recorded on a data table. At the end of the trial all data was graphed and analyzed.
SS = _____________________________ CT =(CT contains SS!) __________________________
MV= _____________________________ ET = ___________________________________
RV = _____________________________ (ET Contains SS & MV!)
CV1 = _____________________________ UCV1 =_________________________________
CV2 = _____________________________ UCV2 =_________________________________
Question: How will ... (verb?)... Manipulated Variable .... Study Subject.. (either order) affect the Responding Variable ?
___________________________________________________________________________________
Prediction/Hypothesis IF (ss/mv)____________________________________________________________
Then (et-predict)________________________________________________________________________
Compared to (ct)________________________________________________________________________
Because (ss,mv,rv & why)_________________________________________________________________
______________________________________________________________________________________
Therefore_____________________________________________________________________________

6. Challenge = Guppies Sex vs. Temperature - In this long-term life science experiment, Science Seven
students developed an experiment that could be done in the laboratory.
The experiment’s set up is as follows.
A 20 gallon aquarium was set up in the science laboratory and the water heater temperature was adjusted to keep the average water temperature at 27°C, the best temperature for raising guppies.
A second 20 gallon aquarium was set up next to the first aquarium and the water heater temperature was lowered to keep the average water temperature at 24°C.
Both aquariums have the same type of equipment. Each aquarium has the same amount of:
air supply filtration gravel
lighting plants
A week after the aquariums were set up, 10 Guppies, 5 female and 5 male, were placed into each aquarium. The Guppies in the aquariums are fed the same amount of food each day, but the feeding times varied. After 30 days, students discovered babies being born in each aquarium. All babies were taken out of the aquariums, put into two separate tanks, and kept there until each baby’s gender could be positively determined. The gender ratio (males to females) of the babies was entered in a Data Table.
Afterwards all the young guppies were returned to their original aquariums.
Each time baby guppies were discovered, the same procedure was followed.
Two and a half months into the experiment, power was shut off to the school for 3 days due to a winter snowstorm. The investigation continued for a total of nine months. Gender ratio data were recorded throughout the period.
SS = _____________________________ CT =(CT contains SS!) __________________________ MV= _____________________________ ET = ___________________________________ RV = _____________________________ (ET Contains SS & MV!) CV1 = _____________________________ UCV1 =_________________________________ CV2 = _____________________________ UCV2 =_________________________________ Question: ___________________________________________________________________________
Prediction/Hypothesis IF (ss/mv)_________________________________________________________
Then (et-predict)_____________________________________________________________________
Compared to (ct)_____________________________________________________________________
Because (ss,mv,rv & why)______________________________________________________________
___________________________________________________________________________________
Therefore___________________________________________________________________________
27°C Water Temp 24°C Water Temp

Natural History of the House Mouse schmied/reid©2015
Mus musculus Linnaeus http://www.discoverlife.org/nh/tx/Vertebrata/Mammalia/Muridae/Mus/musculus/
Physical Characteristics: The house mouse is a small brownish-gray mouse with a long, slender, tapering, indistinctly bicolored tail. The tail is sparsely haired and scaly. In nature the belly is grayish. Adults length is between 150 & 185 mm (5 3/4 - 7 1/2 in). Adults weigh from 14 to 28 g (1/2 - 1 oz).
Geographic distribution: The house mouse is native to Eurasia, probably originating in India, but it now has a worldwide distribution due to accidental introductions. This species was not known in the United States until about the time of the American Revolution when it is believed to have arrived as a stowaway aboard transatlantic ships. It is believed mice were first been transported to the southern United States along shipping lanes from the Iberian peninsula (Schwarz and Schwarz, 1943)
Habitat: Common in cultivated fields and in and around houses, cabins and barns.
Reproduction: House mice are very prolific. They breed throughout the year in portions of their range and may have as many as 12 or 13 young per litter, although 4 to 7 is the average. Gestation (pregnancy) is 18 to 20 days with an average of eight litters being produced annually.
a. Newborn young are blind and naked and have their eyes and ears sealed. The eyes open at about 14 days of age. The young grow rapidly and are normally weaned by 3 weeks of age. Most individuals are sexually mature at 2 months, although some may begin breeding at 5 weeks. b. An indoor nest may be concealed in a hole, in the woodwork, or beneath some sort of shelter. The nest may be composed of cloth, rags, paper, or any other soft material. Outdoor nests may be located in corn shocks, beneath debris, or in burrows of other animals. Where nesting sites and material are scarce, house mice have been reported to occupy communal nests.
Longevity: Some captive house mice have lived 6 years, although the normal life span of this species is probably less than 2 years. Palmer (1954)
Terrestrial Ecology: House mice are usually associated with human habitations, but in many regions feral (wild) populations exist. Mice are often the most abundant mammal in cultivated fields.
a. House mice tend to be nocturnal (active at night), but may be active day or night during every month of the year. They do not hibernate. Signs of their presence include gnawings and small, black droppings. b. House mice can climb well and readily jump from high places and are good swimmers for short distances. For example mice can jump 12 inches from a standing position and up to 3 feet from a run. They can also squeeze through openings just a little more than 1/4 inch in diameter. Mouse mice can run up almost all vertical surfaces.
c. Mouse sense of sight is poor, and they are colorblind, but their senses of smell, taste, touch, and hearing are excellent (Jackson, 1982). Actually, House mice have a sense of smell that far exceeds humans, having about 3 times as many olfactory (smell) receptors as humans. House mice use this sense to their advantage, for example male mice spray urine to "mark" key parts of their territory just like dogs and cats do. d. House mice generally don't travel far once established, often limiting themselves to an area of 10 to 30 feet in diameter as long as food is plentiful.
Niche & Food habits: House mice are omnivorous and feed on a wide range of items including grains, seeds, green vegetation, insects, and invertebrates in nature. However, in a home House mice will sample just about any type of

food, especially high fat foods like butter, chocolate, bacon and nuts. Thus House mice can be very destructive if allowed to run free.
Predators: Snakes, owls, hawks, cats, foxes, weasels, and skunks are the major predators.
Scientific Use and Disease: The house mouse is one of the most important species for scientific research. It has a complex of several separate lineages and nearly 3000 different strains of natural mutants, and transgenic and targeted mutant mice. Most of these strains are being studied in educational and research settings throughout the world.
Please answer each question using complete, quality and correct sentences that reflect the question.
1. Explain where House mice originated AND how they came to be in the US.
2. Pretend that one female House mouse produced the maximum number of young in each of her litters, had the maximum amount of litters in one year, and ALL the young survived. Show how many offspring this female would have in one full year. Show your work.
3. Tell the maximum and normal ages of House mice.
4. Tell the House mouse's habitat AND niche.
5. Tell each of the House mouse's major predators AND tell each predators niche
6. House mice can be considered both good and bad for humans. Explain how the House mice can be considered as "good" for humans and also how these creatures can be "bad" for humans
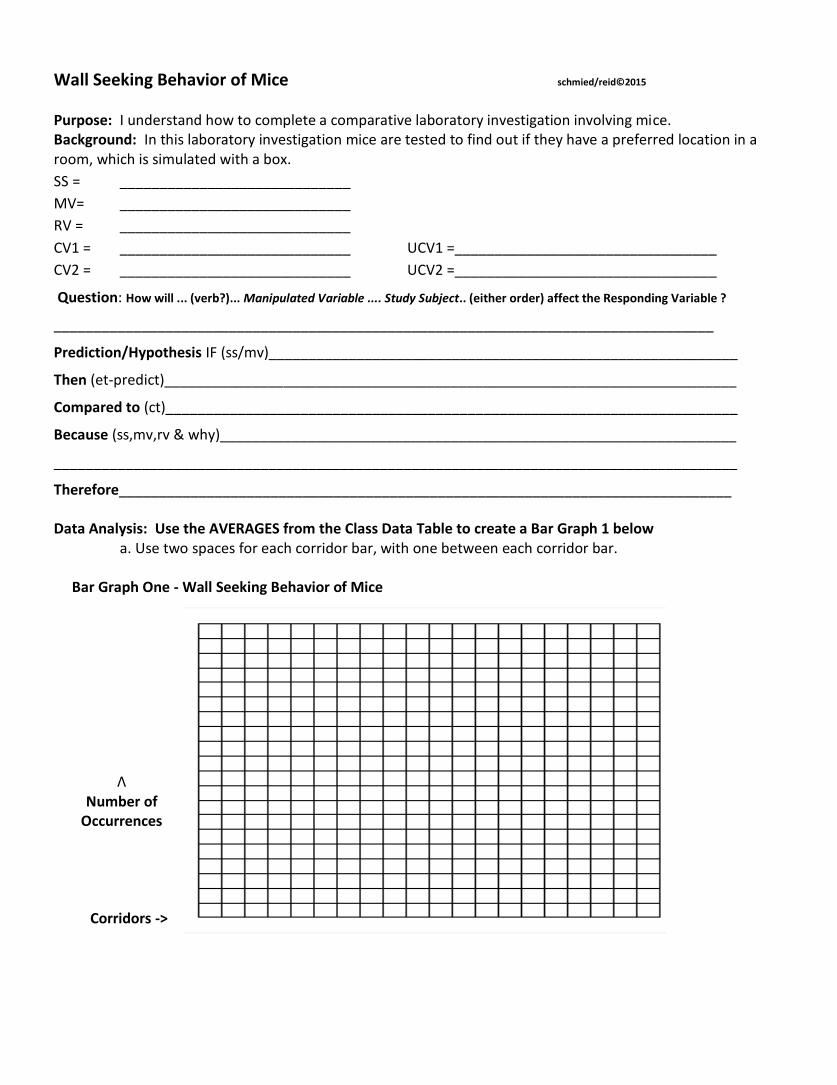
Wall Seeking Behavior of Mice schmied/reid©2015 Purpose: I understand how to complete a comparative laboratory investigation involving mice. Background: In this laboratory investigation mice are tested to find out if they have a preferred location in a room, which is simulated with a box.
SS = _____________________________
MV= _____________________________
RV = _____________________________
CV1 = _____________________________ UCV1 =_________________________________
CV2 = _____________________________ UCV2 =_________________________________
Question: How will ... (verb?)... Manipulated Variable .... Study Subject.. (either order) affect the Responding Variable ?
___________________________________________________________________________________
Prediction/Hypothesis IF (ss/mv)___________________________________________________________
Then (et-predict)________________________________________________________________________
Compared to (ct)________________________________________________________________________
Because (ss,mv,rv & why)_________________________________________________________________
______________________________________________________________________________________
Therefore_____________________________________________________________________________ Data Analysis: Use the AVERAGES from the Class Data Table to create a Bar Graph 1 below
a. Use two spaces for each corridor bar, with one between each corridor bar. Bar Graph One - Wall Seeking Behavior of Mice
Λ Number of
Occurrences
Corridors ->
2. Consider the data shown in Bar Graph 1 above. Which pair of corridors did your mouse prefer? a. (1+2) the center pair of corridors
b. (3+4) the middle pair of corridors
c. (5+6) the outer corridors (Walls)
3. How great was the difference compared to each pair of corridors? (1.5x, 2x, 2.5x, etc) a. Walls (5+6) to Center corridors (1 + 2) ________________ b. Walls (5+6) to Middle corridors (3 + 4) ________________
4. Tell 2 Controlled Variables and 2 Uncontrolled variables
5. Explain how to control the uncontrolled variables in 4 above. a.
b.
Conclusion 6. Was your hypothesis accepted or rejected? (circle) a. Accepted b. Rejected 7. Explain why the hypothesis was accepted or rejected. Use data as evidence.
Controlled Variables Uncontrolled Variables
a. a.
b. b.

Edges Seeking Behavior of Mice schmied/reid©2015
Purpose: I can understand how to complete a simple laboratory investigation involving mice.
Background: In this laboratory investigation mice are tested to find out if they have a preferred location in a
room, which is simulated with a box.
SS = _____________________________ CT =(CT contains SS!) __________________________
MV= _____________________________ ET = ___________________________________
RV = _____________________________ (ET Contains SS & MV!)
CV1 = _____________________________ UCV1 =_________________________________
CV2 = _____________________________ UCV2 =_________________________________
Question: How will ... (verb?)... Manipulated Variable .... Study Subject.. (either order) affect the Responding Variable ?
___________________________________________________________________________________
Prediction/Hypothesis IF (ss/mv)___________________________________________________________
Then (et-predict)________________________________________________________________________
Compared to (ct)________________________________________________________________________
Because (ss,mv,rv & why)_________________________________________________________________
______________________________________________________________________________________
Therefore_____________________________________________________________________________
Data Analysis: Use the AVERAGES from your Data Table to Bar Graph the data from Data Table 1 below
a. Use two spaces for each corridor bar, with one between each station.
Bar Graph One – Edge Seeking Behavior of Mice
Λ
Number of
Occurrences
Corridors ->
1. Consider the data shown in Bar Graph 1 above. Which pair of corridors did your mouse prefer?
a. (1&2) the center pair of corridors
b. (3&4) the middle pair of corridors
c. (5&6) the outer corridors?
3. How great was the difference compared to each of the other corridors. (1.5x, 2x, 2.5x, etc)
a. Edge corridors (5&6) to Center corridors (1 & 2) ________________
b. Edge corridors (5&6) to Middle corridors (3 & 4) ________________
4. Tell 2 Controlled Variables and 2 Uncontrolled variables
Conclusion 5. Was your hypothesis accepted or rejected? (circle) a. Accepted b. Rejected 6. Explain why the hypothesis was accepted or rejected. Use data as evidence.
7. Tell how reliable this data was and explain why you think this is so.
Controlled Variables Uncontrolled Variables
a. a.
b. b.
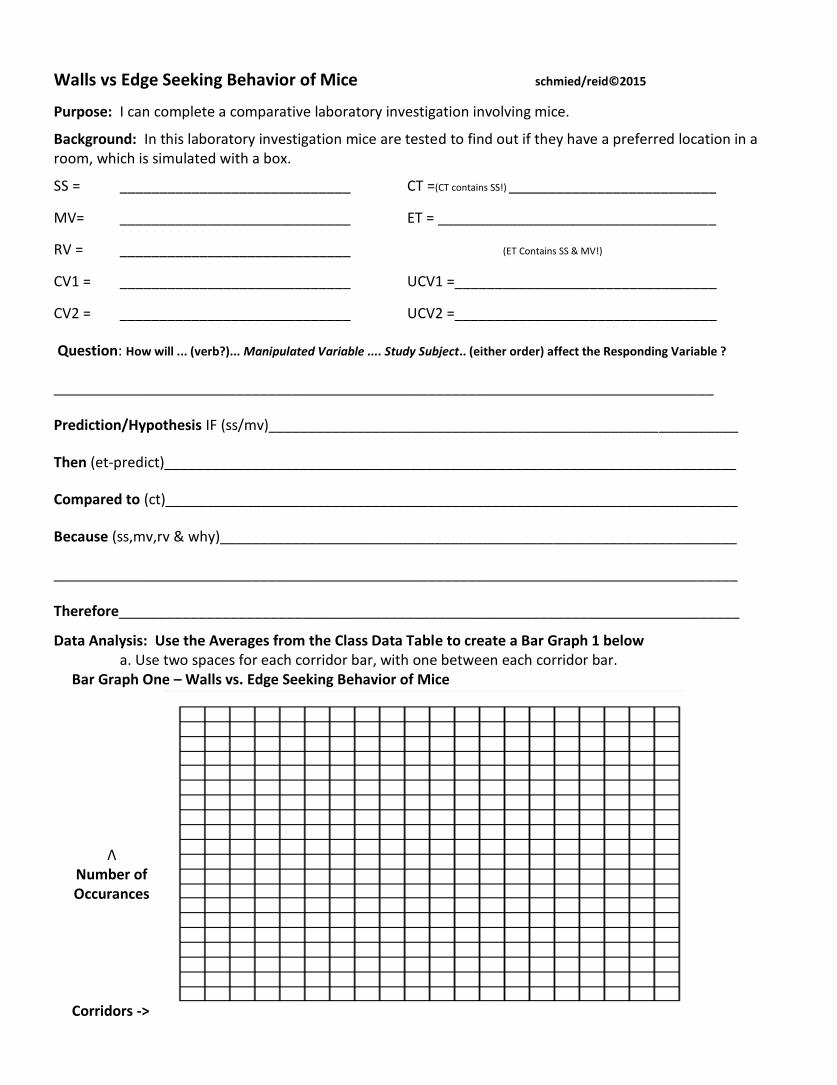
Walls vs Edge Seeking Behavior of Mice schmied/reid©2015
Purpose: I can complete a comparative laboratory investigation involving mice.
Background: In this laboratory investigation mice are tested to find out if they have a preferred location in a room, which is simulated with a box.
SS = _____________________________ CT =(CT contains SS!) __________________________
MV= _____________________________ ET = ___________________________________
RV = _____________________________ (ET Contains SS & MV!)
CV1 = _____________________________ UCV1 =_________________________________
CV2 = _____________________________ UCV2 =_________________________________
Question: How will ... (verb?)... Manipulated Variable .... Study Subject.. (either order) affect the Responding Variable ?
___________________________________________________________________________________
Prediction/Hypothesis IF (ss/mv)___________________________________________________________
Then (et-predict)________________________________________________________________________
Compared to (ct)________________________________________________________________________
Because (ss,mv,rv & why)_________________________________________________________________
______________________________________________________________________________________
Therefore______________________________________________________________________________
Data Analysis: Use the Averages from the Class Data Table to create a Bar Graph 1 below a. Use two spaces for each corridor bar, with one between each corridor bar.
Bar Graph One – Walls vs. Edge Seeking Behavior of Mice
Λ Number of Occurances
Corridors ->

ANALYSIS: Use the data in Bar Graph 1 to tell which pair of corridors did your mouse prefer? (Circle) 1. Center Walls 1+2 OR Edges 1+2
2. Middle Walls 3+4 OR Edges 3+4
3. Outer Walls 5+6 OR Edges 5+6
4. How great was the difference compared to each pair of corridors? a. Walls (1+2) to Edges ( 1+ 2) ________ : ________
b. Walls (3+4) to Edges (3 + 4) ________ : ________
c. Walls (5+6) to Edges (5 + 6) ________ : ________
5. Identify two types of error that occurred, explain how each was caused,
Conclusion
6. Was your hypothesis accepted or rejected? (circle) a. Accepted b. Rejected
8. Explain why the hypothesis was accepted or rejected. Use data as evidence.
Type of Error How was this error caused? What effect did this error have on the
data?
a. a.
b. b.

Activity 8: Diving Submarines Purpose: To plan and conduct a controlled experiment to test a hypothesis. Goal: The goal is to make a toy submarine dive as many times possible in 10 minutes.
~ Part A ~ Instructions: You are now Onderzeeboten Kommanders! Your goal is to make your submarine dive underwater as many times as possible in 10 minutes. Gather the list of materials & perform the procedure below.
Materials: 1 submarine 1 small scoop 1 thermometer baking powder 1 Red Vines container
Procedure:
1. Fill the Red Vines container up to the first line with
cold water.
2. Record the Temperature of the water.
3. Remove the conning tower cap of the submarine &
add 10 level scoops of baking powder inside the
submarine. Tap 3x to pack the powder.
4. Add 5 more scoops & tap 3x, then 5 more and tap again. Put conning tower firmly on submarine.
5. Submerge the submarine in the Red Vines container & shake the submarine under water for 4 sec.
6. Release the submarine & start a timer for 5 minutes.
7. Record the total number of dives the submarine makes in 5 minutes in Data Table 1.
8. After 5 minutes, take off the conning tower, wash out the inside of the submarine and blow dry.
Dump out the Red Vines container in the sink. Return all materials to your bin.
Data Table 1 - Total Dives in Warm Water – Control Trial
# of Dives Water Temperature °C # of Scoops of Baking
Powder Time (min) (dives/min)
20 5
~ Part B ~ Instructions: You and your team must plan and conduct an experiment testing a hypothesis between
two variables.
a. Chose one of the two possible variables below to test:
Temperature of water,
Number of scoops of baking powder
b. Complete steps #1-6 on the next page.
c. Get approval from your instructor. Then conduct your experiment & record your data in the provided data table.
Finally, analyze your data and communicate your conclusions.
Figure 1. Submarine components

Step 1: State the purpose of your team’s investigation (include YOUR TEAM’s Variable).
Step 2: Identify the study subject, manipulated variable, and responding variable.
SS =
MV =
RV =
Step 3: What is your scientific question? (“How does/What is… SS + MV affect RV?”)
Step 4: Identify the experimental trial & control trial.
ET =
CT =
Step 5: State your hypothesis.
IF (SS + MV)
THEN (ET + Prediction)
COMPARED TO (CT)
BECAUSE (WHY = SS, MV, & RV)
THEREFORE
Step 6: List the controlled & uncontrolled variables and types of error in the experiment. BE SPECIFIC: Be sure to go back and revise this list after your experiment is done!! Controlled Variables ) Uncontrolled Variables ) Type of Error ) Minimum of 2 List 2 or more that affect data Use World of Variables HO
1. 1. 1.
2. 2. 2.
3. 3. 3.

Step 7: Record data.
Data Table 2. _________________________________________________
Water Temperature °C # of Dives Water
Temperature
# of Scoops of
Baking Powder Time (min) (dives/min)
Control Trial
(get data from p.1) 20 5
Experimental Trial 1
Experimental Trial 2
Mean of Exp. Trials
Step 8: Analyze data. Bar Graph 1 _____________________________ _______ Y-Axis
X-Axis_________
Be sure to properly title, label, draw a key and show the data
Step 9: Conclusion. What conclusions can be drawn after analyzing the data? Use your data above and the
checklist below when writing your conclusion. FOLLOW THIS FORMAT Skip a line between ___ a. Overall conclusive statement explaining what the experiment shows. (“This experiment shows..”)
___ b. Tell if the experiment’s results accepts or rejects your hypothesis
___ c. Explain, using evidence from the lab, why the hypothesis was accepted or rejected.
Ensure the evidence compares to the control trial.
___ d. Describe at least two sources of error and explain how each affected the data.
___ e. Tell at least two ways to improve this experiment.
___ f. Describe two new things that you learned by doing this experiment