Embed Size (px)
Citation preview

Unit 3 Review
AP Macroeconomics
1. The modern tools of macroeconomic policy are:
Monetary and Fiscal Policy
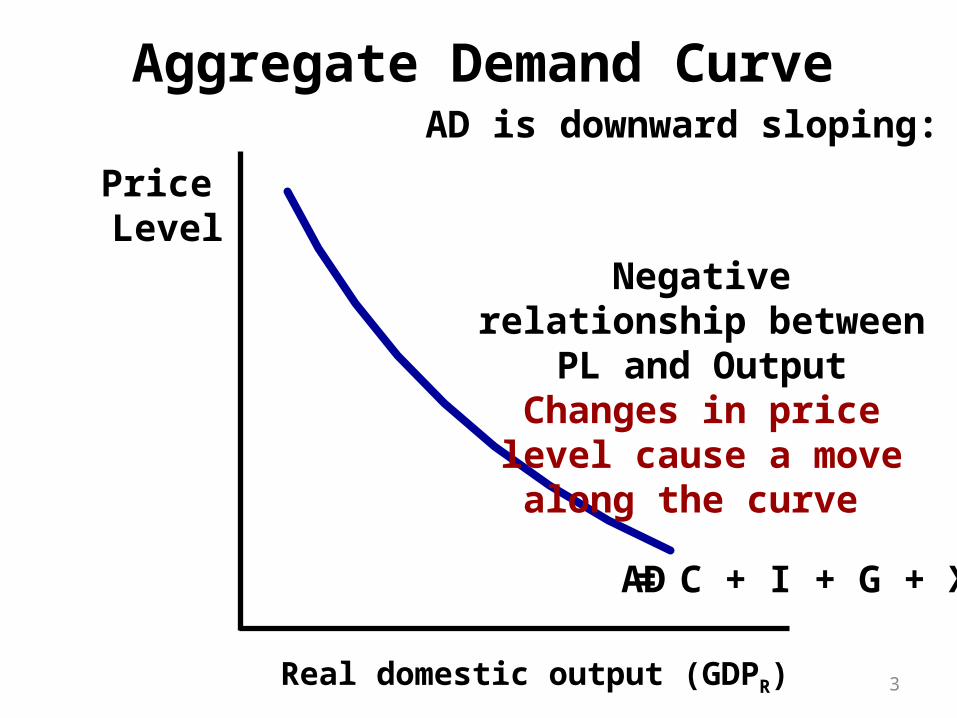
Aggregate Demand Curve
Price Level
Real domestic output (GDPR)
AD
3
AD is downward sloping:
Negative relationship between PL and Output
Changes in price level cause a move along the curve
= C + I + G + Xn
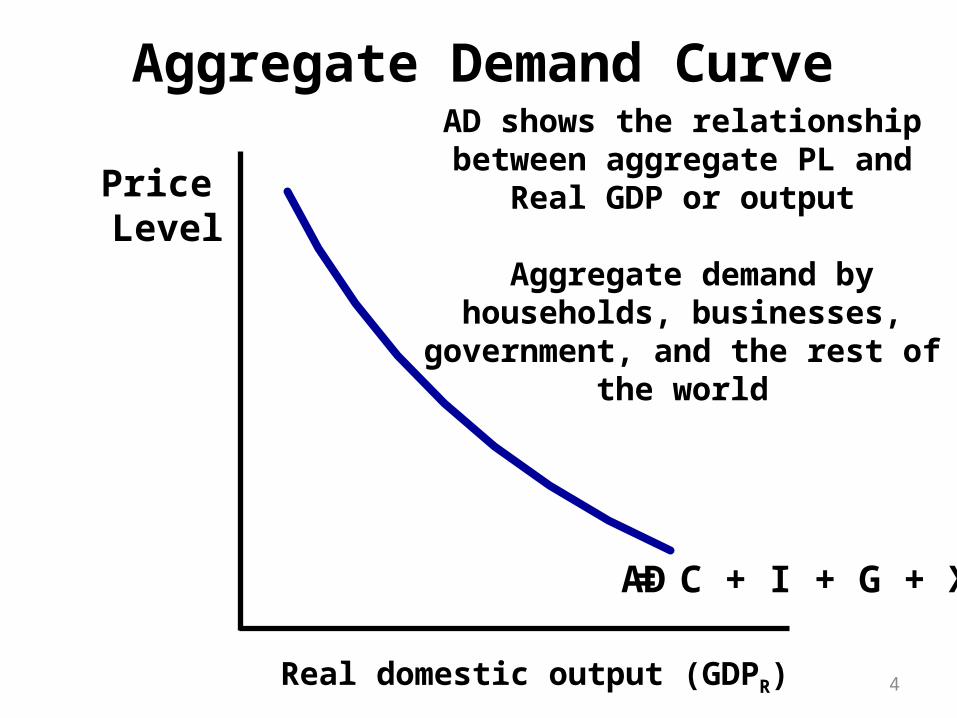
Aggregate Demand Curve
Price Level
Real domestic output (GDPR)
AD
4
AD shows the relationship between aggregate PL and
Real GDP or output
Aggregate demand by households, businesses, government, and the rest of
the world
= C + I + G + Xn
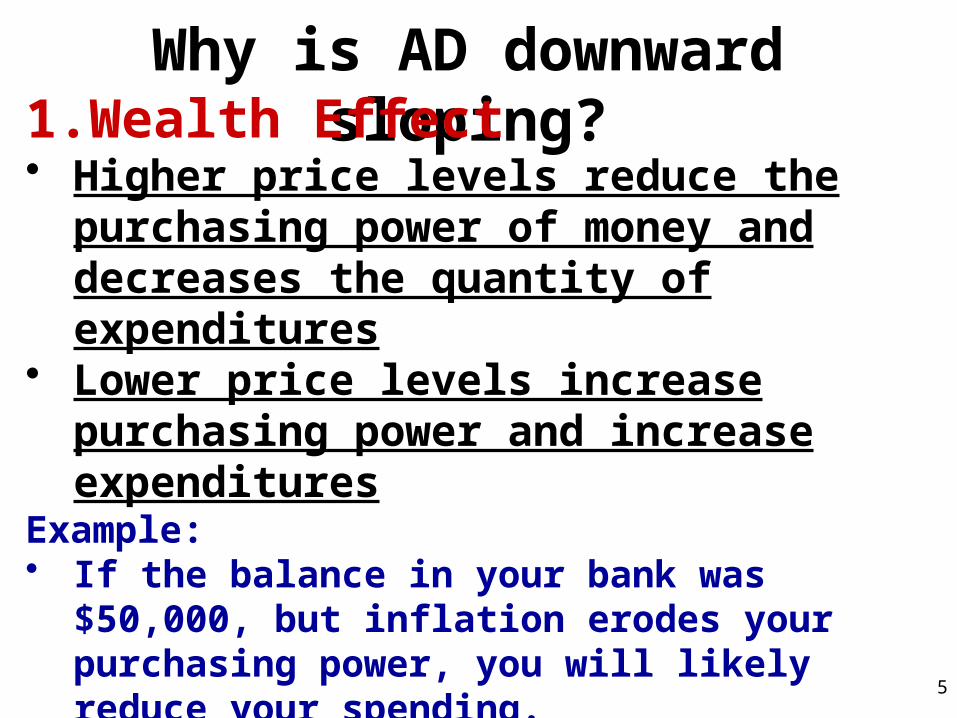
Why is AD downward sloping?1. Wealth Effect • Higher price levels reduce the purchasing
power of money and decreases the quantity of expenditures
• Lower price levels increase purchasing power and increase expenditures
Example: • If the balance in your bank was $50,000, but inflation
erodes your purchasing power, you will likely reduce your spending.
• So…Price Level goes up, GDP demanded goes down.
5
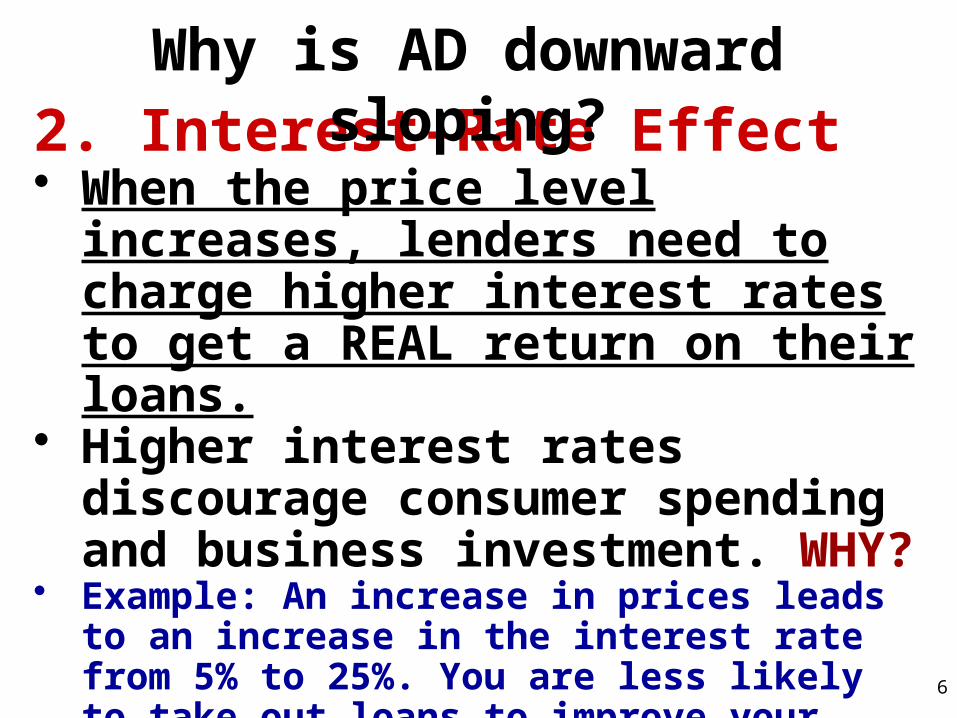
2. Interest-Rate Effect• When the price level increases, lenders
need to charge higher interest rates to get a REAL return on their loans.
• Higher interest rates discourage consumer spending and business investment. WHY?
• Example: An increase in prices leads to an increase in the interest rate from 5% to 25%. You are less likely to take out loans to improve your business.
• Result…Price Level goes up, GDP demanded goes down (and Vice Versa).
6
Why is AD downward sloping?
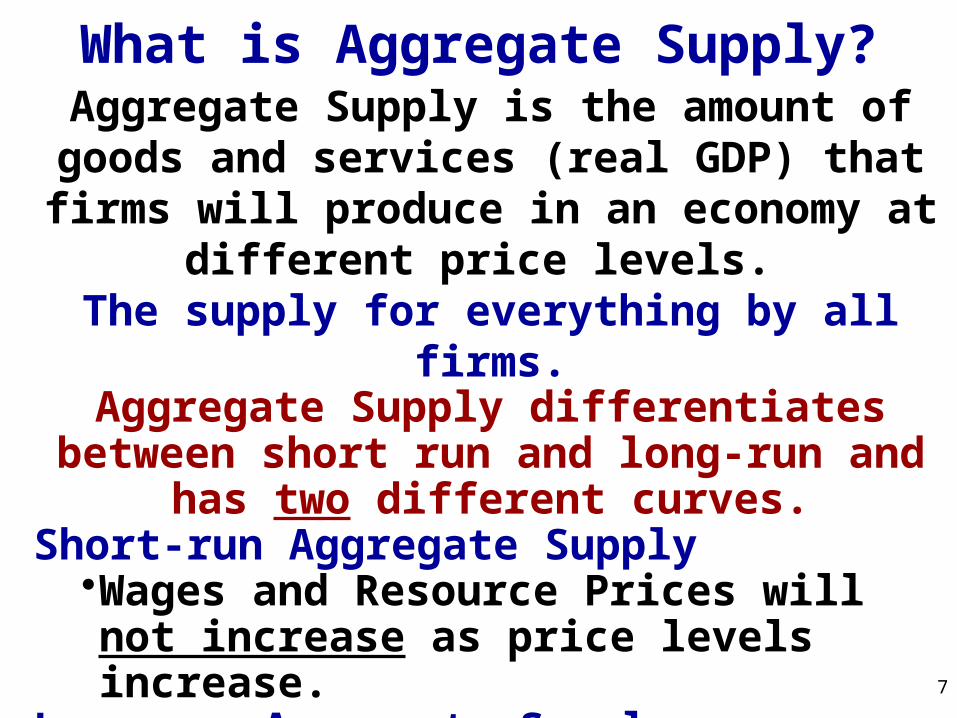
What is Aggregate Supply?Aggregate Supply is the amount of goods and
services (real GDP) that firms will produce in an economy at different price levels.
The supply for everything by all firms.Aggregate Supply differentiates between short run and long-run and has two different curves.
Short-run Aggregate Supply•Wages and Resource Prices will not increase as price levels increase.
Long-run Aggregate Supply•Wages and Resource Prices will increase as price levels increase.
7
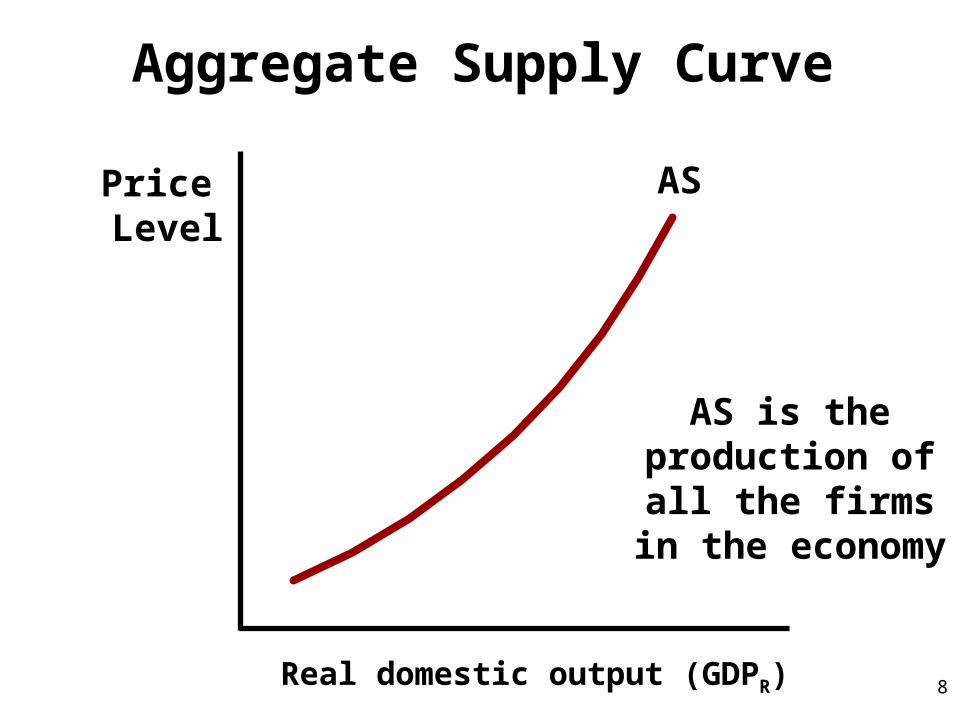
Aggregate Supply Curve
Price Level
Real domestic output (GDPR)
AS
8
AS is the production of all the firms in the
economy
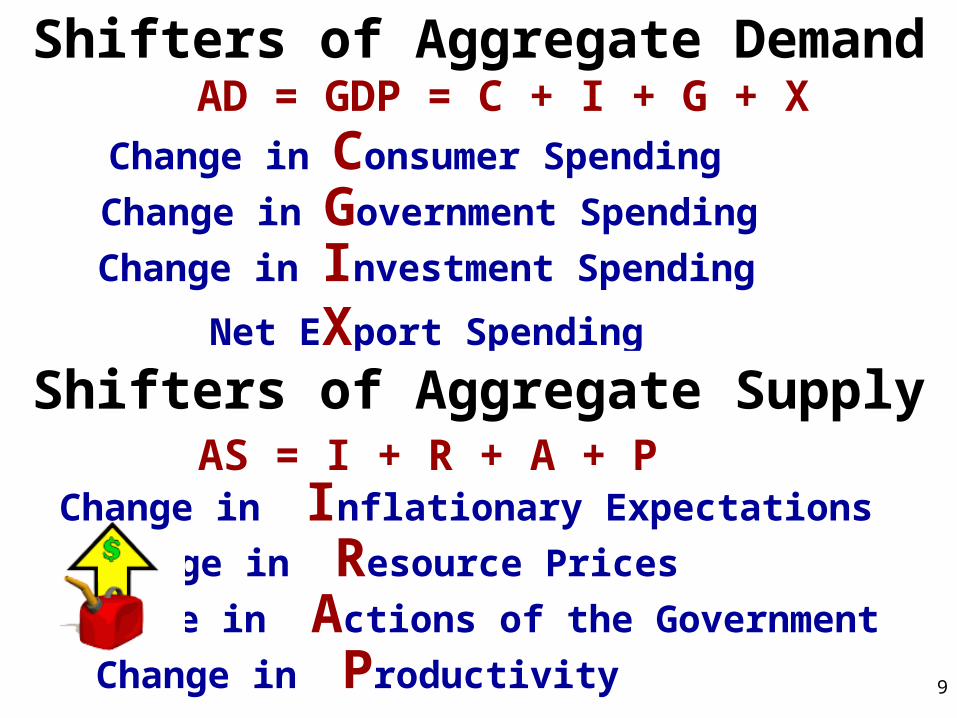
Shifters of Aggregate Demand
Change in Consumer Spending
Change in Investment Spending
Change in Government Spending
Net EXport Spending
AD = GDP = C + I + G + X
Shifters of Aggregate SupplyAS = I + R + A + P
Change in Resource Prices
Change in Actions of the Government
Change in Productivity 9
Change in Inflationary Expectations
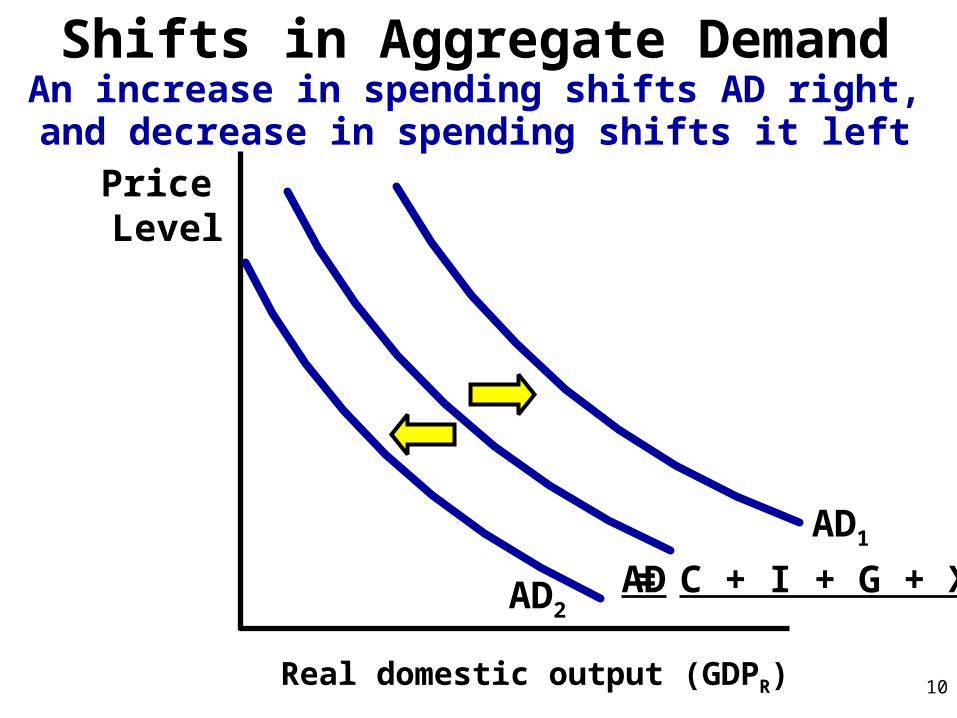
Shifts in Aggregate Demand
Price Level
Real domestic output (GDPR)
AD
10
An increase in spending shifts AD right, and decrease in spending shifts it left
= C + I + G + Xn
AD1
AD2
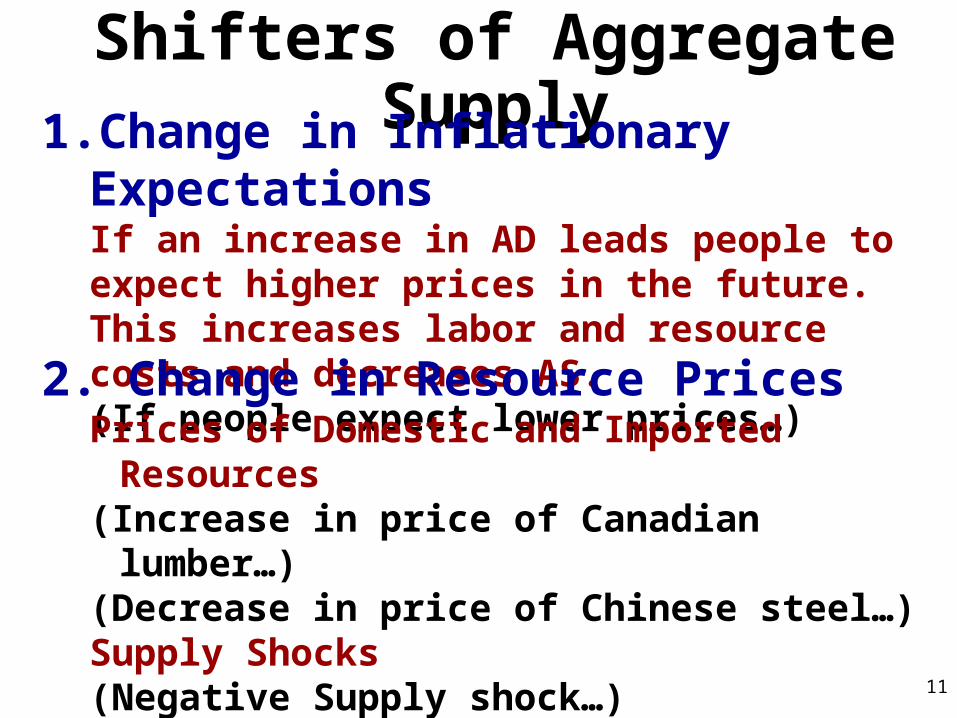
Shifters of Aggregate Supply
1. Change in Inflationary Expectations If an increase in AD leads people to expect higher prices in the future. This increases labor and resource costs and decreases AS. (If people expect lower prices…)
2. Change in Resource PricesPrices of Domestic and Imported Resources (Increase in price of Canadian lumber…)(Decrease in price of Chinese steel…)Supply Shocks(Negative Supply shock…)(Positive Supply shock…)
11
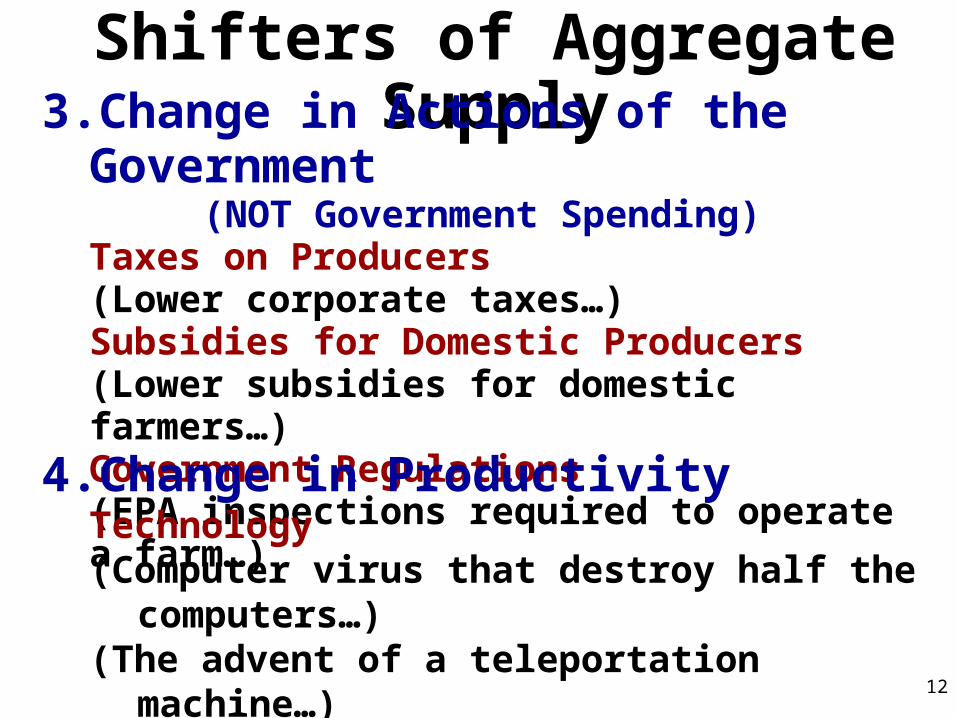
Shifters of Aggregate Supply3. Change in Actions of the Government
(NOT Government Spending)Taxes on Producers (Lower corporate taxes…)Subsidies for Domestic Producers (Lower subsidies for domestic farmers…)Government Regulations (EPA inspections required to operate a farm…)
4. Change in ProductivityTechnology (Computer virus that destroy half the computers…)(The advent of a teleportation machine…)
12
Price Level
13
AS
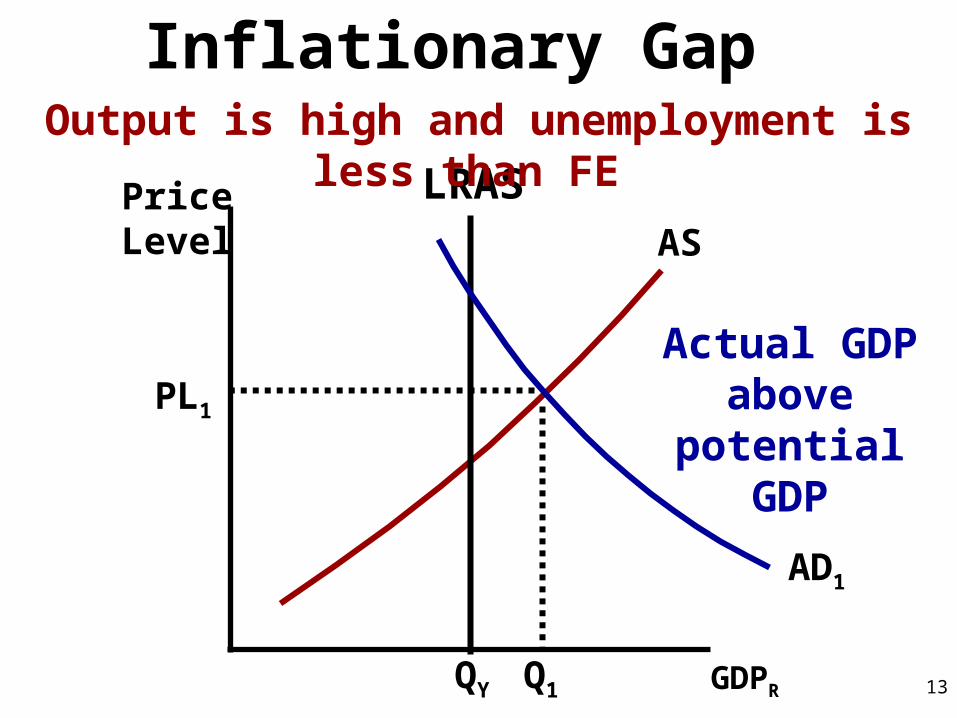
Inflationary Gap
GDPR
LRAS
QY
AD1
PL1
Q1
Output is high and unemployment is less than FE
Actual GDP above potential
GDP
Price Level
14
AD
GDPRQY
PL1
Q1
LRAS AS1
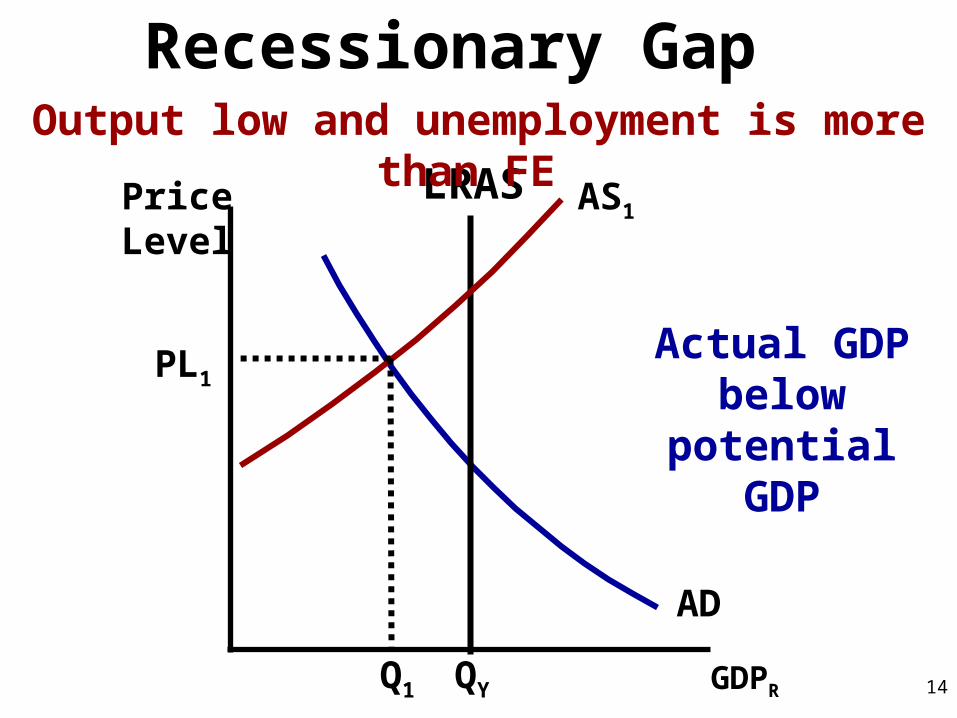
Recessionary Gap
Output low and unemployment is more than FE
Actual GDP below potential
GDP
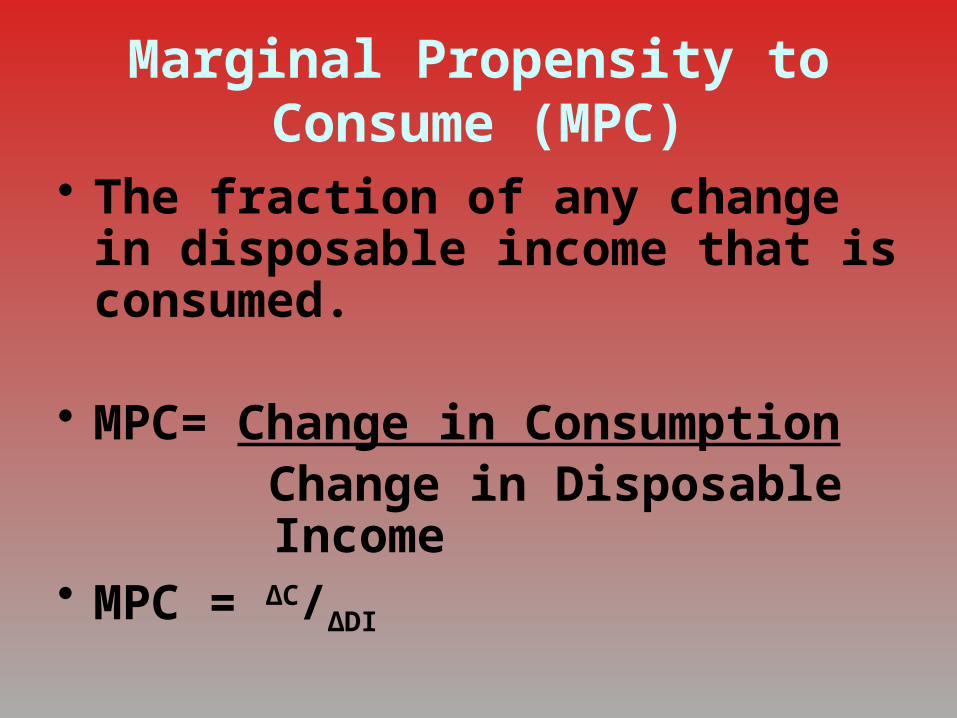
Marginal Propensity to Consume (MPC)
• The fraction of any change in disposable income that is consumed.
• MPC= Change in Consumption
Change in Disposable Income
• MPC = ΔC/ΔDI
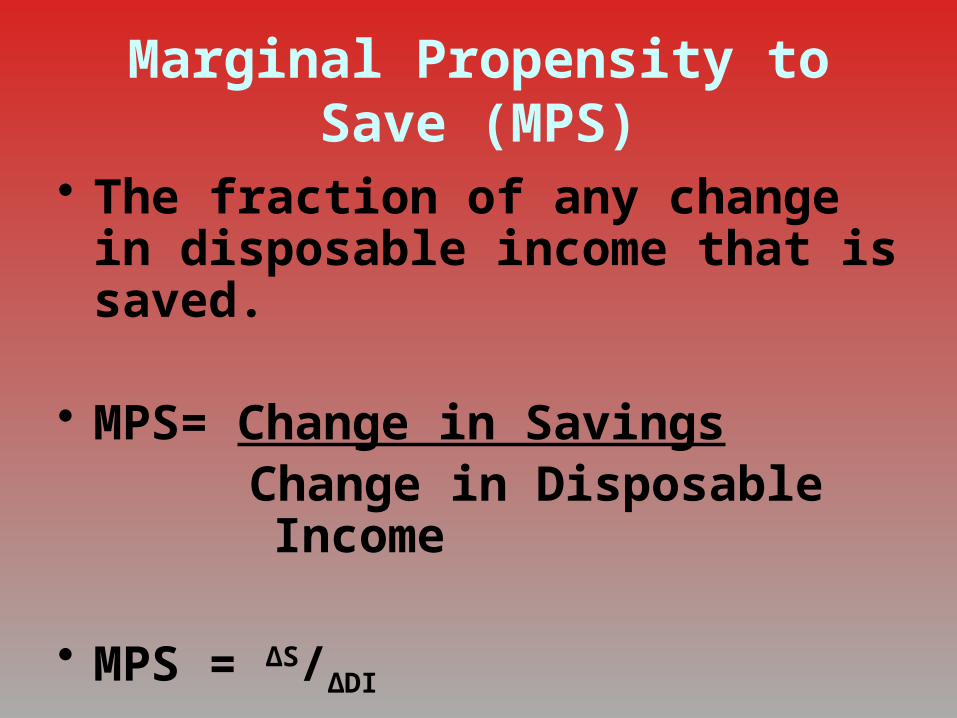
Marginal Propensity to Save (MPS)
• The fraction of any change in disposable income that is saved.
• MPS= Change in SavingsChange in Disposable Income
• MPS = ΔS/ΔDI
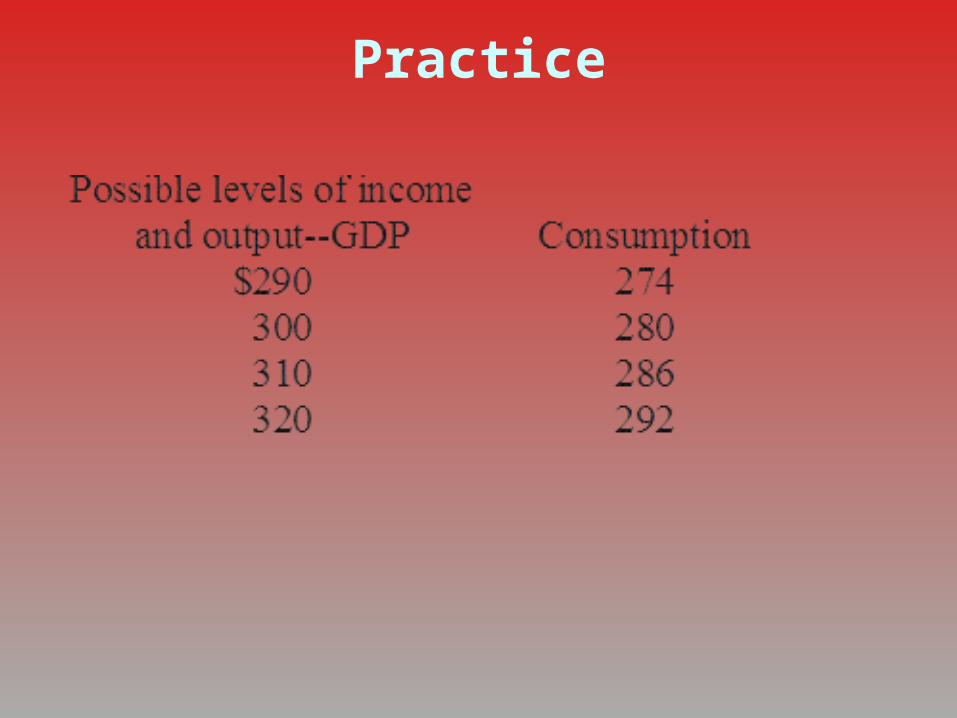
Practice
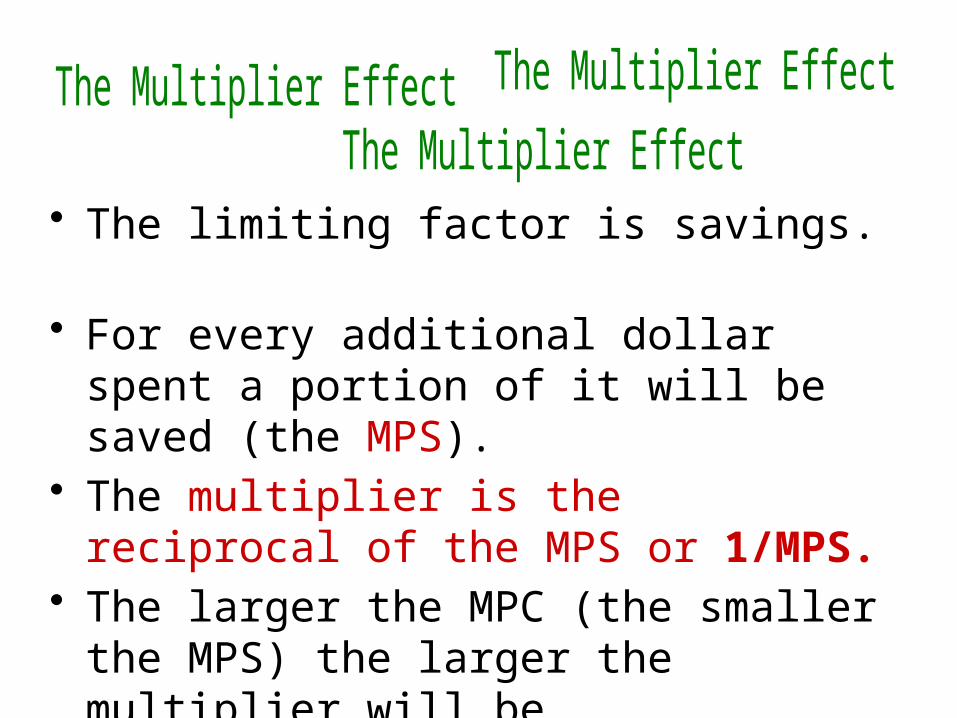
• The limiting factor is savings. • For every additional dollar spent a portion
of it will be saved (the MPS). • The multiplier is the reciprocal of the MPS
or 1/MPS.• The larger the MPC (the smaller the MPS)
the larger the multiplier will be.
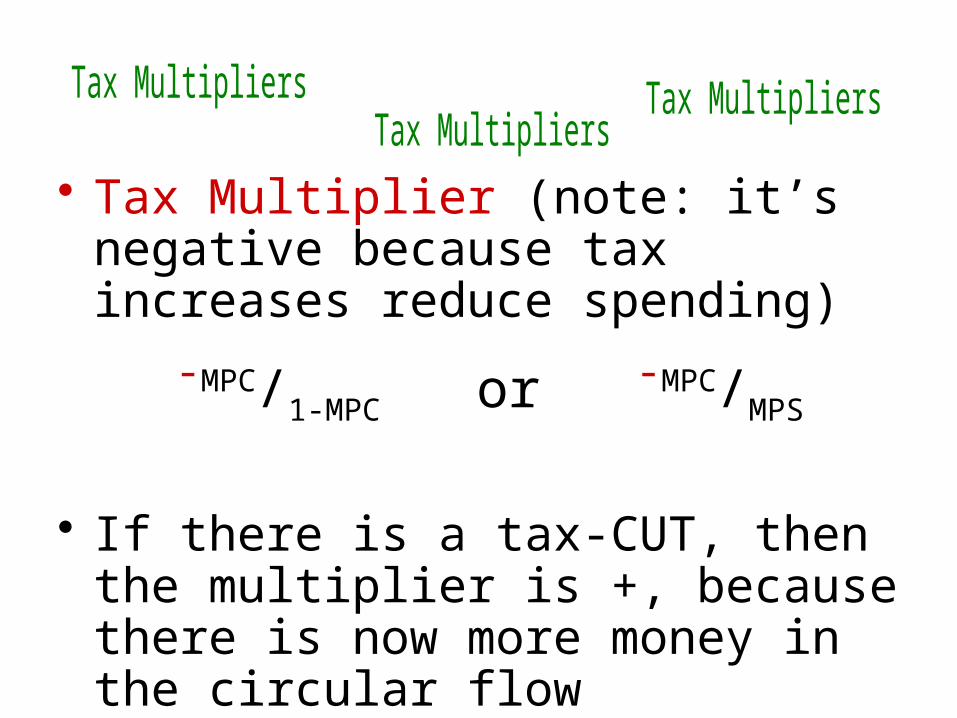
• Tax Multiplier (note: it’s negative because tax increases reduce spending)
-MPC/1-MPC or -MPC/MPS
• If there is a tax-CUT, then the multiplier is +, because there is now more money in the circular flow
Keynesian
Government Spending during a recession or depression and can improve an economy by injecting money into households.
Recessions are inevitable. Many government programs like Social
Security, Medicare, Unemployment, and Welfare were begun as Keynesian economic stimulus.
Aggregate Demand must be stimulated in order to recover from a recession.

Classical
Free Markets will lead to full employment Keynesian Economics causes price
bubbles, (inflation.) When the bubbles break, a recession
(hangover) incurs. The booms and busts of the business
cycle are natural and are self-correcting. Competition is the invisible hand Government should be limited to
preventing monopolies or unions
Monetary
A non-political agency can regulate banks, the money supply, and interest rates. It will be especially effective when painful and unpopular decisions need to be made and will make them in a timely manner. This can be the central banking system.
During recessions, impact the overall investment demand through tools that increase the incentive to borrow. This will be lower interest rates.
During inflation, impact the overall investment demand through tools that decrease the incentive to borrow. This will be higher interest rates.