Embed Size (px)
Citation preview
Macroeconomics
What is Macroeconomics?Important Macro VariablesWhat is GDP?Macroeconomic Policy
What is Macroeconomics?
Microeconomics – studies individual markets and industries. “How to divide up Pie”
Macroeconomics – studies the general conditions of the overall economy. “Size of the Pie”
Macroeconomics involves aggregation – adding up parts of economy to get whole picture.
Example: National Crime Index
Serious Crime (violent + property) per 100,000 people:
1992: 5,700
1998: 4,600
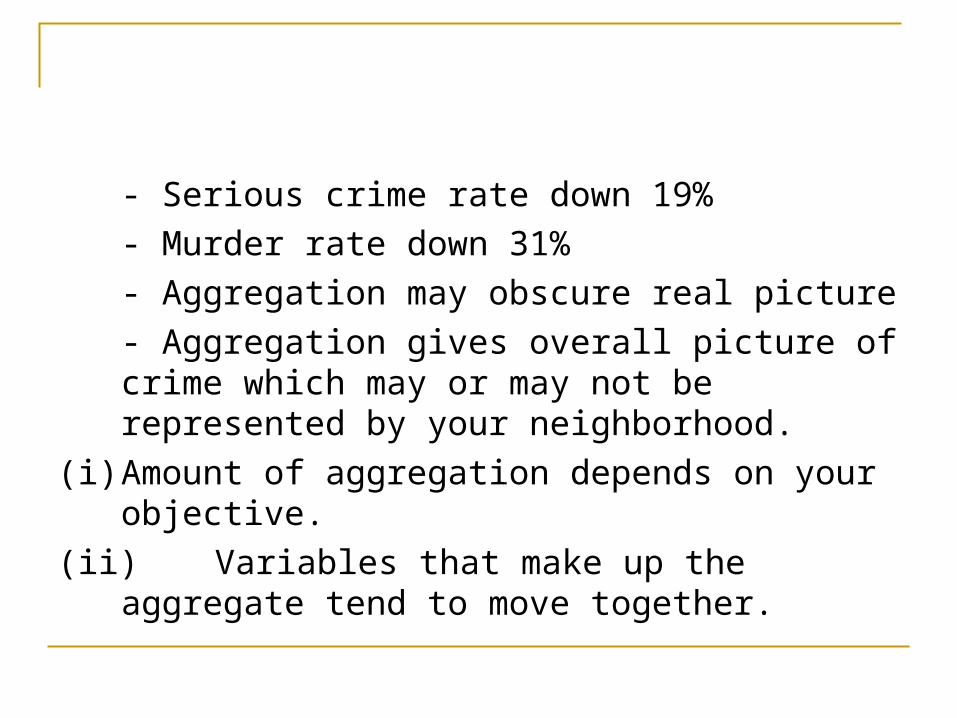
- Serious crime rate down 19%
- Murder rate down 31%
- Aggregation may obscure real picture
- Aggregation gives overall picture of crime which may or may not be represented by your neighborhood.
(i) Amount of aggregation depends on your objective.
(ii) Variables that make up the aggregate tend to move together.
Important Macroeconomic Variables(1) National Output – How much total output
a country produces over a period of time (GDP).
U.S. GDP for 2005 is $11.8 Trillion
($11,800,000,000,000)
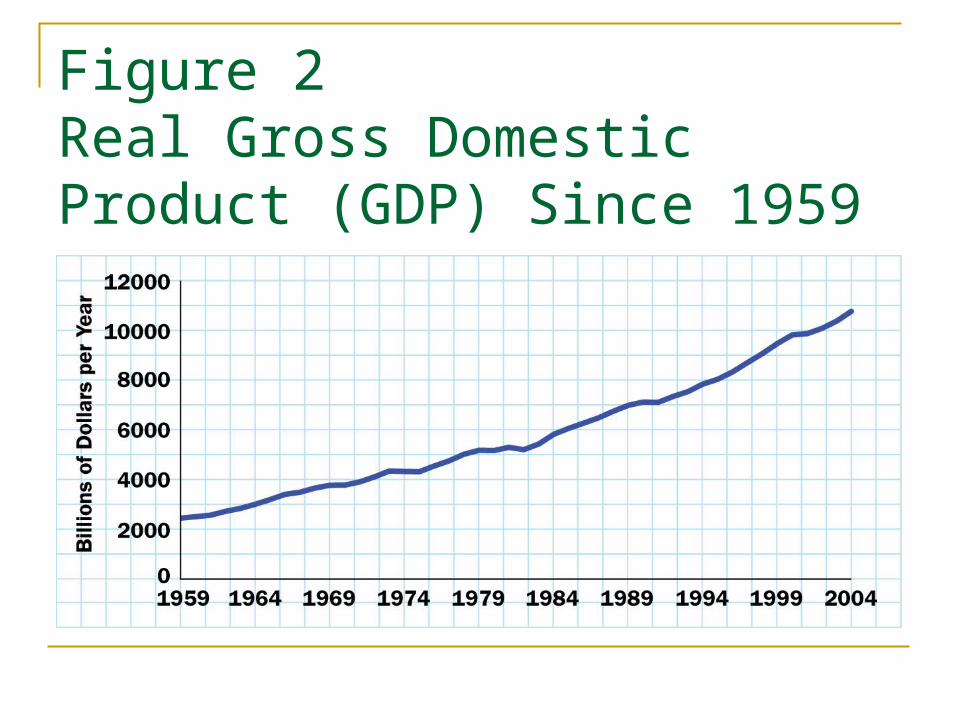
Figure 2 Real Gross Domestic Product (GDP) Since 1959
A Growing Economy… U.S. GDP 4.4 times larger in 2004 versus 1959 U.S. GDP per capita is 2.7 times larger
But with Bumps along the WayGrowth is irregular from year to year
Periods of boom and bust (recession) known as business cycles or economic fluctuations.
GDP is produced from labor (“who”) and capital (“what”).
Labor – measured in number of workers or total hours worked
Capital – the value of productive assets used by businesses to produce goods and services.
(2) Unemployment Rate – fraction of all people who are willing and able to work who don’t have jobs.
U.S. Unemployment Rate is 4.7%
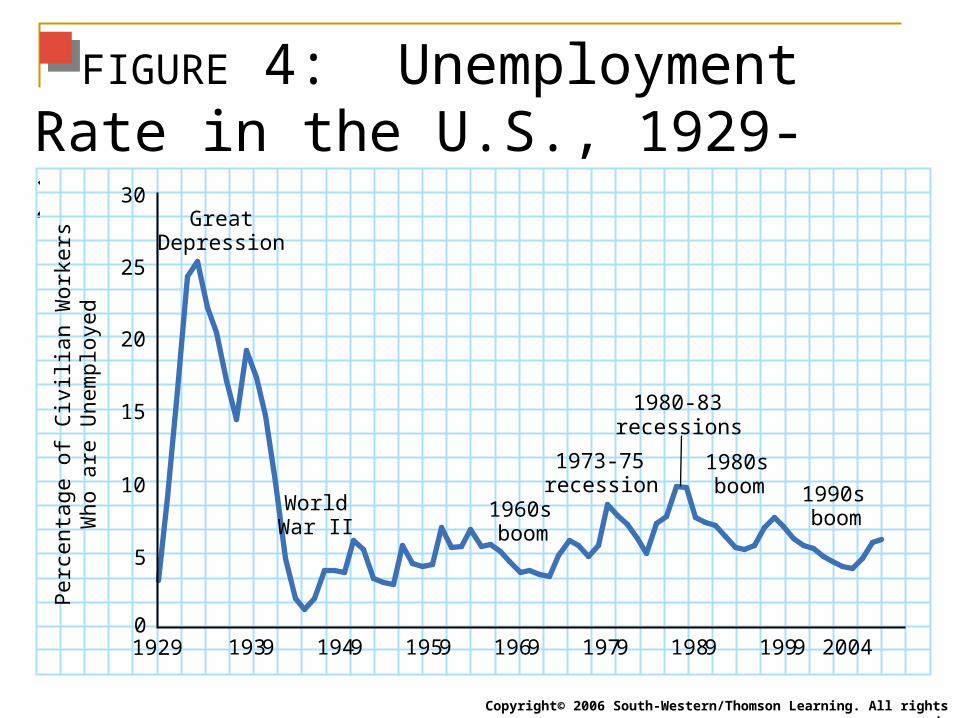
FIGURE 4: Unemployment Rate in the U.S., 1929-2004
Copyright© 2006 South-Western/Thomson Learning. All rights reserved.
5
10
15
20
25
30
01929 1939 1949 1959 1969 1979 1989 1999 2004
GreatDepression
WorldWar II
1960sboom
1973-75recession
1980-83recessions
1980sboom 1990s
boom
Perc
enta
ge o
f C
ivili
an W
ork
ers
Who a
re U
nem
plo
yed
Inflation Rate – the rate of increase of overall (economy-wide) prices.
U.S. inflation rate in 2005 is around 3.8%
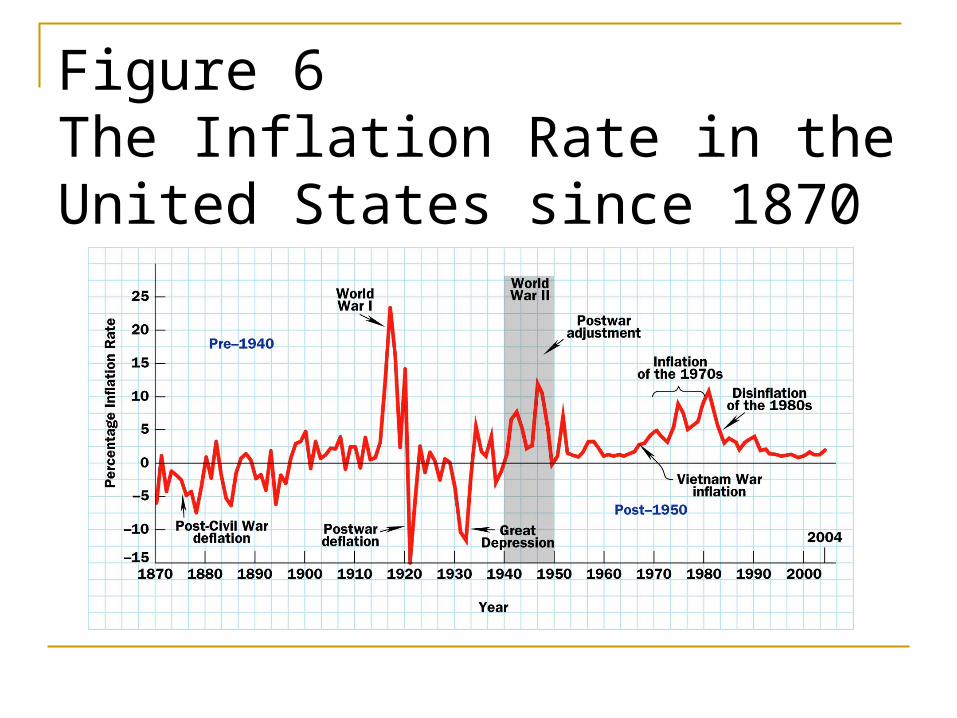
Figure 6 The Inflation Rate in the United States since 1870
Structure of the American Economy A Private Enterprise Economy
Most production completed by private enterprises in free markets
Gross Domestic Product (GDP): standard measure of the economy’s output
Government spending accounts for about 18 percent of GDP.
Circular Flow of Goods and Money Households (Consumers):
Supplies Labor and CapitalReceives Goods and ServicesEarns and Spends Income
Businesses:Receives Capital and LaborProduces Goods and ServicesEarns sales receipts and pays for capital and labor.
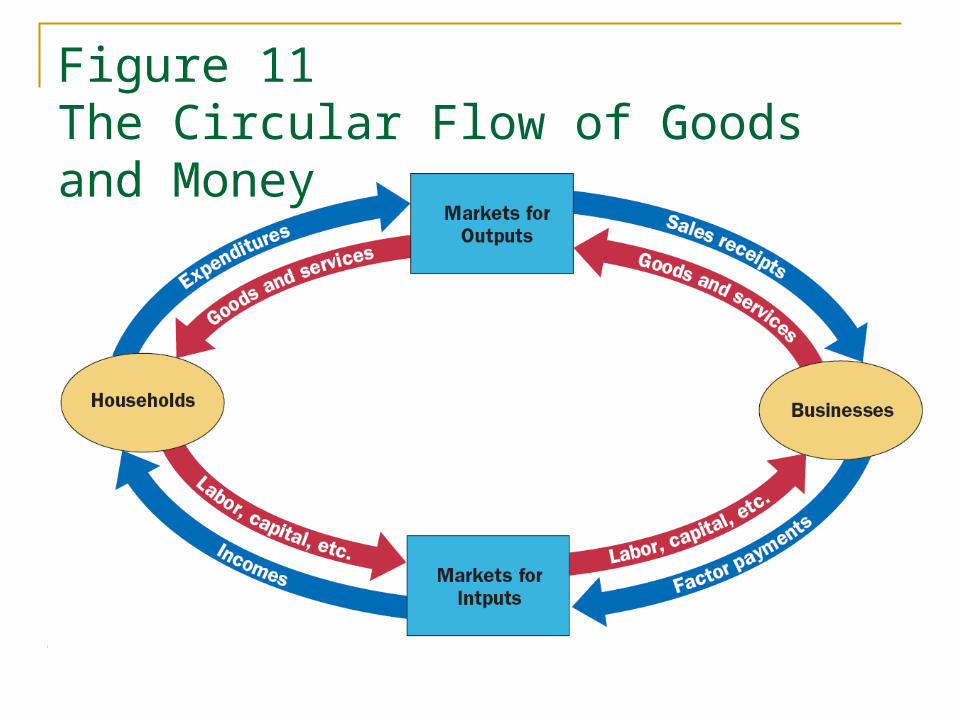
Figure 11 The Circular Flow of Goods and Money
What’s Missing from the Picture? Government The Government as a Referee
Enforce laws and act as an arbitrator
The Government as Business Regulator Government activity designed to improve
market activity Antitrust laws Environmental regulation
What’s Missing from the Picture? Government Government Expenditures
Government spending on Pensions and income security programs
(Social Security and unemployment compensation
Health-care expenditures (Medicare and Medicaid)
National defense Interest on national debt
Taxes in America By international standards, Americans pay a small
share of income to taxes
The Government as a Redistributor Socialist idea – equal distribution of income
overrides the decision of the market Liberal idea – use progressive taxes and transfer
payments to reduce income inequality
GDP: What It Is and What It’s Not Gross Domestic Product (GDP) is the total market
(dollar) value of all final goods and services currently and domestically produced within a period of time (e.g., a year).
(1) Production
(2) Market Value
(3) Final goods
(4) Current
(5) Domestic
Income-Output-Expenditures Identity
GDP = Y = Total Output = Total Income
= Total Expenditures
Is that Real??
GDP and other economic quantities are usually expressed as
(i) Nominal - quantities measured in current prices or current dollars (nominal GDP is sometimes called money GDP)
(ii) Real - quantities measured at fixed prices or constant dollars.
Nominal = (prices)x(quantities)
Real = quantities Examples:Apples
Movie Box Office Sales Changes in real GDP measures the overall
change in national production.
Shortcomings of GDP
GDP is not necessarily a perfect indicator of the well-being of a nation.
(1) Includes Only Market Activities
(2) No Value for Leisure
(3) Some “Goods” are also “Bads”
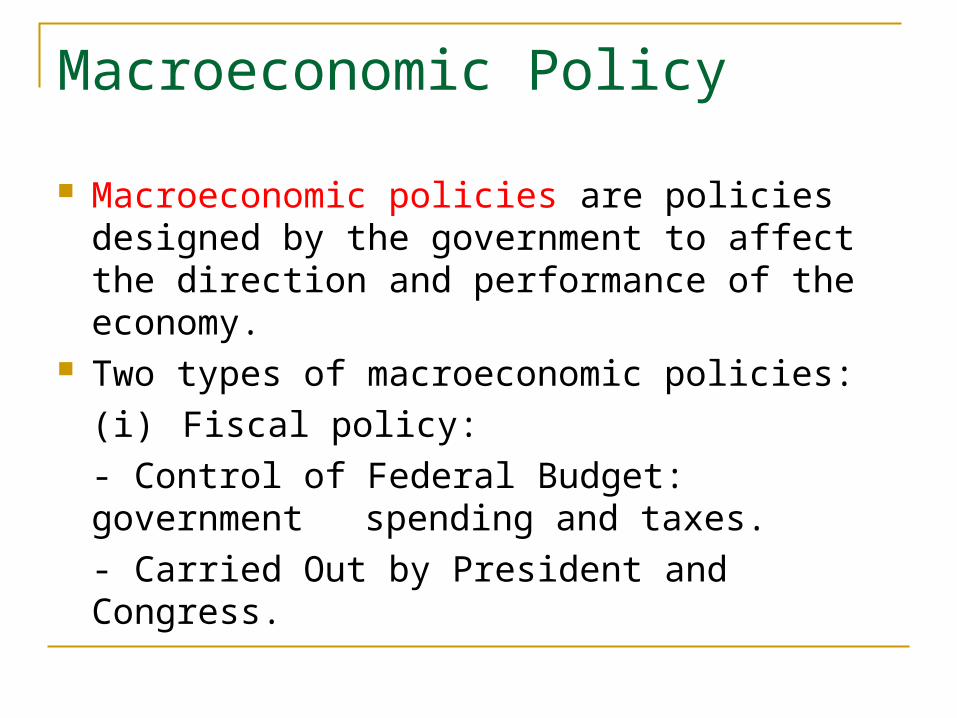
Macroeconomic Policy
Macroeconomic policies are policies designed by the government to affect the direction and performance of the economy.
Two types of macroeconomic policies:
(i) Fiscal policy:
- Control of Federal Budget: government spending and taxes.
- Carried Out by President and Congress.
(ii) Monetary policy:
- Control of the Nation’s Money Supply
- Carried out by the Federal Reserve System
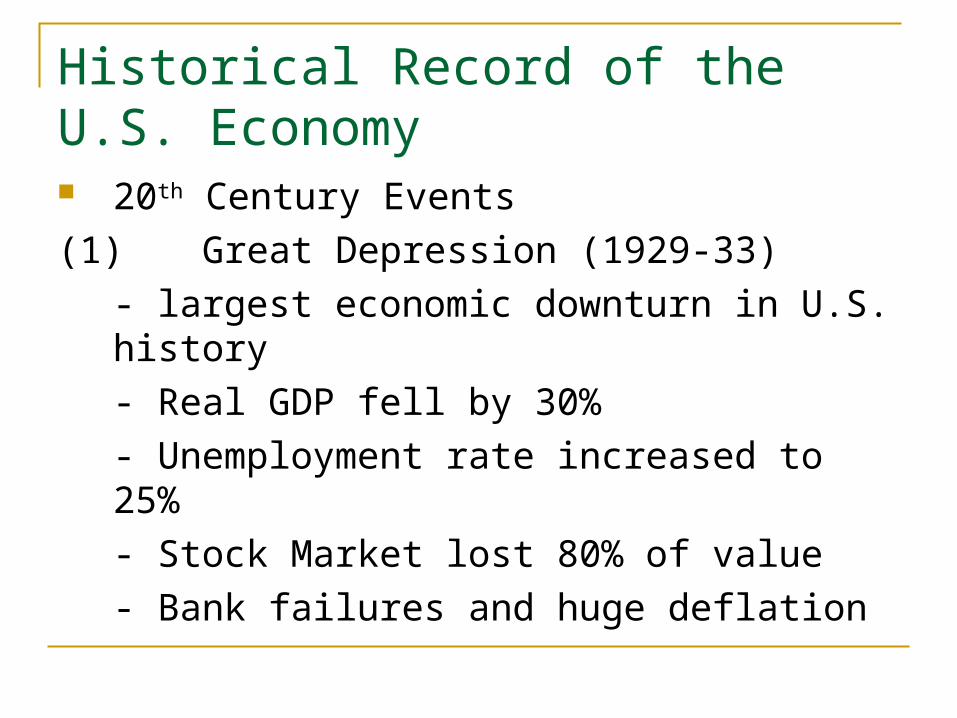
Historical Record of the U.S. Economy 20th Century Events
(1) Great Depression (1929-33)
- largest economic downturn in U.S. history
- Real GDP fell by 30%
- Unemployment rate increased to 25%
- Stock Market lost 80% of value
- Bank failures and huge deflation
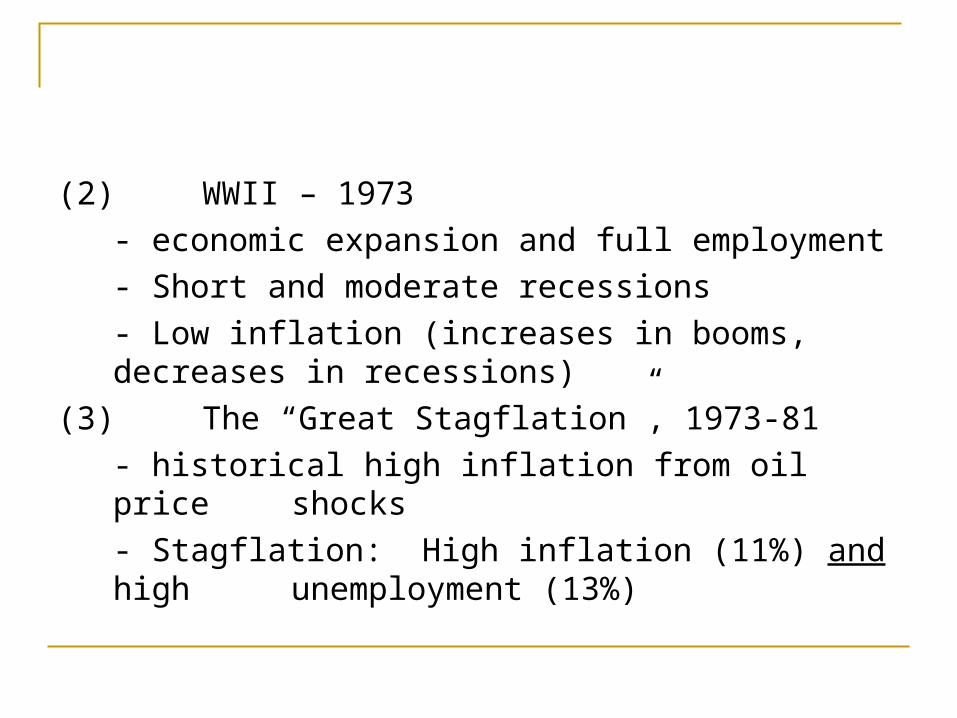
(2) WWII – 1973
- economic expansion and full employment
- Short and moderate recessions
- Low inflation (increases in booms, decreases in recessions)
(3) The “Great Stagflation”, 1973-81
- historical high inflation from oil price shocks
- Stagflation: High inflation (11%) and high unemployment (13%)
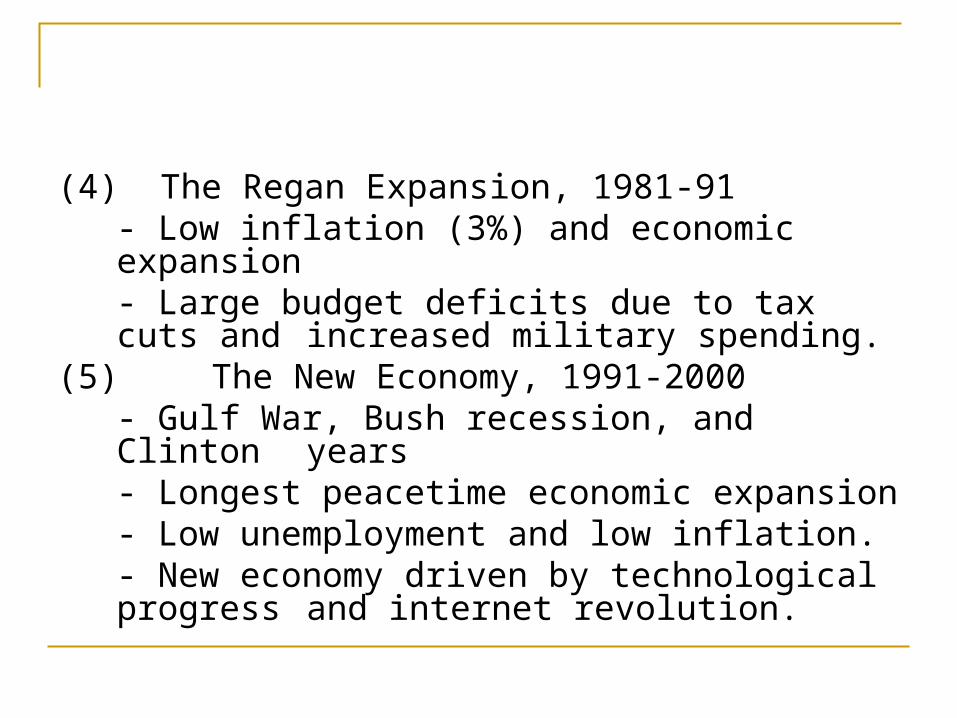
(4) The Regan Expansion, 1981-91- Low inflation (3%) and economic
expansion- Large budget deficits due to tax cuts and
increased military spending.(5) The New Economy, 1991-2000
- Gulf War, Bush recession, and Clinton years
- Longest peacetime economic expansion- Low unemployment and low inflation.- New economy driven by technological
progress and internet revolution.
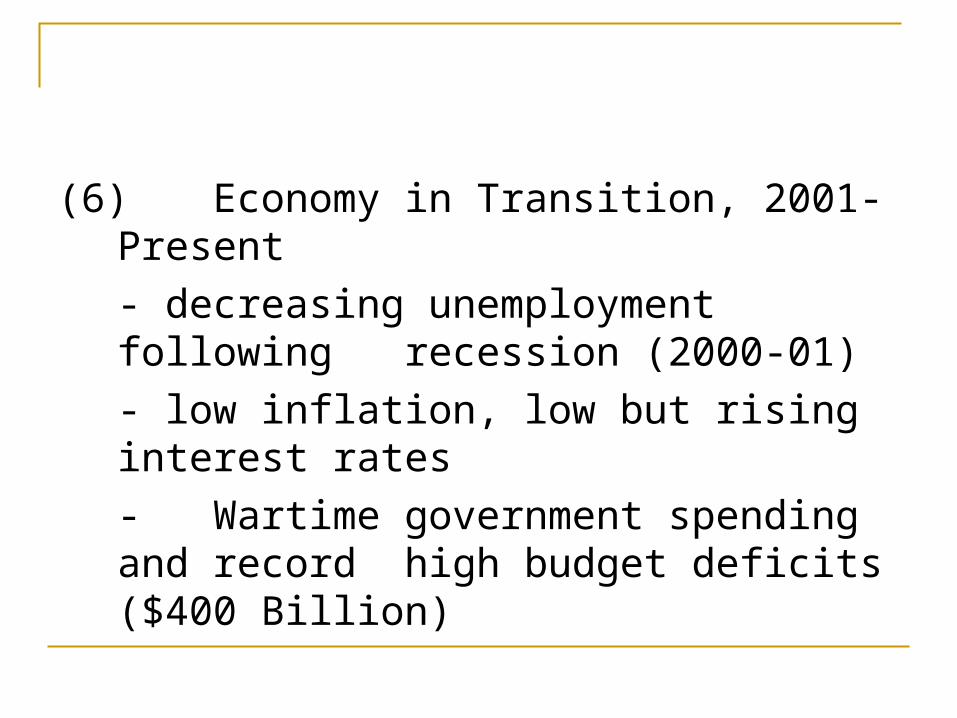
(6) Economy in Transition, 2001-Present
- decreasing unemployment following recession (2000-01)
- low inflation, low but rising interest rates
- Wartime government spending and record high budget deficits ($400 Billion)
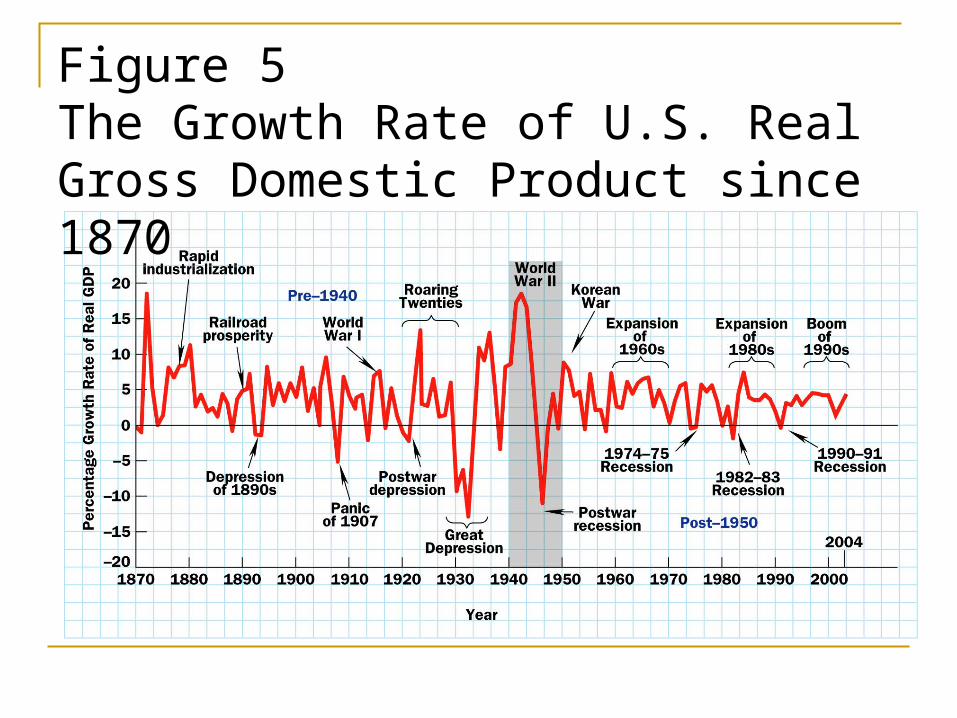
Figure 5 The Growth Rate of U.S. Real Gross Domestic Product since 1870

Figure 6 The Inflation Rate in the United States since 1870
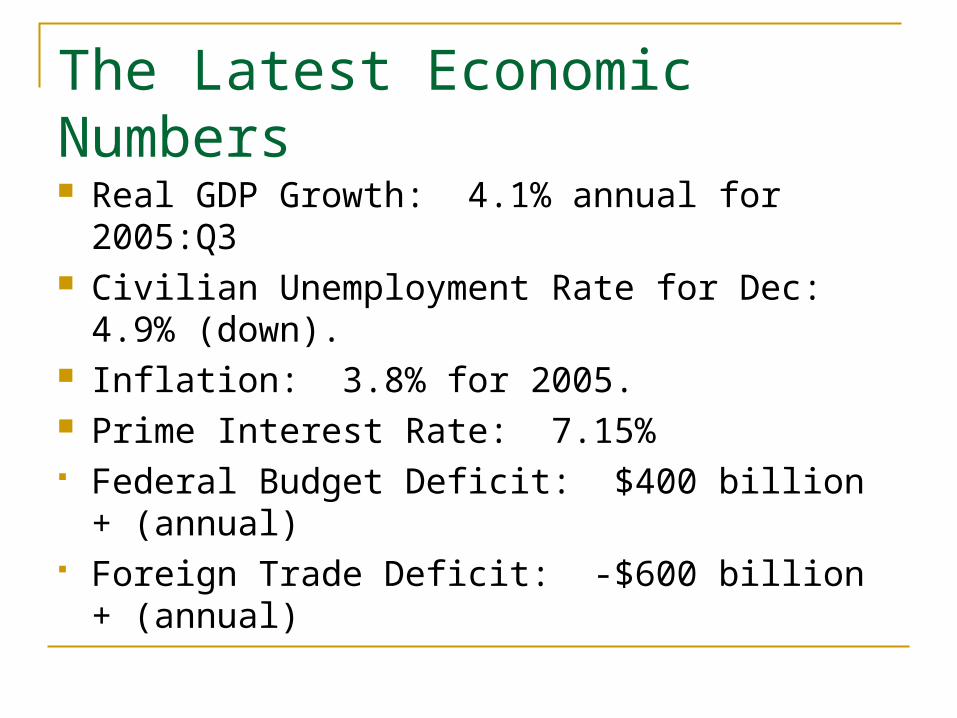
The Latest Economic Numbers Real GDP Growth: 4.1% annual for 2005:Q3 Civilian Unemployment Rate for Dec: 4.9%
(down). Inflation: 3.8% for 2005. Prime Interest Rate: 7.15% Federal Budget Deficit: $400 billion + (annual) Foreign Trade Deficit: -$600 billion + (annual)