Embed Size (px)
DESCRIPTION
Unit 3 Markets: not just for fleas and stocks!. Specialization and Voluntary Exchange. Specialization. Specialization : people/companies learn and practice a small set of skills then work with others with different skills to produce something The assembly line idea. - PowerPoint PPT Presentation
Citation preview

Unit 3 Markets: not just for
fleas and stocks!

Specialization and Voluntary Exchange

Specialization Specialization: people/companies learn and
practice a small set of skills then work with others with different skills to produce something The assembly line idea

Why does specialization work?
Skills are developed at a deeper level people become “experts” in their field
Costs are cut because time needed to produce is decreased
Training can be more focused and in-depth
Remember: People, Stores & industries specialize

Examples of specialization
Doctors – cardiologists, dermatologists, dentists, podiatrists, rhinologists

Examples of specialization
Teachers – grade level, subject, coaches
Stores at the mall – food court, hats, electronics, shoes, clothes
Write two examples of specialization in each of these areas: Restaurant Movie Courts

How does specialization relate to voluntary exchange?
Because we specialize, we rely on others for the things we don’t produce
In an exchange, BOTH sides are looking to gain something
BOTH sides gain in VOLUNTARY, NON-FRAUDULENT EXCHANGE

How does each side gain in these potential transactions?
LAWYER

Circular Flow

GPS
SSEMI1 The student will describe how households, businesses, and governments are interdependent and interact through flows of goods, services, and money.
Illustrate by means of a circular flow diagram, the Product market; the Resource market; the real flow of goods and services between and among businesses, households, and government; and the flow of money.
Explain the role of money and how it facilitates exchange.

Components of the circular flow
Product market Factor (resource) market Households Businesses Government Money Goods/services Resources

GOVERNMENT
Taxes Taxes
Goods and Services

Explaining the Circular Flow diagram Imagine a family wants to have some popcorn to eat
during movie night. The family would be represented by the “Households” box on the left. Rather than do everything themselves to produce the popcorn someone in the household will just go to a grocery store and buy the popcorn. The grocery store is the “Product Market,” where people pay money (“Expenditures”) to get the goods they need (“Products” like popcorn).
Where did the family get the money to pay for the popcorn? Very likely, someone worked at a job in return for a salary. In the diagram, the working family member of the household provided labor (a “Productive Resource”) at a “Factor Market” (also called a “Resource Market”) in return for “Income,” or money.
Explaining the Circular Flow diagram (continued) That explains the left side of the diagram, showing how the family
demanded popcorn and then acquired it. The right side of the diagram shows how the popcorn was supplied. To be a successful popcorn “Business,” a company must secure kernels of corn; these are the primary “Resource” needed to produce popcorn. In the diagram, the “Resource” can be paid for by “Wages, Interest, Net Profit.” This just illustrates that there is a variety of ways a business can pay for its resources. If the popcorn company owns its own farm, it would pay “Wages” to its employees to harvest the “Resource.” If it doesn’t own its own farm, it might pay money (“Net Profit”) to some independent farmer in order to purchase corn, its “Resource.”
Once the business has its kernels of corn, it’s time to package them and prepare them for sale in the grocery store. These bags of popcorn are the “Goods” that travel to the “Product Market.” Of course, the popcorn company doesn’t give its popcorn away; the grocery store must pay the popcorn maker money, which is shown as the “Revenue” arrow.

Supply and Demand
GPS
SSEMI2 The student will explain how the Law of Demand, the Law of Supply, prices, and profits work to determine production and distribution in a market economy.
Define the Law of Supply and the Law of Demand.
Describe the role of buyers and sellers in determining market clearing price.

Demand
amount of a good or service that consumers are willing and able to purchase at various prices
this can be represented by a graph or by a table
DIFFERENT THAN QUANTITY DEMANDED QUANTITY DEMANDED – amount a consumer is
willing and able to purchase at a SPECIFIC price

Demand Graph
Demand line = D Essential components
Y axis = prices of good X axis = quantity of good
AXES MATTER! Demand line = D
At $2, there is a QUANTITY DEMANDED of 5
Price (P)
Quantity (Q)
D
$2
5

Law of Demand THERE IS AN INVERSE RELATIONSHIP
BETWEEN PRICE and QUANTITY DEMANDED
Why? the more expensive something becomes, the more
likely people are to find a substitute diminishing marginal utility

The demand curve shows the amount of goods or services that buyers are able and willing to purchase at different prices.

Supply amount of a good or service that producers
are willing and able to sell at various prices this can be represented by a graph or by a table
DIFFERENT THAN QUANTITY SUPPLIED QUANTITY SUPPLIED – amount a producer is
willing and able to sell at a SPECIFIC price

Supply Graph Essential components
Y axis = prices of good X axis = quantity of good Supply line = S At a price of $2, there is a
QUANTITY SUPPLIED of 3 Supply line = S
Price (P)
Quantity (Q)
S
$2
3

Law of Supply THERE IS A DIRECT RELATIONSHIP
BETWEEN PRICE AND QUANTITY SUPPLIED
Why? the higher the price, the more likely the chance for
a greater profit to be made

The graph shows the firm’s supply, the quantity of goods or services that someone is able and willing to supply at different prices.

PriceIF ALL THAT CHANGES IS PRICE,
then ONLY QUANTITY DEMANDED or SUPPLIED CHANGES!!!!!!!!
Q2
P
QD
P1
Q1
P2

Supply and Demand

Explaining Supply and Demand
At equilibrium, the demand exactly equals supply, which is why P is called the equilibrium price and Q is called the equilibrium quantity. If a firm produces Q* at a price of P*, they should be able to sell all that they make. This is very efficient, and efficiency is good for a business.
Equilibrium price is also called market clearing price

GPS
SSEMI2 The student will explain how the Law of Demand, the Law of Supply, prices, and profits work to determine production and distribution in a market economy.
Define the Law of Supply and the Law of Demand. Describe the role of buyers and sellers in
determining market clearing price. Illustrate on a graph how supply and demand
determine equilibrium price and quantity. Explain how prices serve as incentives in a market
economy.

GPS
SSEMI3 The student will explain how markets, prices, and competition influence economic behavior.
Identify and illustrate on a graph factors that cause changes in market supply and demand.
Explain and illustrate on a graph how price floors create surpluses and price ceilings create shortages.
Define price elasticity of demand and supply.

DEMAND SHIFTS (IRDL)
P
QD
$200
150
Market for Diamond Rings
Assume that a diamond ring costs $200
At $200 buyers are buying around 100 a day
If the price were $100, buyers would be buying 150 a day
What happens if people’s income doubles?
100
$100 Now, at $200, people want
150 rings. What about at $100?
Will people want more or less?
D2

Determinants of Demand (Things that shift the entire line!)(*All statements work in reverse as well!)
R
IPEN
elated goods (Complements and Substitutes)•Complements – if price of complement increases, demand for the other good decreases•Substitutes – if price of substitute increases, demand for other good increases.
ncome – income increases, demand increases
references – preferences increase, demand increases
xpectations – expect higher prices in future, current …. demand increasesumber of buyers – # of buyers increase, demand increases

Shifting Demand (RIPEN) not price

Determinants of Supply (Entire Line)
G
R
E
N
T
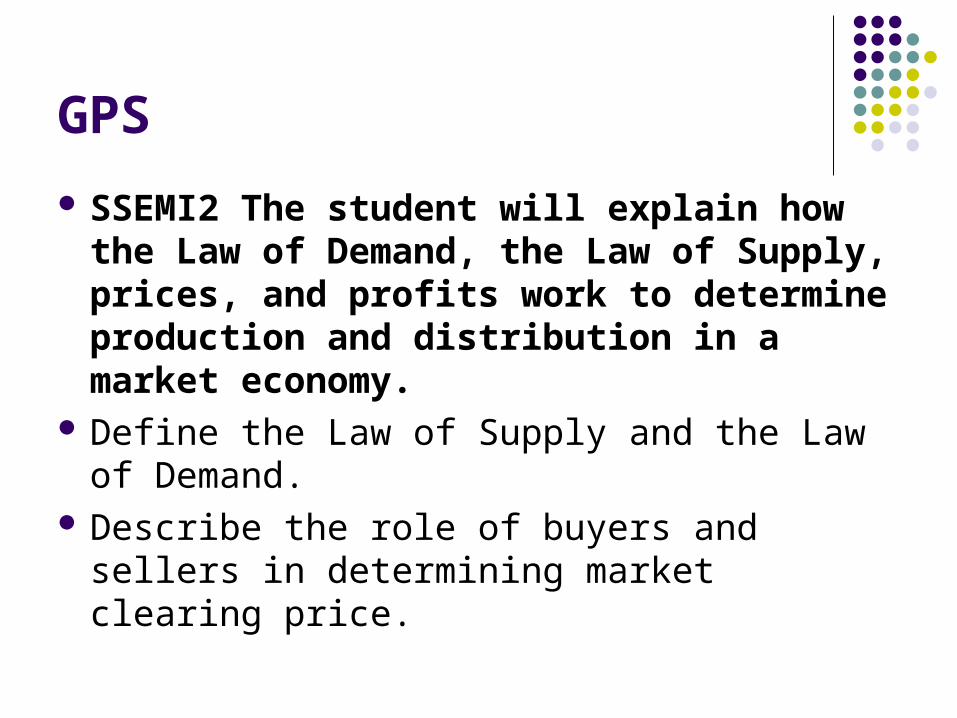
overnment decisions•Taxes – taxes increase, supply decreases•Subsidies – subsidies increase, supply increases•Regulation – regulations increase, supply decreases
esource prices or availability -
*prices have an inverse relationship,
*availability has a direct relationship
echnology or training – direct relationship to supply
xpectations – expect to sell more, supply increases; expect to sell at higher prices, immediate supply decreases.
umber of producers – direct relationship to supply
Shifting Supply (GRENT) not price

Price ceilings lead to shortages This figure illustrates the shortage that occurs when a price ceiling is
imposed on suppliers. Consumers demand QD while Suppliers are only willing to supply QS.

Price Floors lead to surpluses:Market for Wheat

Why does a price floor lead to a surplus?
“Price Floors in Wheat Markets” shows the market for wheat. Suppose the government sets the price of wheat at PF. Notice that PF is above the equilibrium price of PE. At PF, we read over to the demand curve to find that the quantity of wheat that buyers will be willing and able to purchase is W1 bushels. Reading over to the supply curve, we find that sellers will offer W2 bushels of wheat at the price floor of PF. Because PF is above the equilibrium price, there is a surplus of wheat equal to (W2 − W1) bushels. The surplus persists because the government does not allow the price to fall.

Define Price elasticity
economists occasionally talk about price elasticity. Elasticity refers to the percentage change in quantity divided by the percentage change in price, and it can refer to both supply and demand. The main idea is to track how much a change in price affects a change in quantity, and vice versa.

Illustration of inelastic demand

Explanation for case 1
In Case 1, price increases greatly, from P1 to P2. However, consumers still desire the good provided, so while quantity demanded is diminished, it is only a small drop from Q1 to Q2. As the change in price is greater than the change in quantity demanded, the demand curve for this good is said to be inelastic.

Illustration of elastic demand

Explanation for case 2
A small change in price in Case 2 leads to a great decrease in the quantity demanded. Since this good is very sensitive to changes in price, this good has a demand curve that is elastic.

Elasticity in supply curves work under the same principle as elasticity in demand curves. In Case 1, a larger change in price leads to a smaller change in quantity, so the supply curve in Case 1 is inelastic. In Case 2, a smaller change in price leads to a greater change in quantity, showing that the supply curve in Case 2 is price elastic.

Market Structures

GPS
SSEMI4 The student will explain the organization and role of business and analyze the four types of market structures in the U.S. economy.
Identify the basic characteristics of monopoly, oligopoly, monopolistic competition, and pure competition.

Competitive MarketsCompetitive Markets

2 Major Types of Competitive 2 Major Types of Competitive MarketsMarkets
Pure CompetitionPure Competition
Monopolistic CompetitionMonopolistic Competition

PURE COMPETITIONPURE COMPETITION
No single buyer or seller controls supply, No single buyer or seller controls supply, demand, or pricesdemand, or prices
There are 4 conditions for PCThere are 4 conditions for PC Many Buyers and SellersMany Buyers and Sellers Identical ProductsIdentical Products Informed BuyersInformed Buyers Easy Market Entry and ExitEasy Market Entry and Exit

1. Many Buyers/Sellers1. Many Buyers/Sellers
Each company or producer accounts for a Each company or producer accounts for a small portion of goodssmall portion of goods
Everyone acts INDEPENDENTLY, little or no Everyone acts INDEPENDENTLY, little or no teamwork among competitorsteamwork among competitors

2. Identical Products2. Identical Products
Buyers choose goods almost SOLELY Buyers choose goods almost SOLELY based on price, not qualitybased on price, not quality
Consumers are highly informed about Consumers are highly informed about productproduct

3. Informed Buyers3. Informed Buyers
Buyers will decide if prices Buyers will decide if prices are acceptableare acceptable
This is possible because all This is possible because all the products are nearly the products are nearly identicalidentical Offers Offers easy comparison easy comparison
between competitorsbetween competitors

4. Easy Market Entry4. Easy Market Entry
Extremely easy to enter the market and make Extremely easy to enter the market and make a profita profit Low start-up costs, few regulationsLow start-up costs, few regulations
Easy to switch between goods if you’re Easy to switch between goods if you’re already in the marketalready in the market

Real World PC?Real World PC?
Pure Competition is a Pure Competition is a modelmodel AGRICULTURE is closest to pure AGRICULTURE is closest to pure
competitioncompetition Many farmers, food is very similar, buyers Many farmers, food is very similar, buyers
are informedare informed Commodities also are close Commodities also are close
Gold, silver, dairy, etcGold, silver, dairy, etc

MONOPOLISTIC MONOPOLISTIC COMPETITIONCOMPETITION
Similar to pure competition in some areasSimilar to pure competition in some areas Many producersMany producers Fairly easy to enter market Fairly easy to enter market
Primary difference between pure competition Primary difference between pure competition is sellers try to DIFFERENTIATE their is sellers try to DIFFERENTIATE their products through advertisingproducts through advertising

Monopolistic Competition Monopolistic Competition (cont’d)(cont’d)
Competition based on things other than priceCompetition based on things other than price Quality, size, perks, color…Quality, size, perks, color… Advertising differences is keyAdvertising differences is key

Differences other than Price

Differences other than Price

What are these companies selling?


Problem with ProfitsProblem with Profits MC and PC face problem of non-sustainable profitsMC and PC face problem of non-sustainable profits
2 major problems2 major problems 1. No real control over price1. No real control over price
If price goes too high, consumers purchase from If price goes too high, consumers purchase from someone elsesomeone else
If profits are extremely large, other firms enter the If profits are extremely large, other firms enter the industry because it’s easy to get inindustry because it’s easy to get in
2. In MC, advertising constantly changes the 2. In MC, advertising constantly changes the playing fieldplaying field Consumers change back and forth from one brand to Consumers change back and forth from one brand to
another based on their preferencesanother based on their preferences SHORT RUN profits are possible with differentiationSHORT RUN profits are possible with differentiation

Journal #?Journal #?
Identify 3 different Identify 3 different categoriescategories of goods of goods (shoes, hamburgers, etc)(shoes, hamburgers, etc) For each category of good, identify 3 different For each category of good, identify 3 different
brandsbrands Explain what each brand has that the other two Explain what each brand has that the other two
don’t havedon’t have

Imperfect Competition

Imperfectly Competitive Markets
- Unlike competitive markets, firms in imperfectly competitive markets may be able to set prices or production
- 2 types: Oligopoly and Monopoly

3 Conditions for Oligopoly
1. Few LARGE sellers- top 3-4 companies/sellers handle 75% of
demand
2. Identical or VERY similar products - producers less willing to take chances
3. Difficult market entry- Large firms have already paid start-up costs

Oligopolies at Work
Typically try to use non-price competition T.V. Stations, Cars, Movie studios

Oligopolies At Work
INTERdependent pricing Firms set prices based on other
firms Price leaders: largest seller sets a
price and others follow

Oligopolies at Work
Collusion: when the major sellers set a price or production level Typically the price is above
equilibrium, but there are no cheaper substitutes

Oligopolies at Work
Cartels: an open form of collusion where production levels or prices are announced OPEC or DeBeers Usually short-lived because of
greed/self-interest

3 Conditions for Monopolies
1. Single Seller Total control of production and price setting
2. No reasonable substitutes Forces demand for good, even if prices are too
high 3. Difficult or Impossible Market Entry
Too high start-up costs or too technical field

Examples of Monopolies or near Monopolies
•Standard Oil, broken up in 1911
NFL – Convicted of being an illegal monopoly in 1980
•Currently under investigation.
•Potentially trying to form a monopoly in the Used Video Game market.
• Claiming ebay/amazon as competition
•Had competition from Livenation, but are currently under negotiations to buy Livenation

Not all Monopolies are “bad”
•Fayette county water authority is a “natural monopoly”
•The costs to society of having another competitor are too great
•The cost to build more rail lines would be tremendous just for someone to make a little bit of profit

Why not charge outrageous prices?
1. Consumer Demand: Increase in price of too much would cause demand of zero
2. Potential Competition: Startup costs are extremely high, but if prices got high enough, entrepreneurs would have incentive to enter
3. Government Regulation

Business Organizations

GPS
SSEMI4 The student will explain the organization and role of business and analyze the four types of market structures in the U.S. economy.
Compare and contrast three forms of business organization—sole proprietorship, partnership, and corporation.

Business Organizations
3 basic business structures Sole Proprietorship – one person owns/manages Partnership – 2 or a small group Corporation – a group of shareholders
Each has various costs and benefits All types must deal with 4 general issues
Liability, life expectancy, financial options, and taxes

Sole Proprietorships
Advantages Low start-up costs Keeps all profits Full control Can respond to market
quickly Easy to discontinue
Disadvantages 100% Owner liability
Legal, debt, taxes, etc
Life expectancy of company
Limited access to resources

Partnerships
Advantages Low startup costs Take advantage of
specialization Larger pool of capital
Disadvantages Potential for conflict Unlimited liability
General partnership vs. limited liability

Corporations
Advantages Limited liability Much larger pool of
capital Take advantage of
specialization Prestige
Disadvantages Difficulty of startup
corporate charter, stocks
Double taxation The corporation is a
SEPARATE individual from the people who run it.
Loss of control More regulation

0
5000
10000
15000
20000
25000
Total receipts (inbillions)
# of firms (inthousands)
Non farmproprietorships
Partnerships
Corporations
What’s On the Test Specialization/Voluntary
Exchange Why do people trade? Why do we specialize?
Circular Flow Which direction do the arrows
flow? What are the components?
Market Structures What are the characteristics of
the 4? How does each structure
affect prices/profits? Business Organizations
Pros/Cons of each type of Organization
Supply/Demand How are prices set in a
market? Law of Supply/Law of
Demand RIPEN/GRENT What happens to
equilibrium price/quantity when supply/demand shift
Price Floors/Ceilings

Sample Questions for Unit 3
A corporation MOST often seeks to increase its profit and expand the size of its operations by
A issuing stock
B joining an oligopoly
C becoming a monopoly
D controlling the money supply

Answer to sample question
Answer: A Standard: Types of businesses and market structures
Choices B and C are types of market structures and have no relationship to strategies that a corporation can use to increase its profit or size of operation. A corporation cannot control the money supply, choice D. The Federal Reserve controls the money supply. Choice A is the correct answer.

Organizers of many high-interest sporting events such as the Super Bowl and the World Series usually set ticket prices lower than the equilibrium price, citing fairness to the public as their reason. What names do economists give to the resulting set price and disequilibrium situation?
A price ceiling; surplusB price ceiling; shortageC price floor; shortageD price floor; surplus

Answer to sample question
Answer: B Standard: Markets and prices Setting ticket prices below the equilibrium
price creates a price ceiling. This eliminates choices C and D. Price ceilings create a shortage of a good, so choice B is the correct answer.

In the graph below, lines D and S1 show the demand and supply schedules for the Anaxos Fruit Shake company in its last month of operation.

Anaxos just upgraded its capital equipment by buying a machine that makes fruit shakes faster and cheaperthan the original machine. What effect should this have on the graph?
Price Quantity
A Rises Rises
B Drops Rises
C Rises Drops
D Drops Drops

Answer to sample question
1. Answer: B Standard: The laws of supply and demand
The new machine makes shakes faster and cheaper. This allows the supplier to reduce the price, which eliminates choices A and C. Since the price is lower, the number produced can increase to meet the demand (on the same curve). This eliminates choice D. Therefore the correct answer is choice B.

Use the graph to answer the question.

When the income in households increases, what is the likely result?
A The supply curve will shift to the left.
B The supply curve will become vertical.
C The demand curve will shift to the left.
D The demand curve will shift to the right.

Answer to sample question
Answer: D Standard: Markets and prices Houses can be considered normal goods, since people tend to increase their consumption of housing (by buying a bigger house) as their income increases. In the short term, this increased demand will lead the demand curve to move to the right, so the answer is choice D.