Embed Size (px)
Citation preview

ARTICLE IN PRESS
Journal of Solid State Chemistry 182 (2009) 2510–2520
Contents lists available at ScienceDirect
Journal of Solid State Chemistry
0022-45
doi:10.1
� Corr
E-m
journal homepage: www.elsevier.com/locate/jssc
Uniform AMoO4:Ln (A ¼ Sr2+, Ba2+; Ln ¼ Eu3+, Tb3+) submicron particles:Solvothermal synthesis and luminescent properties
Piaoping Yang a, Chunxia Li b, Wenxin Wang a, Zewei Quan b, Shili Gai a, Jun Lin b,�
a College of Material Science and Chemical Engineering, Harbin Engineering University, Harbin 150001, PR Chinab State Key Laboratory of Rare Earth Resource Utilization, Changchun Institute of Applied Chemistry, Chinese Academy of Sciences, Changchun 130022, PR China
a r t i c l e i n f o
Article history:
Received 16 April 2009
Received in revised form
1 July 2009
Accepted 6 July 2009Available online 25 July 2009
Keywords:
Solvothermal synthesis
Luminescence
BaMoO4
SrMoO4
96/$ - see front matter & 2009 Elsevier Inc. A
016/j.jssc.2009.07.009
esponding author. Fax: +86 43185698401.
ail address: [email protected] (J. Lin).
a b s t r a c t
Rare-earth ions (Eu3+, Tb3+) doped AMoO4 (A ¼ Sr, Ba) particles with uniform morphologies were
successfully prepared through a facile solvothermal process using ethylene glycol (EG) as protecting
agent. X-ray diffraction (XRD), scanning electron microscopy (SEM), transmission electron microscopy
(TEM), X-ray photoelectron spectra (XPS), Fourier transform infrared spectroscopy (FT-IR), photo-
luminescence (PL) spectra and the kinetic decays were performed to characterize these samples. The
XRD results reveal that all the doped samples are of high purity and crystallinity and assigned to the
tetragonal scheelite-type structure of the AMoO4 phase. It has been shown that the as-synthesized
SrMoO4:Ln and BaMoO4:Ln samples show respective uniform peanut-like and oval morphologies with
narrow size distribution. The possible growth process of the AMoO4:Ln has been investigated in detail.
The EG/H2O volume ratio, reaction temperature and time have obvious effect on the morphologies and
sizes of the as-synthesized products. Upon excitation by ultraviolet radiation, the AMoO4:Eu3+
phosphors show the characteristic 5D0–7F1–4 emission lines of Eu3+, while the AMoO4:Tb3+ phosphors
exhibit the characteristic 5D4–7F3–6 emission lines of Tb3+. These phosphors exhibit potential
applications in the fields of fluorescent lamps and light emitting diodes (LEDs).
& 2009 Elsevier Inc. All rights reserved.
1. Introduction
During the past decades, self-assembled micrometer-sizedinorganic materials with special size, morphology, and hierarchywere of special interest in the areas of materials synthesis anddevice fabrication due to their hierarchical and repetitive super-structures, which show potential applications in wide fields ofcrystals, catalysis, diagnostics, and pharmacology [1–8]. Consider-able efforts have been devoted to the synthesis of two-dimen-sional (2-D) and three-dimensional (3-D) microscale particleswith well-controlled morphology and architectures for revealingtheir morphology-dependent properties and for achieving theirpromising applications, because of their unique optical, electronic,magnetic, and mechanical properties [9–13]. 3-D hierarchicalparticles have attracted special attention because of the practicalimportance related to some fractal growth process. In most cases,the formation of 3-D hierarchical particles may result from theevolution of 1-D primary crystals via an oriented routine or a self-assembly process, which results in the formation of anisotropicshapes arising from the blocking or retarding of growth along oneor more directions through selective adhesion [14–19]. Further-more, because the physicochemical properties of crystals depend
ll rights reserved.
not only on their chemical composition but also on themorphology and size, controllable synthesis of high-orderedstructures then is very intriguing. So far, various approaches havebeen employed to control the shape and size of the products, suchas template methods [20,21], vapor transport and condensation[22], Langmuir–Blodgett technology [23,24], chemical vapordeposition (CVD) [25], and electrodeposition method [26].
Metal molybdates of relatively large bivalent cations (AMoO4,ionic radius 40.99 A, A ¼ Ca, Ba, Sr) mainly exist in a scheelite-type tetragonal structure form, where the molybdenum atomadopts tetrahedral coordination [27]. Recently, metal molybdatessuch as SrMoO4 and BaMoO4 have been extensively studied orreviewed due to their luminescent behavior and structuralproperties, which have potential application as electro-opticaldevice, solid-state laser, photoluminescence device, scintillators,acousto-optic filter, and stimulated Raman scattering materials[28–37]. Flux method [38], Czochralski technique [39], floatingzone-like technique [40], co-precipitation process [41], citratecomplex method [42], hydrothermal technique [43,44], andsolvothermal routines [45–47] have been employed to preparemolybdates. Among all these methods, surfactant-assisted micro-emulsion-mediated solvothermal process has proved an efficientapproach to synthesize inorganic materials with interestingmorphologies and regular particle sizes. However, in the reversemicelles and microemulsion process, the introduction of tem-plates or substrates usually results in heterogeneous impurities,

ARTICLE IN PRESS
P. Yang et al. / Journal of Solid State Chemistry 182 (2009) 2510–2520 2511
which increases the production cost for further treatment, leadingto the difficulty for scale-up production. Thus, the seeking of facileprocess for the synthesis of inorganic materials with controllablefeatures without using the surfactants should be of significantpromise.
Furthermore, many rare-earth ions (Eu3+, Tb3+) doped schee-lite-related molybdates have been reported and have broad andintense absorption bands due to charge transfer (CT) from oxygento metal in the near-UV region [48,49]. It is shown thatCaMoO4:Eu3+ can be effectively excited by near-UV LEDs(380–410 nm), and then emits bright red fluorescence (5D0–7F2).Therefore, rare-earth-ions-doped molybdates should be potentialmaterials for LED applications. To the best of our knowledge, thesolvothermal process using ethylene glycol (EG) as reaction mediafor the synthesis of the rare-earth-ions-doped molybdates with-out further heat treatment has never been reported. Herein, afacile solvothermal process using EG as protective agent withouttemplates was proposed for the synthesis of rare-earth ion (Eu3+,Tb3+)-doped molybdates particles with uniform morphology andnarrow size distribution. The obtained samples were wellcharacterized by means of XRD, FESEM, TEM, XPS, IR, opticalspectra as well as the kinetic decay times. A possible growthprocess for the micro-sized particles has also been investigated.
1042
040
433
2
400
217
00822
4
220
213
(c)
2θ (degree)
114
316
20831
2
11620
4
20220
0
004
112
101
Inte
nsity
(a. u
.)
(b)
(a)
20 30 40 50 60 70 80
Fig. 1. XRD patterns of the as-synthesized SrMoO4:Eu3+ (a), SrMoO4:Tb3+ (b), and
the standard data for bulk SrMoO4 (JCPDS 08–0482) (c).
Table 1Unit-cell parameters and the deviations for the as-synthesized SrMoO4:Eu3+,
SrMoO4:Tb3+, BaMoO4:Eu3+, and BaMoO4:Tb3+ samples.
Samples a, b (A)/ c (A)/ Unit cell volume3
Crystal
2. Experimental section
2.1. Synthesis of SrMoO4:Eu3+, SrMoO4:Tb3+, BaMoO4:Eu3+, and
BaMoO4: Tb3+
All the reagents for synthesis including ethylene glycol (EG)(A. R., Beijing Fine Chemical Company), Sr(NO3)2 and Ba(NO3)2 (A.R., Beijing Chemical Regent Company), ammonium molybdate((NH4)6Mo7O24 � 4H2O) (A. R., Beijing Chemical Regent Company),Eu2O3, Tb4O7 (99.99%, Science and Technology Parent Company ofChangchun Institute of Applied Chemistry), HNO3 (A. R., BeijingBeihua Chemical Company) were used without further purifica-tion. The doping concentration of Eu3+ was 5 mol% to Sr3+ inSrMoO4:Eu3+. In a typical process, 0.0176 g (0.05 mmol) of Eu2O3
was dissolved in dilute HNO3 with stirring. The superfluous HNO3
was driven off until the pH value of the solution reached between2 and 3. The obtained Eu(NO3)3 crystal powders and 0.201 g(0.95 mmol) of Sr(NO3)2 were added into 20 mL of the mixedsolution of EG and water (volume ratio ¼ 37/3) under stirring.Another 20 mL of the same solution containing 0.176 g of(NH4)6Mo7O24 � 4H2O were added to the former solution. Afterfurther stirring for another 1 h, the resulting solution was thentransferred into a 50 mL sealed Teflon autoclave and staticallyheated at 160 1C for 8 h. After the autoclave was naturally cooledto room temperature, the final products were separated bycentrifugation, and washed several times with ethanol anddistilled water. Finally, the obtained samples were dried invacuum at 80 1C for 24 h. In this way, the Eu3+-doped SrMoO4
was obtained, which was designated as SrMoO4:Eu3+.SrMoO4:Tb3+ with the doping concentration of 5 mol% of Tb3+
and BaMoO4:Eu3+ (Tb3+) with the doping concentration of 5 mol%of Eu3+ (Tb3+) were prepared in the same process.
deviations deviations (A )/deviations size (nm)
JCPDS
08–0482
5.394 12.01 3.492
SrMoO4:Eu3+ 5.382/0.012 11.98/0.03 3.469/0.023 19
SrMoO4:Tb3+ 5.386/0.008 11.99/0.02 3.477/0.015 21
JCPDS
29–0193
5.580 12.821 3.992
BaMoO4:Eu3+ 5.567/0.013 12.790/0.031 3.964/0.028 23
BaMoO4:Tb3+ 5.570/0.010 12.801/0.02 3.979/0.013 25
2.2. Characterization
Powder XRD patterns were obtained on a Rigaku TR IIIdiffractometer with CuKa radiation (l ¼ 0.15405 nm). The accel-erating voltage and emission current are 40 kV and 200 mA,respectively. Fourier-Transform IR spectra were performed on aPerkin-Elmer 580B IR spectrophotometer using the KBr pellet
technique. Field emission scanning electron microscope (FESEM)images were inspected on an XL30 microscope (Philips) equippedwith an energy-dispersive X-ray spectrum (EDS, JEOL JXA-840).Transmission electron microscope (TEM) and high-resolutiontransmission electron microscope (HRTEM) images were carriedout on an FEI Tecnai G2 S-Twin with an acceleration voltage of200 kV. The samples used for TEM were prepared by dispersingsome products in ethanol, then placing a drop of the solution ontoa copper grid and letting the ethanol evaporate slowly in air. TheX-ray photoelectron spectra (XPS) were taken on a VG ESCALABMK II electron energy spectrometer using MgKa (1253.6 eV) as theX-ray excitation source. The doping concentrations of Eu3+ andTb3+ in the resulting materials were determined by InductivelyCoupled Plasma (ICP) (ICP–PLASMA 1000). The UV–vis excitationand emission spectra were recorded on a Hitachi F-4500 spectro-fluorimeter equipped with a 150 W xenon lamp as the excitationsource. Luminescence decay curves were obtained from a LecroyWave Runner 6100 Digital Oscilloscope (1 GHz) using a 250 nmlaser (pulse width ¼ 4 ns, gate ¼ 50 ns) as the excitation source(Continuum Sunlite OPO). All the measurements were performedat room temperature.
3. Results and discussion
3.1. Phase, composition and structure
The phase and the composition of the rare-earth-ions-dopedSrMoO4 samples were first examined by XRD, as shown in Fig. 1.The vertical bars (Fig. 1c) indicate a standard tetragonal bulkSrMoO4 peak position from the standard data (JCPDS 08–0482). It
ARTICLE IN PRESS
10
1110228
404
332400
00822
410
7220
213
105
21111
4
2θ (degree)
316
208
312
11620
4
20220
0
004
112
101
(c)
Inte
nsity
(a. u
.)
(b)
(a)
20 30 40 50 60 70 80
Fig. 2. XRD patterns of the as-synthesized BaMoO4:Eu3+ (a), BaMoO4:Tb3+ (b), and
the standard data for bulk BaMoO4 (JCPDS 29–0193) (c).
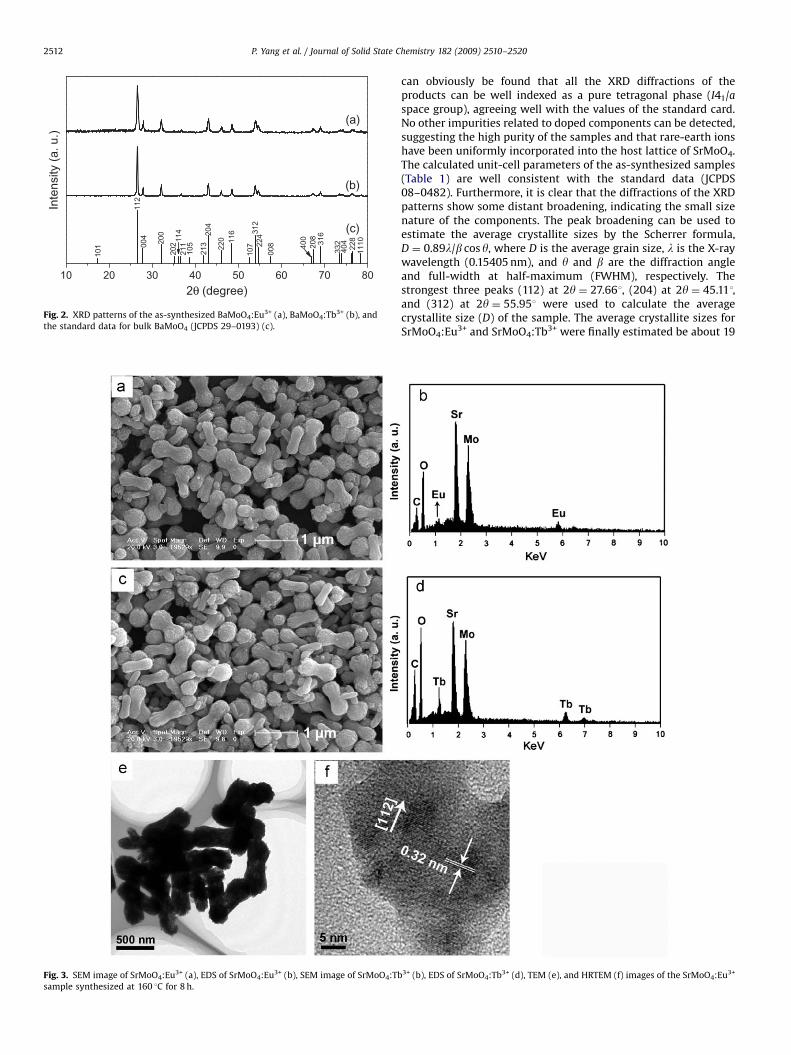
Fig. 3. SEM image of SrMoO4:Eu3+ (a), EDS of SrMoO4:Eu3+ (b), SEM image of SrMoO4:Tb
sample synthesized at 160 1C for 8 h.
P. Yang et al. / Journal of Solid State Chemistry 182 (2009) 2510–25202512
can obviously be found that all the XRD diffractions of theproducts can be well indexed as a pure tetragonal phase (I41/aspace group), agreeing well with the values of the standard card.No other impurities related to doped components can be detected,suggesting the high purity of the samples and that rare-earth ionshave been uniformly incorporated into the host lattice of SrMoO4.The calculated unit-cell parameters of the as-synthesized samples(Table 1) are well consistent with the standard data (JCPDS08–0482). Furthermore, it is clear that the diffractions of the XRDpatterns show some distant broadening, indicating the small sizenature of the components. The peak broadening can be used toestimate the average crystallite sizes by the Scherrer formula,D ¼ 0.89l/b cos y, where D is the average grain size, l is the X-raywavelength (0.15405 nm), and y and b are the diffraction angleand full-width at half-maximum (FWHM), respectively. Thestrongest three peaks (112) at 2y ¼ 27.661, (204) at 2y ¼ 45.111,and (312) at 2y ¼ 55.951 were used to calculate the averagecrystallite size (D) of the sample. The average crystallite sizes forSrMoO4:Eu3+ and SrMoO4:Tb3+ were finally estimated be about 19
3+ (b), EDS of SrMoO4:Tb3+ (d), TEM (e), and HRTEM (f) images of the SrMoO4:Eu3+

ARTICLE IN PRESS
P. Yang et al. / Journal of Solid State Chemistry 182 (2009) 2510–2520 2513
and 21 nm, as shown in Table 1. Moreover, the respective actualdoping concentrations of Eu3+ in SrMoO4:Eu3+ and of Tb3+ inSrMoO4:Tb3+ sample are 2.98 and 3.09 wt% as determined by theICP analysis, which are much closer to the stoichiometric values(3.03 wt% or 5 mol% to Sr2+ in SrMoO4:Eu3+ and 3.16 wt% or 5 mol%to Sr2+ in SrMoO4:Tb3+).
Fig. 2 gives the XRD patterns of rare-earth-ions-doped BaMoO4
samples and the standard data for the tetragonal BaMoO4,respectively. The diffraction peaks can be directly indexed to thetetragonal BaMoO4 in I41/a space group (JCPDS 29–0193). Thecalculated cell lattice constants summarized in Table 1 are in goodagreement with the standard values of pure BaMoO4, indicatingthe high purity and crystallinity of the as-synthesized samples.Moreover, the average crystallite sizes determined by the Scherrerformula are calculated to be 23 and 25 nm, respectively. Theactual doping concentrations of Eu3+ and Tb3+ in the dopedBaMoO4 products are 2.49 and 2.58 wt%, respectively, asdetermined by ICP analysis, which are similar to thestoichiometric values (2.54 and 2.66 wt% or 5 mol% to Ba2+ inBaMoO4:Eu3+ and BaMoO4:Tb3+).
Fig. 4. SEM image of BaMoO4:Eu3+ (a), EDS of BaMoO4:Eu3+ (b), SEM image of BaMoO4:T
sample synthesized at 160 1C for 8 h.
3.2. Morphology
The morphology and the microstructure details of the as-synthesized products were examined by SEM and TEM techni-ques. Fig. 3 shows the SEM images, EDS of SrMoO4:Eu3+ andSrMoO4:Tb3+, TEM and the HRTEM images of SrMoO4:Eu3+. Thelow-magnification SEM image (Fig. 3a and c) reveals that the twoas-synthesized products consist of exclusively peanut-likeparticles with relatively narrow size distribution, indicating thatthe doping components have little effect on the morphologicalfeatures of the samples. Additionally, the samples exhibitrelatively well-defined peanut-like crystals with diameter300–500 nm and length 800–1000 nm. Furthermore, it can beseen that the single peanut-like particle is actually composed ofnumerous small nanosized particles, which can be responsible forthe broadening of the XRD peaks. The EDS (Fig. 3b and d) of thesamples confirms the presence of strontium (Sr), molybdenum(Mo), oxygen (O), europium (Eu), and terbium (Tb) in the product(the carbon signal is from the carbon substrate). The approxi-mate surface composition extracted from the EDS analysis gives a
b3+ (c), EDS of BaMoO4:Tb3+ (d), TEM (e), and HRTEM (f) images of the BaMoO4:Eu3+

ARTICLE IN PRESS
C1s
Mo3
p
Inte
nsity
(a. u
.)
Eu3
d
O1sB
a2p
Mo3
d
1200
C1s
Mo3
p
Mo3
d
Inte
nsity
(a. u
.)
Binding energy (eV)
Eu3
d
O1s
Sr2
p
1000 800 600 400 200 0
1200Binding energy (eV)
1000 800 600 400 200 0
Fig. 5. XPS spectra for the as-synthesized SrMoO4:Eu3+ and BaMoO4:Eu3+
phosphors.
2921
1070
404
(b)
Tran
smitt
ance
(%)
(a)
3419
1631
OH
H2O
P. Yang et al. / Journal of Solid State Chemistry 182 (2009) 2510–25202514
Eu/Sr/Mo/O atomic ratio of 0.04:0.96:1:4.1, which is much closerto the ICP results. TEM investigations can provide further insightinto the morphology details and structural features of the peanut-like particles. The TEM image (Fig. 3e) of SrMoO4:Eu3+ exhibitsmuch similar morphological features provided by the SEManalysis. Furthermore, the lattice fringes in the HRTEM image(Fig. 3f) are obvious, revealing the high crystallinity of theproduct. The lattice fringes of (112) planes with an interplanardistance of 0.32 nm are marked by the arrows. The calculatedinterplanar distance between the adjacent lattice fringes agreeswell with the d112 spacing of the literature value (0.3222 nm)(JCPDS 08–0482). HRTEM investigation confirms the highcrystallinity and single-crystal nature of the product.
The typical SEM images, EDS of BaMoO4:Eu3+ and Ba-MoO4:Tb3+, TEM and the HRTEM images of BaMoO4:Eu3+ aredepicted in Fig. 4. It can be seen that the two samples arecomposed of uniform oval particles with the particle size of about1mm in length and 300–500 nm in width (Fig. 4a and c). Theseparticles are non-aggregated with narrow size distribution. TheSEM image also reveals that the big single particle actuallyconsists of many small nanoparticles, which results in thebroadening of the XRD patterns. In the EDS spectra (Fig. 4b andd), the signals of barium (Ba), molybdenum (Mo), oxygen (O),europium (Eu), and terbium (Tb) suggest the presence of thecorresponding element in the products (the carbon signal is due tothe carbon used). The EDS analysis gives the approximate surfacecomposition of 0.06/0.94/0.9/4.0 of Eu/Ba/Mo/O molar ratio in theas-synthesized product, agreeing well with the ICP results. TheTEM image (Fig. 4e) shows a morphology similar to that of theSEM result. In this HRTEM image (Fig. 4f), taken with the electronbeam perpendicular to the c-axis of the oval particle, theinterplanar distances between adjacent lattice fringes aredetermined as 0.34 nm, agreeing well with the d spacing value(0.3357 nm) of the (112) planes of tetragonal BaMoO4.
The surface components of SrMoO4:Eu3+ and BaMoO4:Eu3+
were further examined by the XPS analysis, as shown in Fig. 5. Inthe XPS spectrum of SrMoO4:Eu3+ (Fig. 5a), the binding energy(calibrated using C 1 s (284.7 eV) as the reference) of Mo (Mo2p3/2,415.1 eV; Mo2p1/2, 398 eV; 3d5/2, 232.5 eV; 3d3/2, 235.3 eV), Eu (3d,1132.9 eV), O (1s, 529.6 eV), and Sr (2p, 132.9 eV) can be obviouslyfound (the C signal is due to the carbon used as reference). Bycombining the XRD result, it can be deduced that these signals canbe attributed to SrMoO4:Eu3+. In the case of BaMoO4:Eu3+ (Fig.5b), in addition to the binding energies of Mo, O, and Eu, thebinding energies of Ba (Ba2p3/2, 778.1 eV; Ba2p1/2, 793.4 eV) areapparent.
Fig. 6 shows the FT-IR spectra of the as-synthesizedSrMoO4:Eu3+ and BaMoO4:Eu3+ particles synthesized at 160 1Cfor 8 h. It can be seen that the two samples have approximatevibration modes. The respective bands at 3419 and 1631 cm�1 canbe ascribed to O–H stretching vibration and H–O–H bendingvibration of physically absorbed water on the sample surface. Astrong absorption peak at 807 cm�1 can be assigned to n3 anti-symmetric stretching vibration originating from the Mo–Ostretching vibration in MoO4
2� tetrahedron [44,50]. And theweak adsorption peak at 404 cm�1 can be assigned to n2
bending vibration of Mo–O [44]. C–Hx bending vibration at2921 cm�1 can be detected, indicating the incomplete removalof the EG molecules from the surface of the samples.
807
Wavenumbers (cm-1)
05001000150020002500300035004000
Fig. 6. FT-IR spectra of the as-synthesized SrMoO4:Eu3+ and BaMoO4:Eu3+ samples
synthesized at 160 1C for 8 h.
3.3. The growth process and the factors influencing the formation of
the products
A proposed formation process is presented in Scheme 1.Typically, after the two solutions containing Sr(NO3)2 and

ARTICLE IN PRESS
P. Yang et al. / Journal of Solid State Chemistry 182 (2009) 2510–2520 2515
(NH4)6Mo7O24 � 4H2O were mixed together, amorphous SrMoO4
nuclei will form. When the water ratio in the media is very lowand the EG concentration is high enough, the low water content inthe media leads to the formation of numerous tiny dropletssurrounded by the protective agent. The amorphous fine particlesmay act as the precursor and the subsequent growth ofSrMoO4:Eu3+ nuclei is confined within the droplets.Consequently, the peanut-like SrMoO4:Eu3+ crystals wereformed by self-assembly through the further solvothermalprocess. The formation of BaMoO4:Tb3+ proceeds in a routinesimilar to that of SrMoO4:Eu3+ except for the oval morphology ofthe final product. In order to investigate the formation process,pure water was used as the reaction media for the synthesis of thesame product through a hydrothermal process. Ethylene glycol(EG) has been widely used as an effectively protective agent tocontrol the growth rate of the particles in the solvothermalprocess. Thus, the size and morphology of the final productsshould be much different when using different concentrations ofwater and EG in the reaction media. Fig. 7 shows the typical SEMimages of the as-synthesized SrMoO4:Eu3+ particles synthesizedwith EG/H2O volume ratios of 0 and 37/3, respectively. FE-SEMmicrographs obviously reveal that the SrMoO4:Eu3+ powderssynthesized at 160 1C for 8 h with EG/H2O volume ratio of 0(pure water) exhibit a large quantity of small particles withagglomerated and polydisperse features (Fig. 7a). This randomaggregation can be related to the increase of the effective collisionrates between the nano-scale particles by the hydrothermaltreatment without the protection of the EG molecules [51]. In
MoO42-
Mixture of solution
Sr2+
MoO42-
Eu3+ Sr2+
Amorphous nuclei
Formation of crystalby solvothermal treatment
Eu3+
SrMoO 4:Eu3+
EG
Scheme 1. Illustration for the formation process of SrMoO
the case of the sample synthesized with the EG/H2O volume ratioof 37/3, the high magnification image (Fig. 7b) indicates therelatively uniform peanut-like morphologies with the particle sizeof 800–1000 nm in length and 300–500 nm in width. It can beobviously seen that the large particles actually consist ofnumerous nanosized small particles. The adsorption/absorptionof a large amount of EG molecules on the surface of the smallparticles and the high collision rates promoted by thesolvothermal treatment favor the formation of the peanut-likemorphology. The results indicate that the volume ratio of EG/H2Oplay a key role in affecting the morphology and size of the finalproduct.
To further study the growth of SrMoO4:Eu3+ and BaMoO4:Tb3+
microcrystals in the solvothermal process, the products synthe-sized at different solvothermal times and temperatures wereinvestigated in detail using the FE-SEM technique. Fig. 8 showsthe SEM images of SrMoO4:Eu3+ synthesized at differenttemperatures of 140, 160, 180 and 200 1C for 8 h with the EG/H2O volume ratio of 37/3. Obviously, the particle size of thesamples shows a gradually increasing trend from 500 nm to 1mmin length with the increasing reaction time from 4 to 24 h, whilethe relatively uniform peanut-like morphology has beenmaintained. Of note is that when the reaction temperature isincreased to 200 1C, the microproducts did not have the exclusivepeanut-like morphology, and some nanoparticles with muchsmaller particle size are also found (Fig. 8d). The typical SEMimage of SrMoO4:Eu3+ synthesized at 160 1C for different reactiontimes is given in Fig. 9. An obvious growing process from the small
MoO42-
Mixture of solution
Ba2+
MoO42-
Tb3+ Ba2+
Amorphous nuclei
Formation of crystalby solvothermal treatment
Tb3+
BaMoO4:Tb3+
4:Eu3+ and BaMoO4:Tb3+ with different morphologies.

ARTICLE IN PRESS
Fig. 8. SEM images of the as-synthesized SrMoO4:Eu3+ particles synthesized at 140 1C (a), 160 1C (b), 180 1C (c), and 200 1C (d) for 8 h.
Fig. 7. SEM images of the as-synthesized SrMoO4:Eu3+ particles synthesized with EG/H2O volume ratio of 0 (a) and 37/3 (b) at 160 1C for 8 h.
P. Yang et al. / Journal of Solid State Chemistry 182 (2009) 2510–25202516
particle to the final larger products by self-assembly is found. Theresults suggest that the reaction temperature and time play animportant role in the morphology and size of the final product. Asimilar growth process has also been found for the formation ofBaMoO4:Tb3+ synthesized at different temperatures, except for theoval morphology of the products (Fig. 10).
3.4. Photoluminescence properties
The as-synthesized SrMoO4:Eu3+ and BaMoO4:Eu3+ particlesshow red emission under ultraviolet (254 nm) excitation, asshown in Fig. 11. The PL properties of the samples were furthercharacterized by the PL excitation and emission spectra (Fig. 11aand b). It can be seen that the two Eu3+-doped samples showmuch similar PL spectra. The excitation spectra were obtained bymonitoring the emission of the Eu3+ 5D0–7F2 transition at 612 nm.
It is obvious that all the spectra consist of a broad band with amaximum at about 270 nm and some weak peaks between 300and 500 nm. The broad band at 270 nm can be associated with theMoO4
2– groups [52]. The weak peaks within the Eu3+ 4f6
configuration can be assigned to 7F0-5D4 (367 nm), 7F0-
5L6
(396 nm) and 7F0-5D2 (469 nm) [53]. Upon excitation into the
MoO42– groups at 270 nm, not only the characteristic transition
lines from the lowest excited 5D0 but also those from higherenergy levels (5D1) with weak intensities can be found (Fig. 11aand b, right) (the locations of the emission lines together withtheir assignments are labeled as well) [54]. The emission of Eu3+ isdominated by the red 5D0–7F2 hypersensitive transition.
As shown in Fig. 11, the as-synthesized SrMoO4:Tb3+ andBaMoO4:Tb3+ particles show green emission under short ultra-violet (254 nm) excitation. Fig. 11(c and d) depicts the PLexcitation and emission spectra of the SrMoO4:Tb3+ and Ba-MoO4:Tb3+ particles, respectively. The two samples also show

ARTICLE IN PRESS
Fig. 10. SEM images of the as-synthesized BaMoO4:Eu3+ particles synthesized at 160 1C for 4 h (a), 8 h (b), 12 (c), and 24 (h).
Fig. 9. SEM images of the as-synthesized SrMoO4:Eu3+ particles synthesized at 160 1C for 4 h (a), 8 h (b), 12 (c), and 24 (h).
P. Yang et al. / Journal of Solid State Chemistry 182 (2009) 2510–2520 2517
much similar emission features except for a slight difference inthe intensities. In the excitation spectra monitored by theemission of the Tb3+ 5D4–7F5 transition at 544 nm, a broad bandfrom 200 to 400 nm with a maximum at 258 nm can be observed,which can be ascribed to the charge-transfer transitions within
the MoO42� groups [52]. The f–f transitions within the Tb3+ 4f8
configuration can hardly be detected due to their weaker intensitywith respect to that of MoO4
2�, revealing the efficient energytransfer from MoO4
2� to Tb3+. Upon excitation into the MoO42� at
258 nm, the characteristic transition lines from the excited 5D4

ARTICLE IN PRESS
200 300 400 500 600 700
469
396
Inte
nsity
(a. u
.)
Wavelength (nm)
270
MoO42-
538 5
D1-7 F 1
590 5
D0-
7 F 161
2 5 D
0-7 F 2
652 5
D0-
7 F 3
367
200 300 400 500 600 700
Inte
nsity
(a. u
.)
Wavelength (nm)
489
5 D4-
7 F 6
620
5 D4-
7 F 3
587
5 D4-
7 F 4
544 5
D4-
7 F 5
258
MO42-
200 300 400 500 600 700
Inte
nsity
(a. u
.)
Wavelength (nm)48
95 D
4-7 F 6
620
5 D4-
7 F 3
587
5 D4-7 F 4
544 5
D4-
7 F 5
258
MO42-
200 300 400 500 600 700
270
MoO42-
538 5
D1-
7 F 1
590 5
D0-7 F 1
612
5 D0-
7 F 2
652 5
D0-
7 F 3
Inte
nsity
(a. u
.)
Wavelength (nm)
λem = 612 nm
λem = 544 nm λem = 544 nmλex = 258 nm λex = 258 nm
λex = 270 nm λem = 612 nm λex = 270 nm
469
396
367
a b c d
Fig. 11. The excitation (left) and emission (right) spectra for SrMoO4:Eu3+ (a), BaMoO4:Eu3+ (b), SrMoO4:Tb3+ (c), BaMoO4:Tb3+ (d) and their corresponding photographs
under ultraviolet (254 nm) excitation.
P. Yang et al. / Journal of Solid State Chemistry 182 (2009) 2510–25202518
level of Tb3+ are apparent in the emission spectra (Fig. 11c and d,right). Additionally, the characteristic emission of Tb3+ with5D4–7F5 green emission (544 nm) is the most prominent groupcompared with other transitions.
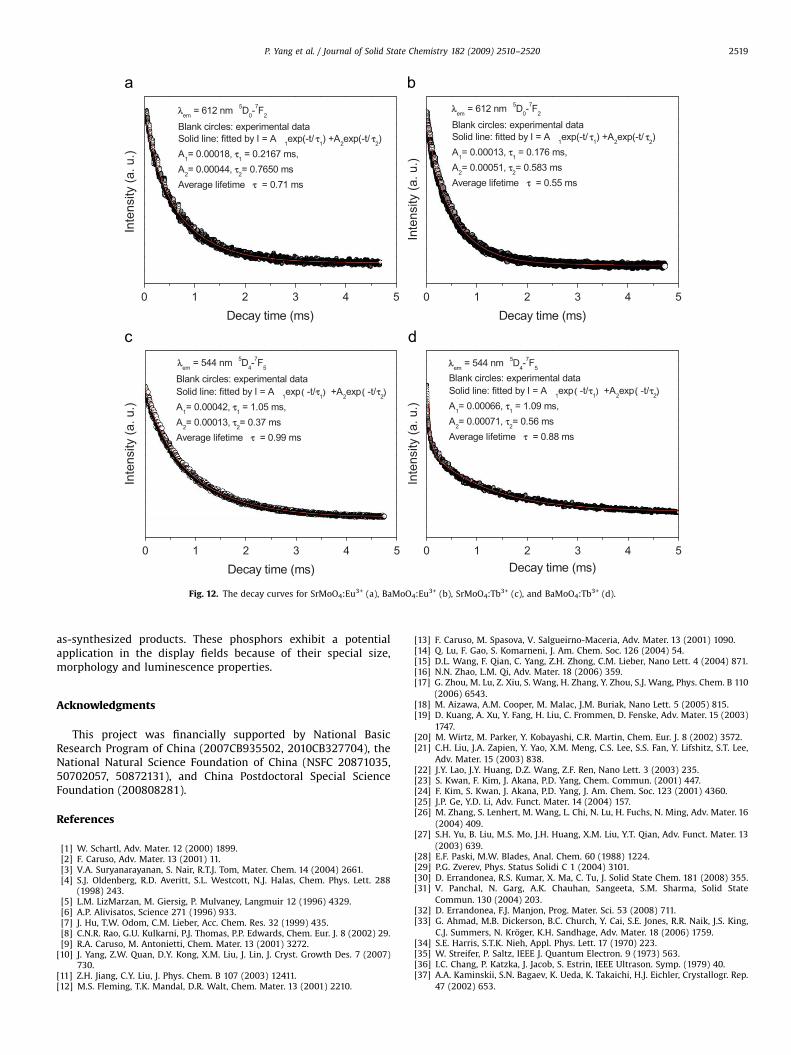
The typical decay curves for the luminescence of Eu3+ inAMoO4:Eu3+ (A ¼ Sr, Ba) and Tb3+ in AMoO4:Tb3+ (A ¼ Sr, Ba) areshown in Fig. 12. It can be seen that the decay curves for 5D0–7F2
(612 nm) of Eu3+ and 5D4–7F5 (544 nm) of Tb3+ can be well fittedinto a double-exponential function as I ¼ A1 exp(�t/t1)+A2 exp(�t/t2) (t1 and t2 are the fast and slow components of theluminescence lifetimes, A1 and A2 are the fitting parameters),and the fitting results are shown in Fig. 12. The respective averagelifetimes for 5D0–7F2 (612 nm) of Eu3+ in SrMoO4:Eu3+ andBaMoO4:Eu3+ are 0.71 and 0.55 ms, respectively, which aredetermined by the formula t ¼ (A1t1
2+A2t22)/(A1t1+A2t2) [55].
However, the average lifetimes for 5D4–7F5 (544 nm) of Tb3+ inSrMoO4:Tb3+ and BaMoO4:Tb3+ are 0.99 and 0.88 ms, respectively.The double-exponential decay behavior of the activator is
frequently observed when the excitation energy is transferredfrom the donor to the acceptor [55,56].
4. Conclusions
In summary, rare-earth ion (Eu3+, Tb3+) doped AMoO4
phosphors have been synthesized by a simple solvothermalprocess using EG as protective agent without further heattreatment. The obtained products exhibit well-defined peanut-like and oval morphologies, non-agglomeration, and narrow sizedistribution. The obtained AMo4:Eu3+ and AMoO4:Tb3+ phosphorsshow the characteristic emission lines of Eu3+ and Tb3+, respec-tively. The decay curves of all the samples fit well into a double-exponential function. The possible formation process for theAMoO4:Ln phosphors has been studied in detail. The solvothermalreaction temperature, reaction time, and EG/H2O volume ratioplay significant roles in the morphologies and sizes of the
ARTICLE IN PRESS
Decay time (ms)0 1 2 3 4 5
Inte
nsity
(a. u
.)
Inte
nsity
(a. u
.)
Decay time (ms)
0 1 2 3 4 5
Inte
nsity
(a. u
.)
Decay time (ms)0 1 2 3 4 5
Inte
nsity
(a. u
.)
Decay time (ms)
Fig. 12. The decay curves for SrMoO4:Eu3+ (a), BaMoO4:Eu3+ (b), SrMoO4:Tb3+ (c), and BaMoO4:Tb3+ (d).
P. Yang et al. / Journal of Solid State Chemistry 182 (2009) 2510–2520 2519
as-synthesized products. These phosphors exhibit a potentialapplication in the display fields because of their special size,morphology and luminescence properties.
Acknowledgments
This project was financially supported by National BasicResearch Program of China (2007CB935502, 2010CB327704), theNational Natural Science Foundation of China (NSFC 20871035,50702057, 50872131), and China Postdoctoral Special ScienceFoundation (200808281).
References
[1] W. Schartl, Adv. Mater. 12 (2000) 1899.[2] F. Caruso, Adv. Mater. 13 (2001) 11.[3] V.A. Suryanarayanan, S. Nair, R.T.J. Tom, Mater. Chem. 14 (2004) 2661.[4] S.J. Oldenberg, R.D. Averitt, S.L. Westcott, N.J. Halas, Chem. Phys. Lett. 288
(1998) 243.[5] L.M. LizMarzan, M. Giersig, P. Mulvaney, Langmuir 12 (1996) 4329.[6] A.P. Alivisatos, Science 271 (1996) 933.[7] J. Hu, T.W. Odom, C.M. Lieber, Acc. Chem. Res. 32 (1999) 435.[8] C.N.R. Rao, G.U. Kulkarni, P.J. Thomas, P.P. Edwards, Chem. Eur. J. 8 (2002) 29.[9] R.A. Caruso, M. Antonietti, Chem. Mater. 13 (2001) 3272.
[10] J. Yang, Z.W. Quan, D.Y. Kong, X.M. Liu, J. Lin, J. Cryst. Growth Des. 7 (2007)730.
[11] Z.H. Jiang, C.Y. Liu, J. Phys. Chem. B 107 (2003) 12411.[12] M.S. Fleming, T.K. Mandal, D.R. Walt, Chem. Mater. 13 (2001) 2210.
[13] F. Caruso, M. Spasova, V. Salgueirno-Maceria, Adv. Mater. 13 (2001) 1090.[14] Q. Lu, F. Gao, S. Komarneni, J. Am. Chem. Soc. 126 (2004) 54.[15] D.L. Wang, F. Qian, C. Yang, Z.H. Zhong, C.M. Lieber, Nano Lett. 4 (2004) 871.[16] N.N. Zhao, L.M. Qi, Adv. Mater. 18 (2006) 359.[17] G. Zhou, M. Lu, Z. Xiu, S. Wang, H. Zhang, Y. Zhou, S.J. Wang, Phys. Chem. B 110
(2006) 6543.[18] M. Aizawa, A.M. Cooper, M. Malac, J.M. Buriak, Nano Lett. 5 (2005) 815.[19] D. Kuang, A. Xu, Y. Fang, H. Liu, C. Frommen, D. Fenske, Adv. Mater. 15 (2003)
1747.[20] M. Wirtz, M. Parker, Y. Kobayashi, C.R. Martin, Chem. Eur. J. 8 (2002) 3572.[21] C.H. Liu, J.A. Zapien, Y. Yao, X.M. Meng, C.S. Lee, S.S. Fan, Y. Lifshitz, S.T. Lee,
Adv. Mater. 15 (2003) 838.[22] J.Y. Lao, J.Y. Huang, D.Z. Wang, Z.F. Ren, Nano Lett. 3 (2003) 235.[23] S. Kwan, F. Kim, J. Akana, P.D. Yang, Chem. Commun. (2001) 447.[24] F. Kim, S. Kwan, J. Akana, P.D. Yang, J. Am. Chem. Soc. 123 (2001) 4360.[25] J.P. Ge, Y.D. Li, Adv. Funct. Mater. 14 (2004) 157.[26] M. Zhang, S. Lenhert, M. Wang, L. Chi, N. Lu, H. Fuchs, N. Ming, Adv. Mater. 16
(2004) 409.[27] S.H. Yu, B. Liu, M.S. Mo, J.H. Huang, X.M. Liu, Y.T. Qian, Adv. Funct. Mater. 13
(2003) 639.[28] E.F. Paski, M.W. Blades, Anal. Chem. 60 (1988) 1224.[29] P.G. Zverev, Phys. Status Solidi C 1 (2004) 3101.[30] D. Errandonea, R.S. Kumar, X. Ma, C. Tu, J. Solid State Chem. 181 (2008) 355.[31] V. Panchal, N. Garg, A.K. Chauhan, Sangeeta, S.M. Sharma, Solid State
Commun. 130 (2004) 203.[32] D. Errandonea, F.J. Manjon, Prog. Mater. Sci. 53 (2008) 711.[33] G. Ahmad, M.B. Dickerson, B.C. Church, Y. Cai, S.E. Jones, R.R. Naik, J.S. King,
C.J. Summers, N. Kroger, K.H. Sandhage, Adv. Mater. 18 (2006) 1759.[34] S.E. Harris, S.T.K. Nieh, Appl. Phys. Lett. 17 (1970) 223.[35] W. Streifer, P. Saltz, IEEE J. Quantum Electron. 9 (1973) 563.[36] I.C. Chang, P. Katzka, J. Jacob, S. Estrin, IEEE Ultrason. Symp. (1979) 40.[37] A.A. Kaminskii, S.N. Bagaev, K. Ueda, K. Takaichi, H.J. Eichler, Crystallogr. Rep.
47 (2002) 653.

ARTICLE IN PRESS
P. Yang et al. / Journal of Solid State Chemistry 182 (2009) 2510–25202520
[38] K. Teshima, K. Yubuta, S. Sugiura, Y. Fujita, T. Suzuki, M. Endo, T. Shishido, S.Oishi, Cryst. Growth Des. 6 (2006) 1598.
[39] V.B. Mikhailik, H. Kraus, G. Miller, M.S. Mykhaylyk, D. Wahl, J. Appl. Phys. 97(2005) 083523.
[40] L.B. Barbosa, D.R. Ardila, C. Cusatis, J.P. Andreeta, J. Cryst. Growth 235 (2002)327.
[41] D. Chen, K. Tang, F. Li, H. Zheng, Cryst. Growth Des. 6 (2006) 247.[42] J.H. Ryu, J.-W. Yoon, C.S. Lim, W.-C. Oh, K.B. Shim, J. Alloy Compd. 390 (2005)
245.[43] Y. Liu, Y. Chu, Mater. Chem. Phys. 92 (2005) 59.[44] F. Lei, B. Yan, J. Solid State Chem. 181 (2008) 855.[45] C. Zhang, E. Shen, E. Wang, Z. Kang, L. Gao, C. Hu, L. Xu, Mater. Chem. Phys. 96
(2006) 240.[46] Q. Gong, X.F. Qian, X.D. Ma, Z.K. Zhu, Cryst. Growth Des. 6 (2006) 1821.
[47] Z.H. Li, J.M. Du, J.L. Zhang, ;T.C. Mu, Y.N. Gao, B.X. Han, J. Chen, J.W. Chen,Mater. Lett. 59 (2005) 64.
[48] M.D. Barnes, A. Mehta, T. Thundat, R.N. Bhargava, V. Chabra, B. Kulkarni, J.Phys. Chem. B 104 (2000) 6099.
[49] G. Blasse, B.C. Grabmaier, Springer, Berlin, 1994.[50] G.Z. Li, Z.L. Wang, Z.W. Quan, C.X. Li, J. Lin, Cryst. Growth Des. 7 (2007) 1797.[51] J.C. Sczancoski, L.S. Cavalcante, M.R. Joya, J.W.M. Espinosa, P.S. Pizani, J.A.
Varela, E. Longo, J. Colloid Interf. Sci. 330 (2009) 227.[52] J.A. Groenink, C. Hakfoort, G. Blasse, Phys. Status Solidi A 54 (1979) 329.[53] C.X. Li, Z.W. Quan, J. Yang, P.P. Yang, J. Lin, Inorg. Chem. 46 (2007) 6329.[54] D.L. Shi, J. Lian, W. Wang, G.K. Liu, P. He, Z.Y. Dong, Adv. Mater. 18 (2006) 189.[55] S. Mukarami, H. Markus, R. Doris, M. Makato, Inorg. Chim. Acta 300 (2000)
1014.[56] C. Hsu, R.C. Poweh, J. Lumin. 10 (1975) 273.