Embed Size (px)
Citation preview
HAL Id: hal-02991767https://hal.archives-ouvertes.fr/hal-02991767
Submitted on 11 Dec 2020
HAL is a multi-disciplinary open accessarchive for the deposit and dissemination of sci-entific research documents, whether they are pub-lished or not. The documents may come fromteaching and research institutions in France orabroad, or from public or private research centers.
L’archive ouverte pluridisciplinaire HAL, estdestinée au dépôt et à la diffusion de documentsscientifiques de niveau recherche, publiés ou non,émanant des établissements d’enseignement et derecherche français ou étrangers, des laboratoirespublics ou privés.
Judd-Ofelt and quantum cutting analysis of Eu3+ orPr3+ doped β-NaGdF4 nanorods obtained by rapid
coprecipitation methodY. Cheroura, Z. Smara, A. Potdevin, D. Boyer, A. Chafa, O. Ziane, Rachid
Mahiou
To cite this version:Y. Cheroura, Z. Smara, A. Potdevin, D. Boyer, A. Chafa, et al.. Judd-Ofelt and quantum cuttinganalysis of Eu3+ or Pr3+ doped β-NaGdF4 nanorods obtained by rapid coprecipitation method.Materials Research Bulletin, Elsevier, 2020, 125, pp.110809. �10.1016/j.materresbull.2020.110809�.�hal-02991767�
1
Judd-Ofelt and quantum cutting analysis
of Eu3+ or Pr3+ doped -NaGdF4 nanorods
obtained by rapid coprecipitation method Y. Cheroura1, 2, Z. Smara1, 3, A. Potdevin1,*, D. Boyer1, A. Chafa3, O. Ziane2, R. Mahiou1,*
1Université Clermont Auvergne, CNRS, SIGMA Clermont, Institut de Chimie de
Clermont-Ferrand, F-63000 Clermont-Ferrand, France
2Laboratoire d’Electronique Quantique, Faculté de Physique, USTHB, El -Alia Bab-
Ezzouar, 16111 Alger, Algérie
3 Laboratoire des Sciences Nucléaires et Interaction Rayonnement Matière, Faculté de
Physique, USTHB, El-Alia Bab-Ezzouar, 16111 Alger, Algérie
Abstract
Pure hexagonal -NaGdF4 and Eu3+ or Pr3+-doped -NaGdF4 nanocrystals in shape of nanorods
of 140 nm of length have been synthesized using a simple and rapid coprecipitation method.
XRD analysis evidenced pure single phases exhibiting characteristic luminescence of Eu3+ or
Pr3+ ions when excited under UV or blue radiations. Samples gave rise to intense orange-red
emission and quite white emission in the case of respectively Eu3+ or Pr3+ doped samples.
Optical properties are discussed in the frame of Judd-Ofelt theory and considering that an
energy transfer occurs between active ions. Notably it was found that the quantum-cutting by a
two-step energy transfer from Gd3+ to Eu3+ can improve the red emission of Eu3+ ions under
near-VUV excitation. Such quantum-cutting mechanism has been also considered in the case
of Pr3+ doped -NaGdF4. However, the efficiency of both processes in comparison with
literature suggest that only one part of the energy in the excited states within Gd3+ can be
transferred to Eu3+ for its red emission. In the case of Pr3+ ions, the energy is more probably
released through the self-trapped exciton emission certainly due to the lack of resonant VUV
excitation.
Keywords: Nanorods, fluorides, luminescence, Judd-Ofelt theory
2
1. Introduction
The fabrication of nano-to micro-scale inorganic structures has attracted great interest as a
result of their novel properties and their potential applications in various fields e.g. color
displays, solid-state lasers, medicine and Light Emitting Diodes (LEDs) or in specific screens
for enhancing solar cells efficiency.[1] In most cases, the as-explored materials are based on the
use of lanthanide ions which exhibit efficient luminescence under VUV, UV or IR excitations
leading to strong conversion of the excitation wavelength in the range of the desired
luminescence in the UV-Visible or IR wavelength range.
To date, Ln3+doped fluorides have been extensively investigated and proved to be the ideal
host candidates for producing high up and down conversion luminescence efficiency.[2, 3]
NaGdF4 is a member of the NaREF4 family (RE=rare earth), it crystallizes in two phases, cubic
α-NaGdF4 and hexagonal β-NaGdF4.[4] Special conditions are required to obtain pure β-NaREF4
nanoparticles (NPs) which exhibits better luminescent properties and thermodynamic stability.
[5] Hexagonal β-NaGdF4 phase has a low effective phonon energy of about 350 cm-1, which
reduces the probability of non-radiative decay by multiphonon relaxation and thereby enhances
the luminescence compared to the cubic phase.[6] Different papers have reported the synthesis
of pure hexagonal phases. β-NaGdF4 NPs are mainly prepared by the following methods: high
temperature solvothermal or hydrothermal methods or thermal decomposition process[7]. Using
solvothermal method, P. Lei et al.[8] achieved the synthesis of hexagonal phase β-NaGdF4 using
ethylene glycol as solvent at 200°C, for 7h. The synthesis of colloidal β-NaGdF4 NPs was also
performed via thermal decomposition of fluoride precursors of lanthanide ions. The method
was described by J. Ryu et al.[9] and E. Hemmer et al.[10]. In the first step, the lanthanide
trifluoroacetate precursor was prepared at 80°C for 12 h, then sodium trifluoroacetate was added
to the flask; octadecene was used as a solvent with oleic acid or oleylamine as surfactants. The
solution was maintained at 310°C for 60 min under stirring and argon flow. β-NaGdF4
3
nanocrystals were prepared as well by N. Martin et al. [11] from solution by a co-precipitation
method. This method allows a good control of the morphology and homogeneity of the obtained
materials and efficiently reduces oxygen contamination but it requires a temperature between
300 and 780°C under SF6+Ar (10%) atmosphere. Banski et al.[12] prepared β-NaGdF4
nanocrystals using trioctylphosphine oxide (TOPO) as a surfactant using a two-step co-
thermolysis method at 120°C under vacuum for 30 minutes. Then the growth temperature was
increased to 350°C for 1 hour. These methods are cumbersome, because high temperature
and/or long reaction time are often needed to obtain the desired β-NaGdF4 NPs in the pure
hexagonal form, moreover high amounts of surfactants are used to control the morphology and
the size distribution of the NPs. To overcome these drawbacks, several simple synthetic ways
have been developed last years. Recently, Gao et al.[13] published an easy aqueous synthesis
strategy using chlorides and NH4F as well as β-cyclodextrin as precursors. They had to heat at
60°C during 40 min to obtain β-NaGdF4 nanorods. Tessitore et al.[6, 14] used ethylene glycol as
a solvent and obtained β-NaGdF4 nanocrystals (2-3 nm) from rare-earth acetates after 24h at
room temperature. On the other hand, several papers[15, 16] have reported the synthesis of β-
NaBiF4 NPs at room temperature, basing their work on Lei et al.’s [17].
In the present work, we report an easy, cost-effective and low energy-consumption strategy
to synthesize β-NaGdF4 NPs using a process, based on coprecipitation method, similar to that
reported by Lei et al.’s [17]. Several synthesis parameters have been optimized to achieve well-
crystallized of both undoped and Eu3+- or Pr3+-doped β-NaGdF4 NPs. Simple chemical
precursors were involved and the required synthesis time was reduced at 1 hour at only 150°C.
Firstly, structural and morphological properties of as-synthesized NPs were studied by means
of X-Ray diffraction (XRD), Transmission Electronic Microscopy (TEM) and InfraRed (IR)
spectroscopy.
4
In the second part of our work, the optical properties of Eu3+ or Pr3+ions doped β-NaGdF4
NPs were investigated. Such ions are well-known to give rise to visible luminescence, notably
in the red range for Eu3+ and simultaneously in the blue, green and red ranges for Pr3+ leading
to quasi white emission. These nanophosphors present the interest to be easily integrable in
several optical devices.
To perform these studies, photoluminescence and lifetime measurements were analyzed as a
function of the Eu3+and Pr3+ contents. They are discussed in the frame of energy transfer
mechanisms occurring between the active ions. In addition, the Judd-Ofelt [18] analysis based
on the recorded emission spectra of Eu3+ and Pr3+ ions was performed, which allowed
calculating radiative and non-radiative transition probabilities, decay lifetimes, and Judd-Ofelt
intensity parameters of the luminescence of Eu3+and Pr3+ doped β-NaGdF4 nanoparticles.
Moreover, in LiGdF4:Eu3+ [19] and -NaGdF4:Eu3+ [20] systems, a visible quantum cutting with
efficiency higher than 100 % have been obtained through the 6GJ →6PJ (Gd3+) and 7FJ →
5D0
(Eu3+) cross-relaxation energy transfer from Gd3+ to Eu3+. To investigate whether or not this
two-step energy transfer for the couple Gd3+-Eu3+ occurs in β-NaGdF4 NPs, emission spectra
upon excitation in several Gd3+ energy levels were recorded. It is well-known that an energy
transfer from Pr3+ to Gd3+ can occur when the fluoride matrix or the 4f5d bands of Pr3+ are
excited. [21, 22] However, the near VUV excitation provided by our experimental set-up has
allowed observing an emission related to Self-Trapped Emission (STE) in β-NaGdF4: Pr3+ NPs
indicating that possible quantum cutting can take place in such material by triggering the
luminescence of Pr3+ in the VUV range.
2. Experimental section
2.1. Materials
Analytical grade gadolinium nitrate hexahydrate (Gd(NO3)3.6H2O, 99.9%), sodium nitrate
(NaNO3, 99.5%) and ethylene glycol (EG) (C2H2O2, 99.8%) were purchased from Acros
Organics. Ammonium fluoride (NH4F, 95%) was obtained from Prolabo (VWR) and europium
5
nitrate pentahydrate (Eu(NO3)3.5H2O, 99.9%), praseodymium nitrate hexahydrate
(Pr(NO3)3.6H2O, 99.9%) from Sigma-Aldrich. All the above chemicals were used directly
without further purification.
2.2. Nanopowder synthesis
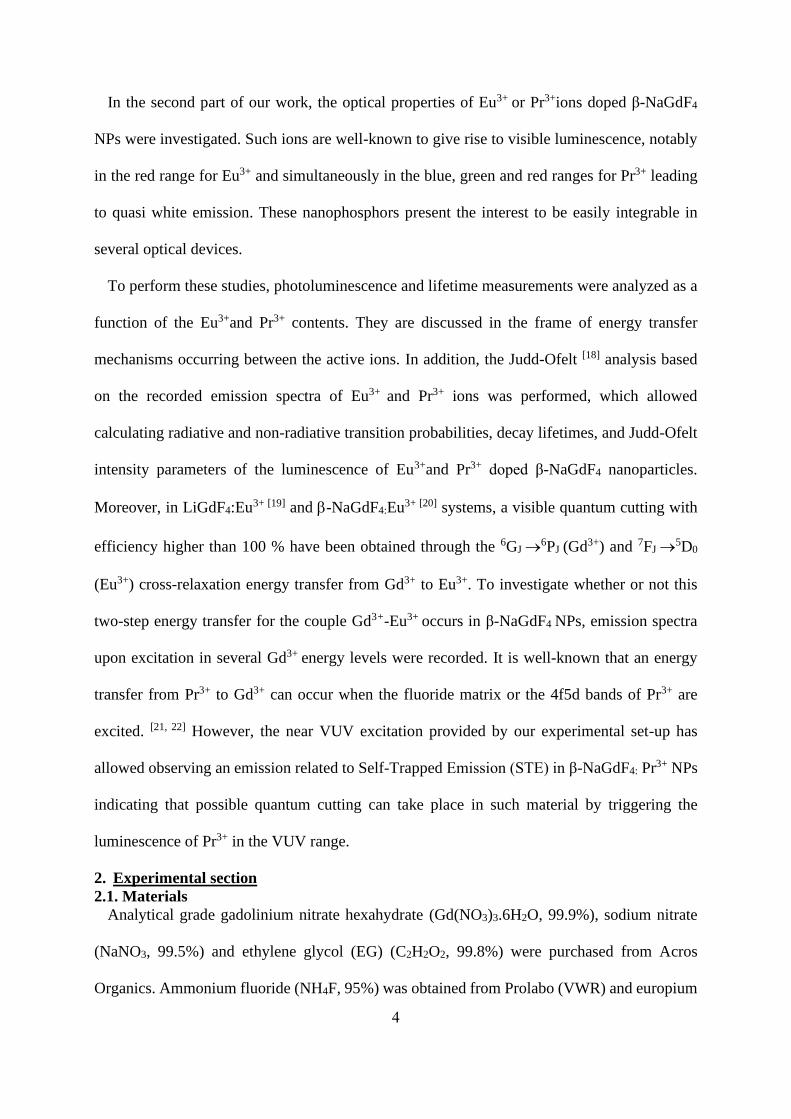
The β-NaGdF4 NPs were synthesized using a coprecipitation method as depicted in Figure 1.
In a typical synthesis route, a solution of EG (10 ml) containing Gd(NO3)3.6H2O (1mmol) and
NaNO3 (3 mmol) is added to a solution of EG (20 ml) containing NH4F (6mmol). The resulting
mixture is subsequently heated to different reaction temperatures (25, 50, 100,150 °C), and held
for different reaction times (30, 45, 60 min) under vigorous stirring. The detailed experimental
parameters including the reacting temperature and reaction time are listed later in Table 1. After
cooling to RT, the β-NaGdF4 NPs are collected through centrifugation and washed several times
with ethanol, distilled water and then dried at 80°C for 24h.
Eu3+ and Pr3+ -doped NPs were synthesized following the same procedure, using the optimal
parameters of temperature and reaction time defined on undoped matrix, and using Eu nitrate
pentahydrate (Eu(NO3)3.5H2O, 99.9%) or Pr3+nitrate hexahydrate (Pr(NO3)3.5H2O, 99.9%) in
variable amounts as rare-earth precursors. The total lanthanide ions (Gd+Ln, Ln = Eu or Pr)
concentration was kept constant (1 mmol) in all experiments, whereas the doping rate (molar
ratio Ln/Gd with Ln=Eu or Pr) varies from 1% to 30 % and from 0.1% to 1% respectively in
order to investigate the effect of this parameter on the luminescent properties.
EG
Solution 1 Solution 2Solution 2
Solu
tion 1
Stirring
EGEG Centrifugation
Wash and dry
Heating
Powder
NaNO3
Gd(NO3)3.6H2O NH4F
Stirring 30 min
Figure 1 : Schematic illustration of the synthesis procedure of -NaGdF4 nanoparticles
6
2.3. Technical Characterizations
Structural and morphological characterizations
The X-ray diffraction (XRD) analysis were performed at room temperature with a
commercial X'Pert Pro Philips diffractometer equipped with a back monochromator using the
Bragg- Brentano configuration and the Cu-Kα radiation (λ=1.5406 Å) over 2θ range from 10°
to 90° with step size of 0.02°. All the data were processed by XPert High Score plus Software
using databases (unit cell parameters, peak identification).
Particles size measurements were carried out using Dynamic Light Scattering; their
distributions were obtained using the Zetasizer Nano ZS, Malvern, U.K. Instrument.
Transmission Electronic Microscopy (TEM) images were recorded on a Hitachi H-7650
microscope at the Centre Imagerie Cellulaire Santé (CICS) of Clermont-Ferrand.
Fourier transform infrared spectra were performed from polycrystalline samples with a
Thermo Electron (Nicolet 5700-FTIR model) spectrometer equipped with a diamond micro-
Attenuated Total Reflection (ATR) accessory and working with OMNIC software. Spectra
were recorded from 4000 to 400 cm-1 at a spectral resolution of 4 cm-1 and 400 scans were
accumulated for improving the signal/noise ratio.
Luminescence analysis
The optical properties were investigated by recording the photoluminescence spectra with a
Jobin-Yvon set-up consisting of a Xenon lamp operating at 400 W and two monochromators
(Triax 550 and Triax 180) combined with a cryogenically cold charge coupled device (CCD)
camera (Jobin-Yvon Symphony LN2 series) for emission spectra and with a Hamamatsu 980
photomultiplicator for excitation ones.
Quantum yields (QY) efficiencies were assessed using C9920−02G PL-QY measurement
system from Hamamatsu. The set-up consisted of a 150 W monochromatized Xe lamp, an
integrating sphere (Spectralon coating, = 3.3 in.) and a high sensibility CCD camera.
7
Photoluminescence excitation (PLE) spectra were obtained by exciting the NPs from 250 to
500 nm with 5 nm increment and measuring their absolute QY. The absolute PL QYs were
calculated by combining the internal QY values with the absorption coefficient (also measured
by the apparatus).
Luminescence decays were recorded using a second-harmonic generation beam delivered by
a pulsed Nd:YAG OPO-Ekspla NT342A laser (3-5 ns pulse duration, 10 Hz, 5 cm-1 line width
, 0.3 mJ in the UV). The emitted photons were detected at right angle from the excitation and
analyzed through Edinburgh FLS980 spectrometer (Czerny-Turner monochromator, 300 mm
focal length, 1200 groove mm-1 grating and minimum band-pass of 0.1 nm) equipped with
Hamamatsu R928P PMT (200-870 nm range).
3. Results and discussion
3.1. Structural and Morphological study of undoped NaGdF4
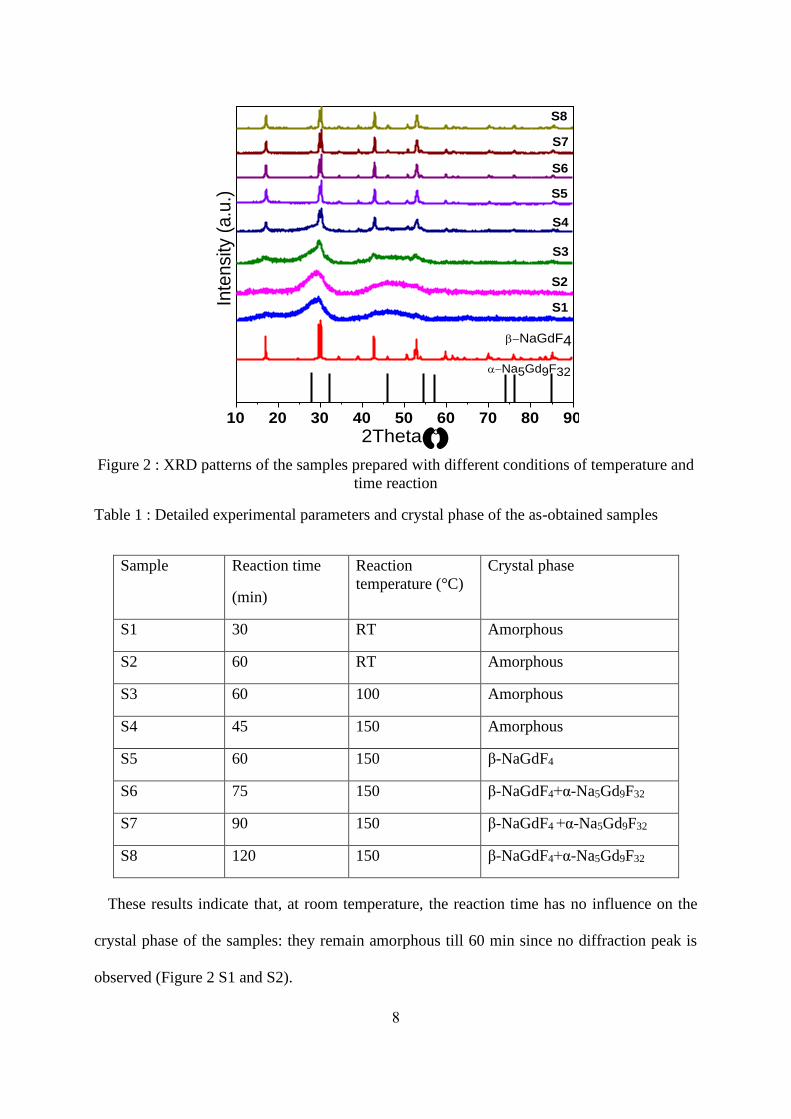
To study the effect of reaction time and synthesis temperature on the crystalline structure,
XRD patterns were recorded from samples prepared with different reaction times going from
30 to 120 min, and with synthesis temperatures varying from Room Temperature (RT) to
150°C, are illustrated in
Figure 2. The detailed parameters and crystalline phase of the as-obtained samples are listed
in Table 1.
8
10 20 30 40 50 60 70 80 90
a-Na5Gd9F32
2Theta (°)
Inte
nsity (
a.u
.)
-NaGdF4
S1
S2
S3
S4
S5
S6
S7
S8
Figure 2 : XRD patterns of the samples prepared with different conditions of temperature and
time reaction
Table 1 : Detailed experimental parameters and crystal phase of the as-obtained samples
Sample Reaction time
(min)
Reaction
temperature (°C)
Crystal phase
S1 30 RT Amorphous
S2 60 RT Amorphous
S3 60 100 Amorphous
S4 45 150 Amorphous
S5 60 150 β-NaGdF4
S6 75 150 β-NaGdF4+α-Na5Gd9F32
S7 90 150 β-NaGdF4 +α-Na5Gd9F32
S8 120 150 β-NaGdF4+α-Na5Gd9F32
These results indicate that, at room temperature, the reaction time has no influence on the
crystal phase of the samples: they remain amorphous till 60 min since no diffraction peak is
observed (Figure 2 S1 and S2).
9
It can be also seen that the variation of the reaction temperature highly affects the crystalline
phase of the resultant samples. The beginning of crystallization is observed for the sample
obtained at 100°C for 60 min (Figure 2 S3). When the reaction temperature is increased to
150°C for 45 min (Figure 2 S4), diffraction peaks are more apparent and the resultant product
is more crystallized. With the reaction temperature of 150°C for 60 min (Figure 2 S5), all the
diffraction peaks can be readily indexed as the hexagonal -NaGdF4, agreeing well with the
data reported in the JCPDS standard file (n°027-0699) and no byproduct can be observed. Thus,
the β-NaGdF4 can be synthesized at 150°C for 60 min via this facile strategy. It is worth noting
that, to our knowledge, it is the first report on the hexagonal phase -NaGdF4 NPs synthesized
at such a low heating temperature at ambient pressure. For reaction time longer than 60 min at
150°C, a small amount of α-Na5Gd9F32 is observed and becomes more and more present with
increasing the synthesis time. This phase has received more and more attention in recent years.
[23, 24] In particular, Xu et al. worked on the synthesis of -NaGdF4 or Na5Gd9F32 using
hydrothermal synthesis (8h at 160°C). In the absence of ethylene-glycol, used to modify
diffusion behavior of the reactants, their synthesis resulted in a mixture of -NaGdF4 and
Na5Gd9F32. Basing on their study, the presence of Na5Gd9F32 may be the result of a slower
diffusion rate of Gd3+ ions compared to other species. Indeed, if the reaction time is sufficiently
long, more Gd3+ ions can react with F- and Na+ ions to give birth to Na5Gd9F32 phase following
the equation: [23, 24]
9 Gd3+ + 32 F- + 5 Na+ → Na5Gd9F32
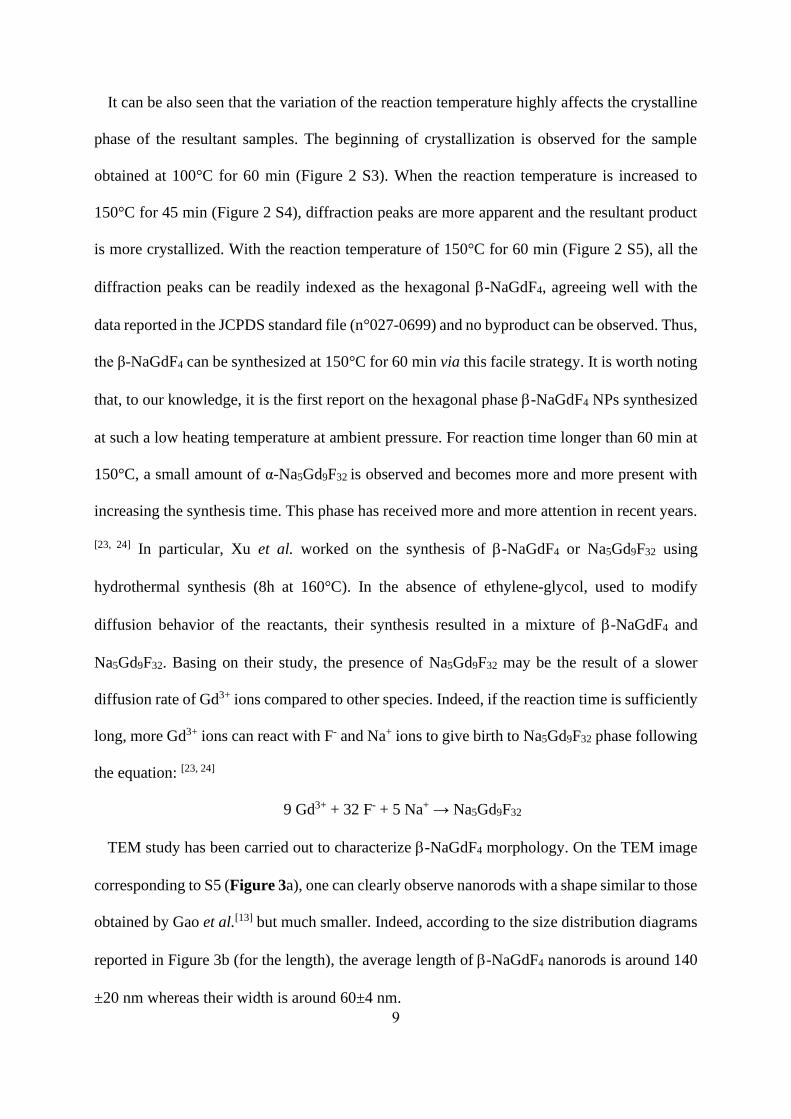
TEM study has been carried out to characterize -NaGdF4 morphology. On the TEM image
corresponding to S5 (Figure 3a), one can clearly observe nanorods with a shape similar to those
obtained by Gao et al.[13] but much smaller. Indeed, according to the size distribution diagrams
reported in Figure 3b (for the length), the average length of -NaGdF4 nanorods is around 140
±20 nm whereas their width is around 60±4 nm.
10
0
2
4
6
8
0.200.160.12
Mean length= 0.14 0.02 mm
Fre
qu
en
cy
Size (mm)
a
b
0.08
Figure 3 : (a)TEM image and (b) size distribution of β-NaGdF4
nanocrystals.
The hydrodynamic diameter measured by DLS in an aqueous particles suspension is about
200 nm. This value is only slightly larger than the mean particle size estimated from the TEM
micrographs of the sample and confirmed the absence of particle aggregation in the aqueous
suspension.
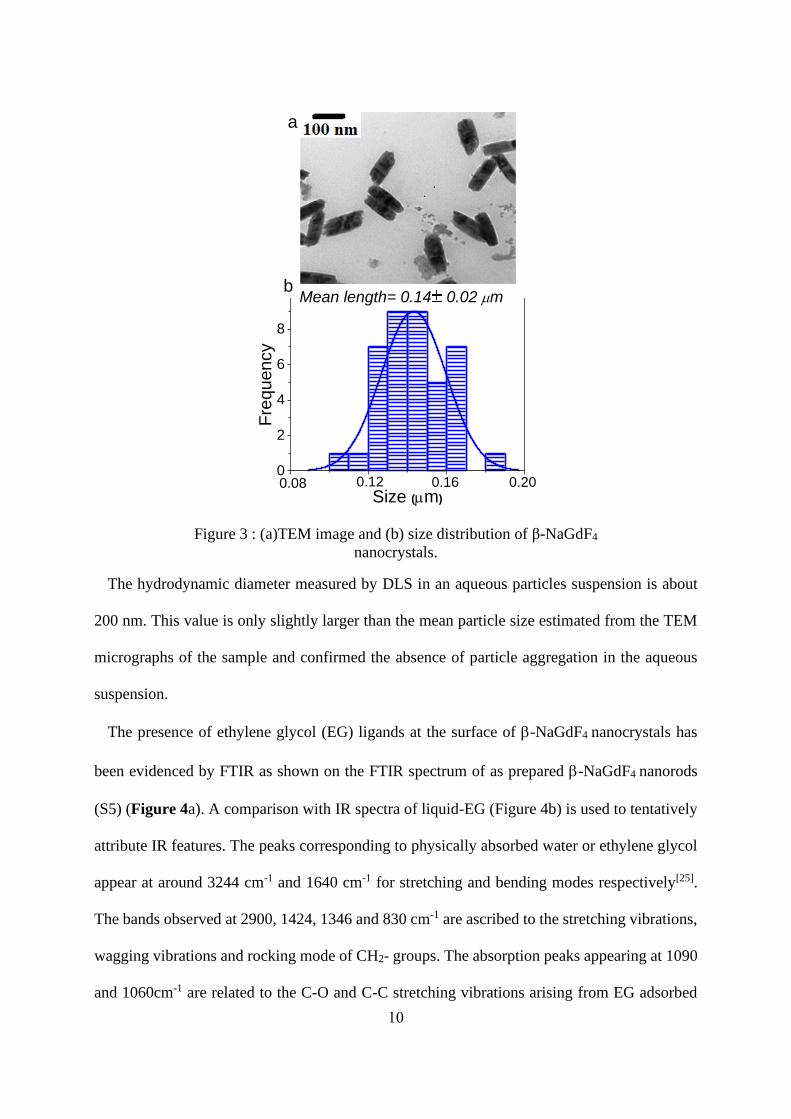
The presence of ethylene glycol (EG) ligands at the surface of -NaGdF4 nanocrystals has
been evidenced by FTIR as shown on the FTIR spectrum of as prepared -NaGdF4 nanorods
(S5) (Figure 4a). A comparison with IR spectra of liquid-EG (Figure 4b) is used to tentatively
attribute IR features. The peaks corresponding to physically absorbed water or ethylene glycol
appear at around 3244 cm-1 and 1640 cm-1 for stretching and bending modes respectively[25].
The bands observed at 2900, 1424, 1346 and 830 cm-1 are ascribed to the stretching vibrations,
wagging vibrations and rocking mode of CH2- groups. The absorption peaks appearing at 1090
and 1060cm-1 are related to the C-O and C-C stretching vibrations arising from EG adsorbed
11
on the surface of -NaGdF4 NPs.[26] Basing on these spectra, EG seems to act as a capping-
agent in this synthesis route. This behavior is probably responsible for the anisotropic growth
of -NaGdF4 nanocrystals, as it has already been evidenced by Zhao and his co-workers.[26]
Figure 4 : FTIR spectra of (a) -NaGdF4 nanorods and (b) liquid EG
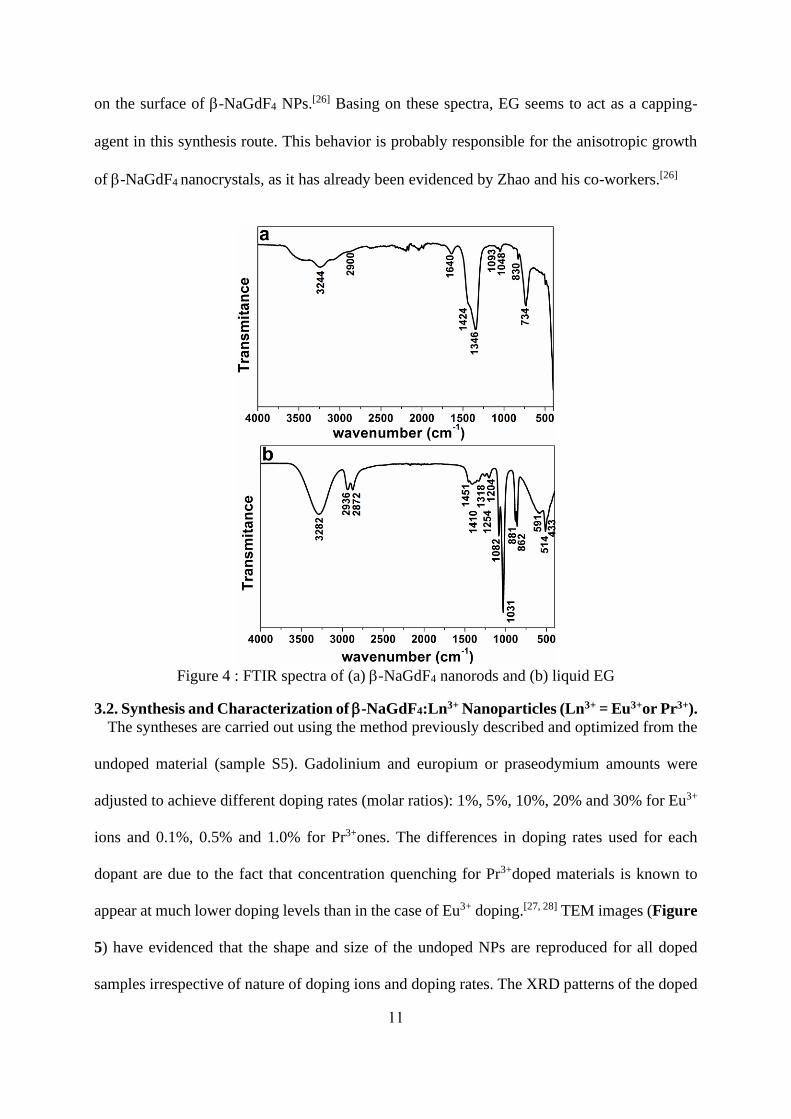
3.2. Synthesis and Characterization of -NaGdF4:Ln3+ Nanoparticles (Ln3+ = Eu3+or Pr3+).
The syntheses are carried out using the method previously described and optimized from the
undoped material (sample S5). Gadolinium and europium or praseodymium amounts were
adjusted to achieve different doping rates (molar ratios): 1%, 5%, 10%, 20% and 30% for Eu3+
ions and 0.1%, 0.5% and 1.0% for Pr3+ones. The differences in doping rates used for each
dopant are due to the fact that concentration quenching for Pr3+doped materials is known to
appear at much lower doping levels than in the case of Eu3+ doping.[27, 28] TEM images (Figure
5) have evidenced that the shape and size of the undoped NPs are reproduced for all doped
samples irrespective of nature of doping ions and doping rates. The XRD patterns of the doped
12
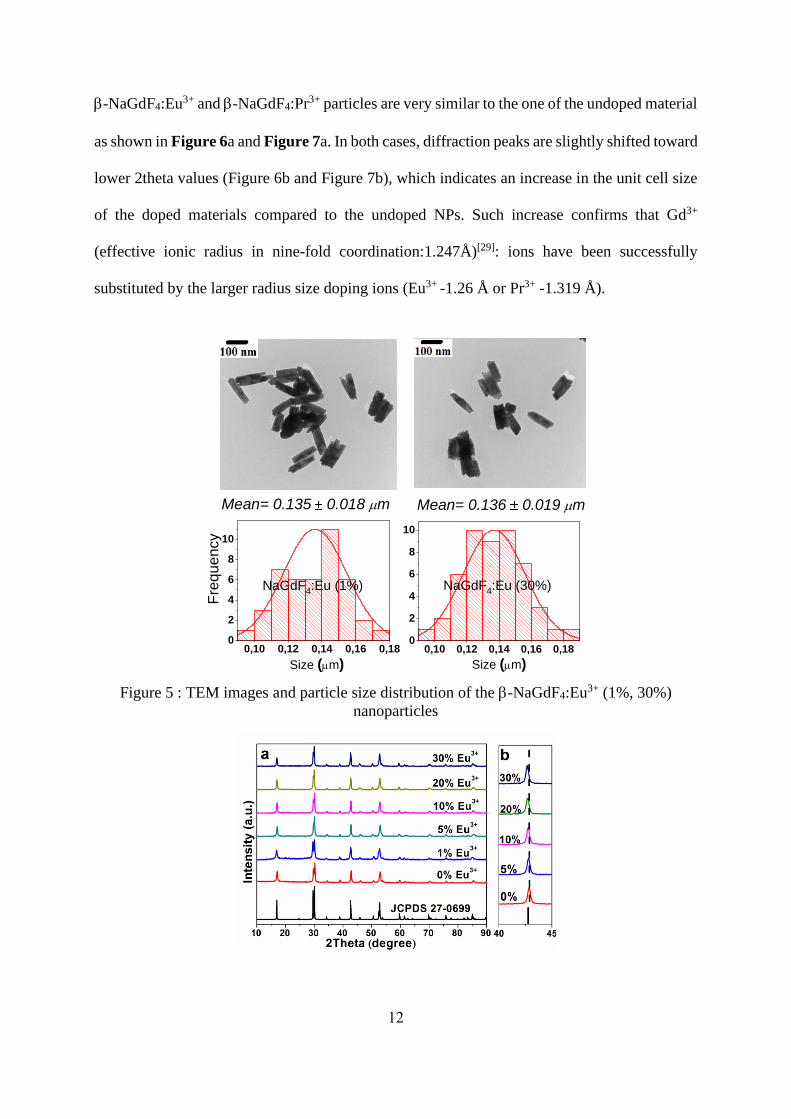
-NaGdF4:Eu3+ and -NaGdF4:Pr3+ particles are very similar to the one of the undoped material
as shown in Figure 6a and Figure 7a. In both cases, diffraction peaks are slightly shifted toward
lower 2theta values (Figure 6b and Figure 7b), which indicates an increase in the unit cell size
of the doped materials compared to the undoped NPs. Such increase confirms that Gd3+
(effective ionic radius in nine-fold coordination:1.247Å)[29]: ions have been successfully
substituted by the larger radius size doping ions (Eu3+ -1.26 Å or Pr3+ -1.319 Å).
Mean= 0.135 0.018 mm
0,0 0,1 0,2 0,30
4
8
12
16
Mean= 0.136 0.019 mm
0,10 0,12 0,14 0,16 0,180
2
4
6
8
10
NaGdF4:Eu (1%)
Fre
qu
en
cy
0,10 0,12 0,14 0,16 0,180
2
4
6
8
10
NaGdF4:Eu (30%)
Size (mm)
Size (mm)
Figure 5 : TEM images and particle size distribution of the -NaGdF4:Eu3+ (1%, 30%)
nanoparticles
13
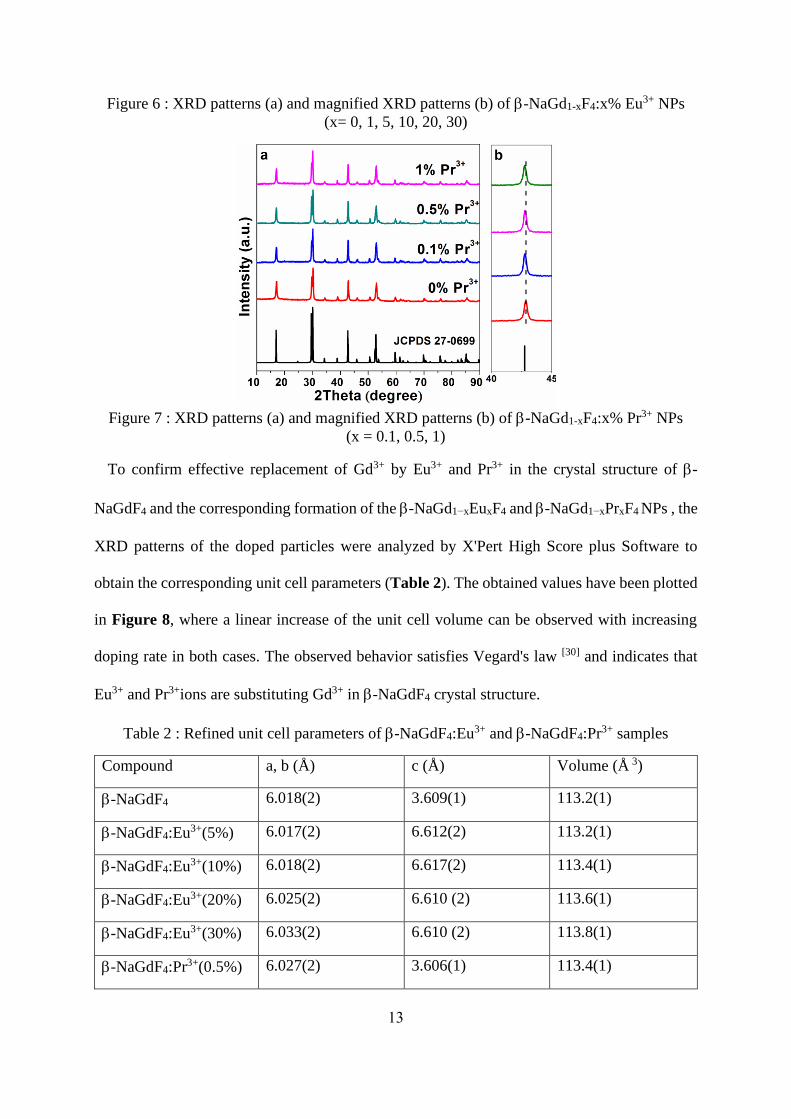
Figure 6 : XRD patterns (a) and magnified XRD patterns (b) of -NaGd1-xF4:x% Eu3+ NPs
(x= 0, 1, 5, 10, 20, 30)
Figure 7 : XRD patterns (a) and magnified XRD patterns (b) of -NaGd1-xF4:x% Pr3+ NPs
(x = 0.1, 0.5, 1)
To confirm effective replacement of Gd3+ by Eu3+ and Pr3+ in the crystal structure of -
NaGdF4 and the corresponding formation of the -NaGd1−xEuxF4 and -NaGd1−xPrxF4 NPs , the
XRD patterns of the doped particles were analyzed by X'Pert High Score plus Software to
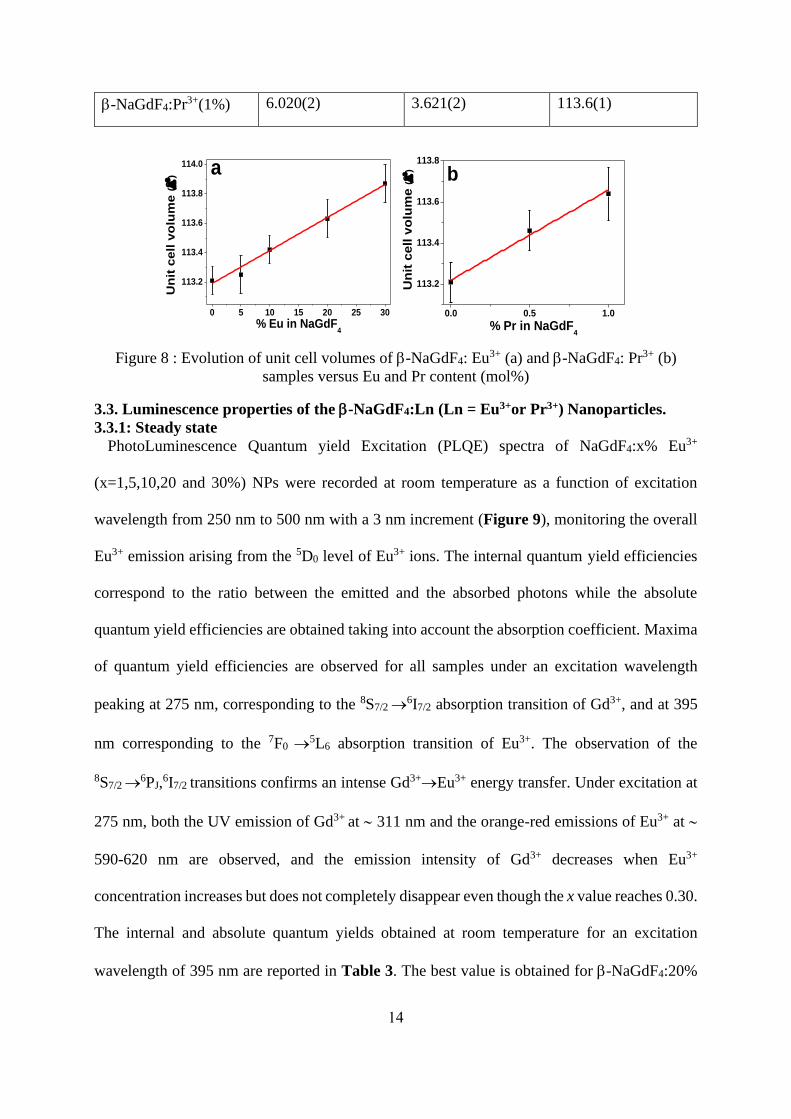
obtain the corresponding unit cell parameters (Table 2). The obtained values have been plotted
in Figure 8, where a linear increase of the unit cell volume can be observed with increasing
doping rate in both cases. The observed behavior satisfies Vegard's law [30] and indicates that
Eu3+ and Pr3+ions are substituting Gd3+ in -NaGdF4 crystal structure.
Table 2 : Refined unit cell parameters of -NaGdF4:Eu3+ and -NaGdF4:Pr3+ samples
Compound a, b (Å) c (Å) Volume (Å 3)
-NaGdF4 6.018(2) 3.609(1) 113.2(1)
-NaGdF4:Eu3+(5%) 6.017(2) 6.612(2) 113.2(1)
-NaGdF4:Eu3+(10%) 6.018(2) 6.617(2) 113.4(1)
-NaGdF4:Eu3+(20%) 6.025(2) 6.610 (2) 113.6(1)
-NaGdF4:Eu3+(30%) 6.033(2) 6.610 (2) 113.8(1)
-NaGdF4:Pr3+(0.5%) 6.027(2) 3.606(1) 113.4(1)
14
-NaGdF4:Pr3+(1%) 6.020(2) 3.621(2) 113.6(1)
0.0 0.5 1.0
113.2
113.4
113.6
113.8
b
Un
it c
ell
vo
lum
e (Å
3)
% Pr in NaGdF4
0 5 10 15 20 25 30
113.2
113.4
113.6
113.8
114.0U
nit
cell
vo
lum
e (Å
3)
% Eu in NaGdF4
a
Figure 8 : Evolution of unit cell volumes of -NaGdF4: Eu3+ (a) and -NaGdF4: Pr3+ (b)
samples versus Eu and Pr content (mol%)
3.3. Luminescence properties of the -NaGdF4:Ln (Ln = Eu3+or Pr3+) Nanoparticles.
3.3.1: Steady state
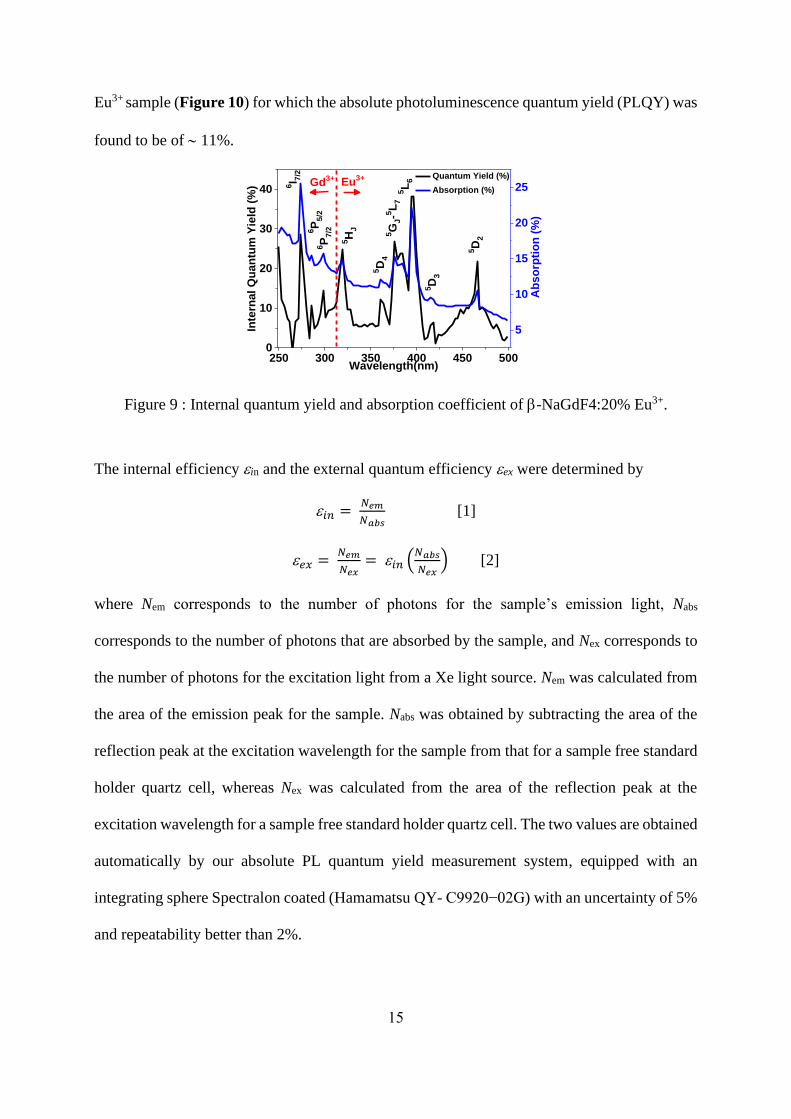
PhotoLuminescence Quantum yield Excitation (PLQE) spectra of NaGdF4:x% Eu3+
(x=1,5,10,20 and 30%) NPs were recorded at room temperature as a function of excitation
wavelength from 250 nm to 500 nm with a 3 nm increment (Figure 9), monitoring the overall
Eu3+ emission arising from the 5D0 level of Eu3+ ions. The internal quantum yield efficiencies
correspond to the ratio between the emitted and the absorbed photons while the absolute
quantum yield efficiencies are obtained taking into account the absorption coefficient. Maxima
of quantum yield efficiencies are observed for all samples under an excitation wavelength
peaking at 275 nm, corresponding to the 8S7/2 →6I7/2 absorption transition of Gd3+, and at 395
nm corresponding to the 7F0 →5L6 absorption transition of Eu3+. The observation of the
8S7/2 →6PJ,
6I7/2 transitions confirms an intense Gd3+→Eu3+ energy transfer. Under excitation at
275 nm, both the UV emission of Gd3+ at 311 nm and the orange-red emissions of Eu3+ at
590-620 nm are observed, and the emission intensity of Gd3+ decreases when Eu3+
concentration increases but does not completely disappear even though the x value reaches 0.30.
The internal and absolute quantum yields obtained at room temperature for an excitation
wavelength of 395 nm are reported in Table 3. The best value is obtained for -NaGdF4:20%
15
Eu3+ sample (Figure 10) for which the absolute photoluminescence quantum yield (PLQY) was
found to be of 11%.
250 300 350 400 450 5000
10
20
30
40
Quantum Yield (%)
Absorption (%)
Wavelength(nm)
Inte
rnal
Qu
an
tum
Yie
ld (
%)
5
10
15
20
25Gd3+
6I 7
/2
6P
7/26P
5/2
5G
J-5
L7
5L
6
5H
J
5D
4
5D
3
Ab
so
rpti
on
(%
)
5D
2
Eu3+
Figure 9 : Internal quantum yield and absorption coefficient of -NaGdF4:20% Eu3+.
The internal efficiency in and the external quantum efficiency ex were determined by
𝑖𝑛 = 𝑁𝑒𝑚
𝑁𝑎𝑏𝑠 [1]
𝑒𝑥 = 𝑁𝑒𝑚
𝑁𝑒𝑥= 𝑖𝑛 (
𝑁𝑎𝑏𝑠
𝑁𝑒𝑥) [2]
where Nem corresponds to the number of photons for the sample’s emission light, Nabs
corresponds to the number of photons that are absorbed by the sample, and Nex corresponds to
the number of photons for the excitation light from a Xe light source. Nem was calculated from
the area of the emission peak for the sample. Nabs was obtained by subtracting the area of the
reflection peak at the excitation wavelength for the sample from that for a sample free standard
holder quartz cell, whereas Nex was calculated from the area of the reflection peak at the
excitation wavelength for a sample free standard holder quartz cell. The two values are obtained
automatically by our absolute PL quantum yield measurement system, equipped with an
integrating sphere Spectralon coated (Hamamatsu QY- C9920−02G) with an uncertainty of 5%
and repeatability better than 2%.
16
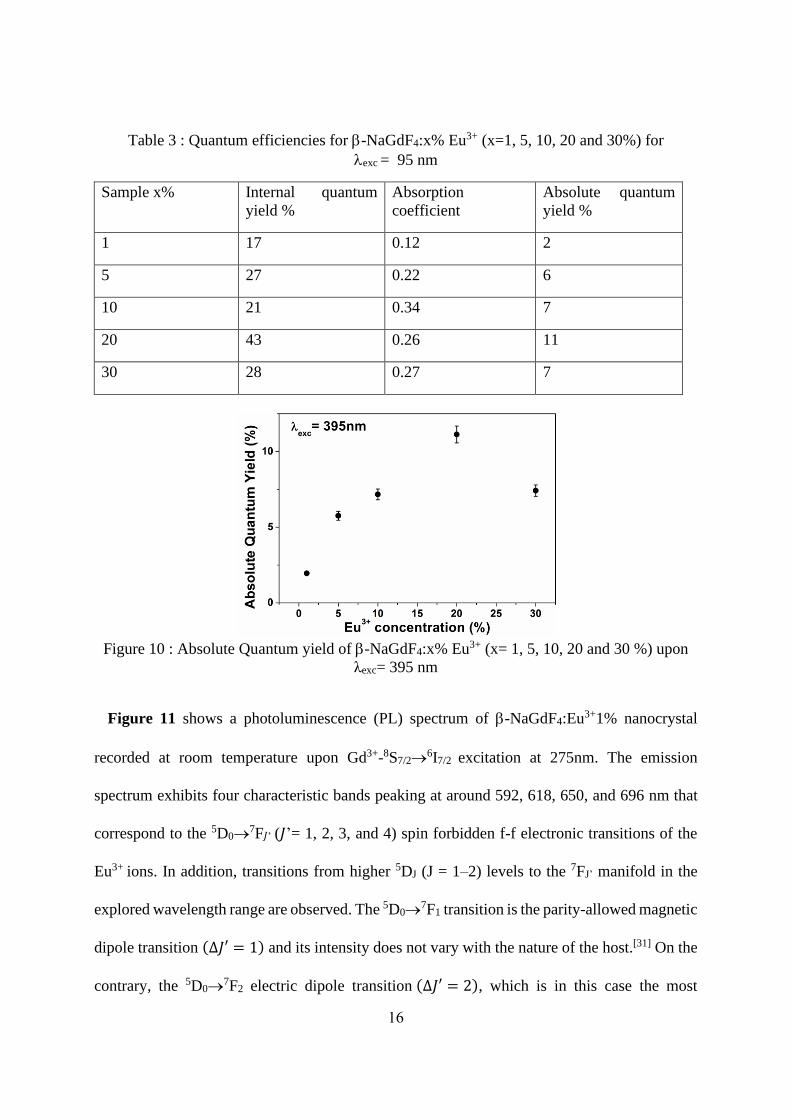
Table 3 : Quantum efficiencies for -NaGdF4:x% Eu3+ (x=1, 5, 10, 20 and 30%) for
exc = 95 nm
Sample x% Internal quantum
yield %
Absorption
coefficient
Absolute quantum
yield %
1 17 0.12 2
5 27 0.22 6
10 21 0.34 7
20 43 0.26 11
30 28 0.27 7
Figure 10 : Absolute Quantum yield of -NaGdF4:x% Eu3+ (x= 1, 5, 10, 20 and 30 %) upon
λexc= 395 nm
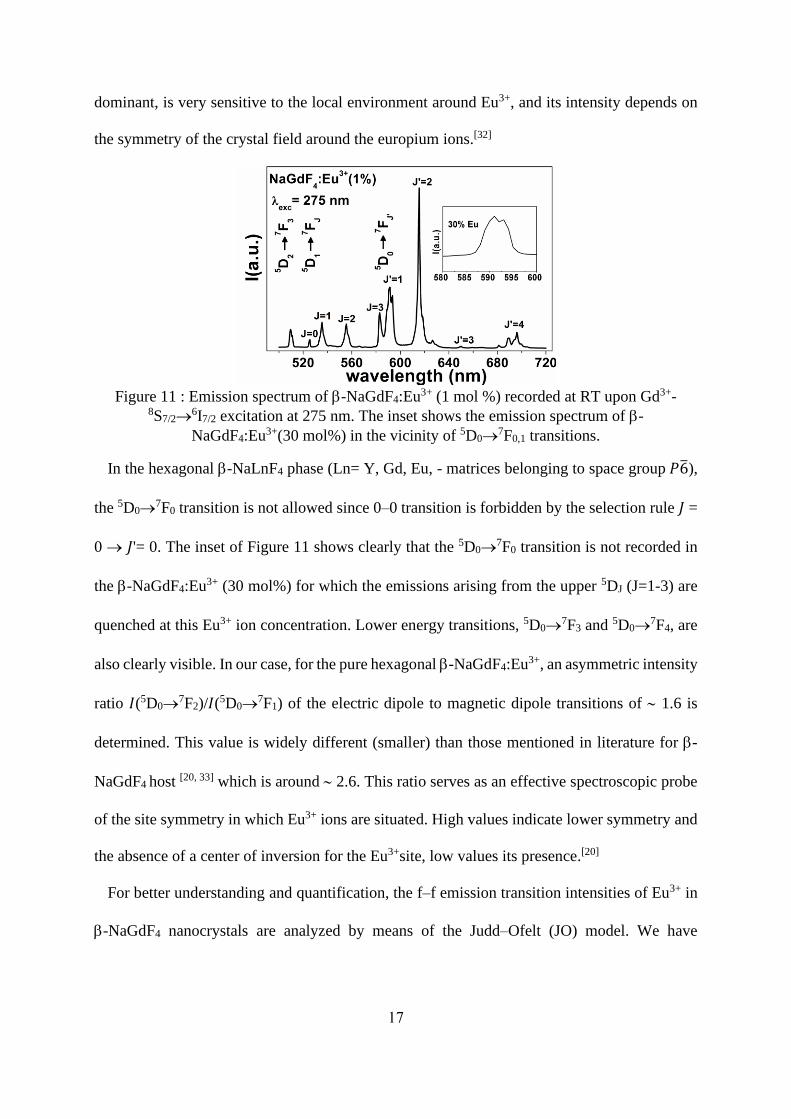
Figure 11 shows a photoluminescence (PL) spectrum of -NaGdF4:Eu3+1% nanocrystal
recorded at room temperature upon Gd3+-8S7/2→6I7/2 excitation at 275nm. The emission
spectrum exhibits four characteristic bands peaking at around 592, 618, 650, and 696 nm that
correspond to the 5D0→7F𝐽’ (𝐽’= 1, 2, 3, and 4) spin forbidden f-f electronic transitions of the
Eu3+ ions. In addition, transitions from higher 5DJ (J = 1–2) levels to the 7FJ’ manifold in the
explored wavelength range are observed. The 5D0→7F1 transition is the parity-allowed magnetic
dipole transition (Δ𝐽′ = 1) and its intensity does not vary with the nature of the host.[31] On the
contrary, the 5D0→7F2 electric dipole transition (Δ𝐽′ = 2), which is in this case the most
17
dominant, is very sensitive to the local environment around Eu3+, and its intensity depends on
the symmetry of the crystal field around the europium ions.[32]
Figure 11 : Emission spectrum of -NaGdF4:Eu3+ (1 mol %) recorded at RT upon Gd3+-
8S7/2→6I7/2 excitation at 275 nm. The inset shows the emission spectrum of -
NaGdF4:Eu3+(30 mol%) in the vicinity of 5D0→7F0,1 transitions.
In the hexagonal -NaLnF4 phase (Ln= Y, Gd, Eu, - matrices belonging to space group 𝑃6̅),
the 5D0→7F0 transition is not allowed since 0–0 transition is forbidden by the selection rule 𝐽 =
0 → 𝐽'= 0. The inset of Figure 11 shows clearly that the 5D0→7F0 transition is not recorded in
the -NaGdF4:Eu3+ (30 mol%) for which the emissions arising from the upper 5DJ (J=1-3) are
quenched at this Eu3+ ion concentration. Lower energy transitions, 5D0→7F3 and 5D0→
7F4, are
also clearly visible. In our case, for the pure hexagonal -NaGdF4:Eu3+, an asymmetric intensity
ratio 𝐼(5D0→7F2)/𝐼(5D0→
7F1) of the electric dipole to magnetic dipole transitions of 1.6 is
determined. This value is widely different (smaller) than those mentioned in literature for -
NaGdF4 host [20, 33] which is around 2.6. This ratio serves as an effective spectroscopic probe
of the site symmetry in which Eu3+ ions are situated. High values indicate lower symmetry and
the absence of a center of inversion for the Eu3+site, low values its presence.[20]
For better understanding and quantification, the f–f emission transition intensities of Eu3+ in
-NaGdF4 nanocrystals are analyzed by means of the Judd–Ofelt (JO) model. We have
18
calculated the asymmetry parameter Ω2 which gives information on the intensity and nature of
the hypersensitive transition of the Eu3+ions (for more details see Supporting Information).
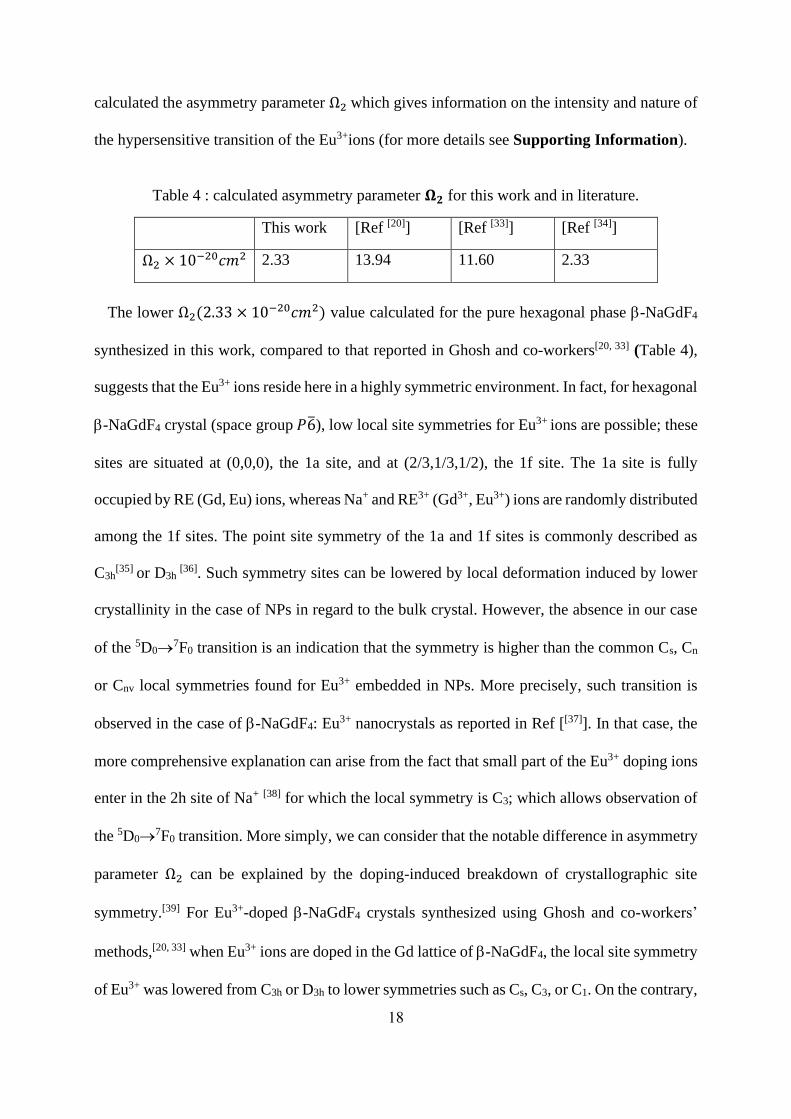
Table 4 : calculated asymmetry parameter 𝛀𝟐 for this work and in literature.
This work [Ref [20]] [Ref [33]] [Ref [34]]
Ω2 × 10⁻²⁰𝑐𝑚2 2.33 13.94 11.60 2.33
The lower Ω2(2.33 × 10⁻²⁰𝑐𝑚2) value calculated for the pure hexagonal phase -NaGdF4
synthesized in this work, compared to that reported in Ghosh and co-workers[20, 33] (Table 4),
suggests that the Eu3+ ions reside here in a highly symmetric environment. In fact, for hexagonal
-NaGdF4 crystal (space group 𝑃6̅), low local site symmetries for Eu3+ ions are possible; these
sites are situated at (0,0,0), the 1a site, and at (2/3,1/3,1/2), the 1f site. The 1a site is fully
occupied by RE (Gd, Eu) ions, whereas Na+ and RE3+ (Gd3+, Eu3+) ions are randomly distributed
among the 1f sites. The point site symmetry of the 1a and 1f sites is commonly described as
C3h[35]
or D3h [36]. Such symmetry sites can be lowered by local deformation induced by lower
crystallinity in the case of NPs in regard to the bulk crystal. However, the absence in our case
of the 5D0→7F0 transition is an indication that the symmetry is higher than the common Cs, Cn
or Cnv local symmetries found for Eu3+ embedded in NPs. More precisely, such transition is
observed in the case of -NaGdF4: Eu3+ nanocrystals as reported in Ref [[37]]. In that case, the
more comprehensive explanation can arise from the fact that small part of the Eu3+ doping ions
enter in the 2h site of Na+ [38] for which the local symmetry is C3; which allows observation of
the 5D0→7F0 transition. More simply, we can consider that the notable difference in asymmetry
parameter Ω2 can be explained by the doping-induced breakdown of crystallographic site
symmetry.[39] For Eu3+-doped -NaGdF4 crystals synthesized using Ghosh and co-workers’
methods,[20, 33] when Eu3+ ions are doped in the Gd lattice of -NaGdF4, the local site symmetry
of Eu3+ was lowered from C3h or D3h to lower symmetries such as Cs, C3, or C1. On the contrary,
19
using our method and the method reported by Ref [34], the local site symmetry of Eu3+ ions
remains C3h or D3h. Since the numbering of the Stark components of the 5D0→7FJ transitions is
not possible, due the nanoscopic form of the samples, we can’t state on the nature of the site
symmetry. Such considerations indicate that the site symmetry of Eu3+ ions in the NPs is
dependent on the synthesis method used for their preparation.
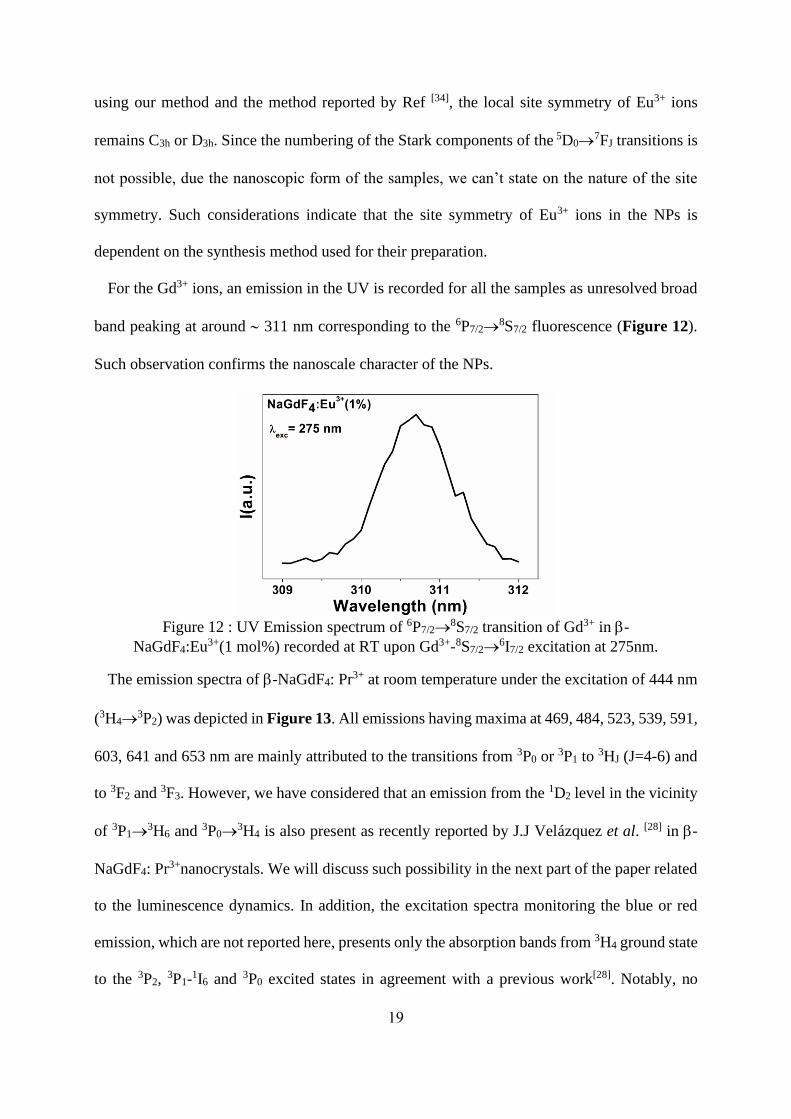
For the Gd3+ ions, an emission in the UV is recorded for all the samples as unresolved broad
band peaking at around 311 nm corresponding to the 6P7/2→8S7/2 fluorescence (Figure 12).
Such observation confirms the nanoscale character of the NPs.
Figure 12 : UV Emission spectrum of 6P7/2→
8S7/2 transition of Gd3+ in -
NaGdF4:Eu3+(1 mol%) recorded at RT upon Gd3+-8S7/2→6I7/2 excitation at 275nm.
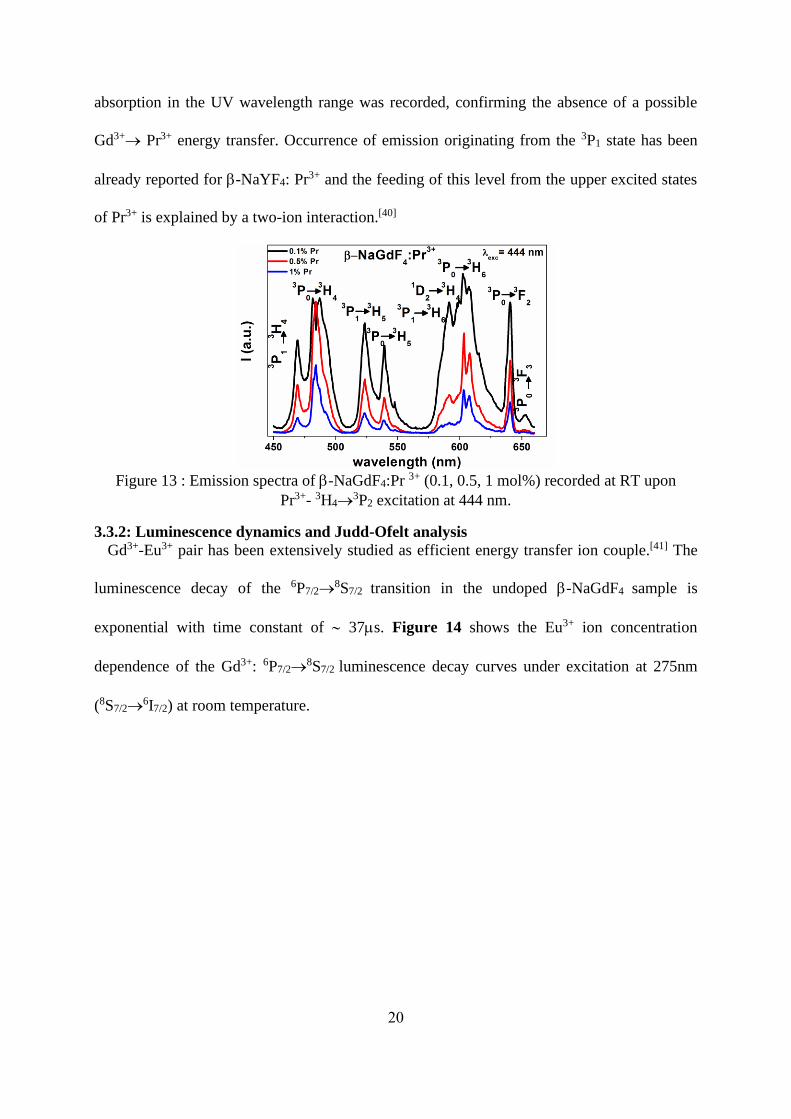
The emission spectra of -NaGdF4: Pr3+ at room temperature under the excitation of 444 nm
(3H4→3P2) was depicted in Figure 13. All emissions having maxima at 469, 484, 523, 539, 591,
603, 641 and 653 nm are mainly attributed to the transitions from 3P0 or 3P1 to 3HJ (J=4-6) and
to 3F2 and 3F3. However, we have considered that an emission from the 1D2 level in the vicinity
of 3P1→3H6 and 3P0→
3H4 is also present as recently reported by J.J Velázquez et al. [28] in -
NaGdF4: Pr3+nanocrystals. We will discuss such possibility in the next part of the paper related
to the luminescence dynamics. In addition, the excitation spectra monitoring the blue or red
emission, which are not reported here, presents only the absorption bands from 3H4 ground state
to the 3P2, 3P1-
1I6 and 3P0 excited states in agreement with a previous work[28]. Notably, no
20
absorption in the UV wavelength range was recorded, confirming the absence of a possible
Gd3+→ Pr3+ energy transfer. Occurrence of emission originating from the 3P1 state has been
already reported for -NaYF4: Pr3+ and the feeding of this level from the upper excited states
of Pr3+ is explained by a two-ion interaction.[40]
Figure 13 : Emission spectra of -NaGdF4:Pr 3+ (0.1, 0.5, 1 mol%) recorded at RT upon
Pr3+- 3H4→3P2 excitation at 444 nm.
3.3.2: Luminescence dynamics and Judd-Ofelt analysis
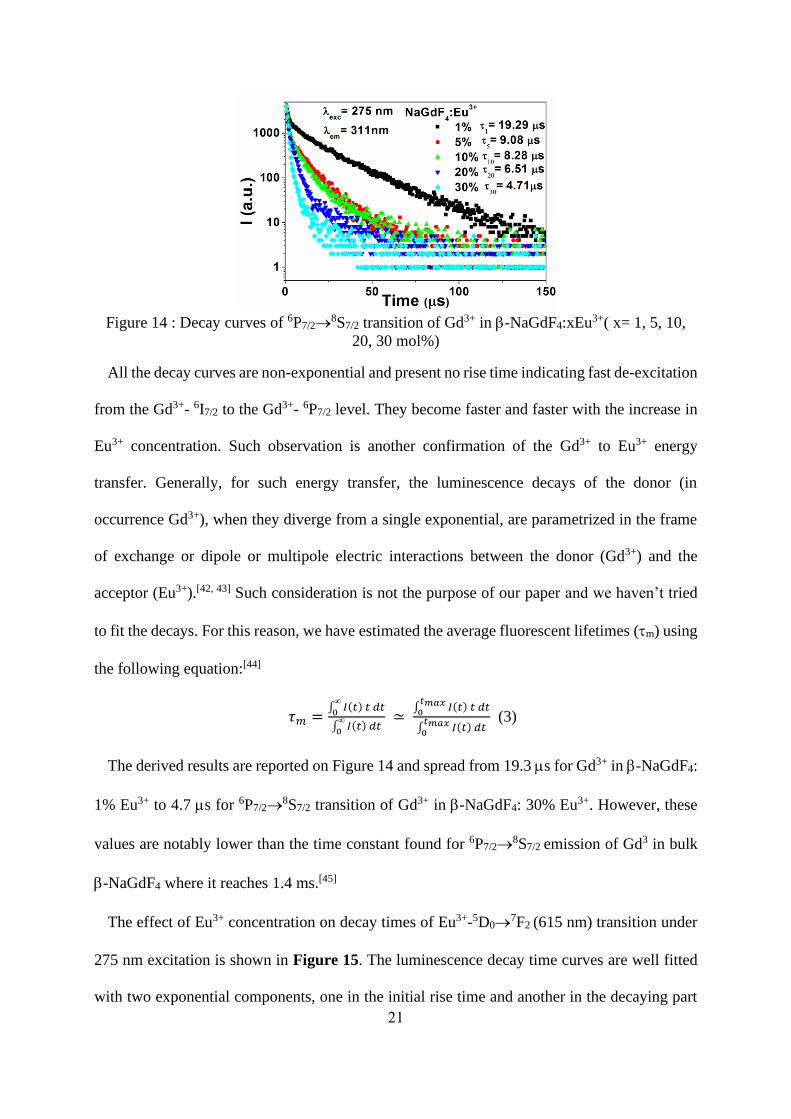
Gd3+-Eu3+ pair has been extensively studied as efficient energy transfer ion couple.[41] The
luminescence decay of the 6P7/2→8S7/2 transition in the undoped -NaGdF4 sample is
exponential with time constant of 37ms. Figure 14 shows the Eu3+ ion concentration
dependence of the Gd3+: 6P7/2→8S7/2 luminescence decay curves under excitation at 275nm
(8S7/2→6I7/2) at room temperature.
21
Figure 14 : Decay curves of 6P7/2→
8S7/2 transition of Gd3+ in -NaGdF4:xEu3+( x= 1, 5, 10,
20, 30 mol%)
All the decay curves are non-exponential and present no rise time indicating fast de-excitation
from the Gd3+- 6I7/2 to the Gd3+- 6P7/2 level. They become faster and faster with the increase in
Eu3+ concentration. Such observation is another confirmation of the Gd3+ to Eu3+ energy
transfer. Generally, for such energy transfer, the luminescence decays of the donor (in
occurrence Gd3+), when they diverge from a single exponential, are parametrized in the frame
of exchange or dipole or multipole electric interactions between the donor (Gd3+) and the
acceptor (Eu3+).[42, 43] Such consideration is not the purpose of our paper and we haven’t tried
to fit the decays. For this reason, we have estimated the average fluorescent lifetimes (m) using
the following equation:[44]
𝜏𝑚 =∫ 𝐼(𝑡) 𝑡 𝑑𝑡
0
∫ 𝐼(𝑡) 𝑑𝑡
0
≃ ∫ 𝐼(𝑡) 𝑡 𝑑𝑡
𝑡𝑚𝑎𝑥0
∫ 𝐼(𝑡) 𝑑𝑡𝑡𝑚𝑎𝑥
0
(3)
The derived results are reported on Figure 14 and spread from 19.3 ms for Gd3+ in -NaGdF4:
1% Eu3+ to 4.7 ms for 6P7/2→8S7/2 transition of Gd3+ in -NaGdF4: 30% Eu3+. However, these
values are notably lower than the time constant found for 6P7/2→8S7/2 emission of Gd3 in bulk
-NaGdF4 where it reaches 1.4 ms.[45]
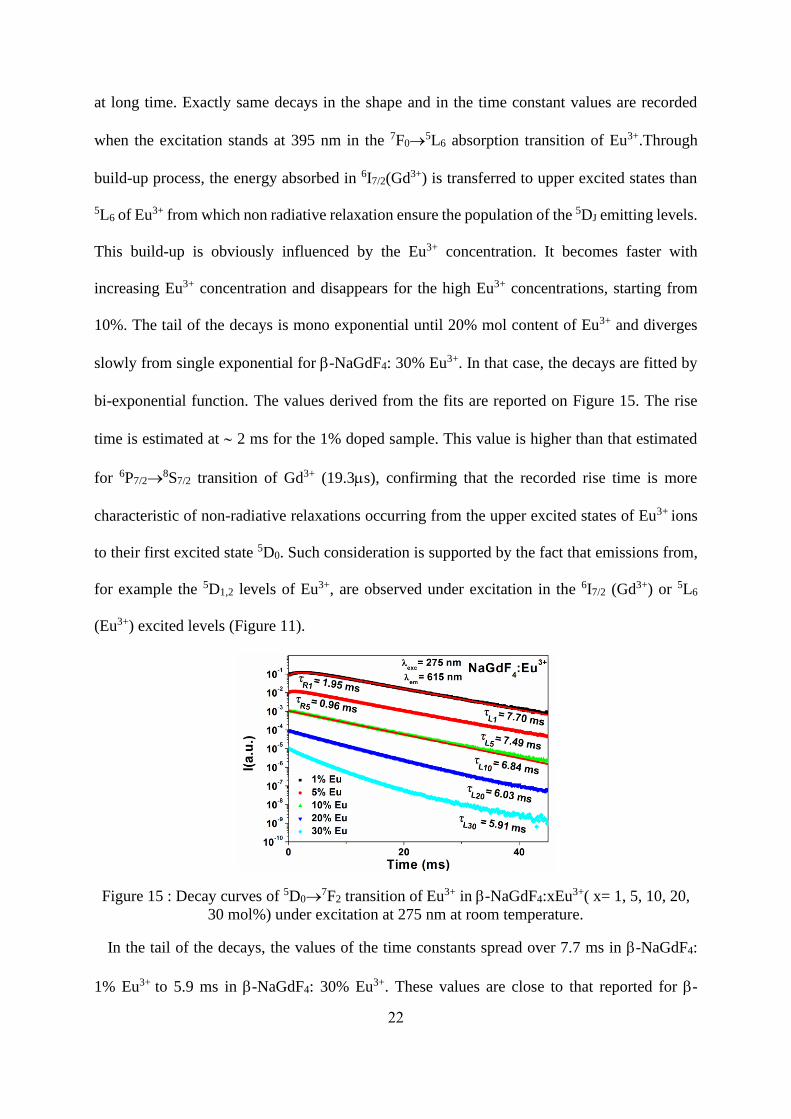
The effect of Eu3+ concentration on decay times of Eu3+-5D0→7F2 (615 nm) transition under
275 nm excitation is shown in Figure 15. The luminescence decay time curves are well fitted
with two exponential components, one in the initial rise time and another in the decaying part
22
at long time. Exactly same decays in the shape and in the time constant values are recorded
when the excitation stands at 395 nm in the 7F0→5L6 absorption transition of Eu3+.Through
build-up process, the energy absorbed in 6I7/2(Gd3+) is transferred to upper excited states than
5L6 of Eu3+ from which non radiative relaxation ensure the population of the 5DJ emitting levels.
This build-up is obviously influenced by the Eu3+ concentration. It becomes faster with
increasing Eu3+ concentration and disappears for the high Eu3+ concentrations, starting from
10%. The tail of the decays is mono exponential until 20% mol content of Eu3+ and diverges
slowly from single exponential for -NaGdF4: 30% Eu3+. In that case, the decays are fitted by
bi-exponential function. The values derived from the fits are reported on Figure 15. The rise
time is estimated at 2 ms for the 1% doped sample. This value is higher than that estimated
for 6P7/2→8S7/2 transition of Gd3+ (19.3ms), confirming that the recorded rise time is more
characteristic of non-radiative relaxations occurring from the upper excited states of Eu3+ ions
to their first excited state 5D0. Such consideration is supported by the fact that emissions from,
for example the 5D1,2 levels of Eu3+, are observed under excitation in the 6I7/2 (Gd3+) or 5L6
(Eu3+) excited levels (Figure 11).
Figure 15 : Decay curves of 5D0→7F2 transition of Eu3+ in -NaGdF4:xEu3+( x= 1, 5, 10, 20,
30 mol%) under excitation at 275 nm at room temperature.
In the tail of the decays, the values of the time constants spread over 7.7 ms in -NaGdF4:
1% Eu3+ to 5.9 ms in -NaGdF4: 30% Eu3+. These values are close to that reported for -
23
NaGdF4: 2% Eu3+ nanorods for which the measured lifetime is 9.17 ms under excitation at 272
nm (8S7/2→6I7/2).
[20] However, in that report, the nanorods are mixed materials containing both
a and -NaGdF4 phases and also exhibit the 5D0→7F0 in addition of a high asymmetry
parameter Ω2 of 13.94 (Table 4).
JO intensity parameters are essential indicators in judging radiative potential of RE ions in
different hosts, which are usually derived from absorption spectrum. Effective absorption
measurement is very difficult for powdered phosphors but some reports exist in the literature
[46-48]. Indeed, owing to the special energy level structure of Eu3+, they can be calculated from
the suitably calibrated emission spectra to correct for the detector response, grating efficiency
and other optical elements which may be related to the experimental set-up and taking into
account the total area of each 5D0→7FJ transitions. The several steps of the procedure are
reported in supplementary information SI1 for Eu3+-doped samples.
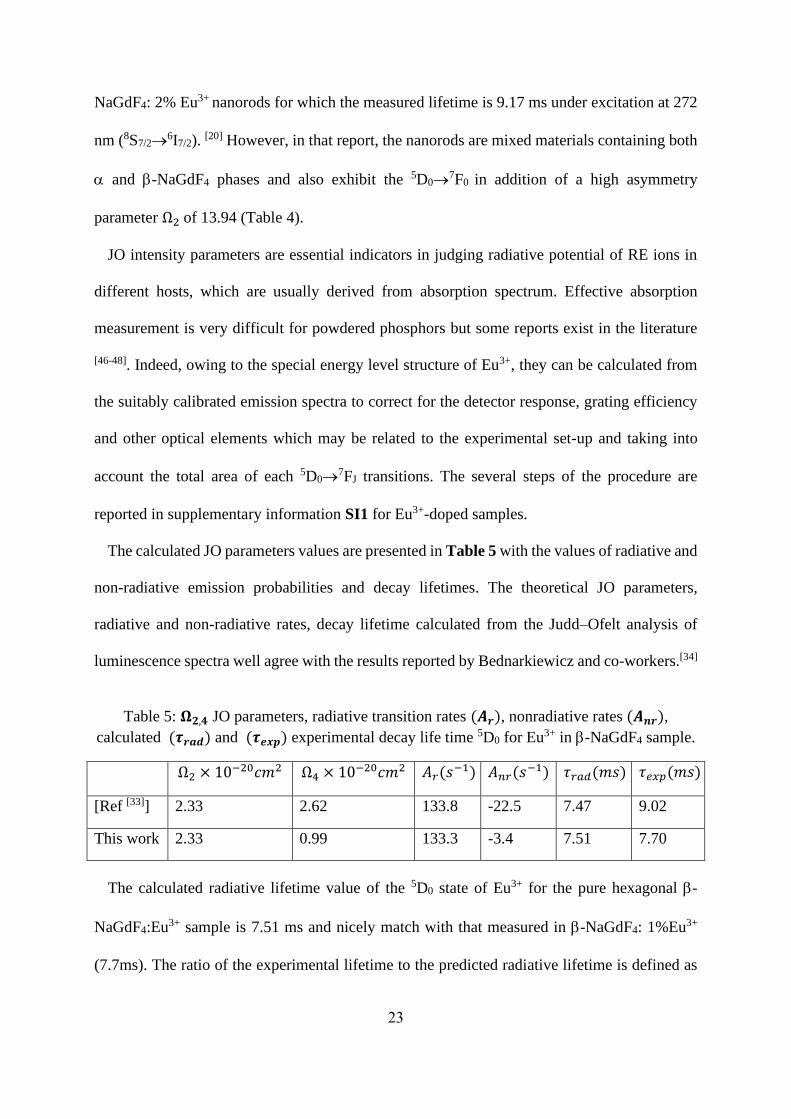
The calculated JO parameters values are presented in Table 5 with the values of radiative and
non-radiative emission probabilities and decay lifetimes. The theoretical JO parameters,
radiative and non-radiative rates, decay lifetime calculated from the Judd–Ofelt analysis of
luminescence spectra well agree with the results reported by Bednarkiewicz and co-workers.[34]
Table 5: 𝛀𝟐,𝟒 JO parameters, radiative transition rates (𝑨𝒓), nonradiative rates (𝑨𝒏𝒓),
calculated (𝝉𝒓𝒂𝒅) and (𝝉𝒆𝒙𝒑) experimental decay life time 5D0 for Eu3+ in -NaGdF4 sample.
Ω2 × 10⁻²⁰𝑐𝑚2 Ω4 × 10⁻²⁰𝑐𝑚2 𝐴𝑟(𝑠−1) 𝐴𝑛𝑟(𝑠−1) 𝜏𝑟𝑎𝑑(𝑚𝑠) 𝜏𝑒𝑥𝑝(𝑚𝑠)
[Ref [33]] 2.33 2.62 133.8 -22.5 7.47 9.02
This work 2.33 0.99 133.3 -3.4 7.51 7.70
The calculated radiative lifetime value of the 5D0 state of Eu3+ for the pure hexagonal -
NaGdF4:Eu3+ sample is 7.51 ms and nicely match with that measured in -NaGdF4: 1%Eu3+
(7.7ms). The ratio of the experimental lifetime to the predicted radiative lifetime is defined as
24
quantum efficiency (QE = 𝜏𝑒𝑥𝑝/𝜏𝑟𝑎𝑑) of the corresponding level. It depends on the considered
sample, since the 𝜏𝑒𝑥𝑝 is modified by the Eu3+ amount contained in the material. In our case,
the derived QE values are of 100% for 1 and 5% Eu3+ content and of 90%, and 80% for
respectively the 10% Eu3+ content and 20 as well as 30% Eu3+ content. These values are
questionable, because it is necessary to take into account uncertainties on the measured values
and on the JO analysis derived values. An estimated uncertainty of 5% for each of these values
leads to an overall uncertainty of 10%. The most important information is the QE value of the
20% Eu3+ for which the measured absolute (external) quantum yield is of 11% ± 5% is in the
order range of the external quantum obtained by correcting the QE from the absorption
coefficient (Table 3) which is of 90% x 26% = 23.4% ± 10%.
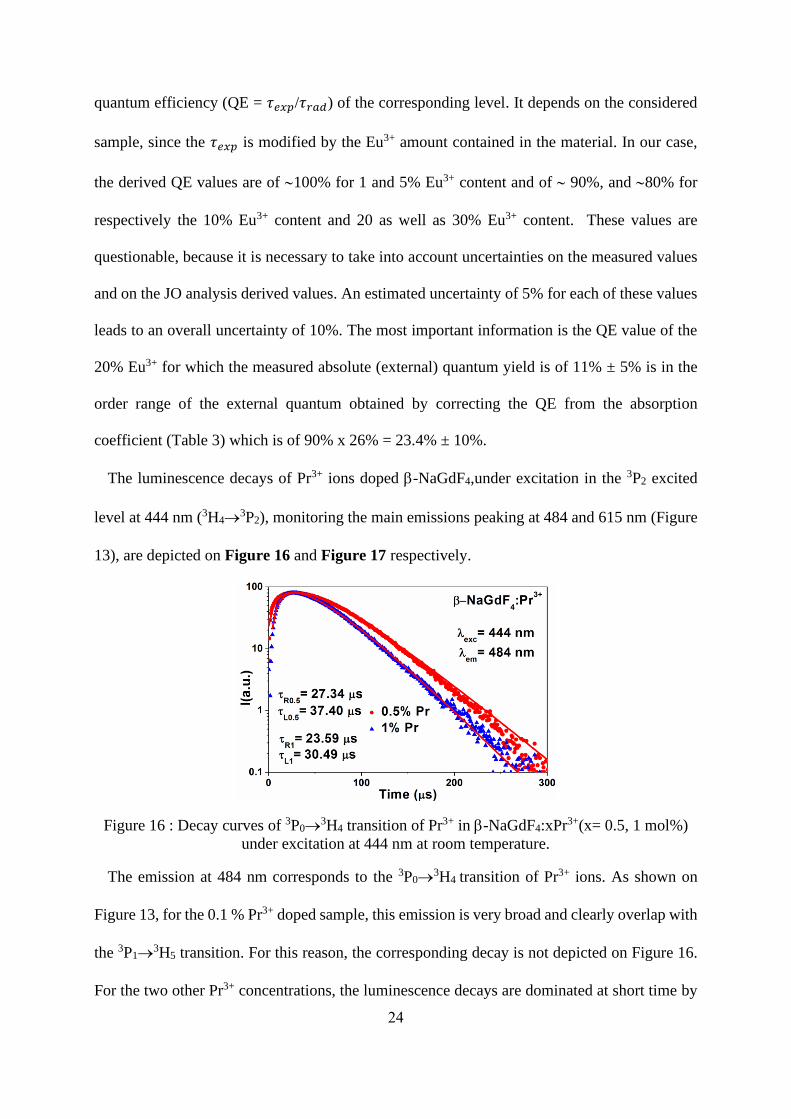
The luminescence decays of Pr3+ ions doped -NaGdF4,under excitation in the 3P2 excited
level at 444 nm (3H4→3P2), monitoring the main emissions peaking at 484 and 615 nm (Figure
13), are depicted on Figure 16 and Figure 17 respectively.
Figure 16 : Decay curves of 3P0→3H4 transition of Pr3+ in -NaGdF4:xPr3+(x= 0.5, 1 mol%)
under excitation at 444 nm at room temperature.
The emission at 484 nm corresponds to the 3P0→3H4 transition of Pr3+ ions. As shown on
Figure 13, for the 0.1 % Pr3+ doped sample, this emission is very broad and clearly overlap with
the 3P1→3H5 transition. For this reason, the corresponding decay is not depicted on Figure 16.
For the two other Pr3+ concentrations, the luminescence decays are dominated at short time by
25
a build-up characteristic of the feeding of the 3P0 level from the upper excited states followed
in the tail by an exponential decaying. The values derived from the fits by two exponential
function, one in the rise and another in the tail of the decays, are reported on Figure 16. The
decaying time constants of the 3P0 level, of 37 and 30 ms for respectively the 0.5% and 1 %
doped samples are close to the radiative lifetimes found in -NaYF4 :Pr3+(i.e. 22 ms)[49] or in
LiYF4: Pr3+ (i.e. 38 ms),[50] but diverge notably from the values reported for -NaGdF4:Pr3+
nanocrystals doped with 0.1% and 0.5% Pr3+ which they are of 10 and 6 ms respectively.[20]
Such discrepancy can perhaps be explained by the fact that, in ref [20], the -NaGdF4:Pr3+
nanocrystals are synthesized in-situ in oxyfluoride glass-ceramics by the melting-quenching
method which can induce a large amount of defects at the surface of the nanocrystals inherent
to the interface between the glass and the nanocrystals; these defects being responsible for the
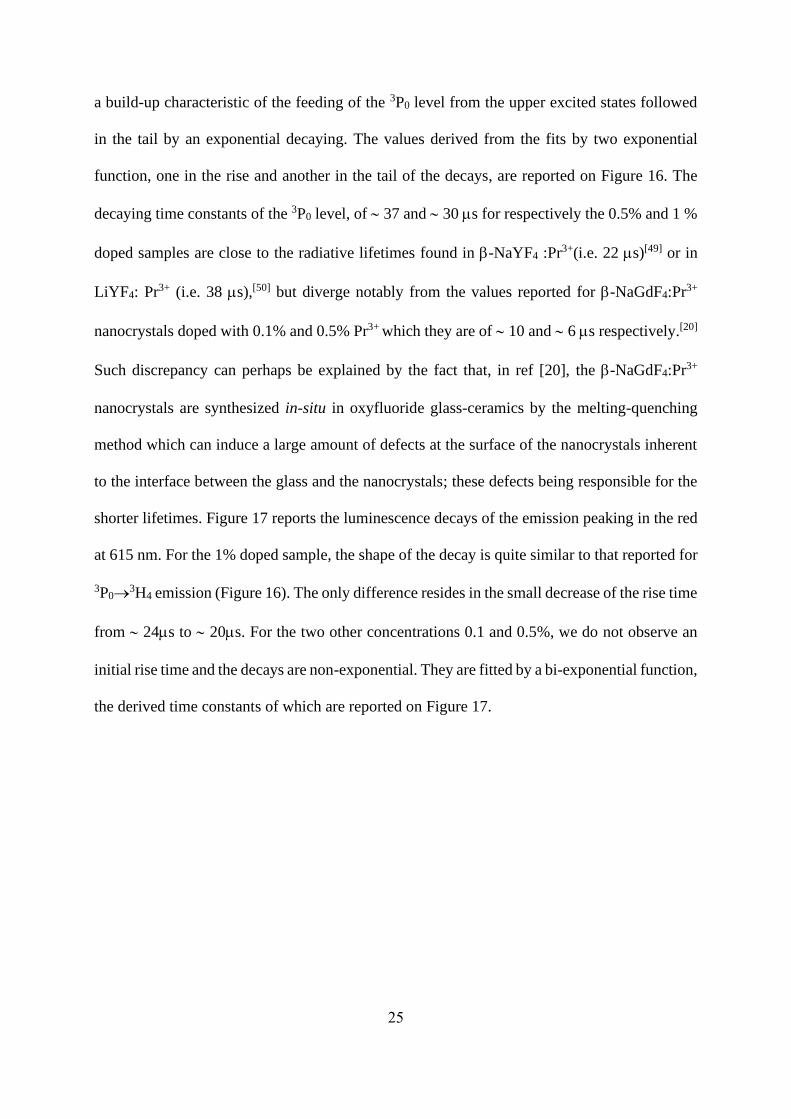
shorter lifetimes. Figure 17 reports the luminescence decays of the emission peaking in the red
at 615 nm. For the 1% doped sample, the shape of the decay is quite similar to that reported for
3P0→3H4 emission (Figure 16). The only difference resides in the small decrease of the rise time
from 24ms to 20ms. For the two other concentrations 0.1 and 0.5%, we do not observe an
initial rise time and the decays are non-exponential. They are fitted by a bi-exponential function,
the derived time constants of which are reported on Figure 17.
26
Figure 17 : Decay curves of red emission at 615 nm of Pr3+ in -NaGdF4:xPr3+(x= 0.1, 0.5,
1 mol%) under excitation at 444 nm at room temperature.
The values found in the tail are consistent with the radiative lifetime of the 3P0 level as
discussed above. Origin of the short time component of 13-14 ms is puzzling. It can’t
correspond to the time constant of the luminescence arising from the 3P1 level, since its value
can be estimated from the rise time of the decay of 3P0→3H4 emission which is considered
around 23-27ms. Another possibility resides in considering that this slow component can be
attributed to the radiative decaying from the 1D2 level to the 3H4 ground state of Pr3+ ions. The
1D2 level in this scheme is populated via cross-relaxation processes between Pr3+ ions such as
3P0→3H6 and 3H4→
1D2. Such mechanism is concentration-dependent since the 1D2 level exhibit
rapid quenching and has already been reported for example in the oxides, like YPO4:Pr3+,[51] in
which the intensity ratio between the emissions arising from the 3P0 and 1D2 increases with
increasing the Pr3+ concentration. Such consideration can perhaps explain satisfactorily why the
luminescence decay of the emission peaking at 615 nm for 1 % concentration is more
characteristic of the radiative decaying from the 3P0 level. However, the time constant of the
1D2 level in -NaYF4: 0.1%Pr3+ bulk powdered samples that we have prepared by solid-state
reaction has been measured around 313 ms at 300 K, which is larger than the one we have
measured in the NPs obtained by co-precipitation. In conclusion, some supplementary
experiments are needed to state about the possible emission from the 1D2 level of Pr3+ ions in -
27
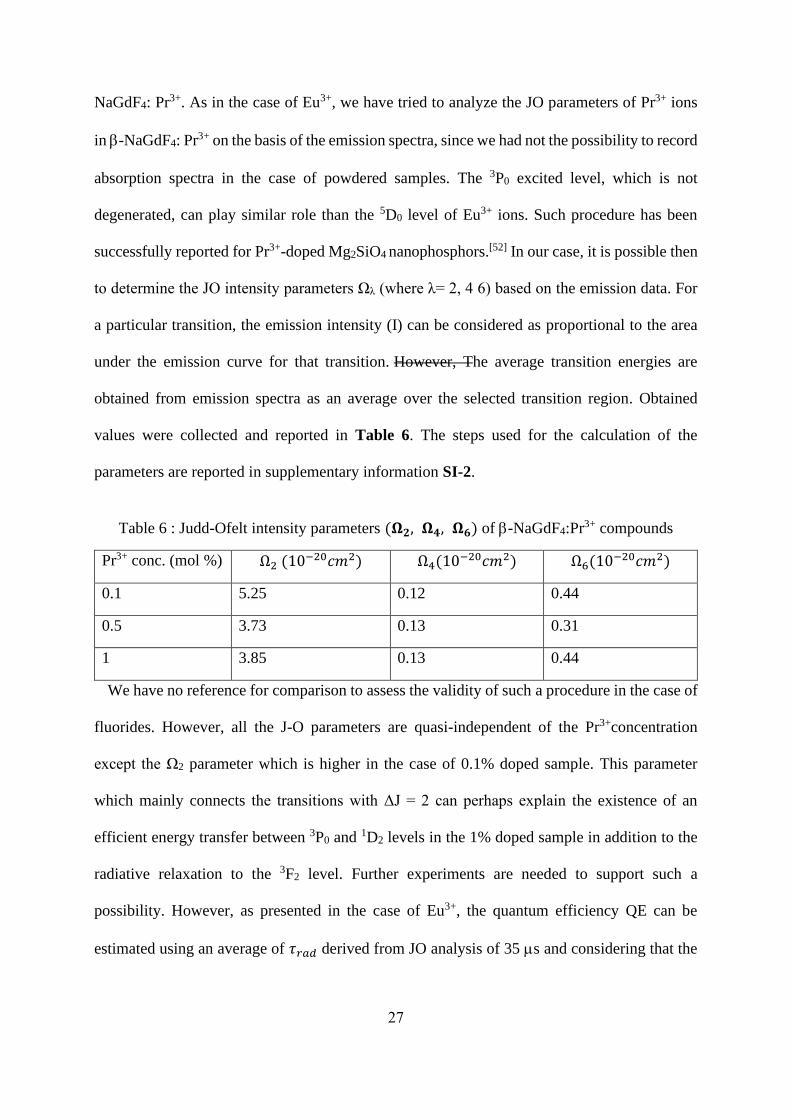
NaGdF4: Pr3+. As in the case of Eu3+, we have tried to analyze the JO parameters of Pr3+ ions
in -NaGdF4: Pr3+ on the basis of the emission spectra, since we had not the possibility to record
absorption spectra in the case of powdered samples. The 3P0 excited level, which is not
degenerated, can play similar role than the 5D0 level of Eu3+ ions. Such procedure has been
successfully reported for Pr3+-doped Mg2SiO4 nanophosphors.[52] In our case, it is possible then
to determine the JO intensity parameters Ωλ (where λ= 2, 4 6) based on the emission data. For
a particular transition, the emission intensity (I) can be considered as proportional to the area
under the emission curve for that transition. However, The average transition energies are
obtained from emission spectra as an average over the selected transition region. Obtained
values were collected and reported in Table 6. The steps used for the calculation of the
parameters are reported in supplementary information SI-2.
Table 6 : Judd-Ofelt intensity parameters (𝛀𝟐, 𝛀𝟒, 𝛀𝟔) of -NaGdF4:Pr3+ compounds
Pr3+ conc. (mol %) Ω2 (10−20𝑐𝑚2) Ω4(10−20𝑐𝑚2) Ω6(10−20𝑐𝑚2)
0.1 5.25 0.12 0.44
0.5 3.73 0.13 0.31
1 3.85 0.13 0.44
We have no reference for comparison to assess the validity of such a procedure in the case of
fluorides. However, all the J-O parameters are quasi-independent of the Pr3+concentration
except the Ω2 parameter which is higher in the case of 0.1% doped sample. This parameter
which mainly connects the transitions with ΔJ = 2 can perhaps explain the existence of an
efficient energy transfer between 3P0 and 1D2 levels in the 1% doped sample in addition to the
radiative relaxation to the 3F2 level. Further experiments are needed to support such a
possibility. However, as presented in the case of Eu3+, the quantum efficiency QE can be
estimated using an average of 𝜏𝑟𝑎𝑑 derived from JO analysis of 35 ms and considering that the
28
experimental 𝜏𝑒𝑥𝑝 can be estimated from the tail of the decays; the calculated QE values are of
100, 98 and 87% for 0.1, 0.5 and % Pr3+ content in the samples.
3.3.3: Quantum cutting
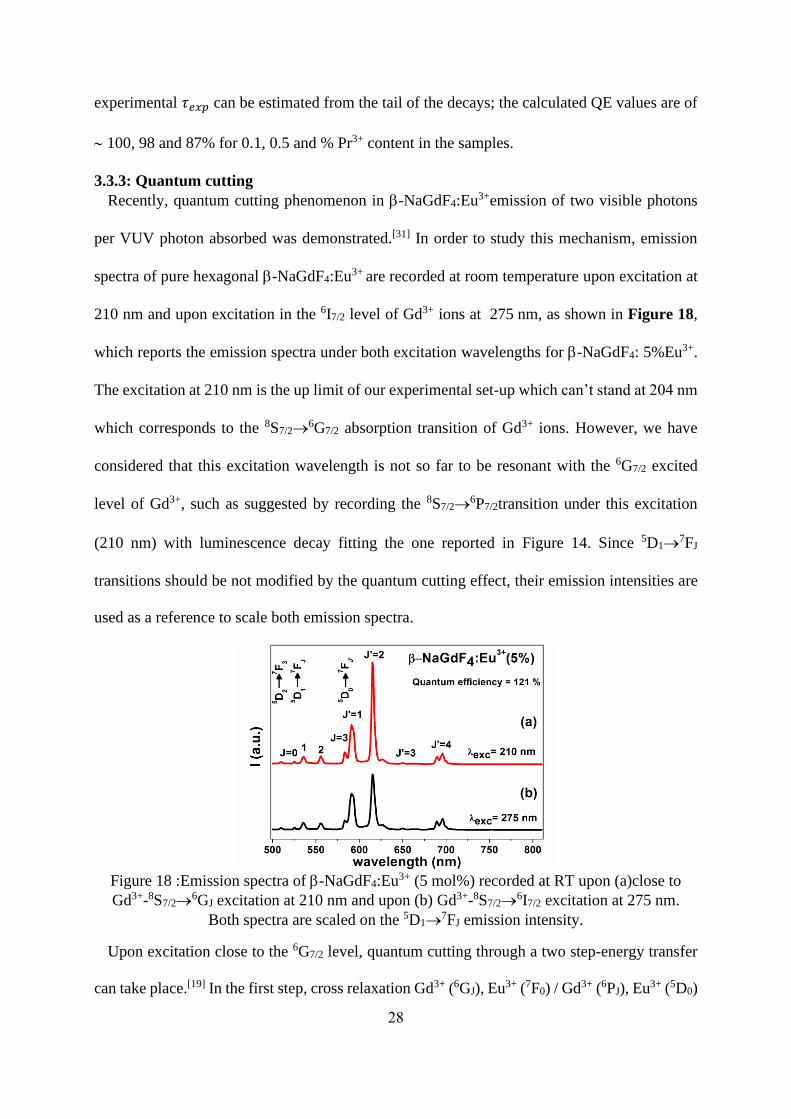
Recently, quantum cutting phenomenon in -NaGdF4:Eu3+emission of two visible photons
per VUV photon absorbed was demonstrated.[31] In order to study this mechanism, emission
spectra of pure hexagonal -NaGdF4:Eu3+ are recorded at room temperature upon excitation at
210 nm and upon excitation in the 6I7/2 level of Gd3+ ions at 275 nm, as shown in Figure 18,
which reports the emission spectra under both excitation wavelengths for -NaGdF4: 5%Eu3+.
The excitation at 210 nm is the up limit of our experimental set-up which can’t stand at 204 nm
which corresponds to the 8S7/2→6G7/2 absorption transition of Gd3+ ions. However, we have
considered that this excitation wavelength is not so far to be resonant with the 6G7/2 excited
level of Gd3+, such as suggested by recording the 8S7/2→6P7/2transition under this excitation
(210 nm) with luminescence decay fitting the one reported in Figure 14. Since 5D1→7FJ
transitions should be not modified by the quantum cutting effect, their emission intensities are
used as a reference to scale both emission spectra.
Figure 18 :Emission spectra of -NaGdF4:Eu3+ (5 mol%) recorded at RT upon (a)close to
Gd3+-8S7/2→6GJ excitation at 210 nm and upon (b) Gd3+-8S7/2→
6I7/2 excitation at 275 nm.
Both spectra are scaled on the 5D1→7FJ emission intensity.
Upon excitation close to the 6G7/2 level, quantum cutting through a two step-energy transfer
can take place.[19] In the first step, cross relaxation Gd3+ (6GJ), Eu3+ (7F0) / Gd3+ (6PJ), Eu3+ (5D0)
29
yields one photon, this step will feed only the 5D0 level. In the second step, energy is transferred
from the 6PJ level of Gd3+ to a higher energy level of Eu3+, yielding a normal branching ratio
for the different 5DJ emission bands. When excited at 275 nm (6IJ), a single energy transfer step
to Eu3+ occurs with normal branching ratio for the different 5DJ emission bands. As a result, if
quantum cutting through a two step-energy transfer process happens, significant increase in the
emission intensity from 5D0 will be observed. This is the case for our samples confirming the
occurrence of quantum cutting. The 5D0/5D0,1,2 ratios were calculated both for the excitations at
210 nm and 275 nm and the quantum efficiency of 115, 121 and 118 % are achieved for -
NaGdF4respectively doped 1, 5 and 10% Eu3+. These values are lower than that found for -
NaGdF4: 2 mol% Eu3+nanorods [20] in which the quantum efficiency reaches 187 %. Such a
discrepancy can perhaps be explained by the absence of pure resonant excitation in the 6G7/2
level, leading to some losses by multiphonon relaxations during the cross-relaxation step. VUV
excitation using more adapted experimental set-up are planned to explore in more probing
manner the quantum cutting process in our samples. Same considerations concern the Pr3+
doped -NaGdF4 for which a quantum-cutting was reported in -NaYF4:Pr3+nanocrystals.[21]
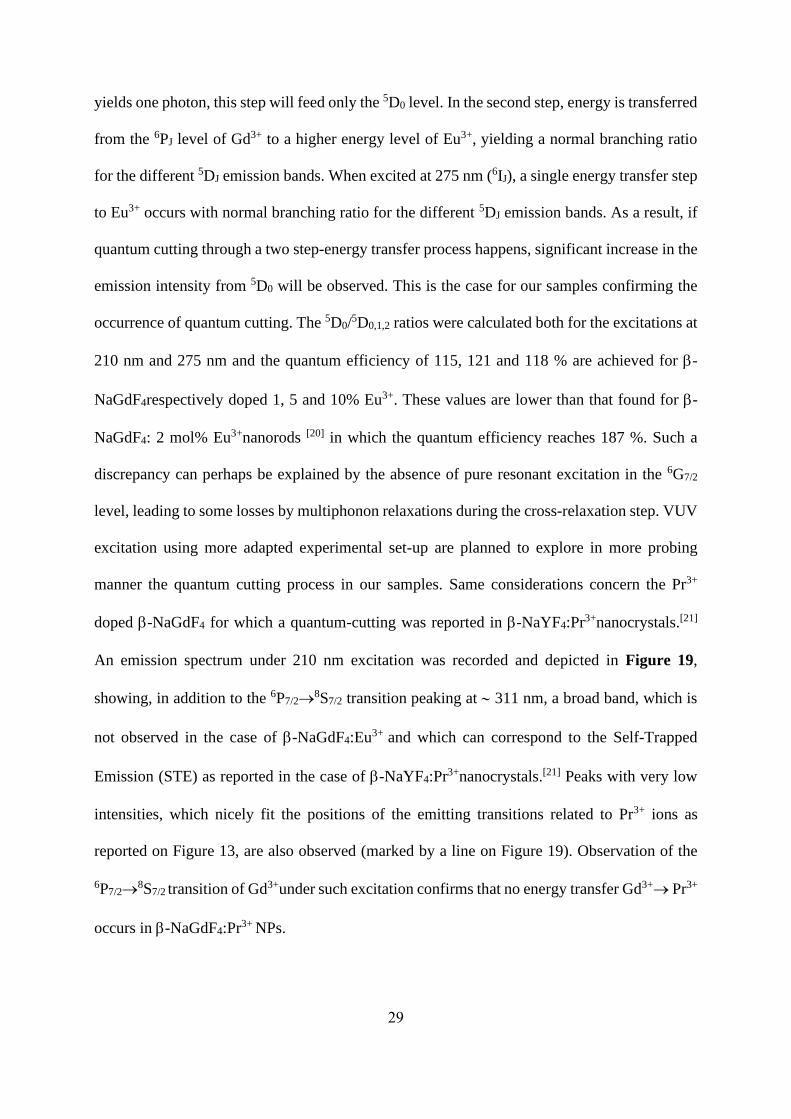
An emission spectrum under 210 nm excitation was recorded and depicted in Figure 19,
showing, in addition to the 6P7/2→8S7/2 transition peaking at 311 nm, a broad band, which is
not observed in the case of -NaGdF4:Eu3+ and which can correspond to the Self-Trapped
Emission (STE) as reported in the case of -NaYF4:Pr3+nanocrystals.[21] Peaks with very low
intensities, which nicely fit the positions of the emitting transitions related to Pr3+ ions as
reported on Figure 13, are also observed (marked by a line on Figure 19). Observation of the
6P7/2→8S7/2 transition of Gd3+under such excitation confirms that no energy transfer Gd3+→ Pr3+
occurs in -NaGdF4:Pr3+ NPs.
30
Figure 19 : Emission spectrum of -NaGdF4:Pr3+ (0.5 mol%) recorded at RT upon
excitation at 210 nm.
Further experiments are planned to efficiently explore the quantum cutting phenomenon in
-NaGdF4:Pr3+.
Conclusion
We reported a very easy and tunable strategy for rapid fabrication of hexagonal phase -
NaGdF4:Ln3+ (Ln=Eu or Pr) nanorods at low temperature for the first time, leading to nanorods
of around 140 nm in the length characterized by a highly uniform distribution. Experimental
results indicate that the Eu3+or Pr3+doping rates have no effect on both crystalline phase and
morphology of the -NaGdF4 NPs. This new synthesis process could be applied to the whole
lanthanide series. The optical properties of Eu3+ or Pr3+doped -NaGdF4 were then deeply
studied as a function of the luminescent active ions content and wavelength excitation. The
strongest luminescence was observed for β-NaGdF4: 20%Eu3+ and β-NaGdF4: 0.5%Pr3+. The
measured decay times of the luminescence arising from the main emitting levels of Eu3+ or Pr3+
under near VUV, UV or visible excitations, show characteristic radiative de-excitations, the
time constants of which are quite close to that found in bulk materials. Quantum cutting by
down conversion process between Gd3+ and Eu3+ was also evidenced upon near VUV
excitation. STE emission is also observed in the case of Pr3+ doped β-NaGdF4.
The analysis of optical intensities and comparison with measured lifetimes was performed by
means of the Judd–Ofelt theory based on luminescence spectra. The observed emission bands
31
5D0→7F1and 5D0→
7F2 of Eu3+ are well-resolved, which enabled the determination of the Ω2 and
Ω4 intensity parameter values. A low value of asymmetry parameter Ω2 was obtained, which
indicates a relatively high symmetry at the Eu3+ sites. Including branching ratio measurements
into the analysis allows the Judd–Ofelt parameters to be reliably calculated from emission
spectra of Pr3+ ions embedded in β-NaGdF4. Ω2 parameter was found to be strongly dependent
on the Pr3+ concentration and was used to explain the difference in the emission shapes of Pr3+
emission depending on its concentration in β-NaGdF4.
ASSOCIATED CONTENT
Supporting Information.
The following files are available free of charge.
-SI-1: Detailed procedure of the calculation of JO parameters for Eu3+-doped -NaGdF4
(PDF)
- SI-2: Detailed procedure of the calculation of JO parameters for Pr3+-doped -NaGdF4
(PDF)
AUTHOR INFORMATION
Corresponding Authors
[email protected] or [email protected]
Author Contributions
The manuscript was written through contributions of all authors.
Funding Sources
This research was performed as a part of joint PHC-Tassili, Algeria-France R&D Project
(project N° 16MDU959) supported by Campus France (project N° 35079VB). Y. Cheroura
32
and Z. Smara are also grateful to the USTHB (Algeria) for providing a training grant under
the faculty of physics program 2018-2019.
ACKNOWLEDGMENTS
Y. Cheroura and Z. Smara are grateful to the USTHB (Algeria) for providing a training grant
under the faculty of physics program 2018-2019 and for the International Relations Department
of UCA (France) for their facilities supports. We thank Christelle Blavignac (CICS, UCA) for
TEM observations.
References
[1] S. Gai, C. Li, P. Yang, J. Lin, Chem. Rev., 114 (2014) 2343-2389, DOI: 10.1021/cr4001594. [2] Z.-L. Wang, J.H. Hao, H.L.W. Chan, J. Mater. Chem., 20 (2010) 3178-3185, DOI: 10.1039/B924448D. [3] X. Chen, J. Vanacken, J. Han, Z. Zhong, L. Li, Y. Han, Y. Liu, V.V. Moshchalkov, J. Appl. Phys., 121 (2017) 163103, DOI: 10.1063/1.4982349. [4] A. Herrmann, M. Tylkowski, C. Bocker, C. Rüssel, Chem. Mater., 25 (2013) 2878-2884, DOI: 10.1021/cm401454y. [5] P. Ghosh, A.-V. Mudring, Nanoscale, 8 (2016) 8160-8169, DOI: 10.1039/C6NR00172F. [6] G. Tessitore, A.-V. Mudring, K.W. Krämer, J. Lumin., 189 (2017) 91-98, DOI: 10.1016/j.jlumin.2017.03.021. [7] C. Cheng, Y. Xu, S. Liu, Y. Liu, X. Wang, J. Wang, G. De, J. Mater. Chem. C, (2019), DOI: 10.1039/C9TC01323G. [8] P. Lei, P. Zhang, S. Yao, S. Song, L. Dong, X. Xu, X. Liu, K. Du, J. Feng, H. Zhang, ACS Appl. Mater. Interfaces, 8 (2016) 27490-27497, DOI: 10.1021/acsami.6b08335. [9] J. Ryu, H.-Y. Park, K. Kim, H. Kim, J.H. Yoo, M. Kang, K. Im, R. Grailhe, R. Song, J. Phys. Chem. B, 114 (2010) 21077-21082, DOI: 10.1021/jp107725r. [10] E. Hemmer, M. Quintanilla, F. Légaré, F. Vetrone, Chem. Mater., 27 (2015) 235-244, DOI: 10.1021/cm503799f. [11] N. Martin, P. Boutinaud, R. Mahiou, J.-C. Cousseins, M. Bouderbala, J. Mater. Chem., 9 (1999) 125-128, DOI: 10.1039/A804472D. [12] M. Banski, A. Podhorodecki, J. Misiewicz, M. Afzaal, A.L. Abdelhady, P. O'Brien, J. Mater. Chem. C, 1 (2013) 801-807, DOI: 10.1039/C2TC00132B. [13] R. Gao, L. Sun, L. Li, T. Pan, L. Fu, X.-C. Ai, J.-P. Zhang, New J. Chem., 43 (2019) 7198-7201, DOI: 10.1039/C9NJ01226E. [14] G. Tessitore, A.-V. Mudring, K.W. Krämer, New J. Chem., 42 (2018) 237-245, DOI: 10.1039/C7NJ03242K. [15] P. Du, L. Luo, X. Huang, J.S. Yu, J. Colloid Interface Sci., 514 (2018) 172-181, DOI: 10.1016/j.jcis.2017.12.027. [16] J.W. Chung, J.Y. Park, H.K. Yang, J. Lumin., 211 (2019) 176-182, DOI: 10.1016/j.jlumin.2019.03.010. [17] P. Lei, R. An, S. Yao, Q. Wang, L. Dong, X. Xu, K. Du, J. Feng, H. Zhang, Adv. Mater., 29 (2017) 1700505, DOI: 10.1002/adma.201700505. [18] M.J. Weber, T.E. Varitimos, B.H. Matsinger, Phys. Rev. B, 8 (1973) 47-53, DOI: 10.1103/PhysRevB.8.47.
33
[19] R.T. Wegh, H. Donker, K.D. Oskam, A. Meijerink, J. Lumin., 82 (1999) 93-104, DOI: 10.1016/S0022-2313(99)00042-3. [20] P. Ghosh, S. Tang, A.-V. Mudring, J. Mater. Chem., 21 (2011) 8640-8644, DOI: 10.1039/C1JM10728C. [21] M.A. Gusowski, H.C. Swart, L.S. Karlsson, M. Trzebiatowska-Gusowska, Nanoscale, 4 (2012) 541-546, DOI: 10.1039/C1NR11249J. [22] T. Hirai, H. Yoshida, S. Sakuragi, S. Hashimoto, N. Ohno, Jpn. J. Appl. Phys., 46 (2007) 660-663, DOI: 10.1143/jjap.46.660. [23] J. Xu, S. Gai, P.a. Ma, Y. Dai, G. Yang, F. He, P. Yang, J. Mater. Chem. B, 2 (2014) 1791-1801, DOI: 10.1039/C3TB21465F. [24] J. Yang, J. Dong, R. Wu, H. Wu, H. Song, S. Gan, L. Zou, Dalton Trans., 47 (2018) 9795-9803, DOI: 10.1039/C8DT01991F. [25] X. Jiang, Y. Wang, T. Herricks, Y. Xia, J. Mater. Chem., 14 (2004) 695-703, DOI: 10.1039/B313938G. [26] Q. Zhao, B. Shao, W. Lü, W. Lv, M. Jiao, L. Zhao, H. You, Dalton Trans., 44 (2015) 3745-3752, DOI: 10.1039/C4DT03619K. [27] W. Zhang, Y. Shen, M. Liu, P. Gao, H. Pu, L. Fan, R. Jiang, Z. Liu, F. Shi, H. Lu, ACS Appl. Mater. Interfaces, 9 (2017) 39985-39993, DOI: 10.1021/acsami.7b11295. [28] J.J. Velázquez, R. Balda, J. Fernández, G. Gorni, L. Pascual, G. Chen, M. Sundararajan, A. Durán, M.J. Pascual, J. Lumin., 193 (2018) 61-69, DOI: 10.1016/j.jlumin.2017.07.034. [29] Y.Q. Jia, J. Solid State Chem., 95 (1991) 184-187, DOI: 10.1016/0022-4596(91)90388-X. [30] A.I. Becerro, D. González-Mancebo, E. Cantelar, F. Cussó, G. Stepien, J.M. de la Fuente, M. Ocaña, Langmuir, 32 (2016) 411-420, DOI: 10.1021/acs.langmuir.5b03837. [31] K. Vukovic, M. Medic, M. Sekulic, M. Dramicanin, Adv. Cond. Matter Phys., 2015 (2015) 7, DOI: 10.1155/2015/736517. [32] L. Đačanin, S.R. Lukić, D.M. Petrović, M. Nikolić, M.D. Dramićanin, Physica B, 406 (2011) 2319-2322, DOI: 10.1016/j.physb.2011.03.068. [33] P. Ghosh, R.K. Sharma, Y.N. Chouryal, A.-V. Mudring, RSC Adv., 7 (2017) 33467-33476, DOI: 10.1039/C7RA06741K. [34] A. Bednarkiewicz, A. Mech, M. Karbowiak, W. Stręk, J. Lumin., 114 (2005) 247-254, DOI: 10.1016/j.jlumin.2005.01.005. [35] F. Hund, Z. Anorg. Chem., 261 (1950) 106-115, DOI: 10.1002/zaac.19502610110. [36] H.S. Kiliaan, J.F.A.K. Kotte, G. Blasse, Chem. Phys. Lett., 133 (1987) 425-428, DOI: 10.1016/0009-2614(87)87095-1. [37] P. Ptacek, H. Schäfer, K. Kömpe, M. Haase, Adv. Funct. Mater., 17 (2007) 3843-3848, DOI: 10.1002/adfm.200600974. [38] D. Zakaria, R. Mahiou, D. Avignant, M. Zahir, J. Alloys Compd., 257 (1997) 65-68, DOI: 10.1016/S0925-8388(97)00016-9. [39] D. Tu, Y. Liu, H. Zhu, R. Li, L. Liu, X. Chen, Angew. Chem., 125 (2013) 1166-1171, DOI: 10.1002/ange.201208218. [40] P. Boutinaud, R. Mahiou, N. Martin, M. Malinowski, J. Lumin., 72-74 (1997) 809-811, DOI: 10.1016/S0022-2313(96)00173-1. [41] W. Ryba-Romanowski, S. Gołvab, G. Dominiak-Dzik, P. Solarz, Appl. Phys. A, 74 (2002) 581-586, DOI: 10.1007/s003390100917. [42] M. Inokuti, F. Hirayama, J. Phys. Chem., 43 (1965) 1978-1989, DOI: 10.1063/1.1697063. [43] M. Yokota, O. Tanimoto, J. Phys. Soc. Jpn., 22 (1967) 779-784, DOI: 10.1143/JPSJ.22.779. [44] M.N. Berberan-Santos, E.N. Bodunov, B. Valeur, Chem. Phys., 317 (2005) 57-62, DOI: 10.1016/j.chemphys.2005.05.026. [45] R. Mahiou, J.C. Cousseins, M.T. Fournier, J. Chim. Phys., 85 (1988) 769-773, DOI: 10.1051/jcp/1988850769 [46] B. Tian, B. Chen, Y. Tian, X. Li, J. Zhang, J. Sun, H. Zhong, L. Cheng, S. Fu, H. Zhong, Y. Wang, X. Zhang, H. Xia, R. Hua, J. Mater. Chem. C, 1 (2013) 2338-2344, DOI: 10.1039/C3TC00915G.
34
[47] Y. Tian, B. Chen, R. Hua, J. Sun, L. Cheng, H. Zhong, X. Li, J. Zhang, Y. Zheng, T. Yu, L. Huang, H. Yu, J. Appl. Phys., 109 (2011) 053511, DOI: 10.1063/1.3551584. [48] Y. Zhang, B. Chen, S. Xu, X. Li, J. Zhang, J. Sun, X. Zhang, H. Xia, R. Hua, Phys. Chem. Chem. Phys., 20 (2018) 15876-15883, DOI: 10.1039/C8CP02317D. [49] N. Martin, P. Boutinaud, M. Malinowski, R. Mahiou, J.C. Cousseins, J. Alloys Compd., 275-277 (1998) 304-306, DOI: 10.1016/S0925-8388(98)00323-5. [50] M. Malinowski, M.F. Joubert, B. Jacquier, J. Lumin., 60-61 (1994) 179-182, DOI: 10.1016/0022-2313(94)90124-4. [51] H. Chen, R. Lian, M. Yin, L. Lou, W. Zhang, S. Xia, J.-C. Krupa, J. Phys.: Condens. Matter, 13 (2001) 1151-1158, DOI: 10.1088/0953-8984/13/5/328. [52] R. Naik, S.C. Prashantha, H. Nagabhushana, S.C. Sharma, D.M. Jnaneshwara, K.S. Ananthraju, H.P. Nagaswarupa, H.B. Premkumar, M. Chandrasekhar, AIP Conf. Proc., 1731 (2016) 050034, DOI: 10.1063/1.4947688.
Supporting information SI-1
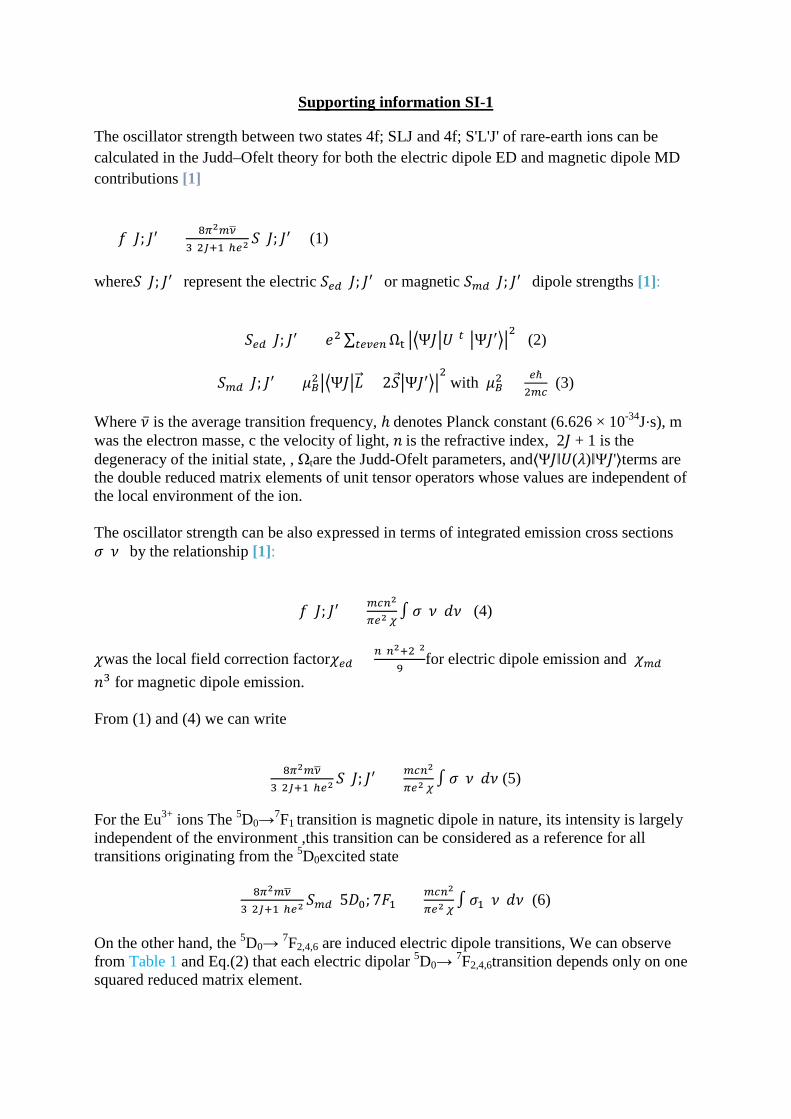
The oscillator strength between two states 4f; SLJ and 4f; S'L'J' of rare-earth ions can be calculated in the Judd–Ofelt theory for both the electric dipole ED and magnetic dipole MD contributions [1]
𝑓(𝐽; 𝐽′) = 8𝜋2𝑚𝜈�
3(2𝐽+1)ℎ𝑒2𝑆(𝐽; 𝐽′) (1)
where𝑆(𝐽; 𝐽′) represent the electric 𝑆𝑒𝑒(𝐽; 𝐽′) or magnetic 𝑆𝑚𝑒(𝐽; 𝐽′) dipole strengths [1]:
𝑆𝑒𝑒(𝐽; 𝐽′) = 𝑒2 ∑ Ωt𝑡𝑒𝑡𝑒𝑡 ��Ψ𝐽�𝑈(𝑡)�Ψ𝐽′��2 (2)
𝑆𝑚𝑒(𝐽; 𝐽′) = 𝜇𝐵2��Ψ𝐽�𝐿�⃗ + 2𝑆�Ψ𝐽′��2
with 𝜇𝐵2 = 𝑒ℏ2𝑚𝑚
(3)
Where �̅� is the average transition frequency, ℎ denotes Planck constant (6.626 × 10⁻³⁴J⋅s), m was the electron masse, c the velocity of light, 𝑛 is the refractive index, 2𝐽 + 1 is the degeneracy of the initial state, , Ωtare the Judd-Ofelt parameters, and⟨Ψ𝐽‖𝑈(𝜆)‖Ψ𝐽'⟩terms are the double reduced matrix elements of unit tensor operators whose values are independent of the local environment of the ion. The oscillator strength can be also expressed in terms of integrated emission cross sections 𝜎(𝜈) by the relationship [1]:
𝑓(𝐽; 𝐽′) = 𝑚𝑚𝑡2
𝜋𝑒2 𝜒∫ 𝜎(𝜈)𝑑𝜈 (4)
𝜒was the local field correction factor𝜒𝑒𝑒 = 𝑡(𝑡2+2)2
9for electric dipole emission and 𝜒𝑚𝑒 =
𝑛3 for magnetic dipole emission. From (1) and (4) we can write
8𝜋2𝑚𝜈�3(2𝐽+1)ℎ𝑒2
𝑆(𝐽; 𝐽′) = 𝑚𝑚𝑡2
𝜋𝑒2 𝜒∫ 𝜎(𝜈)𝑑𝜈 (5)
For the Eu3+ ions The 5D0→7F1 transition is magnetic dipole in nature, its intensity is largely independent of the environment ,this transition can be considered as a reference for all transitions originating from the 5D0excited state
8𝜋2𝑚𝜈�3(2𝐽+1)ℎ𝑒2
𝑆𝑚𝑒(5𝐷0; 7𝐹1) = 𝑚𝑚𝑡2
𝜋𝑒2 𝜒∫ 𝜎1(𝜈)𝑑𝜈 (6)
On the other hand, the 5D0→ 7F2,4,6 are induced electric dipole transitions, We can observe from Table 1 and Eq.(2) that each electric dipolar 5D0→ 7F2,4,6transition depends only on one squared reduced matrix element.
8𝜋2𝑚𝜈�3(2𝐽+1)ℎ𝑒2
𝑆𝑒𝑒(5𝐷0; 7𝐹𝑡) = 𝑚𝑚𝑡2
𝜋𝑒2 𝜒∫ 𝜎𝑡(𝜈)𝑑𝜈 Where 𝑆𝑒𝑒(5𝐷0; 7𝐹𝑡) = 𝑒2Ωt��Ψ𝐽�𝑈(𝑡)�Ψ𝐽′��
2
(7)
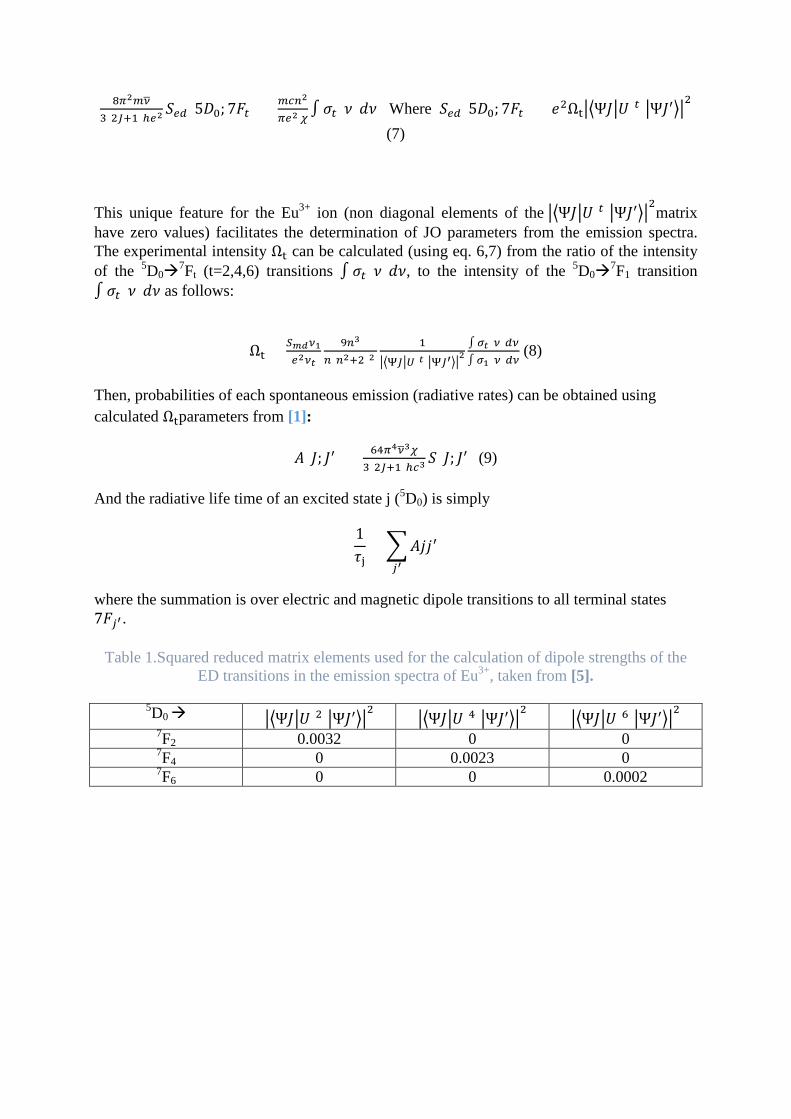
This unique feature for the Eu3+ ion (non diagonal elements of the ��Ψ𝐽�𝑈(𝑡)�Ψ𝐽′��2matrix
have zero values) facilitates the determination of JO parameters from the emission spectra. The experimental intensity Ωt can be calculated (using eq. 6,7) from the ratio of the intensity of the 5D0
7Ft (t=2,4,6) transitions ∫ 𝜎𝑡(𝜈)𝑑𝜈, to the intensity of the 5D07F1 transition
∫ 𝜎𝑡(𝜈)𝑑𝜈 as follows:
Ωt = 𝑆𝑚𝑚𝜈1𝑒2𝜈𝑡
9𝑡3
𝑡(𝑡2+2)2 1
��Ψ𝐽�𝑈(𝑡)�Ψ𝐽′��2∫ 𝜎𝑡(𝜈)𝑒𝜈∫ 𝜎1(𝜈)𝑒𝜈
(8)
Then, probabilities of each spontaneous emission (radiative rates) can be obtained using calculated Ωtparameters from [1]:
𝐴(𝐽; 𝐽′) = 64𝜋4𝜈�3𝜒3(2𝐽+1)ℎ𝑚3
𝑆(𝐽; 𝐽′) (9)
And the radiative life time of an excited state j (5D0) is simply
1𝜏j
= �𝐴𝐴𝐴′𝑗′
where the summation is over electric and magnetic dipole transitions to all terminal states 7𝐹𝑗′ .
Table 1.Squared reduced matrix elements used for the calculation of dipole strengths of the ED transitions in the emission spectra of Eu3+, taken from [5].
5D0 ��Ψ𝐽�𝑈(2)�Ψ𝐽′��
2 ��Ψ𝐽�𝑈(4)�Ψ𝐽′��
2 ��Ψ𝐽�𝑈(6)�Ψ𝐽′��
2
7F2 0.0032 0 0 7F4 0 0.0023 0 7F6 0 0 0.0002
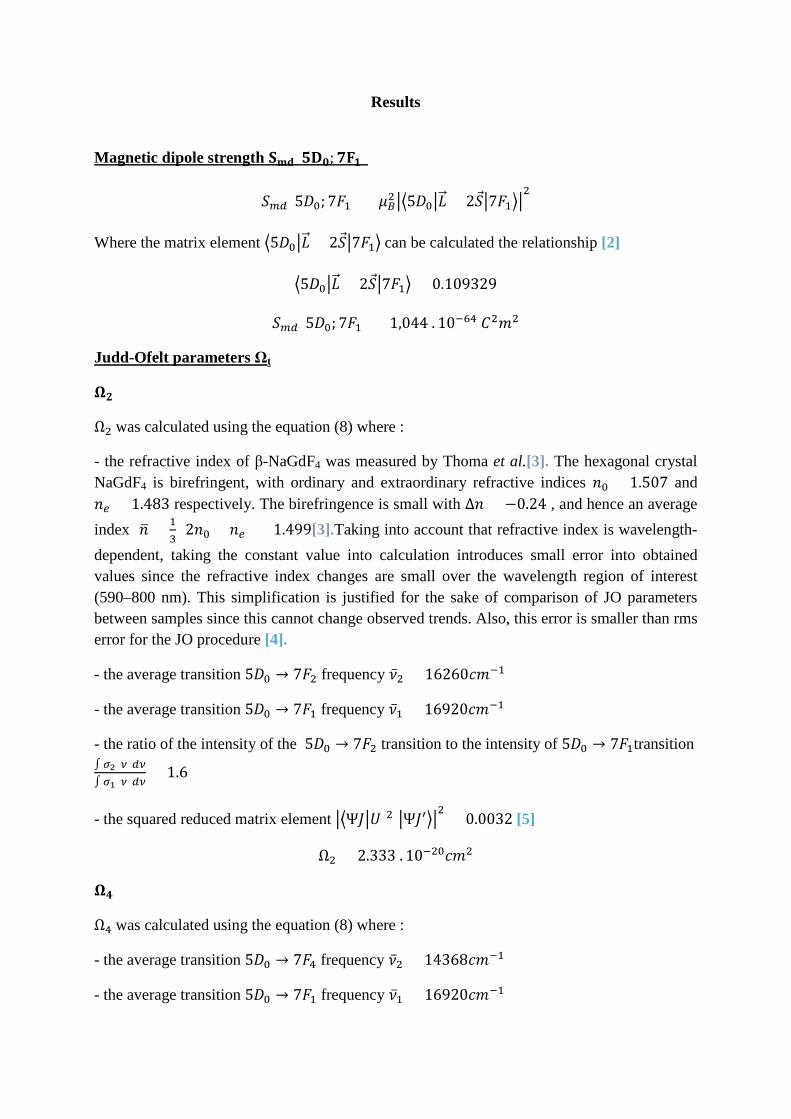
Results Magnetic dipole strength 𝐒𝐦𝐦(𝟓𝟓𝟎;𝟕𝐅𝟏)
𝑆𝑚𝑒(5𝐷0; 7𝐹1) = 𝜇𝐵2��5𝐷0�𝐿�⃗ + 2𝑆�7𝐹1��2
Where the matrix element �5𝐷0�𝐿�⃗ + 2𝑆�7𝐹1� can be calculated the relationship [2]
�5𝐷0�𝐿�⃗ + 2𝑆�7𝐹1� = 0.109329
𝑆𝑚𝑒(5𝐷0; 7𝐹1) = 1,044 . 10−64 𝐶2𝑚2
Judd-Ofelt parameters Ωt
𝛀𝟐
Ω2 was calculated using the equation (8) where :
- the refractive index of β-NaGdF4 was measured by Thoma et al.[3]. The hexagonal crystal NaGdF4 is birefringent, with ordinary and extraordinary refractive indices 𝑛0 = 1.507 and 𝑛𝑒 = 1.483 respectively. The birefringence is small with Δ𝑛 = −0.24 , and hence an average index 𝑛� = 1
3(2𝑛0 + 𝑛𝑒) = 1.499[3].Taking into account that refractive index is wavelength-
dependent, taking the constant value into calculation introduces small error into obtained values since the refractive index changes are small over the wavelength region of interest (590–800 nm). This simplification is justified for the sake of comparison of JO parameters between samples since this cannot change observed trends. Also, this error is smaller than rms error for the JO procedure [4].
- the average transition 5𝐷0 → 7𝐹2 frequency �̅�2 = 16260𝑐𝑚−1
- the average transition 5𝐷0 → 7𝐹1 frequency �̅�1 = 16920𝑐𝑚−1
- the ratio of the intensity of the 5𝐷0 → 7𝐹2 transition to the intensity of 5𝐷0 → 7𝐹1transition ∫ 𝜎2(𝜈)𝑒𝜈∫ 𝜎1(𝜈)𝑒𝜈
= 1.6
- the squared reduced matrix element ��Ψ𝐽�𝑈(2)�Ψ𝐽′��2
= 0.0032 [5]
Ω2 = 2.333 . 10−20𝑐𝑚2
𝛀𝟒
Ω4 was calculated using the equation (8) where :
- the average transition 5𝐷0 → 7𝐹4 frequency �̅�2 = 14368𝑐𝑚−1
- the average transition 5𝐷0 → 7𝐹1 frequency �̅�1 = 16920𝑐𝑚−1
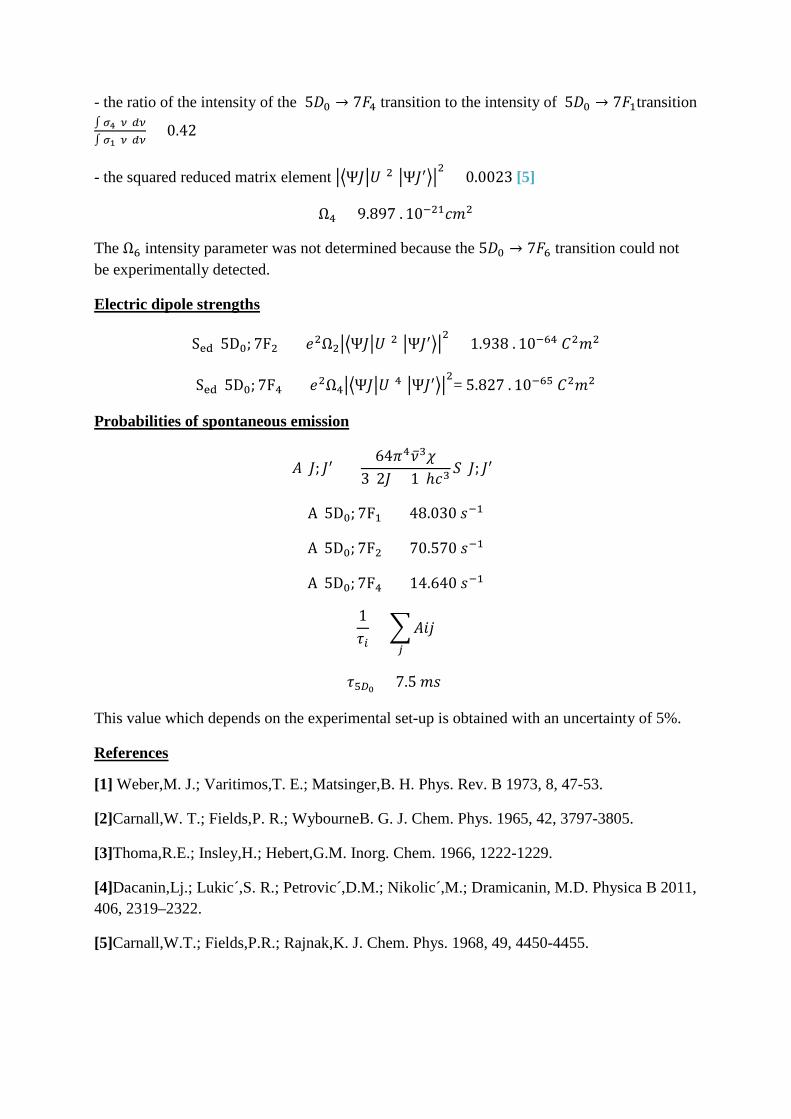
- the ratio of the intensity of the 5𝐷0 → 7𝐹4 transition to the intensity of 5𝐷0 → 7𝐹1transition ∫ 𝜎4(𝜈)𝑒𝜈∫ 𝜎1(𝜈)𝑒𝜈
= 0.42
- the squared reduced matrix element ��Ψ𝐽�𝑈(2)�Ψ𝐽′��2
= 0.0023 [5]
Ω4 = 9.897 . 10−21𝑐𝑚2
The Ω6 intensity parameter was not determined because the 5𝐷0 → 7𝐹6 transition could not be experimentally detected.
Electric dipole strengths
Sed(5D0; 7F2) = 𝑒2Ω2��Ψ𝐽�𝑈(2)�Ψ𝐽′��2
= 1.938 . 10−64 𝐶2𝑚2
Sed(5D0; 7F4) = 𝑒2Ω4��Ψ𝐽�𝑈(4)�Ψ𝐽′��2= 5.827 . 10−65 𝐶2𝑚2
Probabilities of spontaneous emission
𝐴(𝐽; 𝐽′) =64𝜋4�̅�3𝜒
3(2𝐽 + 1)ℎ𝑐3𝑆(𝐽; 𝐽′)
A(5D0; 7F1) = 48.030 𝑠−1
A(5D0; 7F2) = 70.570 𝑠−1
A(5D0; 7F4) = 14.640 𝑠−1
1𝜏𝑖
= �𝐴𝐴𝐴𝑗
𝜏5𝐷0 = 7.5 𝑚𝑠
This value which depends on the experimental set-up is obtained with an uncertainty of 5%.
References
[1] Weber,M. J.; Varitimos,T. E.; Matsinger,B. H. Phys. Rev. B 1973, 8, 47-53.
[2]Carnall,W. T.; Fields,P. R.; WybourneB. G. J. Chem. Phys. 1965, 42, 3797-3805.
[3]Thoma,R.E.; Insley,H.; Hebert,G.M. Inorg. Chem. 1966, 1222-1229.
[4]Dacanin,Lj.; Lukic´,S. R.; Petrovic´,D.M.; Nikolic´,M.; Dramicanin, M.D. Physica B 2011, 406, 2319–2322.
[5]Carnall,W.T.; Fields,P.R.; Rajnak,K. J. Chem. Phys. 1968, 49, 4450-4455.
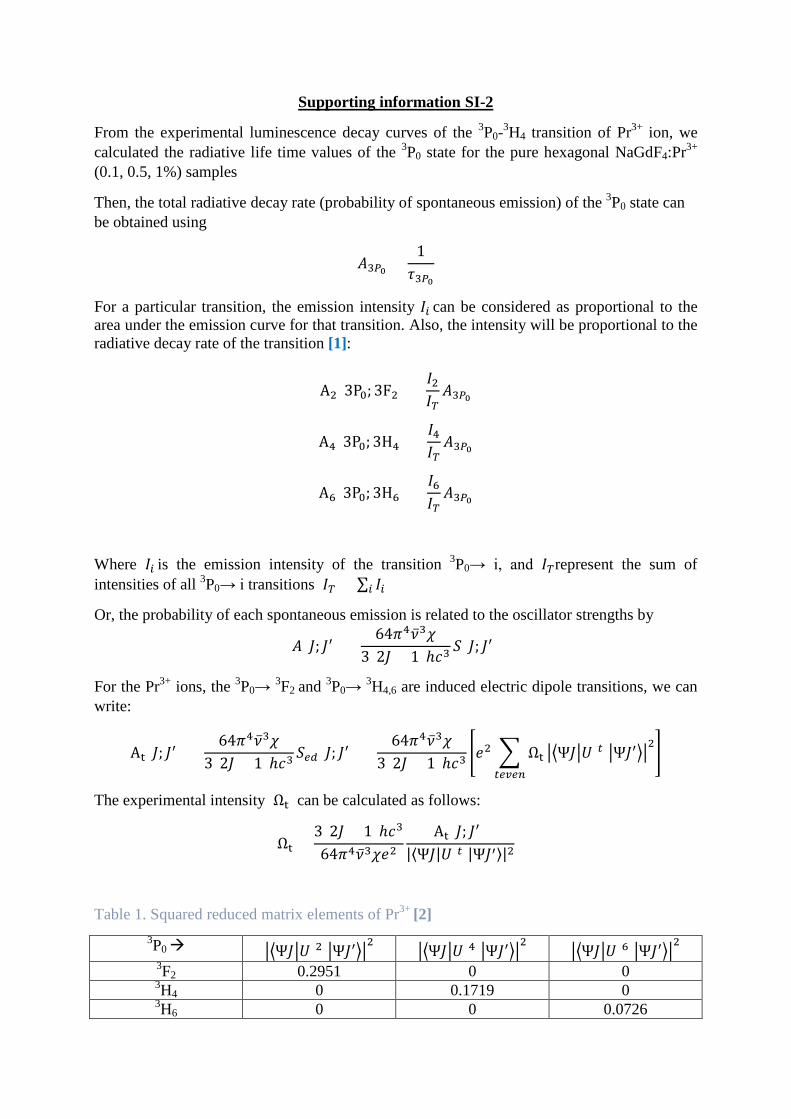
Supporting information SI-2
From the experimental luminescence decay curves of the 3P0-3H4 transition of Pr3+ ion, we calculated the radiative life time values of the 3P0 state for the pure hexagonal NaGdF4:Pr3+ (0.1, 0.5, 1%) samples
Then, the total radiative decay rate (probability of spontaneous emission) of the 3P0 state can be obtained using
𝐴3𝑃0 =1𝜏3𝑃0
For a particular transition, the emission intensity 𝐼𝑖 can be considered as proportional to the area under the emission curve for that transition. Also, the intensity will be proportional to the radiative decay rate of the transition [1]:
A2(3P0; 3F2) =𝐼2𝐼𝑇𝐴3𝑃0
A4(3P0; 3H4) =𝐼4𝐼𝑇𝐴3𝑃0
A6(3P0; 3H6) =𝐼6𝐼𝑇𝐴3𝑃0
Where 𝐼𝑖 is the emission intensity of the transition 3P0→ i, and 𝐼𝑇represent the sum of intensities of all 3P0→ i transitions 𝐼𝑇 = ∑ 𝐼𝑖 𝑖
Or, the probability of each spontaneous emission is related to the oscillator strengths by
𝐴(𝐽; 𝐽′) =64𝜋4�̅�3𝜒
3(2𝐽 + 1)ℎ𝑐3𝑆(𝐽; 𝐽′)
For the Pr3+ ions, the 3P0→ 3F2 and 3P0→ 3H4,6 are induced electric dipole transitions, we can write:
At(𝐽; 𝐽′) =64𝜋4�̅�3𝜒
3(2𝐽 + 1)ℎ𝑐3𝑆𝑒𝑒(𝐽; 𝐽′) =
64𝜋4�̅�3𝜒3(2𝐽 + 1)ℎ𝑐3
�𝑒2 � Ωt𝑡𝑒𝑡𝑒𝑡
��Ψ𝐽�𝑈(𝑡)�Ψ𝐽′��2�
The experimental intensity Ωt can be calculated as follows:
Ωt =3(2𝐽 + 1)ℎ𝑐3
64𝜋4�̅�3𝜒𝑒2At(𝐽; 𝐽′)
|⟨Ψ𝐽|𝑈(𝑡)|Ψ𝐽′⟩|2
Table 1. Squared reduced matrix elements of Pr3+ [2] 3P0 ��Ψ𝐽�𝑈(2)�Ψ𝐽′��
2 ��Ψ𝐽�𝑈(4)�Ψ𝐽′��
2 ��Ψ𝐽�𝑈(6)�Ψ𝐽′��
2
3F2 0.2951 0 0 3H4 0 0.1719 0 3H6 0 0 0.0726
Results
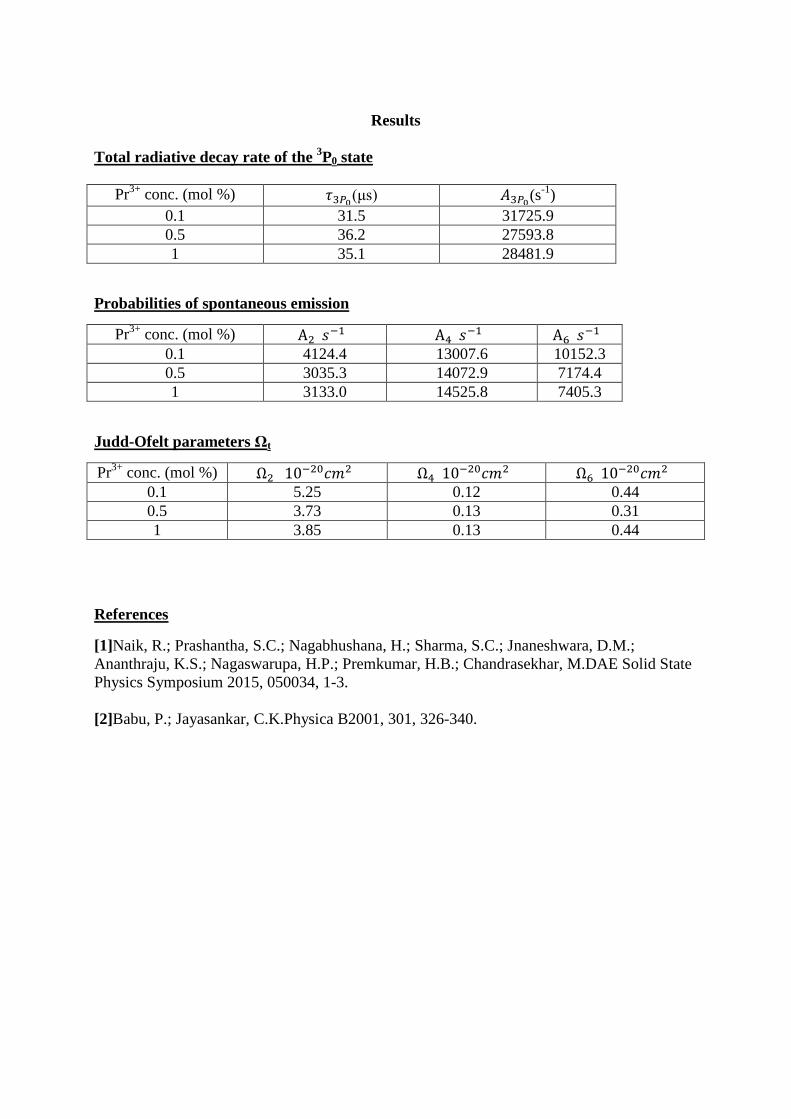
Total radiative decay rate of the 3P0 state
Pr3+ conc. (mol %) 𝜏3𝑃0(μs) 𝐴3𝑃0(s-1)
0.1 31.5 31725.9 0.5 36.2 27593.8 1 35.1 28481.9
Probabilities of spontaneous emission
Pr3+ conc. (mol %) A2(𝑠−1) A4(𝑠−1) A6(𝑠−1) 0.1 4124.4 13007.6 10152.3 0.5 3035.3 14072.9 7174.4 1 3133.0 14525.8 7405.3
Judd-Ofelt parameters Ωt
Pr3+ conc. (mol %) Ω2 (10−20𝑐𝑐2) Ω4(10−20𝑐𝑐2) Ω6(10−20𝑐𝑐2) 0.1 5.25 0.12 0.44 0.5 3.73 0.13 0.31 1 3.85 0.13 0.44
References
[1]Naik, R.; Prashantha, S.C.; Nagabhushana, H.; Sharma, S.C.; Jnaneshwara, D.M.; Ananthraju, K.S.; Nagaswarupa, H.P.; Premkumar, H.B.; Chandrasekhar, M.DAE Solid State Physics Symposium 2015, 050034, 1-3. [2]Babu, P.; Jayasankar, C.K.Physica B2001, 301, 326-340.