Embed Size (px)
Citation preview
AUDIT & ASSESSMENT OF QOS FOR QE-MARCH- 2015-GUJARAT CIRCLE
TUV-SUD SOUTH ASIA PRIVATE LIMITED Page 1
Audit & Assessment of Quality of Service
Of
Cellular Mobile Telephone Service
For
Telecom Regulatory Authority of India
West Zone – Gujarat Service Area
(January 2015 – March 2015)
UNICEF Lucknow Office
Prepared by:-
TÜV SÜD SOUTH ASIA PVT. LTD, C-153/1, Okhla Industrial Estate,
Phase-1, New Delhi – 110020 Telephone 011- 30889611
Fax: 011-30889595
AUDIT & ASSESSMENT OF QOS FOR QE-MARCH- 2015-GUJARAT CIRCLE
TUV-SUD SOUTH ASIA PRIVATE LIMITED Page 2
PREFACE The Telecom Regulatory Authority of India (TRAI), was established in 1997 by an Act of Parliament, called the Telecom
Regulatory Authority of India Act, 1997, to regulate telecom services. The Authority‟s mission is to ensure that the interest of
consumers are protected and at the same time to nurture conditions for growth of telecommunications, broadcasting and cable
services in a manner and at a pace which will enable India to play a leading role in emerging global information society.
The Authority, in exercise of its functions as per the provisions in the TRAI Act, has been entrusted to measure the Quality of
Service provided by the Service Providers from time to time and to compare them with the benchmarks so as to assess the
level of performance. In pursuance of this, TRAI has appointed M/s TUV-SUD South Asia Pvt. Ltd. to carry out “Audit and
Assessment of Quality of Service” provided by Basic (Wire line), Cellular Mobile and Broadband service providers in terms of
the benchmarks specified in the respective regulations, in North and West Zones.
TUV-SUD South Asia carried out QoS audit as per the norms of TRAI in all the eight circles / services areas of the North Zone
and four circles of the West Zone. This report details the performance of the various service providers in Gujarat circle
against the QoS bench marks laid down by TRAI in the respective regulations.
AUDIT & ASSESSMENT OF QOS FOR QE-MARCH- 2015-GUJARAT CIRCLE
TUV-SUD SOUTH ASIA PRIVATE LIMITED Page 3
Index of Contents 1. BACKGROUND ............................................................................................................................................... 6
2. OBJECTIVES AND METHODOLOGY .......................................................................................................... 9
3. SAMPLE SIZE ................................................................................................................................................ 11
3.1 SAMPLING FOR CELLULAR MOBILE (WIRELESS) SERVICE PROVIDERS .................................... 11
3.2 SAMPLING FOR BASIC (WIRE LINE) SERVICES.................................................................................. 12
3.3 SAMPLING FOR BROADBAND SERVICE PROVIDERS ....................................................................... 12
4. EXECUTIVE SUMMARY ............................................................................................................................. 14
5. PMR AUDIT REPORTS: ............................................................................................................................... 17
5.1 MONTHLY PMR: ......................................................................................................................................... 17
5.1.1 BUSY HOUR OF VARIOUS SERVICE PROVIDERS: ...................................................................... 17
5.1.2 SWITCHES/BSC/BTS DETAILS OF SERVICE PROVIDERS: ......................................................... 18
5.1.3 QOS PERFORMANCE OF MONTHLY PMR – JANUARY-15 MONTH ......................................... 19
5.1.4 QOS PERFORMANCE OF MONTHLY PMR – FEBRUARY-15 MONTH ....................................... 20
5.1.5 QOS PERFORMANCE OF MONTHLY PMR – MARCH- 15 MONTH ............................................ 21
5.1.6 QOS PERFORMANCE OF QUARTERLY PMR –AVERAGE OF QE- MARCH-15(JANUARY TO
MARCH 2015 MONTHS AUDITED DATA) ............................................................................................... 22
5.1.7 KEY FINDINGS ON MONTHLY PMR AUDIT REPORTS: .............................................................. 23
5.2 LIVE MEASUREMENT DATA (3-DAYS) FOR CELLULAR MOBILE SERVICE PROVIDERS
(NETWORK SERVICE QUALITY PARAMETER): ........................................................................................ 26
5.2.1 LIVE MEASURMENT DATA (3-DAYS) – JANUARY- 15 MONTH: .............................................. 26
5.2.2 LIVE MEASURMENT DATA (3-DAYS) – FEBRUARY- 15 MONTH: ............................................ 27
5.2.3 LIVE MEASURMENT DATA (3-DAYS) – MARCH-15 MONTH: ................................................... 28
5.2.4 QUARTERLY QOS PERFORMANCE OF 3-DAYS LIVE MEASUREMENT AUDITED DATA
(AVERAGE OF JANUARY TO MARCH 2015 MONTHS) ......................................................................... 29
5.2.5 KEY FINDING ON 3 DAYS LIVE MEASUREMENTS: .................................................................... 29
5.2.6 DETAILED NETWORK DATA ASSESSMENT OF CELLULAR MOBILE TELEPHONE
SERVICES: ..................................................................................................................................................... 30
5.3 CUSTOMER SERVICE QUALITY PARAMETERS MEASUREMENT FOR CMTS: ............................. 40
5.3.1 QUARTERLY CUSTOMER SERVICE DELIVERY (CSD) AUDITED DATA FOR CELLULAR
MOBILE SERVICES (JANUARY TO FEBRUARY 2015 MONTHS AUDITED DATA): ........................ 40
5.3.2 3 DAYS LIVE CSD AUDITED DATA FOR CELLULAR MOBILE SERVICES: ............................. 43
KEY FINDINGS: CUSTOMER SERVICE DELIVERY PARAMETERS.................................................... 44
6. LIVE CALLING ASSESSMENT: .................................................................................................................. 46
6.1 INTER OPERATOR CALLS ASSESSMENT: ............................................................................................ 46
6.2 CUSTOMER CARE / HELPLINE ASSESSMENT: .................................................................................... 47
6.3 LIVE CALLING ASSESSMENT FOR BILLING COMPLIANTS: ............................................................ 47
AUDIT & ASSESSMENT OF QOS FOR QE-MARCH- 2015-GUJARAT CIRCLE
TUV-SUD SOUTH ASIA PRIVATE LIMITED Page 4
6.4 LEVEL -1 CALLING ASSESSMENT: ........................................................................................................ 48
7. OPERATOR ASSESTID DRIVE TEST ........................................................................................................ 50
7.1 DETAIL OF THE ROUTES COVERED DURING THE DRIVE TESTS: ................................................. 63
7.2 SSA WISE DRIVE TEST OBSERVATION: ............................................................................................... 66
7.3 KEY FINDINGS ON DRIVE TEST: ............................................................................................................ 71
8. GRAPHICAL REPRESENTATION (CMTS): ............................................................................................... 73
AUDIT & ASSESSMENT OF QOS FOR QE-MARCH- 2015-GUJARAT CIRCLE
TUV-SUD SOUTH ASIA PRIVATE LIMITED Page 5
1. BACKGROUND
AUDIT & ASSESSMENT OF QOS FOR QE-MARCH- 2015-GUJARAT CIRCLE
TUV-SUD SOUTH ASIA PRIVATE LIMITED Page 6
1. BACKGROUND
Telecom Regulatory Authority of India has been entrusted to “lay down the standards of quality of service to be
provided by the service providers and ensure the quality of service and conduct the periodical survey of such
service provided by the service providers so as to protect interest of the consumers of telecommunication services”
vide sub-clause (v) of clause (b) of sub-section (1) of section 11 of the Telecom Regulatory Authority of India Act,
1997 (24 of 1997).
The purpose of laying down Quality of Service Parameters is to:
i) Create conditions for consumer satisfaction by making known the quality of service, which the Service provider is
required to provide, and the user has a right to expect.
ii) Measure the Quality of Service provided by the Service Providers from time to time and to compare them with the
norms so as to assess the level of performance.
iii) Generally protect the interests of consumers of telecommunication services.
TRAI, the regulatory watch dog for the Quality of Service for the telecom services – Basic (Wire line), Cellular
Mobile (Wireless) and Broadband has commissioned M/s TUV-SUD South Asia Pvt. Ltd. for conducting audit and
assessment of quality of service of service providers, in terms of the benchmarks specified in the “The Standards of
Quality of Service of Basic Telephone Service (Wire line) and Cellular Mobile Telephone Service Regulations, 2009
(7 of 2009) dated 20th March, 2009 and the Quality of Service of Broadband Service Regulations, 2006 (11 of 2006)
dated 6thOctober, 2006 on zonal basis for North Zone and West Zone comprising of the following Telecom
Circles/Metro Service Areas:
North Zone: Delhi, Jammu & Kashmir, Himachal Pradesh, Punjab, Haryana, Rajasthan, Uttar Pradesh-East and
Uttar Pradesh-West (including Uttarakhand). For the cellular mobile telephone service the service area of Delhi
includes Ghaziabad, Faridabad, Noida and Gurgaon.
West Zone: Mumbai, Maharashtra (including Goa and excluding Mumbai), Gujarat and Madhya Pradesh (including
Chhattisgarh).
AUDIT & ASSESSMENT OF QOS FOR QE-MARCH- 2015-GUJARAT CIRCLE
TUV-SUD SOUTH ASIA PRIVATE LIMITED Page 7
The Audit exercise would assess the Quality of Service of telecom operators providing Basic (Wire line), Cellular
Mobile (Wireless) and Broadband services by auditing the relevant QoS records maintained by the operators,
conducting drive tests as well as live measurements and comparing them with quality of service benchmarks
stipulated by TRAI. The audit would be carried out by TUV-SUD South Asia every quarter across all the
Circles/Service areas of North and West Zones for Cellular Mobile Service. However, in respect of Basic telephone
service (wire line) and Broadband service, a circle would be audited once in a year.
AUDIT & ASSESSMENT OF QOS FOR QE-MARCH- 2015-GUJARAT CIRCLE
TUV-SUD SOUTH ASIA PRIVATE LIMITED Page 8
2. OBJECTIVES AND METHODOLOGY
AUDIT & ASSESSMENT OF QOS FOR QE-MARCH- 2015-GUJARAT CIRCLE
TUV-SUD SOUTH ASIA PRIVATE LIMITED Page 9
2. OBJECTIVES AND METHODOLOGY
The primary objective is to audit and assess the Quality of Service being rendered by Basic, Cellular Mobile
& Broadband service providers against the parameters notified by TRAI. The audit and assessment of Quality of Service is carried out by TUV SUD South Asia across all the
Circles/Service areas of North and West Zones for Cellular Mobile Service. Apart from this, QoS audit for
Basic (Wire line) and Broadband Services is also undertaken for Himanchal Pradesh, J&K and Maharashtra
& Goa circles during the quarter January 2015 – March 2015.
The Scope of work as per the Terms of Reference (TOR) includes the following:
i) Preparation of Performance Monitoring reports (PMRs) and uploading in the system.
ii) Live measurements of the performance of Service Providers (SPs) against the benchmarks for three
days during each audit.
iii) Monthly audit based on one month data of the SPs.
iv) Drive test of the RF networks.
v) Audit of the performance of call centers with respect to their accessibility and percentage of calls
answered by the operators and random customer feedback by calling the customers to get feedback of
the services provided by the service providers.
vi) Transfer of data generated by the RF drive test/Live measurements / PMR/ monthly audit to the server
located at TRAI premises on real time basis.
AUDIT & ASSESSMENT OF QOS FOR QE-MARCH- 2015-GUJARAT CIRCLE
TUV-SUD SOUTH ASIA PRIVATE LIMITED Page 10
3. SAMPLE SIZE
AUDIT & ASSESSMENT OF QOS FOR QE-MARCH- 2015-GUJARAT CIRCLE
TUV-SUD SOUTH ASIA PRIVATE LIMITED Page 11
3. SAMPLE SIZE
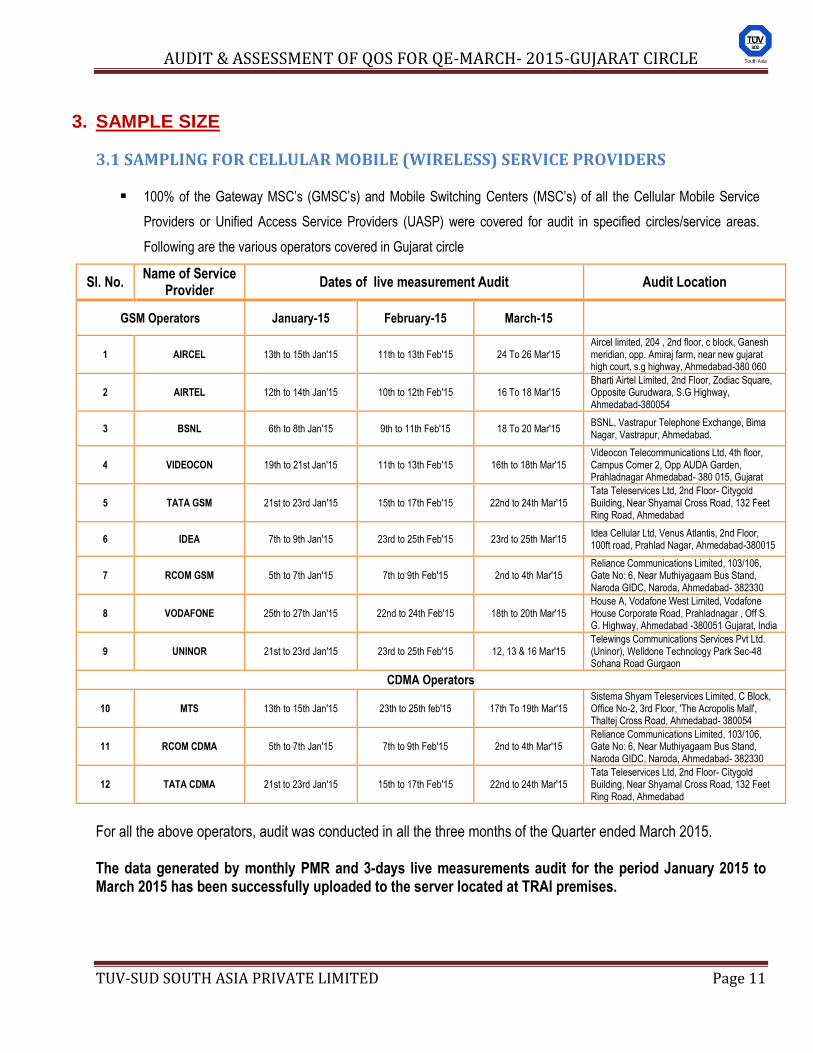
3.1 SAMPLING FOR CELLULAR MOBILE (WIRELESS) SERVICE PROVIDERS 100% of the Gateway MSC‟s (GMSC‟s) and Mobile Switching Centers (MSC‟s) of all the Cellular Mobile Service
Providers or Unified Access Service Providers (UASP) were covered for audit in specified circles/service areas.
Following are the various operators covered in Gujarat circle
Sl. No. Name of Service
Provider Dates of live measurement Audit Audit Location
GSM Operators January-15 February-15 March-15
1 AIRCEL 13th to 15th Jan'15 11th to 13th Feb'15 24 To 26 Mar'15 Aircel limited, 204 , 2nd floor, c block, Ganesh meridian, opp. Amiraj farm, near new gujarat high court, s.g highway, Ahmedabad-380 060
2 AIRTEL 12th to 14th Jan'15 10th to 12th Feb'15 16 To 18 Mar'15 Bharti Airtel Limited, 2nd Floor, Zodiac Square, Opposite Gurudwara, S.G Highway, Ahmedabad-380054
3 BSNL 6th to 8th Jan'15 9th to 11th Feb'15 18 To 20 Mar'15 BSNL, Vastrapur Telephone Exchange, Bima Nagar, Vastrapur, Ahmedabad.
4 VIDEOCON 19th to 21st Jan'15 11th to 13th Feb'15 16th to 18th Mar'15 Videocon Telecommunications Ltd, 4th floor, Campus Corner 2, Opp AUDA Garden, Prahladnagar Ahmedabad- 380 015, Gujarat
5 TATA GSM 21st to 23rd Jan'15 15th to 17th Feb'15 22nd to 24th Mar'15 Tata Teleservices Ltd, 2nd Floor- Citygold Building, Near Shyamal Cross Road, 132 Feet Ring Road, Ahmedabad
6 IDEA 7th to 9th Jan'15 23rd to 25th Feb'15 23rd to 25th Mar'15 Idea Cellular Ltd, Venus Atlantis, 2nd Floor, 100ft road, Prahlad Nagar, Ahmedabad-380015
7 RCOM GSM 5th to 7th Jan'15 7th to 9th Feb'15 2nd to 4th Mar'15 Reliance Communications Limited, 103/106, Gate No: 6, Near Muthiyagaam Bus Stand, Naroda GIDC, Naroda, Ahmedabad- 382330
8 VODAFONE 25th to 27th Jan'15 22nd to 24th Feb'15 18th to 20th Mar'15 House A, Vodafone West Limited, Vodafone House Corporate Road, Prahladnagar , Off S. G. Highway, Ahmedabad -380051 Gujarat, India
9 UNINOR 21st to 23rd Jan'15 23rd to 25th Feb'15 12, 13 & 16 Mar'15 Telewings Communications Services Pvt Ltd. (Uninor), Welldone Technology Park Sec-48 Sohana Road Gurgaon
CDMA Operators
10 MTS 13th to 15th Jan'15 23th to 25th feb'15 17th To 19th Mar'15 Sistema Shyam Teleservices Limited, C Block, Office No-2, 3rd Floor, 'The Acropolis Mall', Thaltej Cross Road, Ahmedabad- 380054
11 RCOM CDMA 5th to 7th Jan'15 7th to 9th Feb'15 2nd to 4th Mar'15 Reliance Communications Limited, 103/106, Gate No: 6, Near Muthiyagaam Bus Stand, Naroda GIDC, Naroda, Ahmedabad- 382330
12 TATA CDMA 21st to 23rd Jan'15 15th to 17th Feb'15 22nd to 24th Mar'15 Tata Teleservices Ltd, 2nd Floor- Citygold Building, Near Shyamal Cross Road, 132 Feet Ring Road, Ahmedabad
For all the above operators, audit was conducted in all the three months of the Quarter ended March 2015. The data generated by monthly PMR and 3-days live measurements audit for the period January 2015 to March 2015 has been successfully uploaded to the server located at TRAI premises.
AUDIT & ASSESSMENT OF QOS FOR QE-MARCH- 2015-GUJARAT CIRCLE
TUV-SUD SOUTH ASIA PRIVATE LIMITED Page 12
3.2 SAMPLING FOR BASIC (WIRE LINE) SERVICES
The QoS audit for basic (wire line) service was to be done for the number of exchanges spread over in about 10%
of SDCAs with each service providers in specified circles. As per the clause 17.3 of the tender document, the QoS
audit of Basis Telephone Service (Wire line) in a service area / circle is to be done only once in a year. Based on
this criterion, QoS audit of Wire line service in Gujarat circle was not required to be done during
QE March-15.
3.3 SAMPLING FOR BROADBAND SERVICE PROVIDERS TUV–SUD South Asia has to conduct the audit and assessment of Quality of Service of Broadband Service only in
respect of the service providers who are having broadband subscriber base of more than 10,000 subscribers in their
licensed service area, for 5% of Point of Presence (PoPs) spread over in 10% SDCAs in specified Telecom Circle.
As per the clause 17.3 of the tender document, the QoS audit of Broadband service in a service area / circle is to be
done only once in a year. Based on this criterion, QoS audit of broadband service in Gujarat circle was not
required to be done during QE March-15.

AUDIT & ASSESSMENT OF QOS FOR QE-MARCH- 2015-GUJARAT CIRCLE
TUV-SUD SOUTH ASIA PRIVATE LIMITED Page 13
4. EXECUTIVE SUMMARY
AUDIT & ASSESSMENT OF QOS FOR QE-MARCH- 2015-GUJARAT CIRCLE
TUV-SUD SOUTH ASIA PRIVATE LIMITED Page 14
4. EXECUTIVE SUMMARY
The executive summary put in a nutshell the key findings of the Audit by providing: -
“Service provider performance report” for Cellular mobile, Basic (wire line) and Broadband services , which gives a foretaste
of the performance of various operators against the benchmark specified by TRAI, during the months in which the Audit was
carried out by TUV-SUD Auditors.
“Parameter wise critical findings” for Cellular mobile, Basic (wire line) and Broadband services: This indicates key
observations and findings from different activities carried out during the Audit process.
TUV-SUD conducted audit involved a 3 stage verification process which consisted of auditing the records of the service
providers and verifying the data submitted to TRAI. The second step involved a three day live measurement of all the network
parameters. On the basis of the three days live measurement, the auditors checked the busy hour of the day for the service
provider and collected the data for this busy hour for the month in which the audit was conducted Finally, the performance of
the service providers was also gauged by conducting drive tests in three select SSAs per service provider per quarter.
The three stage audit / verification viz audit of the records, live measurements and drive tests of all the cellular mobile
operators was repeated every month. In case of Basic (Wire line) and Broadband, this exercise is required to be carried out on
quarterly basis
Essence of compliance report of service providers with respect to the QoS:
Cellular Mobile Telephone Service:
(i) From analysis of monthly audit and 3 days live measurements results, it was concluded that performance of the operators
in the Gujarat service area is fairly satisfactory for Network parameters as all operators (except Tata-GSM/Tata-CDMA and
MTS) were found to have met the benchmarks of all parameters. Tata (GSM), Tata (CDMA) and MTS were having non-
compliance for parameter „Worst affected Cells > 3% TCH drops’ in all the three months of the quarter with their average
performance of 4.92%, 6.90% and 3.65% respectively.
In case of three days live measurement assessment, it is found that the performance of all operators is satisfactory as they
have largely met the benchmarks except the parameter „Worst affected cells> 3 % TCH drops”, which could not be
complied with by Tata (GSM, Tata (CDMA) and MTS. The quarterly average performance of Tata (GSM), Tata (CDMA) and
MTS for this parameter was 5.06%, 7.14 % and 3.19 % respectively.
(ii) With regard to the Customer Service Quality Parameters, the performance of operators remained satisfactory as most of
the service providers were found in compliance of most of the benchmarks. However, BSNL could not meet the benchmark of
Metering and Billing credibility for pre-paid with its performance level as 0.13%.
AUDIT & ASSESSMENT OF QOS FOR QE-MARCH- 2015-GUJARAT CIRCLE
TUV-SUD SOUTH ASIA PRIVATE LIMITED Page 15
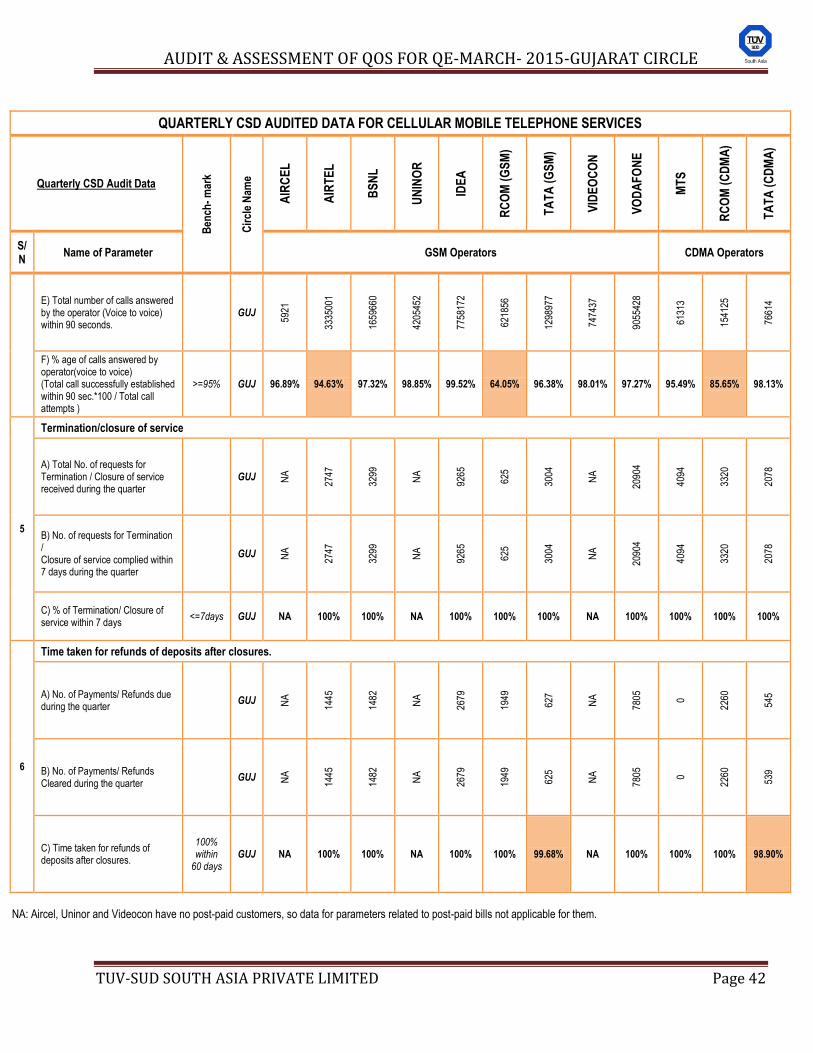
The compliance with respect to the parameter „Calls answered by Operators (voice to voice) within 90 seconds’ was not
met by Airtel, RCOM (GSM) and RCOM (CDMA) with their performance of 94.63%, 64.05% and 85.65% respectively.
In case of the parameters „Time taken for refund of deposit after closure’, the performance of Tata (GSM) & Tata (CDMA)
were 99.68% & 98.90% against the benchmark of 100%.
Regarding parameter Termination/Closure, all operators settled 100% of cases within 7 days.
The results for three days live measurements reveal that all operators have met the benchmarks for the parameters
„Accessibility to call center‟. However, RCOM (GSM) failed to meet the benchmark of „Call answered by Operators (Voice to
voice) within 90 seconds’ with its performance as 47.99%. The performance of RCOM (GSM) was very poor with respect to
this parameter.
(iii) The Drive Tests results suggest satisfactory working of the network of all the service providers in Amreli, Bharuch and
Godhara SSAs where the drive tests were conducted.
Thus, taking cognizance on overall performance of the service providers, it was concluded that service providers were doing
fairly well in Gujarat Circle for most of the parameters. However, the performance with respect to the parameters worst
affected cell having > 3 % TCH drop and Calls answered by operator (voice to voice) need further improvement for those
operators who could not meet the benchmarks of these parameters. In case of Customer Service Quality Parameters, the
operators lagging behind the benchmark of parameter Billing Complaint – Pre-paid and Calls answered by operators
(Voice to Voice) need improvements enough to meet the benchmarks.
AUDIT & ASSESSMENT OF QOS FOR QE-MARCH- 2015-GUJARAT CIRCLE
TUV-SUD SOUTH ASIA PRIVATE LIMITED Page 16
5. PMR AUDIT REPORT
AUDIT & ASSESSMENT OF QOS FOR QE-MARCH- 2015-GUJARAT CIRCLE
TUV-SUD SOUTH ASIA PRIVATE LIMITED Page 17
5. PMR AUDIT REPORTS:
5.1 MONTHLY PMR:
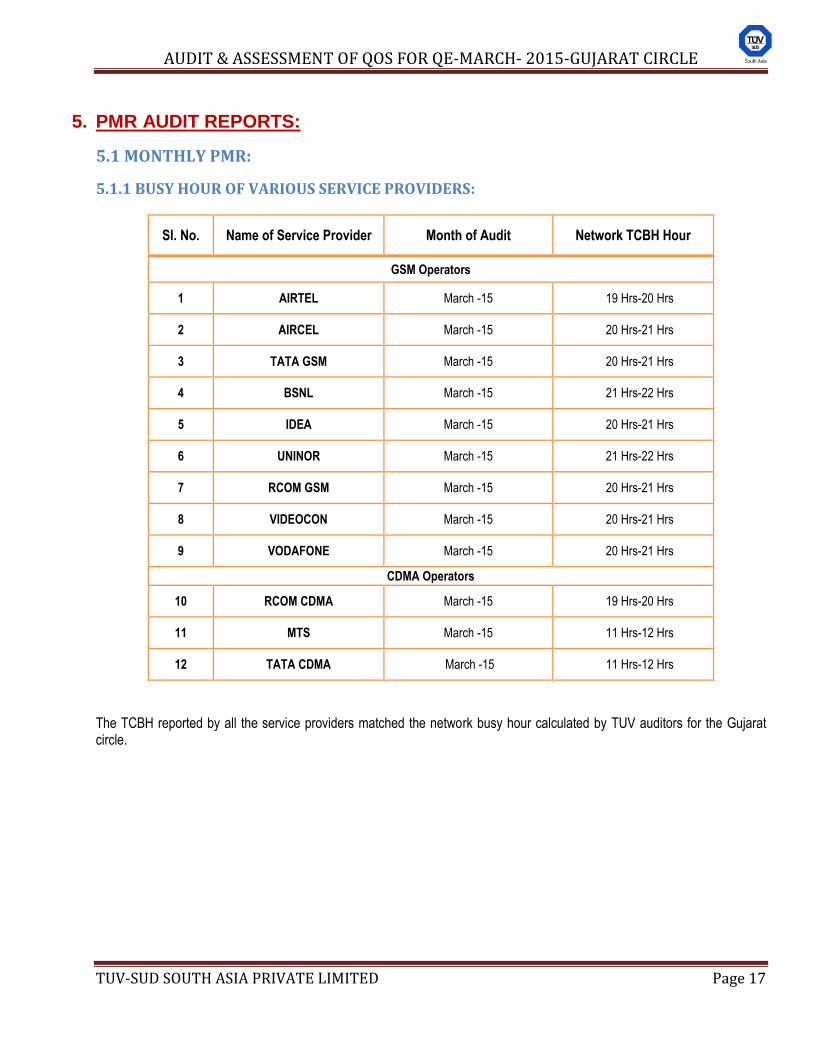
5.1.1 BUSY HOUR OF VARIOUS SERVICE PROVIDERS:
Sl. No. Name of Service Provider Month of Audit Network TCBH Hour
GSM Operators
1 AIRTEL March -15 19 Hrs-20 Hrs
2 AIRCEL March -15 20 Hrs-21 Hrs
3 TATA GSM March -15 20 Hrs-21 Hrs
4 BSNL March -15 21 Hrs-22 Hrs
5 IDEA March -15 20 Hrs-21 Hrs
6 UNINOR March -15 21 Hrs-22 Hrs
7 RCOM GSM March -15 20 Hrs-21 Hrs
8 VIDEOCON March -15 20 Hrs-21 Hrs
9 VODAFONE March -15 20 Hrs-21 Hrs
CDMA Operators
10 RCOM CDMA March -15 19 Hrs-20 Hrs
11 MTS March -15 11 Hrs-12 Hrs
12 TATA CDMA March -15 11 Hrs-12 Hrs
The TCBH reported by all the service providers matched the network busy hour calculated by TUV auditors for the Gujarat circle.
AUDIT & ASSESSMENT OF QOS FOR QE-MARCH- 2015-GUJARAT CIRCLE
TUV-SUD SOUTH ASIA PRIVATE LIMITED Page 18
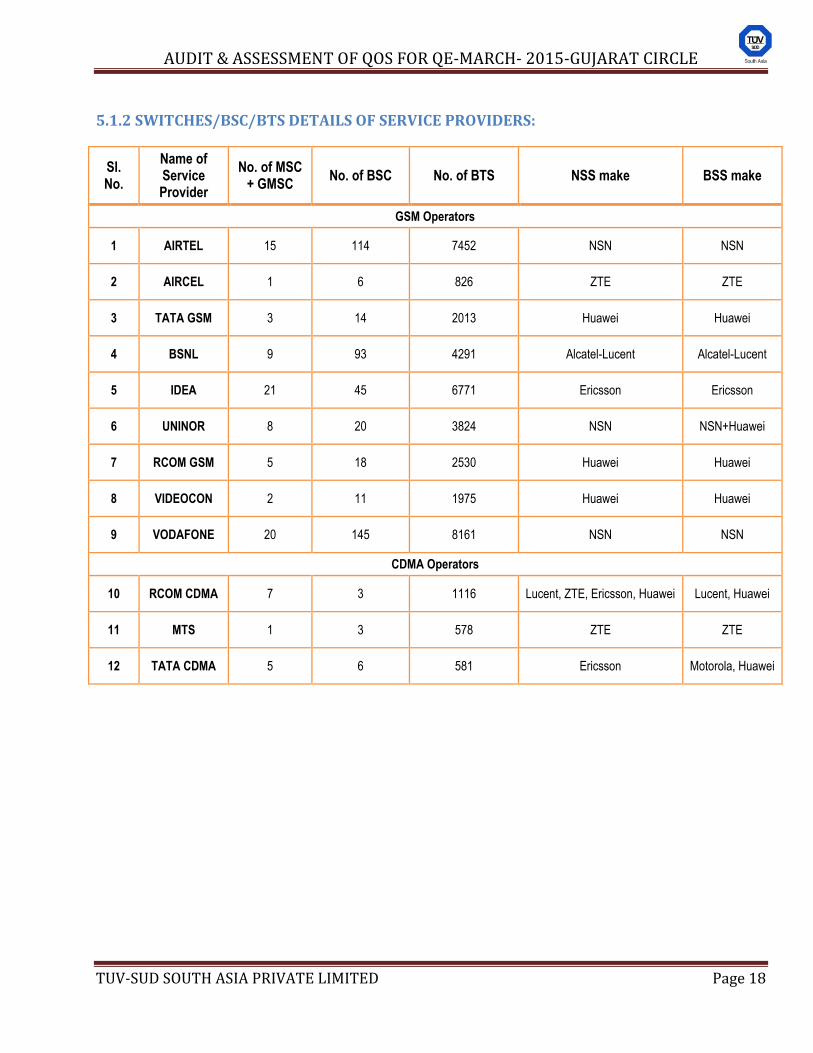
5.1.2 SWITCHES/BSC/BTS DETAILS OF SERVICE PROVIDERS:
Sl. No.
Name of Service Provider
No. of MSC + GMSC
No. of BSC No. of BTS NSS make BSS make
GSM Operators
1 AIRTEL 15 114 7452 NSN NSN
2 AIRCEL 1 6 826 ZTE ZTE
3 TATA GSM 3 14 2013 Huawei Huawei
4 BSNL 9 93 4291 Alcatel-Lucent Alcatel-Lucent
5 IDEA 21 45 6771 Ericsson Ericsson
6 UNINOR 8 20 3824 NSN NSN+Huawei
7 RCOM GSM 5 18 2530 Huawei Huawei
8 VIDEOCON 2 11 1975 Huawei Huawei
9 VODAFONE 20 145 8161 NSN NSN
CDMA Operators
10 RCOM CDMA 7 3 1116 Lucent, ZTE, Ericsson, Huawei Lucent, Huawei
11 MTS 1 3 578 ZTE ZTE
12 TATA CDMA 5 6 581 Ericsson Motorola, Huawei
AUDIT & ASSESSMENT OF QOS FOR QE-MARCH- 2015-GUJARAT CIRCLE
TUV-SUD SOUTH ASIA PRIVATE LIMITED Page 19
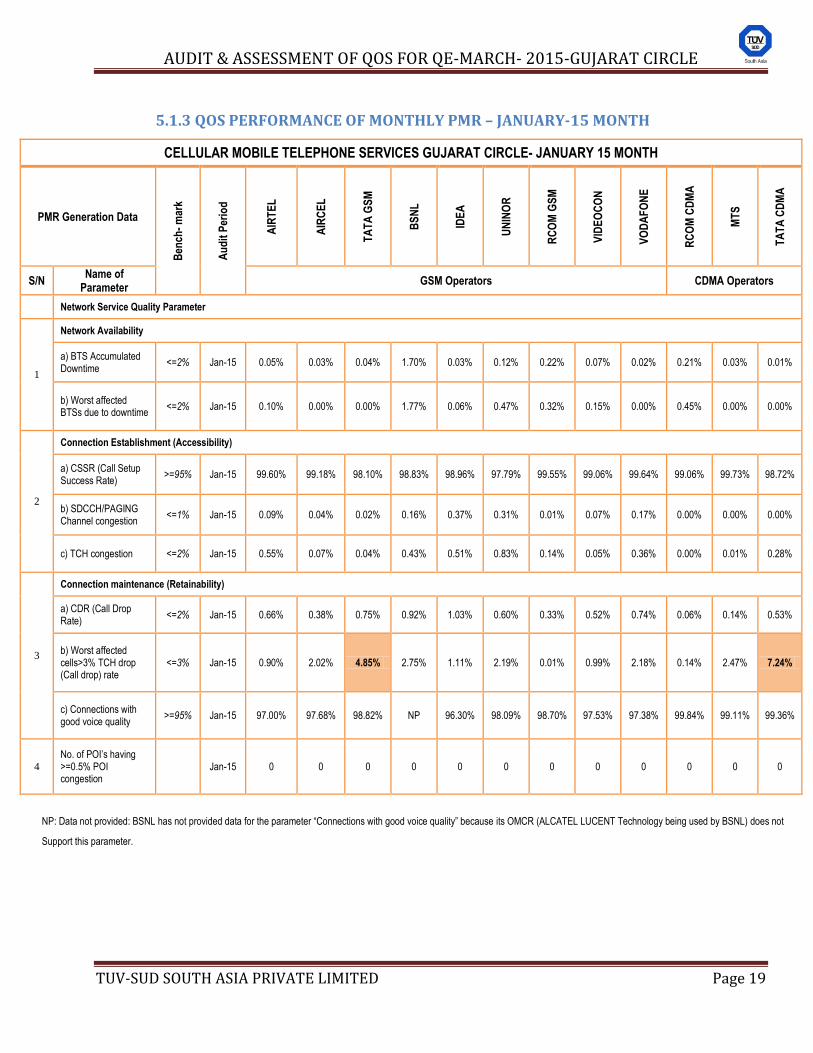
5.1.3 QOS PERFORMANCE OF MONTHLY PMR – JANUARY-15 MONTH
CELLULAR MOBILE TELEPHONE SERVICES GUJARAT CIRCLE- JANUARY 15 MONTH
PMR Generation Data
Ben
ch-
mar
k
Au
dit
Per
iod
AIR
TE
L
AIR
CE
L
TA
TA
GS
M
BS
NL
IDE
A
UN
INO
R
RC
OM
GS
M
VID
EO
CO
N
VO
DA
FO
NE
RC
OM
CD
MA
MT
S
TA
TA
CD
MA
S/N Name of
Parameter GSM Operators CDMA Operators
Network Service Quality Parameter
1
Network Availability
a) BTS Accumulated Downtime
<=2% Jan-15 0.05% 0.03% 0.04% 1.70% 0.03% 0.12% 0.22% 0.07% 0.02% 0.21% 0.03% 0.01%
b) Worst affected BTSs due to downtime
<=2% Jan-15 0.10% 0.00% 0.00% 1.77% 0.06% 0.47% 0.32% 0.15% 0.00% 0.45% 0.00% 0.00%
2
Connection Establishment (Accessibility)
a) CSSR (Call Setup Success Rate)
>=95% Jan-15 99.60% 99.18% 98.10% 98.83% 98.96% 97.79% 99.55% 99.06% 99.64% 99.06% 99.73% 98.72%
b) SDCCH/PAGING Channel congestion
<=1% Jan-15 0.09% 0.04% 0.02% 0.16% 0.37% 0.31% 0.01% 0.07% 0.17% 0.00% 0.00% 0.00%
c) TCH congestion <=2% Jan-15 0.55% 0.07% 0.04% 0.43% 0.51% 0.83% 0.14% 0.05% 0.36% 0.00% 0.01% 0.28%
3
Connection maintenance (Retainability)
a) CDR (Call Drop Rate)
<=2% Jan-15 0.66% 0.38% 0.75% 0.92% 1.03% 0.60% 0.33% 0.52% 0.74% 0.06% 0.14% 0.53%
b) Worst affected cells>3% TCH drop (Call drop) rate
<=3% Jan-15 0.90% 2.02% 4.85% 2.75% 1.11% 2.19% 0.01% 0.99% 2.18% 0.14% 2.47% 7.24%
c) Connections with good voice quality
>=95% Jan-15 97.00% 97.68% 98.82% NP 96.30% 98.09% 98.70% 97.53% 97.38% 99.84% 99.11% 99.36%
4 No. of POI‟s having >=0.5% POI congestion
Jan-15 0 0 0 0 0 0 0 0 0 0 0 0
NP: Data not provided: BSNL has not provided data for the parameter “Connections with good voice quality” because its OMCR (ALCATEL LUCENT Technology being used by BSNL) does not
Support this parameter.
AUDIT & ASSESSMENT OF QOS FOR QE-MARCH- 2015-GUJARAT CIRCLE
TUV-SUD SOUTH ASIA PRIVATE LIMITED Page 20
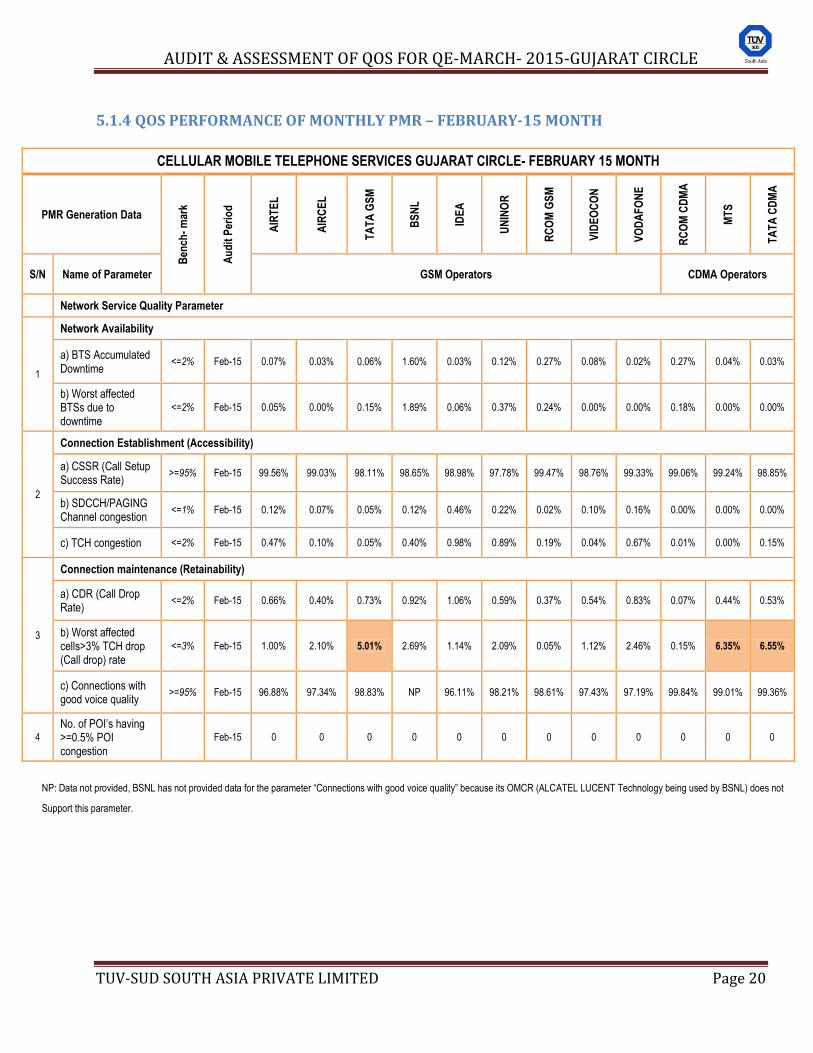
5.1.4 QOS PERFORMANCE OF MONTHLY PMR – FEBRUARY-15 MONTH
CELLULAR MOBILE TELEPHONE SERVICES GUJARAT CIRCLE- FEBRUARY 15 MONTH
PMR Generation Data
Ben
ch-
mar
k
Au
dit
Per
iod
AIR
TE
L
AIR
CE
L
TA
TA
GS
M
BS
NL
IDE
A
UN
INO
R
RC
OM
GS
M
VID
EO
CO
N
VO
DA
FO
NE
RC
OM
CD
MA
MT
S
TA
TA
CD
MA
S/N Name of Parameter GSM Operators CDMA Operators
Network Service Quality Parameter
1
Network Availability
a) BTS Accumulated Downtime
<=2% Feb-15 0.07% 0.03% 0.06% 1.60% 0.03% 0.12% 0.27% 0.08% 0.02% 0.27% 0.04% 0.03%
b) Worst affected BTSs due to downtime
<=2% Feb-15 0.05% 0.00% 0.15% 1.89% 0.06% 0.37% 0.24% 0.00% 0.00% 0.18% 0.00% 0.00%
2
Connection Establishment (Accessibility)
a) CSSR (Call Setup Success Rate)
>=95% Feb-15 99.56% 99.03% 98.11% 98.65% 98.98% 97.78% 99.47% 98.76% 99.33% 99.06% 99.24% 98.85%
b) SDCCH/PAGING Channel congestion
<=1% Feb-15 0.12% 0.07% 0.05% 0.12% 0.46% 0.22% 0.02% 0.10% 0.16% 0.00% 0.00% 0.00%
c) TCH congestion <=2% Feb-15 0.47% 0.10% 0.05% 0.40% 0.98% 0.89% 0.19% 0.04% 0.67% 0.01% 0.00% 0.15%
3
Connection maintenance (Retainability)
a) CDR (Call Drop Rate)
<=2% Feb-15 0.66% 0.40% 0.73% 0.92% 1.06% 0.59% 0.37% 0.54% 0.83% 0.07% 0.44% 0.53%
b) Worst affected cells>3% TCH drop (Call drop) rate
<=3% Feb-15 1.00% 2.10% 5.01% 2.69% 1.14% 2.09% 0.05% 1.12% 2.46% 0.15% 6.35% 6.55%
c) Connections with good voice quality
>=95% Feb-15 96.88% 97.34% 98.83% NP 96.11% 98.21% 98.61% 97.43% 97.19% 99.84% 99.01% 99.36%
4
No. of POI‟s having >=0.5% POI congestion
Feb-15 0 0 0 0 0 0 0 0 0 0 0 0
NP: Data not provided, BSNL has not provided data for the parameter “Connections with good voice quality” because its OMCR (ALCATEL LUCENT Technology being used by BSNL) does not
Support this parameter.
AUDIT & ASSESSMENT OF QOS FOR QE-MARCH- 2015-GUJARAT CIRCLE
TUV-SUD SOUTH ASIA PRIVATE LIMITED Page 21
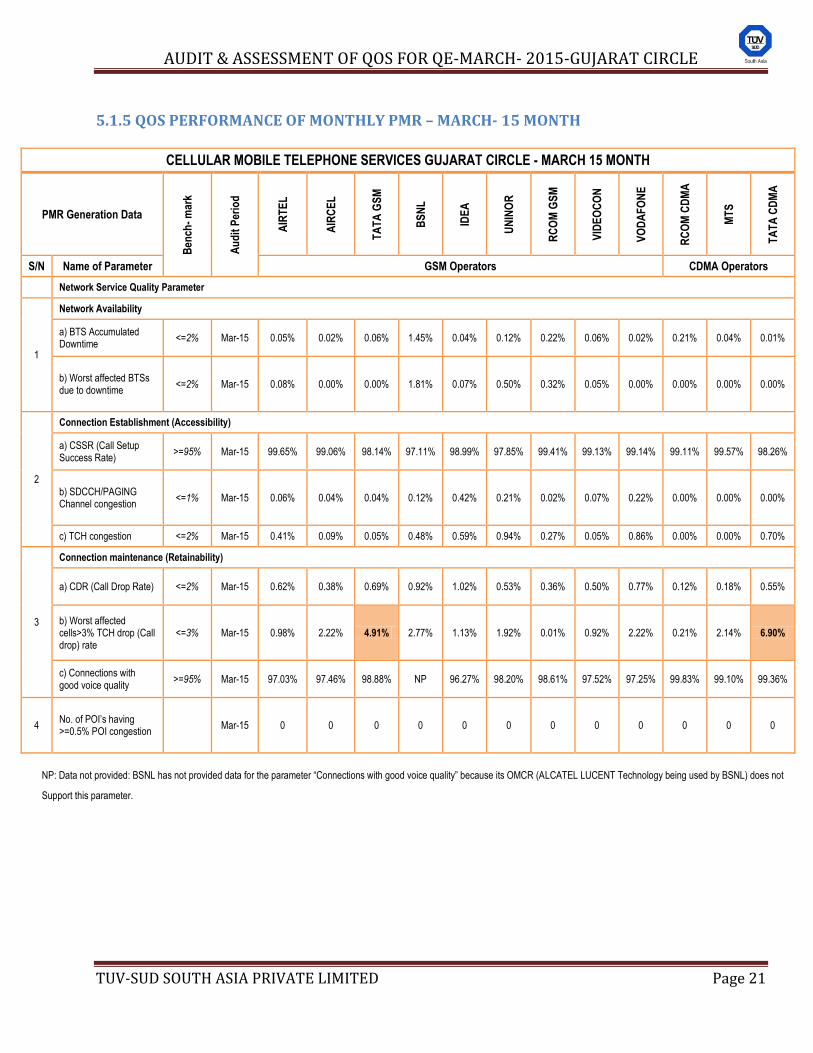
5.1.5 QOS PERFORMANCE OF MONTHLY PMR – MARCH- 15 MONTH
CELLULAR MOBILE TELEPHONE SERVICES GUJARAT CIRCLE - MARCH 15 MONTH
PMR Generation Data
Ben
ch-
mar
k
Au
dit
Per
iod
AIR
TE
L
AIR
CE
L
TA
TA
GS
M
BS
NL
IDE
A
UN
INO
R
RC
OM
GS
M
VID
EO
CO
N
VO
DA
FO
NE
RC
OM
CD
MA
MT
S
TA
TA
CD
MA
S/N Name of Parameter GSM Operators CDMA Operators
Network Service Quality Parameter
1
Network Availability
a) BTS Accumulated Downtime
<=2% Mar-15 0.05% 0.02% 0.06% 1.45% 0.04% 0.12% 0.22% 0.06% 0.02% 0.21% 0.04% 0.01%
b) Worst affected BTSs due to downtime
<=2% Mar-15 0.08% 0.00% 0.00% 1.81% 0.07% 0.50% 0.32% 0.05% 0.00% 0.00% 0.00% 0.00%
2
Connection Establishment (Accessibility)
a) CSSR (Call Setup Success Rate)
>=95% Mar-15 99.65% 99.06% 98.14% 97.11% 98.99% 97.85% 99.41% 99.13% 99.14% 99.11% 99.57% 98.26%
b) SDCCH/PAGING Channel congestion
<=1% Mar-15 0.06% 0.04% 0.04% 0.12% 0.42% 0.21% 0.02% 0.07% 0.22% 0.00% 0.00% 0.00%
c) TCH congestion <=2% Mar-15 0.41% 0.09% 0.05% 0.48% 0.59% 0.94% 0.27% 0.05% 0.86% 0.00% 0.00% 0.70%
3
Connection maintenance (Retainability)
a) CDR (Call Drop Rate) <=2% Mar-15 0.62% 0.38% 0.69% 0.92% 1.02% 0.53% 0.36% 0.50% 0.77% 0.12% 0.18% 0.55%
b) Worst affected cells>3% TCH drop (Call drop) rate
<=3% Mar-15 0.98% 2.22% 4.91% 2.77% 1.13% 1.92% 0.01% 0.92% 2.22% 0.21% 2.14% 6.90%
c) Connections with good voice quality
>=95% Mar-15 97.03% 97.46% 98.88% NP 96.27% 98.20% 98.61% 97.52% 97.25% 99.83% 99.10% 99.36%
4 No. of POI‟s having >=0.5% POI congestion
Mar-15 0 0 0 0 0 0 0 0 0 0 0 0
NP: Data not provided: BSNL has not provided data for the parameter “Connections with good voice quality” because its OMCR (ALCATEL LUCENT Technology being used by BSNL) does not
Support this parameter.
AUDIT & ASSESSMENT OF QOS FOR QE-MARCH- 2015-GUJARAT CIRCLE
TUV-SUD SOUTH ASIA PRIVATE LIMITED Page 22
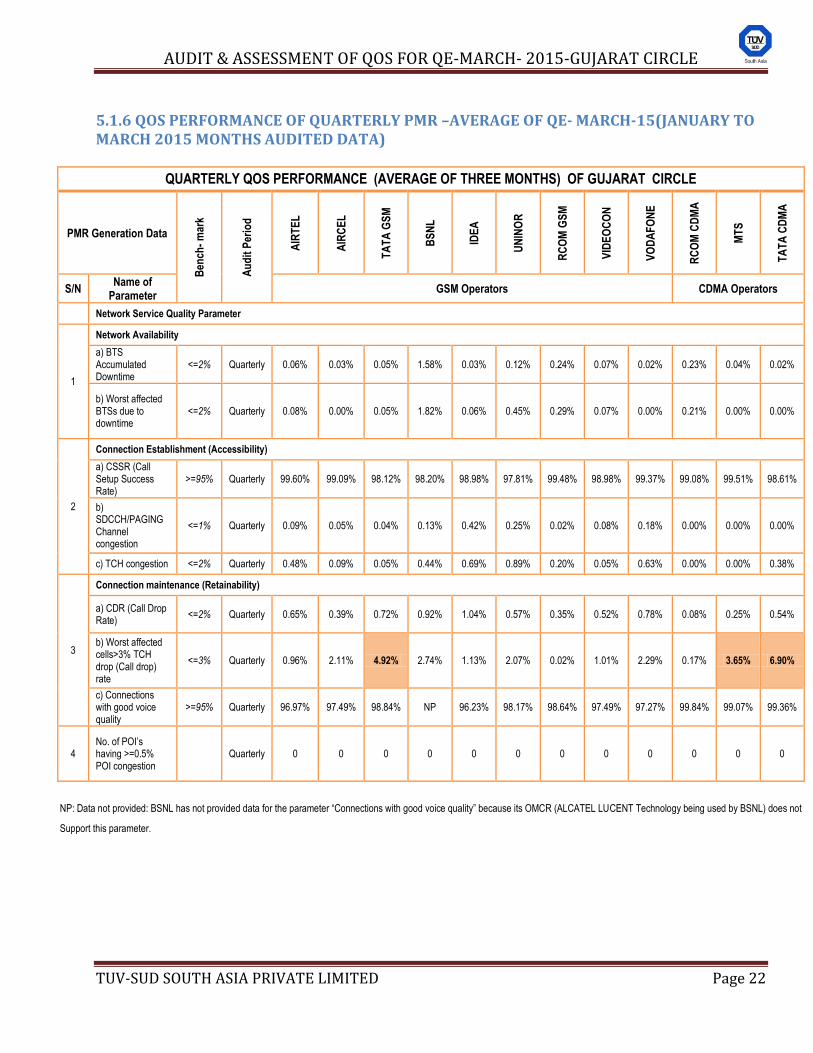
5.1.6 QOS PERFORMANCE OF QUARTERLY PMR –AVERAGE OF QE- MARCH-15(JANUARY TO MARCH 2015 MONTHS AUDITED DATA)
QUARTERLY QOS PERFORMANCE (AVERAGE OF THREE MONTHS) OF GUJARAT CIRCLE
PMR Generation Data
Ben
ch-
mar
k
Au
dit
Per
iod
AIR
TE
L
AIR
CE
L
TA
TA
GS
M
BS
NL
IDE
A
UN
INO
R
RC
OM
GS
M
VID
EO
CO
N
VO
DA
FO
NE
RC
OM
CD
MA
MT
S
TA
TA
CD
MA
S/N Name of
Parameter GSM Operators CDMA Operators
Network Service Quality Parameter
1
Network Availability
a) BTS Accumulated Downtime
<=2% Quarterly 0.06% 0.03% 0.05% 1.58% 0.03% 0.12% 0.24% 0.07% 0.02% 0.23% 0.04% 0.02%
b) Worst affected BTSs due to downtime
<=2% Quarterly 0.08% 0.00% 0.05% 1.82% 0.06% 0.45% 0.29% 0.07% 0.00% 0.21% 0.00% 0.00%
2
Connection Establishment (Accessibility)
a) CSSR (Call Setup Success Rate)
>=95% Quarterly 99.60% 99.09% 98.12% 98.20% 98.98% 97.81% 99.48% 98.98% 99.37% 99.08% 99.51% 98.61%
b) SDCCH/PAGING Channel congestion
<=1% Quarterly 0.09% 0.05% 0.04% 0.13% 0.42% 0.25% 0.02% 0.08% 0.18% 0.00% 0.00% 0.00%
c) TCH congestion <=2% Quarterly 0.48% 0.09% 0.05% 0.44% 0.69% 0.89% 0.20% 0.05% 0.63% 0.00% 0.00% 0.38%
3
Connection maintenance (Retainability)
a) CDR (Call Drop Rate)
<=2% Quarterly 0.65% 0.39% 0.72% 0.92% 1.04% 0.57% 0.35% 0.52% 0.78% 0.08% 0.25% 0.54%
b) Worst affected cells>3% TCH drop (Call drop) rate
<=3% Quarterly 0.96% 2.11% 4.92% 2.74% 1.13% 2.07% 0.02% 1.01% 2.29% 0.17% 3.65% 6.90%
c) Connections with good voice quality
>=95% Quarterly 96.97% 97.49% 98.84% NP 96.23% 98.17% 98.64% 97.49% 97.27% 99.84% 99.07% 99.36%
4 No. of POI‟s having >=0.5% POI congestion
Quarterly 0 0 0 0 0 0 0 0 0 0 0 0
NP: Data not provided: BSNL has not provided data for the parameter “Connections with good voice quality” because its OMCR (ALCATEL LUCENT Technology being used by BSNL) does not
Support this parameter.
AUDIT & ASSESSMENT OF QOS FOR QE-MARCH- 2015-GUJARAT CIRCLE
TUV-SUD SOUTH ASIA PRIVATE LIMITED Page 23
5.1.7 KEY FINDINGS ON MONTHLY PMR AUDIT REPORTS:
The audit of network related parameters for cellular mobile service providers was conducted at their respective MSCs in the circle.
TUV conducted audit for cellular mobile operators based on three stage audit / verification viz audit of the records, live measurements and drive tests. This exercise has been repeated every month for CMSPs.
Network Service Quality Parameters:
Network Availability
i. BTS Accumulated Downtime (Not Available for Service): ii. Worst affected BTSs due to downtime
For measuring the performance against the benchmark for this parameter, down time of each BTS lasting for more than 1 hour at a time in a day during the period of a month has been taken for computation. In Gujarat circle, all the operators were found meeting benchmark of the above parameters „BTS accumulated downtime‟ and „worst affected BTSs due to down time‟ in all the three months of the quarter. Connection Establishment (Accessibility)
i. Call Set-up Success Rate(CSSR)
CSSR includes complete signaling in the call set up process and does not aim to measure the performance of the called exchange or that of the Point of Interconnection (POI). CSSR was established as the ratio of total number of successful call attempts (establishment) to the total number of call attempts made. All the operators were found to be calculating the parameter as per the TRAI‟s specified norms. All the operators were comfortably meeting the benchmark of this parameter. Parameters related to Network Congestion:
The parameters namely SDCCH / Paging Channel Congestion, TCH and POI are prescribed with the aim of measuring the congestion in the network. In CDMA system, there is no direct counter defined for reporting Paging Channel Congestion as reported by Tata Teleservices. However, they have a defined counter for Paging Channel Occupancy Ratio (PCH Average Using Ratio) which is used to determine the Paging Channel Occupancy which on an average is < 50% on all sites in the network. When the value of this parameter is less than 100%, it is counted as 0% congestion. Thus, there is no congestion on the pegging channel in CDMA system. With respect to this parameter, the performance of the operators is quite satisfactory as all operators met the TRAI specified benchmarks on the congestion parameters. There was no congestion on individual POI links between a service provider vis-à-vis other service providers.
AUDIT & ASSESSMENT OF QOS FOR QE-MARCH- 2015-GUJARAT CIRCLE
TUV-SUD SOUTH ASIA PRIVATE LIMITED Page 24
Connection Maintenance (Retainability)
i. Call Drop Rate: This parameter gives a reliable measurement of the mobile network used by the service provider for maintaining a call once it has been correctly established. Failures in coverage, network congestion and network failures have important impact on this parameter. The audit of this parameter revealed that all the service providers were measuring this parameter as per the TRAI guidelines. Also, all the service providers were found to be meeting the TRAI specified benchmark. The lowest call drop rate (average 0 .08 %) was for RCOM (CDMA) during the quarter.
ii. Worst affected cells having more than 3% TCH drops Worst affected cells are defined as cells in which the call drop rate exceeds 3% during cell Bouncing Busy Hour (CBBH) or at any other hour of a day. The audit, with respect to this parameter revealed that Tata (GSM), MTS and Tata (CDMA) were non-compliants in the three months of the quarter with their average performance of 4.92%, 3.65% and 6.90% respectively.
iii. Connections with good voice quality:
Some of the Operators are measuring this parameter through the system generated data at their switches whereas some are measuring through their periodic drive tests. The audit results for this parameter indicates that all operators have met the bench mark successfully during the quarter.
iv. POI congestion.
There was no congestion on individual POI links between a service provider vis-à-vis other service providers.
AUDIT & ASSESSMENT OF QOS FOR QE-MARCH- 2015-GUJARAT CIRCLE
TUV-SUD SOUTH ASIA PRIVATE LIMITED Page 25
3-DAYS LIVE MEASUREMENT DATA VERIFICATION FOR
CELLULAR MOBILE SERVICE PROVIDERS
(NETWORK SERVICE QUALITY PARAMETER)
AUDIT & ASSESSMENT OF QOS FOR QE-MARCH- 2015-GUJARAT CIRCLE
TUV-SUD SOUTH ASIA PRIVATE LIMITED Page 26
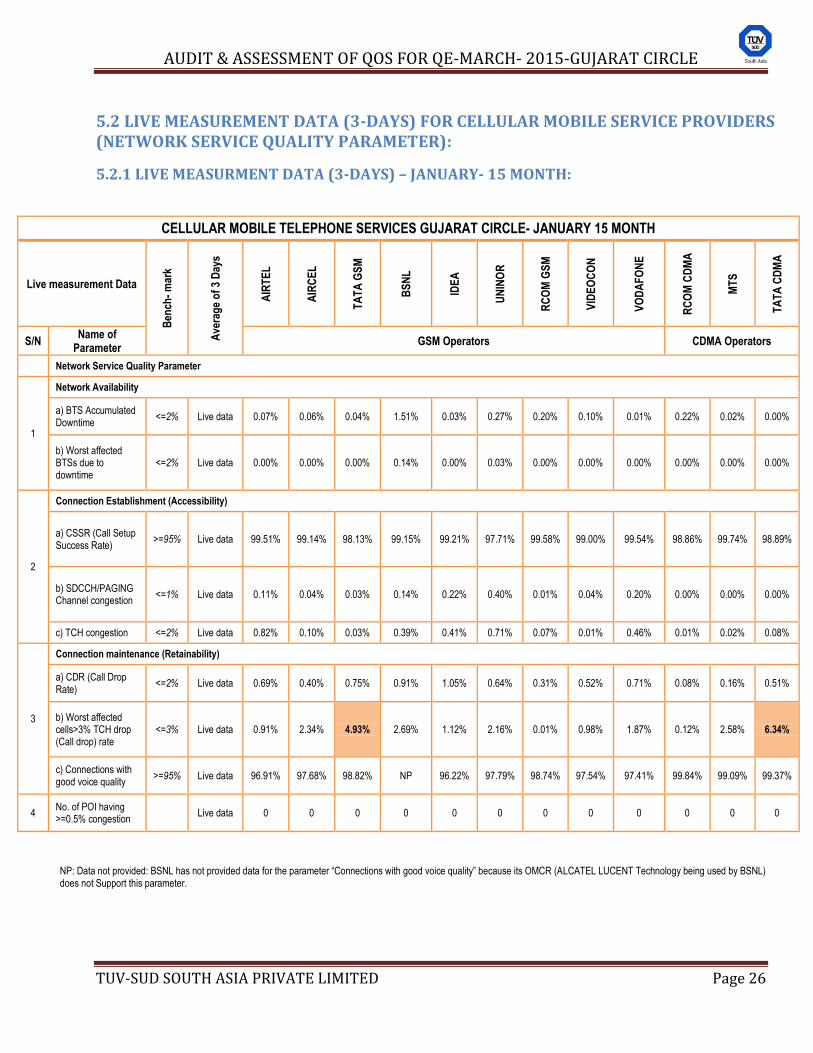
5.2 LIVE MEASUREMENT DATA (3-DAYS) FOR CELLULAR MOBILE SERVICE PROVIDERS (NETWORK SERVICE QUALITY PARAMETER):
5.2.1 LIVE MEASURMENT DATA (3-DAYS) – JANUARY- 15 MONTH:
CELLULAR MOBILE TELEPHONE SERVICES GUJARAT CIRCLE- JANUARY 15 MONTH
Live measurement Data
Ben
ch-
mar
k
Ave
rag
e o
f 3
Day
s
AIR
TE
L
AIR
CE
L
TA
TA
GS
M
BS
NL
IDE
A
UN
INO
R
RC
OM
GS
M
VID
EO
CO
N
VO
DA
FO
NE
RC
OM
CD
MA
MT
S
TA
TA
CD
MA
S/N Name of
Parameter GSM Operators CDMA Operators
Network Service Quality Parameter
1
Network Availability
a) BTS Accumulated Downtime
<=2% Live data 0.07% 0.06% 0.04% 1.51% 0.03% 0.27% 0.20% 0.10% 0.01% 0.22% 0.02% 0.00%
b) Worst affected BTSs due to downtime
<=2% Live data 0.00% 0.00% 0.00% 0.14% 0.00% 0.03% 0.00% 0.00% 0.00% 0.00% 0.00% 0.00%
2
Connection Establishment (Accessibility)
a) CSSR (Call Setup Success Rate)
>=95% Live data 99.51% 99.14% 98.13% 99.15% 99.21% 97.71% 99.58% 99.00% 99.54% 98.86% 99.74% 98.89%
b) SDCCH/PAGING Channel congestion
<=1% Live data 0.11% 0.04% 0.03% 0.14% 0.22% 0.40% 0.01% 0.04% 0.20% 0.00% 0.00% 0.00%
c) TCH congestion <=2% Live data 0.82% 0.10% 0.03% 0.39% 0.41% 0.71% 0.07% 0.01% 0.46% 0.01% 0.02% 0.08%
3
Connection maintenance (Retainability)
a) CDR (Call Drop Rate)
<=2% Live data 0.69% 0.40% 0.75% 0.91% 1.05% 0.64% 0.31% 0.52% 0.71% 0.08% 0.16% 0.51%
b) Worst affected cells>3% TCH drop (Call drop) rate
<=3% Live data 0.91% 2.34% 4.93% 2.69% 1.12% 2.16% 0.01% 0.98% 1.87% 0.12% 2.58% 6.34%
c) Connections with good voice quality
>=95% Live data 96.91% 97.68% 98.82% NP 96.22% 97.79% 98.74% 97.54% 97.41% 99.84% 99.09% 99.37%
4 No. of POI having >=0.5% congestion
Live data 0 0 0 0 0 0 0 0 0 0 0 0
NP: Data not provided: BSNL has not provided data for the parameter “Connections with good voice quality” because its OMCR (ALCATEL LUCENT Technology being used by BSNL) does not Support this parameter.
AUDIT & ASSESSMENT OF QOS FOR QE-MARCH- 2015-GUJARAT CIRCLE
TUV-SUD SOUTH ASIA PRIVATE LIMITED Page 27
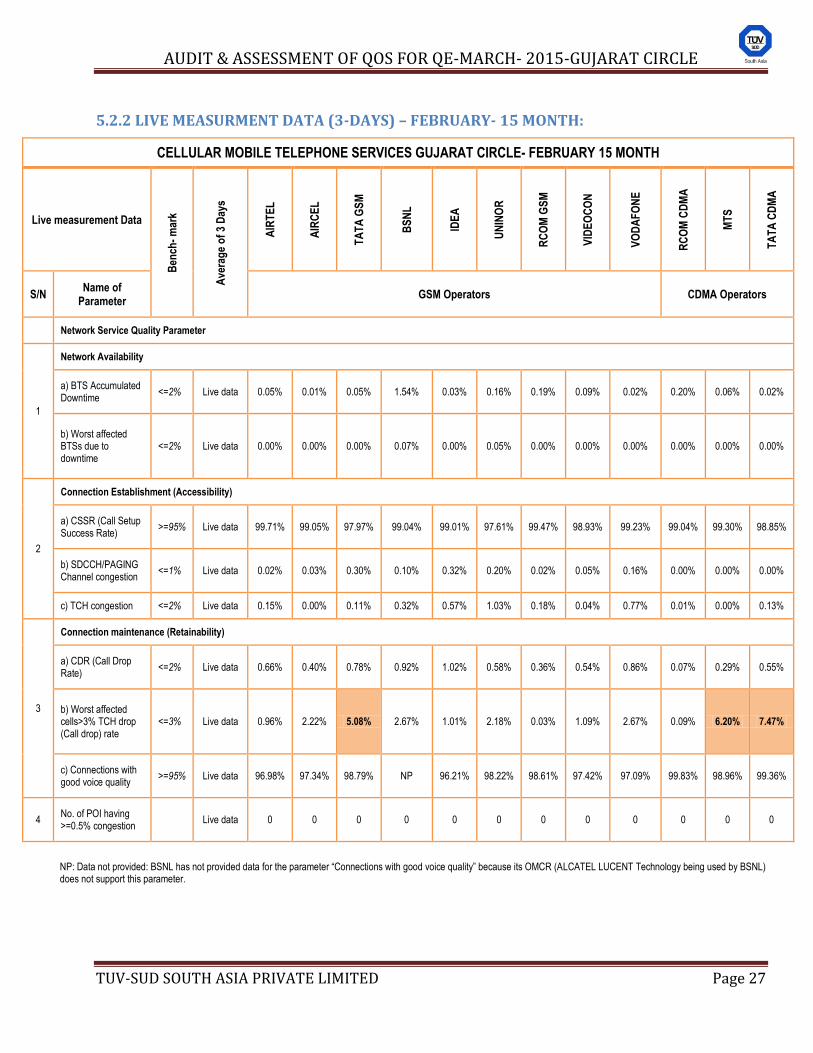
5.2.2 LIVE MEASURMENT DATA (3-DAYS) – FEBRUARY- 15 MONTH:
CELLULAR MOBILE TELEPHONE SERVICES GUJARAT CIRCLE- FEBRUARY 15 MONTH
Live measurement Data
Ben
ch-
mar
k
Ave
rag
e o
f 3
Day
s
AIR
TE
L
AIR
CE
L
TA
TA
GS
M
BS
NL
IDE
A
UN
INO
R
RC
OM
GS
M
VID
EO
CO
N
VO
DA
FO
NE
RC
OM
CD
MA
MT
S
TA
TA
CD
MA
S/N Name of
Parameter GSM Operators CDMA Operators
Network Service Quality Parameter
1
Network Availability
a) BTS Accumulated Downtime
<=2% Live data 0.05% 0.01% 0.05% 1.54% 0.03% 0.16% 0.19% 0.09% 0.02% 0.20% 0.06% 0.02%
b) Worst affected BTSs due to downtime
<=2% Live data 0.00% 0.00% 0.00% 0.07% 0.00% 0.05% 0.00% 0.00% 0.00% 0.00% 0.00% 0.00%
2
Connection Establishment (Accessibility)
a) CSSR (Call Setup Success Rate)
>=95% Live data 99.71% 99.05% 97.97% 99.04% 99.01% 97.61% 99.47% 98.93% 99.23% 99.04% 99.30% 98.85%
b) SDCCH/PAGING Channel congestion
<=1% Live data 0.02% 0.03% 0.30% 0.10% 0.32% 0.20% 0.02% 0.05% 0.16% 0.00% 0.00% 0.00%
c) TCH congestion <=2% Live data 0.15% 0.00% 0.11% 0.32% 0.57% 1.03% 0.18% 0.04% 0.77% 0.01% 0.00% 0.13%
3
Connection maintenance (Retainability)
a) CDR (Call Drop Rate)
<=2% Live data 0.66% 0.40% 0.78% 0.92% 1.02% 0.58% 0.36% 0.54% 0.86% 0.07% 0.29% 0.55%
b) Worst affected cells>3% TCH drop (Call drop) rate
<=3% Live data 0.96% 2.22% 5.08% 2.67% 1.01% 2.18% 0.03% 1.09% 2.67% 0.09% 6.20% 7.47%
c) Connections with good voice quality
>=95% Live data 96.98% 97.34% 98.79% NP 96.21% 98.22% 98.61% 97.42% 97.09% 99.83% 98.96% 99.36%
4 No. of POI having >=0.5% congestion
Live data 0 0 0 0 0 0 0 0 0 0 0 0
NP: Data not provided: BSNL has not provided data for the parameter “Connections with good voice quality” because its OMCR (ALCATEL LUCENT Technology being used by BSNL) does not support this parameter.
AUDIT & ASSESSMENT OF QOS FOR QE-MARCH- 2015-GUJARAT CIRCLE
TUV-SUD SOUTH ASIA PRIVATE LIMITED Page 28
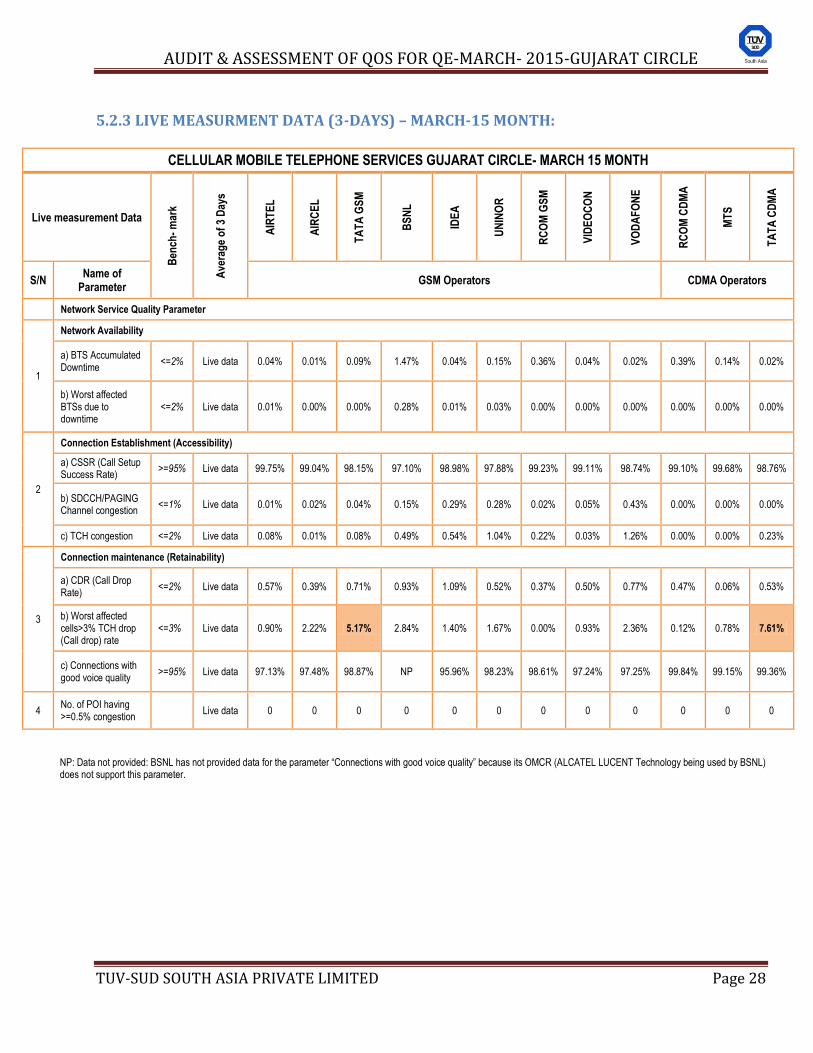
5.2.3 LIVE MEASURMENT DATA (3-DAYS) – MARCH-15 MONTH:
CELLULAR MOBILE TELEPHONE SERVICES GUJARAT CIRCLE- MARCH 15 MONTH
Live measurement Data
Ben
ch-
mar
k
Ave
rag
e o
f 3
Day
s
AIR
TE
L
AIR
CE
L
TA
TA
GS
M
BS
NL
IDE
A
UN
INO
R
RC
OM
GS
M
VID
EO
CO
N
VO
DA
FO
NE
RC
OM
CD
MA
MT
S
TA
TA
CD
MA
S/N Name of
Parameter GSM Operators CDMA Operators
Network Service Quality Parameter
1
Network Availability
a) BTS Accumulated Downtime
<=2% Live data 0.04% 0.01% 0.09% 1.47% 0.04% 0.15% 0.36% 0.04% 0.02% 0.39% 0.14% 0.02%
b) Worst affected BTSs due to downtime
<=2% Live data 0.01% 0.00% 0.00% 0.28% 0.01% 0.03% 0.00% 0.00% 0.00% 0.00% 0.00% 0.00%
2
Connection Establishment (Accessibility)
a) CSSR (Call Setup Success Rate)
>=95% Live data 99.75% 99.04% 98.15% 97.10% 98.98% 97.88% 99.23% 99.11% 98.74% 99.10% 99.68% 98.76%
b) SDCCH/PAGING Channel congestion
<=1% Live data 0.01% 0.02% 0.04% 0.15% 0.29% 0.28% 0.02% 0.05% 0.43% 0.00% 0.00% 0.00%
c) TCH congestion <=2% Live data 0.08% 0.01% 0.08% 0.49% 0.54% 1.04% 0.22% 0.03% 1.26% 0.00% 0.00% 0.23%
3
Connection maintenance (Retainability)
a) CDR (Call Drop Rate)
<=2% Live data 0.57% 0.39% 0.71% 0.93% 1.09% 0.52% 0.37% 0.50% 0.77% 0.47% 0.06% 0.53%
b) Worst affected cells>3% TCH drop (Call drop) rate
<=3% Live data 0.90% 2.22% 5.17% 2.84% 1.40% 1.67% 0.00% 0.93% 2.36% 0.12% 0.78% 7.61%
c) Connections with good voice quality
>=95% Live data 97.13% 97.48% 98.87% NP 95.96% 98.23% 98.61% 97.24% 97.25% 99.84% 99.15% 99.36%
4 No. of POI having >=0.5% congestion
Live data 0 0 0 0 0 0 0 0 0 0 0 0
NP: Data not provided: BSNL has not provided data for the parameter “Connections with good voice quality” because its OMCR (ALCATEL LUCENT Technology being used by BSNL) does not support this parameter.
AUDIT & ASSESSMENT OF QOS FOR QE-MARCH- 2015-GUJARAT CIRCLE
TUV-SUD SOUTH ASIA PRIVATE LIMITED Page 29
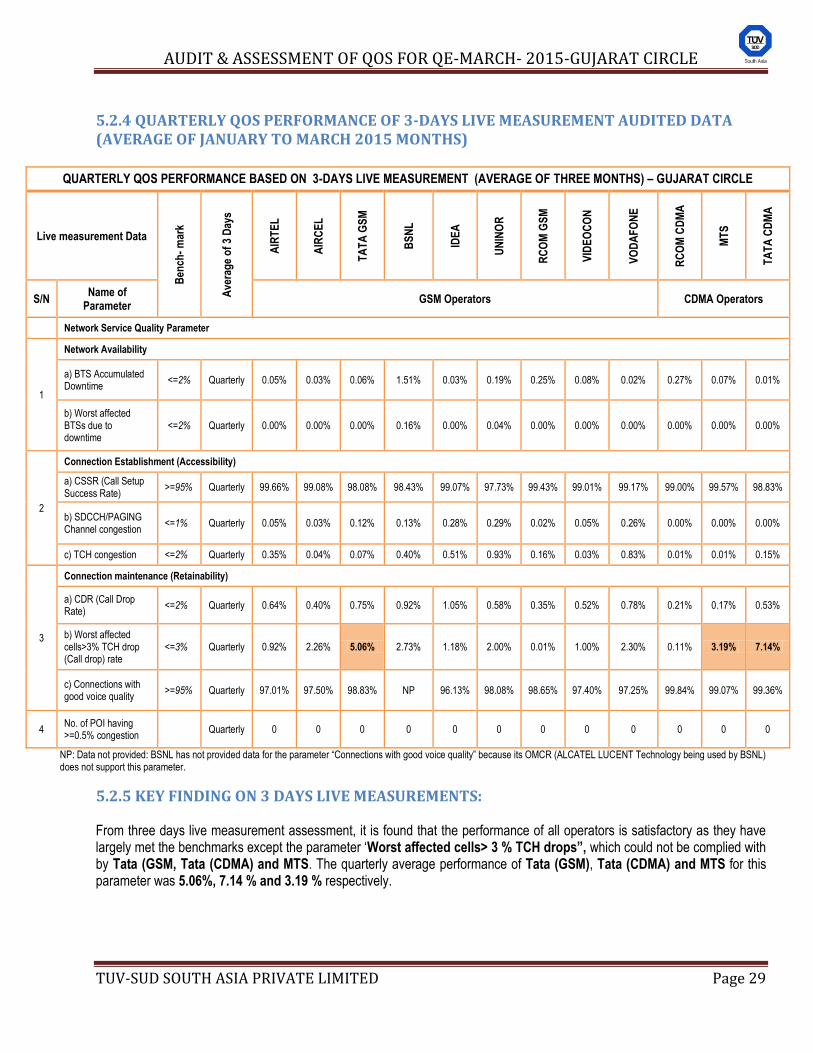
5.2.4 QUARTERLY QOS PERFORMANCE OF 3-DAYS LIVE MEASUREMENT AUDITED DATA (AVERAGE OF JANUARY TO MARCH 2015 MONTHS)
QUARTERLY QOS PERFORMANCE BASED ON 3-DAYS LIVE MEASUREMENT (AVERAGE OF THREE MONTHS) – GUJARAT CIRCLE
Live measurement Data
Ben
ch-
mar
k
Ave
rag
e o
f 3
Day
s
AIR
TE
L
AIR
CE
L
TA
TA
GS
M
BS
NL
IDE
A
UN
INO
R
RC
OM
GS
M
VID
EO
CO
N
VO
DA
FO
NE
RC
OM
CD
MA
MT
S
TA
TA
CD
MA
S/N Name of
Parameter GSM Operators CDMA Operators
Network Service Quality Parameter
1
Network Availability
a) BTS Accumulated Downtime
<=2% Quarterly 0.05% 0.03% 0.06% 1.51% 0.03% 0.19% 0.25% 0.08% 0.02% 0.27% 0.07% 0.01%
b) Worst affected BTSs due to downtime
<=2% Quarterly 0.00% 0.00% 0.00% 0.16% 0.00% 0.04% 0.00% 0.00% 0.00% 0.00% 0.00% 0.00%
2
Connection Establishment (Accessibility)
a) CSSR (Call Setup Success Rate)
>=95% Quarterly 99.66% 99.08% 98.08% 98.43% 99.07% 97.73% 99.43% 99.01% 99.17% 99.00% 99.57% 98.83%
b) SDCCH/PAGING Channel congestion
<=1% Quarterly 0.05% 0.03% 0.12% 0.13% 0.28% 0.29% 0.02% 0.05% 0.26% 0.00% 0.00% 0.00%
c) TCH congestion <=2% Quarterly 0.35% 0.04% 0.07% 0.40% 0.51% 0.93% 0.16% 0.03% 0.83% 0.01% 0.01% 0.15%
3
Connection maintenance (Retainability)
a) CDR (Call Drop Rate)
<=2% Quarterly 0.64% 0.40% 0.75% 0.92% 1.05% 0.58% 0.35% 0.52% 0.78% 0.21% 0.17% 0.53%
b) Worst affected cells>3% TCH drop (Call drop) rate
<=3% Quarterly 0.92% 2.26% 5.06% 2.73% 1.18% 2.00% 0.01% 1.00% 2.30% 0.11% 3.19% 7.14%
c) Connections with good voice quality
>=95% Quarterly 97.01% 97.50% 98.83% NP 96.13% 98.08% 98.65% 97.40% 97.25% 99.84% 99.07% 99.36%
4 No. of POI having >=0.5% congestion
Quarterly 0 0 0 0 0 0 0 0 0 0 0 0
NP: Data not provided: BSNL has not provided data for the parameter “Connections with good voice quality” because its OMCR (ALCATEL LUCENT Technology being used by BSNL) does not support this parameter.
5.2.5 KEY FINDING ON 3 DAYS LIVE MEASUREMENTS: From three days live measurement assessment, it is found that the performance of all operators is satisfactory as they have largely met the benchmarks except the parameter „Worst affected cells> 3 % TCH drops”, which could not be complied with by Tata (GSM, Tata (CDMA) and MTS. The quarterly average performance of Tata (GSM), Tata (CDMA) and MTS for this parameter was 5.06%, 7.14 % and 3.19 % respectively.
AUDIT & ASSESSMENT OF QOS FOR QE-MARCH- 2015-GUJARAT CIRCLE
TUV-SUD SOUTH ASIA PRIVATE LIMITED Page 30
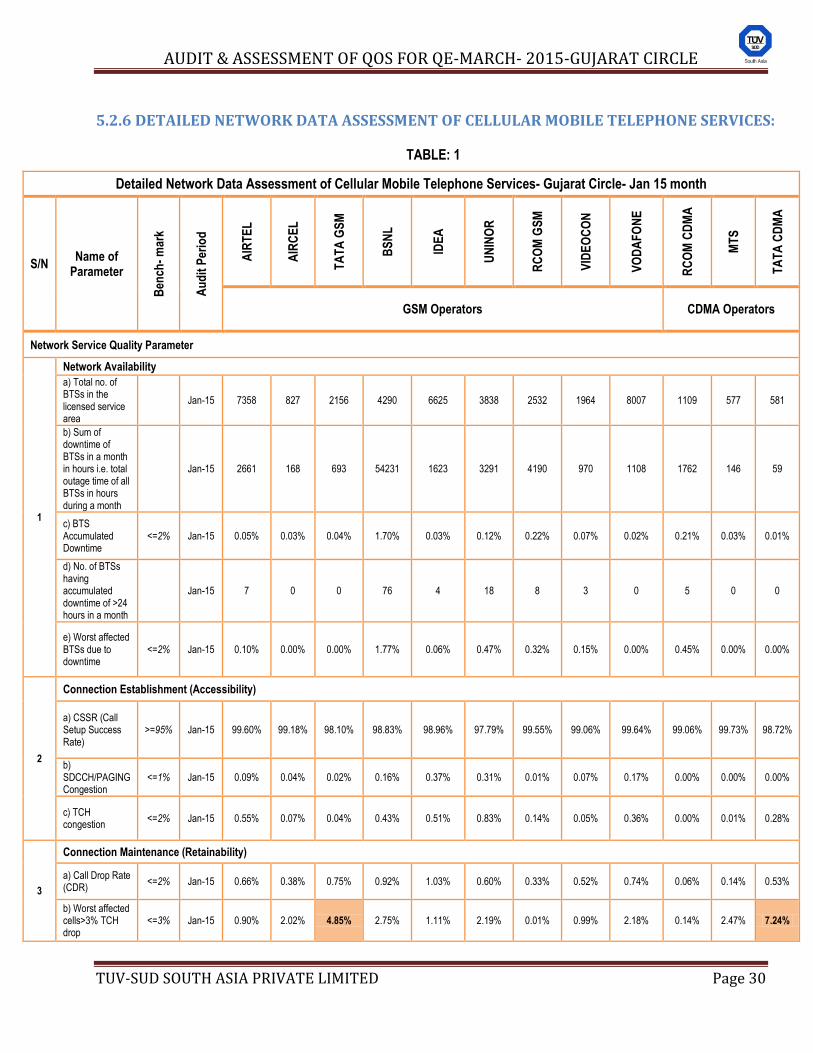
5.2.6 DETAILED NETWORK DATA ASSESSMENT OF CELLULAR MOBILE TELEPHONE SERVICES:
TABLE: 1
Detailed Network Data Assessment of Cellular Mobile Telephone Services- Gujarat Circle- Jan 15 month
S/N Name of
Parameter
Ben
ch-
mar
k
Au
dit
Per
iod
AIR
TE
L
AIR
CE
L
TA
TA
GS
M
BS
NL
IDE
A
UN
INO
R
RC
OM
GS
M
VID
EO
CO
N
VO
DA
FO
NE
RC
OM
CD
MA
MT
S
TA
TA
CD
MA
GSM Operators CDMA Operators
Network Service Quality Parameter
1
Network Availability
a) Total no. of BTSs in the licensed service area
Jan-15 7358 827 2156 4290 6625 3838 2532 1964 8007 1109 577 581
b) Sum of downtime of BTSs in a month in hours i.e. total outage time of all BTSs in hours during a month
Jan-15 2661 168 693 54231 1623 3291 4190 970 1108 1762 146 59
c) BTS Accumulated Downtime
<=2% Jan-15 0.05% 0.03% 0.04% 1.70% 0.03% 0.12% 0.22% 0.07% 0.02% 0.21% 0.03% 0.01%
d) No. of BTSs having accumulated downtime of >24 hours in a month
Jan-15 7 0 0 76 4 18 8 3 0 5 0 0
e) Worst affected BTSs due to downtime
<=2% Jan-15 0.10% 0.00% 0.00% 1.77% 0.06% 0.47% 0.32% 0.15% 0.00% 0.45% 0.00% 0.00%
2
Connection Establishment (Accessibility)
a) CSSR (Call Setup Success Rate)
>=95% Jan-15 99.60% 99.18% 98.10% 98.83% 98.96% 97.79% 99.55% 99.06% 99.64% 99.06% 99.73% 98.72%
b) SDCCH/PAGING Congestion
<=1% Jan-15 0.09% 0.04% 0.02% 0.16% 0.37% 0.31% 0.01% 0.07% 0.17% 0.00% 0.00% 0.00%
c) TCH congestion
<=2% Jan-15 0.55% 0.07% 0.04% 0.43% 0.51% 0.83% 0.14% 0.05% 0.36% 0.00% 0.01% 0.28%
3
Connection Maintenance (Retainability)
a) Call Drop Rate (CDR)
<=2% Jan-15 0.66% 0.38% 0.75% 0.92% 1.03% 0.60% 0.33% 0.52% 0.74% 0.06% 0.14% 0.53%
b) Worst affected cells>3% TCH drop
<=3% Jan-15 0.90% 2.02% 4.85% 2.75% 1.11% 2.19% 0.01% 0.99% 2.18% 0.14% 2.47% 7.24%
AUDIT & ASSESSMENT OF QOS FOR QE-MARCH- 2015-GUJARAT CIRCLE
TUV-SUD SOUTH ASIA PRIVATE LIMITED Page 31
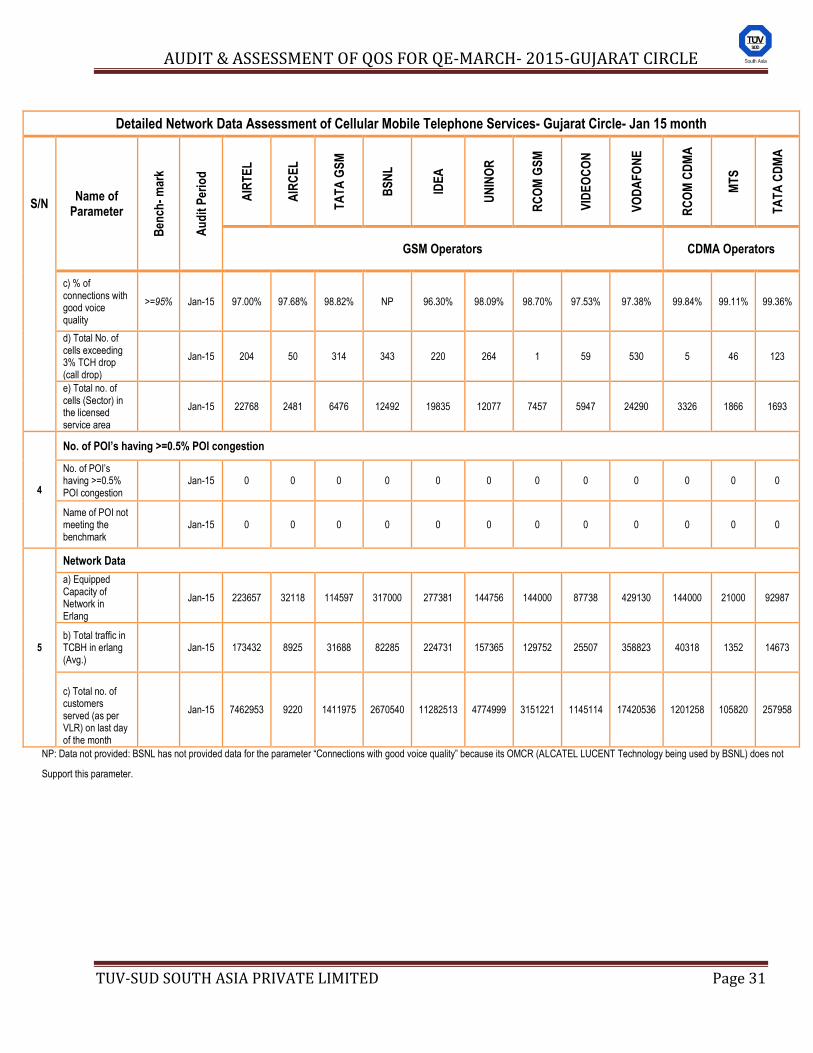
Detailed Network Data Assessment of Cellular Mobile Telephone Services- Gujarat Circle- Jan 15 month
S/N Name of
Parameter
Ben
ch-
mar
k
Au
dit
Per
iod
AIR
TE
L
AIR
CE
L
TA
TA
GS
M
BS
NL
IDE
A
UN
INO
R
RC
OM
GS
M
VID
EO
CO
N
VO
DA
FO
NE
RC
OM
CD
MA
MT
S
TA
TA
CD
MA
GSM Operators CDMA Operators
c) % of connections with good voice quality
>=95% Jan-15 97.00% 97.68% 98.82% NP 96.30% 98.09% 98.70% 97.53% 97.38% 99.84% 99.11% 99.36%
d) Total No. of cells exceeding 3% TCH drop (call drop)
Jan-15 204 50 314 343 220 264 1 59 530 5 46 123
e) Total no. of cells (Sector) in the licensed service area
Jan-15 22768 2481 6476 12492 19835 12077 7457 5947 24290 3326 1866 1693
4
No. of POI’s having >=0.5% POI congestion
No. of POI‟s having >=0.5% POI congestion
Jan-15 0 0 0 0 0 0 0 0 0 0 0 0
Name of POI not meeting the benchmark
Jan-15 0 0 0 0 0 0 0 0 0 0 0 0
5
Network Data
a) Equipped Capacity of Network in Erlang
Jan-15 223657 32118 114597 317000 277381 144756 144000 87738 429130 144000 21000 92987
b) Total traffic in TCBH in erlang (Avg.)
Jan-15 173432 8925 31688 82285 224731 157365 129752 25507 358823 40318 1352 14673
c) Total no. of customers served (as per VLR) on last day of the month
Jan-15 7462953 9220 1411975 2670540 11282513 4774999 3151221 1145114 17420536 1201258 105820 257958
NP: Data not provided: BSNL has not provided data for the parameter “Connections with good voice quality” because its OMCR (ALCATEL LUCENT Technology being used by BSNL) does not
Support this parameter.
AUDIT & ASSESSMENT OF QOS FOR QE-MARCH- 2015-GUJARAT CIRCLE
TUV-SUD SOUTH ASIA PRIVATE LIMITED Page 32
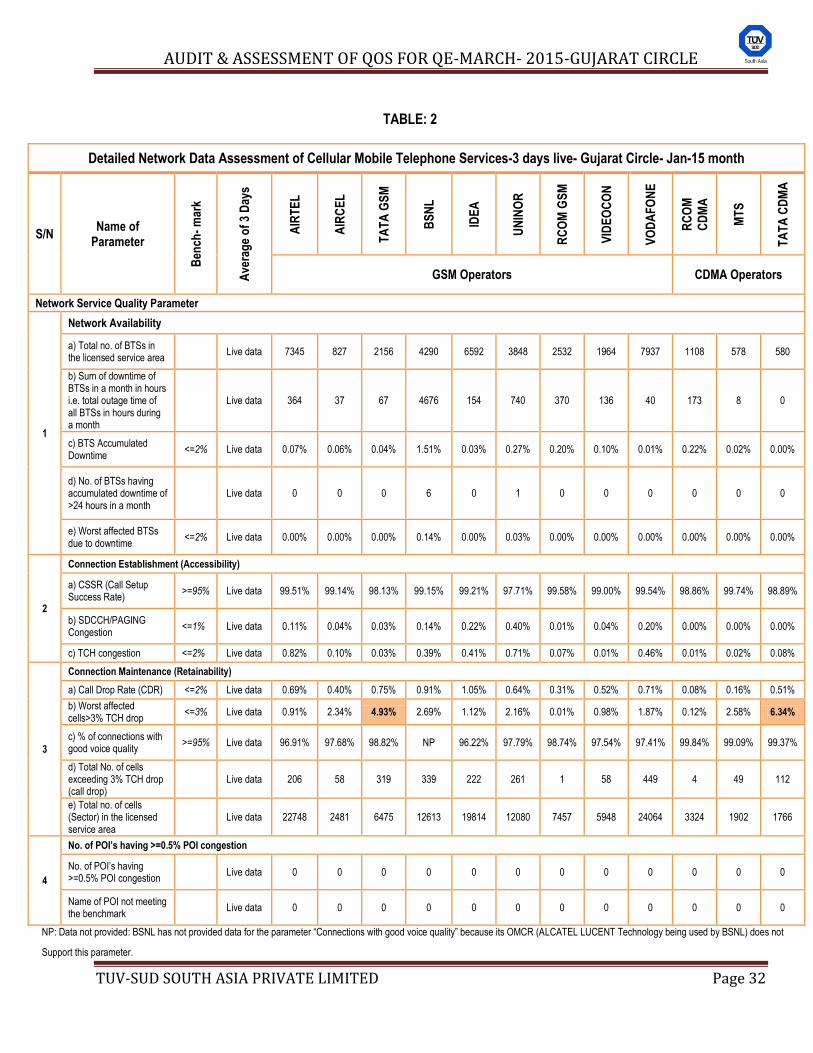
TABLE: 2
Detailed Network Data Assessment of Cellular Mobile Telephone Services-3 days live- Gujarat Circle- Jan-15 month
S/N Name of
Parameter
Ben
ch-
mar
k
Ave
rag
e o
f 3
Day
s
AIR
TE
L
AIR
CE
L
TA
TA
GS
M
BS
NL
IDE
A
UN
INO
R
RC
OM
GS
M
VID
EO
CO
N
VO
DA
FO
NE
RC
OM
CD
MA
MT
S
TA
TA
CD
MA
GSM Operators CDMA Operators
Network Service Quality Parameter
1
Network Availability
a) Total no. of BTSs in the licensed service area
Live data 7345 827 2156 4290 6592 3848 2532 1964 7937 1108 578 580
b) Sum of downtime of BTSs in a month in hours i.e. total outage time of all BTSs in hours during a month
Live data 364 37 67 4676 154 740 370 136 40 173 8 0
c) BTS Accumulated Downtime
<=2% Live data 0.07% 0.06% 0.04% 1.51% 0.03% 0.27% 0.20% 0.10% 0.01% 0.22% 0.02% 0.00%
d) No. of BTSs having accumulated downtime of >24 hours in a month
Live data 0 0 0 6 0 1 0 0 0 0 0 0
e) Worst affected BTSs due to downtime
<=2% Live data 0.00% 0.00% 0.00% 0.14% 0.00% 0.03% 0.00% 0.00% 0.00% 0.00% 0.00% 0.00%
2
Connection Establishment (Accessibility)
a) CSSR (Call Setup Success Rate)
>=95% Live data 99.51% 99.14% 98.13% 99.15% 99.21% 97.71% 99.58% 99.00% 99.54% 98.86% 99.74% 98.89%
b) SDCCH/PAGING Congestion
<=1% Live data 0.11% 0.04% 0.03% 0.14% 0.22% 0.40% 0.01% 0.04% 0.20% 0.00% 0.00% 0.00%
c) TCH congestion <=2% Live data 0.82% 0.10% 0.03% 0.39% 0.41% 0.71% 0.07% 0.01% 0.46% 0.01% 0.02% 0.08%
3
Connection Maintenance (Retainability)
a) Call Drop Rate (CDR) <=2% Live data 0.69% 0.40% 0.75% 0.91% 1.05% 0.64% 0.31% 0.52% 0.71% 0.08% 0.16% 0.51%
b) Worst affected cells>3% TCH drop
<=3% Live data 0.91% 2.34% 4.93% 2.69% 1.12% 2.16% 0.01% 0.98% 1.87% 0.12% 2.58% 6.34%
c) % of connections with good voice quality
>=95% Live data 96.91% 97.68% 98.82% NP 96.22% 97.79% 98.74% 97.54% 97.41% 99.84% 99.09% 99.37%
d) Total No. of cells exceeding 3% TCH drop (call drop)
Live data 206 58 319 339 222 261 1 58 449 4 49 112
e) Total no. of cells (Sector) in the licensed service area
Live data 22748 2481 6475 12613 19814 12080 7457 5948 24064 3324 1902 1766
4
No. of POI’s having >=0.5% POI congestion
No. of POI‟s having >=0.5% POI congestion
Live data 0 0 0 0 0 0 0 0 0 0 0 0
Name of POI not meeting the benchmark
Live data 0 0 0 0 0 0 0 0 0 0 0 0
NP: Data not provided: BSNL has not provided data for the parameter “Connections with good voice quality” because its OMCR (ALCATEL LUCENT Technology being used by BSNL) does not
Support this parameter.
AUDIT & ASSESSMENT OF QOS FOR QE-MARCH- 2015-GUJARAT CIRCLE
TUV-SUD SOUTH ASIA PRIVATE LIMITED Page 33
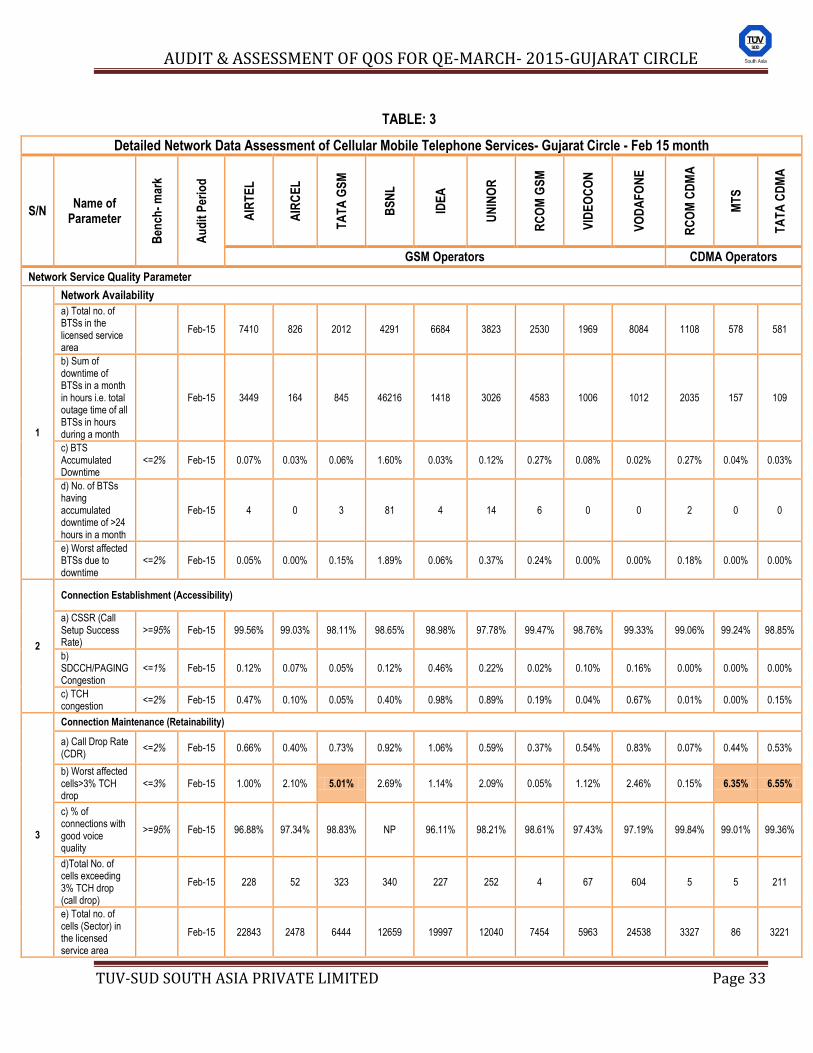
TABLE: 3
Detailed Network Data Assessment of Cellular Mobile Telephone Services- Gujarat Circle - Feb 15 month
S/N Name of
Parameter
Ben
ch-
mar
k
Au
dit
Per
iod
AIR
TE
L
AIR
CE
L
TA
TA
GS
M
BS
NL
IDE
A
UN
INO
R
RC
OM
GS
M
VID
EO
CO
N
VO
DA
FO
NE
RC
OM
CD
MA
MT
S
TA
TA
CD
MA
GSM Operators CDMA Operators
Network Service Quality Parameter
1
Network Availability
a) Total no. of BTSs in the licensed service area
Feb-15 7410 826 2012 4291 6684 3823 2530 1969 8084 1108 578 581
b) Sum of downtime of BTSs in a month in hours i.e. total outage time of all BTSs in hours during a month
Feb-15 3449 164 845 46216 1418 3026 4583 1006 1012 2035 157 109
c) BTS Accumulated Downtime
<=2% Feb-15 0.07% 0.03% 0.06% 1.60% 0.03% 0.12% 0.27% 0.08% 0.02% 0.27% 0.04% 0.03%
d) No. of BTSs having accumulated downtime of >24 hours in a month
Feb-15 4 0 3 81 4 14 6 0 0 2 0 0
e) Worst affected BTSs due to downtime
<=2% Feb-15 0.05% 0.00% 0.15% 1.89% 0.06% 0.37% 0.24% 0.00% 0.00% 0.18% 0.00% 0.00%
2
Connection Establishment (Accessibility)
a) CSSR (Call Setup Success Rate)
>=95% Feb-15 99.56% 99.03% 98.11% 98.65% 98.98% 97.78% 99.47% 98.76% 99.33% 99.06% 99.24% 98.85%
b) SDCCH/PAGING Congestion
<=1% Feb-15 0.12% 0.07% 0.05% 0.12% 0.46% 0.22% 0.02% 0.10% 0.16% 0.00% 0.00% 0.00%
c) TCH congestion
<=2% Feb-15 0.47% 0.10% 0.05% 0.40% 0.98% 0.89% 0.19% 0.04% 0.67% 0.01% 0.00% 0.15%
3
Connection Maintenance (Retainability)
a) Call Drop Rate (CDR)
<=2% Feb-15 0.66% 0.40% 0.73% 0.92% 1.06% 0.59% 0.37% 0.54% 0.83% 0.07% 0.44% 0.53%
b) Worst affected cells>3% TCH drop
<=3% Feb-15 1.00% 2.10% 5.01% 2.69% 1.14% 2.09% 0.05% 1.12% 2.46% 0.15% 6.35% 6.55%
c) % of connections with good voice quality
>=95% Feb-15 96.88% 97.34% 98.83% NP 96.11% 98.21% 98.61% 97.43% 97.19% 99.84% 99.01% 99.36%
d)Total No. of cells exceeding 3% TCH drop (call drop)
Feb-15 228 52 323 340 227 252 4 67 604 5 5 211
e) Total no. of cells (Sector) in the licensed service area
Feb-15 22843 2478 6444 12659 19997 12040 7454 5963 24538 3327 86 3221
AUDIT & ASSESSMENT OF QOS FOR QE-MARCH- 2015-GUJARAT CIRCLE
TUV-SUD SOUTH ASIA PRIVATE LIMITED Page 34
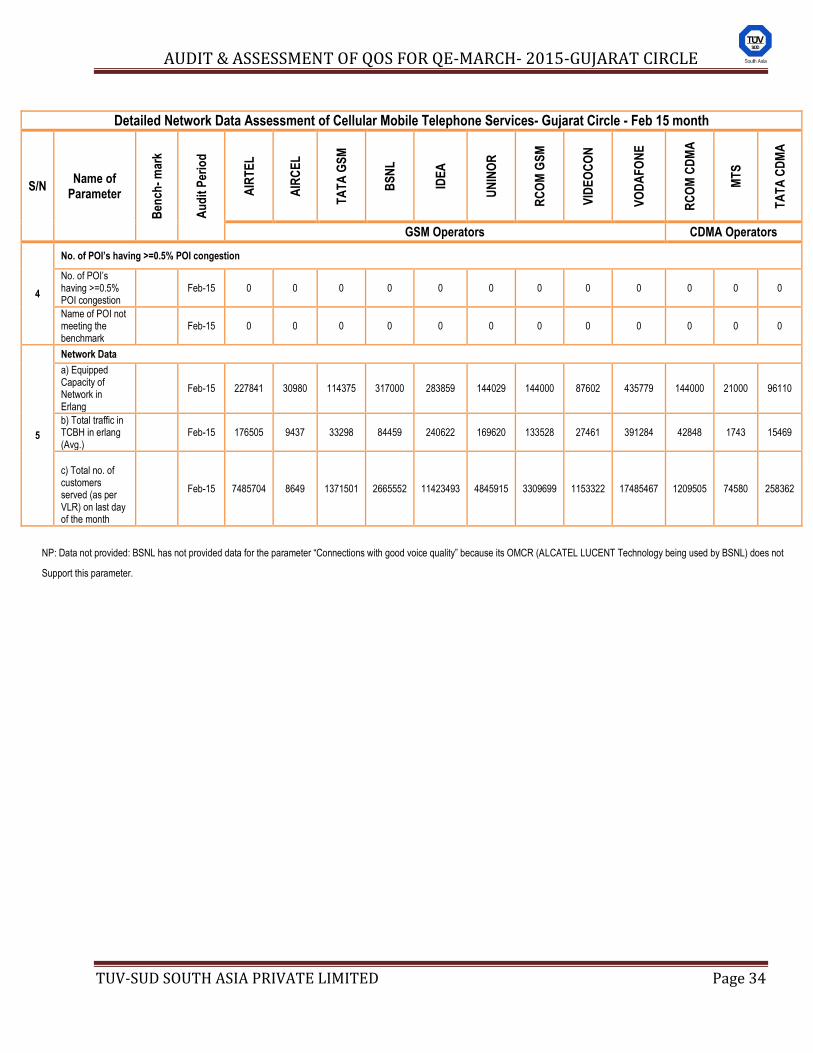
Detailed Network Data Assessment of Cellular Mobile Telephone Services- Gujarat Circle - Feb 15 month
S/N Name of
Parameter
Ben
ch-
mar
k
Au
dit
Per
iod
AIR
TE
L
AIR
CE
L
TA
TA
GS
M
BS
NL
IDE
A
UN
INO
R
RC
OM
GS
M
VID
EO
CO
N
VO
DA
FO
NE
RC
OM
CD
MA
MT
S
TA
TA
CD
MA
GSM Operators CDMA Operators
4
No. of POI’s having >=0.5% POI congestion
No. of POI‟s having >=0.5% POI congestion
Feb-15 0 0 0 0 0 0 0 0 0 0 0 0
Name of POI not meeting the benchmark
Feb-15 0 0 0 0 0 0 0 0 0 0 0 0
5
Network Data
a) Equipped Capacity of Network in Erlang
Feb-15 227841 30980 114375 317000 283859 144029 144000 87602 435779 144000 21000 96110
b) Total traffic in TCBH in erlang (Avg.)
Feb-15 176505 9437 33298 84459 240622 169620 133528 27461 391284 42848 1743 15469
c) Total no. of customers served (as per VLR) on last day of the month
Feb-15 7485704 8649 1371501 2665552 11423493 4845915 3309699 1153322 17485467 1209505 74580 258362
NP: Data not provided: BSNL has not provided data for the parameter “Connections with good voice quality” because its OMCR (ALCATEL LUCENT Technology being used by BSNL) does not
Support this parameter.
AUDIT & ASSESSMENT OF QOS FOR QE-MARCH- 2015-GUJARAT CIRCLE
TUV-SUD SOUTH ASIA PRIVATE LIMITED Page 35
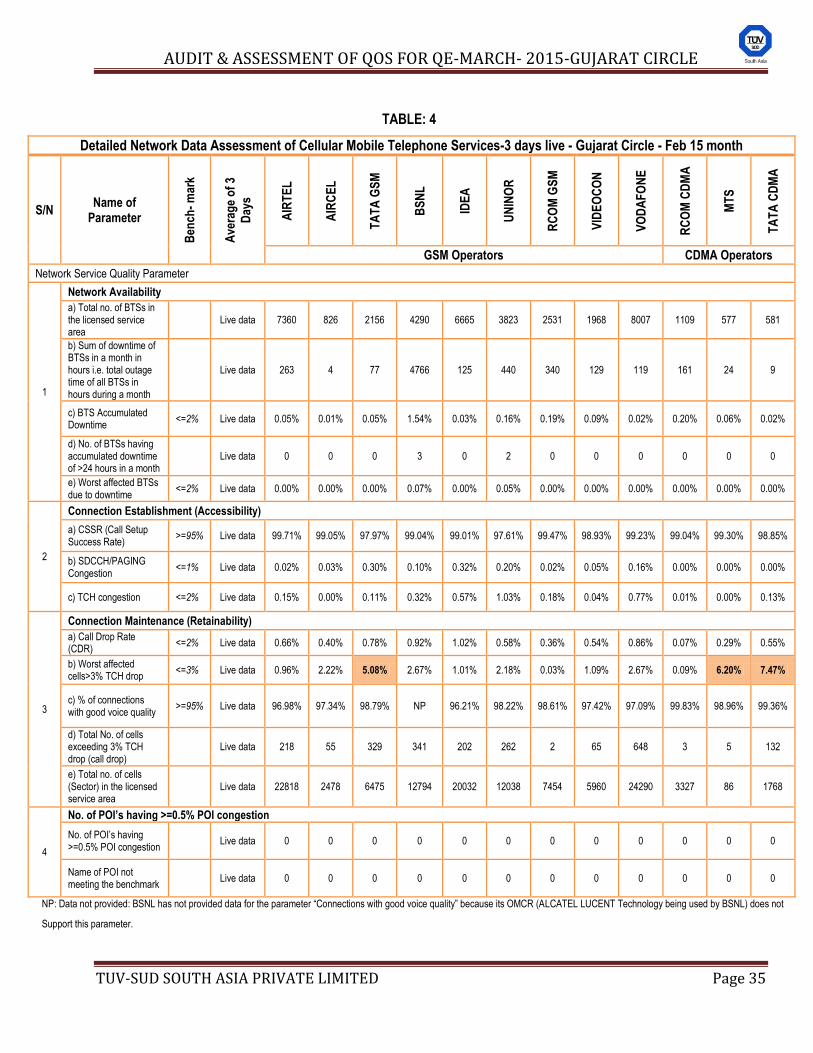
TABLE: 4
Detailed Network Data Assessment of Cellular Mobile Telephone Services-3 days live - Gujarat Circle - Feb 15 month
S/N Name of
Parameter
Ben
ch-
mar
k
Ave
rag
e o
f 3
Day
s
AIR
TE
L
AIR
CE
L
TA
TA
GS
M
BS
NL
IDE
A
UN
INO
R
RC
OM
GS
M
VID
EO
CO
N
VO
DA
FO
NE
RC
OM
CD
MA
MT
S
TA
TA
CD
MA
GSM Operators CDMA Operators
Network Service Quality Parameter
1
Network Availability
a) Total no. of BTSs in the licensed service area
Live data 7360 826 2156 4290 6665 3823 2531 1968 8007 1109 577 581
b) Sum of downtime of BTSs in a month in hours i.e. total outage time of all BTSs in hours during a month
Live data 263 4 77 4766 125 440 340 129 119 161 24 9
c) BTS Accumulated Downtime
<=2% Live data 0.05% 0.01% 0.05% 1.54% 0.03% 0.16% 0.19% 0.09% 0.02% 0.20% 0.06% 0.02%
d) No. of BTSs having accumulated downtime of >24 hours in a month
Live data 0 0 0 3 0 2 0 0 0 0 0 0
e) Worst affected BTSs due to downtime
<=2% Live data 0.00% 0.00% 0.00% 0.07% 0.00% 0.05% 0.00% 0.00% 0.00% 0.00% 0.00% 0.00%
2
Connection Establishment (Accessibility)
a) CSSR (Call Setup Success Rate)
>=95% Live data 99.71% 99.05% 97.97% 99.04% 99.01% 97.61% 99.47% 98.93% 99.23% 99.04% 99.30% 98.85%
b) SDCCH/PAGING Congestion
<=1% Live data 0.02% 0.03% 0.30% 0.10% 0.32% 0.20% 0.02% 0.05% 0.16% 0.00% 0.00% 0.00%
c) TCH congestion <=2% Live data 0.15% 0.00% 0.11% 0.32% 0.57% 1.03% 0.18% 0.04% 0.77% 0.01% 0.00% 0.13%
3
Connection Maintenance (Retainability)
a) Call Drop Rate (CDR)
<=2% Live data 0.66% 0.40% 0.78% 0.92% 1.02% 0.58% 0.36% 0.54% 0.86% 0.07% 0.29% 0.55%
b) Worst affected cells>3% TCH drop
<=3% Live data 0.96% 2.22% 5.08% 2.67% 1.01% 2.18% 0.03% 1.09% 2.67% 0.09% 6.20% 7.47%
c) % of connections with good voice quality
>=95% Live data 96.98% 97.34% 98.79% NP 96.21% 98.22% 98.61% 97.42% 97.09% 99.83% 98.96% 99.36%
d) Total No. of cells exceeding 3% TCH drop (call drop)
Live data 218 55 329 341 202 262 2 65 648 3 5 132
e) Total no. of cells (Sector) in the licensed service area
Live data 22818 2478 6475 12794 20032 12038 7454 5960 24290 3327 86 1768
4
No. of POI’s having >=0.5% POI congestion
No. of POI‟s having >=0.5% POI congestion
Live data 0 0 0 0 0 0 0 0 0 0 0 0
Name of POI not meeting the benchmark
Live data 0 0 0 0 0 0 0 0 0 0 0 0
NP: Data not provided: BSNL has not provided data for the parameter “Connections with good voice quality” because its OMCR (ALCATEL LUCENT Technology being used by BSNL) does not
Support this parameter.
AUDIT & ASSESSMENT OF QOS FOR QE-MARCH- 2015-GUJARAT CIRCLE
TUV-SUD SOUTH ASIA PRIVATE LIMITED Page 36
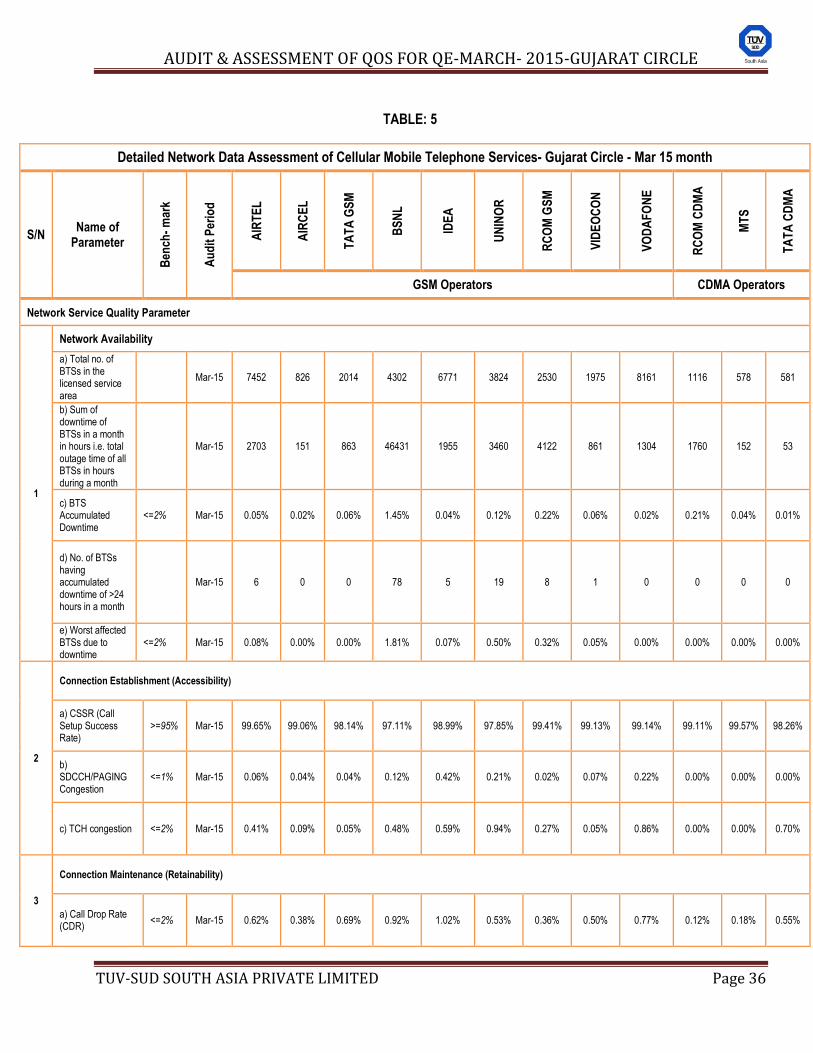
TABLE: 5
Detailed Network Data Assessment of Cellular Mobile Telephone Services- Gujarat Circle - Mar 15 month
S/N Name of
Parameter
Ben
ch-
mar
k
Au
dit
Per
iod
AIR
TE
L
AIR
CE
L
TA
TA
GS
M
BS
NL
IDE
A
UN
INO
R
RC
OM
GS
M
VID
EO
CO
N
VO
DA
FO
NE
RC
OM
CD
MA
MT
S
TA
TA
CD
MA
GSM Operators CDMA Operators
Network Service Quality Parameter
1
Network Availability
a) Total no. of BTSs in the licensed service area
Mar-15 7452 826 2014 4302 6771 3824 2530 1975 8161 1116 578 581
b) Sum of downtime of BTSs in a month in hours i.e. total outage time of all BTSs in hours during a month
Mar-15 2703 151 863 46431 1955 3460 4122 861 1304 1760 152 53
c) BTS Accumulated Downtime
<=2% Mar-15 0.05% 0.02% 0.06% 1.45% 0.04% 0.12% 0.22% 0.06% 0.02% 0.21% 0.04% 0.01%
d) No. of BTSs having accumulated downtime of >24 hours in a month
Mar-15 6 0 0 78 5 19 8 1 0 0 0 0
e) Worst affected BTSs due to downtime
<=2% Mar-15 0.08% 0.00% 0.00% 1.81% 0.07% 0.50% 0.32% 0.05% 0.00% 0.00% 0.00% 0.00%
2
Connection Establishment (Accessibility)
a) CSSR (Call Setup Success Rate)
>=95% Mar-15 99.65% 99.06% 98.14% 97.11% 98.99% 97.85% 99.41% 99.13% 99.14% 99.11% 99.57% 98.26%
b) SDCCH/PAGING Congestion
<=1% Mar-15 0.06% 0.04% 0.04% 0.12% 0.42% 0.21% 0.02% 0.07% 0.22% 0.00% 0.00% 0.00%
c) TCH congestion <=2% Mar-15 0.41% 0.09% 0.05% 0.48% 0.59% 0.94% 0.27% 0.05% 0.86% 0.00% 0.00% 0.70%
3
Connection Maintenance (Retainability)
a) Call Drop Rate (CDR)
<=2% Mar-15 0.62% 0.38% 0.69% 0.92% 1.02% 0.53% 0.36% 0.50% 0.77% 0.12% 0.18% 0.55%
AUDIT & ASSESSMENT OF QOS FOR QE-MARCH- 2015-GUJARAT CIRCLE
TUV-SUD SOUTH ASIA PRIVATE LIMITED Page 37
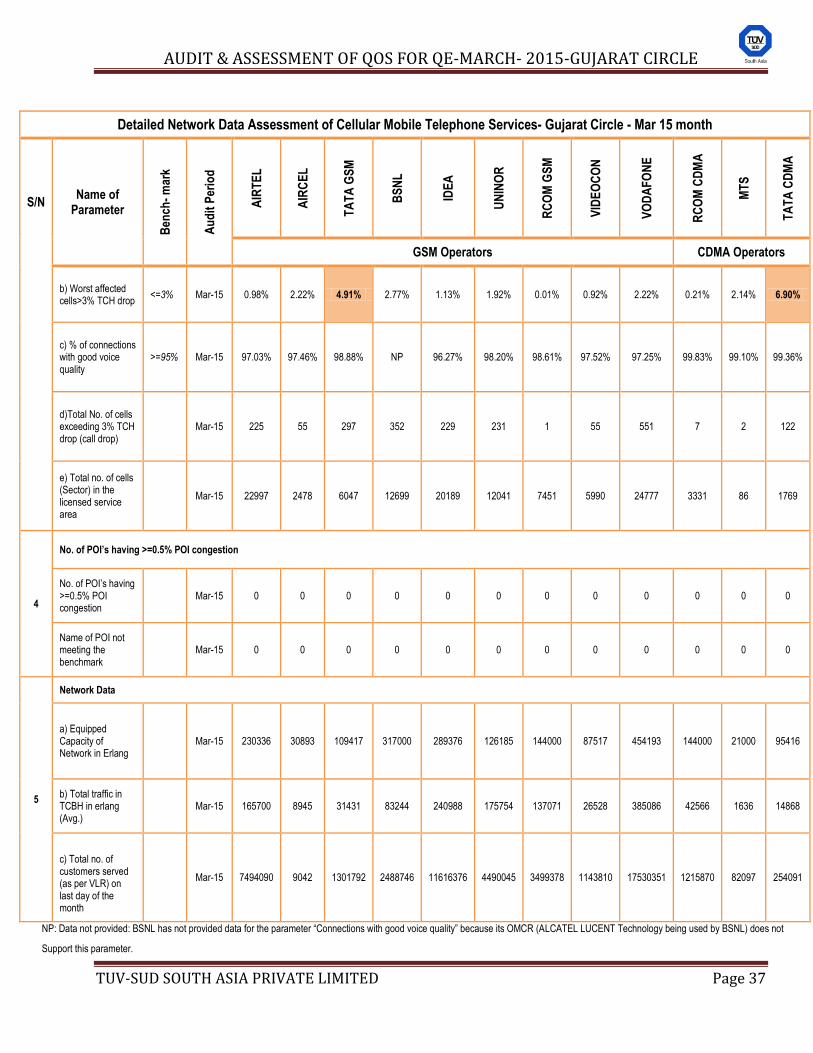
Detailed Network Data Assessment of Cellular Mobile Telephone Services- Gujarat Circle - Mar 15 month
S/N Name of
Parameter
Ben
ch-
mar
k
Au
dit
Per
iod
AIR
TE
L
AIR
CE
L
TA
TA
GS
M
BS
NL
IDE
A
UN
INO
R
RC
OM
GS
M
VID
EO
CO
N
VO
DA
FO
NE
RC
OM
CD
MA
MT
S
TA
TA
CD
MA
GSM Operators CDMA Operators
b) Worst affected cells>3% TCH drop
<=3% Mar-15 0.98% 2.22% 4.91% 2.77% 1.13% 1.92% 0.01% 0.92% 2.22% 0.21% 2.14% 6.90%
c) % of connections with good voice quality
>=95% Mar-15 97.03% 97.46% 98.88% NP 96.27% 98.20% 98.61% 97.52% 97.25% 99.83% 99.10% 99.36%
d)Total No. of cells exceeding 3% TCH drop (call drop)
Mar-15 225 55 297 352 229 231 1 55 551 7 2 122
e) Total no. of cells (Sector) in the licensed service area
Mar-15 22997 2478 6047 12699 20189 12041 7451 5990 24777 3331 86 1769
4
No. of POI’s having >=0.5% POI congestion
No. of POI‟s having >=0.5% POI congestion
Mar-15 0 0 0 0 0 0 0 0 0 0 0 0
Name of POI not meeting the benchmark
Mar-15 0 0 0 0 0 0 0 0 0 0 0 0
5
Network Data
a) Equipped Capacity of Network in Erlang
Mar-15 230336 30893 109417 317000 289376 126185 144000 87517 454193 144000 21000 95416
b) Total traffic in TCBH in erlang (Avg.)
Mar-15 165700 8945 31431 83244 240988 175754 137071 26528 385086 42566 1636 14868
c) Total no. of customers served (as per VLR) on last day of the month
Mar-15 7494090 9042 1301792 2488746 11616376 4490045 3499378 1143810 17530351 1215870 82097 254091
NP: Data not provided: BSNL has not provided data for the parameter “Connections with good voice quality” because its OMCR (ALCATEL LUCENT Technology being used by BSNL) does not
Support this parameter.
AUDIT & ASSESSMENT OF QOS FOR QE-MARCH- 2015-GUJARAT CIRCLE
TUV-SUD SOUTH ASIA PRIVATE LIMITED Page 38
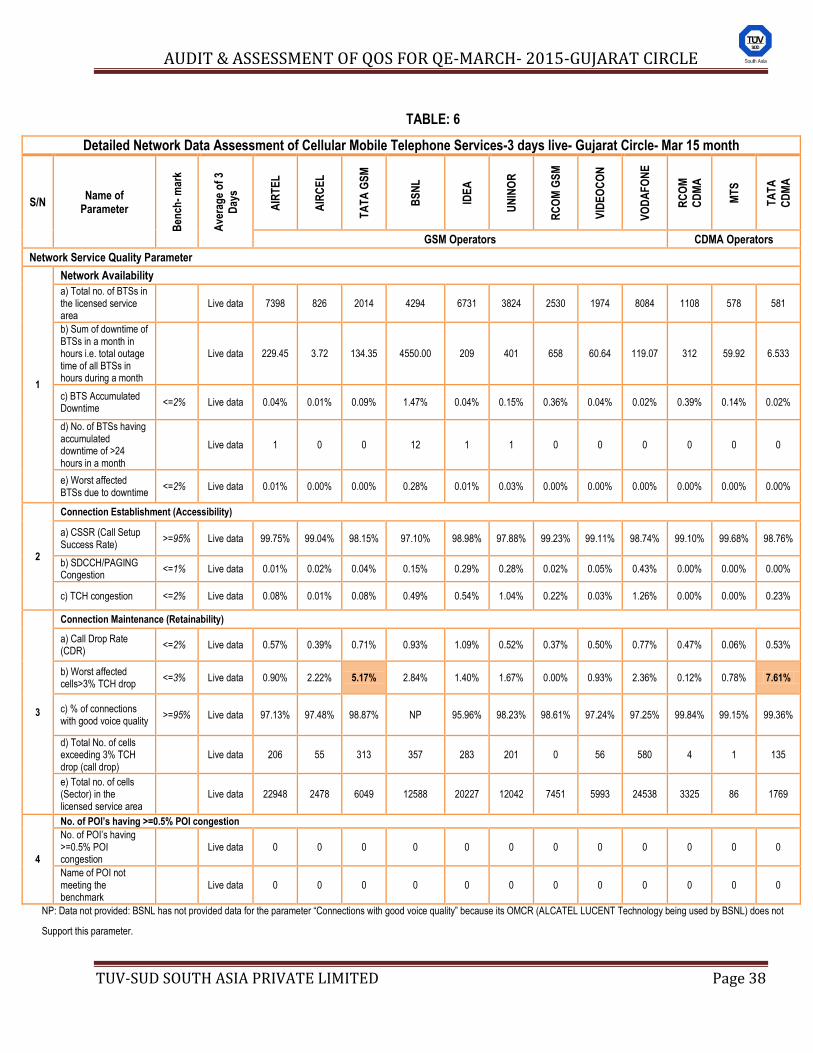
TABLE: 6
Detailed Network Data Assessment of Cellular Mobile Telephone Services-3 days live- Gujarat Circle- Mar 15 month
S/N Name of
Parameter
Ben
ch-
mar
k
Ave
rag
e o
f 3
Day
s
AIR
TE
L
AIR
CE
L
TA
TA
GS
M
BS
NL
IDE
A
UN
INO
R
RC
OM
GS
M
VID
EO
CO
N
VO
DA
FO
NE
RC
OM
CD
MA
MT
S
TA
TA
CD
MA
GSM Operators CDMA Operators
Network Service Quality Parameter
1
Network Availability
a) Total no. of BTSs in the licensed service area
Live data 7398 826 2014 4294 6731 3824 2530 1974 8084 1108 578 581
b) Sum of downtime of BTSs in a month in hours i.e. total outage time of all BTSs in hours during a month
Live data 229.45 3.72 134.35 4550.00 209 401 658 60.64 119.07 312 59.92 6.533
c) BTS Accumulated Downtime
<=2% Live data 0.04% 0.01% 0.09% 1.47% 0.04% 0.15% 0.36% 0.04% 0.02% 0.39% 0.14% 0.02%
d) No. of BTSs having accumulated downtime of >24 hours in a month
Live data 1 0 0 12 1 1 0 0 0 0 0 0
e) Worst affected BTSs due to downtime
<=2% Live data 0.01% 0.00% 0.00% 0.28% 0.01% 0.03% 0.00% 0.00% 0.00% 0.00% 0.00% 0.00%
2
Connection Establishment (Accessibility)
a) CSSR (Call Setup Success Rate)
>=95% Live data 99.75% 99.04% 98.15% 97.10% 98.98% 97.88% 99.23% 99.11% 98.74% 99.10% 99.68% 98.76%
b) SDCCH/PAGING Congestion
<=1% Live data 0.01% 0.02% 0.04% 0.15% 0.29% 0.28% 0.02% 0.05% 0.43% 0.00% 0.00% 0.00%
c) TCH congestion <=2% Live data 0.08% 0.01% 0.08% 0.49% 0.54% 1.04% 0.22% 0.03% 1.26% 0.00% 0.00% 0.23%
3
Connection Maintenance (Retainability)
a) Call Drop Rate (CDR)
<=2% Live data 0.57% 0.39% 0.71% 0.93% 1.09% 0.52% 0.37% 0.50% 0.77% 0.47% 0.06% 0.53%
b) Worst affected cells>3% TCH drop
<=3% Live data 0.90% 2.22% 5.17% 2.84% 1.40% 1.67% 0.00% 0.93% 2.36% 0.12% 0.78% 7.61%
c) % of connections with good voice quality
>=95% Live data 97.13% 97.48% 98.87% NP 95.96% 98.23% 98.61% 97.24% 97.25% 99.84% 99.15% 99.36%
d) Total No. of cells exceeding 3% TCH drop (call drop)
Live data 206 55 313 357 283 201 0 56 580 4 1 135
e) Total no. of cells (Sector) in the licensed service area
Live data 22948 2478 6049 12588 20227 12042 7451 5993 24538 3325 86 1769
4
No. of POI’s having >=0.5% POI congestion
No. of POI‟s having >=0.5% POI congestion
Live data 0 0 0 0 0 0 0 0 0 0 0 0
Name of POI not meeting the benchmark
Live data 0 0 0 0 0 0 0 0 0 0 0 0
NP: Data not provided: BSNL has not provided data for the parameter “Connections with good voice quality” because its OMCR (ALCATEL LUCENT Technology being used by BSNL) does not
Support this parameter.
AUDIT & ASSESSMENT OF QOS FOR QE-MARCH- 2015-GUJARAT CIRCLE
TUV-SUD SOUTH ASIA PRIVATE LIMITED Page 39
CUSTOMER SERVICE QUALITY (CSD) PARAMETERS
AUDIT & ASSESSMENT OF QOS FOR QE-MARCH- 2015-GUJARAT CIRCLE
TUV-SUD SOUTH ASIA PRIVATE LIMITED Page 40
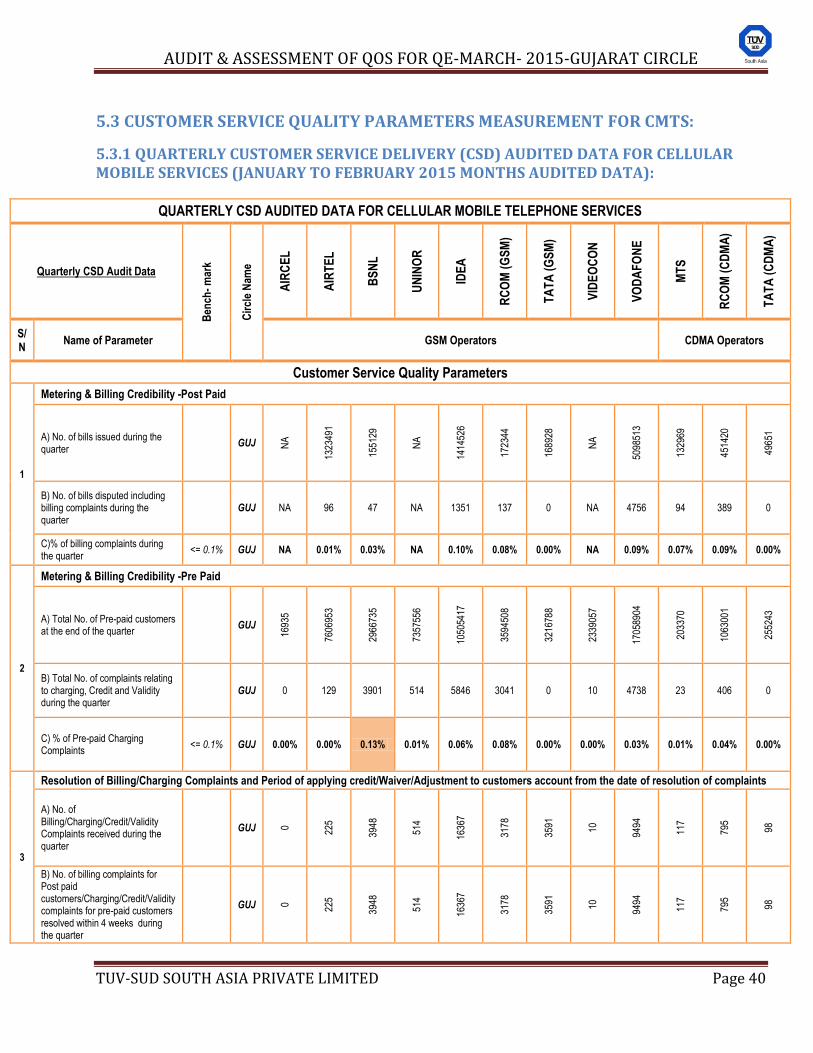
5.3 CUSTOMER SERVICE QUALITY PARAMETERS MEASUREMENT FOR CMTS:
5.3.1 QUARTERLY CUSTOMER SERVICE DELIVERY (CSD) AUDITED DATA FOR CELLULAR MOBILE SERVICES (JANUARY TO FEBRUARY 2015 MONTHS AUDITED DATA):
QUARTERLY CSD AUDITED DATA FOR CELLULAR MOBILE TELEPHONE SERVICES
Quarterly CSD Audit Data
Ben
ch-
mar
k
Cir
cle
Nam
e
AIR
CE
L
AIR
TE
L
BS
NL
UN
INO
R
IDE
A
RC
OM
(G
SM
)
TA
TA
(G
SM
)
VID
EO
CO
N
VO
DA
FO
NE
MT
S
RC
OM
(C
DM
A)
TA
TA
(C
DM
A)
S/ N
Name of Parameter GSM Operators CDMA Operators
Customer Service Quality Parameters
1
Metering & Billing Credibility -Post Paid
A) No. of bills issued during the quarter
GUJ NA
1323
491
1551
29
NA
1414
526
1723
44
1689
28
NA
5098
513
1329
69
4514
20
4965
1
B) No. of bills disputed including billing complaints during the quarter
GUJ NA 96 47 NA 1351 137 0 NA 4756 94 389 0
C)% of billing complaints during the quarter
<= 0.1% GUJ NA 0.01% 0.03% NA 0.10% 0.08% 0.00% NA 0.09% 0.07% 0.09% 0.00%
2
Metering & Billing Credibility -Pre Paid
A) Total No. of Pre-paid customers at the end of the quarter
GUJ
1693
5
7606
953
2966
735
7357
556
1050
5417
3594
508
3216
788
2339
057
1705
8904
2033
70
1063
001
2552
43
B) Total No. of complaints relating to charging, Credit and Validity during the quarter
GUJ 0 129 3901 514 5846 3041 0 10 4738 23 406 0
C) % of Pre-paid Charging Complaints
<= 0.1% GUJ 0.00% 0.00% 0.13% 0.01% 0.06% 0.08% 0.00% 0.00% 0.03% 0.01% 0.04% 0.00%
3
Resolution of Billing/Charging Complaints and Period of applying credit/Waiver/Adjustment to customers account from the date of resolution of complaints
A) No. of Billing/Charging/Credit/Validity Complaints received during the quarter
GUJ 0 22
5
3948
514
1636
7
3178
3591
10
9494
117
795
98
B) No. of billing complaints for Post paid customers/Charging/Credit/Validity complaints for pre-paid customers resolved within 4 weeks during the quarter
GUJ 0 22
5
3948
514
1636
7
3178
3591
10
9494
117
795
98
AUDIT & ASSESSMENT OF QOS FOR QE-MARCH- 2015-GUJARAT CIRCLE
TUV-SUD SOUTH ASIA PRIVATE LIMITED Page 41
QUARTERLY CSD AUDITED DATA FOR CELLULAR MOBILE TELEPHONE SERVICES
Quarterly CSD Audit Data
Ben
ch-
mar
k
Cir
cle
Nam
e
AIR
CE
L
AIR
TE
L
BS
NL
UN
INO
R
IDE
A
RC
OM
(G
SM
)
TA
TA
(G
SM
)
VID
EO
CO
N
VO
DA
FO
NE
MT
S
RC
OM
(C
DM
A)
TA
TA
(C
DM
A)
S/ N
Name of Parameter GSM Operators CDMA Operators
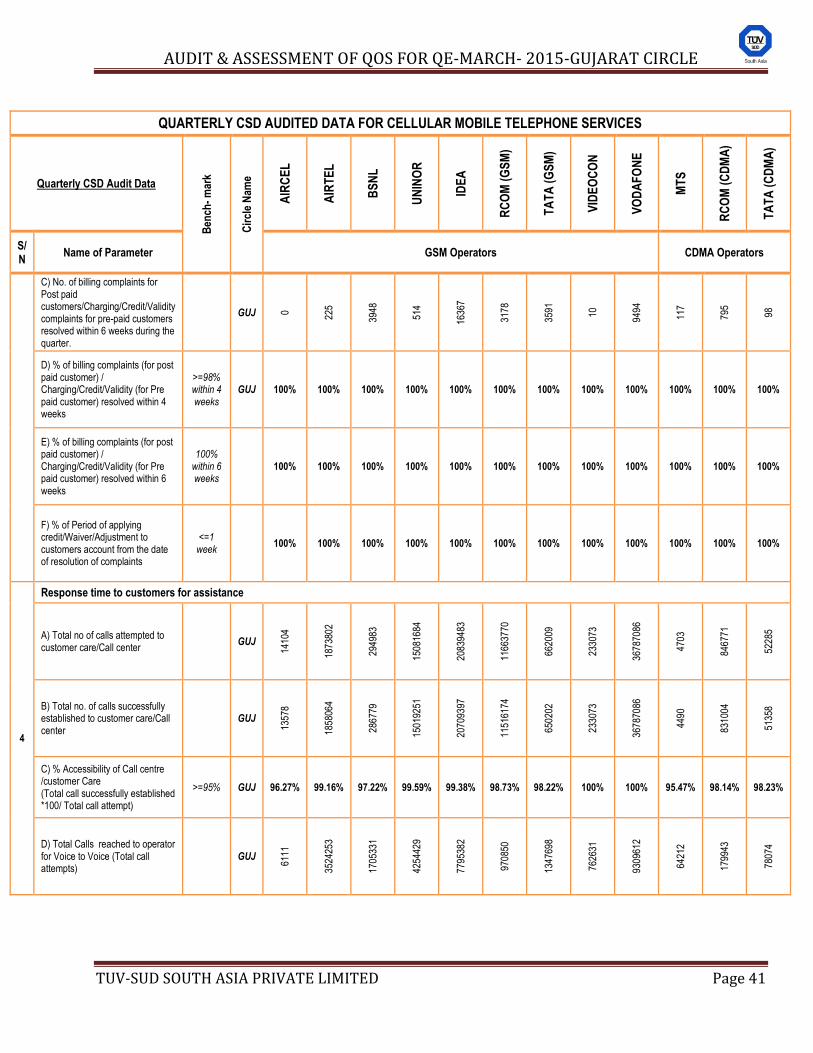
C) No. of billing complaints for Post paid customers/Charging/Credit/Validity complaints for pre-paid customers resolved within 6 weeks during the quarter.
GUJ 0 22
5
3948
514
1636
7
3178
3591
10
9494
117
795
98
D) % of billing complaints (for post paid customer) / Charging/Credit/Validity (for Pre paid customer) resolved within 4 weeks
>=98% within 4 weeks
GUJ 100% 100% 100% 100% 100% 100% 100% 100% 100% 100% 100% 100%
E) % of billing complaints (for post paid customer) / Charging/Credit/Validity (for Pre paid customer) resolved within 6 weeks
100% within 6 weeks
100% 100% 100% 100% 100% 100% 100% 100% 100% 100% 100% 100%
F) % of Period of applying credit/Waiver/Adjustment to customers account from the date of resolution of complaints
<=1 week
100% 100% 100% 100% 100% 100% 100% 100% 100% 100% 100% 100%
4
Response time to customers for assistance
A) Total no of calls attempted to customer care/Call center
GUJ
1410
4
1873
802
2949
83
1508
1684
2083
9483
1166
3770
6620
09
2330
73
3678
7086
4703
8467
71
5228
5
B) Total no. of calls successfully established to customer care/Call center
GUJ
1357
8
1858
064
2867
79
1501
9251
2070
9397
1151
6174
6502
02
2330
73
3678
7086
4490
8310
04
5135
8 C) % Accessibility of Call centre /customer Care (Total call successfully established *100/ Total call attempt)
>=95% GUJ 96.27% 99.16% 97.22% 99.59% 99.38% 98.73% 98.22% 100% 100% 95.47% 98.14% 98.23%
D) Total Calls reached to operator for Voice to Voice (Total call attempts)
GUJ
6111
3524
253
1705
331
4254
429
7795
382
9708
50
1347
698
7626
31
9309
612
6421
2
1799
43
7807
4
AUDIT & ASSESSMENT OF QOS FOR QE-MARCH- 2015-GUJARAT CIRCLE
TUV-SUD SOUTH ASIA PRIVATE LIMITED Page 42
QUARTERLY CSD AUDITED DATA FOR CELLULAR MOBILE TELEPHONE SERVICES
Quarterly CSD Audit Data
Ben
ch-
mar
k
Cir
cle
Nam
e
AIR
CE
L
AIR
TE
L
BS
NL
UN
INO
R
IDE
A
RC
OM
(G
SM
)
TA
TA
(G
SM
)
VID
EO
CO
N
VO
DA
FO
NE
MT
S
RC
OM
(C
DM
A)
TA
TA
(C
DM
A)
S/ N
Name of Parameter GSM Operators CDMA Operators
E) Total number of calls answered by the operator (Voice to voice) within 90 seconds.
GUJ
5921
3335
001
1659
660
4205
452
7758
172
6218
56
1298
977
7474
37
9055
428
6131
3
1541
25
7661
4
F) % age of calls answered by operator(voice to voice) (Total call successfully established within 90 sec.*100 / Total call attempts )
>=95% GUJ 96.89% 94.63% 97.32% 98.85% 99.52% 64.05% 96.38% 98.01% 97.27% 95.49% 85.65% 98.13%
5
Termination/closure of service
A) Total No. of requests for Termination / Closure of service received during the quarter
GUJ N
A
2747
3299
NA
9265
625
3004
NA
2090
4
4094
3320
2078
B) No. of requests for Termination / Closure of service complied within 7 days during the quarter
GUJ N
A
2747
3299
NA
9265
625
3004
NA
2090
4
4094
3320
2078
C) % of Termination/ Closure of service within 7 days
<=7days GUJ NA 100% 100% NA 100% 100% 100% NA 100% 100% 100% 100%
6
Time taken for refunds of deposits after closures.
A) No. of Payments/ Refunds due during the quarter
GUJ NA
1445
1482
NA
2679
1949
627
NA
7805
0
2260
545
B) No. of Payments/ Refunds Cleared during the quarter
GUJ NA
1445
1482
NA
2679
1949
625
NA
7805
0
2260
539
C) Time taken for refunds of deposits after closures.
100% within
60 days GUJ NA 100% 100% NA 100% 100% 99.68% NA 100% 100% 100% 98.90%
NA: Aircel, Uninor and Videocon have no post-paid customers, so data for parameters related to post-paid bills not applicable for them.
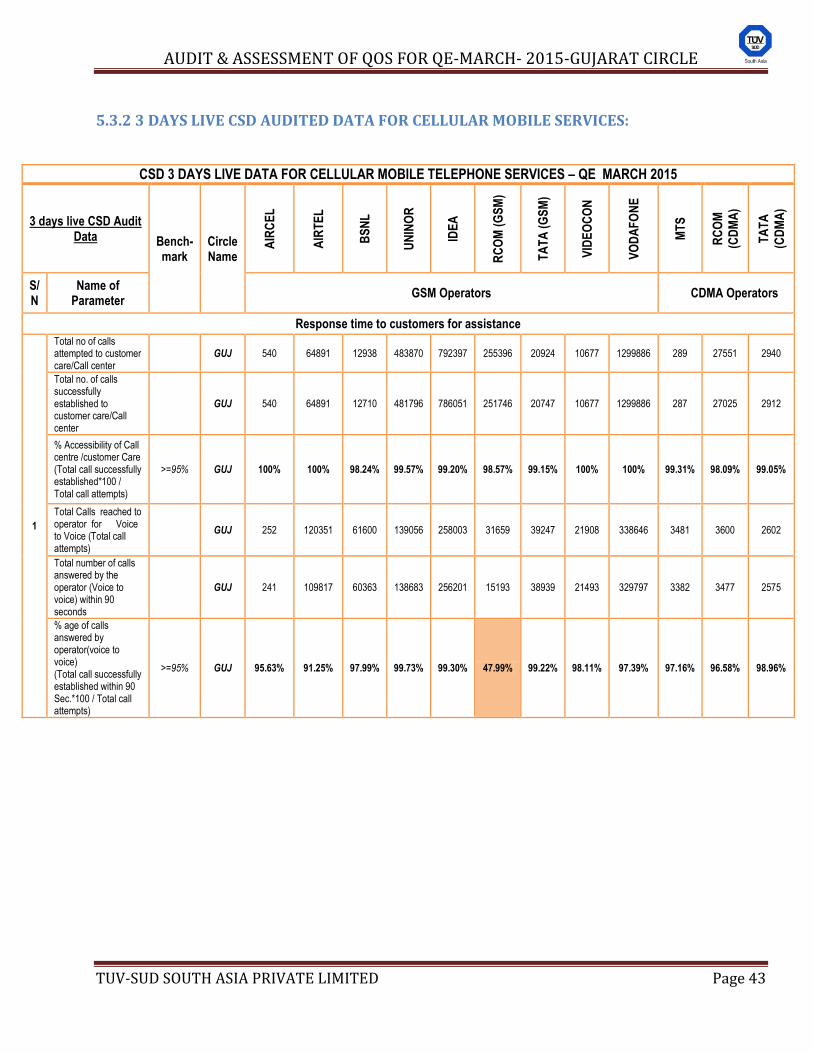
AUDIT & ASSESSMENT OF QOS FOR QE-MARCH- 2015-GUJARAT CIRCLE
TUV-SUD SOUTH ASIA PRIVATE LIMITED Page 43
5.3.2 3 DAYS LIVE CSD AUDITED DATA FOR CELLULAR MOBILE SERVICES:
CSD 3 DAYS LIVE DATA FOR CELLULAR MOBILE TELEPHONE SERVICES – QE MARCH 2015
3 days live CSD Audit Data Bench-
mark Circle Name
AIR
CE
L
AIR
TE
L
BS
NL
UN
INO
R
IDE
A
RC
OM
(G
SM
)
TA
TA
(G
SM
)
VID
EO
CO
N
VO
DA
FO
NE
MT
S
RC
OM
(CD
MA
)
TA
TA
(CD
MA
)
S/ N
Name of Parameter
GSM Operators CDMA Operators
Response time to customers for assistance
1
Total no of calls attempted to customer care/Call center
GUJ 540 64891 12938 483870 792397 255396 20924 10677 1299886 289 27551 2940
Total no. of calls successfully established to customer care/Call center
GUJ 540 64891 12710 481796 786051 251746 20747 10677 1299886 287 27025 2912
% Accessibility of Call centre /customer Care (Total call successfully established*100 / Total call attempts)
>=95% GUJ 100% 100% 98.24% 99.57% 99.20% 98.57% 99.15% 100% 100% 99.31% 98.09% 99.05%
Total Calls reached to operator for Voice to Voice (Total call attempts)
GUJ 252 120351 61600 139056 258003 31659 39247 21908 338646 3481 3600 2602
Total number of calls answered by the operator (Voice to voice) within 90 seconds
GUJ 241 109817 60363 138683 256201 15193 38939 21493 329797 3382 3477 2575
% age of calls answered by operator(voice to voice) (Total call successfully established within 90 Sec.*100 / Total call attempts)
>=95% GUJ 95.63% 91.25% 97.99% 99.73% 99.30% 47.99% 99.22% 98.11% 97.39% 97.16% 96.58% 98.96%
AUDIT & ASSESSMENT OF QOS FOR QE-MARCH- 2015-GUJARAT CIRCLE
TUV-SUD SOUTH ASIA PRIVATE LIMITED Page 44
KEY FINDINGS: CUSTOMER SERVICE DELIVERY PARAMETERS
1. Metering and billing credibility-(Post paid & Pre-paid) The performance of the service providers with respect to the parameter metering and billing credibility for both post-paid and pre-paid was well within the prescribed bench mark of <=0.1 %. However, BSNL could not meet the benchmark of Metering and Billing credibility for pre-paid with its performance level as 0.13%.
2. Resolution of Billing complaints and applying credits -
i. Resolution of billing /charging complaints
ii. Period of applying credit/waiver/adjustment to customer’s account from the date of resolution of complaints All operators have 100 % resolved the billing complaints within stipulated period of 4/6 weeks. Similarly, in all cases where customers were due for credit / adjustment, all the service providers have complied with the benchmark of 100 % refund in one week.
3. Response Time to the Customer for assistance
i. Accessibility of call centre/customer care ii. Percentage of calls answered by Operators (Voice to Voice) within 60 seconds
All service providers are in compliance with respect to the parameter Accessibility of call center. However, Airtel, RCOM (GSM) and RCOM (CDMA) have not met the benchmark of „calls answered by Operators (voice to voice) within 90 seconds. They remained short of benchmark with their performance as 94.63%, 64.05%% and 85.65% respectively.
4. Termination/Closure of Service
In case of this parameters also, all service providers have settled the closure/termination within the benchmark of 100% in 7 days.
5. Time Taken for Refund of deposits after closures All operators, except Tata (GSM) & Tata (CDMA) were found to have complied with the benchmark of 100% refund of deposits within 60 days of closure. Tata (GSM) & Tata (CDMA) remained short of benchmark with their performance as 99.68% & 98.90% respectively.
Live Measurements: The results for three days live measurements reveal that all operators have met the benchmarks for the parameters „Accessibility to call center‟. However, RCOM (GSM) failed to meet the benchmark of „Call connection to operators (Voice to voice) within 90 seconds’ with its performance as 47.99% respectively. The performance of RCOM (GSM) was very poor with respect to this parameter.
AUDIT & ASSESSMENT OF QOS FOR QE-MARCH- 2015-GUJARAT CIRCLE
TUV-SUD SOUTH ASIA PRIVATE LIMITED Page 45
6. LIVE CALLING ASSESSMENT
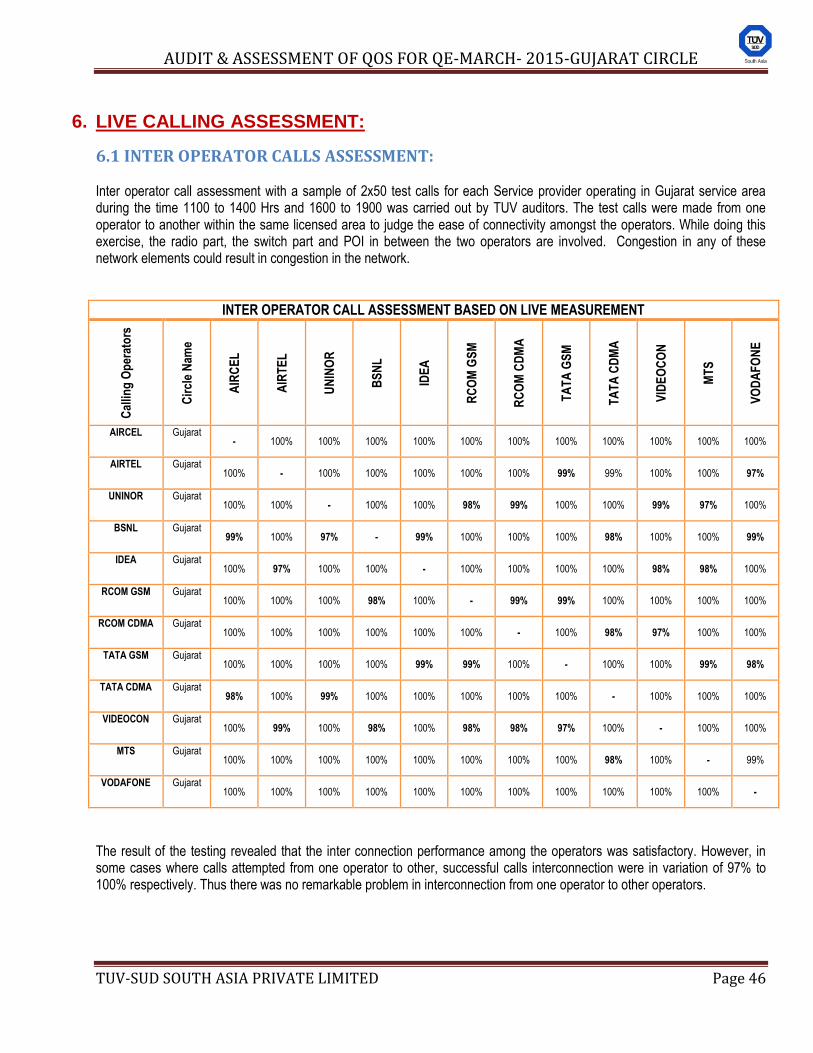
AUDIT & ASSESSMENT OF QOS FOR QE-MARCH- 2015-GUJARAT CIRCLE
TUV-SUD SOUTH ASIA PRIVATE LIMITED Page 46
6. LIVE CALLING ASSESSMENT:
6.1 INTER OPERATOR CALLS ASSESSMENT: Inter operator call assessment with a sample of 2x50 test calls for each Service provider operating in Gujarat service area during the time 1100 to 1400 Hrs and 1600 to 1900 was carried out by TUV auditors. The test calls were made from one operator to another within the same licensed area to judge the ease of connectivity amongst the operators. While doing this exercise, the radio part, the switch part and POI in between the two operators are involved. Congestion in any of these network elements could result in congestion in the network.
INTER OPERATOR CALL ASSESSMENT BASED ON LIVE MEASUREMENT
Cal
ling
Op
erat
ors
Cir
cle
Nam
e
AIR
CE
L
AIR
TE
L
UN
INO
R
BS
NL
IDE
A
RC
OM
GS
M
RC
OM
CD
MA
TA
TA
GS
M
TA
TA
CD
MA
VID
EO
CO
N
MT
S
VO
DA
FO
NE
AIRCEL Gujarat - 100% 100% 100% 100% 100% 100% 100% 100% 100% 100% 100%
AIRTEL Gujarat 100% - 100% 100% 100% 100% 100% 99% 99% 100% 100% 97%
UNINOR Gujarat 100% 100% - 100% 100% 98% 99% 100% 100% 99% 97% 100%
BSNL Gujarat 99% 100% 97% - 99% 100% 100% 100% 98% 100% 100% 99%
IDEA Gujarat 100% 97% 100% 100% - 100% 100% 100% 100% 98% 98% 100%
RCOM GSM Gujarat 100% 100% 100% 98% 100% - 99% 99% 100% 100% 100% 100%
RCOM CDMA Gujarat 100% 100% 100% 100% 100% 100% - 100% 98% 97% 100% 100%
TATA GSM Gujarat 100% 100% 100% 100% 99% 99% 100% - 100% 100% 99% 98%
TATA CDMA Gujarat 98% 100% 99% 100% 100% 100% 100% 100% - 100% 100% 100%
VIDEOCON Gujarat 100% 99% 100% 98% 100% 98% 98% 97% 100% - 100% 100%
MTS Gujarat 100% 100% 100% 100% 100% 100% 100% 100% 98% 100% - 99%
VODAFONE Gujarat 100% 100% 100% 100% 100% 100% 100% 100% 100% 100% 100% -
The result of the testing revealed that the inter connection performance among the operators was satisfactory. However, in some cases where calls attempted from one operator to other, successful calls interconnection were in variation of 97% to 100% respectively. Thus there was no remarkable problem in interconnection from one operator to other operators.
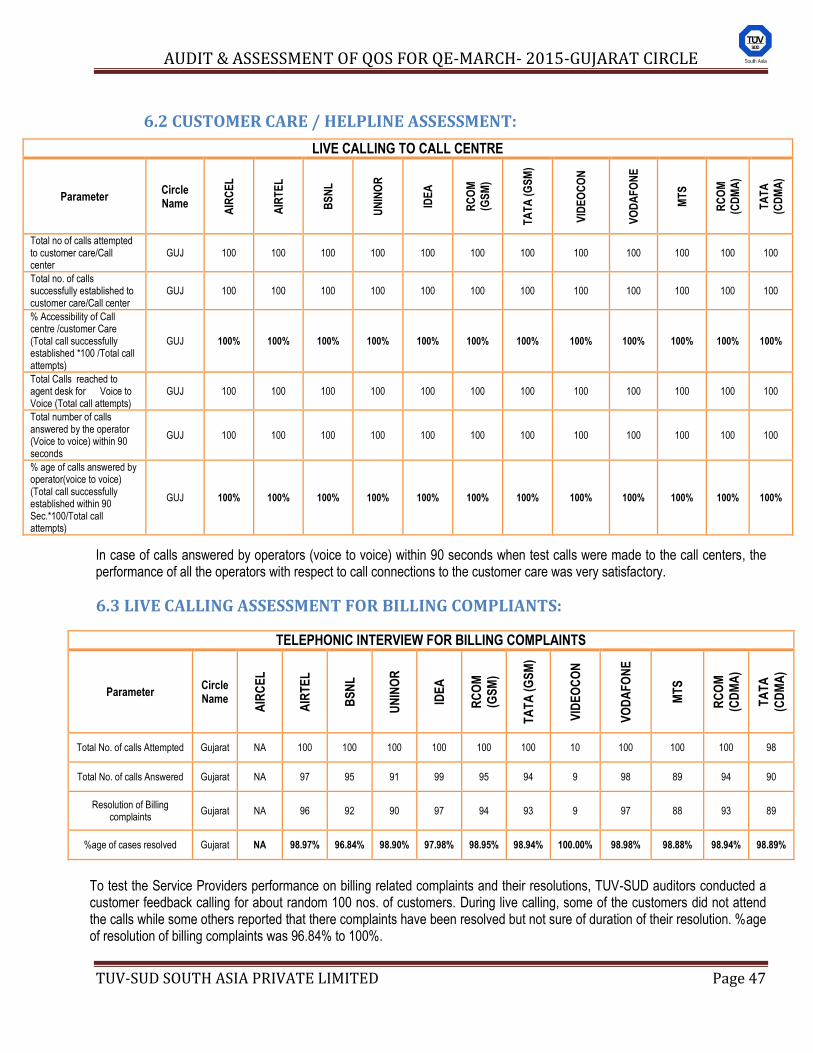
AUDIT & ASSESSMENT OF QOS FOR QE-MARCH- 2015-GUJARAT CIRCLE
TUV-SUD SOUTH ASIA PRIVATE LIMITED Page 47
6.2 CUSTOMER CARE / HELPLINE ASSESSMENT:
LIVE CALLING TO CALL CENTRE
Parameter Circle Name
AIR
CE
L
AIR
TE
L
BS
NL
UN
INO
R
IDE
A
RC
OM
(GS
M)
TA
TA
(G
SM
)
VID
EO
CO
N
VO
DA
FO
NE
MT
S
RC
OM
(CD
MA
)
TA
TA
(CD
MA
)
Total no of calls attempted to customer care/Call center
GUJ 100 100 100 100 100 100 100 100 100 100 100 100
Total no. of calls successfully established to customer care/Call center
GUJ 100 100 100 100 100 100 100 100 100 100 100 100
% Accessibility of Call centre /customer Care (Total call successfully established *100 /Total call attempts)
GUJ 100% 100% 100% 100% 100% 100% 100% 100% 100% 100% 100% 100%
Total Calls reached to agent desk for Voice to Voice (Total call attempts)
GUJ 100 100 100 100 100 100 100 100 100 100 100 100
Total number of calls answered by the operator (Voice to voice) within 90 seconds
GUJ 100 100 100 100 100 100 100 100 100 100 100 100
% age of calls answered by operator(voice to voice) (Total call successfully established within 90 Sec.*100/Total call attempts)
GUJ 100% 100% 100% 100% 100% 100% 100% 100% 100% 100% 100% 100%
In case of calls answered by operators (voice to voice) within 90 seconds when test calls were made to the call centers, the performance of all the operators with respect to call connections to the customer care was very satisfactory.
6.3 LIVE CALLING ASSESSMENT FOR BILLING COMPLIANTS:
TELEPHONIC INTERVIEW FOR BILLING COMPLAINTS
Parameter Circle Name
AIR
CE
L
AIR
TE
L
BS
NL
UN
INO
R
IDE
A
RC
OM
(GS
M)
TA
TA
(G
SM
)
VID
EO
CO
N
VO
DA
FO
NE
MT
S
RC
OM
(CD
MA
)
TA
TA
(CD
MA
)
Total No. of calls Attempted Gujarat NA 100 100 100 100 100 100 10 100 100 100 98
Total No. of calls Answered Gujarat NA 97 95 91 99 95 94 9 98 89 94 90
Resolution of Billing complaints
Gujarat NA 96 92 90 97 94 93 9 97 88 93 89
%age of cases resolved Gujarat NA 98.97% 96.84% 98.90% 97.98% 98.95% 98.94% 100.00% 98.98% 98.88% 98.94% 98.89%
To test the Service Providers performance on billing related complaints and their resolutions, TUV-SUD auditors conducted a customer feedback calling for about random 100 nos. of customers. During live calling, some of the customers did not attend the calls while some others reported that there complaints have been resolved but not sure of duration of their resolution. %age of resolution of billing complaints was 96.84% to 100%.
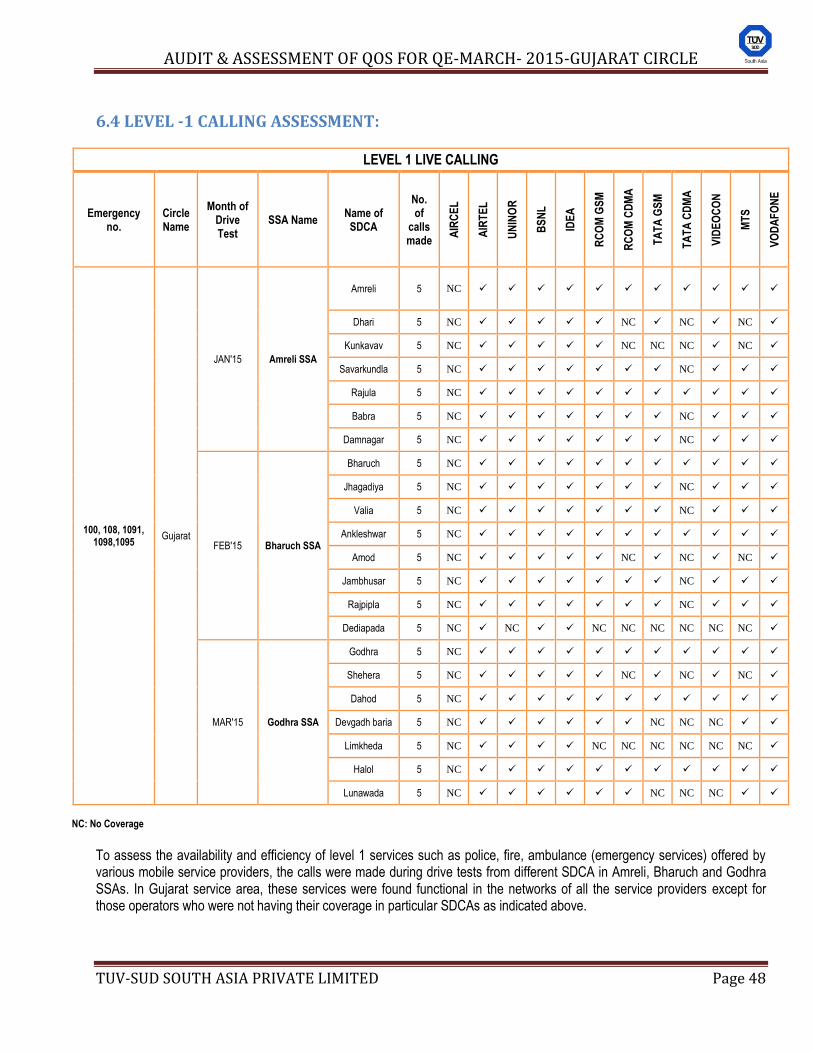
AUDIT & ASSESSMENT OF QOS FOR QE-MARCH- 2015-GUJARAT CIRCLE
TUV-SUD SOUTH ASIA PRIVATE LIMITED Page 48
6.4 LEVEL -1 CALLING ASSESSMENT:
LEVEL 1 LIVE CALLING
Emergency no.
Circle Name
Month of Drive Test
SSA Name Name of SDCA
No. of
calls made
AIR
CE
L
AIR
TE
L
UN
INO
R
BS
NL
IDE
A
RC
OM
GS
M
RC
OM
CD
MA
TA
TA
GS
M
TA
TA
CD
MA
VID
EO
CO
N
MT
S
VO
DA
FO
NE
100, 108, 1091, 1098,1095
Gujarat
JAN'15 Amreli SSA
Amreli 5 NC
Dhari 5 NC NC NC NC
Kunkavav 5 NC NC NC NC NC
Savarkundla 5 NC NC
Rajula 5 NC
Babra 5 NC NC
Damnagar 5 NC NC
FEB'15 Bharuch SSA
Bharuch 5 NC
Jhagadiya 5 NC NC
Valia 5 NC NC
Ankleshwar 5 NC
Amod 5 NC NC NC NC
Jambhusar 5 NC NC
Rajpipla 5 NC NC
Dediapada 5 NC NC NC NC NC NC NC NC
MAR'15 Godhra SSA
Godhra 5 NC
Shehera 5 NC NC NC NC
Dahod 5 NC
Devgadh baria 5 NC NC NC NC
Limkheda 5 NC NC NC NC NC NC NC
Halol 5 NC
Lunawada 5 NC NC NC NC
NC: No Coverage
To assess the availability and efficiency of level 1 services such as police, fire, ambulance (emergency services) offered by various mobile service providers, the calls were made during drive tests from different SDCA in Amreli, Bharuch and Godhra SSAs. In Gujarat service area, these services were found functional in the networks of all the service providers except for those operators who were not having their coverage in particular SDCAs as indicated above.
AUDIT & ASSESSMENT OF QOS FOR QE-MARCH- 2015-GUJARAT CIRCLE
TUV-SUD SOUTH ASIA PRIVATE LIMITED Page 49
7. DRIVE TEST
AUDIT & ASSESSMENT OF QOS FOR QE-MARCH- 2015-GUJARAT CIRCLE
TUV-SUD SOUTH ASIA PRIVATE LIMITED Page 50
7. OPERATOR ASSESTID DRIVE TEST In terms of TRAI‟s letter dated 21st January, 2014, the drive tests were conducted for three consecutive days in one select
SSA each month in each service area. Thus, the drive tests were carried out in three SSA‟s namely Amreli, Bharuch and
Godhra in the months of January, February and March 2015 respectively. The total route Kms covered during drive tests in
respective SSAs was 329 Kms, 327 Kms and 315 Kms. The performance of the operators has been highlighted below in the
tables. The drive test was conducted simultaneously for all the operators following the same route of drive tests. The holding
period for all test calls was 120 seconds. The drive test vehicle across all routes plied at a speed of about 30-50 km per hour
For measuring voice quality, Rx Qual samples on a scale from 0 to 7 for GSM operators and Frame Error Rate (FERs) for
CDMA service providers were measured. As per the QoS norms, Rx Qual between 0- 5 for GSM operators and between 0-4
% FER value for CDMA operators is considered to be good, where as Rx Qual beyond this benchmark is considered to be
bad. Call drops were measured by the number of calls that were dropped to the total number of calls established during the
drive test. Similarly CSSR was measured as the ratio of total calls established to the total call attempts made. Signal strength
was measured in dBm at street level with strength ≥ -75 dBm for in-door coverage and ≥ -85 dBm for in-vehicle.
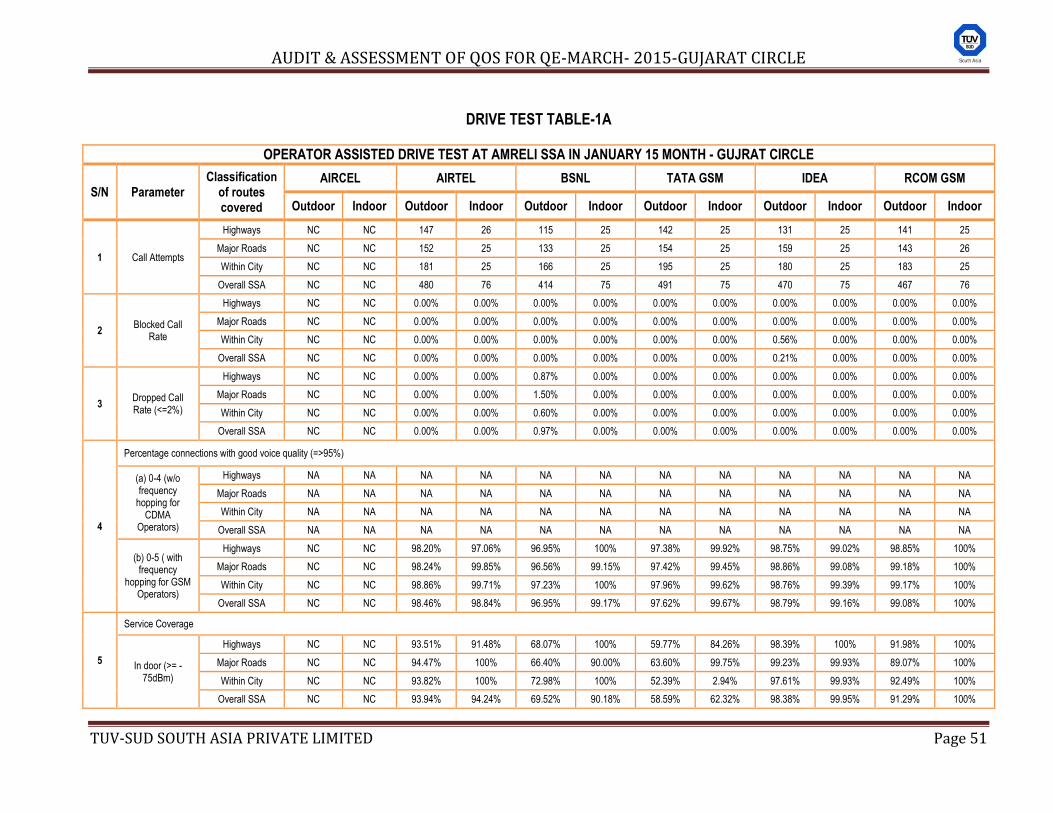
AUDIT & ASSESSMENT OF QOS FOR QE-MARCH- 2015-GUJARAT CIRCLE
TUV-SUD SOUTH ASIA PRIVATE LIMITED Page 51
DRIVE TEST TABLE-1A
OPERATOR ASSISTED DRIVE TEST AT AMRELI SSA IN JANUARY 15 MONTH - GUJRAT CIRCLE
S/N Parameter Classification
of routes covered
AIRCEL AIRTEL BSNL TATA GSM IDEA RCOM GSM
Outdoor Indoor Outdoor Indoor Outdoor Indoor Outdoor Indoor Outdoor Indoor Outdoor Indoor
1 Call Attempts
Highways NC NC 147 26 115 25 142 25 131 25 141 25
Major Roads NC NC 152 25 133 25 154 25 159 25 143 26
Within City NC NC 181 25 166 25 195 25 180 25 183 25
Overall SSA NC NC 480 76 414 75 491 75 470 75 467 76
2 Blocked Call
Rate
Highways NC NC 0.00% 0.00% 0.00% 0.00% 0.00% 0.00% 0.00% 0.00% 0.00% 0.00%
Major Roads NC NC 0.00% 0.00% 0.00% 0.00% 0.00% 0.00% 0.00% 0.00% 0.00% 0.00%
Within City NC NC 0.00% 0.00% 0.00% 0.00% 0.00% 0.00% 0.56% 0.00% 0.00% 0.00%
Overall SSA NC NC 0.00% 0.00% 0.00% 0.00% 0.00% 0.00% 0.21% 0.00% 0.00% 0.00%
3 Dropped Call Rate (<=2%)
Highways NC NC 0.00% 0.00% 0.87% 0.00% 0.00% 0.00% 0.00% 0.00% 0.00% 0.00%
Major Roads NC NC 0.00% 0.00% 1.50% 0.00% 0.00% 0.00% 0.00% 0.00% 0.00% 0.00%
Within City NC NC 0.00% 0.00% 0.60% 0.00% 0.00% 0.00% 0.00% 0.00% 0.00% 0.00%
Overall SSA NC NC 0.00% 0.00% 0.97% 0.00% 0.00% 0.00% 0.00% 0.00% 0.00% 0.00%
4
Percentage connections with good voice quality (=>95%)
(a) 0-4 (w/o frequency
hopping for CDMA
Operators)
Highways NA NA NA NA NA NA NA NA NA NA NA NA
Major Roads NA NA NA NA NA NA NA NA NA NA NA NA
Within City NA NA NA NA NA NA NA NA NA NA NA NA
Overall SSA NA NA NA NA NA NA NA NA NA NA NA NA
(b) 0-5 ( with frequency
hopping for GSM Operators)
Highways NC NC 98.20% 97.06% 96.95% 100% 97.38% 99.92% 98.75% 99.02% 98.85% 100%
Major Roads NC NC 98.24% 99.85% 96.56% 99.15% 97.42% 99.45% 98.86% 99.08% 99.18% 100%
Within City NC NC 98.86% 99.71% 97.23% 100% 97.96% 99.62% 98.76% 99.39% 99.17% 100%
Overall SSA NC NC 98.46% 98.84% 96.95% 99.17% 97.62% 99.67% 98.79% 99.16% 99.08% 100%
5
Service Coverage
In door (>= -75dBm)
Highways NC NC 93.51% 91.48% 68.07% 100% 59.77% 84.26% 98.39% 100% 91.98% 100%
Major Roads NC NC 94.47% 100% 66.40% 90.00% 63.60% 99.75% 99.23% 99.93% 89.07% 100%
Within City NC NC 93.82% 100% 72.98% 100% 52.39% 2.94% 97.61% 99.93% 92.49% 100%
Overall SSA NC NC 93.94% 94.24% 69.52% 90.18% 58.59% 62.32% 98.38% 99.95% 91.29% 100%
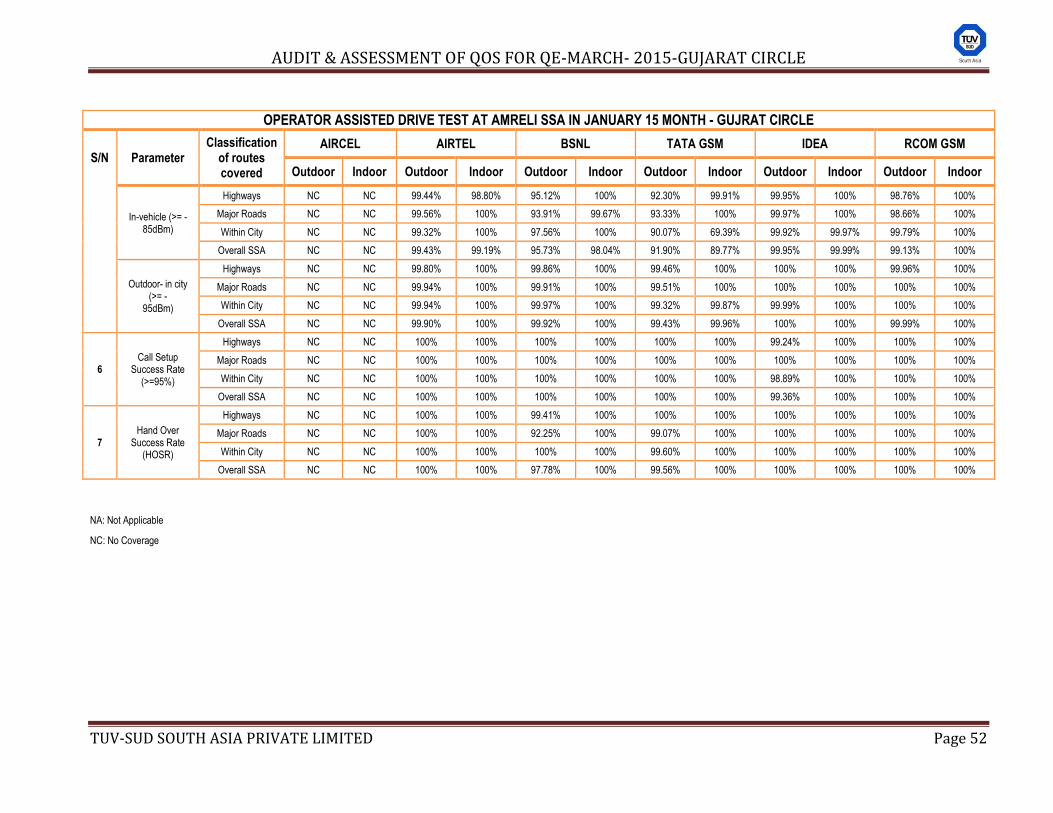
AUDIT & ASSESSMENT OF QOS FOR QE-MARCH- 2015-GUJARAT CIRCLE
TUV-SUD SOUTH ASIA PRIVATE LIMITED Page 52
OPERATOR ASSISTED DRIVE TEST AT AMRELI SSA IN JANUARY 15 MONTH - GUJRAT CIRCLE
S/N Parameter Classification
of routes covered
AIRCEL AIRTEL BSNL TATA GSM IDEA RCOM GSM
Outdoor Indoor Outdoor Indoor Outdoor Indoor Outdoor Indoor Outdoor Indoor Outdoor Indoor
In-vehicle (>= -85dBm)
Highways NC NC 99.44% 98.80% 95.12% 100% 92.30% 99.91% 99.95% 100% 98.76% 100%
Major Roads NC NC 99.56% 100% 93.91% 99.67% 93.33% 100% 99.97% 100% 98.66% 100%
Within City NC NC 99.32% 100% 97.56% 100% 90.07% 69.39% 99.92% 99.97% 99.79% 100%
Overall SSA NC NC 99.43% 99.19% 95.73% 98.04% 91.90% 89.77% 99.95% 99.99% 99.13% 100%
Outdoor- in city (>= -
95dBm)
Highways NC NC 99.80% 100% 99.86% 100% 99.46% 100% 100% 100% 99.96% 100%
Major Roads NC NC 99.94% 100% 99.91% 100% 99.51% 100% 100% 100% 100% 100%
Within City NC NC 99.94% 100% 99.97% 100% 99.32% 99.87% 99.99% 100% 100% 100%
Overall SSA NC NC 99.90% 100% 99.92% 100% 99.43% 99.96% 100% 100% 99.99% 100%
6 Call Setup
Success Rate (>=95%)
Highways NC NC 100% 100% 100% 100% 100% 100% 99.24% 100% 100% 100%
Major Roads NC NC 100% 100% 100% 100% 100% 100% 100% 100% 100% 100%
Within City NC NC 100% 100% 100% 100% 100% 100% 98.89% 100% 100% 100%
Overall SSA NC NC 100% 100% 100% 100% 100% 100% 99.36% 100% 100% 100%
7 Hand Over
Success Rate (HOSR)
Highways NC NC 100% 100% 99.41% 100% 100% 100% 100% 100% 100% 100%
Major Roads NC NC 100% 100% 92.25% 100% 99.07% 100% 100% 100% 100% 100%
Within City NC NC 100% 100% 100% 100% 99.60% 100% 100% 100% 100% 100%
Overall SSA NC NC 100% 100% 97.78% 100% 99.56% 100% 100% 100% 100% 100%
NA: Not Applicable
NC: No Coverage
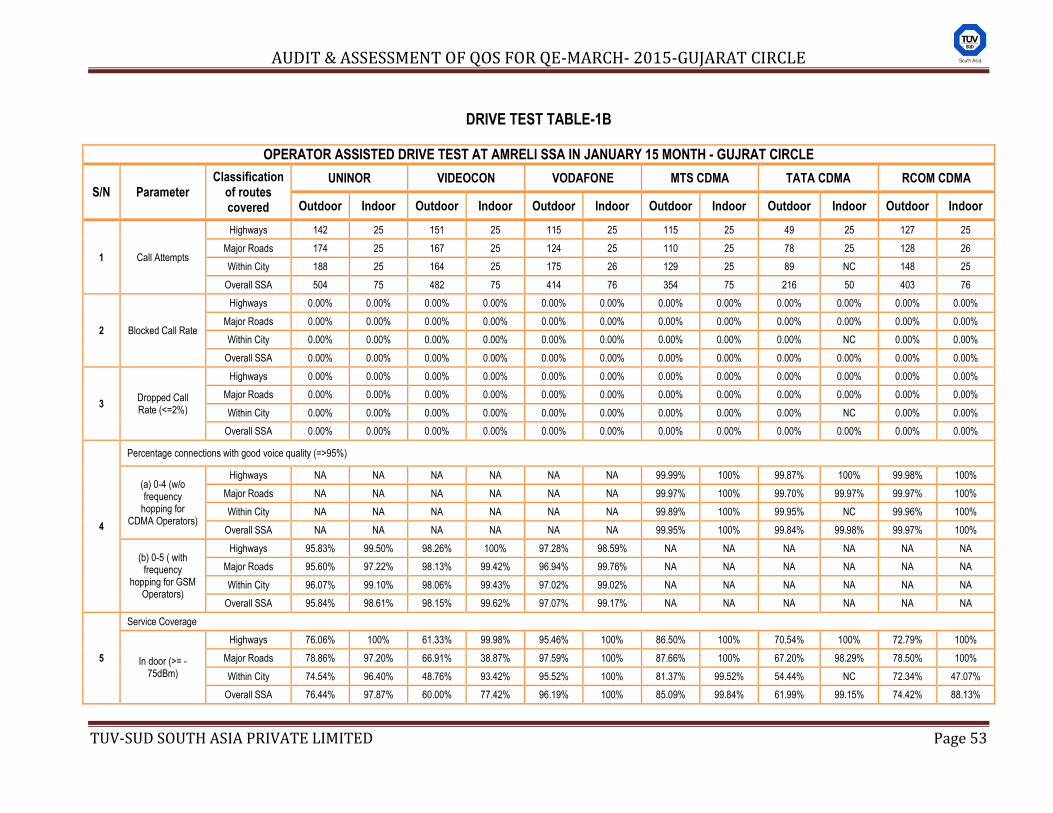
AUDIT & ASSESSMENT OF QOS FOR QE-MARCH- 2015-GUJARAT CIRCLE
TUV-SUD SOUTH ASIA PRIVATE LIMITED Page 53
DRIVE TEST TABLE-1B
OPERATOR ASSISTED DRIVE TEST AT AMRELI SSA IN JANUARY 15 MONTH - GUJRAT CIRCLE
S/N Parameter Classification
of routes covered
UNINOR VIDEOCON VODAFONE MTS CDMA TATA CDMA RCOM CDMA
Outdoor Indoor Outdoor Indoor Outdoor Indoor Outdoor Indoor Outdoor Indoor Outdoor Indoor
1 Call Attempts
Highways 142 25 151 25 115 25 115 25 49 25 127 25
Major Roads 174 25 167 25 124 25 110 25 78 25 128 26
Within City 188 25 164 25 175 26 129 25 89 NC 148 25
Overall SSA 504 75 482 75 414 76 354 75 216 50 403 76
2 Blocked Call Rate
Highways 0.00% 0.00% 0.00% 0.00% 0.00% 0.00% 0.00% 0.00% 0.00% 0.00% 0.00% 0.00%
Major Roads 0.00% 0.00% 0.00% 0.00% 0.00% 0.00% 0.00% 0.00% 0.00% 0.00% 0.00% 0.00%
Within City 0.00% 0.00% 0.00% 0.00% 0.00% 0.00% 0.00% 0.00% 0.00% NC 0.00% 0.00%
Overall SSA 0.00% 0.00% 0.00% 0.00% 0.00% 0.00% 0.00% 0.00% 0.00% 0.00% 0.00% 0.00%
3 Dropped Call Rate (<=2%)
Highways 0.00% 0.00% 0.00% 0.00% 0.00% 0.00% 0.00% 0.00% 0.00% 0.00% 0.00% 0.00%
Major Roads 0.00% 0.00% 0.00% 0.00% 0.00% 0.00% 0.00% 0.00% 0.00% 0.00% 0.00% 0.00%
Within City 0.00% 0.00% 0.00% 0.00% 0.00% 0.00% 0.00% 0.00% 0.00% NC 0.00% 0.00%
Overall SSA 0.00% 0.00% 0.00% 0.00% 0.00% 0.00% 0.00% 0.00% 0.00% 0.00% 0.00% 0.00%
4
Percentage connections with good voice quality (=>95%)
(a) 0-4 (w/o frequency
hopping for CDMA Operators)
Highways NA NA NA NA NA NA 99.99% 100% 99.87% 100% 99.98% 100%
Major Roads NA NA NA NA NA NA 99.97% 100% 99.70% 99.97% 99.97% 100%
Within City NA NA NA NA NA NA 99.89% 100% 99.95% NC 99.96% 100%
Overall SSA NA NA NA NA NA NA 99.95% 100% 99.84% 99.98% 99.97% 100%
(b) 0-5 ( with frequency
hopping for GSM Operators)
Highways 95.83% 99.50% 98.26% 100% 97.28% 98.59% NA NA NA NA NA NA
Major Roads 95.60% 97.22% 98.13% 99.42% 96.94% 99.76% NA NA NA NA NA NA
Within City 96.07% 99.10% 98.06% 99.43% 97.02% 99.02% NA NA NA NA NA NA
Overall SSA 95.84% 98.61% 98.15% 99.62% 97.07% 99.17% NA NA NA NA NA NA
5
Service Coverage
In door (>= -75dBm)
Highways 76.06% 100% 61.33% 99.98% 95.46% 100% 86.50% 100% 70.54% 100% 72.79% 100%
Major Roads 78.86% 97.20% 66.91% 38.87% 97.59% 100% 87.66% 100% 67.20% 98.29% 78.50% 100%
Within City 74.54% 96.40% 48.76% 93.42% 95.52% 100% 81.37% 99.52% 54.44% NC 72.34% 47.07%
Overall SSA 76.44% 97.87% 60.00% 77.42% 96.19% 100% 85.09% 99.84% 61.99% 99.15% 74.42% 88.13%
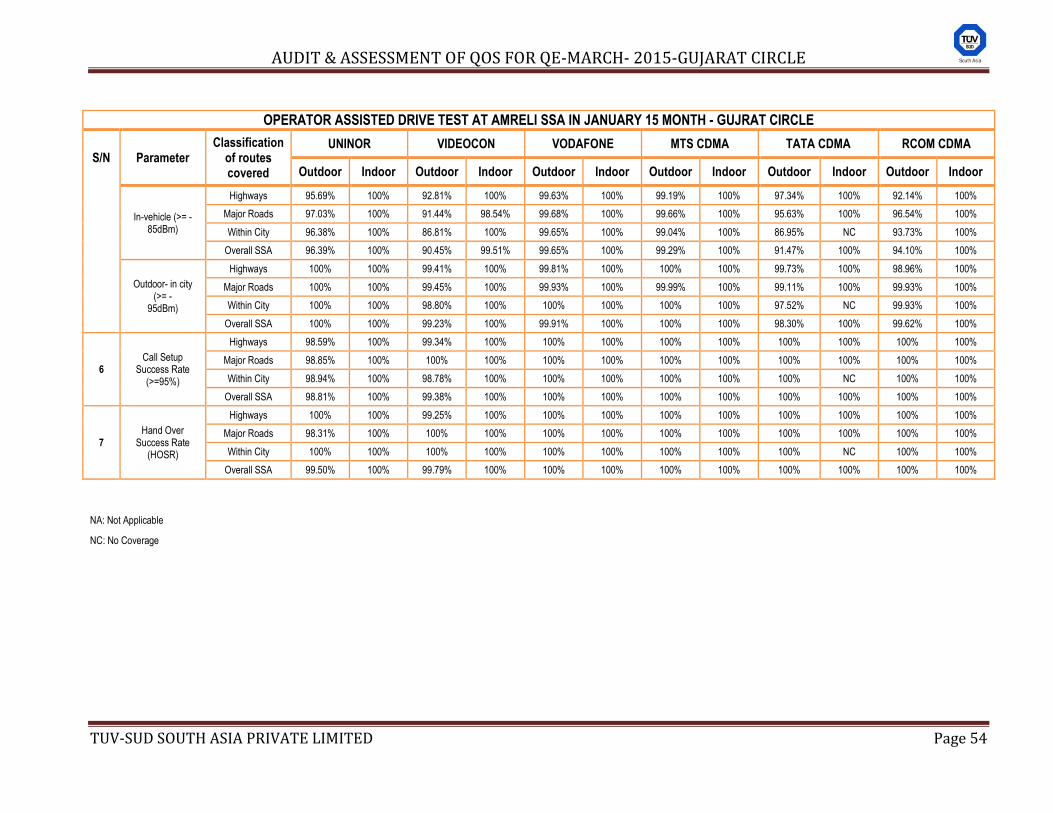
AUDIT & ASSESSMENT OF QOS FOR QE-MARCH- 2015-GUJARAT CIRCLE
TUV-SUD SOUTH ASIA PRIVATE LIMITED Page 54
OPERATOR ASSISTED DRIVE TEST AT AMRELI SSA IN JANUARY 15 MONTH - GUJRAT CIRCLE
S/N Parameter Classification
of routes covered
UNINOR VIDEOCON VODAFONE MTS CDMA TATA CDMA RCOM CDMA
Outdoor Indoor Outdoor Indoor Outdoor Indoor Outdoor Indoor Outdoor Indoor Outdoor Indoor
In-vehicle (>= -85dBm)
Highways 95.69% 100% 92.81% 100% 99.63% 100% 99.19% 100% 97.34% 100% 92.14% 100%
Major Roads 97.03% 100% 91.44% 98.54% 99.68% 100% 99.66% 100% 95.63% 100% 96.54% 100%
Within City 96.38% 100% 86.81% 100% 99.65% 100% 99.04% 100% 86.95% NC 93.73% 100%
Overall SSA 96.39% 100% 90.45% 99.51% 99.65% 100% 99.29% 100% 91.47% 100% 94.10% 100%
Outdoor- in city (>= -
95dBm)
Highways 100% 100% 99.41% 100% 99.81% 100% 100% 100% 99.73% 100% 98.96% 100%
Major Roads 100% 100% 99.45% 100% 99.93% 100% 99.99% 100% 99.11% 100% 99.93% 100%
Within City 100% 100% 98.80% 100% 100% 100% 100% 100% 97.52% NC 99.93% 100%
Overall SSA 100% 100% 99.23% 100% 99.91% 100% 100% 100% 98.30% 100% 99.62% 100%
6 Call Setup
Success Rate (>=95%)
Highways 98.59% 100% 99.34% 100% 100% 100% 100% 100% 100% 100% 100% 100%
Major Roads 98.85% 100% 100% 100% 100% 100% 100% 100% 100% 100% 100% 100%
Within City 98.94% 100% 98.78% 100% 100% 100% 100% 100% 100% NC 100% 100%
Overall SSA 98.81% 100% 99.38% 100% 100% 100% 100% 100% 100% 100% 100% 100%
7 Hand Over
Success Rate (HOSR)
Highways 100% 100% 99.25% 100% 100% 100% 100% 100% 100% 100% 100% 100%
Major Roads 98.31% 100% 100% 100% 100% 100% 100% 100% 100% 100% 100% 100%
Within City 100% 100% 100% 100% 100% 100% 100% 100% 100% NC 100% 100%
Overall SSA 99.50% 100% 99.79% 100% 100% 100% 100% 100% 100% 100% 100% 100%
NA: Not Applicable
NC: No Coverage
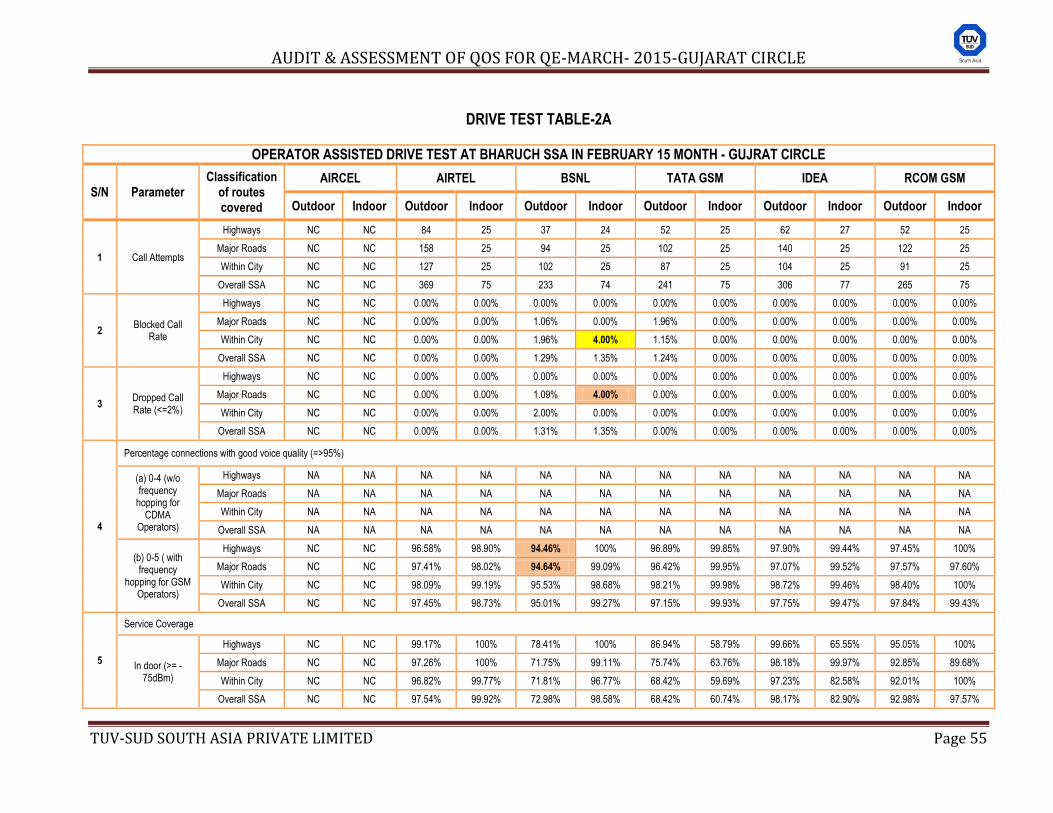
AUDIT & ASSESSMENT OF QOS FOR QE-MARCH- 2015-GUJARAT CIRCLE
TUV-SUD SOUTH ASIA PRIVATE LIMITED Page 55
DRIVE TEST TABLE-2A
OPERATOR ASSISTED DRIVE TEST AT BHARUCH SSA IN FEBRUARY 15 MONTH - GUJRAT CIRCLE
S/N Parameter Classification
of routes covered
AIRCEL AIRTEL BSNL TATA GSM IDEA RCOM GSM
Outdoor Indoor Outdoor Indoor Outdoor Indoor Outdoor Indoor Outdoor Indoor Outdoor Indoor
1 Call Attempts
Highways NC NC 84 25 37 24 52 25 62 27 52 25
Major Roads NC NC 158 25 94 25 102 25 140 25 122 25
Within City NC NC 127 25 102 25 87 25 104 25 91 25
Overall SSA NC NC 369 75 233 74 241 75 306 77 265 75
2 Blocked Call
Rate
Highways NC NC 0.00% 0.00% 0.00% 0.00% 0.00% 0.00% 0.00% 0.00% 0.00% 0.00%
Major Roads NC NC 0.00% 0.00% 1.06% 0.00% 1.96% 0.00% 0.00% 0.00% 0.00% 0.00%
Within City NC NC 0.00% 0.00% 1.96% 4.00% 1.15% 0.00% 0.00% 0.00% 0.00% 0.00%
Overall SSA NC NC 0.00% 0.00% 1.29% 1.35% 1.24% 0.00% 0.00% 0.00% 0.00% 0.00%
3 Dropped Call Rate (<=2%)
Highways NC NC 0.00% 0.00% 0.00% 0.00% 0.00% 0.00% 0.00% 0.00% 0.00% 0.00%
Major Roads NC NC 0.00% 0.00% 1.09% 4.00% 0.00% 0.00% 0.00% 0.00% 0.00% 0.00%
Within City NC NC 0.00% 0.00% 2.00% 0.00% 0.00% 0.00% 0.00% 0.00% 0.00% 0.00%
Overall SSA NC NC 0.00% 0.00% 1.31% 1.35% 0.00% 0.00% 0.00% 0.00% 0.00% 0.00%
4
Percentage connections with good voice quality (=>95%)
(a) 0-4 (w/o frequency
hopping for CDMA
Operators)
Highways NA NA NA NA NA NA NA NA NA NA NA NA
Major Roads NA NA NA NA NA NA NA NA NA NA NA NA
Within City NA NA NA NA NA NA NA NA NA NA NA NA
Overall SSA NA NA NA NA NA NA NA NA NA NA NA NA
(b) 0-5 ( with frequency
hopping for GSM Operators)
Highways NC NC 96.58% 98.90% 94.46% 100% 96.89% 99.85% 97.90% 99.44% 97.45% 100%
Major Roads NC NC 97.41% 98.02% 94.64% 99.09% 96.42% 99.95% 97.07% 99.52% 97.57% 97.60%
Within City NC NC 98.09% 99.19% 95.53% 98.68% 98.21% 99.98% 98.72% 99.46% 98.40% 100%
Overall SSA NC NC 97.45% 98.73% 95.01% 99.27% 97.15% 99.93% 97.75% 99.47% 97.84% 99.43%
5
Service Coverage
In door (>= -75dBm)
Highways NC NC 99.17% 100% 78.41% 100% 86.94% 58.79% 99.66% 65.55% 95.05% 100%
Major Roads NC NC 97.26% 100% 71.75% 99.11% 75.74% 63.76% 98.18% 99.97% 92.85% 89.68%
Within City NC NC 96.82% 99.77% 71.81% 96.77% 68.42% 59.69% 97.23% 82.58% 92.01% 100%
Overall SSA NC NC 97.54% 99.92% 72.98% 98.58% 68.42% 60.74% 98.17% 82.90% 92.98% 97.57%
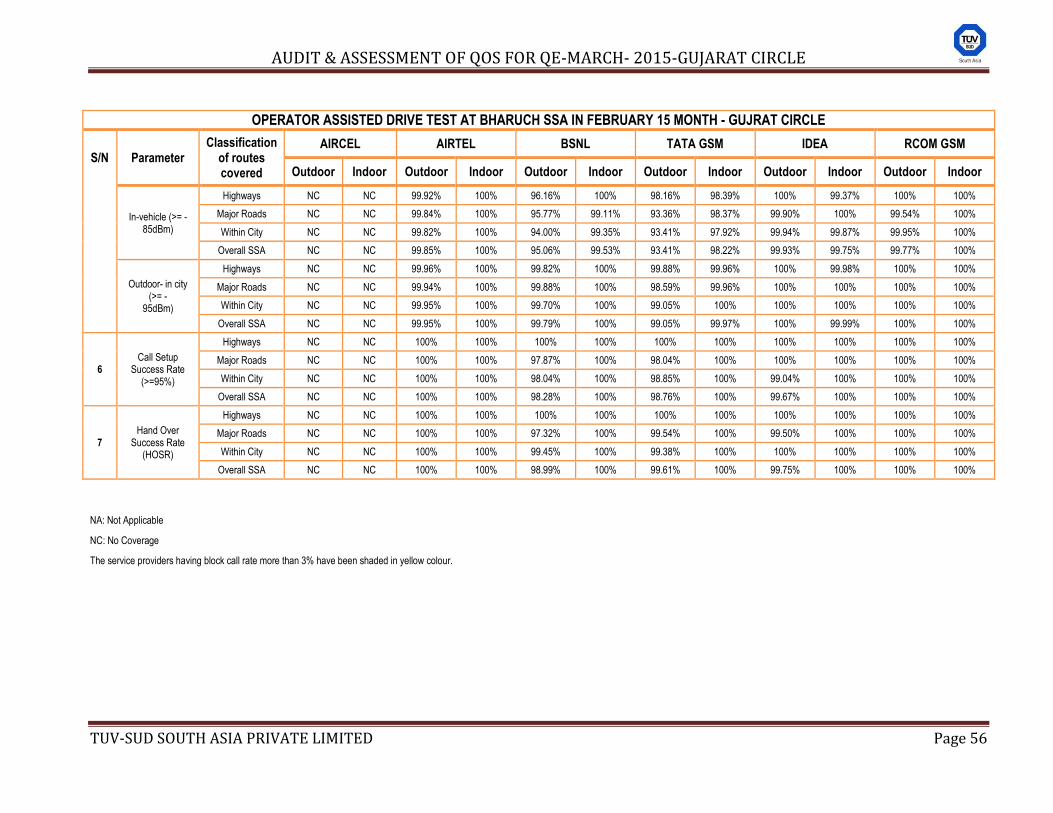
AUDIT & ASSESSMENT OF QOS FOR QE-MARCH- 2015-GUJARAT CIRCLE
TUV-SUD SOUTH ASIA PRIVATE LIMITED Page 56
OPERATOR ASSISTED DRIVE TEST AT BHARUCH SSA IN FEBRUARY 15 MONTH - GUJRAT CIRCLE
S/N Parameter Classification
of routes covered
AIRCEL AIRTEL BSNL TATA GSM IDEA RCOM GSM
Outdoor Indoor Outdoor Indoor Outdoor Indoor Outdoor Indoor Outdoor Indoor Outdoor Indoor
In-vehicle (>= -85dBm)
Highways NC NC 99.92% 100% 96.16% 100% 98.16% 98.39% 100% 99.37% 100% 100%
Major Roads NC NC 99.84% 100% 95.77% 99.11% 93.36% 98.37% 99.90% 100% 99.54% 100%
Within City NC NC 99.82% 100% 94.00% 99.35% 93.41% 97.92% 99.94% 99.87% 99.95% 100%
Overall SSA NC NC 99.85% 100% 95.06% 99.53% 93.41% 98.22% 99.93% 99.75% 99.77% 100%
Outdoor- in city (>= -
95dBm)
Highways NC NC 99.96% 100% 99.82% 100% 99.88% 99.96% 100% 99.98% 100% 100%
Major Roads NC NC 99.94% 100% 99.88% 100% 98.59% 99.96% 100% 100% 100% 100%
Within City NC NC 99.95% 100% 99.70% 100% 99.05% 100% 100% 100% 100% 100%
Overall SSA NC NC 99.95% 100% 99.79% 100% 99.05% 99.97% 100% 99.99% 100% 100%
6 Call Setup
Success Rate (>=95%)
Highways NC NC 100% 100% 100% 100% 100% 100% 100% 100% 100% 100%
Major Roads NC NC 100% 100% 97.87% 100% 98.04% 100% 100% 100% 100% 100%
Within City NC NC 100% 100% 98.04% 100% 98.85% 100% 99.04% 100% 100% 100%
Overall SSA NC NC 100% 100% 98.28% 100% 98.76% 100% 99.67% 100% 100% 100%
7 Hand Over
Success Rate (HOSR)
Highways NC NC 100% 100% 100% 100% 100% 100% 100% 100% 100% 100%
Major Roads NC NC 100% 100% 97.32% 100% 99.54% 100% 99.50% 100% 100% 100%
Within City NC NC 100% 100% 99.45% 100% 99.38% 100% 100% 100% 100% 100%
Overall SSA NC NC 100% 100% 98.99% 100% 99.61% 100% 99.75% 100% 100% 100%
NA: Not Applicable
NC: No Coverage
The service providers having block call rate more than 3% have been shaded in yellow colour.
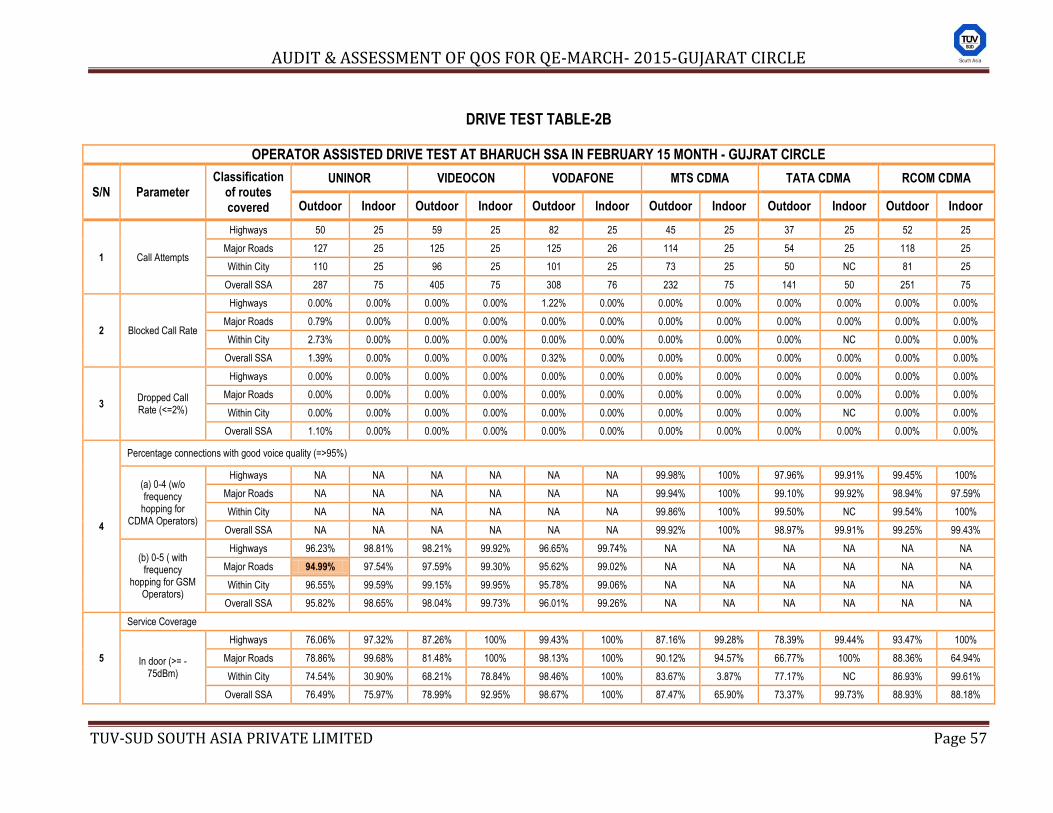
AUDIT & ASSESSMENT OF QOS FOR QE-MARCH- 2015-GUJARAT CIRCLE
TUV-SUD SOUTH ASIA PRIVATE LIMITED Page 57
DRIVE TEST TABLE-2B
OPERATOR ASSISTED DRIVE TEST AT BHARUCH SSA IN FEBRUARY 15 MONTH - GUJRAT CIRCLE
S/N Parameter Classification
of routes covered
UNINOR VIDEOCON VODAFONE MTS CDMA TATA CDMA RCOM CDMA
Outdoor Indoor Outdoor Indoor Outdoor Indoor Outdoor Indoor Outdoor Indoor Outdoor Indoor
1 Call Attempts
Highways 50 25 59 25 82 25 45 25 37 25 52 25
Major Roads 127 25 125 25 125 26 114 25 54 25 118 25
Within City 110 25 96 25 101 25 73 25 50 NC 81 25
Overall SSA 287 75 405 75 308 76 232 75 141 50 251 75
2 Blocked Call Rate
Highways 0.00% 0.00% 0.00% 0.00% 1.22% 0.00% 0.00% 0.00% 0.00% 0.00% 0.00% 0.00%
Major Roads 0.79% 0.00% 0.00% 0.00% 0.00% 0.00% 0.00% 0.00% 0.00% 0.00% 0.00% 0.00%
Within City 2.73% 0.00% 0.00% 0.00% 0.00% 0.00% 0.00% 0.00% 0.00% NC 0.00% 0.00%
Overall SSA 1.39% 0.00% 0.00% 0.00% 0.32% 0.00% 0.00% 0.00% 0.00% 0.00% 0.00% 0.00%
3 Dropped Call Rate (<=2%)
Highways 0.00% 0.00% 0.00% 0.00% 0.00% 0.00% 0.00% 0.00% 0.00% 0.00% 0.00% 0.00%
Major Roads 0.00% 0.00% 0.00% 0.00% 0.00% 0.00% 0.00% 0.00% 0.00% 0.00% 0.00% 0.00%
Within City 0.00% 0.00% 0.00% 0.00% 0.00% 0.00% 0.00% 0.00% 0.00% NC 0.00% 0.00%
Overall SSA 1.10% 0.00% 0.00% 0.00% 0.00% 0.00% 0.00% 0.00% 0.00% 0.00% 0.00% 0.00%
4
Percentage connections with good voice quality (=>95%)
(a) 0-4 (w/o frequency
hopping for CDMA Operators)
Highways NA NA NA NA NA NA 99.98% 100% 97.96% 99.91% 99.45% 100%
Major Roads NA NA NA NA NA NA 99.94% 100% 99.10% 99.92% 98.94% 97.59%
Within City NA NA NA NA NA NA 99.86% 100% 99.50% NC 99.54% 100%
Overall SSA NA NA NA NA NA NA 99.92% 100% 98.97% 99.91% 99.25% 99.43%
(b) 0-5 ( with frequency
hopping for GSM Operators)
Highways 96.23% 98.81% 98.21% 99.92% 96.65% 99.74% NA NA NA NA NA NA
Major Roads 94.99% 97.54% 97.59% 99.30% 95.62% 99.02% NA NA NA NA NA NA
Within City 96.55% 99.59% 99.15% 99.95% 95.78% 99.06% NA NA NA NA NA NA
Overall SSA 95.82% 98.65% 98.04% 99.73% 96.01% 99.26% NA NA NA NA NA NA
5
Service Coverage
In door (>= -75dBm)
Highways 76.06% 97.32% 87.26% 100% 99.43% 100% 87.16% 99.28% 78.39% 99.44% 93.47% 100%
Major Roads 78.86% 99.68% 81.48% 100% 98.13% 100% 90.12% 94.57% 66.77% 100% 88.36% 64.94%
Within City 74.54% 30.90% 68.21% 78.84% 98.46% 100% 83.67% 3.87% 77.17% NC 86.93% 99.61%
Overall SSA 76.49% 75.97% 78.99% 92.95% 98.67% 100% 87.47% 65.90% 73.37% 99.73% 88.93% 88.18%
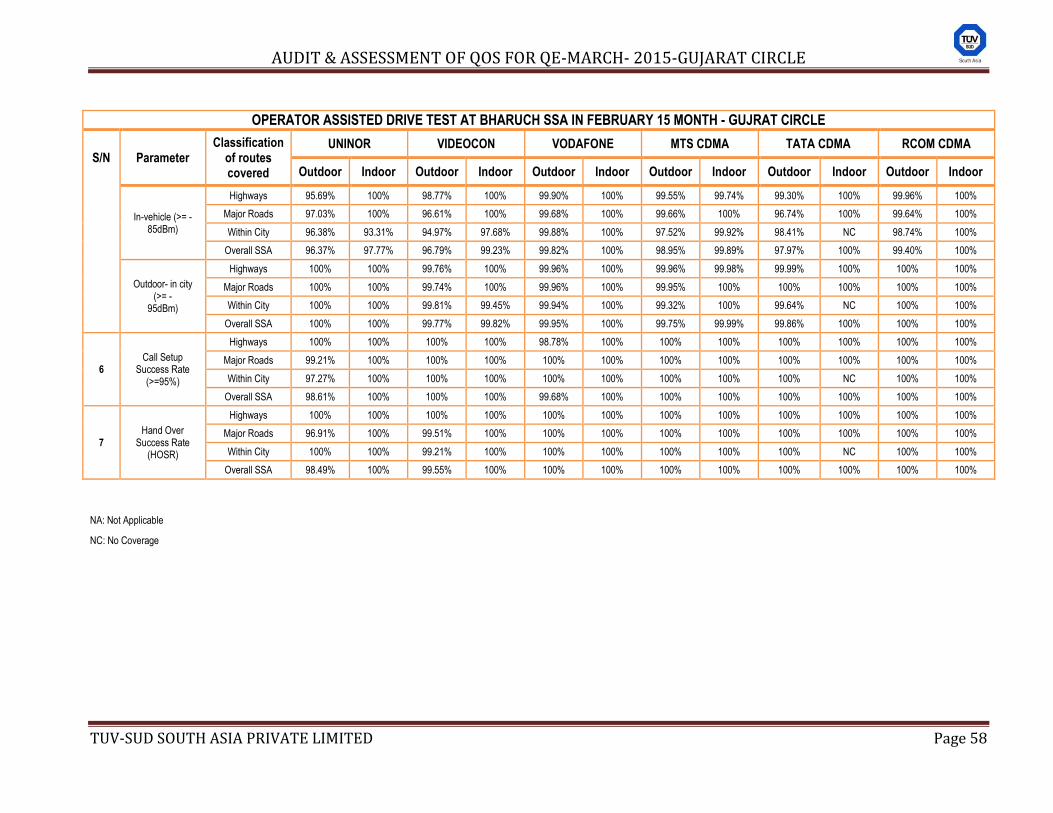
AUDIT & ASSESSMENT OF QOS FOR QE-MARCH- 2015-GUJARAT CIRCLE
TUV-SUD SOUTH ASIA PRIVATE LIMITED Page 58
OPERATOR ASSISTED DRIVE TEST AT BHARUCH SSA IN FEBRUARY 15 MONTH - GUJRAT CIRCLE
S/N Parameter Classification
of routes covered
UNINOR VIDEOCON VODAFONE MTS CDMA TATA CDMA RCOM CDMA
Outdoor Indoor Outdoor Indoor Outdoor Indoor Outdoor Indoor Outdoor Indoor Outdoor Indoor
In-vehicle (>= -85dBm)
Highways 95.69% 100% 98.77% 100% 99.90% 100% 99.55% 99.74% 99.30% 100% 99.96% 100%
Major Roads 97.03% 100% 96.61% 100% 99.68% 100% 99.66% 100% 96.74% 100% 99.64% 100%
Within City 96.38% 93.31% 94.97% 97.68% 99.88% 100% 97.52% 99.92% 98.41% NC 98.74% 100%
Overall SSA 96.37% 97.77% 96.79% 99.23% 99.82% 100% 98.95% 99.89% 97.97% 100% 99.40% 100%
Outdoor- in city (>= -
95dBm)
Highways 100% 100% 99.76% 100% 99.96% 100% 99.96% 99.98% 99.99% 100% 100% 100%
Major Roads 100% 100% 99.74% 100% 99.96% 100% 99.95% 100% 100% 100% 100% 100%
Within City 100% 100% 99.81% 99.45% 99.94% 100% 99.32% 100% 99.64% NC 100% 100%
Overall SSA 100% 100% 99.77% 99.82% 99.95% 100% 99.75% 99.99% 99.86% 100% 100% 100%
6 Call Setup
Success Rate (>=95%)
Highways 100% 100% 100% 100% 98.78% 100% 100% 100% 100% 100% 100% 100%
Major Roads 99.21% 100% 100% 100% 100% 100% 100% 100% 100% 100% 100% 100%
Within City 97.27% 100% 100% 100% 100% 100% 100% 100% 100% NC 100% 100%
Overall SSA 98.61% 100% 100% 100% 99.68% 100% 100% 100% 100% 100% 100% 100%
7 Hand Over
Success Rate (HOSR)
Highways 100% 100% 100% 100% 100% 100% 100% 100% 100% 100% 100% 100%
Major Roads 96.91% 100% 99.51% 100% 100% 100% 100% 100% 100% 100% 100% 100%
Within City 100% 100% 99.21% 100% 100% 100% 100% 100% 100% NC 100% 100%
Overall SSA 98.49% 100% 99.55% 100% 100% 100% 100% 100% 100% 100% 100% 100%
NA: Not Applicable
NC: No Coverage
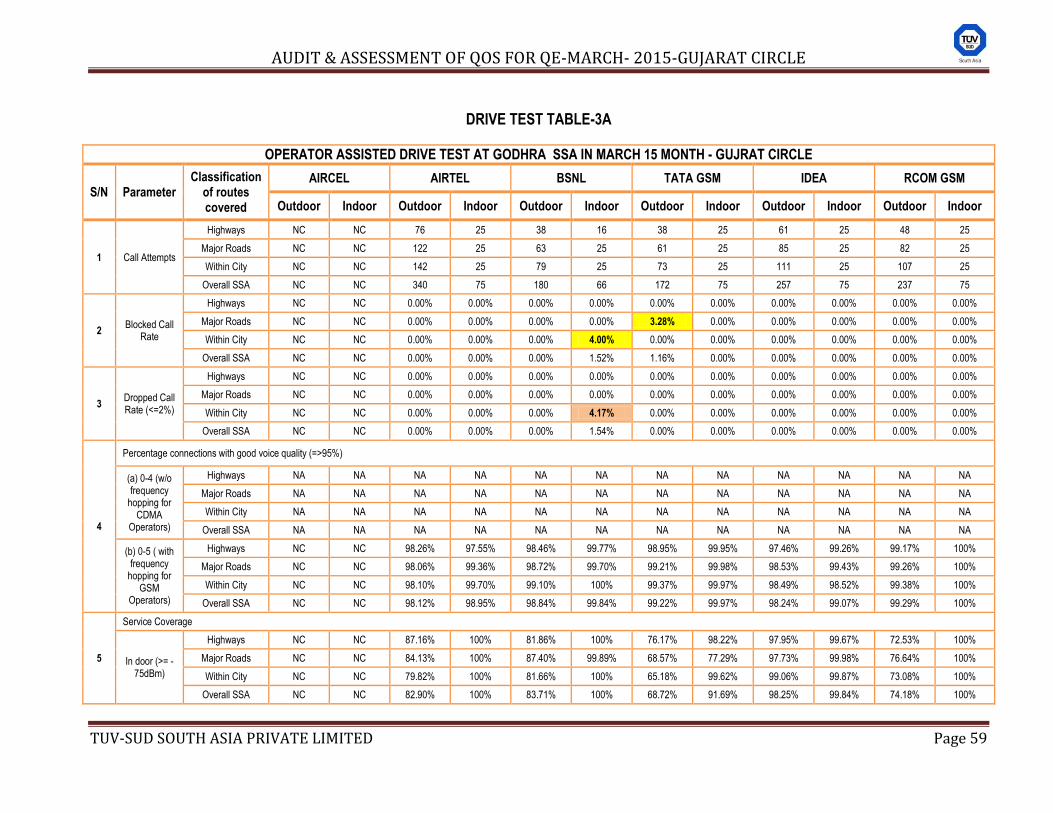
AUDIT & ASSESSMENT OF QOS FOR QE-MARCH- 2015-GUJARAT CIRCLE
TUV-SUD SOUTH ASIA PRIVATE LIMITED Page 59
DRIVE TEST TABLE-3A
OPERATOR ASSISTED DRIVE TEST AT GODHRA SSA IN MARCH 15 MONTH - GUJRAT CIRCLE
S/N Parameter Classification
of routes covered
AIRCEL AIRTEL BSNL TATA GSM IDEA RCOM GSM
Outdoor Indoor Outdoor Indoor Outdoor Indoor Outdoor Indoor Outdoor Indoor Outdoor Indoor
1 Call Attempts
Highways NC NC 76 25 38 16 38 25 61 25 48 25
Major Roads NC NC 122 25 63 25 61 25 85 25 82 25
Within City NC NC 142 25 79 25 73 25 111 25 107 25
Overall SSA NC NC 340 75 180 66 172 75 257 75 237 75
2 Blocked Call
Rate
Highways NC NC 0.00% 0.00% 0.00% 0.00% 0.00% 0.00% 0.00% 0.00% 0.00% 0.00%
Major Roads NC NC 0.00% 0.00% 0.00% 0.00% 3.28% 0.00% 0.00% 0.00% 0.00% 0.00%
Within City NC NC 0.00% 0.00% 0.00% 4.00% 0.00% 0.00% 0.00% 0.00% 0.00% 0.00%
Overall SSA NC NC 0.00% 0.00% 0.00% 1.52% 1.16% 0.00% 0.00% 0.00% 0.00% 0.00%
3 Dropped Call Rate (<=2%)
Highways NC NC 0.00% 0.00% 0.00% 0.00% 0.00% 0.00% 0.00% 0.00% 0.00% 0.00%
Major Roads NC NC 0.00% 0.00% 0.00% 0.00% 0.00% 0.00% 0.00% 0.00% 0.00% 0.00%
Within City NC NC 0.00% 0.00% 0.00% 4.17% 0.00% 0.00% 0.00% 0.00% 0.00% 0.00%
Overall SSA NC NC 0.00% 0.00% 0.00% 1.54% 0.00% 0.00% 0.00% 0.00% 0.00% 0.00%
4
Percentage connections with good voice quality (=>95%)
(a) 0-4 (w/o frequency
hopping for CDMA
Operators)
Highways NA NA NA NA NA NA NA NA NA NA NA NA
Major Roads NA NA NA NA NA NA NA NA NA NA NA NA
Within City NA NA NA NA NA NA NA NA NA NA NA NA
Overall SSA NA NA NA NA NA NA NA NA NA NA NA NA
(b) 0-5 ( with frequency
hopping for GSM
Operators)
Highways NC NC 98.26% 97.55% 98.46% 99.77% 98.95% 99.95% 97.46% 99.26% 99.17% 100%
Major Roads NC NC 98.06% 99.36% 98.72% 99.70% 99.21% 99.98% 98.53% 99.43% 99.26% 100%
Within City NC NC 98.10% 99.70% 99.10% 100% 99.37% 99.97% 98.49% 98.52% 99.38% 100%
Overall SSA NC NC 98.12% 98.95% 98.84% 99.84% 99.22% 99.97% 98.24% 99.07% 99.29% 100%
5
Service Coverage
In door (>= -75dBm)
Highways NC NC 87.16% 100% 81.86% 100% 76.17% 98.22% 97.95% 99.67% 72.53% 100%
Major Roads NC NC 84.13% 100% 87.40% 99.89% 68.57% 77.29% 97.73% 99.98% 76.64% 100%
Within City NC NC 79.82% 100% 81.66% 100% 65.18% 99.62% 99.06% 99.87% 73.08% 100%
Overall SSA NC NC 82.90% 100% 83.71% 100% 68.72% 91.69% 98.25% 99.84% 74.18% 100%
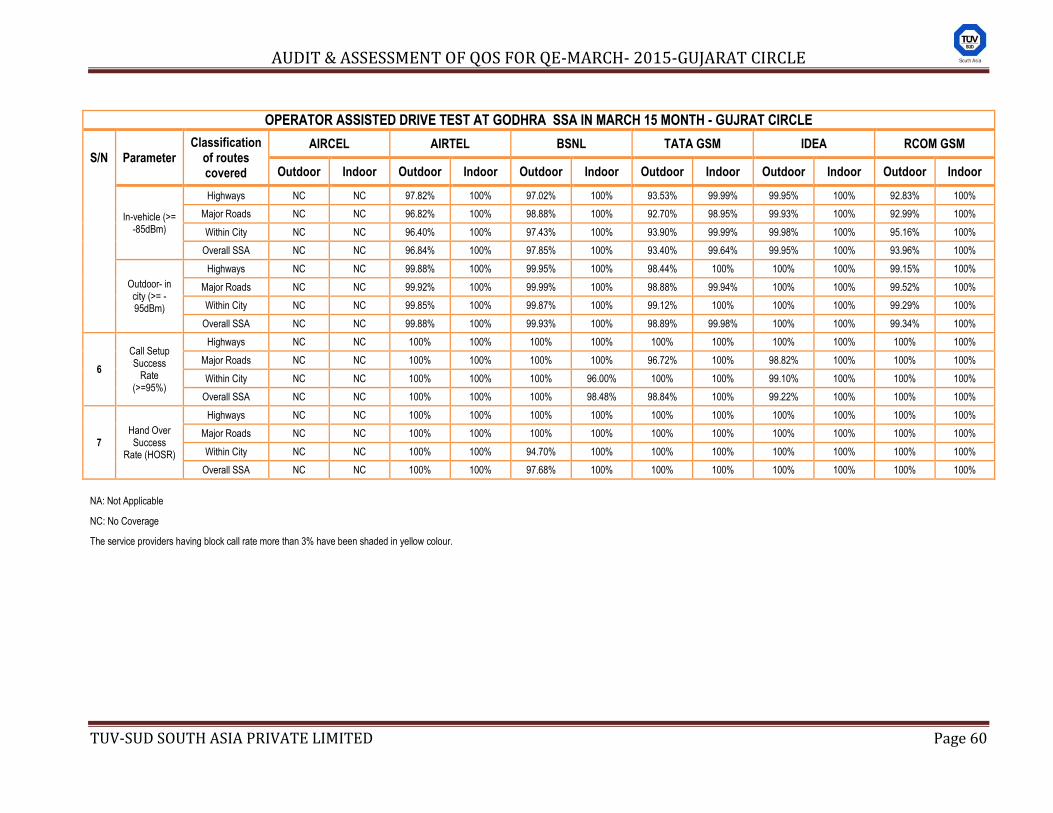
AUDIT & ASSESSMENT OF QOS FOR QE-MARCH- 2015-GUJARAT CIRCLE
TUV-SUD SOUTH ASIA PRIVATE LIMITED Page 60
OPERATOR ASSISTED DRIVE TEST AT GODHRA SSA IN MARCH 15 MONTH - GUJRAT CIRCLE
S/N Parameter Classification
of routes covered
AIRCEL AIRTEL BSNL TATA GSM IDEA RCOM GSM
Outdoor Indoor Outdoor Indoor Outdoor Indoor Outdoor Indoor Outdoor Indoor Outdoor Indoor
In-vehicle (>= -85dBm)
Highways NC NC 97.82% 100% 97.02% 100% 93.53% 99.99% 99.95% 100% 92.83% 100%
Major Roads NC NC 96.82% 100% 98.88% 100% 92.70% 98.95% 99.93% 100% 92.99% 100%
Within City NC NC 96.40% 100% 97.43% 100% 93.90% 99.99% 99.98% 100% 95.16% 100%
Overall SSA NC NC 96.84% 100% 97.85% 100% 93.40% 99.64% 99.95% 100% 93.96% 100%
Outdoor- in city (>= - 95dBm)
Highways NC NC 99.88% 100% 99.95% 100% 98.44% 100% 100% 100% 99.15% 100%
Major Roads NC NC 99.92% 100% 99.99% 100% 98.88% 99.94% 100% 100% 99.52% 100%
Within City NC NC 99.85% 100% 99.87% 100% 99.12% 100% 100% 100% 99.29% 100%
Overall SSA NC NC 99.88% 100% 99.93% 100% 98.89% 99.98% 100% 100% 99.34% 100%
6
Call Setup Success
Rate (>=95%)
Highways NC NC 100% 100% 100% 100% 100% 100% 100% 100% 100% 100%
Major Roads NC NC 100% 100% 100% 100% 96.72% 100% 98.82% 100% 100% 100%
Within City NC NC 100% 100% 100% 96.00% 100% 100% 99.10% 100% 100% 100%
Overall SSA NC NC 100% 100% 100% 98.48% 98.84% 100% 99.22% 100% 100% 100%
7 Hand Over Success
Rate (HOSR)
Highways NC NC 100% 100% 100% 100% 100% 100% 100% 100% 100% 100%
Major Roads NC NC 100% 100% 100% 100% 100% 100% 100% 100% 100% 100%
Within City NC NC 100% 100% 94.70% 100% 100% 100% 100% 100% 100% 100%
Overall SSA NC NC 100% 100% 97.68% 100% 100% 100% 100% 100% 100% 100%
NA: Not Applicable
NC: No Coverage
The service providers having block call rate more than 3% have been shaded in yellow colour.
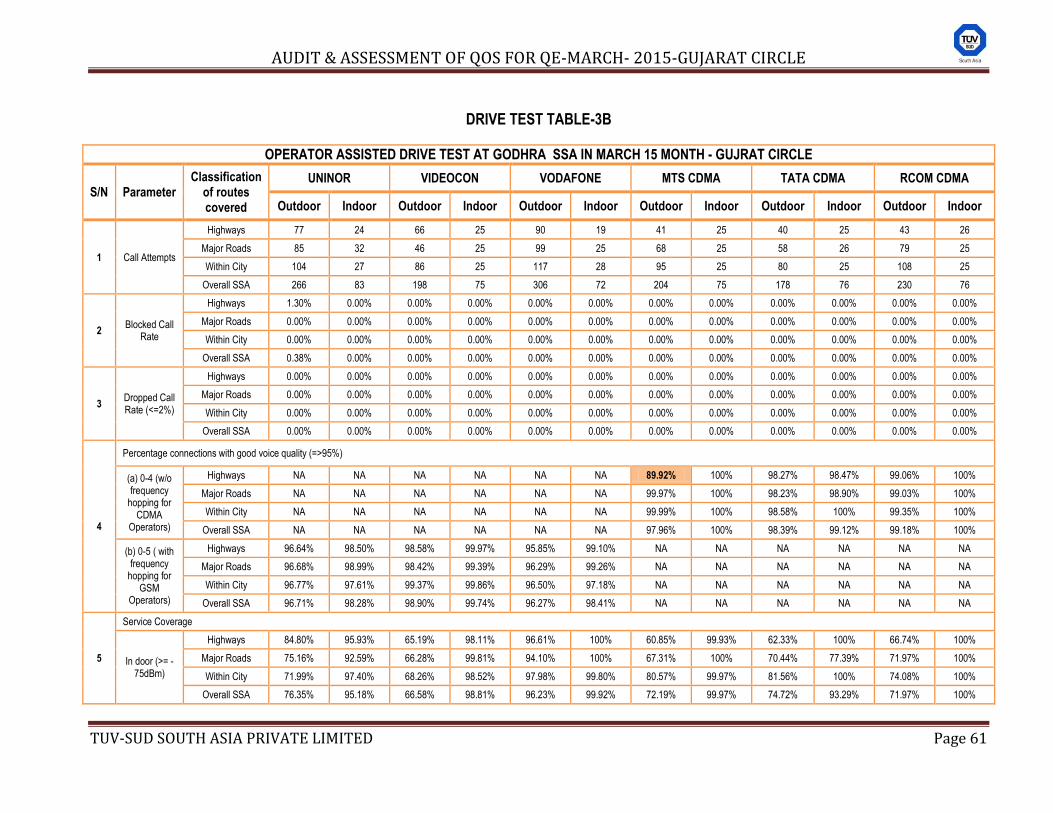
AUDIT & ASSESSMENT OF QOS FOR QE-MARCH- 2015-GUJARAT CIRCLE
TUV-SUD SOUTH ASIA PRIVATE LIMITED Page 61
DRIVE TEST TABLE-3B
OPERATOR ASSISTED DRIVE TEST AT GODHRA SSA IN MARCH 15 MONTH - GUJRAT CIRCLE
S/N Parameter Classification
of routes covered
UNINOR VIDEOCON VODAFONE MTS CDMA TATA CDMA RCOM CDMA
Outdoor Indoor Outdoor Indoor Outdoor Indoor Outdoor Indoor Outdoor Indoor Outdoor Indoor
1 Call Attempts
Highways 77 24 66 25 90 19 41 25 40 25 43 26
Major Roads 85 32 46 25 99 25 68 25 58 26 79 25
Within City 104 27 86 25 117 28 95 25 80 25 108 25
Overall SSA 266 83 198 75 306 72 204 75 178 76 230 76
2 Blocked Call
Rate
Highways 1.30% 0.00% 0.00% 0.00% 0.00% 0.00% 0.00% 0.00% 0.00% 0.00% 0.00% 0.00%
Major Roads 0.00% 0.00% 0.00% 0.00% 0.00% 0.00% 0.00% 0.00% 0.00% 0.00% 0.00% 0.00%
Within City 0.00% 0.00% 0.00% 0.00% 0.00% 0.00% 0.00% 0.00% 0.00% 0.00% 0.00% 0.00%
Overall SSA 0.38% 0.00% 0.00% 0.00% 0.00% 0.00% 0.00% 0.00% 0.00% 0.00% 0.00% 0.00%
3 Dropped Call Rate (<=2%)
Highways 0.00% 0.00% 0.00% 0.00% 0.00% 0.00% 0.00% 0.00% 0.00% 0.00% 0.00% 0.00%
Major Roads 0.00% 0.00% 0.00% 0.00% 0.00% 0.00% 0.00% 0.00% 0.00% 0.00% 0.00% 0.00%
Within City 0.00% 0.00% 0.00% 0.00% 0.00% 0.00% 0.00% 0.00% 0.00% 0.00% 0.00% 0.00%
Overall SSA 0.00% 0.00% 0.00% 0.00% 0.00% 0.00% 0.00% 0.00% 0.00% 0.00% 0.00% 0.00%
4
Percentage connections with good voice quality (=>95%)
(a) 0-4 (w/o frequency
hopping for CDMA
Operators)
Highways NA NA NA NA NA NA 89.92% 100% 98.27% 98.47% 99.06% 100%
Major Roads NA NA NA NA NA NA 99.97% 100% 98.23% 98.90% 99.03% 100%
Within City NA NA NA NA NA NA 99.99% 100% 98.58% 100% 99.35% 100%
Overall SSA NA NA NA NA NA NA 97.96% 100% 98.39% 99.12% 99.18% 100%
(b) 0-5 ( with frequency
hopping for GSM
Operators)
Highways 96.64% 98.50% 98.58% 99.97% 95.85% 99.10% NA NA NA NA NA NA
Major Roads 96.68% 98.99% 98.42% 99.39% 96.29% 99.26% NA NA NA NA NA NA
Within City 96.77% 97.61% 99.37% 99.86% 96.50% 97.18% NA NA NA NA NA NA
Overall SSA 96.71% 98.28% 98.90% 99.74% 96.27% 98.41% NA NA NA NA NA NA
5
Service Coverage
In door (>= -75dBm)
Highways 84.80% 95.93% 65.19% 98.11% 96.61% 100% 60.85% 99.93% 62.33% 100% 66.74% 100%
Major Roads 75.16% 92.59% 66.28% 99.81% 94.10% 100% 67.31% 100% 70.44% 77.39% 71.97% 100%
Within City 71.99% 97.40% 68.26% 98.52% 97.98% 99.80% 80.57% 99.97% 81.56% 100% 74.08% 100%
Overall SSA 76.35% 95.18% 66.58% 98.81% 96.23% 99.92% 72.19% 99.97% 74.72% 93.29% 71.97% 100%
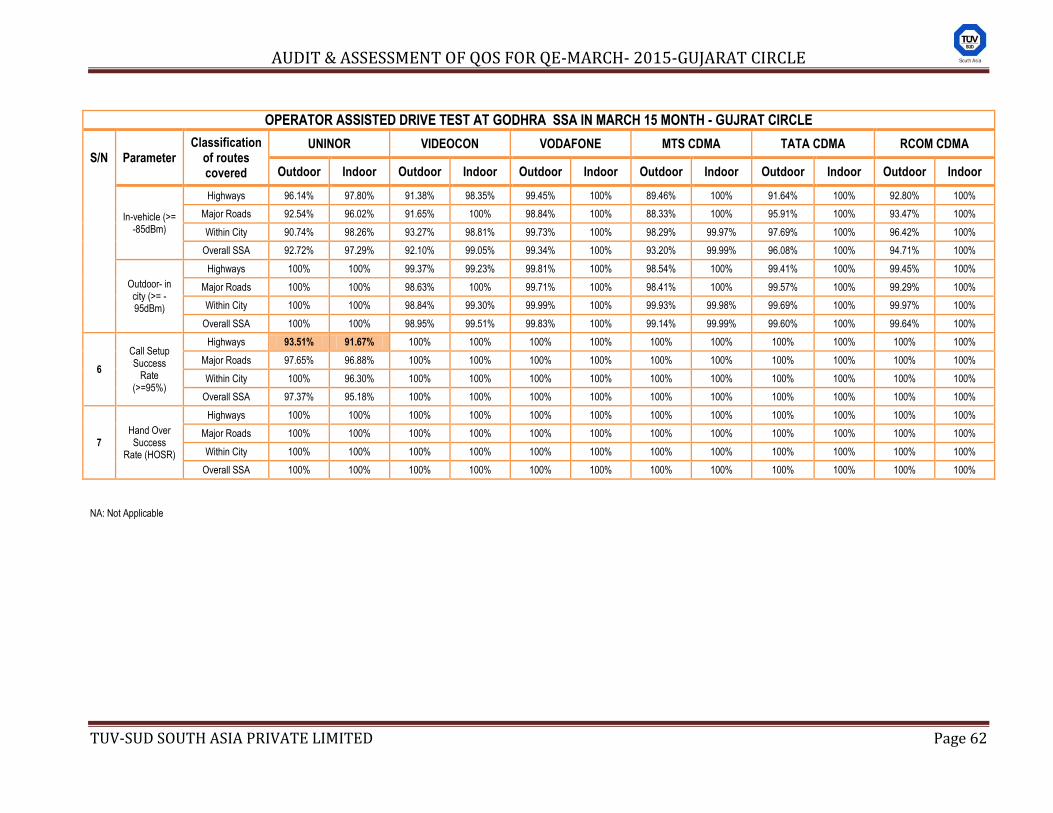
AUDIT & ASSESSMENT OF QOS FOR QE-MARCH- 2015-GUJARAT CIRCLE
TUV-SUD SOUTH ASIA PRIVATE LIMITED Page 62
OPERATOR ASSISTED DRIVE TEST AT GODHRA SSA IN MARCH 15 MONTH - GUJRAT CIRCLE
S/N Parameter Classification
of routes covered
UNINOR VIDEOCON VODAFONE MTS CDMA TATA CDMA RCOM CDMA
Outdoor Indoor Outdoor Indoor Outdoor Indoor Outdoor Indoor Outdoor Indoor Outdoor Indoor
In-vehicle (>= -85dBm)
Highways 96.14% 97.80% 91.38% 98.35% 99.45% 100% 89.46% 100% 91.64% 100% 92.80% 100%
Major Roads 92.54% 96.02% 91.65% 100% 98.84% 100% 88.33% 100% 95.91% 100% 93.47% 100%
Within City 90.74% 98.26% 93.27% 98.81% 99.73% 100% 98.29% 99.97% 97.69% 100% 96.42% 100%
Overall SSA 92.72% 97.29% 92.10% 99.05% 99.34% 100% 93.20% 99.99% 96.08% 100% 94.71% 100%
Outdoor- in city (>= - 95dBm)
Highways 100% 100% 99.37% 99.23% 99.81% 100% 98.54% 100% 99.41% 100% 99.45% 100%
Major Roads 100% 100% 98.63% 100% 99.71% 100% 98.41% 100% 99.57% 100% 99.29% 100%
Within City 100% 100% 98.84% 99.30% 99.99% 100% 99.93% 99.98% 99.69% 100% 99.97% 100%
Overall SSA 100% 100% 98.95% 99.51% 99.83% 100% 99.14% 99.99% 99.60% 100% 99.64% 100%
6
Call Setup Success
Rate (>=95%)
Highways 93.51% 91.67% 100% 100% 100% 100% 100% 100% 100% 100% 100% 100%
Major Roads 97.65% 96.88% 100% 100% 100% 100% 100% 100% 100% 100% 100% 100%
Within City 100% 96.30% 100% 100% 100% 100% 100% 100% 100% 100% 100% 100%
Overall SSA 97.37% 95.18% 100% 100% 100% 100% 100% 100% 100% 100% 100% 100%
7 Hand Over Success
Rate (HOSR)
Highways 100% 100% 100% 100% 100% 100% 100% 100% 100% 100% 100% 100%
Major Roads 100% 100% 100% 100% 100% 100% 100% 100% 100% 100% 100% 100%
Within City 100% 100% 100% 100% 100% 100% 100% 100% 100% 100% 100% 100%
Overall SSA 100% 100% 100% 100% 100% 100% 100% 100% 100% 100% 100% 100%
NA: Not Applicable
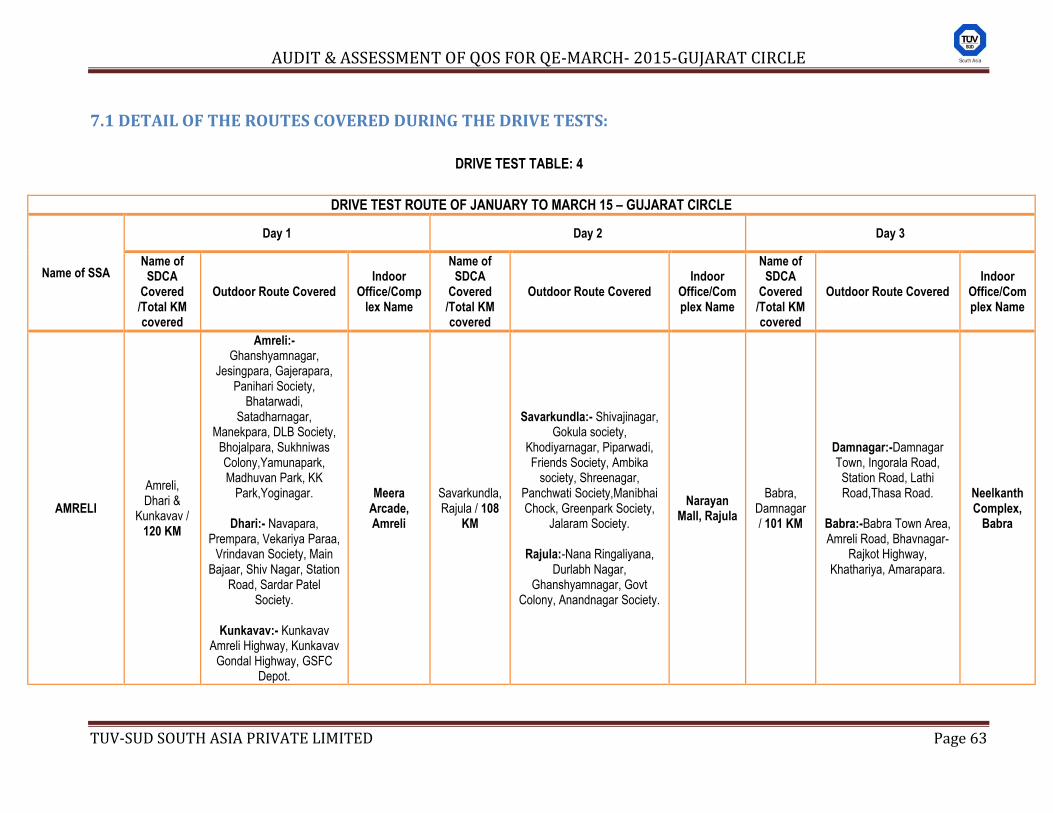
AUDIT & ASSESSMENT OF QOS FOR QE-MARCH- 2015-GUJARAT CIRCLE
TUV-SUD SOUTH ASIA PRIVATE LIMITED Page 63
7.1 DETAIL OF THE ROUTES COVERED DURING THE DRIVE TESTS:
DRIVE TEST TABLE: 4
DRIVE TEST ROUTE OF JANUARY TO MARCH 15 – GUJARAT CIRCLE
Name of SSA
Day 1 Day 2 Day 3
Name of SDCA
Covered /Total KM covered
Outdoor Route Covered Indoor
Office/Complex Name
Name of SDCA
Covered /Total KM covered
Outdoor Route Covered Indoor
Office/Complex Name
Name of SDCA
Covered /Total KM covered
Outdoor Route Covered Indoor
Office/Complex Name
AMRELI
Amreli, Dhari &
Kunkavav / 120 KM
Amreli:- Ghanshyamnagar,
Jesingpara, Gajerapara, Panihari Society,
Bhatarwadi, Satadharnagar,
Manekpara, DLB Society, Bhojalpara, Sukhniwas Colony,Yamunapark, Madhuvan Park, KK
Park,Yoginagar.
Dhari:- Navapara, Prempara, Vekariya Paraa,
Vrindavan Society, Main Bajaar, Shiv Nagar, Station
Road, Sardar Patel Society.
Kunkavav:- Kunkavav
Amreli Highway, Kunkavav Gondal Highway, GSFC
Depot.
Meera Arcade, Amreli
Savarkundla, Rajula / 108
KM
Savarkundla:- Shivajinagar, Gokula society,
Khodiyarnagar, Piparwadi, Friends Society, Ambika
society, Shreenagar, Panchwati Society,Manibhai Chock, Greenpark Society,
Jalaram Society.
Rajula:-Nana Ringaliyana, Durlabh Nagar,
Ghanshyamnagar, Govt Colony, Anandnagar Society.
Narayan Mall, Rajula
Babra, Damnagar / 101 KM
Damnagar:-Damnagar Town, Ingorala Road, Station Road, Lathi Road,Thasa Road.
Babra:-Babra Town Area, Amreli Road, Bhavnagar-
Rajkot Highway, Khathariya, Amarapara.
Neelkanth Complex,
Babra
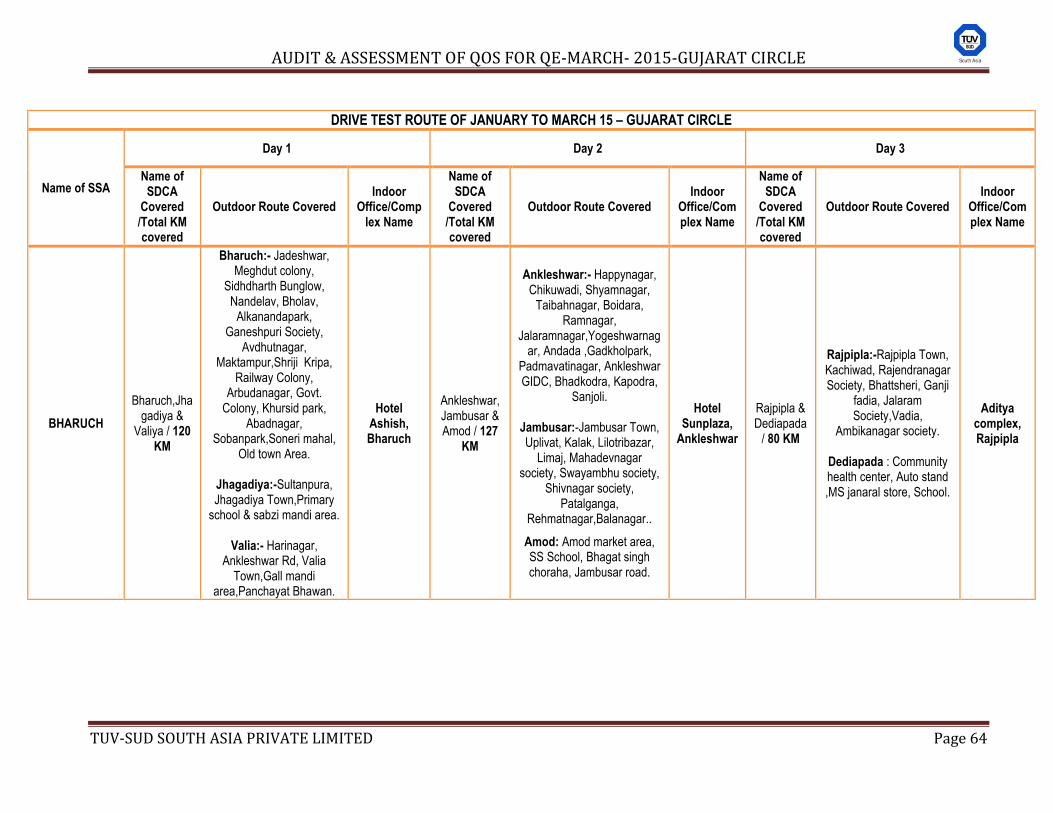
AUDIT & ASSESSMENT OF QOS FOR QE-MARCH- 2015-GUJARAT CIRCLE
TUV-SUD SOUTH ASIA PRIVATE LIMITED Page 64
DRIVE TEST ROUTE OF JANUARY TO MARCH 15 – GUJARAT CIRCLE
Name of SSA
Day 1 Day 2 Day 3
Name of SDCA
Covered /Total KM covered
Outdoor Route Covered Indoor
Office/Complex Name
Name of SDCA
Covered /Total KM covered
Outdoor Route Covered Indoor
Office/Complex Name
Name of SDCA
Covered /Total KM covered
Outdoor Route Covered Indoor
Office/Complex Name
BHARUCH
Bharuch,Jhagadiya &
Valiya / 120 KM
Bharuch:- Jadeshwar, Meghdut colony,
Sidhdharth Bunglow, Nandelav, Bholav,
Alkanandapark, Ganeshpuri Society,
Avdhutnagar, Maktampur,Shriji Kripa,
Railway Colony, Arbudanagar, Govt.
Colony, Khursid park, Abadnagar,
Sobanpark,Soneri mahal, Old town Area.
Jhagadiya:-Sultanpura, Jhagadiya Town,Primary
school & sabzi mandi area.
Valia:- Harinagar, Ankleshwar Rd, Valia
Town,Gall mandi area,Panchayat Bhawan.
Hotel Ashish, Bharuch
Ankleshwar, Jambusar & Amod / 127
KM
Ankleshwar:- Happynagar, Chikuwadi, Shyamnagar,
Taibahnagar, Boidara, Ramnagar,
Jalaramnagar,Yogeshwarnagar, Andada ,Gadkholpark,
Padmavatinagar, Ankleshwar GIDC, Bhadkodra, Kapodra,
Sanjoli.
Jambusar:-Jambusar Town, Uplivat, Kalak, Lilotribazar,
Limaj, Mahadevnagar society, Swayambhu society,
Shivnagar society, Patalganga,
Rehmatnagar,Balanagar..
Amod: Amod market area, SS School, Bhagat singh choraha, Jambusar road.
Hotel Sunplaza,
Ankleshwar
Rajpipla & Dediapada
/ 80 KM
Rajpipla:-Rajpipla Town, Kachiwad, Rajendranagar Society, Bhattsheri, Ganji
fadia, Jalaram Society,Vadia,
Ambikanagar society.
Dediapada : Community health center, Auto stand ,MS janaral store, School.
Aditya complex, Rajpipla
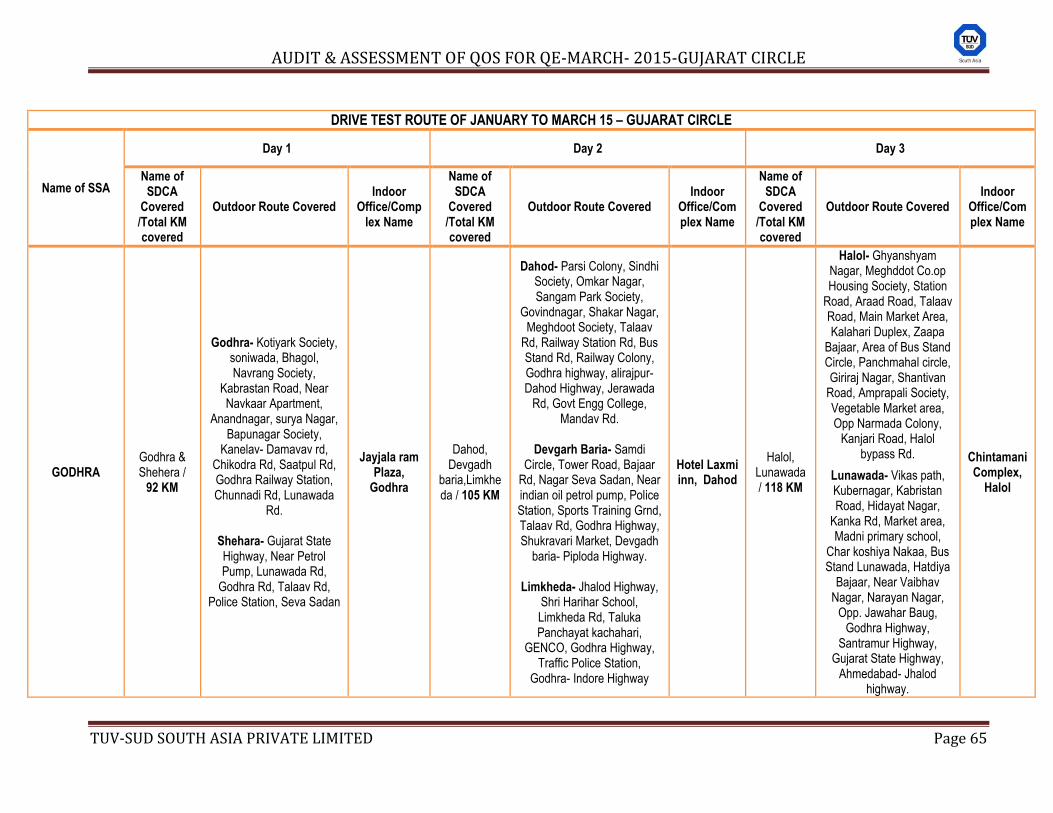
AUDIT & ASSESSMENT OF QOS FOR QE-MARCH- 2015-GUJARAT CIRCLE
TUV-SUD SOUTH ASIA PRIVATE LIMITED Page 65
DRIVE TEST ROUTE OF JANUARY TO MARCH 15 – GUJARAT CIRCLE
Name of SSA
Day 1 Day 2 Day 3
Name of SDCA
Covered /Total KM covered
Outdoor Route Covered Indoor
Office/Complex Name
Name of SDCA
Covered /Total KM covered
Outdoor Route Covered Indoor
Office/Complex Name
Name of SDCA
Covered /Total KM covered
Outdoor Route Covered Indoor
Office/Complex Name
GODHRA Godhra & Shehera /
92 KM
Godhra- Kotiyark Society, soniwada, Bhagol, Navrang Society,
Kabrastan Road, Near Navkaar Apartment,
Anandnagar, surya Nagar, Bapunagar Society,
Kanelav- Damavav rd, Chikodra Rd, Saatpul Rd, Godhra Railway Station, Chunnadi Rd, Lunawada
Rd.
Shehara- Gujarat State Highway, Near Petrol Pump, Lunawada Rd,
Godhra Rd, Talaav Rd, Police Station, Seva Sadan
Jayjala ram Plaza,
Godhra
Dahod, Devgadh
baria,Limkheda / 105 KM
Dahod- Parsi Colony, Sindhi Society, Omkar Nagar, Sangam Park Society,
Govindnagar, Shakar Nagar, Meghdoot Society, Talaav
Rd, Railway Station Rd, Bus Stand Rd, Railway Colony, Godhra highway, alirajpur- Dahod Highway, Jerawada
Rd, Govt Engg College, Mandav Rd.
Devgarh Baria- Samdi
Circle, Tower Road, Bajaar Rd, Nagar Seva Sadan, Near indian oil petrol pump, Police Station, Sports Training Grnd, Talaav Rd, Godhra Highway, Shukravari Market, Devgadh
baria- Piploda Highway.
Limkheda- Jhalod Highway, Shri Harihar School, Limkheda Rd, Taluka Panchayat kachahari,
GENCO, Godhra Highway, Traffic Police Station,
Godhra- Indore Highway
Hotel Laxmi inn, Dahod
Halol, Lunawada / 118 KM
Halol- Ghyanshyam Nagar, Meghddot Co.op Housing Society, Station
Road, Araad Road, Talaav Road, Main Market Area, Kalahari Duplex, Zaapa
Bajaar, Area of Bus Stand Circle, Panchmahal circle, Giriraj Nagar, Shantivan
Road, Amprapali Society, Vegetable Market area, Opp Narmada Colony,
Kanjari Road, Halol bypass Rd.
Lunawada- Vikas path, Kubernagar, Kabristan Road, Hidayat Nagar,
Kanka Rd, Market area, Madni primary school,
Char koshiya Nakaa, Bus Stand Lunawada, Hatdiya
Bajaar, Near Vaibhav Nagar, Narayan Nagar,
Opp. Jawahar Baug, Godhra Highway,
Santramur Highway, Gujarat State Highway,
Ahmedabad- Jhalod highway.
Chintamani Complex,
Halol
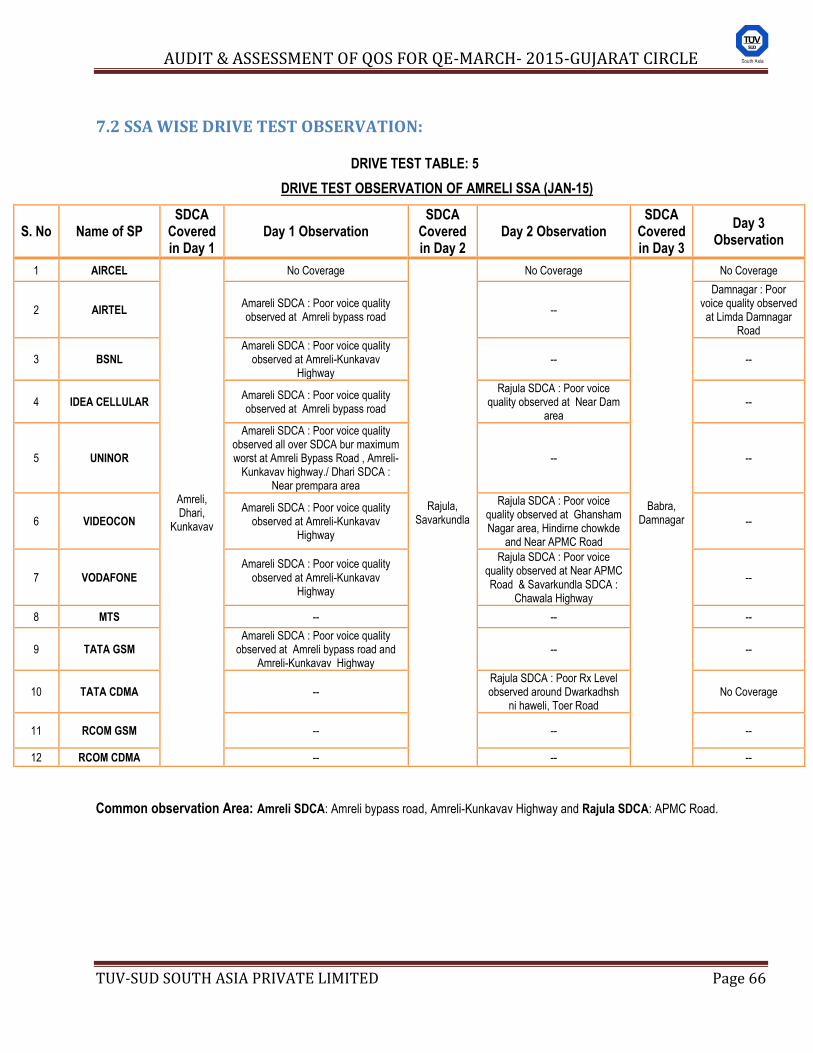
AUDIT & ASSESSMENT OF QOS FOR QE-MARCH- 2015-GUJARAT CIRCLE
TUV-SUD SOUTH ASIA PRIVATE LIMITED Page 66
7.2 SSA WISE DRIVE TEST OBSERVATION:
DRIVE TEST TABLE: 5
DRIVE TEST OBSERVATION OF AMRELI SSA (JAN-15)
S. No Name of SP SDCA
Covered in Day 1
Day 1 Observation SDCA
Covered in Day 2
Day 2 Observation SDCA
Covered in Day 3
Day 3 Observation
1 AIRCEL
Amreli, Dhari,
Kunkavav
No Coverage
Rajula, Savarkundla
No Coverage
Babra, Damnagar
No Coverage
2 AIRTEL Amareli SDCA : Poor voice quality observed at Amreli bypass road
--
Damnagar : Poor voice quality observed at Limda Damnagar
Road
3 BSNL Amareli SDCA : Poor voice quality
observed at Amreli-Kunkavav Highway
-- --
4 IDEA CELLULAR Amareli SDCA : Poor voice quality observed at Amreli bypass road
Rajula SDCA : Poor voice quality observed at Near Dam
area --
5 UNINOR
Amareli SDCA : Poor voice quality observed all over SDCA bur maximum worst at Amreli Bypass Road , Amreli-
Kunkavav highway./ Dhari SDCA : Near prempara area
-- --
6 VIDEOCON Amareli SDCA : Poor voice quality
observed at Amreli-Kunkavav Highway
Rajula SDCA : Poor voice quality observed at Ghansham Nagar area, Hindirne chowkde
and Near APMC Road
--
7 VODAFONE Amareli SDCA : Poor voice quality
observed at Amreli-Kunkavav Highway
Rajula SDCA : Poor voice quality observed at Near APMC Road & Savarkundla SDCA :
Chawala Highway
--
8 MTS -- -- --
9 TATA GSM Amareli SDCA : Poor voice quality
observed at Amreli bypass road and Amreli-Kunkavav Highway
-- --
10 TATA CDMA -- Rajula SDCA : Poor Rx Level observed around Dwarkadhsh
ni haweli, Toer Road No Coverage
11 RCOM GSM -- -- --
12 RCOM CDMA -- -- --
Common observation Area: Amreli SDCA: Amreli bypass road, Amreli-Kunkavav Highway and Rajula SDCA: APMC Road.
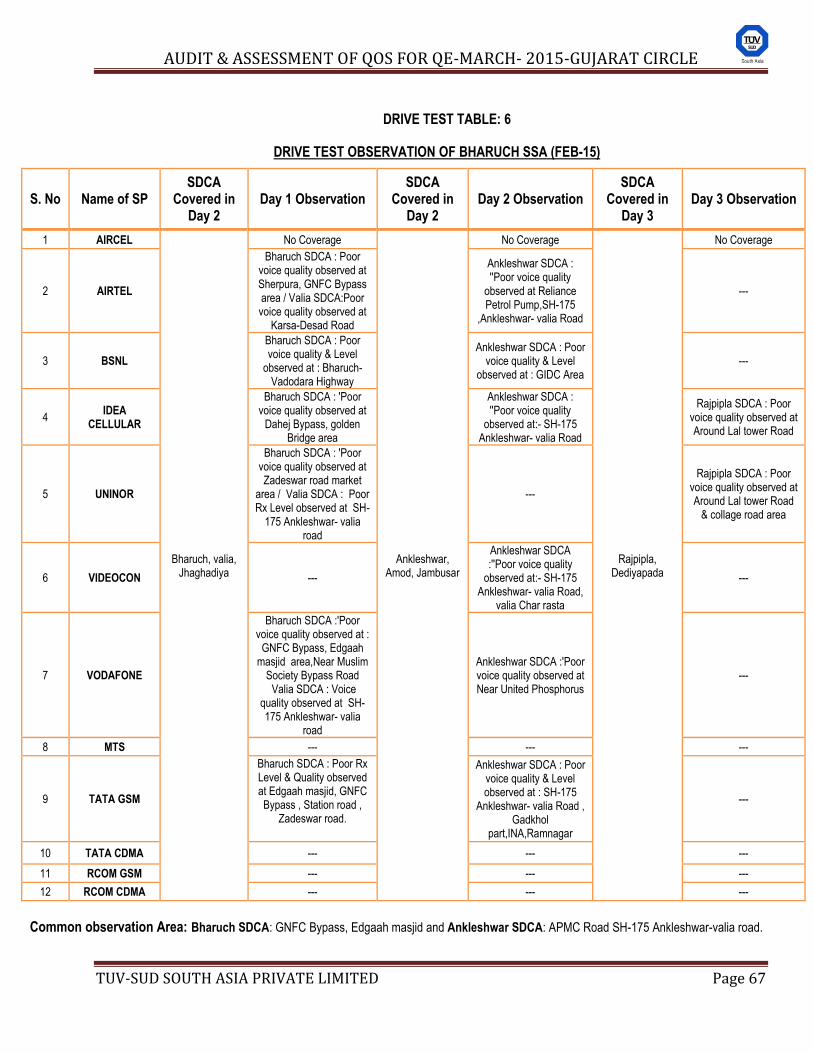
AUDIT & ASSESSMENT OF QOS FOR QE-MARCH- 2015-GUJARAT CIRCLE
TUV-SUD SOUTH ASIA PRIVATE LIMITED Page 67
DRIVE TEST TABLE: 6
DRIVE TEST OBSERVATION OF BHARUCH SSA (FEB-15)
S. No Name of SP SDCA
Covered in Day 2
Day 1 Observation SDCA
Covered in Day 2
Day 2 Observation SDCA
Covered in Day 3
Day 3 Observation
1 AIRCEL
Bharuch, valia, Jhaghadiya
No Coverage
Ankleshwar, Amod, Jambusar
No Coverage
Rajpipla, Dediyapada
No Coverage
2 AIRTEL
Bharuch SDCA : Poor voice quality observed at Sherpura, GNFC Bypass area / Valia SDCA:Poor voice quality observed at
Karsa-Desad Road
Ankleshwar SDCA : ''Poor voice quality
observed at Reliance Petrol Pump,SH-175
,Ankleshwar- valia Road
---
3 BSNL
Bharuch SDCA : Poor voice quality & Level
observed at : Bharuch- Vadodara Highway
Ankleshwar SDCA : Poor voice quality & Level
observed at : GIDC Area ---
4 IDEA
CELLULAR
Bharuch SDCA : 'Poor voice quality observed at
Dahej Bypass, golden Bridge area
Ankleshwar SDCA : ''Poor voice quality
observed at:- SH-175 Ankleshwar- valia Road
Rajpipla SDCA : Poor voice quality observed at Around Lal tower Road
5 UNINOR
Bharuch SDCA : 'Poor voice quality observed at Zadeswar road market
area / Valia SDCA : Poor Rx Level observed at SH-
175 Ankleshwar- valia road
---
Rajpipla SDCA : Poor voice quality observed at Around Lal tower Road
& collage road area
6 VIDEOCON ---
Ankleshwar SDCA :''Poor voice quality
observed at:- SH-175 Ankleshwar- valia Road,
valia Char rasta
---
7 VODAFONE
Bharuch SDCA :'Poor voice quality observed at :
GNFC Bypass, Edgaah masjid area,Near Muslim
Society Bypass Road Valia SDCA : Voice
quality observed at SH-175 Ankleshwar- valia
road
Ankleshwar SDCA :'Poor voice quality observed at Near United Phosphorus
---
8 MTS --- --- ---
9 TATA GSM
Bharuch SDCA : Poor Rx Level & Quality observed at Edgaah masjid, GNFC Bypass , Station road ,
Zadeswar road.
Ankleshwar SDCA : Poor voice quality & Level observed at : SH-175
Ankleshwar- valia Road , Gadkhol
part,INA,Ramnagar
---
10 TATA CDMA --- --- ---
11 RCOM GSM --- --- ---
12 RCOM CDMA --- --- ---
Common observation Area: Bharuch SDCA: GNFC Bypass, Edgaah masjid and Ankleshwar SDCA: APMC Road SH-175 Ankleshwar-valia road.
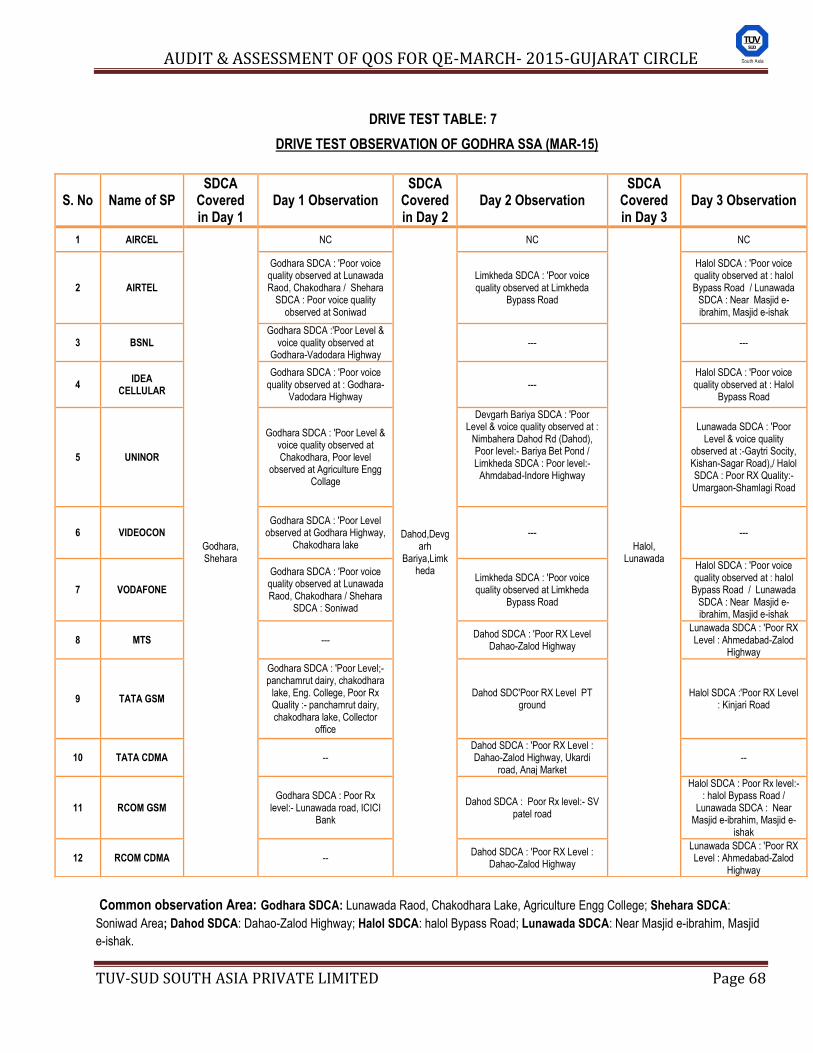
AUDIT & ASSESSMENT OF QOS FOR QE-MARCH- 2015-GUJARAT CIRCLE
TUV-SUD SOUTH ASIA PRIVATE LIMITED Page 68
DRIVE TEST TABLE: 7
DRIVE TEST OBSERVATION OF GODHRA SSA (MAR-15)
Common observation Area: Godhara SDCA: Lunawada Raod, Chakodhara Lake, Agriculture Engg College; Shehara SDCA:
Soniwad Area; Dahod SDCA: Dahao-Zalod Highway; Halol SDCA: halol Bypass Road; Lunawada SDCA: Near Masjid e-ibrahim, Masjid
e-ishak.
S. No Name of SP SDCA
Covered in Day 1
Day 1 Observation SDCA
Covered in Day 2
Day 2 Observation SDCA
Covered in Day 3
Day 3 Observation
1 AIRCEL
Godhara, Shehara
NC
Dahod,Devgarh
Bariya,Limkheda
NC
Halol, Lunawada
NC
2 AIRTEL
Godhara SDCA : 'Poor voice quality observed at Lunawada Raod, Chakodhara / Shehara
SDCA : Poor voice quality observed at Soniwad
Limkheda SDCA : 'Poor voice quality observed at Limkheda
Bypass Road
Halol SDCA : 'Poor voice quality observed at : halol Bypass Road / Lunawada
SDCA : Near Masjid e-ibrahim, Masjid e-ishak
3 BSNL Godhara SDCA :'Poor Level &
voice quality observed at Godhara-Vadodara Highway
--- ---
4 IDEA
CELLULAR
Godhara SDCA : 'Poor voice quality observed at : Godhara-
Vadodara Highway ---
Halol SDCA : 'Poor voice quality observed at : Halol
Bypass Road
5 UNINOR
Godhara SDCA : 'Poor Level & voice quality observed at Chakodhara, Poor level
observed at Agriculture Engg Collage
Devgarh Bariya SDCA : 'Poor Level & voice quality observed at :
Nimbahera Dahod Rd (Dahod), Poor level:- Bariya Bet Pond / Limkheda SDCA : Poor level:-
Ahmdabad-Indore Highway
Lunawada SDCA : 'Poor Level & voice quality
observed at :-Gaytri Socity, Kishan-Sagar Road),/ Halol SDCA : Poor RX Quality:- Umargaon-Shamlagi Road
6 VIDEOCON Godhara SDCA : 'Poor Level
observed at Godhara Highway, Chakodhara lake
--- ---
7 VODAFONE
Godhara SDCA : 'Poor voice quality observed at Lunawada Raod, Chakodhara / Shehara
SDCA : Soniwad
Limkheda SDCA : 'Poor voice quality observed at Limkheda
Bypass Road
Halol SDCA : 'Poor voice quality observed at : halol
Bypass Road / Lunawada SDCA : Near Masjid e-ibrahim, Masjid e-ishak
8 MTS --- Dahod SDCA : 'Poor RX Level
Dahao-Zalod Highway
Lunawada SDCA : 'Poor RX Level : Ahmedabad-Zalod
Highway
9 TATA GSM
Godhara SDCA : 'Poor Level;- panchamrut dairy, chakodhara
lake, Eng. College, Poor Rx Quality :- panchamrut dairy, chakodhara lake, Collector
office
Dahod SDC'Poor RX Level PT ground
Halol SDCA :'Poor RX Level : Kinjari Road
10 TATA CDMA -- Dahod SDCA : 'Poor RX Level : Dahao-Zalod Highway, Ukardi
road, Anaj Market --
11 RCOM GSM Godhara SDCA : Poor Rx
level:- Lunawada road, ICICI Bank
Dahod SDCA : Poor Rx level:- SV patel road
Halol SDCA : Poor Rx level:-: halol Bypass Road /
Lunawada SDCA : Near Masjid e-ibrahim, Masjid e-
ishak
12 RCOM CDMA -- Dahod SDCA : 'Poor RX Level :
Dahao-Zalod Highway
Lunawada SDCA : 'Poor RX Level : Ahmedabad-Zalod
Highway
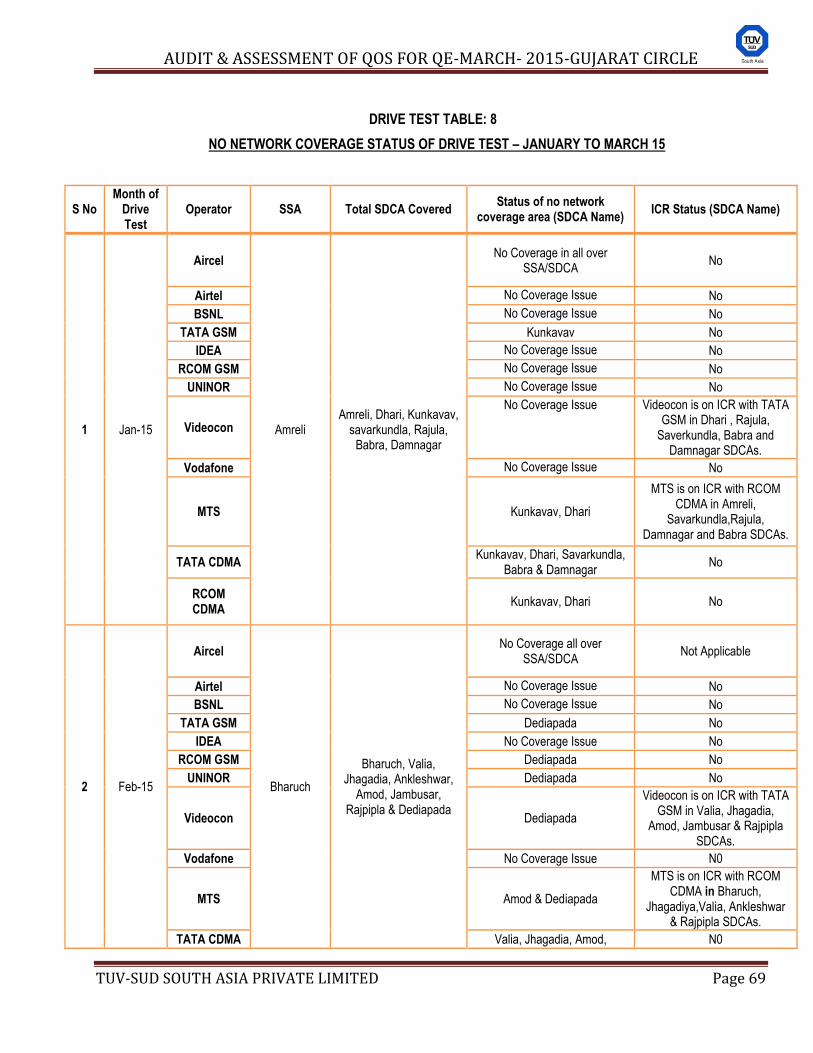
AUDIT & ASSESSMENT OF QOS FOR QE-MARCH- 2015-GUJARAT CIRCLE
TUV-SUD SOUTH ASIA PRIVATE LIMITED Page 69
DRIVE TEST TABLE: 8
NO NETWORK COVERAGE STATUS OF DRIVE TEST – JANUARY TO MARCH 15
S No Month of
Drive Test
Operator SSA Total SDCA Covered Status of no network
coverage area (SDCA Name) ICR Status (SDCA Name)
1 Jan-15
Aircel
Amreli Amreli, Dhari, Kunkavav,
savarkundla, Rajula, Babra, Damnagar
No Coverage in all over SSA/SDCA
No
Airtel No Coverage Issue No
BSNL No Coverage Issue No
TATA GSM Kunkavav No
IDEA No Coverage Issue No
RCOM GSM No Coverage Issue No
UNINOR No Coverage Issue No
Videocon
No Coverage Issue Videocon is on ICR with TATA GSM in Dhari , Rajula,
Saverkundla, Babra and Damnagar SDCAs.
Vodafone No Coverage Issue No
MTS Kunkavav, Dhari
MTS is on ICR with RCOM CDMA in Amreli,
Savarkundla,Rajula, Damnagar and Babra SDCAs.
TATA CDMA Kunkavav, Dhari, Savarkundla,
Babra & Damnagar No
RCOM CDMA
Kunkavav, Dhari No
2 Feb-15
Aircel
Bharuch
Bharuch, Valia, Jhagadia, Ankleshwar,
Amod, Jambusar, Rajpipla & Dediapada
No Coverage all over SSA/SDCA
Not Applicable
Airtel No Coverage Issue No
BSNL No Coverage Issue No
TATA GSM Dediapada No
IDEA No Coverage Issue No
RCOM GSM Dediapada No
UNINOR Dediapada No
Videocon Dediapada
Videocon is on ICR with TATA GSM in Valia, Jhagadia,
Amod, Jambusar & Rajpipla SDCAs.
Vodafone No Coverage Issue N0
MTS Amod & Dediapada
MTS is on ICR with RCOM CDMA in Bharuch,
Jhagadiya,Valia, Ankleshwar & Rajpipla SDCAs.
TATA CDMA Valia, Jhagadia, Amod, N0
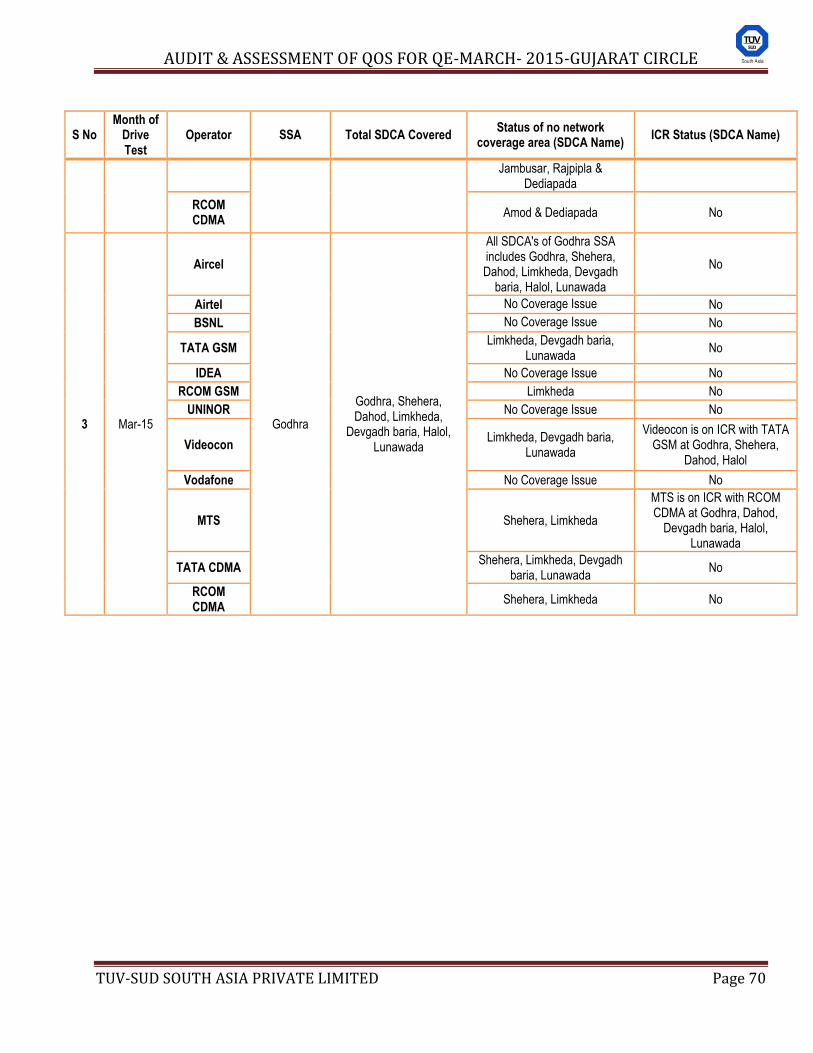
AUDIT & ASSESSMENT OF QOS FOR QE-MARCH- 2015-GUJARAT CIRCLE
TUV-SUD SOUTH ASIA PRIVATE LIMITED Page 70
S No Month of
Drive Test
Operator SSA Total SDCA Covered Status of no network
coverage area (SDCA Name) ICR Status (SDCA Name)
Jambusar, Rajpipla & Dediapada
RCOM CDMA
Amod & Dediapada No
3 Mar-15
Aircel
Godhra
Godhra, Shehera, Dahod, Limkheda,
Devgadh baria, Halol, Lunawada
All SDCA's of Godhra SSA includes Godhra, Shehera, Dahod, Limkheda, Devgadh
baria, Halol, Lunawada
No
Airtel No Coverage Issue No
BSNL No Coverage Issue No
TATA GSM Limkheda, Devgadh baria,
Lunawada No
IDEA No Coverage Issue No
RCOM GSM Limkheda No
UNINOR No Coverage Issue No
Videocon Limkheda, Devgadh baria,
Lunawada
Videocon is on ICR with TATA GSM at Godhra, Shehera,
Dahod, Halol
Vodafone No Coverage Issue No
MTS Shehera, Limkheda
MTS is on ICR with RCOM CDMA at Godhra, Dahod,
Devgadh baria, Halol, Lunawada
TATA CDMA Shehera, Limkheda, Devgadh
baria, Lunawada No
RCOM CDMA
Shehera, Limkheda No
AUDIT & ASSESSMENT OF QOS FOR QE-MARCH- 2015-GUJARAT CIRCLE
TUV-SUD SOUTH ASIA PRIVATE LIMITED Page 71
7.3 KEY FINDINGS ON DRIVE TEST: The key observations that could be derived from the results of the drive tests are as under –
1. January-15 : Amreli SSA
SDCAs covered: Amreli, Dhari, Kunkavav, savarkunda, Rajula, Babra and Damnagar SDCAs (329 Kms). No Coverage: Aircel has no any coverage in Amreli SDCA.
The results of the drive test, carried out across Amreli SSA for all service providers revealed that they were in compliance of benchmarks of all the parameters.
2. February-15: Bharuch SSA
SDCA covered: Bharuch, Jhagadiya, Valiya, Ankleshwar, Jambusar, Amod, Rajpipla and Dediapada SDCAs (327 Kms).
No Coverage: Aircel has no any coverage in Bharuch SDCA
The results of the drive test, carried out across Bharuch SSA for all service providers revealed that they were largely in
compliance of benchmarks for all the parameters on over all SSA level.
March-15: Godhara SSA
SDCA Covered: Godhara, Shehara, Dahod, Devgadhbaria, Limkheda, Halol and Lunawal (315 Kms).
No coverage: Aircel has no any coverage in Godhara SSA.
The results of the drive test, carried out in Godhara SSA also revealed that the operators were doing well with regard to
compliance of the TRAI norms as all operators met the benchmarks of network parameters.
The drive test results suggest satisfactory working of the network of the service providers in all the SSAs where drive was
conducted during the quarter. However, deficiencies with respect to adequate coverage and good voice quality, encountered
by different Service providers at the various places shown in the drive tests plots, are detailed in the above table.-5, table-6
and table-7 for the respective SSAs.
The detail of Network coverage and Intra Circle Roaming (ICR) status of different service providers at various locations in the three SSAs is given in table-8.
AUDIT & ASSESSMENT OF QOS FOR QE-MARCH- 2015-GUJARAT CIRCLE
TUV-SUD SOUTH ASIA PRIVATE LIMITED Page 72
8. GRAPHICAL REPRESENTATION (CELLULAR MOBILE SERVICE PROVIDERS)
AVERAGED QUARTERLY PMR
V/S
AVERAGED QUARTERLY 3-DAYs LIVE MEASURMENT
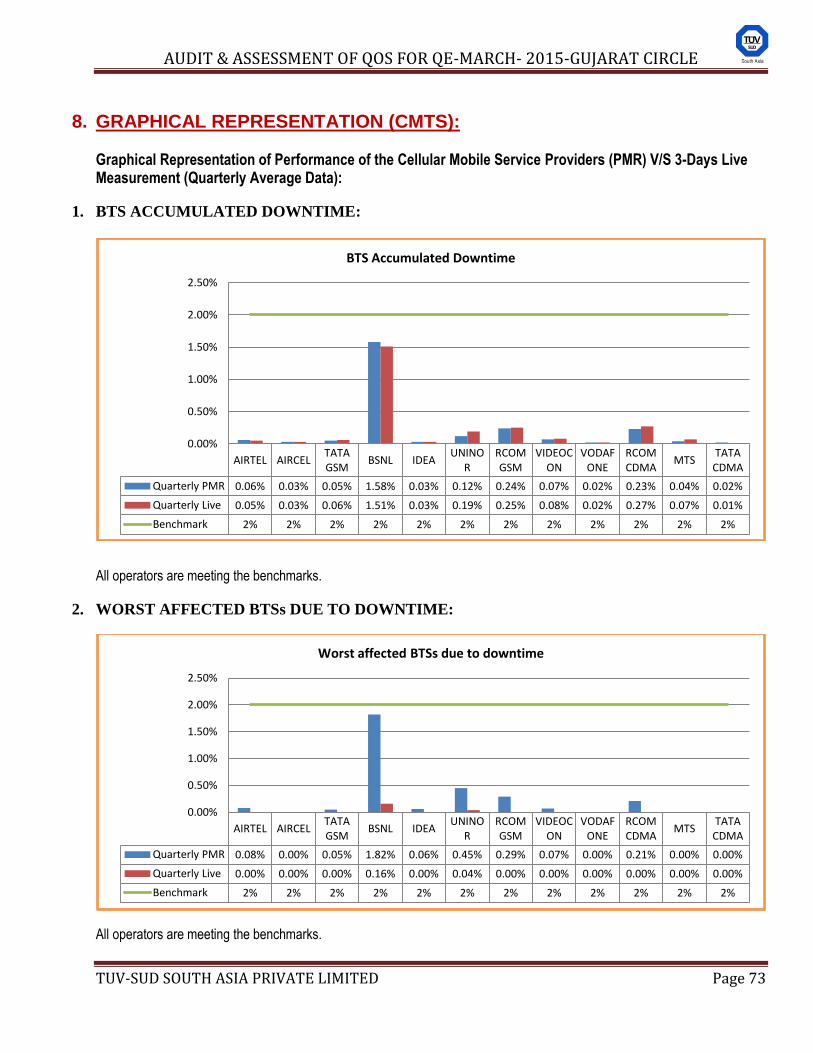
AUDIT & ASSESSMENT OF QOS FOR QE-MARCH- 2015-GUJARAT CIRCLE
TUV-SUD SOUTH ASIA PRIVATE LIMITED Page 73
8. GRAPHICAL REPRESENTATION (CMTS):
Graphical Representation of Performance of the Cellular Mobile Service Providers (PMR) V/S 3-Days Live Measurement (Quarterly Average Data):
1. BTS ACCUMULATED DOWNTIME:
All operators are meeting the benchmarks.
2. WORST AFFECTED BTSs DUE TO DOWNTIME:
All operators are meeting the benchmarks.
AIRTEL AIRCEL TATA GSM
BSNL IDEA UNINO
R RCOM GSM
VIDEOCON
VODAFONE
RCOM CDMA
MTS TATA
CDMA
Quarterly PMR 0.06% 0.03% 0.05% 1.58% 0.03% 0.12% 0.24% 0.07% 0.02% 0.23% 0.04% 0.02%
Quarterly Live 0.05% 0.03% 0.06% 1.51% 0.03% 0.19% 0.25% 0.08% 0.02% 0.27% 0.07% 0.01%
Benchmark 2% 2% 2% 2% 2% 2% 2% 2% 2% 2% 2% 2%
0.00%
0.50%
1.00%
1.50%
2.00%
2.50%
BTS Accumulated Downtime
AIRTEL AIRCEL TATA GSM
BSNL IDEA UNINO
R RCOM GSM
VIDEOCON
VODAFONE
RCOM CDMA
MTS TATA
CDMA
Quarterly PMR 0.08% 0.00% 0.05% 1.82% 0.06% 0.45% 0.29% 0.07% 0.00% 0.21% 0.00% 0.00%
Quarterly Live 0.00% 0.00% 0.00% 0.16% 0.00% 0.04% 0.00% 0.00% 0.00% 0.00% 0.00% 0.00%
Benchmark 2% 2% 2% 2% 2% 2% 2% 2% 2% 2% 2% 2%
0.00%
0.50%
1.00%
1.50%
2.00%
2.50%
Worst affected BTSs due to downtime
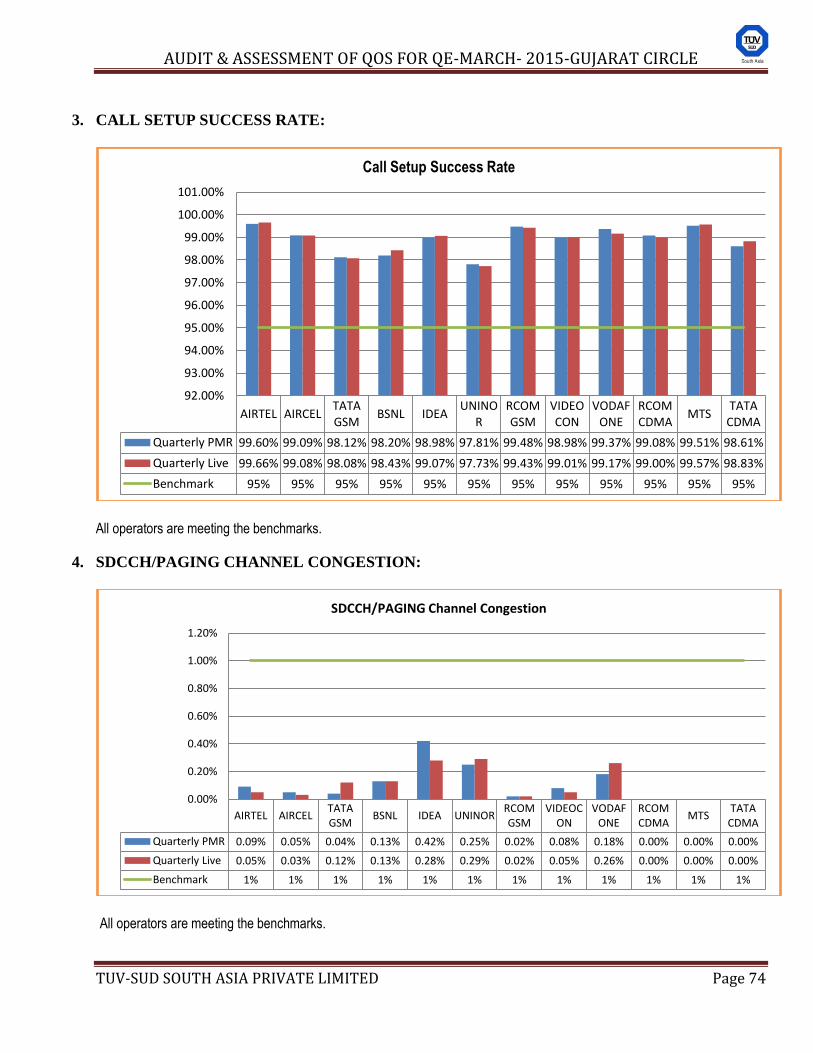
AUDIT & ASSESSMENT OF QOS FOR QE-MARCH- 2015-GUJARAT CIRCLE
TUV-SUD SOUTH ASIA PRIVATE LIMITED Page 74
3. CALL SETUP SUCCESS RATE:
All operators are meeting the benchmarks.
4. SDCCH/PAGING CHANNEL CONGESTION:
All operators are meeting the benchmarks.
AIRTEL AIRCEL TATA GSM
BSNL IDEA UNINO
R RCOM GSM
VIDEOCON
VODAFONE
RCOM CDMA
MTS TATA
CDMA
Quarterly PMR 99.60% 99.09% 98.12% 98.20% 98.98% 97.81% 99.48% 98.98% 99.37% 99.08% 99.51% 98.61%
Quarterly Live 99.66% 99.08% 98.08% 98.43% 99.07% 97.73% 99.43% 99.01% 99.17% 99.00% 99.57% 98.83%
Benchmark 95% 95% 95% 95% 95% 95% 95% 95% 95% 95% 95% 95%
92.00%
93.00%
94.00%
95.00%
96.00%
97.00%
98.00%
99.00%
100.00%
101.00%
Call Setup Success Rate
AIRTEL AIRCEL TATA GSM
BSNL IDEA UNINOR RCOM GSM
VIDEOCON
VODAFONE
RCOM CDMA
MTS TATA
CDMA
Quarterly PMR 0.09% 0.05% 0.04% 0.13% 0.42% 0.25% 0.02% 0.08% 0.18% 0.00% 0.00% 0.00%
Quarterly Live 0.05% 0.03% 0.12% 0.13% 0.28% 0.29% 0.02% 0.05% 0.26% 0.00% 0.00% 0.00%
Benchmark 1% 1% 1% 1% 1% 1% 1% 1% 1% 1% 1% 1%
0.00%
0.20%
0.40%
0.60%
0.80%
1.00%
1.20%
SDCCH/PAGING Channel Congestion
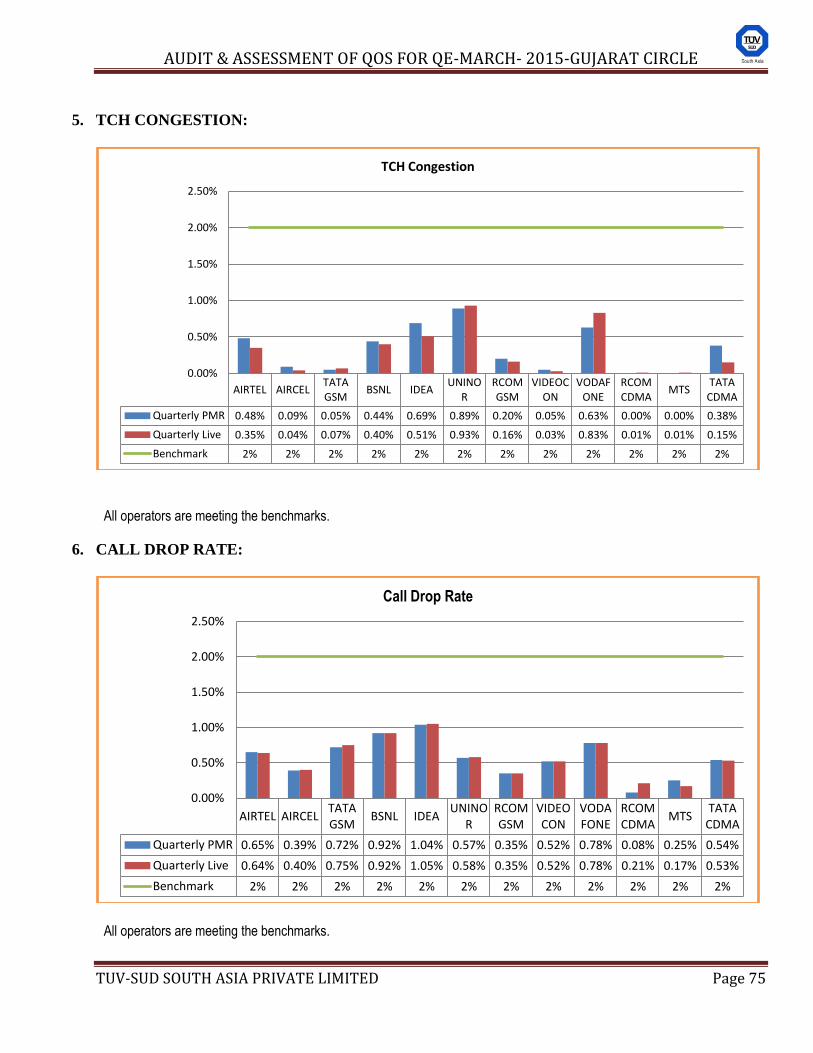
AUDIT & ASSESSMENT OF QOS FOR QE-MARCH- 2015-GUJARAT CIRCLE
TUV-SUD SOUTH ASIA PRIVATE LIMITED Page 75
5. TCH CONGESTION:
All operators are meeting the benchmarks.
6. CALL DROP RATE:
All operators are meeting the benchmarks.
AIRTEL AIRCEL TATA GSM
BSNL IDEA UNINO
R RCOM GSM
VIDEOCON
VODAFONE
RCOM CDMA
MTS TATA
CDMA
Quarterly PMR 0.48% 0.09% 0.05% 0.44% 0.69% 0.89% 0.20% 0.05% 0.63% 0.00% 0.00% 0.38%
Quarterly Live 0.35% 0.04% 0.07% 0.40% 0.51% 0.93% 0.16% 0.03% 0.83% 0.01% 0.01% 0.15%
Benchmark 2% 2% 2% 2% 2% 2% 2% 2% 2% 2% 2% 2%
0.00%
0.50%
1.00%
1.50%
2.00%
2.50%
TCH Congestion
AIRTEL AIRCEL TATA GSM
BSNL IDEA UNINO
R RCOM GSM
VIDEOCON
VODAFONE
RCOM CDMA
MTS TATA
CDMA
Quarterly PMR 0.65% 0.39% 0.72% 0.92% 1.04% 0.57% 0.35% 0.52% 0.78% 0.08% 0.25% 0.54%
Quarterly Live 0.64% 0.40% 0.75% 0.92% 1.05% 0.58% 0.35% 0.52% 0.78% 0.21% 0.17% 0.53%
Benchmark 2% 2% 2% 2% 2% 2% 2% 2% 2% 2% 2% 2%
0.00%
0.50%
1.00%
1.50%
2.00%
2.50%
Call Drop Rate
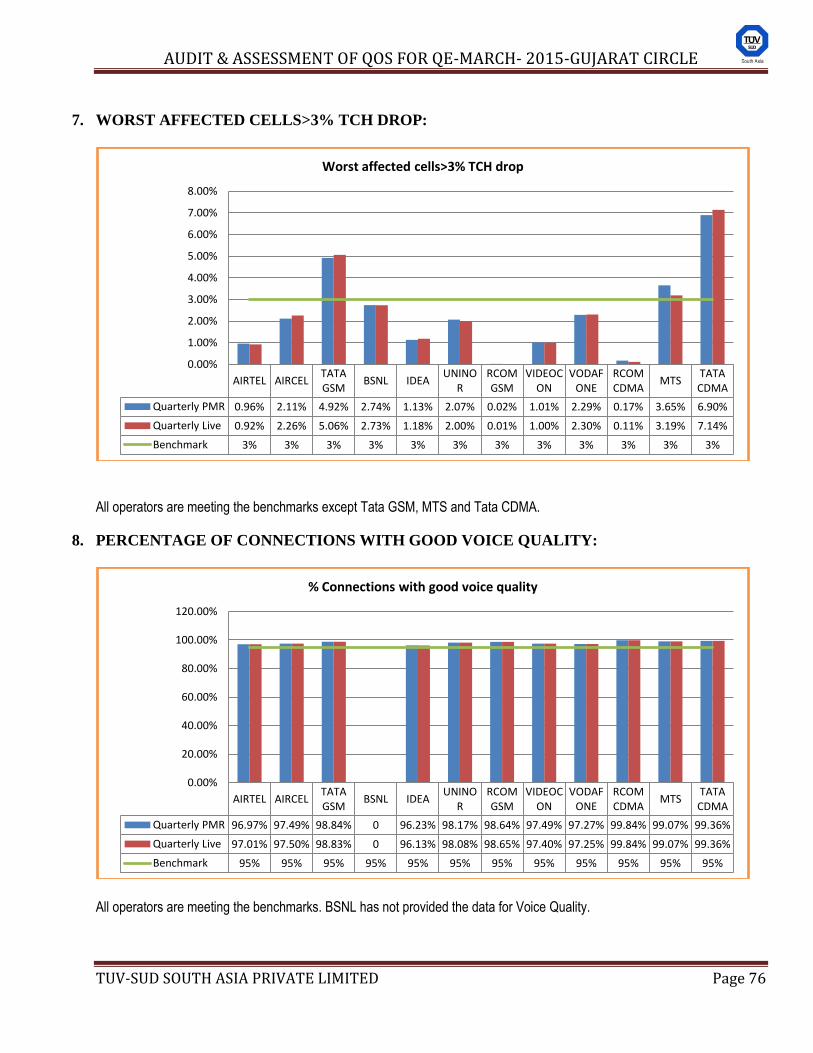
AUDIT & ASSESSMENT OF QOS FOR QE-MARCH- 2015-GUJARAT CIRCLE
TUV-SUD SOUTH ASIA PRIVATE LIMITED Page 76
7. WORST AFFECTED CELLS>3% TCH DROP:
All operators are meeting the benchmarks except Tata GSM, MTS and Tata CDMA.
8. PERCENTAGE OF CONNECTIONS WITH GOOD VOICE QUALITY:
All operators are meeting the benchmarks. BSNL has not provided the data for Voice Quality.
AIRTEL AIRCEL TATA GSM
BSNL IDEA UNINO
R RCOM GSM
VIDEOCON
VODAFONE
RCOM CDMA
MTS TATA CDMA
Quarterly PMR 0.96% 2.11% 4.92% 2.74% 1.13% 2.07% 0.02% 1.01% 2.29% 0.17% 3.65% 6.90%
Quarterly Live 0.92% 2.26% 5.06% 2.73% 1.18% 2.00% 0.01% 1.00% 2.30% 0.11% 3.19% 7.14%
Benchmark 3% 3% 3% 3% 3% 3% 3% 3% 3% 3% 3% 3%
0.00%
1.00%
2.00%
3.00%
4.00%
5.00%
6.00%
7.00%
8.00%
Worst affected cells>3% TCH drop
AIRTEL AIRCEL TATA GSM
BSNL IDEA UNINO
R RCOM GSM
VIDEOCON
VODAFONE
RCOM CDMA
MTS TATA CDMA
Quarterly PMR 96.97% 97.49% 98.84% 0 96.23% 98.17% 98.64% 97.49% 97.27% 99.84% 99.07% 99.36%
Quarterly Live 97.01% 97.50% 98.83% 0 96.13% 98.08% 98.65% 97.40% 97.25% 99.84% 99.07% 99.36%
Benchmark 95% 95% 95% 95% 95% 95% 95% 95% 95% 95% 95% 95%
0.00%
20.00%
40.00%
60.00%
80.00%
100.00%
120.00%
% Connections with good voice quality


![Demistyfing equity-focused evaluations [EFE] Marco Segone, UNICEF Evaluation Office Anne-Claire Luzot, M&E Regional Advisor, UNICEF CEECIS EO is developing](https://img.pdfslide.us/doc/110x75/56649cd85503460f949a0fa7/demistyfing-equity-focused-evaluations-efe-marco-segone-unicef-evaluation.jpg)