Embed Size (px)
Citation preview
AUDIT & ASSESSMENT OF QOS FOR QE-MARCH-2015-RAJASTHAN CIRCLE
TUV-SUD SOUTH ASIA PRIVATE LIMITED Page 1
Audit & Assessment of Quality of Service
Of
Cellular Mobile Telephone Service
For
Telecom Regulatory Authority Of India
North Zone – Rajasthan Service Area
(January 2015 – March 2015)
UNICEF Lucknow Office
Prepared by:-
TÜV SÜD SOUTH ASIA PVT. LTD,
C-153/1, Okhla Industrial Estate,
Phase-1, New Delhi – 110020
Telephone 011- 30889611
Fax: 011-30889595
AUDIT & ASSESSMENT OF QOS FOR QE-MARCH-2015-RAJASTHAN CIRCLE
TUV-SUD SOUTH ASIA PRIVATE LIMITED Page 2
PREFACE
The Telecom Regulatory Authority of India (TRAI) was established in 1997 by an Act of Parliament, called the Telecom
Regulatory Authority of India Act, 1997, to regulate telecom services. The Authority‟s mission is to ensure that the interest
of consumers are protected and at the same time to nurture conditions for growth of telecommunications, broadcasting and
cable services in a manner and at a pace which will enable India to play a leading role in emerging global information
society.
The Authority, in exercise of its functions as per the provisions in the TRAI Act, has been entrusted to measure the Quality
of Service provided by the Service Providers from time to time and to compare them with the benchmarks so as to assess
the level of performance. In pursuance of this, TRAI has appointed M/s TUV-SUD South Asia Pvt. Ltd. to carry out “Audit
and Assessment of Quality of Service” provided by Basic (Wire line), Cellular Mobile and Broadband service providers in
terms of the benchmarks specified in the respective regulations, in North and West Zones.
TUV-SUD South Asia carried out QoS audit as per the norms of TRAI in all the eight circles / services areas of the North
Zone and four circles of the West Zone. This report details the performance of the various service providers in Rajasthan
circle against the QoS bench marks laid down by TRAI in the respective regulations.
AUDIT & ASSESSMENT OF QOS FOR QE-MARCH-2015-RAJASTHAN CIRCLE
TUV-SUD SOUTH ASIA PRIVATE LIMITED Page 3
Table of Contents
1. BACKGROUND ............................................................................................................................ 6
2. OBJECTIVES AND METHODOLOGY ....................................................................................... 9
3. SAMPLE SIZE ............................................................................................................................. 11
3.1 SAMPLING FOR CELLULAR MOBILE (WIRELESS) SERVICE PROVIDERS ................. 11
3.2 SAMPLING FOR BASIC (WIRE LINE) SERVICES ............................................................... 12
3.3 SAMPLING FOR BROADBAND SERVICE PROVIDERS .................................................... 12
4. EXECUTIVE SUMMARY .......................................................................................................... 14
5. PMR AUDIT REPORTS: ............................................................................................................. 17
5.1 MONTHLY PMR: ...................................................................................................................... 17
5.1.1 BUSY HOUR OF VARIOUS SERVICE PROVIDERS: .................................................... 17
5.1.2 SWITCHES/BSC/BTS DETAILS OF SERVICE PROVIDERS: ....................................... 17
5.1.3 QOS PERFORMANCE OF MONTHLY PMR – JANUARY-15 MONTH: ...................... 18
5.1.4 QOS PERFORMANCE OF MONTHLY PMR – FEBRUARY 15 MONTH: ................... 19
5.1.5 QOS PERFORMANCE OF MONTHLY PMR – MARCH- 15 MONTH: ......................... 20
5.1.6 QOS PERFORMANCE OF QUARTERLY PMR –AVERAGE OF QE- MARCH- 15
(JANUARY-15 TO MARCH- 2015 MONTHS AUDITED DATA) ........................................... 21
5.1.7 KEY FINDINGS ON MONTHLY PMR AUDIT REPORTS: ........................................... 22
5.2 LIVE MEASUREMENT DATA (3-DAYS) FOR CELLULAR MOBILE SERVICE
PROVIDERS (NETWORK SERVICE QUALITY PARAMETER): .............................................. 25
5.2.1 LIVE MEASURMENT DATA (3-DAYS) – JANUARY 15 MONTH: ............................. 25
5.2.2 LIVE MEASURMENT DATA (3-DAYS) – FEBRUARY 15 MONTH: .......................... 26
5.2.3 LIVE MEASURMENT DATA (3-DAYS) – MARCH- 15 MONTH: ................................ 27
5.2.4 QUARTERLY QOS PERFORMANCE OF 3-DAYS LIVE MEASUREMENT AUDITED
DATA (AVERAGE OF JANUARY 2015 TO MARCH 2015) ................................................... 28
5.2.5 KEY FINDING ON 3 DAYS LIVE MEASUREMENTS: ................................................. 28
5.2.6 DETAILED NETWORK DATA ASSESSMENT OF CELLULAR MOBILE
TELEPHONE SERVICES: .......................................................................................................... 29
5.3 CUSTOMER SERVICE QUALITY PARAMETERS MEASUREMENT FOR CMTS-QE-
MARCH-15: ..................................................................................................................................... 36
5.3.1 QUARTERLY CUSTOMER SERVICE DELIVERY (CSD) AUDITED DATA FOR
CELLULAR MOBILE SERVICES (JANUARY TO MARCH 2015 MONTHS AUDITED
DATA): ......................................................................................................................................... 36
5.3.2 3 DAYS LIVE CSD AUDITED DATA FOR CELLULAR MOBILE SERVICES (QE –
MARCH -2015): ........................................................................................................................... 39
KEY FINDINGS: CUSTOMER SERVICE DELIVERY PARAMETERS ................................. 40
6. LIVE CALLING ASSESSMENT: ............................................................................................... 42
AUDIT & ASSESSMENT OF QOS FOR QE-MARCH-2015-RAJASTHAN CIRCLE
TUV-SUD SOUTH ASIA PRIVATE LIMITED Page 4
6.1 INTER OPERATOR CALLS ASSESSMENT: ......................................................................... 42
6.2 CUSTOMER CARE / HELPLINE ASSESSMENT: ................................................................. 43
6.3 LIVE CALLING ASSESSMENT FOR BILLING COMPLIANTS: ......................................... 43
6.4 LEVEL -1 CALLING ASSESSMENT: ..................................................................................... 44
7. OPERATOR ASSESTID DRIVE TEST ...................................................................................... 46
7.1 DETAIL OF THE ROUTES COVERED DURING THE DRIVE TESTS: .............................. 56
7.2 SSA WISE DRIVE TEST OBSERVATION: ............................................................................ 59
7.3 KEY FINDINGS ON DRIVE TEST: ......................................................................................... 65
8. GRAPHICAL REPRESENTATION (CMTS): ............................................................................ 67
AUDIT & ASSESSMENT OF QOS FOR QE-MARCH-2015-RAJASTHAN CIRCLE
TUV-SUD SOUTH ASIA PRIVATE LIMITED Page 5
1. BACKGROUND
AUDIT & ASSESSMENT OF QOS FOR QE-MARCH-2015-RAJASTHAN CIRCLE
TUV-SUD SOUTH ASIA PRIVATE LIMITED Page 6
1. BACKGROUND
Telecom Regulatory Authority of India has been entrusted to “lay down the standards of quality of service to be
provided by the service providers and ensure the quality of service and conduct the periodical survey of such
service provided by the service providers so as to protect interest of the consumers of telecommunication
services” vide sub-clause (v) of clause (b) of sub-section (1) of section 11 of the Telecom Regulatory Authority of
India Act, 1997 (24 of 1997).
The purpose of laying down Quality of Service Parameters is to:
i) Create conditions for consumer satisfaction by making known the quality of service, which the Service provider
is required to provide, and the user has a right to expect.
ii) Measure the Quality of Service provided by the Service Providers from time to time and to compare them
with the norms so as to assess the level of performance.
iii) Generally protect the interests of consumers of telecommunication services.
TRAI, the regulatory watch dog for the Quality of Service for the telecom services – Basic (Wire line), Cellular
Mobile (Wireless) and Broadband has commissioned M/s TUV-SUD South Asia Pvt. Ltd. for conducting audit
and assessment of quality of service of service providers, in terms of the benchmarks specified in the “The
Standards of Quality of Service of Basic Telephone Service (Wire line) and Cellular Mobile Telephone Service
Regulations, 2009 (7 of 2009) dated 20th March, 2009 and the Quality of Service of Broadband Service
Regulations, 2006 (11 of 2006) dated 6thOctober, 2006 on zonal basis for North Zone and West Zone
comprising of the following Telecom Circles/Metro Service Areas:
North Zone: Delhi, Jammu & Kashmir, Himachal Pradesh, Punjab, Haryana, Rajasthan, Uttar Pradesh-East and
Uttar Pradesh-West (including Uttarakhand). For the cellular mobile telephone service the service area of Delhi
includes Ghaziabad, Faridabad, Noida and Gurgaon.
West Zone: Mumbai, Maharashtra (including Goa and excluding Mumbai), Gujarat and Madhya Pradesh
(including Chhattisgarh).
AUDIT & ASSESSMENT OF QOS FOR QE-MARCH-2015-RAJASTHAN CIRCLE
TUV-SUD SOUTH ASIA PRIVATE LIMITED Page 7
The Audit exercise would assess the Quality of Service of telecom operators providing Basic (Wire line), Cellular
Mobile (Wireless) and Broadband services by auditing the relevant QoS records maintained by the operators,
conducting drive tests as well as live measurements and comparing them with quality of service benchmarks
stipulated by TRAI. The audit would be carried out by TUV-SUD South Asia every quarter across all the
Circles/Service areas of North and West Zones for Cellular Mobile Service. However, in respect of Basic
telephone service (wire line) and Broadband service, a circle would be audited once in a year.
AUDIT & ASSESSMENT OF QOS FOR QE-MARCH-2015-RAJASTHAN CIRCLE
TUV-SUD SOUTH ASIA PRIVATE LIMITED Page 8
2. OBJECTIVES AND METHODOLOGY
AUDIT & ASSESSMENT OF QOS FOR QE-MARCH-2015-RAJASTHAN CIRCLE
TUV-SUD SOUTH ASIA PRIVATE LIMITED Page 9
2. OBJECTIVES AND METHODOLOGY
The primary objective is to audit and assess the Quality of Service being rendered by Basic, Cellular Mobile
& Broadband service providers against the parameters notified by TRAI. The audit and assessment of Quality of Service was carried out by TUV SUD South Asia across all the
Circles/Service areas of North and West Zones for Cellular Mobile Service. Apart from this, QoS audit for
Basic (Wire line) and Broadband Services was also undertaken for Himanchal Pradesh, J&K and
Maharashtra & Goa circles during the quarter January 2015 – March 2015.
The Scope of work as per the Terms of Reference (TOR) includes the following:
i) Preparation of Performance Monitoring reports (PMRs) and uploading in the system.
ii) Live measurements of the performance of Service Providers (SPs) against the benchmarks for three
days during each audit.
iii) Monthly audit based on one month data of the SPs.
iv) Drive test of the RF networks.
v) Audit of the performance of call centers with respect to their accessibility and percentage of calls
answered by the operators and random customer feedback by calling the customers to get feedback
of the services provided by the service providers.
vi) Transfer of data generated by the RF drive test/Live measurements / PMR/ monthly audit to the
server located at TRAI premises on real time basis.
AUDIT & ASSESSMENT OF QOS FOR QE-MARCH-2015-RAJASTHAN CIRCLE
TUV-SUD SOUTH ASIA PRIVATE LIMITED Page 10
3. SAMPLE SIZE
AUDIT & ASSESSMENT OF QOS FOR QE-MARCH-2015-RAJASTHAN CIRCLE
TUV-SUD SOUTH ASIA PRIVATE LIMITED Page 11
3. SAMPLE SIZE 3.1 SAMPLING FOR CELLULAR MOBILE (WIRELESS) SERVICE PROVIDERS
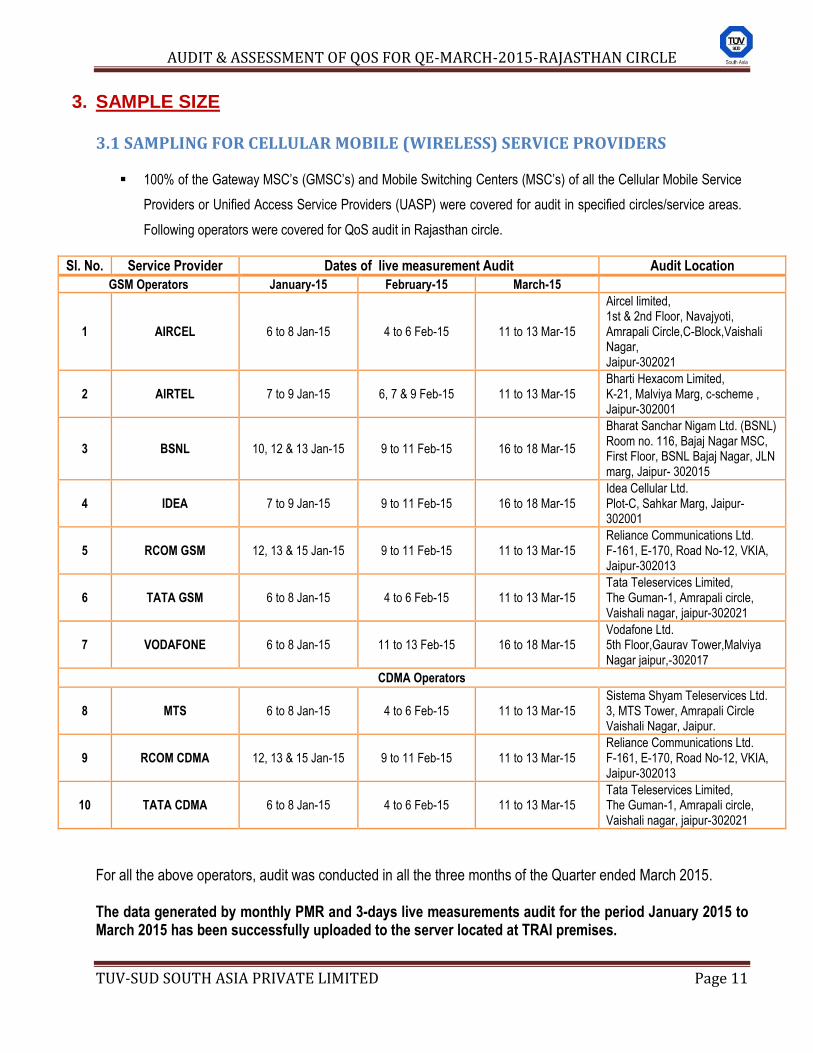
100% of the Gateway MSC‟s (GMSC‟s) and Mobile Switching Centers (MSC‟s) of all the Cellular Mobile Service
Providers or Unified Access Service Providers (UASP) were covered for audit in specified circles/service areas.
Following operators were covered for QoS audit in Rajasthan circle.
Sl. No. Service Provider Dates of live measurement Audit Audit Location
GSM Operators January-15 February-15 March-15
1 AIRCEL 6 to 8 Jan-15 4 to 6 Feb-15 11 to 13 Mar-15
Aircel limited, 1st & 2nd Floor, Navajyoti, Amrapali Circle,C-Block,Vaishali Nagar, Jaipur-302021
2 AIRTEL 7 to 9 Jan-15 6, 7 & 9 Feb-15 11 to 13 Mar-15 Bharti Hexacom Limited, K-21, Malviya Marg, c-scheme , Jaipur-302001
3 BSNL 10, 12 & 13 Jan-15 9 to 11 Feb-15 16 to 18 Mar-15
Bharat Sanchar Nigam Ltd. (BSNL) Room no. 116, Bajaj Nagar MSC, First Floor, BSNL Bajaj Nagar, JLN marg, Jaipur- 302015
4 IDEA 7 to 9 Jan-15 9 to 11 Feb-15 16 to 18 Mar-15 Idea Cellular Ltd. Plot-C, Sahkar Marg, Jaipur- 302001
5 RCOM GSM 12, 13 & 15 Jan-15 9 to 11 Feb-15 11 to 13 Mar-15 Reliance Communications Ltd. F-161, E-170, Road No-12, VKIA, Jaipur-302013
6 TATA GSM 6 to 8 Jan-15 4 to 6 Feb-15 11 to 13 Mar-15 Tata Teleservices Limited, The Guman-1, Amrapali circle, Vaishali nagar, jaipur-302021
7 VODAFONE 6 to 8 Jan-15 11 to 13 Feb-15 16 to 18 Mar-15 Vodafone Ltd. 5th Floor,Gaurav Tower,Malviya Nagar jaipur,-302017
CDMA Operators
8 MTS 6 to 8 Jan-15 4 to 6 Feb-15 11 to 13 Mar-15 Sistema Shyam Teleservices Ltd. 3, MTS Tower, Amrapali Circle Vaishali Nagar, Jaipur.
9 RCOM CDMA 12, 13 & 15 Jan-15 9 to 11 Feb-15 11 to 13 Mar-15 Reliance Communications Ltd. F-161, E-170, Road No-12, VKIA, Jaipur-302013
10 TATA CDMA 6 to 8 Jan-15 4 to 6 Feb-15 11 to 13 Mar-15 Tata Teleservices Limited, The Guman-1, Amrapali circle, Vaishali nagar, jaipur-302021
For all the above operators, audit was conducted in all the three months of the Quarter ended March 2015. The data generated by monthly PMR and 3-days live measurements audit for the period January 2015 to March 2015 has been successfully uploaded to the server located at TRAI premises.
AUDIT & ASSESSMENT OF QOS FOR QE-MARCH-2015-RAJASTHAN CIRCLE
TUV-SUD SOUTH ASIA PRIVATE LIMITED Page 12
3.2 SAMPLING FOR BASIC (WIRE LINE) SERVICES
The QoS audit for basic (wire line) service is to be done for the number of exchanges spread over in about 10%
of SDCAs with each service providers in specified circles once in a year. Based on this criterion, QoS audit
for basic (wire line) service was not required to be done for Rajasthan Circle in the quarter ended March-
2015.
3.3 SAMPLING FOR BROADBAND SERVICE PROVIDERS
TUV–SUD South Asia has to conduct the audit and assessment of Quality of Service of Broadband Service only
in respect of the service providers who are having broadband subscriber base of more than 10,000 subscribers
in their licensed service area, for 5% of Point of Presence (PoPs) spread over in 10% SDCAs in specified
Telecom Circle once in a year. Based on this criterion, the QoS audit for Broadband service was not
required to be done for Rajasthan Circle in the quarter ended March- 2015.
.
AUDIT & ASSESSMENT OF QOS FOR QE-MARCH-2015-RAJASTHAN CIRCLE
TUV-SUD SOUTH ASIA PRIVATE LIMITED Page 13
4. EXECUTIVE SUMMARY
AUDIT & ASSESSMENT OF QOS FOR QE-MARCH-2015-RAJASTHAN CIRCLE
TUV-SUD SOUTH ASIA PRIVATE LIMITED Page 14
4. EXECUTIVE SUMMARY The executive summary put in a nutshell the key findings of the Audit by providing: -
“Service provider performance report” for Cellular mobile, Basic (wire line) and Broadband services , which gives a
foretaste of the performance of various operators against the benchmark specified by TRAI, during the months in which the
Audit was carried out by TUV-SUD Auditors.
“Parameter wise critical findings” for Cellular mobile, Basic (wire line) and Broadband services: This indicates key
observations and findings from different activities carried out during the Audit process.
TUV-SUD conducted audit involved a 3 stage verification process which consisted of auditing the records of the service
providers and verifying the data submitted to TRAI. The second step involved a three day live measurement of all the
network parameters. On the basis of the three days live measurement, the auditors checked the busy hour of the day for
the service provider and collected the data for this busy hour for the month in which the audit was conducted Finally, the
performance of the service providers was also gauged by conducting drive tests in three select SSAs per service provider
per quarter.
The three stage audit / verification viz audit of the records, live measurements and drive tests of all the cellular mobile
operators was repeated every month. In case of Basic (Wire line) and Broadband, this exercise is required to be carried
out on quarterly basis.
Essence of compliance report of service providers with respect to the QoS:
Cellular Mobile Service:
(i) From the monthly audit, it was revealed that the performance of the service providers in Rajasthan Service area was
satisfactory for network related parameters except for one parameter namely „Worst affected cells having > 3% TCH drop.
The benchmark for this parameter could not be complied with by Aircel, Tata (GSM) and Tata (CDMA) with their average
achievement as 3.15%, 4.70% and 7.47% respectively.
(ii) From three days live measurement / assessment, the performance of all operators was satisfactory as they largely met
the benchmarks except the parameter „Worst affected cells> 3 % TCH drops”, which could not be complied with by
Aircel, Tata (GSM) and Tata (CDMA). The average performance of Aircel, Tata (GSM) and Tata (CDMA) on this
parameter was 3.03%, 4.71% and 7.43% respectively. The similar non-compliance of Aircel, Tata (GSM) and Tata
(CDMA) was also observed during monthly audit of the quarter.
(iii) With regard to the Customer Service Quality Parameters, it is revealed that all operators are in well compliance of
the parameters on Metering and Billing Credibility, Response Time to Customers, Termination of Service and Time taken
for refunds except few cases of non-compliance for some of the parameters.
AUDIT & ASSESSMENT OF QOS FOR QE-MARCH-2015-RAJASTHAN CIRCLE
TUV-SUD SOUTH ASIA PRIVATE LIMITED Page 15
Regarding the parameters related to Response time to customers, all service providers are in compliance with respect to
the parameter accessibility of call center except Aircel with its achieved value as 85.08%. In case of parameter Calls
answered by operator (Voice to Voice), Aircel, Airtel, BSNL and Vodafone have not met the benchmark of >95% with
their performed level as 84.38%, 93.90%, 90.26% and 91.71% respectively.
Regarding parameter Termination / Closure of Service within 7 days, only Idea failed to meet the benchmark with its
achieved level as 99.56%. Whereas, in case of parameter Time taken for refund of Deposits, Vodafone and Tata CDMA
lagged behind the benchmark with their performance as 96.13% and 99.63% respectively.
The results of three days live measurements reveal that Airtel could not meet the benchmark of parameter Calls answered
by operator (Voice to voice) within 90 seconds, with its performed value as 93.02%
(iv)The performance of the service providers with regard to the Drive Test revealed that all the service providers performed
well within the QoS norms. BSNL was the only operator which could not meet the benchmarks of the prime network
parameters namely Call Drop Rate, Voice Quality and Call Setup Success rate across Alwar, Banswara and Bharatpur
SSAs.
AUDIT & ASSESSMENT OF QOS FOR QE-MARCH-2015-RAJASTHAN CIRCLE
TUV-SUD SOUTH ASIA PRIVATE LIMITED Page 16
5. PMR AUDIT REPORT
AUDIT & ASSESSMENT OF QOS FOR QE-MARCH-2015-RAJASTHAN CIRCLE
TUV-SUD SOUTH ASIA PRIVATE LIMITED Page 17
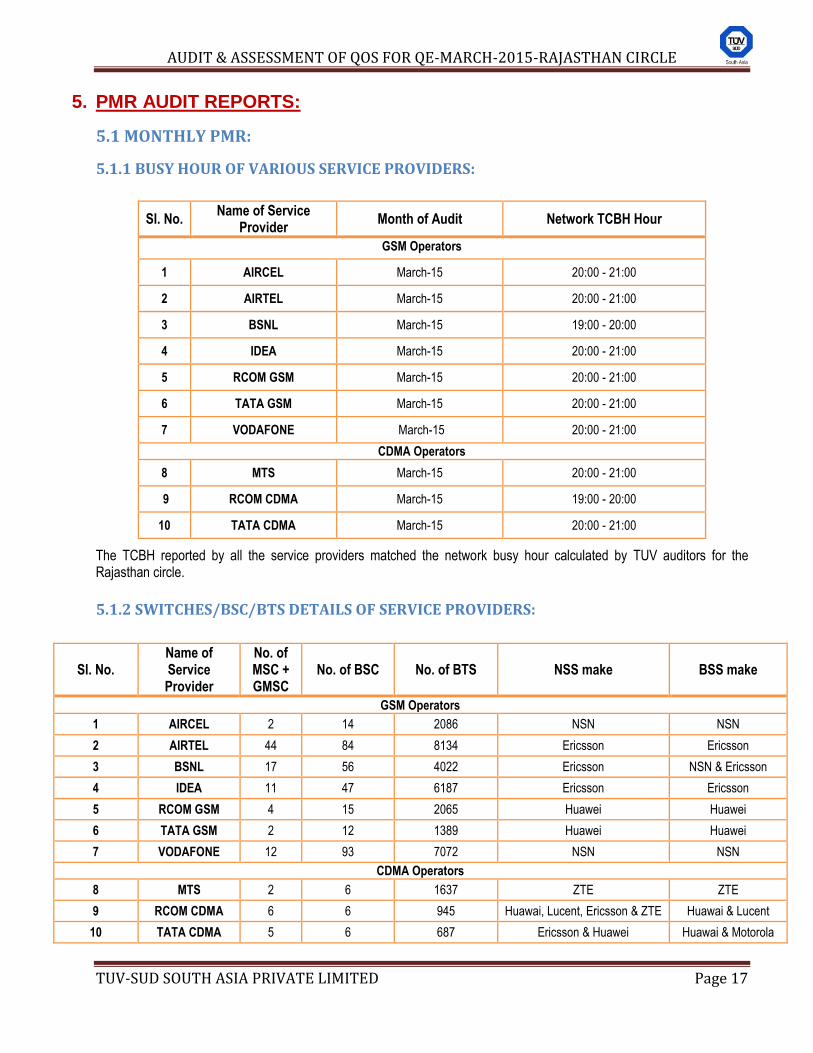
5. PMR AUDIT REPORTS:
5.1 MONTHLY PMR:
5.1.1 BUSY HOUR OF VARIOUS SERVICE PROVIDERS:
Sl. No. Name of Service
Provider Month of Audit Network TCBH Hour
GSM Operators
1 AIRCEL March-15 20:00 - 21:00
2 AIRTEL March-15 20:00 - 21:00
3 BSNL March-15 19:00 - 20:00
4 IDEA March-15 20:00 - 21:00
5 RCOM GSM March-15 20:00 - 21:00
6 TATA GSM March-15 20:00 - 21:00
7 VODAFONE March-15 20:00 - 21:00
CDMA Operators
8 MTS March-15 20:00 - 21:00
9 RCOM CDMA March-15 19:00 - 20:00
10 TATA CDMA March-15 20:00 - 21:00
The TCBH reported by all the service providers matched the network busy hour calculated by TUV auditors for the Rajasthan circle.
5.1.2 SWITCHES/BSC/BTS DETAILS OF SERVICE PROVIDERS:
Sl. No. Name of Service Provider
No. of MSC + GMSC
No. of BSC No. of BTS NSS make BSS make
GSM Operators
1 AIRCEL 2 14 2086 NSN NSN
2 AIRTEL 44 84 8134 Ericsson Ericsson
3 BSNL 17 56 4022 Ericsson NSN & Ericsson
4 IDEA 11 47 6187 Ericsson Ericsson
5 RCOM GSM 4 15 2065 Huawei Huawei
6 TATA GSM 2 12 1389 Huawei Huawei
7 VODAFONE 12 93 7072 NSN NSN
CDMA Operators
8 MTS 2 6 1637 ZTE ZTE
9 RCOM CDMA 6 6 945 Huawai, Lucent, Ericsson & ZTE Huawai & Lucent
10 TATA CDMA 5 6 687 Ericsson & Huawei Huawai & Motorola
AUDIT & ASSESSMENT OF QOS FOR QE-MARCH-2015-RAJASTHAN CIRCLE
TUV-SUD SOUTH ASIA PRIVATE LIMITED Page 18
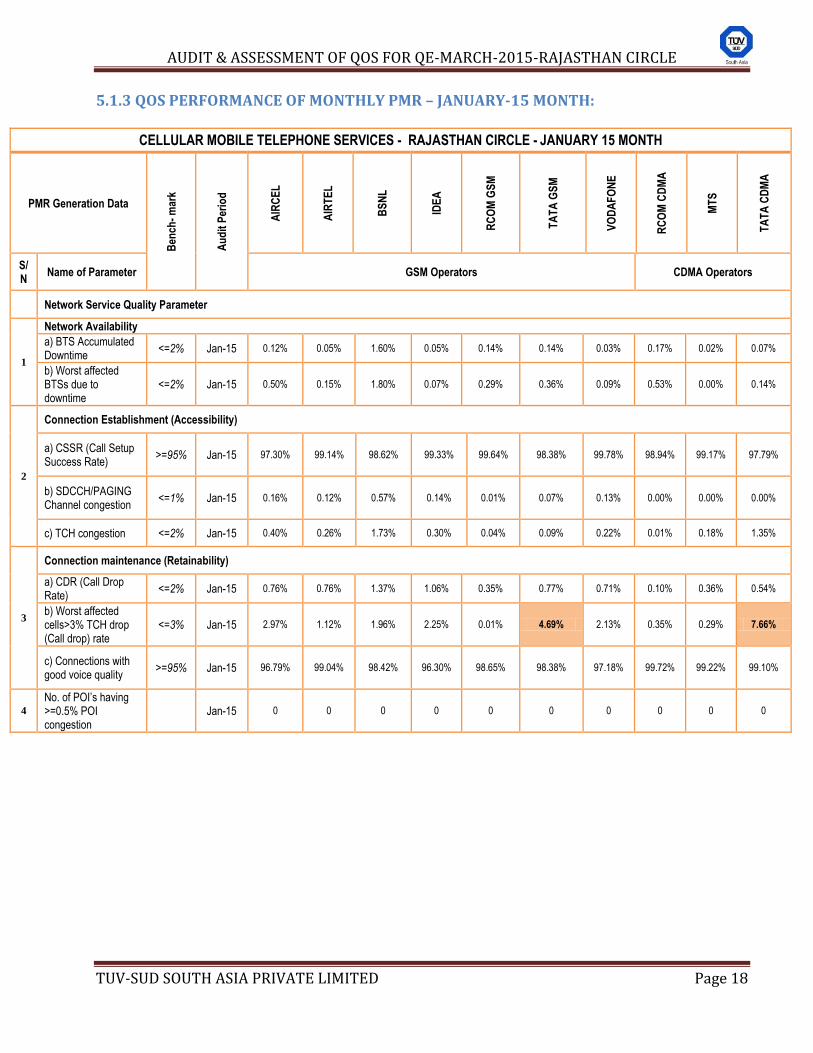
5.1.3 QOS PERFORMANCE OF MONTHLY PMR – JANUARY-15 MONTH:
CELLULAR MOBILE TELEPHONE SERVICES - RAJASTHAN CIRCLE - JANUARY 15 MONTH
PMR Generation Data
Ben
ch-
mar
k
Au
dit
Per
iod
AIR
CE
L
AIR
TE
L
BS
NL
IDE
A
RC
OM
GS
M
TA
TA
GS
M
VO
DA
FO
NE
RC
OM
CD
MA
MT
S
TA
TA
CD
MA
S/N
Name of Parameter GSM Operators CDMA Operators
Network Service Quality Parameter
1
Network Availability
a) BTS Accumulated Downtime
<=2% Jan-15 0.12% 0.05% 1.60% 0.05% 0.14% 0.14% 0.03% 0.17% 0.02% 0.07%
b) Worst affected BTSs due to downtime
<=2% Jan-15 0.50% 0.15% 1.80% 0.07% 0.29% 0.36% 0.09% 0.53% 0.00% 0.14%
2
Connection Establishment (Accessibility)
a) CSSR (Call Setup Success Rate)
>=95% Jan-15 97.30% 99.14% 98.62% 99.33% 99.64% 98.38% 99.78% 98.94% 99.17% 97.79%
b) SDCCH/PAGING Channel congestion
<=1% Jan-15 0.16% 0.12% 0.57% 0.14% 0.01% 0.07% 0.13% 0.00% 0.00% 0.00%
c) TCH congestion <=2% Jan-15 0.40% 0.26% 1.73% 0.30% 0.04% 0.09% 0.22% 0.01% 0.18% 1.35%
3
Connection maintenance (Retainability)
a) CDR (Call Drop Rate)
<=2% Jan-15 0.76% 0.76% 1.37% 1.06% 0.35% 0.77% 0.71% 0.10% 0.36% 0.54%
b) Worst affected cells>3% TCH drop (Call drop) rate
<=3% Jan-15 2.97% 1.12% 1.96% 2.25% 0.01% 4.69% 2.13% 0.35% 0.29% 7.66%
c) Connections with good voice quality
>=95% Jan-15 96.79% 99.04% 98.42% 96.30% 98.65% 98.38% 97.18% 99.72% 99.22% 99.10%
4
No. of POI‟s having >=0.5% POI congestion
Jan-15 0 0 0 0 0 0 0 0 0 0
AUDIT & ASSESSMENT OF QOS FOR QE-MARCH-2015-RAJASTHAN CIRCLE
TUV-SUD SOUTH ASIA PRIVATE LIMITED Page 19
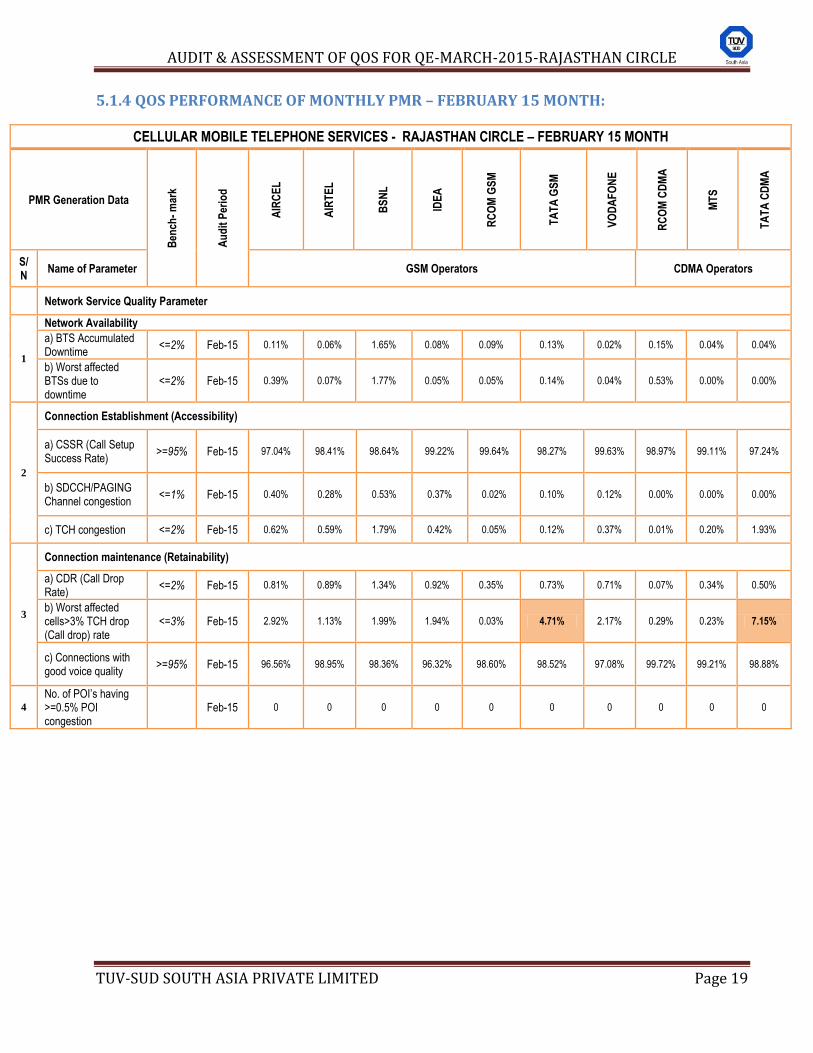
5.1.4 QOS PERFORMANCE OF MONTHLY PMR – FEBRUARY 15 MONTH:
CELLULAR MOBILE TELEPHONE SERVICES - RAJASTHAN CIRCLE – FEBRUARY 15 MONTH
PMR Generation Data
Ben
ch-
mar
k
Au
dit
Per
iod
AIR
CE
L
AIR
TE
L
BS
NL
IDE
A
RC
OM
GS
M
TA
TA
GS
M
VO
DA
FO
NE
RC
OM
CD
MA
MT
S
TA
TA
CD
MA
S/N
Name of Parameter GSM Operators CDMA Operators
Network Service Quality Parameter
1
Network Availability
a) BTS Accumulated Downtime
<=2% Feb-15 0.11% 0.06% 1.65% 0.08% 0.09% 0.13% 0.02% 0.15% 0.04% 0.04%
b) Worst affected BTSs due to downtime
<=2% Feb-15 0.39% 0.07% 1.77% 0.05% 0.05% 0.14% 0.04% 0.53% 0.00% 0.00%
2
Connection Establishment (Accessibility)
a) CSSR (Call Setup Success Rate)
>=95% Feb-15 97.04% 98.41% 98.64% 99.22% 99.64% 98.27% 99.63% 98.97% 99.11% 97.24%
b) SDCCH/PAGING Channel congestion
<=1% Feb-15 0.40% 0.28% 0.53% 0.37% 0.02% 0.10% 0.12% 0.00% 0.00% 0.00%
c) TCH congestion <=2% Feb-15 0.62% 0.59% 1.79% 0.42% 0.05% 0.12% 0.37% 0.01% 0.20% 1.93%
3
Connection maintenance (Retainability)
a) CDR (Call Drop Rate)
<=2% Feb-15 0.81% 0.89% 1.34% 0.92% 0.35% 0.73% 0.71% 0.07% 0.34% 0.50%
b) Worst affected cells>3% TCH drop (Call drop) rate
<=3% Feb-15 2.92% 1.13% 1.99% 1.94% 0.03% 4.71% 2.17% 0.29% 0.23% 7.15%
c) Connections with good voice quality
>=95% Feb-15 96.56% 98.95% 98.36% 96.32% 98.60% 98.52% 97.08% 99.72% 99.21% 98.88%
4
No. of POI‟s having >=0.5% POI congestion
Feb-15 0 0 0 0 0 0 0 0 0 0
AUDIT & ASSESSMENT OF QOS FOR QE-MARCH-2015-RAJASTHAN CIRCLE
TUV-SUD SOUTH ASIA PRIVATE LIMITED Page 20
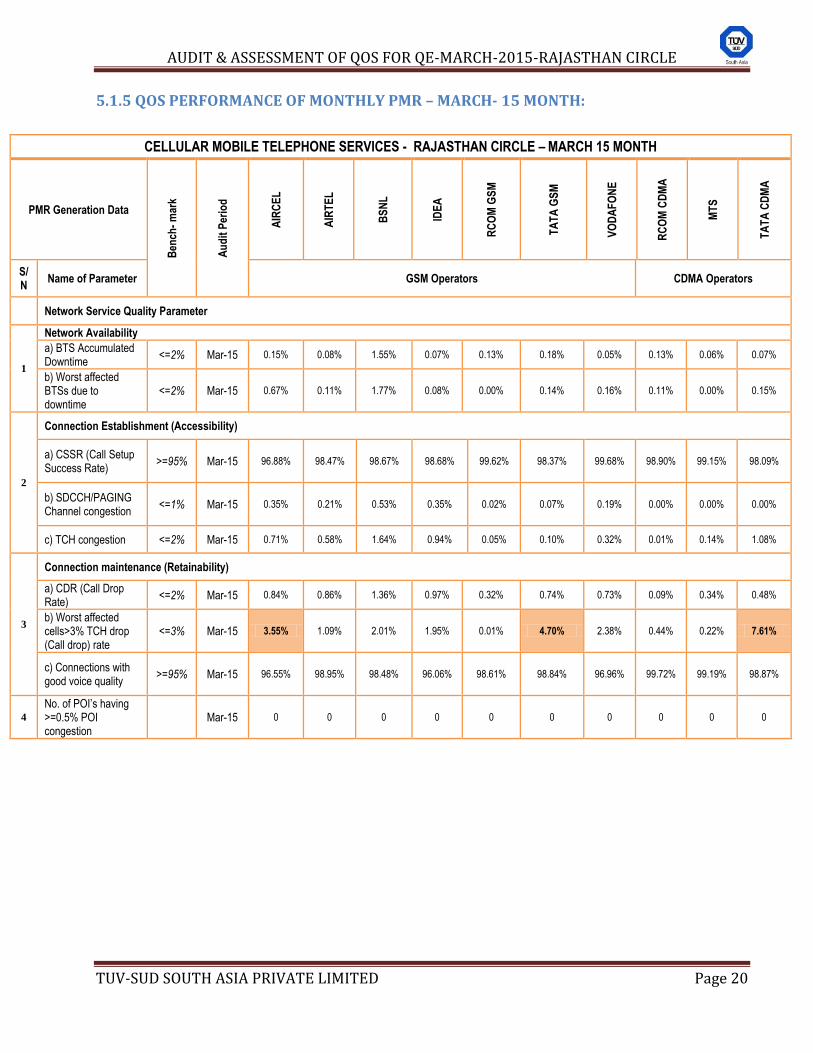
5.1.5 QOS PERFORMANCE OF MONTHLY PMR – MARCH- 15 MONTH:
CELLULAR MOBILE TELEPHONE SERVICES - RAJASTHAN CIRCLE – MARCH 15 MONTH
PMR Generation Data
Ben
ch-
mar
k
Au
dit
Per
iod
AIR
CE
L
AIR
TE
L
BS
NL
IDE
A
RC
OM
GS
M
TA
TA
GS
M
VO
DA
FO
NE
RC
OM
CD
MA
MT
S
TA
TA
CD
MA
S/N
Name of Parameter GSM Operators CDMA Operators
Network Service Quality Parameter
1
Network Availability
a) BTS Accumulated Downtime
<=2% Mar-15 0.15% 0.08% 1.55% 0.07% 0.13% 0.18% 0.05% 0.13% 0.06% 0.07%
b) Worst affected BTSs due to downtime
<=2% Mar-15 0.67% 0.11% 1.77% 0.08% 0.00% 0.14% 0.16% 0.11% 0.00% 0.15%
2
Connection Establishment (Accessibility)
a) CSSR (Call Setup Success Rate)
>=95% Mar-15 96.88% 98.47% 98.67% 98.68% 99.62% 98.37% 99.68% 98.90% 99.15% 98.09%
b) SDCCH/PAGING Channel congestion
<=1% Mar-15 0.35% 0.21% 0.53% 0.35% 0.02% 0.07% 0.19% 0.00% 0.00% 0.00%
c) TCH congestion <=2% Mar-15 0.71% 0.58% 1.64% 0.94% 0.05% 0.10% 0.32% 0.01% 0.14% 1.08%
3
Connection maintenance (Retainability)
a) CDR (Call Drop Rate)
<=2% Mar-15 0.84% 0.86% 1.36% 0.97% 0.32% 0.74% 0.73% 0.09% 0.34% 0.48%
b) Worst affected cells>3% TCH drop (Call drop) rate
<=3% Mar-15 3.55% 1.09% 2.01% 1.95% 0.01% 4.70% 2.38% 0.44% 0.22% 7.61%
c) Connections with good voice quality
>=95% Mar-15 96.55% 98.95% 98.48% 96.06% 98.61% 98.84% 96.96% 99.72% 99.19% 98.87%
4
No. of POI‟s having >=0.5% POI congestion
Mar-15 0 0 0 0 0 0 0 0 0 0
AUDIT & ASSESSMENT OF QOS FOR QE-MARCH-2015-RAJASTHAN CIRCLE
TUV-SUD SOUTH ASIA PRIVATE LIMITED Page 21
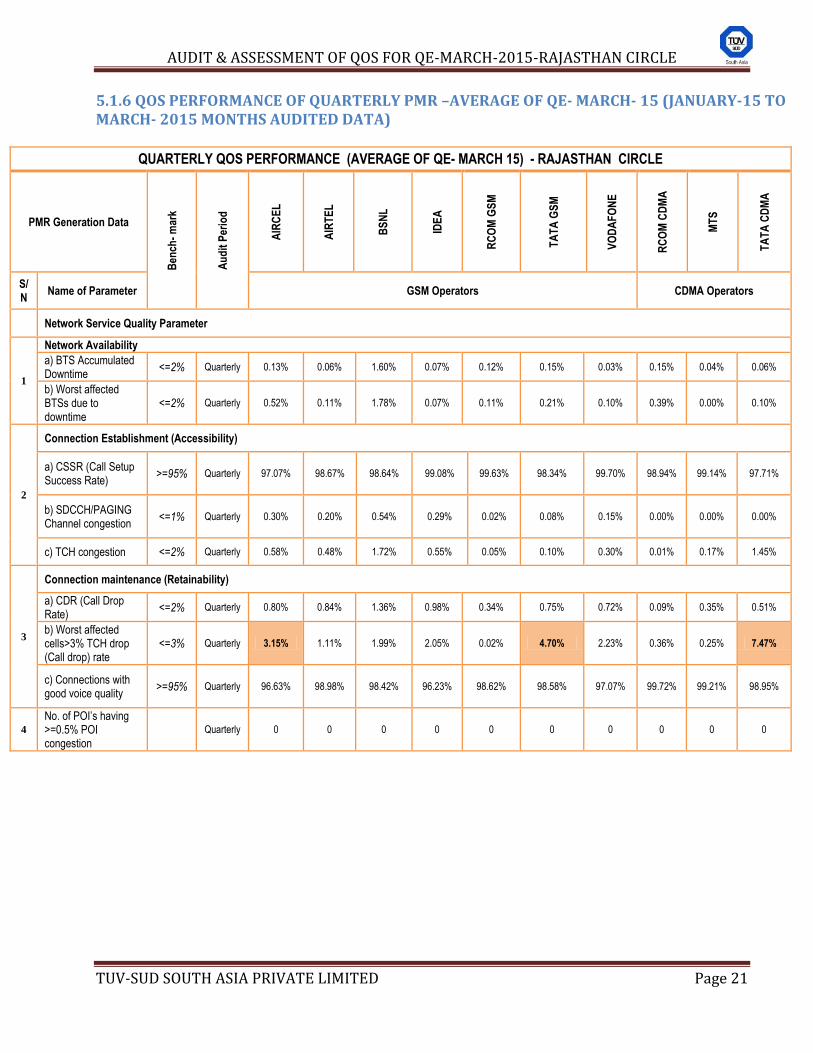
5.1.6 QOS PERFORMANCE OF QUARTERLY PMR –AVERAGE OF QE- MARCH- 15 (JANUARY-15 TO MARCH- 2015 MONTHS AUDITED DATA)
QUARTERLY QOS PERFORMANCE (AVERAGE OF QE- MARCH 15) - RAJASTHAN CIRCLE
PMR Generation Data
Ben
ch-
mar
k
Au
dit
Per
iod
AIR
CE
L
AIR
TE
L
BS
NL
IDE
A
RC
OM
GS
M
TA
TA
GS
M
VO
DA
FO
NE
RC
OM
CD
MA
MT
S
TA
TA
CD
MA
S/N
Name of Parameter GSM Operators CDMA Operators
Network Service Quality Parameter
1
Network Availability
a) BTS Accumulated Downtime
<=2% Quarterly 0.13% 0.06% 1.60% 0.07% 0.12% 0.15% 0.03% 0.15% 0.04% 0.06%
b) Worst affected BTSs due to downtime
<=2% Quarterly 0.52% 0.11% 1.78% 0.07% 0.11% 0.21% 0.10% 0.39% 0.00% 0.10%
2
Connection Establishment (Accessibility)
a) CSSR (Call Setup Success Rate)
>=95% Quarterly 97.07% 98.67% 98.64% 99.08% 99.63% 98.34% 99.70% 98.94% 99.14% 97.71%
b) SDCCH/PAGING Channel congestion
<=1% Quarterly 0.30% 0.20% 0.54% 0.29% 0.02% 0.08% 0.15% 0.00% 0.00% 0.00%
c) TCH congestion <=2% Quarterly 0.58% 0.48% 1.72% 0.55% 0.05% 0.10% 0.30% 0.01% 0.17% 1.45%
3
Connection maintenance (Retainability)
a) CDR (Call Drop Rate)
<=2% Quarterly 0.80% 0.84% 1.36% 0.98% 0.34% 0.75% 0.72% 0.09% 0.35% 0.51%
b) Worst affected cells>3% TCH drop (Call drop) rate
<=3% Quarterly 3.15% 1.11% 1.99% 2.05% 0.02% 4.70% 2.23% 0.36% 0.25% 7.47%
c) Connections with good voice quality
>=95% Quarterly 96.63% 98.98% 98.42% 96.23% 98.62% 98.58% 97.07% 99.72% 99.21% 98.95%
4
No. of POI‟s having >=0.5% POI congestion
Quarterly 0 0 0 0 0 0 0 0 0 0
AUDIT & ASSESSMENT OF QOS FOR QE-MARCH-2015-RAJASTHAN CIRCLE
TUV-SUD SOUTH ASIA PRIVATE LIMITED Page 22
5.1.7 KEY FINDINGS ON MONTHLY PMR AUDIT REPORTS: The audit of network related parameters for cellular mobile service providers was conducted at their respective MSCs in
the circle.
TUV conducted audit for cellular mobile operators based on three stage audit / verification viz audit of the records, live
measurements and drive tests. This exercise has been repeated every month for CMSPs.
Network Service Quality Parameters:
Network Availability
i. BTS Accumulated Downtime (Not Available for Service): ii. Worst affected BTSs due to downtime
For measuring the performance against the benchmark for this parameter, down time of each BTS lasting for more than 1 hour at a time in a day during the period of a month has been taken for computation. In Rajasthan circle, all the operators were found meeting benchmark on the above parameters i.e. „BTS accumulated downtime‟ and „worst affected BTSs due to down time‟ in all the three months of the quarter.
Connection Establishment (Accessibility)
i. Call Set-up Success Rate(CSSR) CSSR includes complete signaling in the call set up process and does not aim to measure the performance of the called exchange or that of the Point of Interconnection (POI). CSSR was established as the ratio of total number of successful call attempts (establishment) to the total number of call attempts made. All the operators were found to be calculating the parameter as per the TRAI‟s specified norms. PMR audit revealed that all operators met the benchmark, prescribed for this parameter.
Parameters related to Network Congestion: The parameters namely SDCCH / Paging Channel Congestion, TCH and POI are prescribed with the aim of measuring the congestion in the network. In CDMA system, there is no direct counter defined for reporting Paging Channel Congestion as reported by Tata Teleservices. However, they have a defined counter for Paging Channel Occupancy Ratio (PCH Average Using Ratio) which is used to determine the Paging Channel Occupancy which on an average is < 50% on all sites in the network. When the value of this parameter is less than 100%, it is counted as 0% congestion. Thus, there is no congestion on the pegging channel in CDMA system. With respect to this parameter, the performance of the operators is also satisfactory as all operators met the TRAI specified benchmarks on the congestion parameters. POI Congestion: With respect to this parameter, all operators were found having congestion within the prescribed benchmark of < 0.5%.
AUDIT & ASSESSMENT OF QOS FOR QE-MARCH-2015-RAJASTHAN CIRCLE
TUV-SUD SOUTH ASIA PRIVATE LIMITED Page 23
Connection Maintenance (Retainability)
i. Call Drop Rate:
This parameter gives a reliable measurement of the mobile network used by the service provider for maintaining a call once it has been correctly established. Failures in coverage, network congestion and network failures have important impact on this parameter. The audit of this parameter revealed that all the service providers were measuring this parameter as per the TRAI guidelines. Also, all the service providers were found to be meeting the TRAI specified benchmark. The lowest call drop rate (average 0 .09%) was for RCOM (CDMA) during the quarter.
ii. Worst affected cells having more than 3% TCH drops Worst affected cells are defined as cells in which the call drop rate exceeds 3% during cell Bouncing Busy Hour (CBBH) or at any other hour of a day. The audit with respect to this parameter revealed that all the operators met the benchmark for this parameter except Aircel, Tata (GSM) and Tata (CDMA) which could not meet the benchmark of this parameter with their average achievement as 3.15%, 4.70% and 7.47% respectively.
iii. Connections with good voice quality:
Some of the Operators are measuring this parameter through the system generated data at their switches whereas some are measuring through their periodic drive tests. The audit results for this parameter reveal that all operators have met the bench mark during the quarter.
AUDIT & ASSESSMENT OF QOS FOR QE-MARCH-2015-RAJASTHAN CIRCLE
TUV-SUD SOUTH ASIA PRIVATE LIMITED Page 24
3-DAYS LIVE MEASUREMENT DATA VERIFICATION FOR
CELLULAR MOBILE SERVICE PROVIDERS
(NETWORK SERVICE QUALITY PARAMETER)
AUDIT & ASSESSMENT OF QOS FOR QE-MARCH-2015-RAJASTHAN CIRCLE
TUV-SUD SOUTH ASIA PRIVATE LIMITED Page 25
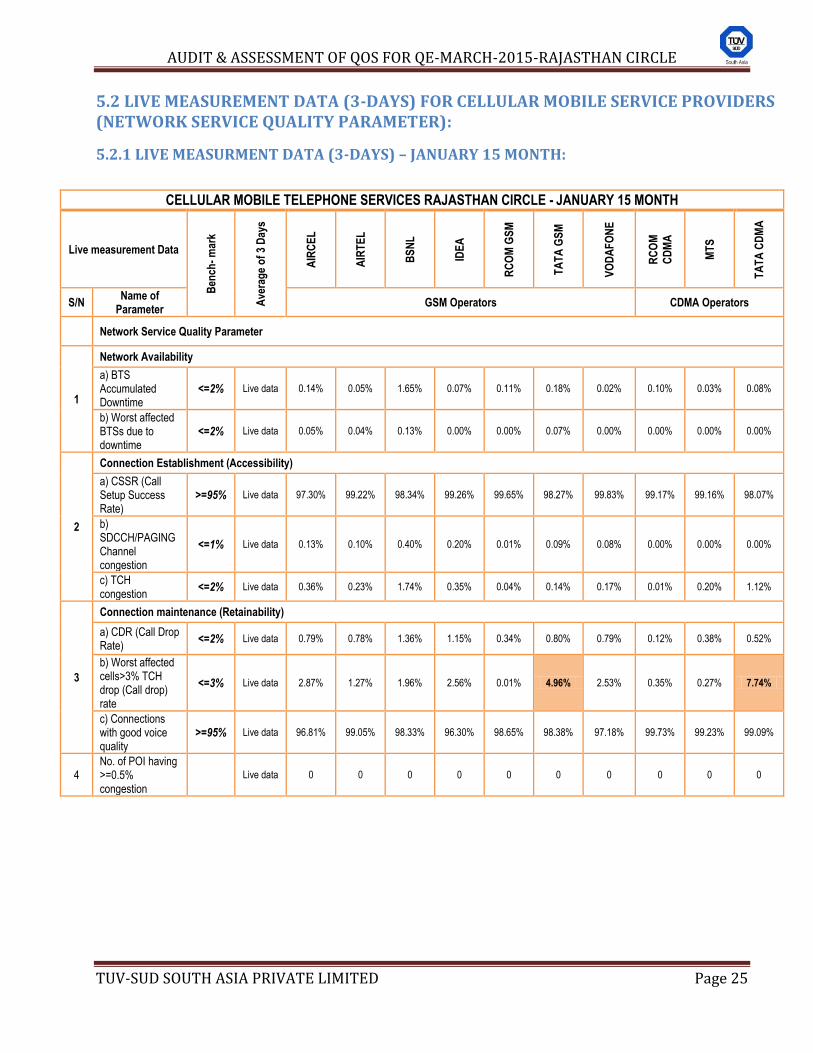
5.2 LIVE MEASUREMENT DATA (3-DAYS) FOR CELLULAR MOBILE SERVICE PROVIDERS (NETWORK SERVICE QUALITY PARAMETER):
5.2.1 LIVE MEASURMENT DATA (3-DAYS) – JANUARY 15 MONTH:
CELLULAR MOBILE TELEPHONE SERVICES RAJASTHAN CIRCLE - JANUARY 15 MONTH
Live measurement Data
Ben
ch-
mar
k
Ave
rag
e o
f 3
Day
s
AIR
CE
L
AIR
TE
L
BS
NL
IDE
A
RC
OM
GS
M
TA
TA
GS
M
VO
DA
FO
NE
RC
OM
CD
MA
MT
S
TA
TA
CD
MA
S/N Name of
Parameter GSM Operators CDMA Operators
Network Service Quality Parameter
1
Network Availability
a) BTS Accumulated Downtime
<=2% Live data 0.14% 0.05% 1.65% 0.07% 0.11% 0.18% 0.02% 0.10% 0.03% 0.08%
b) Worst affected BTSs due to downtime
<=2% Live data 0.05% 0.04% 0.13% 0.00% 0.00% 0.07% 0.00% 0.00% 0.00% 0.00%
2
Connection Establishment (Accessibility)
a) CSSR (Call Setup Success Rate)
>=95% Live data 97.30% 99.22% 98.34% 99.26% 99.65% 98.27% 99.83% 99.17% 99.16% 98.07%
b) SDCCH/PAGING Channel congestion
<=1% Live data 0.13% 0.10% 0.40% 0.20% 0.01% 0.09% 0.08% 0.00% 0.00% 0.00%
c) TCH congestion
<=2% Live data 0.36% 0.23% 1.74% 0.35% 0.04% 0.14% 0.17% 0.01% 0.20% 1.12%
3
Connection maintenance (Retainability)
a) CDR (Call Drop Rate)
<=2% Live data 0.79% 0.78% 1.36% 1.15% 0.34% 0.80% 0.79% 0.12% 0.38% 0.52%
b) Worst affected cells>3% TCH drop (Call drop) rate
<=3% Live data 2.87% 1.27% 1.96% 2.56% 0.01% 4.96% 2.53% 0.35% 0.27% 7.74%
c) Connections with good voice quality
>=95% Live data 96.81% 99.05% 98.33% 96.30% 98.65% 98.38% 97.18% 99.73% 99.23% 99.09%
4 No. of POI having >=0.5% congestion
Live data 0 0 0 0 0 0 0 0 0 0
AUDIT & ASSESSMENT OF QOS FOR QE-MARCH-2015-RAJASTHAN CIRCLE
TUV-SUD SOUTH ASIA PRIVATE LIMITED Page 26
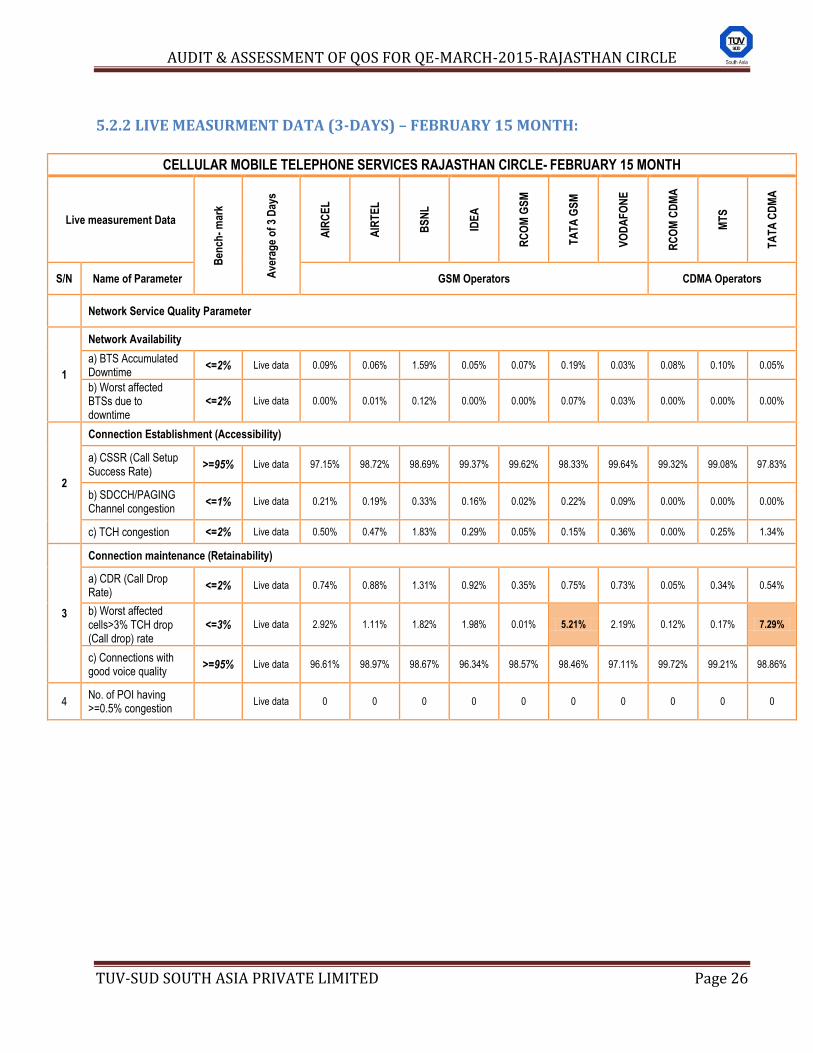
5.2.2 LIVE MEASURMENT DATA (3-DAYS) – FEBRUARY 15 MONTH:
CELLULAR MOBILE TELEPHONE SERVICES RAJASTHAN CIRCLE- FEBRUARY 15 MONTH
Live measurement Data B
ench
- m
ark
Ave
rag
e o
f 3
Day
s
AIR
CE
L
AIR
TE
L
BS
NL
IDE
A
RC
OM
GS
M
TA
TA
GS
M
VO
DA
FO
NE
RC
OM
CD
MA
MT
S
TA
TA
CD
MA
S/N Name of Parameter GSM Operators CDMA Operators
Network Service Quality Parameter
1
Network Availability
a) BTS Accumulated Downtime
<=2% Live data 0.09% 0.06% 1.59% 0.05% 0.07% 0.19% 0.03% 0.08% 0.10% 0.05%
b) Worst affected BTSs due to downtime
<=2% Live data 0.00% 0.01% 0.12% 0.00% 0.00% 0.07% 0.03% 0.00% 0.00% 0.00%
2
Connection Establishment (Accessibility)
a) CSSR (Call Setup Success Rate)
>=95% Live data 97.15% 98.72% 98.69% 99.37% 99.62% 98.33% 99.64% 99.32% 99.08% 97.83%
b) SDCCH/PAGING Channel congestion
<=1% Live data 0.21% 0.19% 0.33% 0.16% 0.02% 0.22% 0.09% 0.00% 0.00% 0.00%
c) TCH congestion <=2% Live data 0.50% 0.47% 1.83% 0.29% 0.05% 0.15% 0.36% 0.00% 0.25% 1.34%
3
Connection maintenance (Retainability)
a) CDR (Call Drop Rate)
<=2% Live data 0.74% 0.88% 1.31% 0.92% 0.35% 0.75% 0.73% 0.05% 0.34% 0.54%
b) Worst affected cells>3% TCH drop (Call drop) rate
<=3% Live data 2.92% 1.11% 1.82% 1.98% 0.01% 5.21% 2.19% 0.12% 0.17% 7.29%
c) Connections with good voice quality
>=95% Live data 96.61% 98.97% 98.67% 96.34% 98.57% 98.46% 97.11% 99.72% 99.21% 98.86%
4 No. of POI having >=0.5% congestion
Live data 0 0 0 0 0 0 0 0 0 0
AUDIT & ASSESSMENT OF QOS FOR QE-MARCH-2015-RAJASTHAN CIRCLE
TUV-SUD SOUTH ASIA PRIVATE LIMITED Page 27
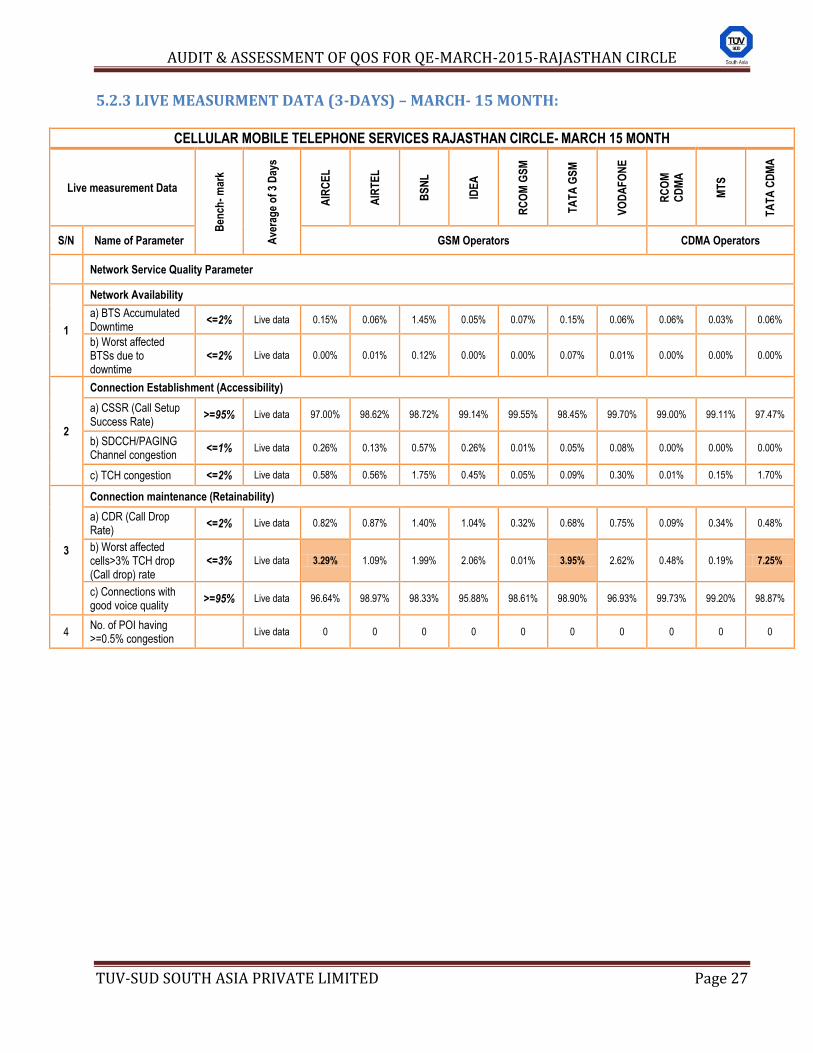
5.2.3 LIVE MEASURMENT DATA (3-DAYS) – MARCH- 15 MONTH:
CELLULAR MOBILE TELEPHONE SERVICES RAJASTHAN CIRCLE- MARCH 15 MONTH
Live measurement Data
Ben
ch-
mar
k
Ave
rag
e o
f 3
Day
s
AIR
CE
L
AIR
TE
L
BS
NL
IDE
A
RC
OM
GS
M
TA
TA
GS
M
VO
DA
FO
NE
RC
OM
CD
MA
MT
S
TA
TA
CD
MA
S/N Name of Parameter GSM Operators CDMA Operators
Network Service Quality Parameter
1
Network Availability
a) BTS Accumulated Downtime
<=2% Live data 0.15% 0.06% 1.45% 0.05% 0.07% 0.15% 0.06% 0.06% 0.03% 0.06%
b) Worst affected BTSs due to downtime
<=2% Live data 0.00% 0.01% 0.12% 0.00% 0.00% 0.07% 0.01% 0.00% 0.00% 0.00%
2
Connection Establishment (Accessibility)
a) CSSR (Call Setup Success Rate)
>=95% Live data 97.00% 98.62% 98.72% 99.14% 99.55% 98.45% 99.70% 99.00% 99.11% 97.47%
b) SDCCH/PAGING Channel congestion
<=1% Live data 0.26% 0.13% 0.57% 0.26% 0.01% 0.05% 0.08% 0.00% 0.00% 0.00%
c) TCH congestion <=2% Live data 0.58% 0.56% 1.75% 0.45% 0.05% 0.09% 0.30% 0.01% 0.15% 1.70%
3
Connection maintenance (Retainability)
a) CDR (Call Drop Rate)
<=2% Live data 0.82% 0.87% 1.40% 1.04% 0.32% 0.68% 0.75% 0.09% 0.34% 0.48%
b) Worst affected cells>3% TCH drop (Call drop) rate
<=3% Live data 3.29% 1.09% 1.99% 2.06% 0.01% 3.95% 2.62% 0.48% 0.19% 7.25%
c) Connections with good voice quality
>=95% Live data 96.64% 98.97% 98.33% 95.88% 98.61% 98.90% 96.93% 99.73% 99.20% 98.87%
4 No. of POI having >=0.5% congestion
Live data 0 0 0 0 0 0 0 0 0 0
AUDIT & ASSESSMENT OF QOS FOR QE-MARCH-2015-RAJASTHAN CIRCLE
TUV-SUD SOUTH ASIA PRIVATE LIMITED Page 28
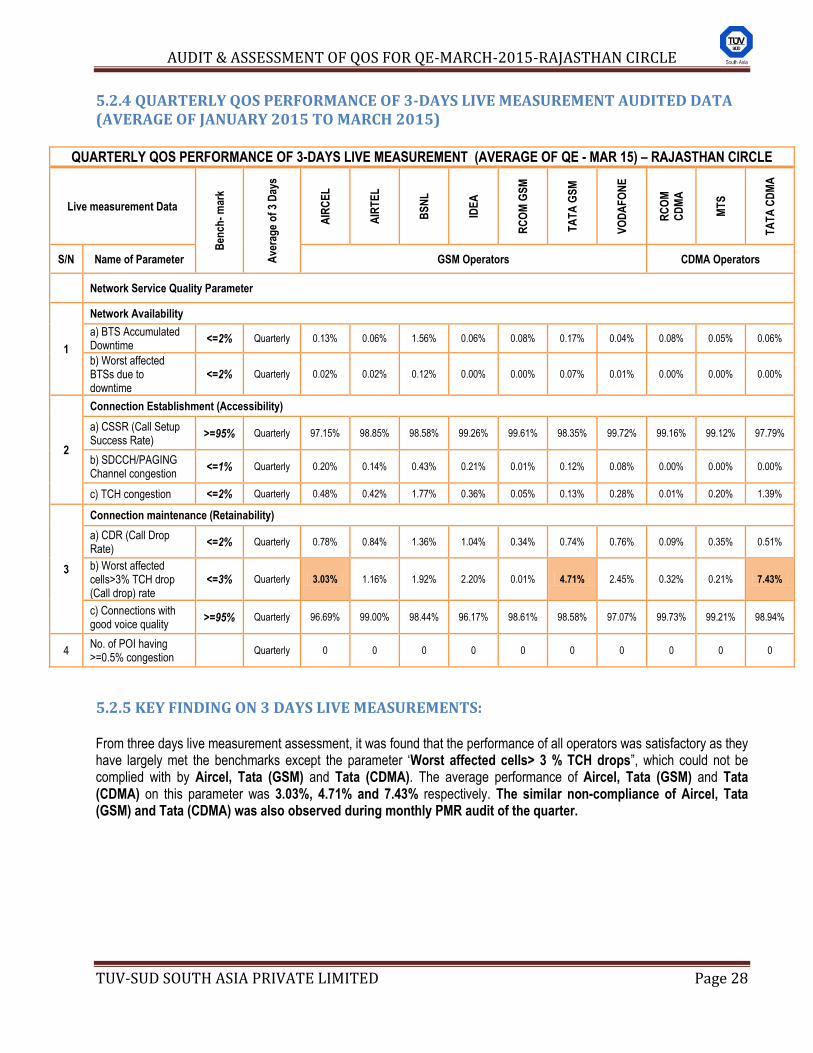
5.2.4 QUARTERLY QOS PERFORMANCE OF 3-DAYS LIVE MEASUREMENT AUDITED DATA (AVERAGE OF JANUARY 2015 TO MARCH 2015)
QUARTERLY QOS PERFORMANCE OF 3-DAYS LIVE MEASUREMENT (AVERAGE OF QE - MAR 15) – RAJASTHAN CIRCLE
Live measurement Data B
ench
- m
ark
Ave
rag
e o
f 3
Day
s
AIR
CE
L
AIR
TE
L
BS
NL
IDE
A
RC
OM
GS
M
TA
TA
GS
M
VO
DA
FO
NE
RC
OM
CD
MA
MT
S
TA
TA
CD
MA
S/N Name of Parameter GSM Operators CDMA Operators
Network Service Quality Parameter
1
Network Availability
a) BTS Accumulated Downtime
<=2% Quarterly 0.13% 0.06% 1.56% 0.06% 0.08% 0.17% 0.04% 0.08% 0.05% 0.06%
b) Worst affected BTSs due to downtime
<=2% Quarterly 0.02% 0.02% 0.12% 0.00% 0.00% 0.07% 0.01% 0.00% 0.00% 0.00%
2
Connection Establishment (Accessibility)
a) CSSR (Call Setup Success Rate)
>=95% Quarterly 97.15% 98.85% 98.58% 99.26% 99.61% 98.35% 99.72% 99.16% 99.12% 97.79%
b) SDCCH/PAGING Channel congestion
<=1% Quarterly 0.20% 0.14% 0.43% 0.21% 0.01% 0.12% 0.08% 0.00% 0.00% 0.00%
c) TCH congestion <=2% Quarterly 0.48% 0.42% 1.77% 0.36% 0.05% 0.13% 0.28% 0.01% 0.20% 1.39%
3
Connection maintenance (Retainability)
a) CDR (Call Drop Rate)
<=2% Quarterly 0.78% 0.84% 1.36% 1.04% 0.34% 0.74% 0.76% 0.09% 0.35% 0.51%
b) Worst affected cells>3% TCH drop (Call drop) rate
<=3% Quarterly 3.03% 1.16% 1.92% 2.20% 0.01% 4.71% 2.45% 0.32% 0.21% 7.43%
c) Connections with good voice quality
>=95% Quarterly 96.69% 99.00% 98.44% 96.17% 98.61% 98.58% 97.07% 99.73% 99.21% 98.94%
4 No. of POI having >=0.5% congestion
Quarterly 0 0 0 0 0 0 0 0 0 0
5.2.5 KEY FINDING ON 3 DAYS LIVE MEASUREMENTS: From three days live measurement assessment, it was found that the performance of all operators was satisfactory as they have largely met the benchmarks except the parameter „Worst affected cells> 3 % TCH drops”, which could not be complied with by Aircel, Tata (GSM) and Tata (CDMA). The average performance of Aircel, Tata (GSM) and Tata (CDMA) on this parameter was 3.03%, 4.71% and 7.43% respectively. The similar non-compliance of Aircel, Tata (GSM) and Tata (CDMA) was also observed during monthly PMR audit of the quarter.
AUDIT & ASSESSMENT OF QOS FOR QE-MARCH-2015-RAJASTHAN CIRCLE
TUV-SUD SOUTH ASIA PRIVATE LIMITED Page 29
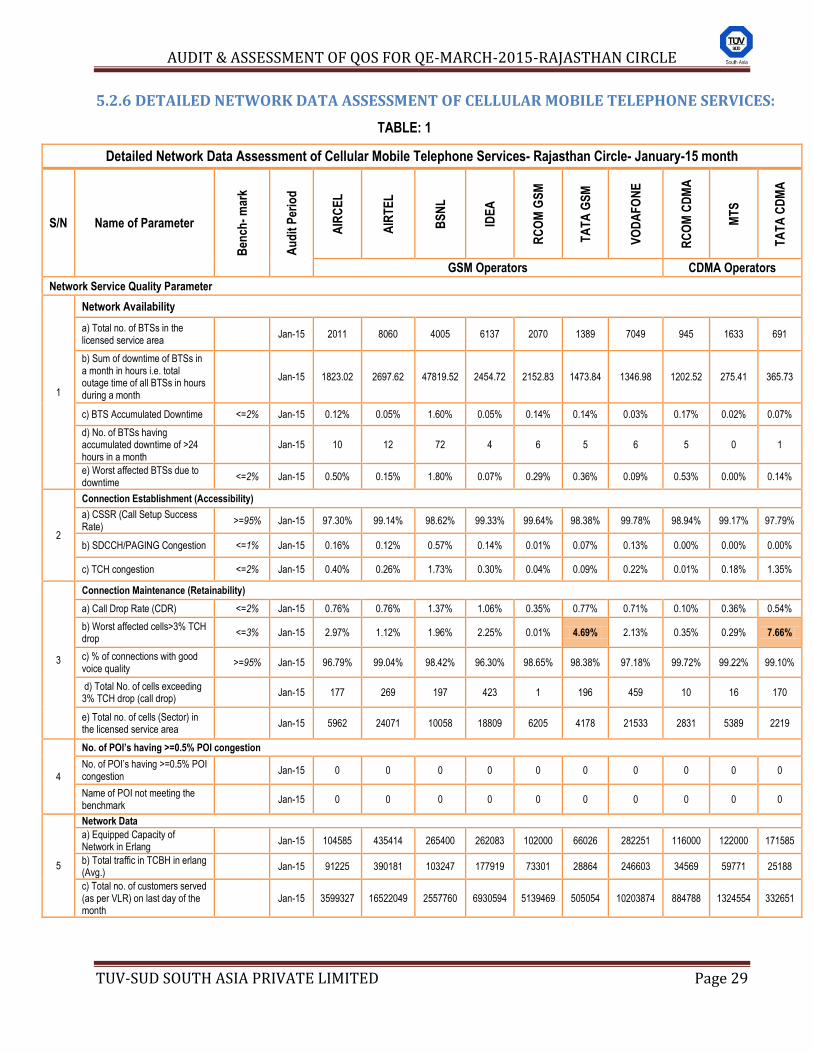
5.2.6 DETAILED NETWORK DATA ASSESSMENT OF CELLULAR MOBILE TELEPHONE SERVICES:
TABLE: 1
Detailed Network Data Assessment of Cellular Mobile Telephone Services- Rajasthan Circle- January-15 month
S/N Name of Parameter
Ben
ch-
mar
k
Au
dit
Per
iod
AIR
CE
L
AIR
TE
L
BS
NL
IDE
A
RC
OM
GS
M
TA
TA
GS
M
VO
DA
FO
NE
RC
OM
CD
MA
MT
S
TA
TA
CD
MA
GSM Operators CDMA Operators
Network Service Quality Parameter
1
Network Availability
a) Total no. of BTSs in the licensed service area
Jan-15 2011 8060 4005 6137 2070 1389 7049 945 1633 691
b) Sum of downtime of BTSs in a month in hours i.e. total outage time of all BTSs in hours during a month
Jan-15 1823.02 2697.62 47819.52 2454.72 2152.83 1473.84 1346.98 1202.52 275.41 365.73
c) BTS Accumulated Downtime <=2% Jan-15 0.12% 0.05% 1.60% 0.05% 0.14% 0.14% 0.03% 0.17% 0.02% 0.07%
d) No. of BTSs having accumulated downtime of >24 hours in a month
Jan-15 10 12 72 4 6 5 6 5 0 1
e) Worst affected BTSs due to downtime
<=2% Jan-15 0.50% 0.15% 1.80% 0.07% 0.29% 0.36% 0.09% 0.53% 0.00% 0.14%
2
Connection Establishment (Accessibility)
a) CSSR (Call Setup Success Rate)
>=95% Jan-15 97.30% 99.14% 98.62% 99.33% 99.64% 98.38% 99.78% 98.94% 99.17% 97.79%
b) SDCCH/PAGING Congestion <=1% Jan-15 0.16% 0.12% 0.57% 0.14% 0.01% 0.07% 0.13% 0.00% 0.00% 0.00%
c) TCH congestion <=2% Jan-15 0.40% 0.26% 1.73% 0.30% 0.04% 0.09% 0.22% 0.01% 0.18% 1.35%
3
Connection Maintenance (Retainability)
a) Call Drop Rate (CDR) <=2% Jan-15 0.76% 0.76% 1.37% 1.06% 0.35% 0.77% 0.71% 0.10% 0.36% 0.54%
b) Worst affected cells>3% TCH drop
<=3% Jan-15 2.97% 1.12% 1.96% 2.25% 0.01% 4.69% 2.13% 0.35% 0.29% 7.66%
c) % of connections with good voice quality
>=95% Jan-15 96.79% 99.04% 98.42% 96.30% 98.65% 98.38% 97.18% 99.72% 99.22% 99.10%
d) Total No. of cells exceeding 3% TCH drop (call drop)
Jan-15 177 269 197 423 1 196 459 10 16 170
e) Total no. of cells (Sector) in the licensed service area
Jan-15 5962 24071 10058 18809 6205 4178 21533 2831 5389 2219
4
No. of POI’s having >=0.5% POI congestion
No. of POI‟s having >=0.5% POI congestion
Jan-15 0 0 0 0 0 0 0 0 0 0
Name of POI not meeting the benchmark
Jan-15 0 0 0 0 0 0 0 0 0 0
5
Network Data
a) Equipped Capacity of Network in Erlang
Jan-15 104585 435414 265400 262083 102000 66026 282251 116000 122000 171585
b) Total traffic in TCBH in erlang (Avg.)
Jan-15 91225 390181 103247 177919 73301 28864 246603 34569 59771 25188
c) Total no. of customers served (as per VLR) on last day of the month
Jan-15 3599327 16522049 2557760 6930594 5139469 505054 10203874 884788 1324554 332651
AUDIT & ASSESSMENT OF QOS FOR QE-MARCH-2015-RAJASTHAN CIRCLE
TUV-SUD SOUTH ASIA PRIVATE LIMITED Page 30
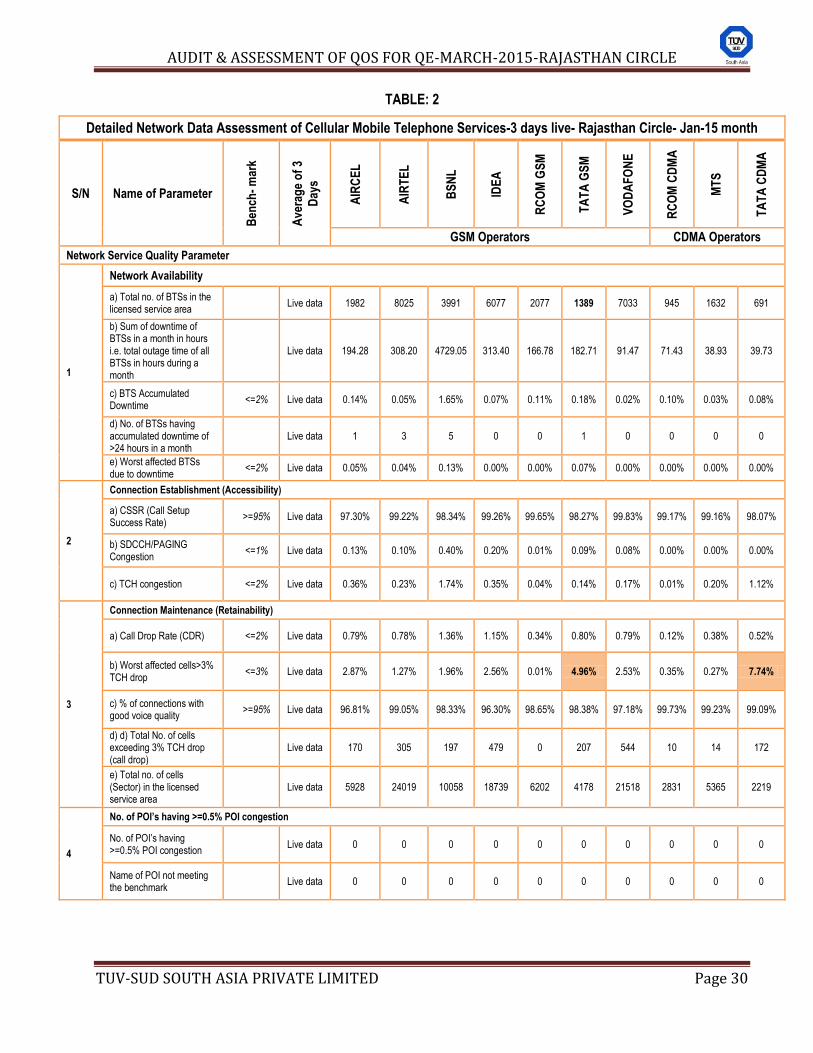
TABLE: 2
Detailed Network Data Assessment of Cellular Mobile Telephone Services-3 days live- Rajasthan Circle- Jan-15 month
S/N Name of Parameter
Ben
ch-
mar
k
Ave
rag
e o
f 3
Day
s
AIR
CE
L
AIR
TE
L
BS
NL
IDE
A
RC
OM
GS
M
TA
TA
GS
M
VO
DA
FO
NE
RC
OM
CD
MA
MT
S
TA
TA
CD
MA
GSM Operators CDMA Operators
Network Service Quality Parameter
1
Network Availability
a) Total no. of BTSs in the licensed service area
Live data 1982 8025 3991 6077 2077 1389 7033 945 1632 691
b) Sum of downtime of BTSs in a month in hours i.e. total outage time of all BTSs in hours during a month
Live data 194.28 308.20 4729.05 313.40 166.78 182.71 91.47 71.43 38.93 39.73
c) BTS Accumulated Downtime
<=2% Live data 0.14% 0.05% 1.65% 0.07% 0.11% 0.18% 0.02% 0.10% 0.03% 0.08%
d) No. of BTSs having accumulated downtime of >24 hours in a month
Live data 1 3 5 0 0 1 0 0 0 0
e) Worst affected BTSs due to downtime
<=2% Live data 0.05% 0.04% 0.13% 0.00% 0.00% 0.07% 0.00% 0.00% 0.00% 0.00%
2
Connection Establishment (Accessibility)
a) CSSR (Call Setup Success Rate)
>=95% Live data 97.30% 99.22% 98.34% 99.26% 99.65% 98.27% 99.83% 99.17% 99.16% 98.07%
b) SDCCH/PAGING Congestion
<=1% Live data 0.13% 0.10% 0.40% 0.20% 0.01% 0.09% 0.08% 0.00% 0.00% 0.00%
c) TCH congestion <=2% Live data 0.36% 0.23% 1.74% 0.35% 0.04% 0.14% 0.17% 0.01% 0.20% 1.12%
3
Connection Maintenance (Retainability)
a) Call Drop Rate (CDR) <=2% Live data 0.79% 0.78% 1.36% 1.15% 0.34% 0.80% 0.79% 0.12% 0.38% 0.52%
b) Worst affected cells>3% TCH drop
<=3% Live data 2.87% 1.27% 1.96% 2.56% 0.01% 4.96% 2.53% 0.35% 0.27% 7.74%
c) % of connections with good voice quality
>=95% Live data 96.81% 99.05% 98.33% 96.30% 98.65% 98.38% 97.18% 99.73% 99.23% 99.09%
d) d) Total No. of cells exceeding 3% TCH drop (call drop)
Live data 170 305 197 479 0 207 544 10 14 172
e) Total no. of cells (Sector) in the licensed service area
Live data 5928 24019 10058 18739 6202 4178 21518 2831 5365 2219
4
No. of POI’s having >=0.5% POI congestion
No. of POI‟s having >=0.5% POI congestion
Live data 0 0 0 0 0 0 0 0 0 0
Name of POI not meeting the benchmark
Live data 0 0 0 0 0 0 0 0 0 0
AUDIT & ASSESSMENT OF QOS FOR QE-MARCH-2015-RAJASTHAN CIRCLE
TUV-SUD SOUTH ASIA PRIVATE LIMITED Page 31
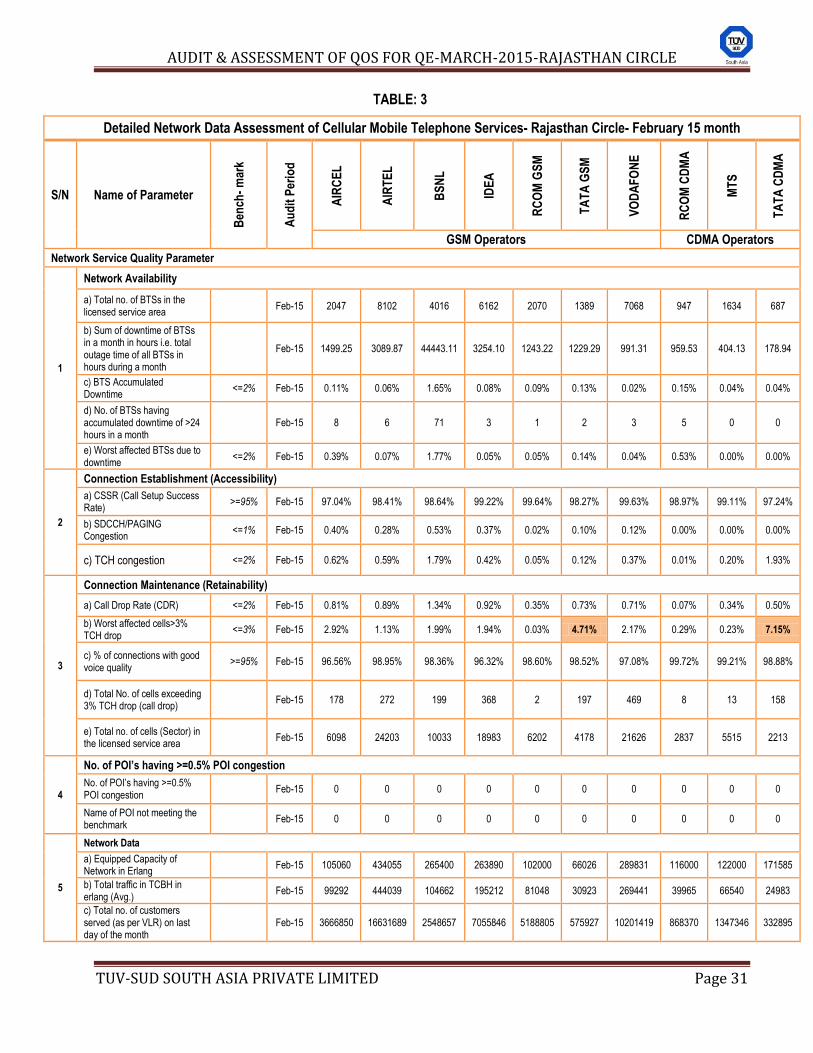
TABLE: 3
Detailed Network Data Assessment of Cellular Mobile Telephone Services- Rajasthan Circle- February 15 month
S/N Name of Parameter
Ben
ch-
mar
k
Au
dit
Per
iod
AIR
CE
L
AIR
TE
L
BS
NL
IDE
A
RC
OM
GS
M
TA
TA
GS
M
VO
DA
FO
NE
RC
OM
CD
MA
MT
S
TA
TA
CD
MA
GSM Operators CDMA Operators
Network Service Quality Parameter
1
Network Availability
a) Total no. of BTSs in the licensed service area
Feb-15 2047 8102 4016 6162 2070 1389 7068 947 1634 687
b) Sum of downtime of BTSs in a month in hours i.e. total outage time of all BTSs in hours during a month
Feb-15 1499.25 3089.87 44443.11 3254.10 1243.22 1229.29 991.31 959.53 404.13 178.94
c) BTS Accumulated Downtime
<=2% Feb-15 0.11% 0.06% 1.65% 0.08% 0.09% 0.13% 0.02% 0.15% 0.04% 0.04%
d) No. of BTSs having accumulated downtime of >24 hours in a month
Feb-15 8 6 71 3 1 2 3 5 0 0
e) Worst affected BTSs due to downtime
<=2% Feb-15 0.39% 0.07% 1.77% 0.05% 0.05% 0.14% 0.04% 0.53% 0.00% 0.00%
2
Connection Establishment (Accessibility)
a) CSSR (Call Setup Success Rate)
>=95% Feb-15 97.04% 98.41% 98.64% 99.22% 99.64% 98.27% 99.63% 98.97% 99.11% 97.24%
b) SDCCH/PAGING Congestion
<=1% Feb-15 0.40% 0.28% 0.53% 0.37% 0.02% 0.10% 0.12% 0.00% 0.00% 0.00%
c) TCH congestion <=2% Feb-15 0.62% 0.59% 1.79% 0.42% 0.05% 0.12% 0.37% 0.01% 0.20% 1.93%
3
Connection Maintenance (Retainability)
a) Call Drop Rate (CDR) <=2% Feb-15 0.81% 0.89% 1.34% 0.92% 0.35% 0.73% 0.71% 0.07% 0.34% 0.50%
b) Worst affected cells>3% TCH drop
<=3% Feb-15 2.92% 1.13% 1.99% 1.94% 0.03% 4.71% 2.17% 0.29% 0.23% 7.15%
c) % of connections with good voice quality
>=95% Feb-15 96.56% 98.95% 98.36% 96.32% 98.60% 98.52% 97.08% 99.72% 99.21% 98.88%
d) Total No. of cells exceeding 3% TCH drop (call drop)
Feb-15 178 272 199 368 2 197 469 8 13 158
e) Total no. of cells (Sector) in the licensed service area
Feb-15 6098 24203 10033 18983 6202 4178 21626 2837 5515 2213
4
No. of POI’s having >=0.5% POI congestion
No. of POI‟s having >=0.5% POI congestion
Feb-15 0 0 0 0 0 0 0 0 0 0
Name of POI not meeting the benchmark
Feb-15 0 0 0 0 0 0 0 0 0 0
5
Network Data
a) Equipped Capacity of Network in Erlang
Feb-15 105060 434055 265400 263890 102000 66026 289831 116000 122000 171585
b) Total traffic in TCBH in erlang (Avg.)
Feb-15 99292 444039 104662 195212 81048 30923 269441 39965 66540 24983
c) Total no. of customers served (as per VLR) on last day of the month
Feb-15 3666850 16631689 2548657 7055846 5188805 575927 10201419 868370 1347346 332895
AUDIT & ASSESSMENT OF QOS FOR QE-MARCH-2015-RAJASTHAN CIRCLE
TUV-SUD SOUTH ASIA PRIVATE LIMITED Page 32
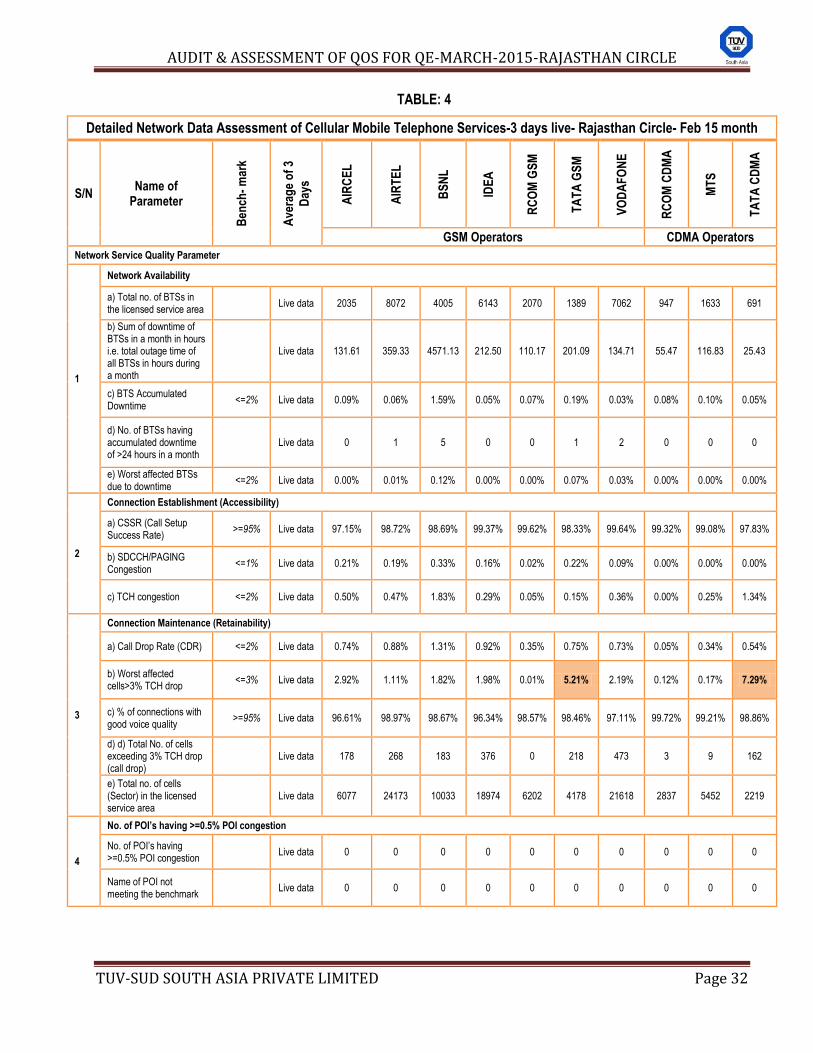
TABLE: 4
Detailed Network Data Assessment of Cellular Mobile Telephone Services-3 days live- Rajasthan Circle- Feb 15 month
S/N Name of
Parameter
Ben
ch-
mar
k
Ave
rag
e o
f 3
Day
s
AIR
CE
L
AIR
TE
L
BS
NL
IDE
A
RC
OM
GS
M
TA
TA
GS
M
VO
DA
FO
NE
RC
OM
CD
MA
MT
S
TA
TA
CD
MA
GSM Operators CDMA Operators
Network Service Quality Parameter
1
Network Availability
a) Total no. of BTSs in the licensed service area
Live data 2035 8072 4005 6143 2070 1389 7062 947 1633 691
b) Sum of downtime of BTSs in a month in hours i.e. total outage time of all BTSs in hours during a month
Live data 131.61 359.33 4571.13 212.50 110.17 201.09 134.71 55.47 116.83 25.43
c) BTS Accumulated Downtime
<=2% Live data 0.09% 0.06% 1.59% 0.05% 0.07% 0.19% 0.03% 0.08% 0.10% 0.05%
d) No. of BTSs having accumulated downtime of >24 hours in a month
Live data 0 1 5 0 0 1 2 0 0 0
e) Worst affected BTSs due to downtime
<=2% Live data 0.00% 0.01% 0.12% 0.00% 0.00% 0.07% 0.03% 0.00% 0.00% 0.00%
2
Connection Establishment (Accessibility)
a) CSSR (Call Setup Success Rate)
>=95% Live data 97.15% 98.72% 98.69% 99.37% 99.62% 98.33% 99.64% 99.32% 99.08% 97.83%
b) SDCCH/PAGING Congestion
<=1% Live data 0.21% 0.19% 0.33% 0.16% 0.02% 0.22% 0.09% 0.00% 0.00% 0.00%
c) TCH congestion <=2% Live data 0.50% 0.47% 1.83% 0.29% 0.05% 0.15% 0.36% 0.00% 0.25% 1.34%
3
Connection Maintenance (Retainability)
a) Call Drop Rate (CDR) <=2% Live data 0.74% 0.88% 1.31% 0.92% 0.35% 0.75% 0.73% 0.05% 0.34% 0.54%
b) Worst affected cells>3% TCH drop
<=3% Live data 2.92% 1.11% 1.82% 1.98% 0.01% 5.21% 2.19% 0.12% 0.17% 7.29%
c) % of connections with good voice quality
>=95% Live data 96.61% 98.97% 98.67% 96.34% 98.57% 98.46% 97.11% 99.72% 99.21% 98.86%
d) d) Total No. of cells exceeding 3% TCH drop (call drop)
Live data 178 268 183 376 0 218 473 3 9 162
e) Total no. of cells (Sector) in the licensed service area
Live data 6077 24173 10033 18974 6202 4178 21618 2837 5452 2219
4
No. of POI’s having >=0.5% POI congestion
No. of POI‟s having >=0.5% POI congestion
Live data 0 0 0 0 0 0 0 0 0 0
Name of POI not meeting the benchmark
Live data 0 0 0 0 0 0 0 0 0 0
AUDIT & ASSESSMENT OF QOS FOR QE-MARCH-2015-RAJASTHAN CIRCLE
TUV-SUD SOUTH ASIA PRIVATE LIMITED Page 33
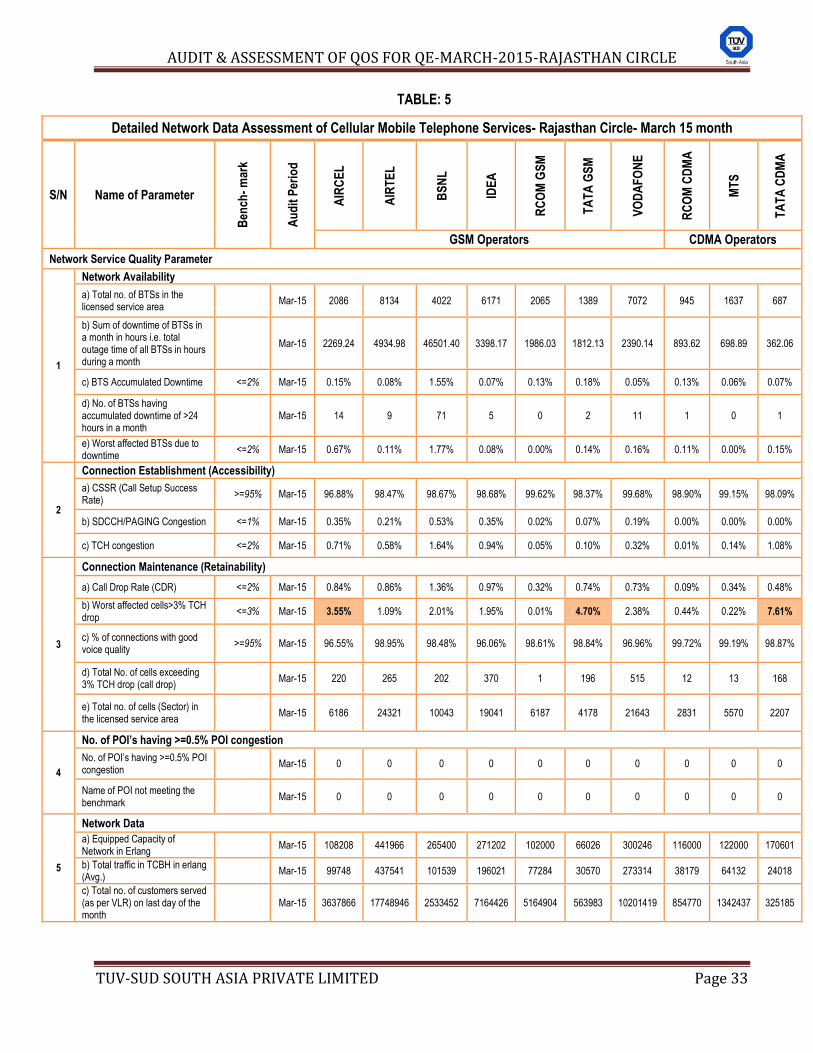
TABLE: 5
Detailed Network Data Assessment of Cellular Mobile Telephone Services- Rajasthan Circle- March 15 month
S/N Name of Parameter
Ben
ch-
mar
k
Au
dit
Per
iod
AIR
CE
L
AIR
TE
L
BS
NL
IDE
A
RC
OM
GS
M
TA
TA
GS
M
VO
DA
FO
NE
RC
OM
CD
MA
MT
S
TA
TA
CD
MA
GSM Operators CDMA Operators
Network Service Quality Parameter
1
Network Availability
a) Total no. of BTSs in the licensed service area
Mar-15 2086 8134 4022 6171 2065 1389 7072 945 1637 687
b) Sum of downtime of BTSs in a month in hours i.e. total outage time of all BTSs in hours during a month
Mar-15 2269.24 4934.98 46501.40 3398.17 1986.03 1812.13 2390.14 893.62 698.89 362.06
c) BTS Accumulated Downtime <=2% Mar-15 0.15% 0.08% 1.55% 0.07% 0.13% 0.18% 0.05% 0.13% 0.06% 0.07%
d) No. of BTSs having accumulated downtime of >24 hours in a month
Mar-15 14 9 71 5 0 2 11 1 0 1
e) Worst affected BTSs due to downtime
<=2% Mar-15 0.67% 0.11% 1.77% 0.08% 0.00% 0.14% 0.16% 0.11% 0.00% 0.15%
2
Connection Establishment (Accessibility)
a) CSSR (Call Setup Success Rate)
>=95% Mar-15 96.88% 98.47% 98.67% 98.68% 99.62% 98.37% 99.68% 98.90% 99.15% 98.09%
b) SDCCH/PAGING Congestion <=1% Mar-15 0.35% 0.21% 0.53% 0.35% 0.02% 0.07% 0.19% 0.00% 0.00% 0.00%
c) TCH congestion <=2% Mar-15 0.71% 0.58% 1.64% 0.94% 0.05% 0.10% 0.32% 0.01% 0.14% 1.08%
3
Connection Maintenance (Retainability)
a) Call Drop Rate (CDR) <=2% Mar-15 0.84% 0.86% 1.36% 0.97% 0.32% 0.74% 0.73% 0.09% 0.34% 0.48%
b) Worst affected cells>3% TCH drop
<=3% Mar-15 3.55% 1.09% 2.01% 1.95% 0.01% 4.70% 2.38% 0.44% 0.22% 7.61%
c) % of connections with good voice quality
>=95% Mar-15 96.55% 98.95% 98.48% 96.06% 98.61% 98.84% 96.96% 99.72% 99.19% 98.87%
d) Total No. of cells exceeding 3% TCH drop (call drop)
Mar-15 220 265 202 370 1 196 515 12 13 168
e) Total no. of cells (Sector) in the licensed service area
Mar-15 6186 24321 10043 19041 6187 4178 21643 2831 5570 2207
4
No. of POI’s having >=0.5% POI congestion
No. of POI‟s having >=0.5% POI congestion
Mar-15 0 0 0 0 0 0 0 0 0 0
Name of POI not meeting the benchmark
Mar-15 0 0 0 0 0 0 0 0 0 0
5
Network Data
a) Equipped Capacity of Network in Erlang
Mar-15 108208 441966 265400 271202 102000 66026 300246 116000 122000 170601
b) Total traffic in TCBH in erlang (Avg.)
Mar-15 99748 437541 101539 196021 77284 30570 273314 38179 64132 24018
c) Total no. of customers served (as per VLR) on last day of the month
Mar-15 3637866 17748946 2533452 7164426 5164904 563983 10201419 854770 1342437 325185
AUDIT & ASSESSMENT OF QOS FOR QE-MARCH-2015-RAJASTHAN CIRCLE
TUV-SUD SOUTH ASIA PRIVATE LIMITED Page 34
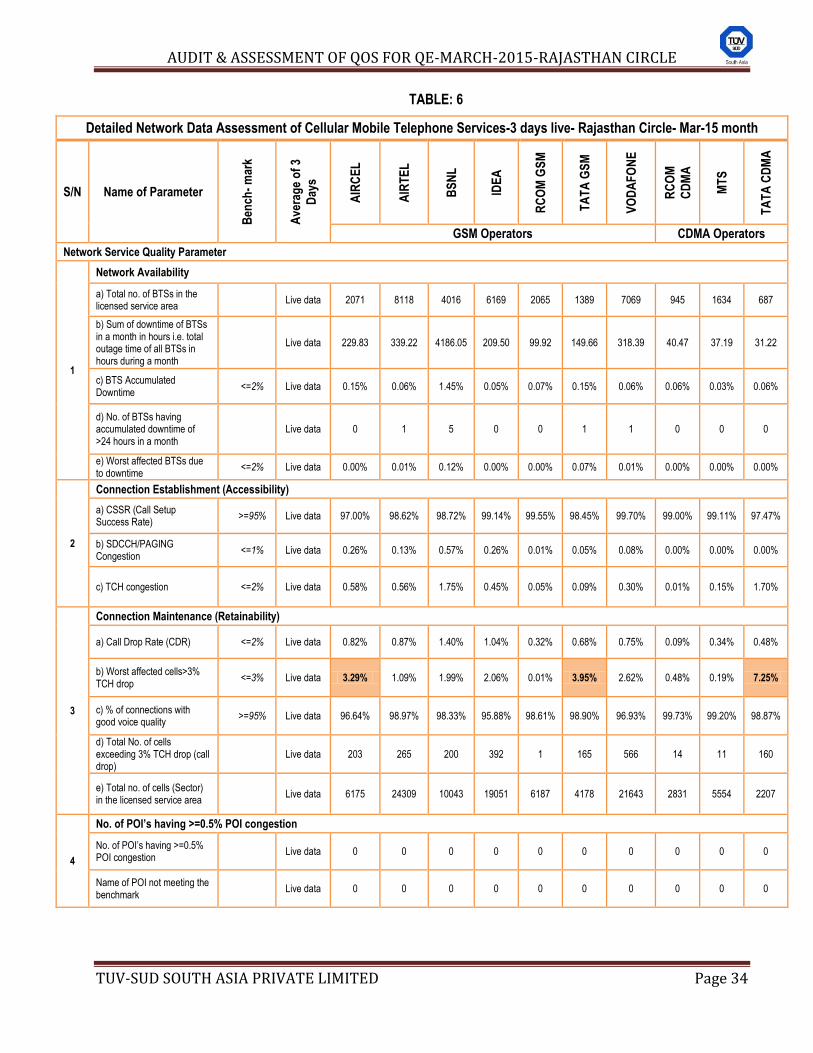
TABLE: 6
Detailed Network Data Assessment of Cellular Mobile Telephone Services-3 days live- Rajasthan Circle- Mar-15 month
S/N Name of Parameter
Ben
ch-
mar
k
Ave
rag
e o
f 3
Day
s
AIR
CE
L
AIR
TE
L
BS
NL
IDE
A
RC
OM
GS
M
TA
TA
GS
M
VO
DA
FO
NE
RC
OM
CD
MA
MT
S
TA
TA
CD
MA
GSM Operators CDMA Operators
Network Service Quality Parameter
1
Network Availability
a) Total no. of BTSs in the licensed service area
Live data 2071 8118 4016 6169 2065 1389 7069 945 1634 687
b) Sum of downtime of BTSs in a month in hours i.e. total outage time of all BTSs in hours during a month
Live data 229.83 339.22 4186.05 209.50 99.92 149.66 318.39 40.47 37.19 31.22
c) BTS Accumulated Downtime
<=2% Live data 0.15% 0.06% 1.45% 0.05% 0.07% 0.15% 0.06% 0.06% 0.03% 0.06%
d) No. of BTSs having accumulated downtime of >24 hours in a month
Live data 0 1 5 0 0 1 1 0 0 0
e) Worst affected BTSs due to downtime
<=2% Live data 0.00% 0.01% 0.12% 0.00% 0.00% 0.07% 0.01% 0.00% 0.00% 0.00%
2
Connection Establishment (Accessibility)
a) CSSR (Call Setup Success Rate)
>=95% Live data 97.00% 98.62% 98.72% 99.14% 99.55% 98.45% 99.70% 99.00% 99.11% 97.47%
b) SDCCH/PAGING Congestion
<=1% Live data 0.26% 0.13% 0.57% 0.26% 0.01% 0.05% 0.08% 0.00% 0.00% 0.00%
c) TCH congestion <=2% Live data 0.58% 0.56% 1.75% 0.45% 0.05% 0.09% 0.30% 0.01% 0.15% 1.70%
3
Connection Maintenance (Retainability)
a) Call Drop Rate (CDR) <=2% Live data 0.82% 0.87% 1.40% 1.04% 0.32% 0.68% 0.75% 0.09% 0.34% 0.48%
b) Worst affected cells>3% TCH drop
<=3% Live data 3.29% 1.09% 1.99% 2.06% 0.01% 3.95% 2.62% 0.48% 0.19% 7.25%
c) % of connections with good voice quality
>=95% Live data 96.64% 98.97% 98.33% 95.88% 98.61% 98.90% 96.93% 99.73% 99.20% 98.87%
d) Total No. of cells exceeding 3% TCH drop (call drop)
Live data 203 265 200 392 1 165 566 14 11 160
e) Total no. of cells (Sector) in the licensed service area
Live data 6175 24309 10043 19051 6187 4178 21643 2831 5554 2207
4
No. of POI’s having >=0.5% POI congestion
No. of POI‟s having >=0.5% POI congestion
Live data 0 0 0 0 0 0 0 0 0 0
Name of POI not meeting the benchmark
Live data 0 0 0 0 0 0 0 0 0 0
AUDIT & ASSESSMENT OF QOS FOR QE-MARCH-2015-RAJASTHAN CIRCLE
TUV-SUD SOUTH ASIA PRIVATE LIMITED Page 35
CUSTOMER SERVICE QUALITY (CSD) PARAMETERS
AUDIT & ASSESSMENT OF QOS FOR QE-MARCH-2015-RAJASTHAN CIRCLE
TUV-SUD SOUTH ASIA PRIVATE LIMITED Page 36
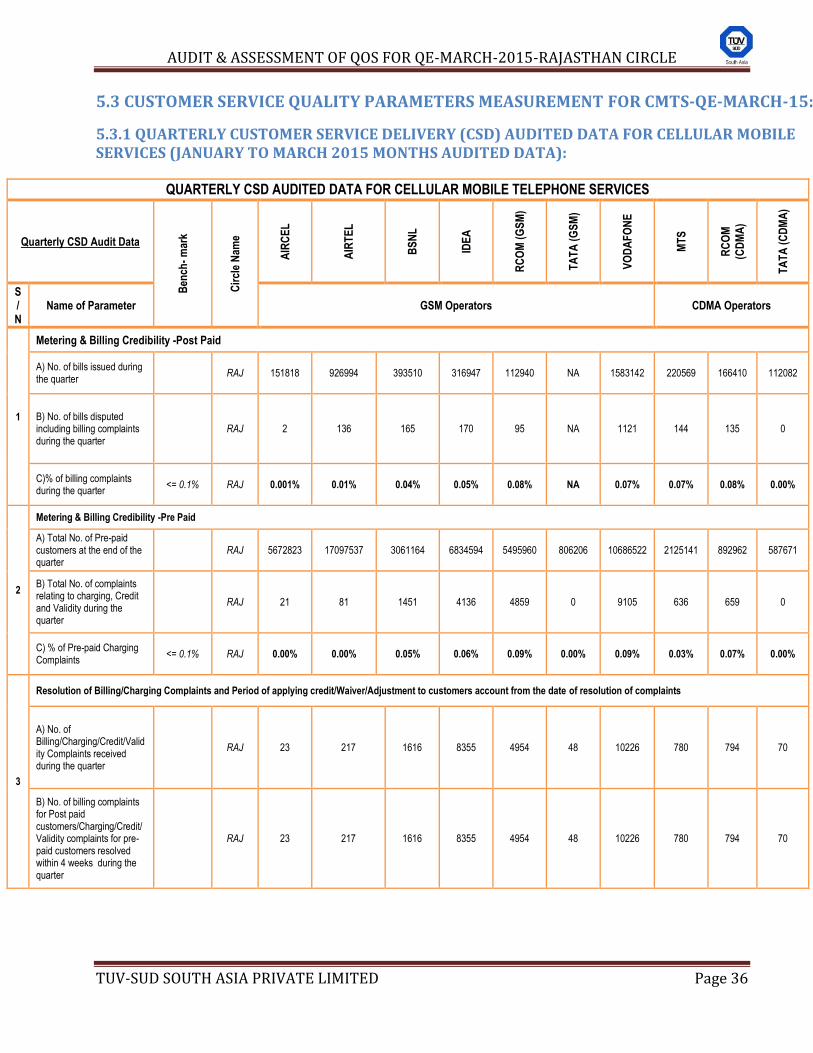
5.3 CUSTOMER SERVICE QUALITY PARAMETERS MEASUREMENT FOR CMTS-QE-MARCH-15:
5.3.1 QUARTERLY CUSTOMER SERVICE DELIVERY (CSD) AUDITED DATA FOR CELLULAR MOBILE SERVICES (JANUARY TO MARCH 2015 MONTHS AUDITED DATA):
QUARTERLY CSD AUDITED DATA FOR CELLULAR MOBILE TELEPHONE SERVICES
Quarterly CSD Audit Data
Ben
ch-
mar
k
Cir
cle
Nam
e
AIR
CE
L
AIR
TE
L
BS
NL
IDE
A
RC
OM
(G
SM
)
TA
TA
(G
SM
)
VO
DA
FO
NE
MT
S
RC
OM
(CD
MA
)
TA
TA
(C
DM
A)
S/ N
Name of Parameter GSM Operators CDMA Operators
1
Metering & Billing Credibility -Post Paid
A) No. of bills issued during the quarter
RAJ 151818 926994 393510 316947 112940 NA 1583142 220569 166410 112082
B) No. of bills disputed including billing complaints during the quarter
RAJ 2 136 165 170 95 NA 1121 144 135 0
C)% of billing complaints during the quarter
<= 0.1% RAJ 0.001% 0.01% 0.04% 0.05% 0.08% NA 0.07% 0.07% 0.08% 0.00%
2
Metering & Billing Credibility -Pre Paid
A) Total No. of Pre-paid customers at the end of the quarter
RAJ 5672823 17097537 3061164 6834594 5495960 806206 10686522 2125141 892962 587671
B) Total No. of complaints relating to charging, Credit and Validity during the quarter
RAJ 21 81 1451 4136 4859 0 9105 636 659 0
C) % of Pre-paid Charging Complaints
<= 0.1% RAJ 0.00% 0.00% 0.05% 0.06% 0.09% 0.00% 0.09% 0.03% 0.07% 0.00%
3
Resolution of Billing/Charging Complaints and Period of applying credit/Waiver/Adjustment to customers account from the date of resolution of complaints
A) No. of Billing/Charging/Credit/Validity Complaints received during the quarter
RAJ 23 217 1616 8355 4954 48 10226 780 794 70
B) No. of billing complaints for Post paid customers/Charging/Credit/Validity complaints for pre-paid customers resolved within 4 weeks during the quarter
RAJ 23 217 1616 8355 4954 48 10226 780 794 70
AUDIT & ASSESSMENT OF QOS FOR QE-MARCH-2015-RAJASTHAN CIRCLE
TUV-SUD SOUTH ASIA PRIVATE LIMITED Page 37
QUARTERLY CSD AUDITED DATA FOR CELLULAR MOBILE TELEPHONE SERVICES
Quarterly CSD Audit Data
Ben
ch-
mar
k
Cir
cle
Nam
e
AIR
CE
L
AIR
TE
L
BS
NL
IDE
A
RC
OM
(G
SM
)
TA
TA
(G
SM
)
VO
DA
FO
NE
MT
S
RC
OM
(CD
MA
)
TA
TA
(C
DM
A)
S/ N
Name of Parameter GSM Operators CDMA Operators
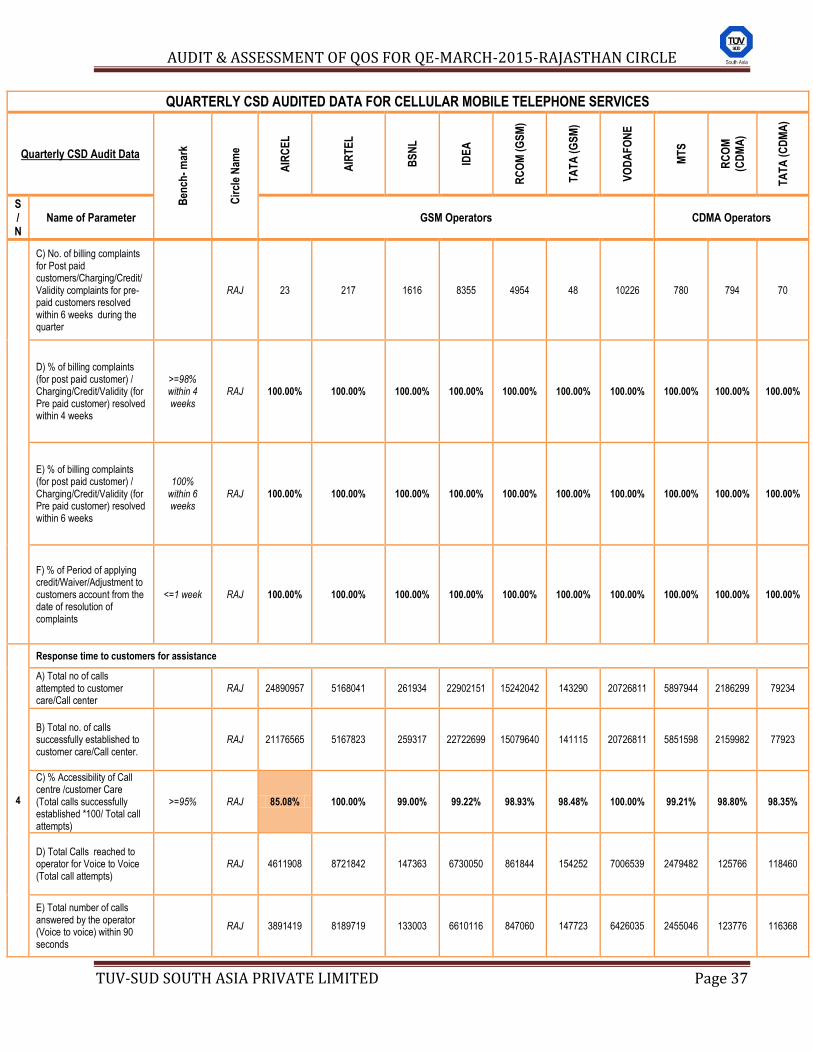
C) No. of billing complaints for Post paid customers/Charging/Credit/Validity complaints for pre-paid customers resolved within 6 weeks during the quarter
RAJ 23 217 1616 8355 4954 48 10226 780 794 70
D) % of billing complaints (for post paid customer) / Charging/Credit/Validity (for Pre paid customer) resolved within 4 weeks
>=98% within 4 weeks
RAJ 100.00% 100.00% 100.00% 100.00% 100.00% 100.00% 100.00% 100.00% 100.00% 100.00%
E) % of billing complaints (for post paid customer) / Charging/Credit/Validity (for Pre paid customer) resolved within 6 weeks
100% within 6 weeks
RAJ 100.00% 100.00% 100.00% 100.00% 100.00% 100.00% 100.00% 100.00% 100.00% 100.00%
F) % of Period of applying credit/Waiver/Adjustment to customers account from the date of resolution of complaints
<=1 week RAJ 100.00% 100.00% 100.00% 100.00% 100.00% 100.00% 100.00% 100.00% 100.00% 100.00%
4
Response time to customers for assistance
A) Total no of calls attempted to customer care/Call center
RAJ 24890957 5168041 261934 22902151 15242042 143290 20726811 5897944 2186299 79234
B) Total no. of calls successfully established to customer care/Call center.
RAJ 21176565 5167823 259317 22722699 15079640 141115 20726811 5851598 2159982 77923
C) % Accessibility of Call centre /customer Care (Total calls successfully established *100/ Total call attempts)
>=95% RAJ 85.08% 100.00% 99.00% 99.22% 98.93% 98.48% 100.00% 99.21% 98.80% 98.35%
D) Total Calls reached to operator for Voice to Voice (Total call attempts)
RAJ 4611908 8721842 147363 6730050 861844 154252 7006539 2479482 125766 118460
E) Total number of calls answered by the operator (Voice to voice) within 90 seconds
RAJ 3891419 8189719 133003 6610116 847060 147723 6426035 2455046 123776 116368
AUDIT & ASSESSMENT OF QOS FOR QE-MARCH-2015-RAJASTHAN CIRCLE
TUV-SUD SOUTH ASIA PRIVATE LIMITED Page 38
QUARTERLY CSD AUDITED DATA FOR CELLULAR MOBILE TELEPHONE SERVICES
Quarterly CSD Audit Data
Ben
ch-
mar
k
Cir
cle
Nam
e
AIR
CE
L
AIR
TE
L
BS
NL
IDE
A
RC
OM
(G
SM
)
TA
TA
(G
SM
)
VO
DA
FO
NE
MT
S
RC
OM
(CD
MA
)
TA
TA
(C
DM
A)
S/ N
Name of Parameter GSM Operators CDMA Operators
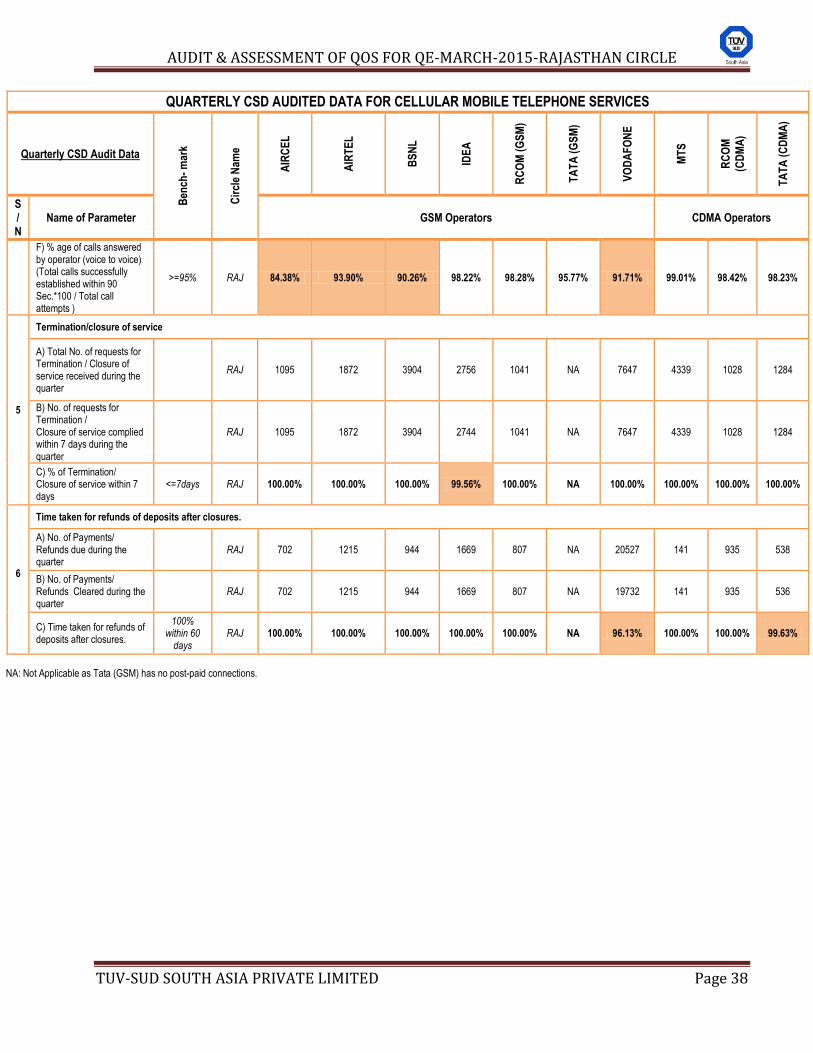
F) % age of calls answered by operator (voice to voice) (Total calls successfully established within 90 Sec.*100 / Total call attempts )
>=95% RAJ 84.38% 93.90% 90.26% 98.22% 98.28% 95.77% 91.71% 99.01% 98.42% 98.23%
5
Termination/closure of service
A) Total No. of requests for Termination / Closure of service received during the quarter
RAJ 1095 1872 3904 2756 1041 NA 7647 4339 1028 1284
B) No. of requests for Termination / Closure of service complied within 7 days during the quarter
RAJ 1095 1872 3904 2744 1041 NA 7647 4339 1028 1284
C) % of Termination/ Closure of service within 7 days
<=7days RAJ 100.00% 100.00% 100.00% 99.56% 100.00% NA 100.00% 100.00% 100.00% 100.00%
6
Time taken for refunds of deposits after closures.
A) No. of Payments/ Refunds due during the quarter
RAJ 702 1215 944 1669 807 NA 20527 141 935 538
B) No. of Payments/ Refunds Cleared during the quarter
RAJ 702 1215 944 1669 807 NA 19732 141 935 536
C) Time taken for refunds of deposits after closures.
100% within 60
days RAJ 100.00% 100.00% 100.00% 100.00% 100.00% NA 96.13% 100.00% 100.00% 99.63%
NA: Not Applicable as Tata (GSM) has no post-paid connections.
AUDIT & ASSESSMENT OF QOS FOR QE-MARCH-2015-RAJASTHAN CIRCLE
TUV-SUD SOUTH ASIA PRIVATE LIMITED Page 39
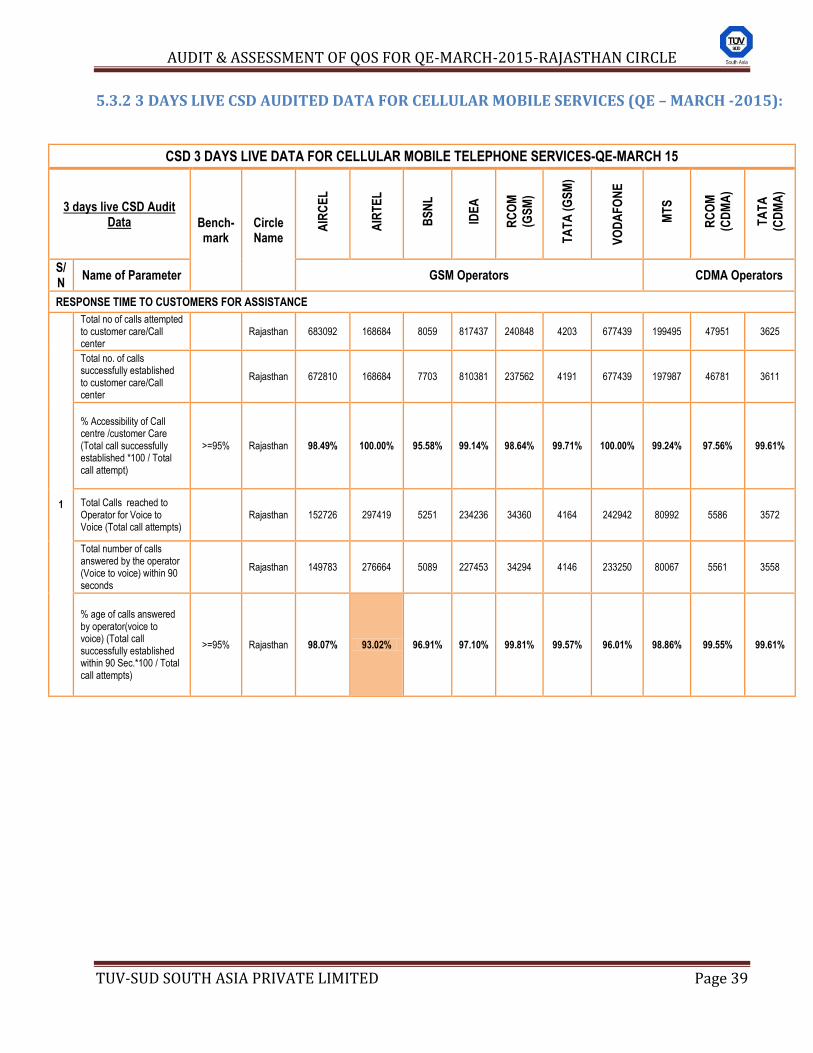
5.3.2 3 DAYS LIVE CSD AUDITED DATA FOR CELLULAR MOBILE SERVICES (QE – MARCH -2015):
CSD 3 DAYS LIVE DATA FOR CELLULAR MOBILE TELEPHONE SERVICES-QE-MARCH 15
3 days live CSD Audit Data Bench-
mark Circle Name
AIR
CE
L
AIR
TE
L
BS
NL
IDE
A
RC
OM
(GS
M)
TA
TA
(G
SM
)
VO
DA
FO
NE
MT
S
RC
OM
(CD
MA
)
TA
TA
(CD
MA
)
S/ N
Name of Parameter GSM Operators CDMA Operators
RESPONSE TIME TO CUSTOMERS FOR ASSISTANCE
1
Total no of calls attempted to customer care/Call center
Rajasthan 683092 168684 8059 817437 240848 4203 677439 199495 47951 3625
Total no. of calls successfully established to customer care/Call center
Rajasthan 672810 168684 7703 810381 237562 4191 677439 197987 46781 3611
% Accessibility of Call centre /customer Care (Total call successfully established *100 / Total call attempt)
>=95% Rajasthan 98.49% 100.00% 95.58% 99.14% 98.64% 99.71% 100.00% 99.24% 97.56% 99.61%
Total Calls reached to Operator for Voice to Voice (Total call attempts)
Rajasthan 152726 297419 5251 234236 34360 4164 242942 80992 5586 3572
Total number of calls answered by the operator (Voice to voice) within 90 seconds
Rajasthan 149783 276664 5089 227453 34294 4146 233250 80067 5561 3558
% age of calls answered by operator(voice to voice) (Total call successfully established within 90 Sec.*100 / Total call attempts)
>=95% Rajasthan 98.07% 93.02% 96.91% 97.10% 99.81% 99.57% 96.01% 98.86% 99.55% 99.61%
AUDIT & ASSESSMENT OF QOS FOR QE-MARCH-2015-RAJASTHAN CIRCLE
TUV-SUD SOUTH ASIA PRIVATE LIMITED Page 40
KEY FINDINGS: CUSTOMER SERVICE DELIVERY PARAMETERS
1. Metering and billing credibility-(Post paid & Pre-paid) The performance of the service providers with respect to the parameter metering and billing credibility for both post-paid and pre-paid is well within the prescribed bench mark of <=0.1 % for all the operators.
2. Resolution of Billing complaints and applying credits -
i. Resolution of billing /charging complaints ( >=98% within 4 weeks and 100% within 6 weeks)
ii. Period of applying credit/waiver/adjustment to customer’s account from the date of resolution of complaints
All operators have 100 % resolved the billing complaints within stipulated period of 4 weeks and 6 weeks. In all cases where customers were due for credit / adjustment, all the service providers have met the benchmark of 100 % refund in one week.
3. Response Time to the Customer for assistance
i. Accessibility of call centre/customer care (>95%) ii. Percentage of calls answered by Operators (Voice to Voice) (>95%)
All service providers are in compliance with respect to the parameter accessibility of call center except Aircel with its achieved value as 85.08%. Regarding Calls answered by operator (Voice to Voice), Aircel, Airtel, BSNL and Vodafone have not met the benchmark of >95% with their performed level as 84.38%, 93.90%, 90.26% and 91.71% respectively.
4. Termination/Closure of Service
In case of this parameters also, all service providers (except Idea) have settled the closure/termination within the benchmark of 7 days. Idea remained short of benchmark with its performance as 99.56%.
5. Time Taken for Refund of deposits after closures All operators (except Vodafone and Tata CDMA) were found to have complied with the benchmark of 100% refund of deposits within 60 days of closure. The performance of Vodafone and Tata CDMA remained 96.13% and 99.63% respectively.
Live Measurements: The results of three days live measurements reveal that all operators have met the benchmarks for the parameter Accessibility of Call Center. Regarding calls answered by operator (Voice to voice) within 90 seconds, Airtel remained non-complied with its performance as 93.02%.
AUDIT & ASSESSMENT OF QOS FOR QE-MARCH-2015-RAJASTHAN CIRCLE
TUV-SUD SOUTH ASIA PRIVATE LIMITED Page 41
6. LIVE CALLING ASSESSMENT
AUDIT & ASSESSMENT OF QOS FOR QE-MARCH-2015-RAJASTHAN CIRCLE
TUV-SUD SOUTH ASIA PRIVATE LIMITED Page 42
6. LIVE CALLING ASSESSMENT:
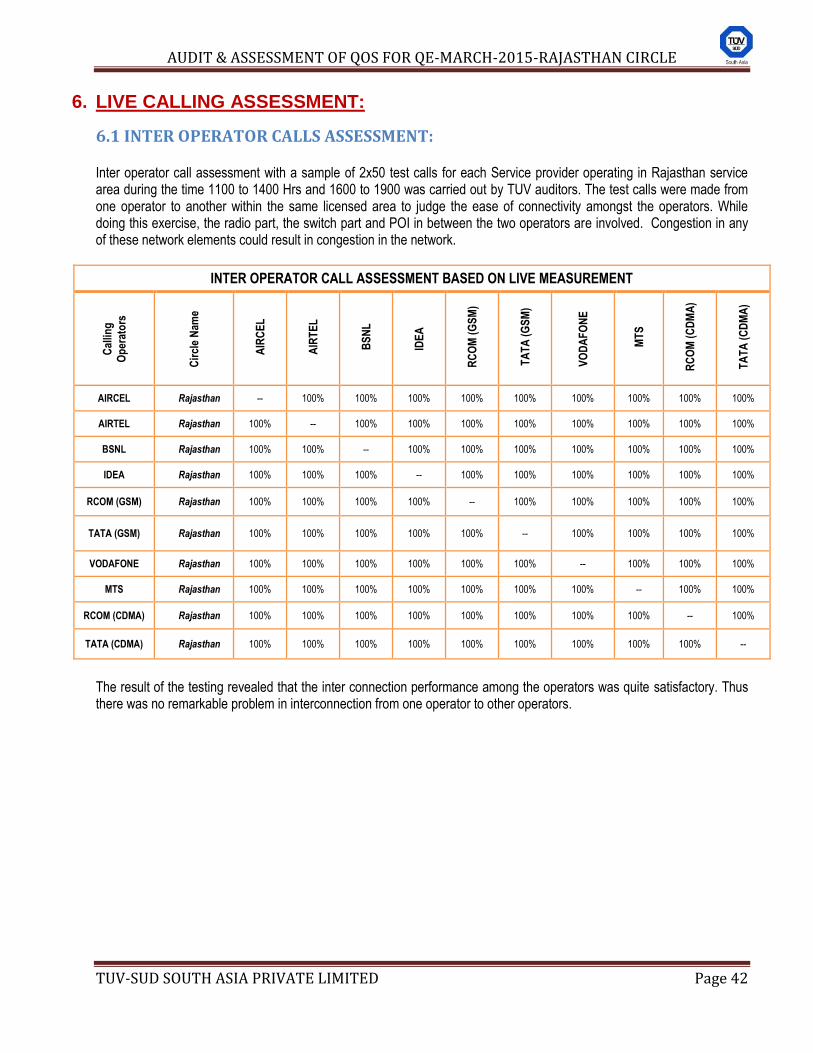
6.1 INTER OPERATOR CALLS ASSESSMENT: Inter operator call assessment with a sample of 2x50 test calls for each Service provider operating in Rajasthan service area during the time 1100 to 1400 Hrs and 1600 to 1900 was carried out by TUV auditors. The test calls were made from one operator to another within the same licensed area to judge the ease of connectivity amongst the operators. While doing this exercise, the radio part, the switch part and POI in between the two operators are involved. Congestion in any of these network elements could result in congestion in the network.
INTER OPERATOR CALL ASSESSMENT BASED ON LIVE MEASUREMENT
Cal
ling
Op
erat
ors
Cir
cle
Nam
e
AIR
CE
L
AIR
TE
L
BS
NL
IDE
A
RC
OM
(G
SM
)
TA
TA
(G
SM
)
VO
DA
FO
NE
MT
S
RC
OM
(C
DM
A)
TA
TA
(C
DM
A)
AIRCEL Rajasthan -- 100% 100% 100% 100% 100% 100% 100% 100% 100%
AIRTEL Rajasthan 100% -- 100% 100% 100% 100% 100% 100% 100% 100%
BSNL Rajasthan 100% 100% -- 100% 100% 100% 100% 100% 100% 100%
IDEA Rajasthan 100% 100% 100% -- 100% 100% 100% 100% 100% 100%
RCOM (GSM) Rajasthan 100% 100% 100% 100% -- 100% 100% 100% 100% 100%
TATA (GSM) Rajasthan 100% 100% 100% 100% 100% -- 100% 100% 100% 100%
VODAFONE Rajasthan 100% 100% 100% 100% 100% 100% -- 100% 100% 100%
MTS Rajasthan 100% 100% 100% 100% 100% 100% 100% -- 100% 100%
RCOM (CDMA) Rajasthan 100% 100% 100% 100% 100% 100% 100% 100% -- 100%
TATA (CDMA) Rajasthan 100% 100% 100% 100% 100% 100% 100% 100% 100% --
The result of the testing revealed that the inter connection performance among the operators was quite satisfactory. Thus there was no remarkable problem in interconnection from one operator to other operators.
AUDIT & ASSESSMENT OF QOS FOR QE-MARCH-2015-RAJASTHAN CIRCLE
TUV-SUD SOUTH ASIA PRIVATE LIMITED Page 43
6.2 CUSTOMER CARE / HELPLINE ASSESSMENT:
LIVE CALLING TO CALL CENTRE
Parameter Circle Name
AIRCEL AIRTEL BSNL IDEA RCOM (GSM)
TATA (GSM)
VODAFONE MTS RCOM
(CDMA) TATA
(CDMA)
Total No. of calls Attempted Rajasthan 100 100 100 100 100 100 100 100 100 100
Total no of calls attempted to customer care/Call center
Rajasthan 100 100 100 100 100 100 100 100 100 100
Total no. of calls successfully established to customer care/Call center
Rajasthan 100 100 98 98 99 99 100 99 98 99
% Accessibility of Call centre /customer Care (Total call successfully established *100 / Total call attempt)
Rajasthan 100.00% 100.00% 98.00% 98.00% 99.00% 99.00% 100.00% 99.00% 98.00% 99.00%
Total Calls reached to agent desk for Voice to Voice (Total call attempt)
Rajasthan 100 100 98 98 99 99 100 99 98 99
Total number of calls answered by the operator (Voice to voice) within 90 seconds
Rajasthan 100 100 96 97 98 98 100 99 96 98
% age of calls answered by operator(voice to voice) (Total call successfully established within 90 Sec.*100 / Total call attempt)
Rajasthan 100.00% 100.00% 97.96% 98.98% 98.99% 98.99% 100.00% 100.00% 97.96% 98.99%
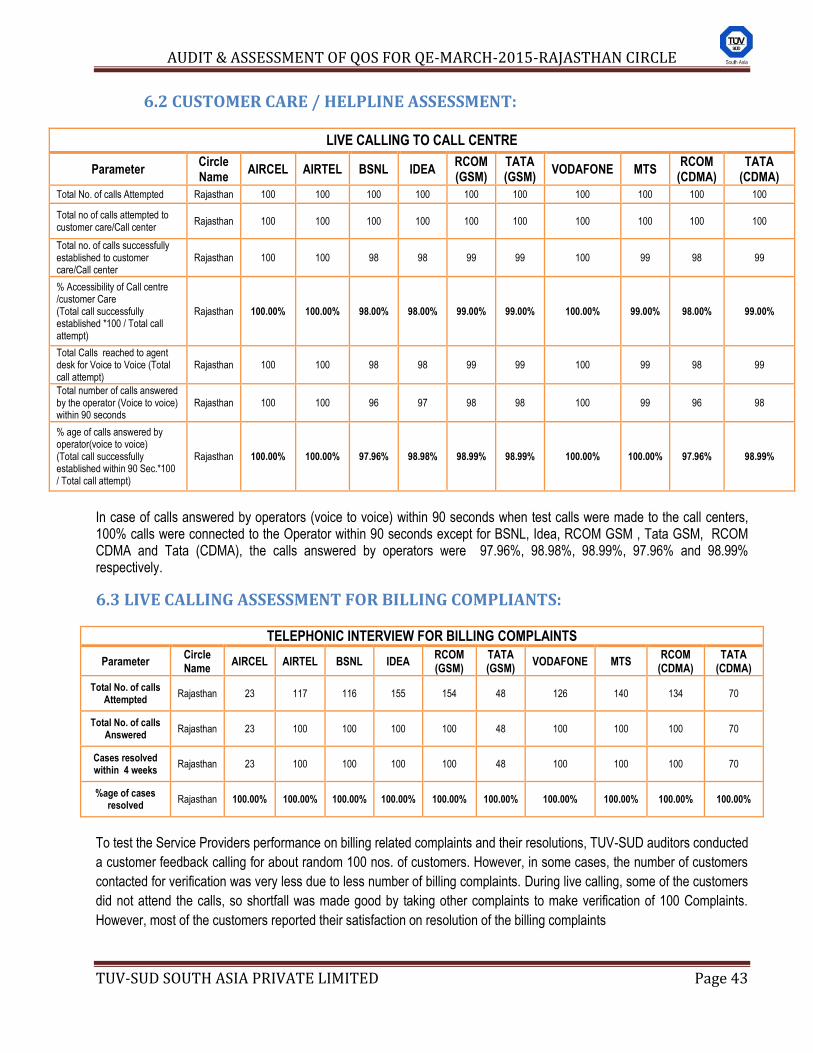
In case of calls answered by operators (voice to voice) within 90 seconds when test calls were made to the call centers, 100% calls were connected to the Operator within 90 seconds except for BSNL, Idea, RCOM GSM , Tata GSM, RCOM CDMA and Tata (CDMA), the calls answered by operators were 97.96%, 98.98%, 98.99%, 97.96% and 98.99% respectively.
6.3 LIVE CALLING ASSESSMENT FOR BILLING COMPLIANTS:
TELEPHONIC INTERVIEW FOR BILLING COMPLAINTS
Parameter Circle Name
AIRCEL AIRTEL BSNL IDEA RCOM (GSM)
TATA (GSM)
VODAFONE MTS RCOM
(CDMA) TATA
(CDMA)
Total No. of calls Attempted
Rajasthan 23 117 116 155 154 48 126 140 134 70
Total No. of calls Answered
Rajasthan 23 100 100 100 100 48 100 100 100 70
Cases resolved within 4 weeks
Rajasthan 23 100 100 100 100 48 100 100 100 70
%age of cases resolved
Rajasthan 100.00% 100.00% 100.00% 100.00% 100.00% 100.00% 100.00% 100.00% 100.00% 100.00%
To test the Service Providers performance on billing related complaints and their resolutions, TUV-SUD auditors conducted
a customer feedback calling for about random 100 nos. of customers. However, in some cases, the number of customers
contacted for verification was very less due to less number of billing complaints. During live calling, some of the customers
did not attend the calls, so shortfall was made good by taking other complaints to make verification of 100 Complaints.
However, most of the customers reported their satisfaction on resolution of the billing complaints
AUDIT & ASSESSMENT OF QOS FOR QE-MARCH-2015-RAJASTHAN CIRCLE
TUV-SUD SOUTH ASIA PRIVATE LIMITED Page 44
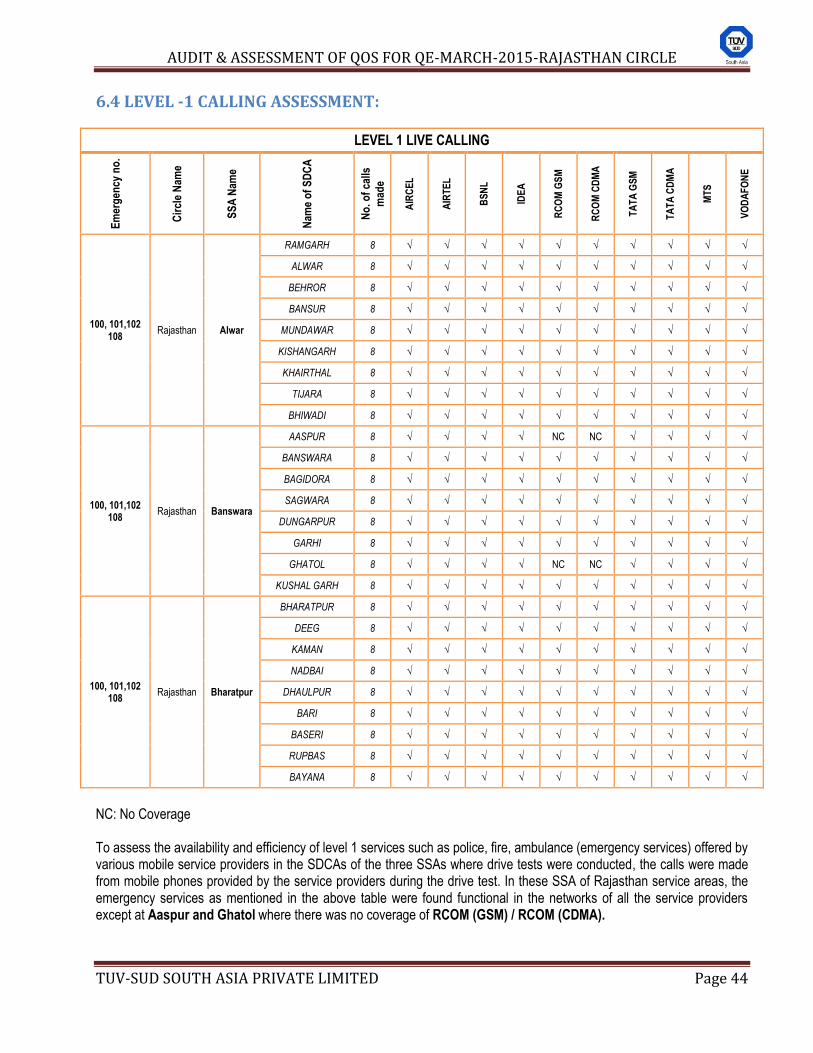
6.4 LEVEL -1 CALLING ASSESSMENT:
LEVEL 1 LIVE CALLING
Em
erg
ency
no
.
Cir
cle
Nam
e
SS
A N
ame
Nam
e o
f S
DC
A
No
. of
calls
mad
e
AIR
CE
L
AIR
TE
L
BS
NL
IDE
A
RC
OM
GS
M
RC
OM
CD
MA
TA
TA
GS
M
TA
TA
CD
MA
MT
S
VO
DA
FO
NE
100, 101,102 108
Rajasthan Alwar
RAMGARH 8 √ √ √ √ √ √ √ √ √ √
ALWAR 8 √ √ √ √ √ √ √ √ √ √
BEHROR 8 √ √ √ √ √ √ √ √ √ √
BANSUR 8 √ √ √ √ √ √ √ √ √ √
MUNDAWAR 8 √ √ √ √ √ √ √ √ √ √
KISHANGARH 8 √ √ √ √ √ √ √ √ √ √
KHAIRTHAL 8 √ √ √ √ √ √ √ √ √ √
TIJARA 8 √ √ √ √ √ √ √ √ √ √
BHIWADI 8 √ √ √ √ √ √ √ √ √ √
100, 101,102 108
Rajasthan Banswara
AASPUR 8 √ √ √ √ NC NC √ √ √ √
BANSWARA 8 √ √ √ √ √ √ √ √ √ √
BAGIDORA 8 √ √ √ √ √ √ √ √ √ √
SAGWARA 8 √ √ √ √ √ √ √ √ √ √
DUNGARPUR 8 √ √ √ √ √ √ √ √ √ √
GARHI 8 √ √ √ √ √ √ √ √ √ √
GHATOL 8 √ √ √ √ NC NC √ √ √ √
KUSHAL GARH 8 √ √ √ √ √ √ √ √ √ √
100, 101,102 108
Rajasthan Bharatpur
BHARATPUR 8 √ √ √ √ √ √ √ √ √ √
DEEG 8 √ √ √ √ √ √ √ √ √ √
KAMAN 8 √ √ √ √ √ √ √ √ √ √
NADBAI 8 √ √ √ √ √ √ √ √ √ √
DHAULPUR 8 √ √ √ √ √ √ √ √ √ √
BARI 8 √ √ √ √ √ √ √ √ √ √
BASERI 8 √ √ √ √ √ √ √ √ √ √
RUPBAS 8 √ √ √ √ √ √ √ √ √ √
BAYANA 8 √ √ √ √ √ √ √ √ √ √
NC: No Coverage To assess the availability and efficiency of level 1 services such as police, fire, ambulance (emergency services) offered by various mobile service providers in the SDCAs of the three SSAs where drive tests were conducted, the calls were made from mobile phones provided by the service providers during the drive test. In these SSA of Rajasthan service areas, the emergency services as mentioned in the above table were found functional in the networks of all the service providers except at Aaspur and Ghatol where there was no coverage of RCOM (GSM) / RCOM (CDMA).
AUDIT & ASSESSMENT OF QOS FOR QE-MARCH-2015-RAJASTHAN CIRCLE
TUV-SUD SOUTH ASIA PRIVATE LIMITED Page 45
7. DRIVE TEST
AUDIT & ASSESSMENT OF QOS FOR QE-MARCH-2015-RAJASTHAN CIRCLE
TUV-SUD SOUTH ASIA PRIVATE LIMITED Page 46
7. OPERATOR ASSESTID DRIVE TEST In terms of TRAI‟s letter dated 21st January, 2014, the drive tests were conducted for three consecutive days in one select SSA each month in each service area. Thus, the drive tests were carried out in three SSA‟s namely Alwar, Banswara and Bharatpur in the months of January, February and March 2015 respectively .The total route Kms covered during the drive tests in the respective SSAs was 386Kms, 354Kms and 400Kms. The performance of the operators has been highlighted below in the tables. The drive test was conducted simultaneously for all the operators following the same route of drive tests. The holding period for all test calls was 120 seconds. The drive test vehicle across all routes plied at a speed of about 30-50 km per hour. For measuring voice quality, Rx Qual samples on a scale from 0 to 7 for GSM operators and Frame Error Rate (FERs) for CDMA service providers were measured. As per the QoS norms, Rx Qual between 0- 5 for GSM operators and between 0-4% FER value for CDMA operators FERs is considered to be good, where as Rx Qual beyond this benchmark is considered to be bad. Call drops were measured by the number of calls that were dropped to the total number of calls established during the drive test. Similarly CSSR was measured as the ratio of total calls established to the total call
attempts made. Signal strength was measured in dBm at street level with strength ≥ -75 dBm for in-door coverage and ≥ -
85 dBm for in-vehicle. .
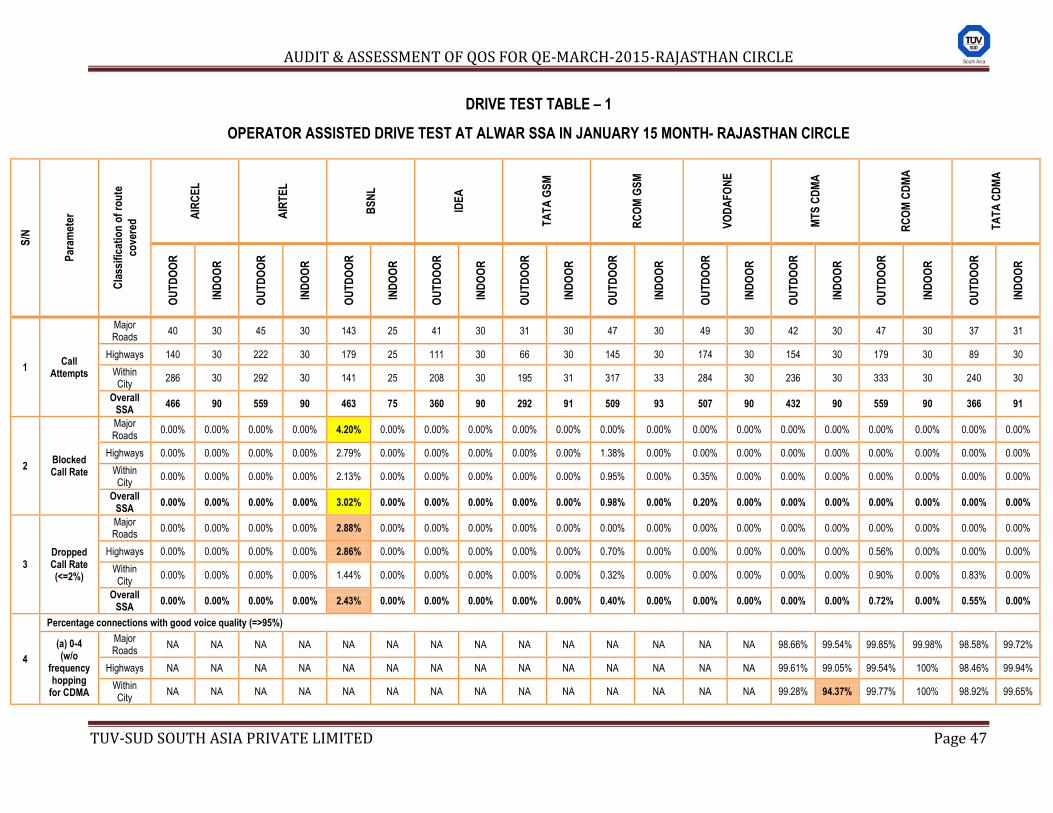
AUDIT & ASSESSMENT OF QOS FOR QE-MARCH-2015-RAJASTHAN CIRCLE
TUV-SUD SOUTH ASIA PRIVATE LIMITED Page 47
DRIVE TEST TABLE – 1
OPERATOR ASSISTED DRIVE TEST AT ALWAR SSA IN JANUARY 15 MONTH- RAJASTHAN CIRCLE
S/N
Par
amet
er
Cla
ssif
icat
ion
of
rou
te
cove
red
AIR
CE
L
AIR
TE
L
BS
NL
IDE
A
TA
TA
GS
M
RC
OM
GS
M
VO
DA
FO
NE
MT
S C
DM
A
RC
OM
CD
MA
TA
TA
CD
MA
OU
TD
OO
R
IND
OO
R
OU
TD
OO
R
IND
OO
R
OU
TD
OO
R
IND
OO
R
OU
TD
OO
R
IND
OO
R
OU
TD
OO
R
IND
OO
R
OU
TD
OO
R
IND
OO
R
OU
TD
OO
R
IND
OO
R
OU
TD
OO
R
IND
OO
R
OU
TD
OO
R
IND
OO
R
OU
TD
OO
R
IND
OO
R
1 Call
Attempts
Major Roads
40 30 45 30 143 25 41 30 31 30 47 30 49 30 42 30 47 30 37 31
Highways 140 30 222 30 179 25 111 30 66 30 145 30 174 30 154 30 179 30 89 30
Within City
286 30 292 30 141 25 208 30 195 31 317 33 284 30 236 30 333 30 240 30
Overall SSA
466 90 559 90 463 75 360 90 292 91 509 93 507 90 432 90 559 90 366 91
2 Blocked Call Rate
Major Roads
0.00% 0.00% 0.00% 0.00% 4.20% 0.00% 0.00% 0.00% 0.00% 0.00% 0.00% 0.00% 0.00% 0.00% 0.00% 0.00% 0.00% 0.00% 0.00% 0.00%
Highways 0.00% 0.00% 0.00% 0.00% 2.79% 0.00% 0.00% 0.00% 0.00% 0.00% 1.38% 0.00% 0.00% 0.00% 0.00% 0.00% 0.00% 0.00% 0.00% 0.00%
Within City
0.00% 0.00% 0.00% 0.00% 2.13% 0.00% 0.00% 0.00% 0.00% 0.00% 0.95% 0.00% 0.35% 0.00% 0.00% 0.00% 0.00% 0.00% 0.00% 0.00%
Overall SSA
0.00% 0.00% 0.00% 0.00% 3.02% 0.00% 0.00% 0.00% 0.00% 0.00% 0.98% 0.00% 0.20% 0.00% 0.00% 0.00% 0.00% 0.00% 0.00% 0.00%
3 Dropped Call Rate (<=2%)
Major Roads
0.00% 0.00% 0.00% 0.00% 2.88% 0.00% 0.00% 0.00% 0.00% 0.00% 0.00% 0.00% 0.00% 0.00% 0.00% 0.00% 0.00% 0.00% 0.00% 0.00%
Highways 0.00% 0.00% 0.00% 0.00% 2.86% 0.00% 0.00% 0.00% 0.00% 0.00% 0.70% 0.00% 0.00% 0.00% 0.00% 0.00% 0.56% 0.00% 0.00% 0.00%
Within City
0.00% 0.00% 0.00% 0.00% 1.44% 0.00% 0.00% 0.00% 0.00% 0.00% 0.32% 0.00% 0.00% 0.00% 0.00% 0.00% 0.90% 0.00% 0.83% 0.00%
Overall SSA
0.00% 0.00% 0.00% 0.00% 2.43% 0.00% 0.00% 0.00% 0.00% 0.00% 0.40% 0.00% 0.00% 0.00% 0.00% 0.00% 0.72% 0.00% 0.55% 0.00%
4
Percentage connections with good voice quality (=>95%)
(a) 0-4 (w/o
frequency hopping
for CDMA
Major Roads
NA NA NA NA NA NA NA NA NA NA NA NA NA NA 98.66% 99.54% 99.85% 99.98% 98.58% 99.72%
Highways NA NA NA NA NA NA NA NA NA NA NA NA NA NA 99.61% 99.05% 99.54% 100% 98.46% 99.94%
Within City
NA NA NA NA NA NA NA NA NA NA NA NA NA NA 99.28% 94.37% 99.77% 100% 98.92% 99.65%
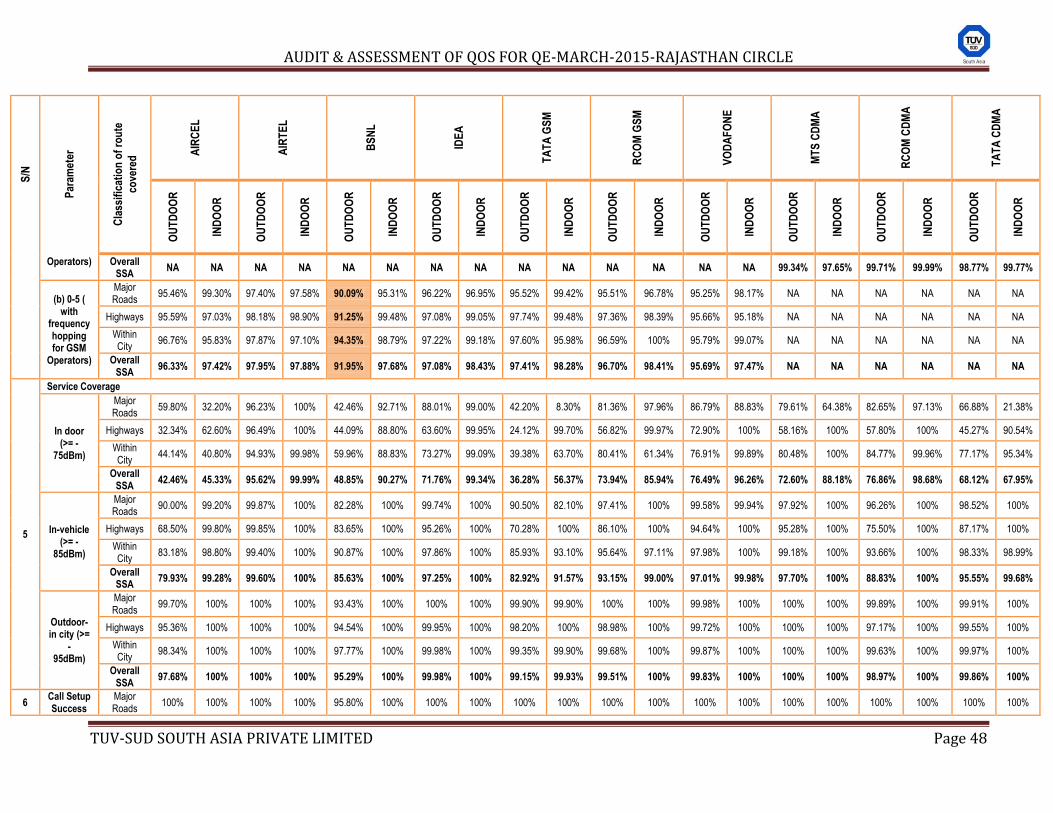
AUDIT & ASSESSMENT OF QOS FOR QE-MARCH-2015-RAJASTHAN CIRCLE
TUV-SUD SOUTH ASIA PRIVATE LIMITED Page 48
S/N
Par
amet
er
Cla
ssif
icat
ion
of
rou
te
cove
red
AIR
CE
L
AIR
TE
L
BS
NL
IDE
A
TA
TA
GS
M
RC
OM
GS
M
VO
DA
FO
NE
MT
S C
DM
A
RC
OM
CD
MA
TA
TA
CD
MA
OU
TD
OO
R
IND
OO
R
OU
TD
OO
R
IND
OO
R
OU
TD
OO
R
IND
OO
R
OU
TD
OO
R
IND
OO
R
OU
TD
OO
R
IND
OO
R
OU
TD
OO
R
IND
OO
R
OU
TD
OO
R
IND
OO
R
OU
TD
OO
R
IND
OO
R
OU
TD
OO
R
IND
OO
R
OU
TD
OO
R
IND
OO
R
Operators) Overall SSA
NA NA NA NA NA NA NA NA NA NA NA NA NA NA 99.34% 97.65% 99.71% 99.99% 98.77% 99.77%
(b) 0-5 ( with
frequency hopping for GSM
Operators)
Major Roads
95.46% 99.30% 97.40% 97.58% 90.09% 95.31% 96.22% 96.95% 95.52% 99.42% 95.51% 96.78% 95.25% 98.17% NA NA NA NA NA NA
Highways 95.59% 97.03% 98.18% 98.90% 91.25% 99.48% 97.08% 99.05% 97.74% 99.48% 97.36% 98.39% 95.66% 95.18% NA NA NA NA NA NA
Within City
96.76% 95.83% 97.87% 97.10% 94.35% 98.79% 97.22% 99.18% 97.60% 95.98% 96.59% 100% 95.79% 99.07% NA NA NA NA NA NA
Overall SSA
96.33% 97.42% 97.95% 97.88% 91.95% 97.68% 97.08% 98.43% 97.41% 98.28% 96.70% 98.41% 95.69% 97.47% NA NA NA NA NA NA
5
Service Coverage
In door (>= -
75dBm)
Major Roads
59.80% 32.20% 96.23% 100% 42.46% 92.71% 88.01% 99.00% 42.20% 8.30% 81.36% 97.96% 86.79% 88.83% 79.61% 64.38% 82.65% 97.13% 66.88% 21.38%
Highways 32.34% 62.60% 96.49% 100% 44.09% 88.80% 63.60% 99.95% 24.12% 99.70% 56.82% 99.97% 72.90% 100% 58.16% 100% 57.80% 100% 45.27% 90.54%
Within City
44.14% 40.80% 94.93% 99.98% 59.96% 88.83% 73.27% 99.09% 39.38% 63.70% 80.41% 61.34% 76.91% 99.89% 80.48% 100% 84.77% 99.96% 77.17% 95.34%
Overall SSA
42.46% 45.33% 95.62% 99.99% 48.85% 90.27% 71.76% 99.34% 36.28% 56.37% 73.94% 85.94% 76.49% 96.26% 72.60% 88.18% 76.86% 98.68% 68.12% 67.95%
In-vehicle (>= -
85dBm)
Major Roads
90.00% 99.20% 99.87% 100% 82.28% 100% 99.74% 100% 90.50% 82.10% 97.41% 100% 99.58% 99.94% 97.92% 100% 96.26% 100% 98.52% 100%
Highways 68.50% 99.80% 99.85% 100% 83.65% 100% 95.26% 100% 70.28% 100% 86.10% 100% 94.64% 100% 95.28% 100% 75.50% 100% 87.17% 100%
Within City
83.18% 98.80% 99.40% 100% 90.87% 100% 97.86% 100% 85.93% 93.10% 95.64% 97.11% 97.98% 100% 99.18% 100% 93.66% 100% 98.33% 98.99%
Overall SSA
79.93% 99.28% 99.60% 100% 85.63% 100% 97.25% 100% 82.92% 91.57% 93.15% 99.00% 97.01% 99.98% 97.70% 100% 88.83% 100% 95.55% 99.68%
Outdoor- in city (>=
- 95dBm)
Major Roads
99.70% 100% 100% 100% 93.43% 100% 100% 100% 99.90% 99.90% 100% 100% 99.98% 100% 100% 100% 99.89% 100% 99.91% 100%
Highways 95.36% 100% 100% 100% 94.54% 100% 99.95% 100% 98.20% 100% 98.98% 100% 99.72% 100% 100% 100% 97.17% 100% 99.55% 100%
Within City
98.34% 100% 100% 100% 97.77% 100% 99.98% 100% 99.35% 99.90% 99.68% 100% 99.87% 100% 100% 100% 99.63% 100% 99.97% 100%
Overall SSA
97.68% 100% 100% 100% 95.29% 100% 99.98% 100% 99.15% 99.93% 99.51% 100% 99.83% 100% 100% 100% 98.97% 100% 99.86% 100%
6 Call Setup Success
Major Roads
100% 100% 100% 100% 95.80% 100% 100% 100% 100% 100% 100% 100% 100% 100% 100% 100% 100% 100% 100% 100%
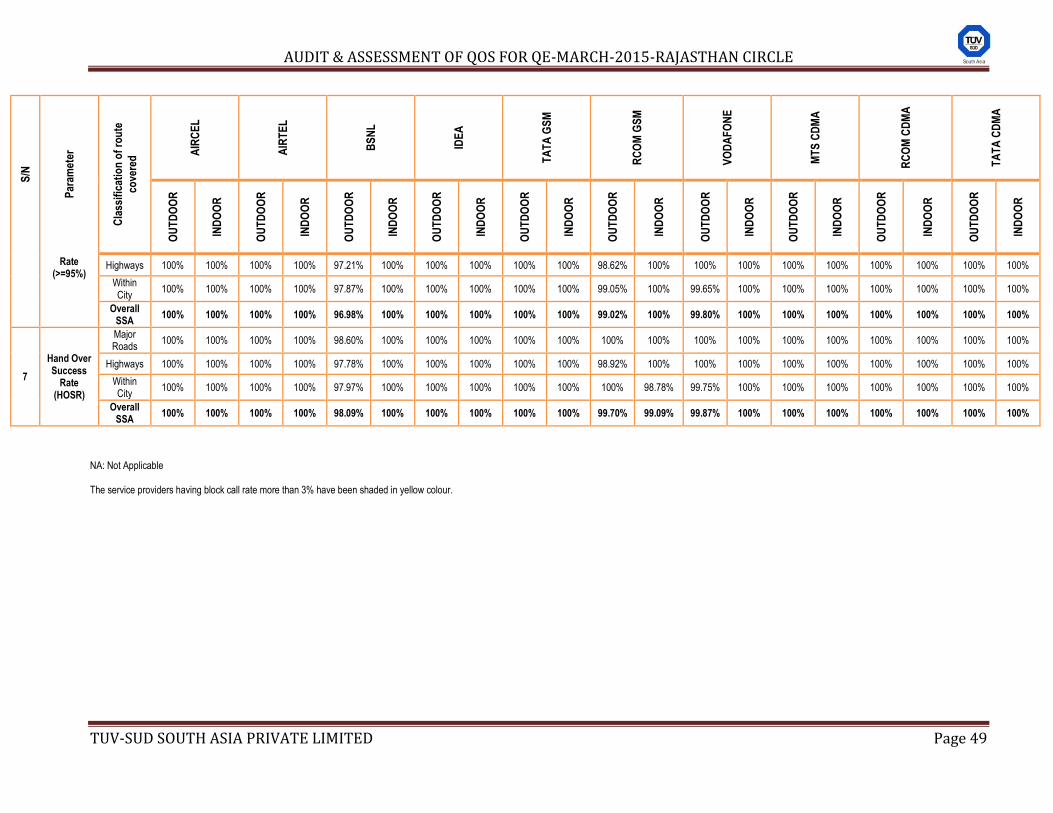
AUDIT & ASSESSMENT OF QOS FOR QE-MARCH-2015-RAJASTHAN CIRCLE
TUV-SUD SOUTH ASIA PRIVATE LIMITED Page 49
S/N
Par
amet
er
Cla
ssif
icat
ion
of
rou
te
cove
red
AIR
CE
L
AIR
TE
L
BS
NL
IDE
A
TA
TA
GS
M
RC
OM
GS
M
VO
DA
FO
NE
MT
S C
DM
A
RC
OM
CD
MA
TA
TA
CD
MA
OU
TD
OO
R
IND
OO
R
OU
TD
OO
R
IND
OO
R
OU
TD
OO
R
IND
OO
R
OU
TD
OO
R
IND
OO
R
OU
TD
OO
R
IND
OO
R
OU
TD
OO
R
IND
OO
R
OU
TD
OO
R
IND
OO
R
OU
TD
OO
R
IND
OO
R
OU
TD
OO
R
IND
OO
R
OU
TD
OO
R
IND
OO
R
Rate (>=95%)
Highways 100% 100% 100% 100% 97.21% 100% 100% 100% 100% 100% 98.62% 100% 100% 100% 100% 100% 100% 100% 100% 100%
Within City
100% 100% 100% 100% 97.87% 100% 100% 100% 100% 100% 99.05% 100% 99.65% 100% 100% 100% 100% 100% 100% 100%
Overall SSA
100% 100% 100% 100% 96.98% 100% 100% 100% 100% 100% 99.02% 100% 99.80% 100% 100% 100% 100% 100% 100% 100%
7
Hand Over Success
Rate (HOSR)
Major Roads
100% 100% 100% 100% 98.60% 100% 100% 100% 100% 100% 100% 100% 100% 100% 100% 100% 100% 100% 100% 100%
Highways 100% 100% 100% 100% 97.78% 100% 100% 100% 100% 100% 98.92% 100% 100% 100% 100% 100% 100% 100% 100% 100%
Within City
100% 100% 100% 100% 97.97% 100% 100% 100% 100% 100% 100% 98.78% 99.75% 100% 100% 100% 100% 100% 100% 100%
Overall SSA
100% 100% 100% 100% 98.09% 100% 100% 100% 100% 100% 99.70% 99.09% 99.87% 100% 100% 100% 100% 100% 100% 100%
NA: Not Applicable The service providers having block call rate more than 3% have been shaded in yellow colour.
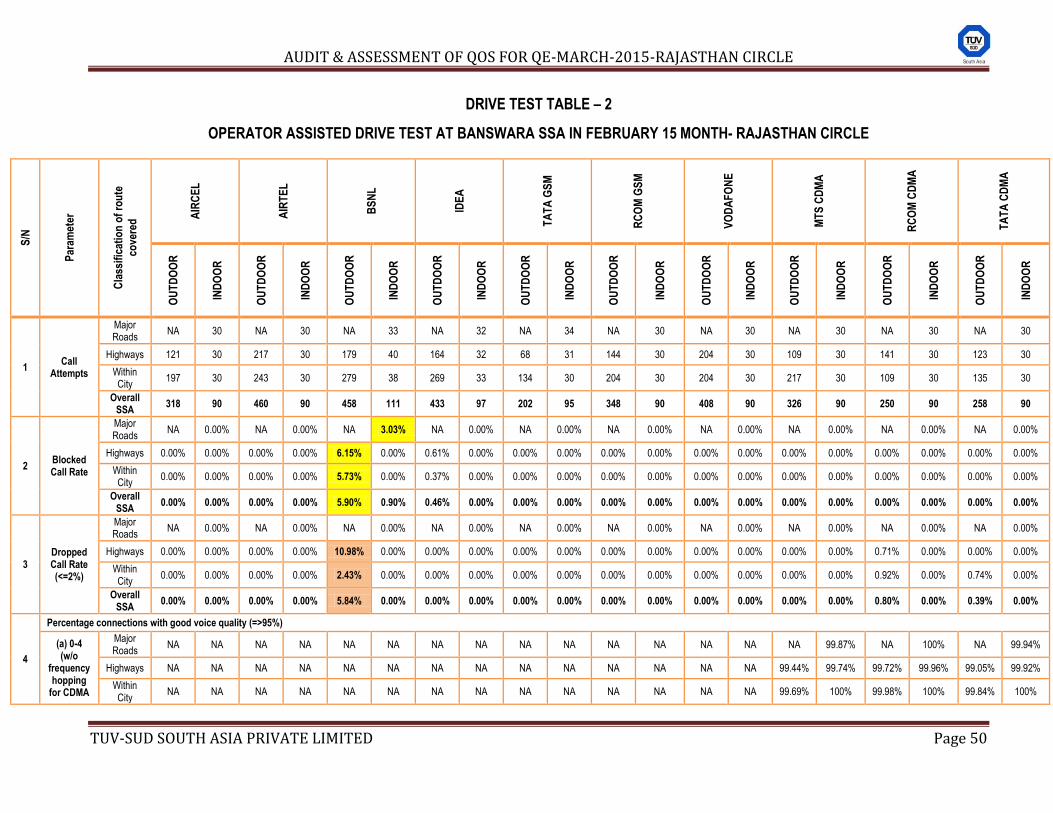
AUDIT & ASSESSMENT OF QOS FOR QE-MARCH-2015-RAJASTHAN CIRCLE
TUV-SUD SOUTH ASIA PRIVATE LIMITED Page 50
DRIVE TEST TABLE – 2
OPERATOR ASSISTED DRIVE TEST AT BANSWARA SSA IN FEBRUARY 15 MONTH- RAJASTHAN CIRCLE
S/N
Par
amet
er
Cla
ssif
icat
ion
of
rou
te
cove
red
AIR
CE
L
AIR
TE
L
BS
NL
IDE
A
TA
TA
GS
M
RC
OM
GS
M
VO
DA
FO
NE
MT
S C
DM
A
RC
OM
CD
MA
TA
TA
CD
MA
OU
TD
OO
R
IND
OO
R
OU
TD
OO
R
IND
OO
R
OU
TD
OO
R
IND
OO
R
OU
TD
OO
R
IND
OO
R
OU
TD
OO
R
IND
OO
R
OU
TD
OO
R
IND
OO
R
OU
TD
OO
R
IND
OO
R
OU
TD
OO
R
IND
OO
R
OU
TD
OO
R
IND
OO
R
OU
TD
OO
R
IND
OO
R
1 Call
Attempts
Major Roads
NA 30 NA 30 NA 33 NA 32 NA 34 NA 30 NA 30 NA 30 NA 30 NA 30
Highways 121 30 217 30 179 40 164 32 68 31 144 30 204 30 109 30 141 30 123 30
Within City
197 30 243 30 279 38 269 33 134 30 204 30 204 30 217 30 109 30 135 30
Overall SSA
318 90 460 90 458 111 433 97 202 95 348 90 408 90 326 90 250 90 258 90
2 Blocked Call Rate
Major Roads
NA 0.00% NA 0.00% NA 3.03% NA 0.00% NA 0.00% NA 0.00% NA 0.00% NA 0.00% NA 0.00% NA 0.00%
Highways 0.00% 0.00% 0.00% 0.00% 6.15% 0.00% 0.61% 0.00% 0.00% 0.00% 0.00% 0.00% 0.00% 0.00% 0.00% 0.00% 0.00% 0.00% 0.00% 0.00%
Within City
0.00% 0.00% 0.00% 0.00% 5.73% 0.00% 0.37% 0.00% 0.00% 0.00% 0.00% 0.00% 0.00% 0.00% 0.00% 0.00% 0.00% 0.00% 0.00% 0.00%
Overall SSA
0.00% 0.00% 0.00% 0.00% 5.90% 0.90% 0.46% 0.00% 0.00% 0.00% 0.00% 0.00% 0.00% 0.00% 0.00% 0.00% 0.00% 0.00% 0.00% 0.00%
3 Dropped Call Rate (<=2%)
Major Roads
NA 0.00% NA 0.00% NA 0.00% NA 0.00% NA 0.00% NA 0.00% NA 0.00% NA 0.00% NA 0.00% NA 0.00%
Highways 0.00% 0.00% 0.00% 0.00% 10.98% 0.00% 0.00% 0.00% 0.00% 0.00% 0.00% 0.00% 0.00% 0.00% 0.00% 0.00% 0.71% 0.00% 0.00% 0.00%
Within City
0.00% 0.00% 0.00% 0.00% 2.43% 0.00% 0.00% 0.00% 0.00% 0.00% 0.00% 0.00% 0.00% 0.00% 0.00% 0.00% 0.92% 0.00% 0.74% 0.00%
Overall SSA
0.00% 0.00% 0.00% 0.00% 5.84% 0.00% 0.00% 0.00% 0.00% 0.00% 0.00% 0.00% 0.00% 0.00% 0.00% 0.00% 0.80% 0.00% 0.39% 0.00%
4
Percentage connections with good voice quality (=>95%)
(a) 0-4 (w/o
frequency hopping
for CDMA
Major Roads
NA NA NA NA NA NA NA NA NA NA NA NA NA NA NA 99.87% NA 100% NA 99.94%
Highways NA NA NA NA NA NA NA NA NA NA NA NA NA NA 99.44% 99.74% 99.72% 99.96% 99.05% 99.92%
Within City
NA NA NA NA NA NA NA NA NA NA NA NA NA NA 99.69% 100% 99.98% 100% 99.84% 100%
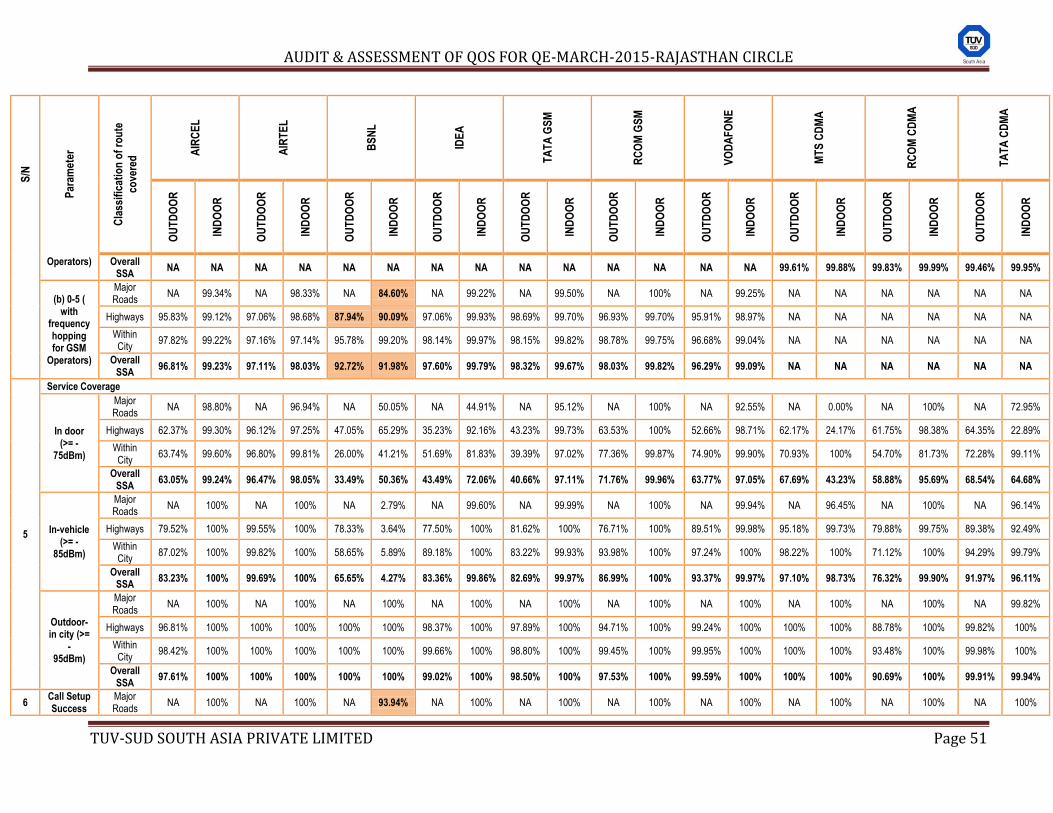
AUDIT & ASSESSMENT OF QOS FOR QE-MARCH-2015-RAJASTHAN CIRCLE
TUV-SUD SOUTH ASIA PRIVATE LIMITED Page 51
S/N
Par
amet
er
Cla
ssif
icat
ion
of
rou
te
cove
red
AIR
CE
L
AIR
TE
L
BS
NL
IDE
A
TA
TA
GS
M
RC
OM
GS
M
VO
DA
FO
NE
MT
S C
DM
A
RC
OM
CD
MA
TA
TA
CD
MA
OU
TD
OO
R
IND
OO
R
OU
TD
OO
R
IND
OO
R
OU
TD
OO
R
IND
OO
R
OU
TD
OO
R
IND
OO
R
OU
TD
OO
R
IND
OO
R
OU
TD
OO
R
IND
OO
R
OU
TD
OO
R
IND
OO
R
OU
TD
OO
R
IND
OO
R
OU
TD
OO
R
IND
OO
R
OU
TD
OO
R
IND
OO
R
Operators) Overall SSA
NA NA NA NA NA NA NA NA NA NA NA NA NA NA 99.61% 99.88% 99.83% 99.99% 99.46% 99.95%
(b) 0-5 ( with
frequency hopping for GSM
Operators)
Major Roads
NA 99.34% NA 98.33% NA 84.60% NA 99.22% NA 99.50% NA 100% NA 99.25% NA NA NA NA NA NA
Highways 95.83% 99.12% 97.06% 98.68% 87.94% 90.09% 97.06% 99.93% 98.69% 99.70% 96.93% 99.70% 95.91% 98.97% NA NA NA NA NA NA
Within City
97.82% 99.22% 97.16% 97.14% 95.78% 99.20% 98.14% 99.97% 98.15% 99.82% 98.78% 99.75% 96.68% 99.04% NA NA NA NA NA NA
Overall SSA
96.81% 99.23% 97.11% 98.03% 92.72% 91.98% 97.60% 99.79% 98.32% 99.67% 98.03% 99.82% 96.29% 99.09% NA NA NA NA NA NA
5
Service Coverage
In door (>= -
75dBm)
Major Roads
NA 98.80% NA 96.94% NA 50.05% NA 44.91% NA 95.12% NA 100% NA 92.55% NA 0.00% NA 100% NA 72.95%
Highways 62.37% 99.30% 96.12% 97.25% 47.05% 65.29% 35.23% 92.16% 43.23% 99.73% 63.53% 100% 52.66% 98.71% 62.17% 24.17% 61.75% 98.38% 64.35% 22.89%
Within City
63.74% 99.60% 96.80% 99.81% 26.00% 41.21% 51.69% 81.83% 39.39% 97.02% 77.36% 99.87% 74.90% 99.90% 70.93% 100% 54.70% 81.73% 72.28% 99.11%
Overall SSA
63.05% 99.24% 96.47% 98.05% 33.49% 50.36% 43.49% 72.06% 40.66% 97.11% 71.76% 99.96% 63.77% 97.05% 67.69% 43.23% 58.88% 95.69% 68.54% 64.68%
In-vehicle (>= -
85dBm)
Major Roads
NA 100% NA 100% NA 2.79% NA 99.60% NA 99.99% NA 100% NA 99.94% NA 96.45% NA 100% NA 96.14%
Highways 79.52% 100% 99.55% 100% 78.33% 3.64% 77.50% 100% 81.62% 100% 76.71% 100% 89.51% 99.98% 95.18% 99.73% 79.88% 99.75% 89.38% 92.49%
Within City
87.02% 100% 99.82% 100% 58.65% 5.89% 89.18% 100% 83.22% 99.93% 93.98% 100% 97.24% 100% 98.22% 100% 71.12% 100% 94.29% 99.79%
Overall SSA
83.23% 100% 99.69% 100% 65.65% 4.27% 83.36% 99.86% 82.69% 99.97% 86.99% 100% 93.37% 99.97% 97.10% 98.73% 76.32% 99.90% 91.97% 96.11%
Outdoor- in city (>=
- 95dBm)
Major Roads
NA 100% NA 100% NA 100% NA 100% NA 100% NA 100% NA 100% NA 100% NA 100% NA 99.82%
Highways 96.81% 100% 100% 100% 100% 100% 98.37% 100% 97.89% 100% 94.71% 100% 99.24% 100% 100% 100% 88.78% 100% 99.82% 100%
Within City
98.42% 100% 100% 100% 100% 100% 99.66% 100% 98.80% 100% 99.45% 100% 99.95% 100% 100% 100% 93.48% 100% 99.98% 100%
Overall SSA
97.61% 100% 100% 100% 100% 100% 99.02% 100% 98.50% 100% 97.53% 100% 99.59% 100% 100% 100% 90.69% 100% 99.91% 99.94%
6 Call Setup Success
Major Roads
NA 100% NA 100% NA 93.94% NA 100% NA 100% NA 100% NA 100% NA 100% NA 100% NA 100%
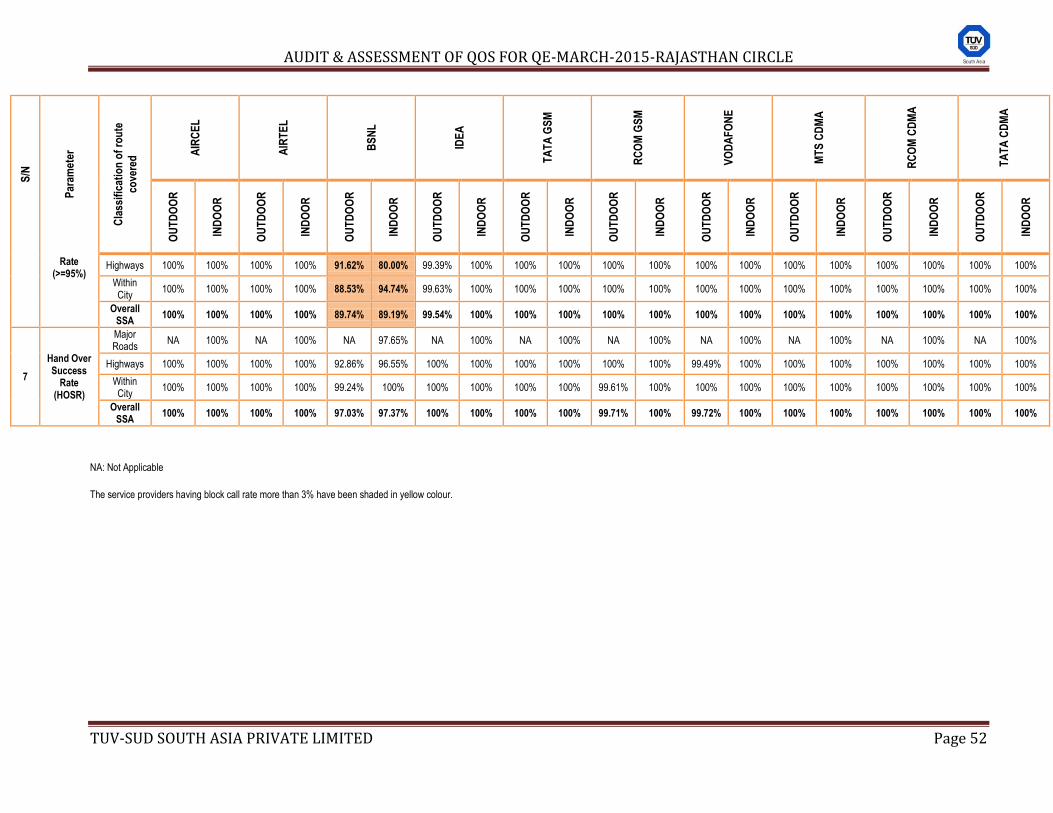
AUDIT & ASSESSMENT OF QOS FOR QE-MARCH-2015-RAJASTHAN CIRCLE
TUV-SUD SOUTH ASIA PRIVATE LIMITED Page 52
S/N
Par
amet
er
Cla
ssif
icat
ion
of
rou
te
cove
red
AIR
CE
L
AIR
TE
L
BS
NL
IDE
A
TA
TA
GS
M
RC
OM
GS
M
VO
DA
FO
NE
MT
S C
DM
A
RC
OM
CD
MA
TA
TA
CD
MA
OU
TD
OO
R
IND
OO
R
OU
TD
OO
R
IND
OO
R
OU
TD
OO
R
IND
OO
R
OU
TD
OO
R
IND
OO
R
OU
TD
OO
R
IND
OO
R
OU
TD
OO
R
IND
OO
R
OU
TD
OO
R
IND
OO
R
OU
TD
OO
R
IND
OO
R
OU
TD
OO
R
IND
OO
R
OU
TD
OO
R
IND
OO
R
Rate (>=95%)
Highways 100% 100% 100% 100% 91.62% 80.00% 99.39% 100% 100% 100% 100% 100% 100% 100% 100% 100% 100% 100% 100% 100%
Within City
100% 100% 100% 100% 88.53% 94.74% 99.63% 100% 100% 100% 100% 100% 100% 100% 100% 100% 100% 100% 100% 100%
Overall SSA
100% 100% 100% 100% 89.74% 89.19% 99.54% 100% 100% 100% 100% 100% 100% 100% 100% 100% 100% 100% 100% 100%
7
Hand Over Success
Rate (HOSR)
Major Roads
NA 100% NA 100% NA 97.65% NA 100% NA 100% NA 100% NA 100% NA 100% NA 100% NA 100%
Highways 100% 100% 100% 100% 92.86% 96.55% 100% 100% 100% 100% 100% 100% 99.49% 100% 100% 100% 100% 100% 100% 100%
Within City
100% 100% 100% 100% 99.24% 100% 100% 100% 100% 100% 99.61% 100% 100% 100% 100% 100% 100% 100% 100% 100%
Overall SSA
100% 100% 100% 100% 97.03% 97.37% 100% 100% 100% 100% 99.71% 100% 99.72% 100% 100% 100% 100% 100% 100% 100%
NA: Not Applicable
The service providers having block call rate more than 3% have been shaded in yellow colour.
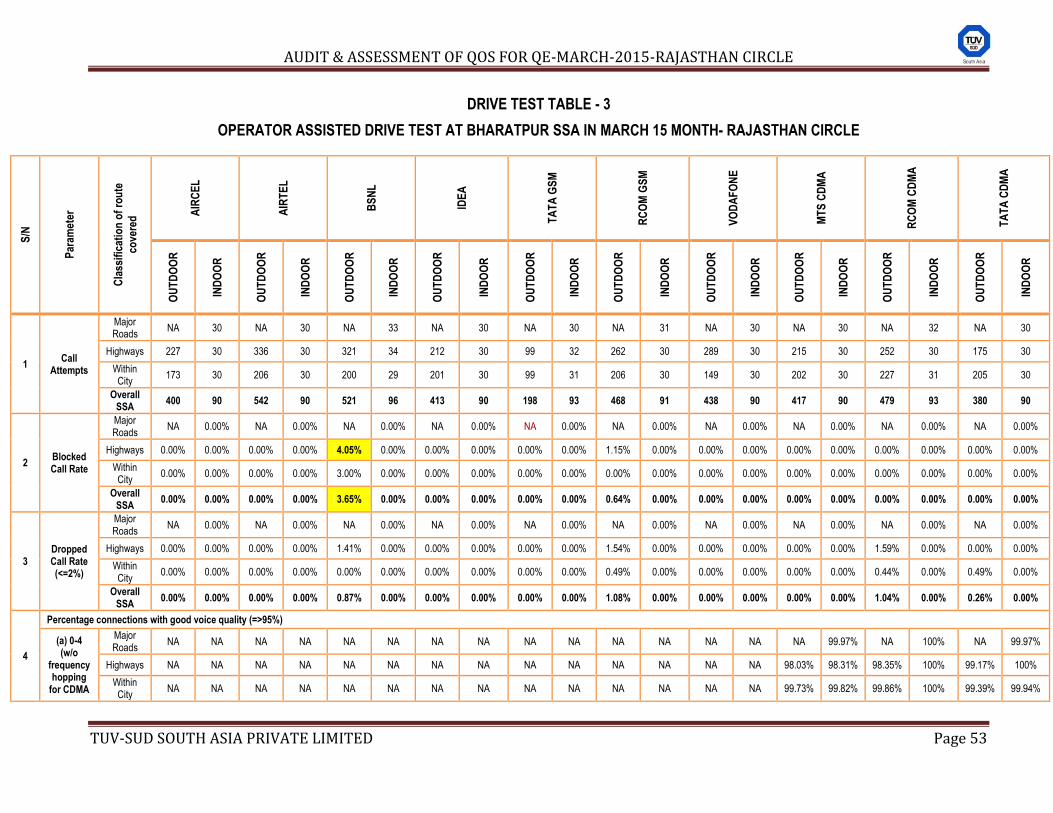
AUDIT & ASSESSMENT OF QOS FOR QE-MARCH-2015-RAJASTHAN CIRCLE
TUV-SUD SOUTH ASIA PRIVATE LIMITED Page 53
DRIVE TEST TABLE - 3
OPERATOR ASSISTED DRIVE TEST AT BHARATPUR SSA IN MARCH 15 MONTH- RAJASTHAN CIRCLE
S/N
Par
amet
er
Cla
ssif
icat
ion
of
rou
te
cove
red
AIR
CE
L
AIR
TE
L
BS
NL
IDE
A
TA
TA
GS
M
RC
OM
GS
M
VO
DA
FO
NE
MT
S C
DM
A
RC
OM
CD
MA
TA
TA
CD
MA
OU
TD
OO
R
IND
OO
R
OU
TD
OO
R
IND
OO
R
OU
TD
OO
R
IND
OO
R
OU
TD
OO
R
IND
OO
R
OU
TD
OO
R
IND
OO
R
OU
TD
OO
R
IND
OO
R
OU
TD
OO
R
IND
OO
R
OU
TD
OO
R
IND
OO
R
OU
TD
OO
R
IND
OO
R
OU
TD
OO
R
IND
OO
R
1 Call
Attempts
Major Roads
NA 30 NA 30 NA 33 NA 30 NA 30 NA 31 NA 30 NA 30 NA 32 NA 30
Highways 227 30 336 30 321 34 212 30 99 32 262 30 289 30 215 30 252 30 175 30
Within City
173 30 206 30 200 29 201 30 99 31 206 30 149 30 202 30 227 31 205 30
Overall SSA
400 90 542 90 521 96 413 90 198 93 468 91 438 90 417 90 479 93 380 90
2 Blocked Call Rate
Major Roads
NA 0.00% NA 0.00% NA 0.00% NA 0.00% NA 0.00% NA 0.00% NA 0.00% NA 0.00% NA 0.00% NA 0.00%
Highways 0.00% 0.00% 0.00% 0.00% 4.05% 0.00% 0.00% 0.00% 0.00% 0.00% 1.15% 0.00% 0.00% 0.00% 0.00% 0.00% 0.00% 0.00% 0.00% 0.00%
Within City
0.00% 0.00% 0.00% 0.00% 3.00% 0.00% 0.00% 0.00% 0.00% 0.00% 0.00% 0.00% 0.00% 0.00% 0.00% 0.00% 0.00% 0.00% 0.00% 0.00%
Overall SSA
0.00% 0.00% 0.00% 0.00% 3.65% 0.00% 0.00% 0.00% 0.00% 0.00% 0.64% 0.00% 0.00% 0.00% 0.00% 0.00% 0.00% 0.00% 0.00% 0.00%
3 Dropped Call Rate (<=2%)
Major Roads
NA 0.00% NA 0.00% NA 0.00% NA 0.00% NA 0.00% NA 0.00% NA 0.00% NA 0.00% NA 0.00% NA 0.00%
Highways 0.00% 0.00% 0.00% 0.00% 1.41% 0.00% 0.00% 0.00% 0.00% 0.00% 1.54% 0.00% 0.00% 0.00% 0.00% 0.00% 1.59% 0.00% 0.00% 0.00%
Within City
0.00% 0.00% 0.00% 0.00% 0.00% 0.00% 0.00% 0.00% 0.00% 0.00% 0.49% 0.00% 0.00% 0.00% 0.00% 0.00% 0.44% 0.00% 0.49% 0.00%
Overall SSA
0.00% 0.00% 0.00% 0.00% 0.87% 0.00% 0.00% 0.00% 0.00% 0.00% 1.08% 0.00% 0.00% 0.00% 0.00% 0.00% 1.04% 0.00% 0.26% 0.00%
4
Percentage connections with good voice quality (=>95%)
(a) 0-4 (w/o
frequency hopping
for CDMA
Major Roads
NA NA NA NA NA NA NA NA NA NA NA NA NA NA NA 99.97% NA 100% NA 99.97%
Highways NA NA NA NA NA NA NA NA NA NA NA NA NA NA 98.03% 98.31% 98.35% 100% 99.17% 100%
Within City
NA NA NA NA NA NA NA NA NA NA NA NA NA NA 99.73% 99.82% 99.86% 100% 99.39% 99.94%
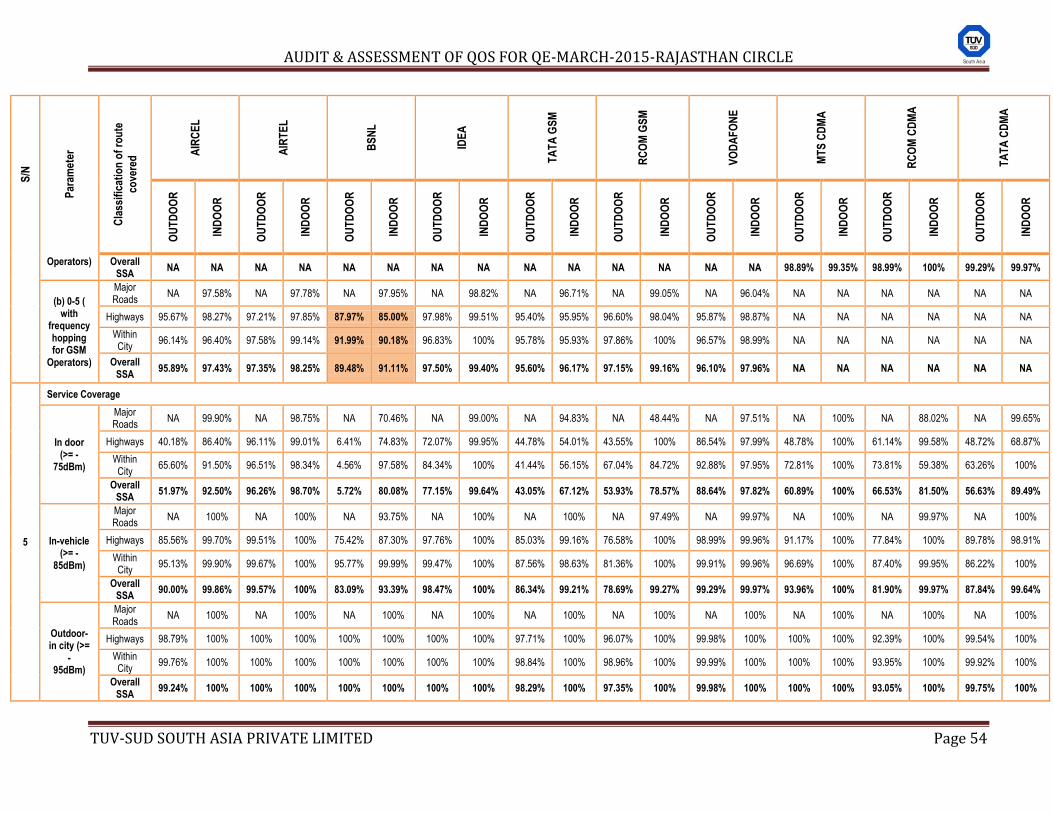
AUDIT & ASSESSMENT OF QOS FOR QE-MARCH-2015-RAJASTHAN CIRCLE
TUV-SUD SOUTH ASIA PRIVATE LIMITED Page 54
S/N
Par
amet
er
Cla
ssif
icat
ion
of
rou
te
cove
red
AIR
CE
L
AIR
TE
L
BS
NL
IDE
A
TA
TA
GS
M
RC
OM
GS
M
VO
DA
FO
NE
MT
S C
DM
A
RC
OM
CD
MA
TA
TA
CD
MA
OU
TD
OO
R
IND
OO
R
OU
TD
OO
R
IND
OO
R
OU
TD
OO
R
IND
OO
R
OU
TD
OO
R
IND
OO
R
OU
TD
OO
R
IND
OO
R
OU
TD
OO
R
IND
OO
R
OU
TD
OO
R
IND
OO
R
OU
TD
OO
R
IND
OO
R
OU
TD
OO
R
IND
OO
R
OU
TD
OO
R
IND
OO
R
Operators) Overall SSA
NA NA NA NA NA NA NA NA NA NA NA NA NA NA 98.89% 99.35% 98.99% 100% 99.29% 99.97%
(b) 0-5 ( with
frequency hopping for GSM
Operators)
Major Roads
NA 97.58% NA 97.78% NA 97.95% NA 98.82% NA 96.71% NA 99.05% NA 96.04% NA NA NA NA NA NA
Highways 95.67% 98.27% 97.21% 97.85% 87.97% 85.00% 97.98% 99.51% 95.40% 95.95% 96.60% 98.04% 95.87% 98.87% NA NA NA NA NA NA
Within City
96.14% 96.40% 97.58% 99.14% 91.99% 90.18% 96.83% 100% 95.78% 95.93% 97.86% 100% 96.57% 98.99% NA NA NA NA NA NA
Overall SSA
95.89% 97.43% 97.35% 98.25% 89.48% 91.11% 97.50% 99.40% 95.60% 96.17% 97.15% 99.16% 96.10% 97.96% NA NA NA NA NA NA
5
Service Coverage
In door (>= -
75dBm)
Major Roads
NA 99.90% NA 98.75% NA 70.46% NA 99.00% NA 94.83% NA 48.44% NA 97.51% NA 100% NA 88.02% NA 99.65%
Highways 40.18% 86.40% 96.11% 99.01% 6.41% 74.83% 72.07% 99.95% 44.78% 54.01% 43.55% 100% 86.54% 97.99% 48.78% 100% 61.14% 99.58% 48.72% 68.87%
Within City
65.60% 91.50% 96.51% 98.34% 4.56% 97.58% 84.34% 100% 41.44% 56.15% 67.04% 84.72% 92.88% 97.95% 72.81% 100% 73.81% 59.38% 63.26% 100%
Overall SSA
51.97% 92.50% 96.26% 98.70% 5.72% 80.08% 77.15% 99.64% 43.05% 67.12% 53.93% 78.57% 88.64% 97.82% 60.89% 100% 66.53% 81.50% 56.63% 89.49%
In-vehicle (>= -
85dBm)
Major Roads
NA 100% NA 100% NA 93.75% NA 100% NA 100% NA 97.49% NA 99.97% NA 100% NA 99.97% NA 100%
Highways 85.56% 99.70% 99.51% 100% 75.42% 87.30% 97.76% 100% 85.03% 99.16% 76.58% 100% 98.99% 99.96% 91.17% 100% 77.84% 100% 89.78% 98.91%
Within City
95.13% 99.90% 99.67% 100% 95.77% 99.99% 99.47% 100% 87.56% 98.63% 81.36% 100% 99.91% 99.96% 96.69% 100% 87.40% 99.95% 86.22% 100%
Overall SSA
90.00% 99.86% 99.57% 100% 83.09% 93.39% 98.47% 100% 86.34% 99.21% 78.69% 99.27% 99.29% 99.97% 93.96% 100% 81.90% 99.97% 87.84% 99.64%
Outdoor- in city (>=
- 95dBm)
Major Roads
NA 100% NA 100% NA 100% NA 100% NA 100% NA 100% NA 100% NA 100% NA 100% NA 100%
Highways 98.79% 100% 100% 100% 100% 100% 100% 100% 97.71% 100% 96.07% 100% 99.98% 100% 100% 100% 92.39% 100% 99.54% 100%
Within City
99.76% 100% 100% 100% 100% 100% 100% 100% 98.84% 100% 98.96% 100% 99.99% 100% 100% 100% 93.95% 100% 99.92% 100%
Overall SSA
99.24% 100% 100% 100% 100% 100% 100% 100% 98.29% 100% 97.35% 100% 99.98% 100% 100% 100% 93.05% 100% 99.75% 100%
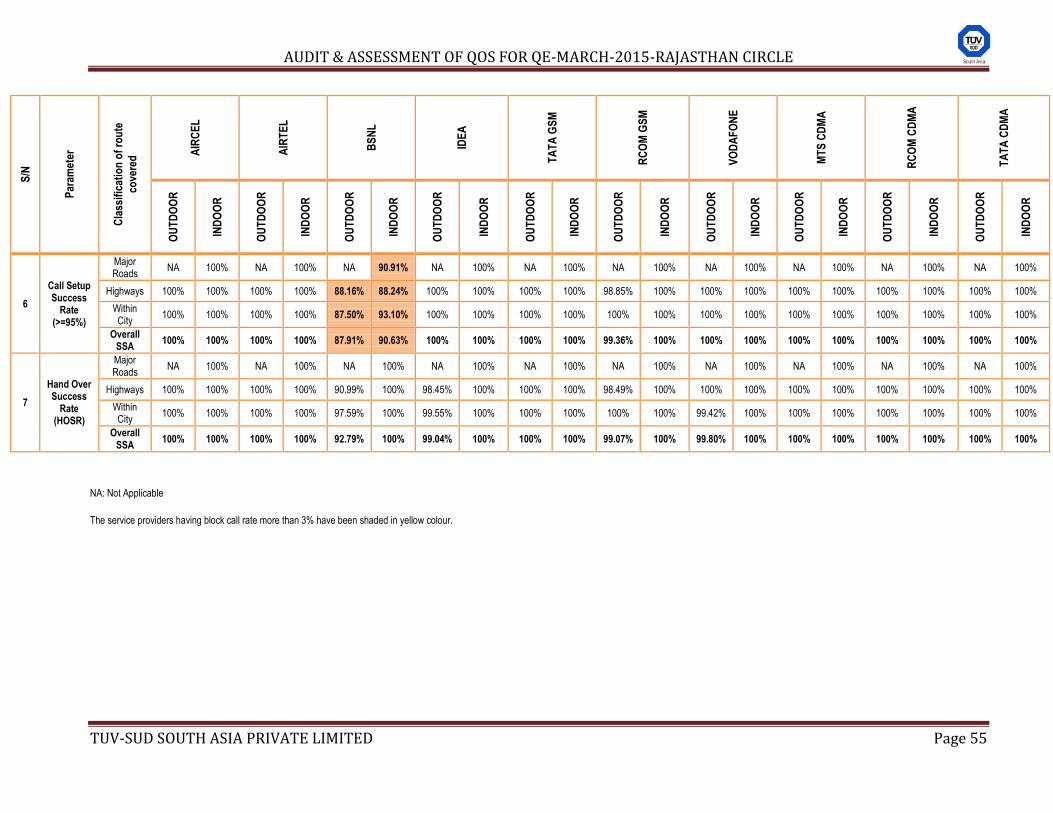
AUDIT & ASSESSMENT OF QOS FOR QE-MARCH-2015-RAJASTHAN CIRCLE
TUV-SUD SOUTH ASIA PRIVATE LIMITED Page 55
S/N
Par
amet
er
Cla
ssif
icat
ion
of
rou
te
cove
red
AIR
CE
L
AIR
TE
L
BS
NL
IDE
A
TA
TA
GS
M
RC
OM
GS
M
VO
DA
FO
NE
MT
S C
DM
A
RC
OM
CD
MA
TA
TA
CD
MA
OU
TD
OO
R
IND
OO
R
OU
TD
OO
R
IND
OO
R
OU
TD
OO
R
IND
OO
R
OU
TD
OO
R
IND
OO
R
OU
TD
OO
R
IND
OO
R
OU
TD
OO
R
IND
OO
R
OU
TD
OO
R
IND
OO
R
OU
TD
OO
R
IND
OO
R
OU
TD
OO
R
IND
OO
R
OU
TD
OO
R
IND
OO
R
6
Call Setup Success
Rate (>=95%)
Major Roads
NA 100% NA 100% NA 90.91% NA 100% NA 100% NA 100% NA 100% NA 100% NA 100% NA 100%
Highways 100% 100% 100% 100% 88.16% 88.24% 100% 100% 100% 100% 98.85% 100% 100% 100% 100% 100% 100% 100% 100% 100%
Within City
100% 100% 100% 100% 87.50% 93.10% 100% 100% 100% 100% 100% 100% 100% 100% 100% 100% 100% 100% 100% 100%
Overall SSA
100% 100% 100% 100% 87.91% 90.63% 100% 100% 100% 100% 99.36% 100% 100% 100% 100% 100% 100% 100% 100% 100%
7
Hand Over Success
Rate (HOSR)
Major Roads
NA 100% NA 100% NA 100% NA 100% NA 100% NA 100% NA 100% NA 100% NA 100% NA 100%
Highways 100% 100% 100% 100% 90.99% 100% 98.45% 100% 100% 100% 98.49% 100% 100% 100% 100% 100% 100% 100% 100% 100%
Within City
100% 100% 100% 100% 97.59% 100% 99.55% 100% 100% 100% 100% 100% 99.42% 100% 100% 100% 100% 100% 100% 100%
Overall SSA
100% 100% 100% 100% 92.79% 100% 99.04% 100% 100% 100% 99.07% 100% 99.80% 100% 100% 100% 100% 100% 100% 100%
NA: Not Applicable
The service providers having block call rate more than 3% have been shaded in yellow colour.
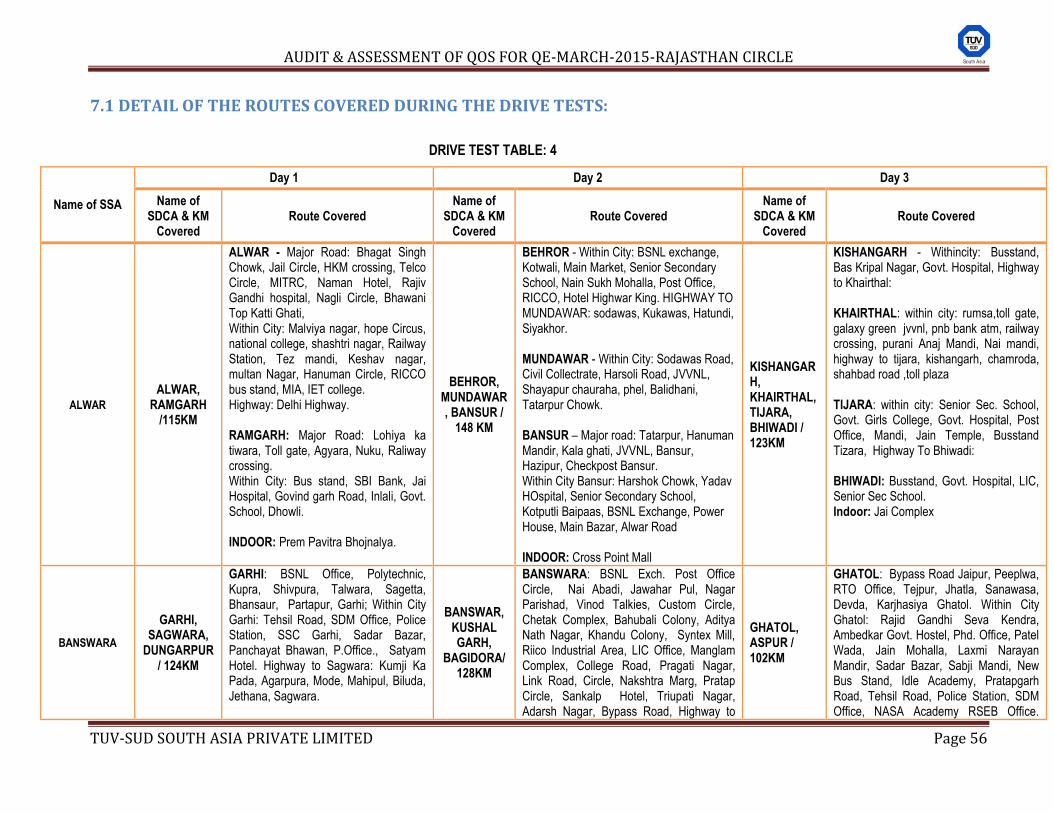
AUDIT & ASSESSMENT OF QOS FOR QE-MARCH-2015-RAJASTHAN CIRCLE
TUV-SUD SOUTH ASIA PRIVATE LIMITED Page 56
7.1 DETAIL OF THE ROUTES COVERED DURING THE DRIVE TESTS:
DRIVE TEST TABLE: 4
Name of SSA
Day 1 Day 2 Day 3
Name of SDCA & KM
Covered Route Covered
Name of SDCA & KM
Covered Route Covered
Name of SDCA & KM
Covered Route Covered
ALWAR
ALWAR, RAMGARH
/115KM
ALWAR - Major Road: Bhagat Singh Chowk, Jail Circle, HKM crossing, Telco Circle, MITRC, Naman Hotel, Rajiv Gandhi hospital, Nagli Circle, Bhawani Top Katti Ghati, Within City: Malviya nagar, hope Circus, national college, shashtri nagar, Railway Station, Tez mandi, Keshav nagar, multan Nagar, Hanuman Circle, RICCO bus stand, MIA, IET college. Highway: Delhi Highway. RAMGARH: Major Road: Lohiya ka tiwara, Toll gate, Agyara, Nuku, Raliway crossing. Within City: Bus stand, SBI Bank, Jai Hospital, Govind garh Road, Inlali, Govt. School, Dhowli. INDOOR: Prem Pavitra Bhojnalya.
BEHROR, MUNDAWAR, BANSUR /
148 KM
BEHROR - Within City: BSNL exchange, Kotwali, Main Market, Senior Secondary School, Nain Sukh Mohalla, Post Office, RICCO, Hotel Highwar King. HIGHWAY TO MUNDAWAR: sodawas, Kukawas, Hatundi, Siyakhor. MUNDAWAR - Within City: Sodawas Road, Civil Collectrate, Harsoli Road, JVVNL, Shayapur chauraha, phel, Balidhani, Tatarpur Chowk. BANSUR – Major road: Tatarpur, Hanuman Mandir, Kala ghati, JVVNL, Bansur, Hazipur, Checkpost Bansur. Within City Bansur: Harshok Chowk, Yadav HOspital, Senior Secondary School, Kotputli Baipaas, BSNL Exchange, Power House, Main Bazar, Alwar Road INDOOR: Cross Point Mall
KISHANGARH, KHAIRTHAL, TIJARA, BHIWADI / 123KM
KISHANGARH - Withincity: Busstand, Bas Kripal Nagar, Govt. Hospital, Highway to Khairthal: KHAIRTHAL: within city: rumsa,toll gate, galaxy green jvvnl, pnb bank atm, railway crossing, purani Anaj Mandi, Nai mandi, highway to tijara, kishangarh, chamroda, shahbad road ,toll plaza TIJARA: within city: Senior Sec. School, Govt. Girls College, Govt. Hospital, Post Office, Mandi, Jain Temple, Busstand Tizara, Highway To Bhiwadi: BHIWADI: Busstand, Govt. Hospital, LIC, Senior Sec School. Indoor: Jai Complex
BANSWARA
GARHI, SAGWARA,
DUNGARPUR / 124KM
GARHI: BSNL Office, Polytechnic, Kupra, Shivpura, Talwara, Sagetta, Bhansaur, Partapur, Garhi; Within City Garhi: Tehsil Road, SDM Office, Police Station, SSC Garhi, Sadar Bazar, Panchayat Bhawan, P.Office., Satyam Hotel. Highway to Sagwara: Kumji Ka Pada, Agarpura, Mode, Mahipul, Biluda, Jethana, Sagwara.
BANSWAR, KUSHAL GARH,
BAGIDORA/ 128KM
BANSWARA: BSNL Exch. Post Office Circle, Nai Abadi, Jawahar Pul, Nagar Parishad, Vinod Talkies, Custom Circle, Chetak Complex, Bahubali Colony, Aditya Nath Nagar, Khandu Colony, Syntex Mill, Riico Industrial Area, LIC Office, Manglam Complex, College Road, Pragati Nagar, Link Road, Circle, Nakshtra Marg, Pratap Circle, Sankalp Hotel, Triupati Nagar, Adarsh Nagar, Bypass Road, Highway to
GHATOL, ASPUR / 102KM
GHATOL: Bypass Road Jaipur, Peeplwa, RTO Office, Tejpur, Jhatla, Sanawasa, Devda, Karjhasiya Ghatol. Within City Ghatol: Rajid Gandhi Seva Kendra, Ambedkar Govt. Hostel, Phd. Office, Patel Wada, Jain Mohalla, Laxmi Narayan Mandir, Sadar Bazar, Sabji Mandi, New Bus Stand, Idle Academy, Pratapgarh Road, Tehsil Road, Police Station, SDM Office, NASA Academy RSEB Office.
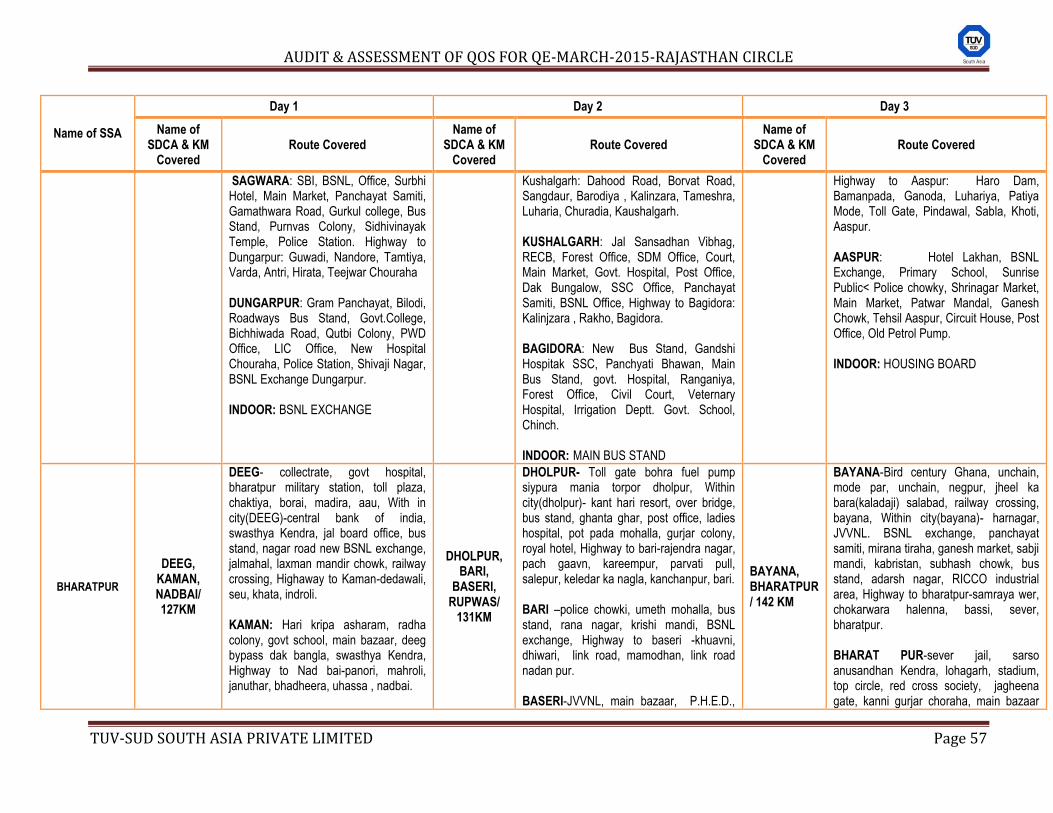
AUDIT & ASSESSMENT OF QOS FOR QE-MARCH-2015-RAJASTHAN CIRCLE
TUV-SUD SOUTH ASIA PRIVATE LIMITED Page 57
Name of SSA
Day 1 Day 2 Day 3
Name of SDCA & KM
Covered Route Covered
Name of SDCA & KM
Covered Route Covered
Name of SDCA & KM
Covered Route Covered
SAGWARA: SBI, BSNL, Office, Surbhi Hotel, Main Market, Panchayat Samiti, Gamathwara Road, Gurkul college, Bus Stand, Purnvas Colony, Sidhivinayak Temple, Police Station. Highway to Dungarpur: Guwadi, Nandore, Tamtiya, Varda, Antri, Hirata, Teejwar Chouraha DUNGARPUR: Gram Panchayat, Bilodi, Roadways Bus Stand, Govt.College, Bichhiwada Road, Qutbi Colony, PWD Office, LIC Office, New Hospital Chouraha, Police Station, Shivaji Nagar, BSNL Exchange Dungarpur. INDOOR: BSNL EXCHANGE
Kushalgarh: Dahood Road, Borvat Road, Sangdaur, Barodiya , Kalinzara, Tameshra, Luharia, Churadia, Kaushalgarh. KUSHALGARH: Jal Sansadhan Vibhag, RECB, Forest Office, SDM Office, Court, Main Market, Govt. Hospital, Post Office, Dak Bungalow, SSC Office, Panchayat Samiti, BSNL Office, Highway to Bagidora: Kalinjzara , Rakho, Bagidora. BAGIDORA: New Bus Stand, Gandshi Hospitak SSC, Panchyati Bhawan, Main Bus Stand, govt. Hospital, Ranganiya, Forest Office, Civil Court, Veternary Hospital, Irrigation Deptt. Govt. School, Chinch. INDOOR: MAIN BUS STAND
Highway to Aaspur: Haro Dam, Bamanpada, Ganoda, Luhariya, Patiya Mode, Toll Gate, Pindawal, Sabla, Khoti, Aaspur. AASPUR: Hotel Lakhan, BSNL Exchange, Primary School, Sunrise Public< Police chowky, Shrinagar Market, Main Market, Patwar Mandal, Ganesh Chowk, Tehsil Aaspur, Circuit House, Post Office, Old Petrol Pump. INDOOR: HOUSING BOARD
BHARATPUR
DEEG, KAMAN, NADBAI/ 127KM
DEEG- collectrate, govt hospital, bharatpur military station, toll plaza, chaktiya, borai, madira, aau, With in city(DEEG)-central bank of india, swasthya Kendra, jal board office, bus stand, nagar road new BSNL exchange, jalmahal, laxman mandir chowk, railway crossing, Highaway to Kaman-dedawali, seu, khata, indroli. KAMAN: Hari kripa asharam, radha colony, govt school, main bazaar, deeg bypass dak bangla, swasthya Kendra, Highway to Nad bai-panori, mahroli, januthar, bhadheera, uhassa , nadbai.
DHOLPUR, BARI,
BASERI, RUPWAS/
131KM
DHOLPUR- Toll gate bohra fuel pump siypura mania torpor dholpur, Within city(dholpur)- kant hari resort, over bridge, bus stand, ghanta ghar, post office, ladies hospital, pot pada mohalla, gurjar colony, royal hotel, Highway to bari-rajendra nagar, pach gaavn, kareempur, parvati pull, salepur, keledar ka nagla, kanchanpur, bari. BARI –police chowki, umeth mohalla, bus stand, rana nagar, krishi mandi, BSNL exchange, Highway to baseri -khuavni, dhiwari, link road, mamodhan, link road nadan pur. BASERI-JVVNL, main bazaar, P.H.E.D.,
BAYANA, BHARATPUR/ 142 KM
BAYANA-Bird century Ghana, unchain, mode par, unchain, negpur, jheel ka bara(kaladaji) salabad, railway crossing, bayana, Within city(bayana)- harnagar, JVVNL. BSNL exchange, panchayat samiti, mirana tiraha, ganesh market, sabji mandi, kabristan, subhash chowk, bus stand, adarsh nagar, RICCO industrial area, Highway to bharatpur-samraya wer, chokarwara halenna, bassi, sever, bharatpur. BHARAT PUR-sever jail, sarso anusandhan Kendra, lohagarh, stadium, top circle, red cross society, jagheena gate, kanni gurjar choraha, main bazaar
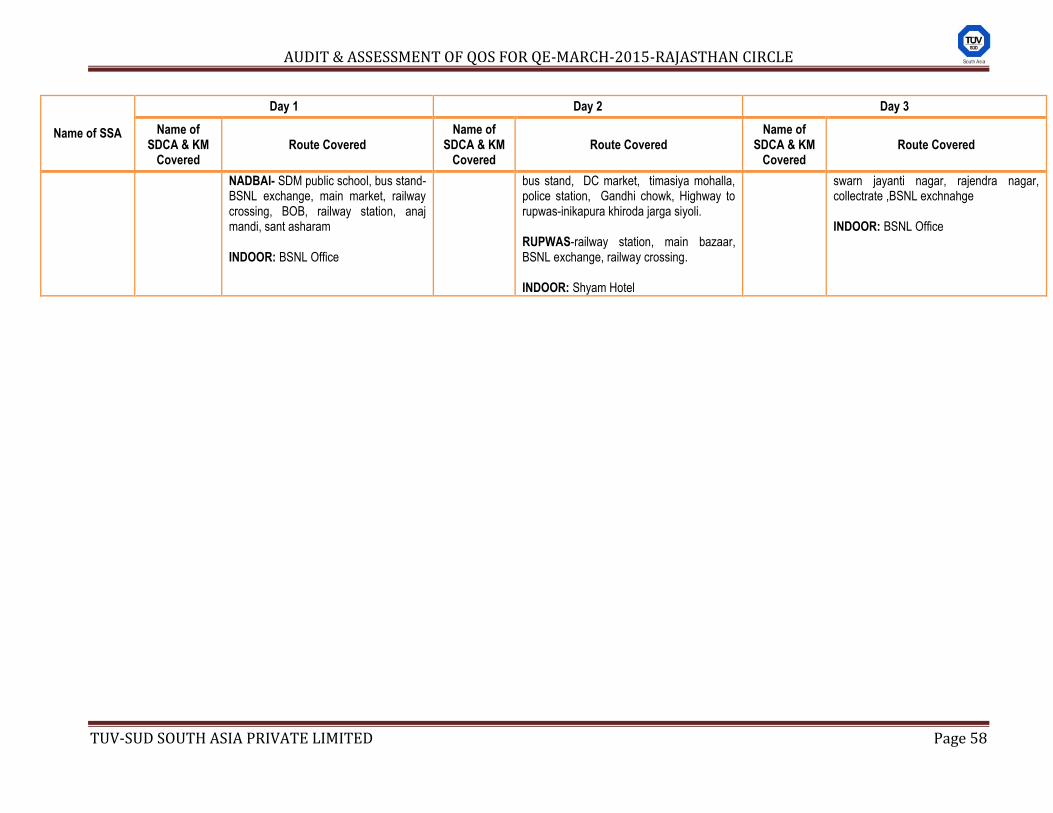
AUDIT & ASSESSMENT OF QOS FOR QE-MARCH-2015-RAJASTHAN CIRCLE
TUV-SUD SOUTH ASIA PRIVATE LIMITED Page 58
Name of SSA
Day 1 Day 2 Day 3
Name of SDCA & KM
Covered Route Covered
Name of SDCA & KM
Covered Route Covered
Name of SDCA & KM
Covered Route Covered
NADBAI- SDM public school, bus stand- BSNL exchange, main market, railway crossing, BOB, railway station, anaj mandi, sant asharam INDOOR: BSNL Office
bus stand, DC market, timasiya mohalla, police station, Gandhi chowk, Highway to rupwas-inikapura khiroda jarga siyoli. RUPWAS-railway station, main bazaar, BSNL exchange, railway crossing. INDOOR: Shyam Hotel
swarn jayanti nagar, rajendra nagar, collectrate ,BSNL exchnahge INDOOR: BSNL Office
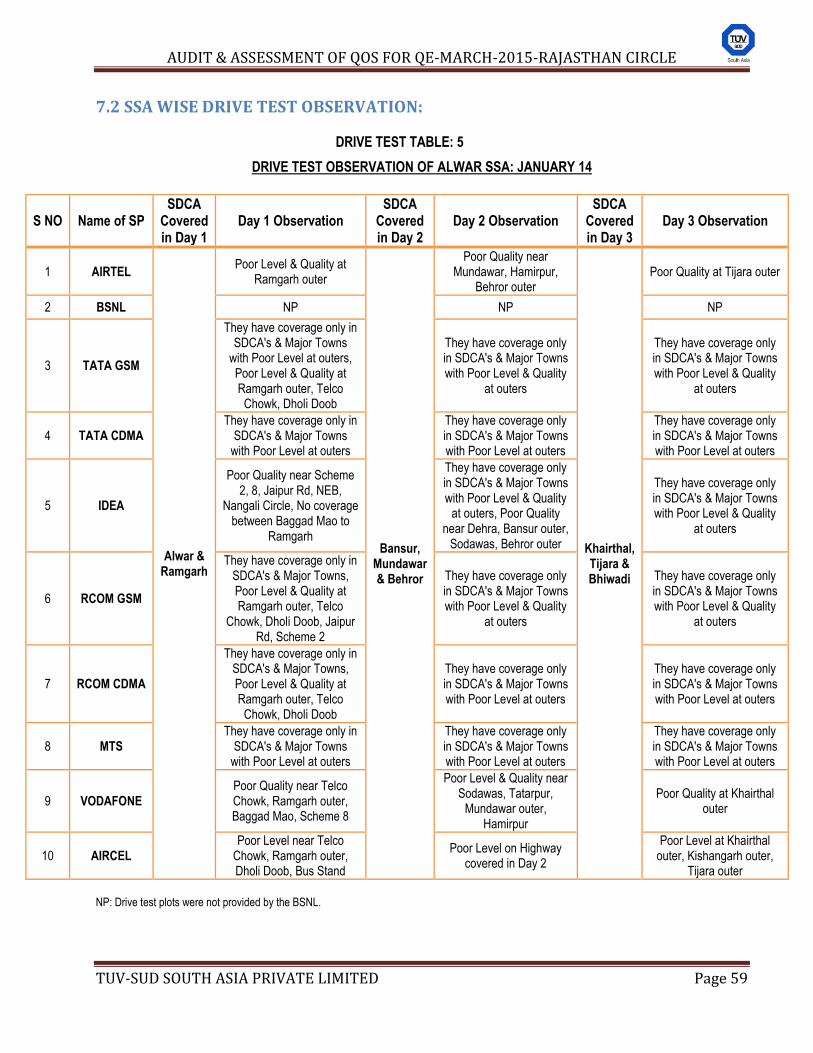
AUDIT & ASSESSMENT OF QOS FOR QE-MARCH-2015-RAJASTHAN CIRCLE
TUV-SUD SOUTH ASIA PRIVATE LIMITED Page 59
7.2 SSA WISE DRIVE TEST OBSERVATION:
DRIVE TEST TABLE: 5
DRIVE TEST OBSERVATION OF ALWAR SSA: JANUARY 14
NP: Drive test plots were not provided by the BSNL.
S NO Name of SP SDCA
Covered in Day 1
Day 1 Observation SDCA
Covered in Day 2
Day 2 Observation SDCA
Covered in Day 3
Day 3 Observation
1 AIRTEL
Alwar & Ramgarh
Poor Level & Quality at Ramgarh outer
Bansur, Mundawar & Behror
Poor Quality near Mundawar, Hamirpur,
Behror outer
Khairthal, Tijara & Bhiwadi
Poor Quality at Tijara outer
2 BSNL NP NP NP
3 TATA GSM
They have coverage only in SDCA's & Major Towns
with Poor Level at outers, Poor Level & Quality at Ramgarh outer, Telco
Chowk, Dholi Doob
They have coverage only in SDCA's & Major Towns with Poor Level & Quality
at outers
They have coverage only in SDCA's & Major Towns with Poor Level & Quality
at outers
4 TATA CDMA They have coverage only in
SDCA's & Major Towns with Poor Level at outers
They have coverage only in SDCA's & Major Towns with Poor Level at outers
They have coverage only in SDCA's & Major Towns with Poor Level at outers
5 IDEA
Poor Quality near Scheme 2, 8, Jaipur Rd, NEB,
Nangali Circle, No coverage between Baggad Mao to
Ramgarh
They have coverage only in SDCA's & Major Towns with Poor Level & Quality
at outers, Poor Quality near Dehra, Bansur outer,
Sodawas, Behror outer
They have coverage only in SDCA's & Major Towns with Poor Level & Quality
at outers
6 RCOM GSM
They have coverage only in SDCA's & Major Towns, Poor Level & Quality at Ramgarh outer, Telco
Chowk, Dholi Doob, Jaipur Rd, Scheme 2
They have coverage only in SDCA's & Major Towns with Poor Level & Quality
at outers
They have coverage only in SDCA's & Major Towns with Poor Level & Quality
at outers
7 RCOM CDMA
They have coverage only in SDCA's & Major Towns, Poor Level & Quality at Ramgarh outer, Telco
Chowk, Dholi Doob
They have coverage only in SDCA's & Major Towns with Poor Level at outers
They have coverage only in SDCA's & Major Towns with Poor Level at outers
8 MTS They have coverage only in
SDCA's & Major Towns with Poor Level at outers
They have coverage only in SDCA's & Major Towns with Poor Level at outers
They have coverage only in SDCA's & Major Towns with Poor Level at outers
9 VODAFONE Poor Quality near Telco Chowk, Ramgarh outer, Baggad Mao, Scheme 8
Poor Level & Quality near Sodawas, Tatarpur,
Mundawar outer, Hamirpur
Poor Quality at Khairthal outer
10 AIRCEL Poor Level near Telco
Chowk, Ramgarh outer, Dholi Doob, Bus Stand
Poor Level on Highway covered in Day 2
Poor Level at Khairthal outer, Kishangarh outer,
Tijara outer
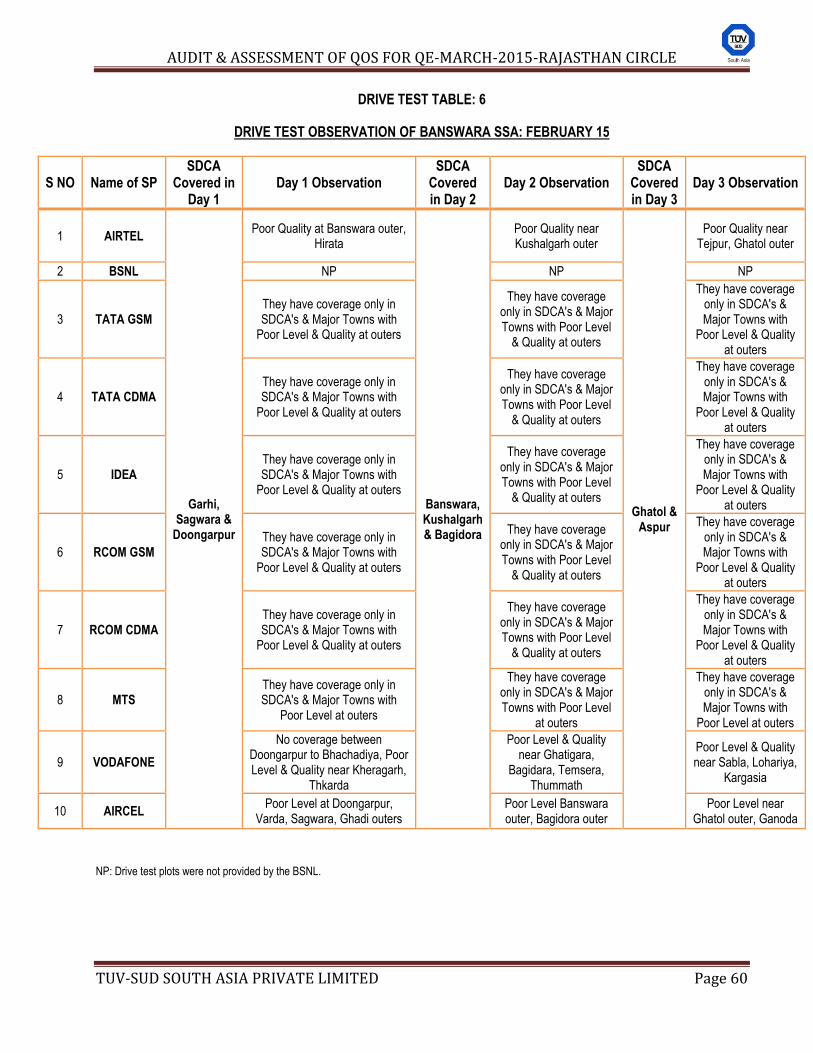
AUDIT & ASSESSMENT OF QOS FOR QE-MARCH-2015-RAJASTHAN CIRCLE
TUV-SUD SOUTH ASIA PRIVATE LIMITED Page 60
DRIVE TEST TABLE: 6
DRIVE TEST OBSERVATION OF BANSWARA SSA: FEBRUARY 15
S NO Name of SP SDCA
Covered in Day 1
Day 1 Observation SDCA
Covered in Day 2
Day 2 Observation SDCA
Covered in Day 3
Day 3 Observation
1 AIRTEL
Garhi, Sagwara &
Doongarpur
Poor Quality at Banswara outer, Hirata
Banswara, Kushalgarh & Bagidora
Poor Quality near Kushalgarh outer
Ghatol & Aspur
Poor Quality near Tejpur, Ghatol outer
2 BSNL NP NP NP
3 TATA GSM They have coverage only in SDCA's & Major Towns with
Poor Level & Quality at outers
They have coverage only in SDCA's & Major Towns with Poor Level
& Quality at outers
They have coverage only in SDCA's & Major Towns with
Poor Level & Quality at outers
4 TATA CDMA They have coverage only in SDCA's & Major Towns with
Poor Level & Quality at outers
They have coverage only in SDCA's & Major Towns with Poor Level
& Quality at outers
They have coverage only in SDCA's & Major Towns with
Poor Level & Quality at outers
5 IDEA They have coverage only in SDCA's & Major Towns with
Poor Level & Quality at outers
They have coverage only in SDCA's & Major Towns with Poor Level
& Quality at outers
They have coverage only in SDCA's & Major Towns with
Poor Level & Quality at outers
6 RCOM GSM They have coverage only in SDCA's & Major Towns with
Poor Level & Quality at outers
They have coverage only in SDCA's & Major Towns with Poor Level
& Quality at outers
They have coverage only in SDCA's & Major Towns with
Poor Level & Quality at outers
7 RCOM CDMA They have coverage only in SDCA's & Major Towns with
Poor Level & Quality at outers
They have coverage only in SDCA's & Major Towns with Poor Level
& Quality at outers
They have coverage only in SDCA's & Major Towns with
Poor Level & Quality at outers
8 MTS They have coverage only in SDCA's & Major Towns with
Poor Level at outers
They have coverage only in SDCA's & Major Towns with Poor Level
at outers
They have coverage only in SDCA's & Major Towns with
Poor Level at outers
9 VODAFONE
No coverage between Doongarpur to Bhachadiya, Poor Level & Quality near Kheragarh,
Thkarda
Poor Level & Quality near Ghatigara,
Bagidara, Temsera, Thummath
Poor Level & Quality near Sabla, Lohariya,
Kargasia
10 AIRCEL Poor Level at Doongarpur,
Varda, Sagwara, Ghadi outers Poor Level Banswara outer, Bagidora outer
Poor Level near Ghatol outer, Ganoda
NP: Drive test plots were not provided by the BSNL.
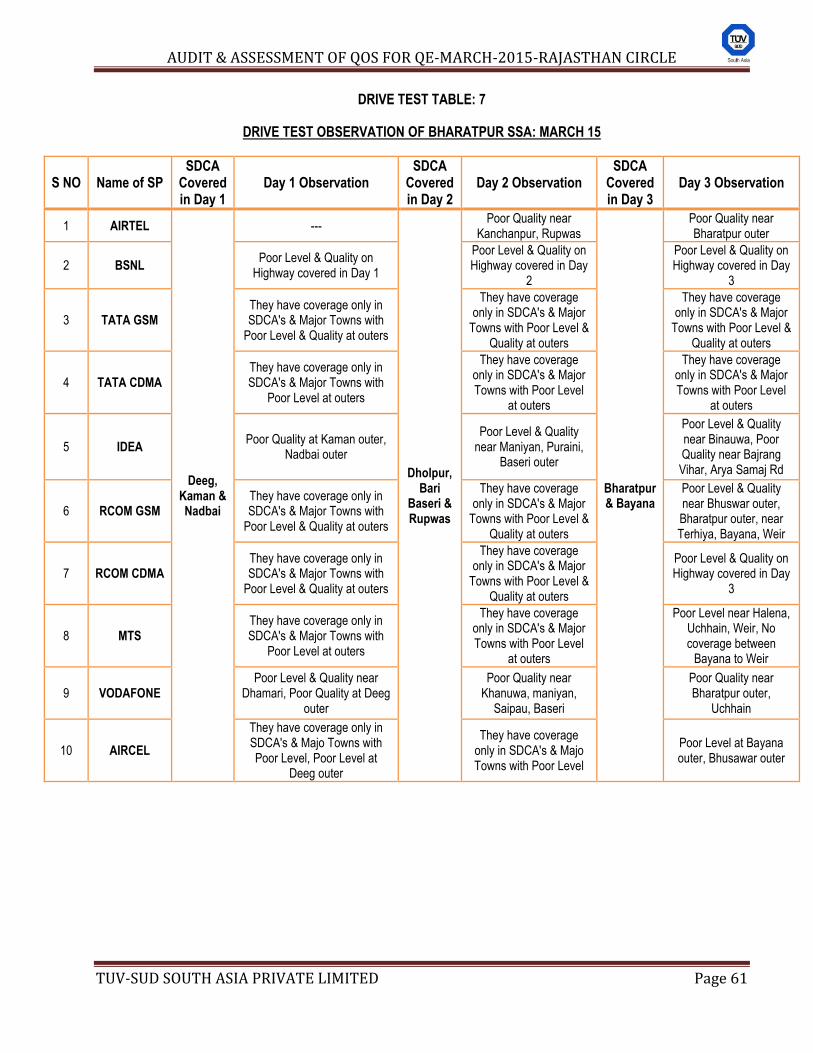
AUDIT & ASSESSMENT OF QOS FOR QE-MARCH-2015-RAJASTHAN CIRCLE
TUV-SUD SOUTH ASIA PRIVATE LIMITED Page 61
DRIVE TEST TABLE: 7
DRIVE TEST OBSERVATION OF BHARATPUR SSA: MARCH 15
S NO Name of SP SDCA
Covered in Day 1
Day 1 Observation SDCA
Covered in Day 2
Day 2 Observation SDCA
Covered in Day 3
Day 3 Observation
1 AIRTEL
Deeg, Kaman & Nadbai
---
Dholpur, Bari
Baseri & Rupwas
Poor Quality near Kanchanpur, Rupwas
Bharatpur & Bayana
Poor Quality near Bharatpur outer
2 BSNL Poor Level & Quality on
Highway covered in Day 1
Poor Level & Quality on Highway covered in Day
2
Poor Level & Quality on Highway covered in Day
3
3 TATA GSM They have coverage only in SDCA's & Major Towns with
Poor Level & Quality at outers
They have coverage only in SDCA's & Major
Towns with Poor Level & Quality at outers
They have coverage only in SDCA's & Major
Towns with Poor Level & Quality at outers
4 TATA CDMA They have coverage only in SDCA's & Major Towns with
Poor Level at outers
They have coverage only in SDCA's & Major Towns with Poor Level
at outers
They have coverage only in SDCA's & Major Towns with Poor Level
at outers
5 IDEA Poor Quality at Kaman outer,
Nadbai outer
Poor Level & Quality near Maniyan, Puraini,
Baseri outer
Poor Level & Quality near Binauwa, Poor Quality near Bajrang Vihar, Arya Samaj Rd
6 RCOM GSM They have coverage only in SDCA's & Major Towns with
Poor Level & Quality at outers
They have coverage only in SDCA's & Major
Towns with Poor Level & Quality at outers
Poor Level & Quality near Bhuswar outer, Bharatpur outer, near Terhiya, Bayana, Weir
7 RCOM CDMA They have coverage only in SDCA's & Major Towns with
Poor Level & Quality at outers
They have coverage only in SDCA's & Major
Towns with Poor Level & Quality at outers
Poor Level & Quality on Highway covered in Day
3
8 MTS They have coverage only in SDCA's & Major Towns with
Poor Level at outers
They have coverage only in SDCA's & Major Towns with Poor Level
at outers
Poor Level near Halena, Uchhain, Weir, No coverage between
Bayana to Weir
9 VODAFONE Poor Level & Quality near
Dhamari, Poor Quality at Deeg outer
Poor Quality near Khanuwa, maniyan,
Saipau, Baseri
Poor Quality near Bharatpur outer,
Uchhain
10 AIRCEL
They have coverage only in SDCA's & Majo Towns with Poor Level, Poor Level at
Deeg outer
They have coverage only in SDCA's & Majo Towns with Poor Level
Poor Level at Bayana outer, Bhusawar outer
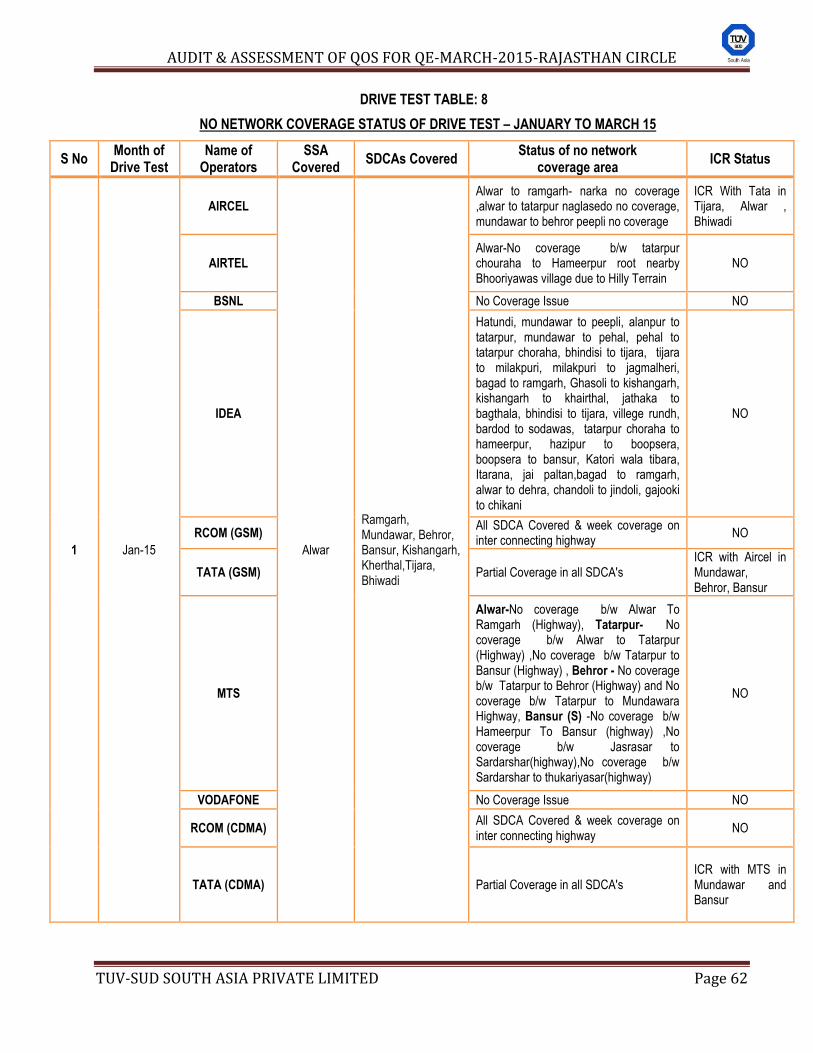
AUDIT & ASSESSMENT OF QOS FOR QE-MARCH-2015-RAJASTHAN CIRCLE
TUV-SUD SOUTH ASIA PRIVATE LIMITED Page 62
DRIVE TEST TABLE: 8
NO NETWORK COVERAGE STATUS OF DRIVE TEST – JANUARY TO MARCH 15
S No Month of
Drive Test Name of
Operators SSA
Covered SDCAs Covered
Status of no network coverage area
ICR Status
1 Jan-15
AIRCEL
Alwar
Ramgarh, Mundawar, Behror, Bansur, Kishangarh, Kherthal,Tijara, Bhiwadi
Alwar to ramgarh- narka no coverage ,alwar to tatarpur naglasedo no coverage, mundawar to behror peepli no coverage
ICR With Tata in Tijara, Alwar , Bhiwadi
AIRTEL Alwar-No coverage b/w tatarpur chouraha to Hameerpur root nearby Bhooriyawas village due to Hilly Terrain
NO
BSNL No Coverage Issue NO
IDEA
Hatundi, mundawar to peepli, alanpur to tatarpur, mundawar to pehal, pehal to tatarpur choraha, bhindisi to tijara, tijara to milakpuri, milakpuri to jagmalheri, bagad to ramgarh, Ghasoli to kishangarh, kishangarh to khairthal, jathaka to bagthala, bhindisi to tijara, villege rundh, bardod to sodawas, tatarpur choraha to hameerpur, hazipur to boopsera, boopsera to bansur, Katori wala tibara, Itarana, jai paltan,bagad to ramgarh, alwar to dehra, chandoli to jindoli, gajooki to chikani
NO
RCOM (GSM) All SDCA Covered & week coverage on inter connecting highway
NO
TATA (GSM) Partial Coverage in all SDCA's ICR with Aircel in Mundawar, Behror, Bansur
MTS
Alwar-No coverage b/w Alwar To Ramgarh (Highway), Tatarpur- No coverage b/w Alwar to Tatarpur (Highway) ,No coverage b/w Tatarpur to Bansur (Highway) , Behror - No coverage b/w Tatarpur to Behror (Highway) and No coverage b/w Tatarpur to Mundawara Highway, Bansur (S) -No coverage b/w Hameerpur To Bansur (highway) ,No coverage b/w Jasrasar to Sardarshar(highway),No coverage b/w Sardarshar to thukariyasar(highway)
NO
VODAFONE No Coverage Issue NO
RCOM (CDMA) All SDCA Covered & week coverage on inter connecting highway
NO
TATA (CDMA) Partial Coverage in all SDCA's ICR with MTS in Mundawar and Bansur
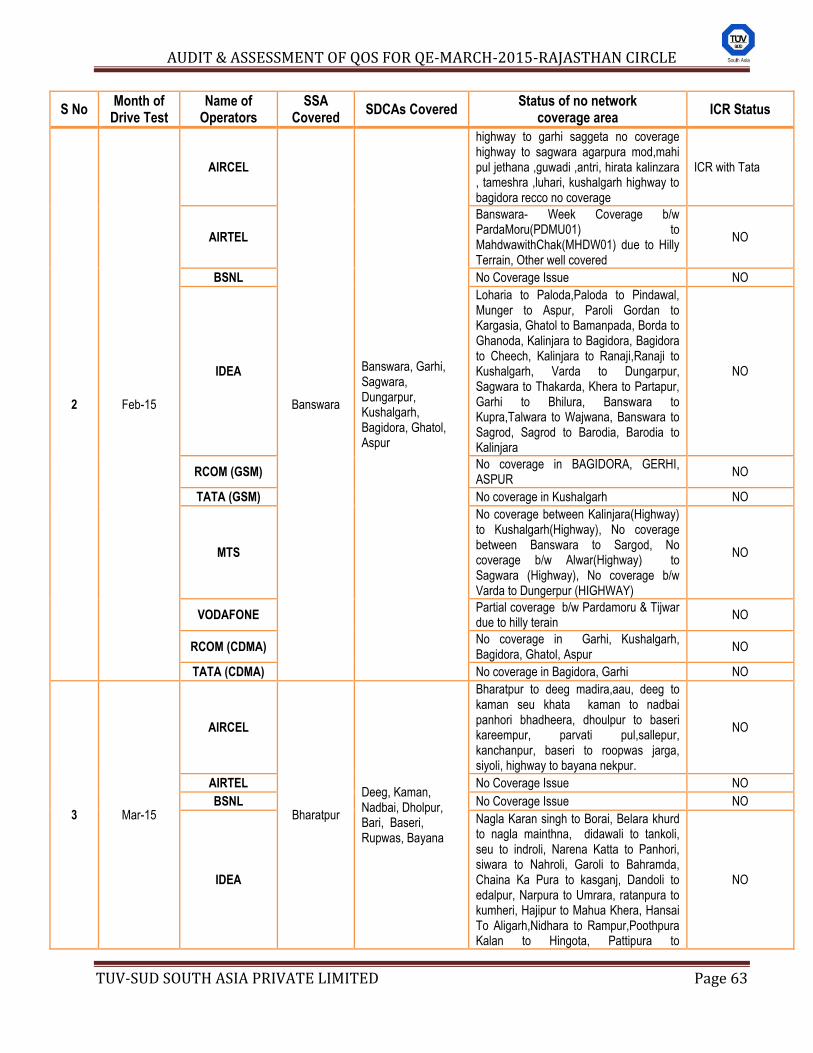
AUDIT & ASSESSMENT OF QOS FOR QE-MARCH-2015-RAJASTHAN CIRCLE
TUV-SUD SOUTH ASIA PRIVATE LIMITED Page 63
S No Month of
Drive Test Name of
Operators SSA
Covered SDCAs Covered
Status of no network coverage area
ICR Status
2 Feb-15
AIRCEL
Banswara
Banswara, Garhi, Sagwara, Dungarpur, Kushalgarh, Bagidora, Ghatol, Aspur
highway to garhi saggeta no coverage highway to sagwara agarpura mod,mahi pul jethana ,guwadi ,antri, hirata kalinzara , tameshra ,luhari, kushalgarh highway to bagidora recco no coverage
ICR with Tata
AIRTEL
Banswara- Week Coverage b/w PardaMoru(PDMU01) to MahdwawithChak(MHDW01) due to Hilly Terrain, Other well covered
NO
BSNL No Coverage Issue NO
IDEA
Loharia to Paloda,Paloda to Pindawal, Munger to Aspur, Paroli Gordan to Kargasia, Ghatol to Bamanpada, Borda to Ghanoda, Kalinjara to Bagidora, Bagidora to Cheech, Kalinjara to Ranaji,Ranaji to Kushalgarh, Varda to Dungarpur, Sagwara to Thakarda, Khera to Partapur, Garhi to Bhilura, Banswara to Kupra,Talwara to Wajwana, Banswara to Sagrod, Sagrod to Barodia, Barodia to Kalinjara
NO
RCOM (GSM) No coverage in BAGIDORA, GERHI, ASPUR
NO
TATA (GSM) No coverage in Kushalgarh NO
MTS
No coverage between Kalinjara(Highway) to Kushalgarh(Highway), No coverage between Banswara to Sargod, No coverage b/w Alwar(Highway) to Sagwara (Highway), No coverage b/w Varda to Dungerpur (HIGHWAY)
NO
VODAFONE Partial coverage b/w Pardamoru & Tijwar due to hilly terain
NO
RCOM (CDMA) No coverage in Garhi, Kushalgarh, Bagidora, Ghatol, Aspur
NO
TATA (CDMA) No coverage in Bagidora, Garhi NO
3 Mar-15
AIRCEL
Bharatpur
Deeg, Kaman, Nadbai, Dholpur, Bari, Baseri, Rupwas, Bayana
Bharatpur to deeg madira,aau, deeg to kaman seu khata kaman to nadbai panhori bhadheera, dhoulpur to baseri kareempur, parvati pul,sallepur, kanchanpur, baseri to roopwas jarga, siyoli, highway to bayana nekpur.
NO
AIRTEL No Coverage Issue NO
BSNL No Coverage Issue NO
IDEA
Nagla Karan singh to Borai, Belara khurd to nagla mainthna, didawali to tankoli, seu to indroli, Narena Katta to Panhori, siwara to Nahroli, Garoli to Bahramda, Chaina Ka Pura to kasganj, Dandoli to edalpur, Narpura to Umrara, ratanpura to kumheri, Hajipur to Mahua Khera, Hansai To Aligarh,Nidhara to Rampur,Poothpura Kalan to Hingota, Pattipura to
NO
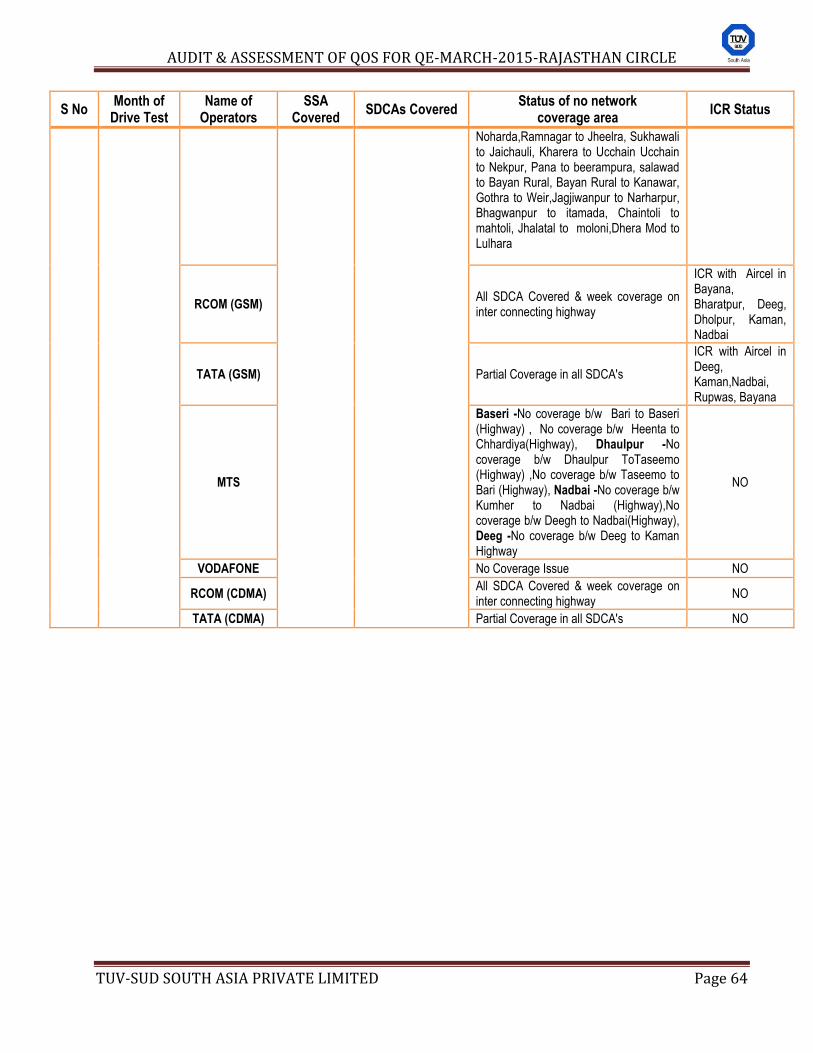
AUDIT & ASSESSMENT OF QOS FOR QE-MARCH-2015-RAJASTHAN CIRCLE
TUV-SUD SOUTH ASIA PRIVATE LIMITED Page 64
S No Month of
Drive Test Name of
Operators SSA
Covered SDCAs Covered
Status of no network coverage area
ICR Status
Noharda,Ramnagar to Jheelra, Sukhawali to Jaichauli, Kharera to Ucchain Ucchain to Nekpur, Pana to beerampura, salawad to Bayan Rural, Bayan Rural to Kanawar, Gothra to Weir,Jagjiwanpur to Narharpur, Bhagwanpur to itamada, Chaintoli to mahtoli, Jhalatal to moloni,Dhera Mod to Lulhara
RCOM (GSM) All SDCA Covered & week coverage on inter connecting highway
ICR with Aircel in Bayana, Bharatpur, Deeg, Dholpur, Kaman, Nadbai
TATA (GSM) Partial Coverage in all SDCA's
ICR with Aircel in Deeg, Kaman,Nadbai, Rupwas, Bayana
MTS
Baseri -No coverage b/w Bari to Baseri (Highway) , No coverage b/w Heenta to Chhardiya(Highway), Dhaulpur -No coverage b/w Dhaulpur ToTaseemo (Highway) ,No coverage b/w Taseemo to Bari (Highway), Nadbai -No coverage b/w Kumher to Nadbai (Highway),No coverage b/w Deegh to Nadbai(Highway), Deeg -No coverage b/w Deeg to Kaman Highway
NO
VODAFONE No Coverage Issue NO
RCOM (CDMA) All SDCA Covered & week coverage on inter connecting highway
NO
TATA (CDMA) Partial Coverage in all SDCA's NO
AUDIT & ASSESSMENT OF QOS FOR QE-MARCH-2015-RAJASTHAN CIRCLE
TUV-SUD SOUTH ASIA PRIVATE LIMITED Page 65
7.3 KEY FINDINGS ON DRIVE TEST: The key observations derived from the results of the drive tests are as under –
(i) In the Month of January-15, drive tests were conducted across Alwar SSA covering Alwar, Ramgarh, Bansur, Mundawar, Behror, Khairthal, Tijara and Bhiwadi SDCAs for three consecutive days. The performance of the service providers in general was satisfactory as all operators largely met the benchmarks on SSA level except BSNL. BSNL could not meet the benchmark of parameters Call Drop Rate (2.43%) and Voice Quality (91.95%) on over all SSA basis.
(ii) In the Month of February-15, drive tests were conducted across Banswara SSA covering Garhi, Sagwara, Doongarpur, Banswara, Kushalgarh, Bagidora , Gahlot and Aspur SDCAs. The drive test results for this SSA also revealed that in general, all operators were doing well within the QoS norms on overall SSA basis except BSNL. BSNL remained non-compliant for parameters Call Drop rate, Voice quality and Call Setup success rate with its achieved values as 5.84%, 92.72% (Outdoor) / 91.98% (Indoor) and 89.74% (Outdoor) / 89.19% (Indoor) respectively.
(iii) In the month of March -15, drive tests were conducted across Bharatpur SSA covering Deeg, Kaman, Nadbai, Dholpur, Bari, Baseri, Rupwas, Bharatpur and Bayana SDCAs. In Bharatpur SSA also , only BSNL failed to meet the benchmark of parameter Voice quality and Call Setup success Rate with its performance as 89.48% ( Outdoor) / 91.11% (Indoor) and 87.91% (Outdoor) / 90.63% (Indoor) on overall SSA level. Other operators performed well within the benchmarks.
Though the Operators have shown good performance in general, but the deficiencies with respect to adequate coverage and voice quality, observed during the drive tests, at the various locations on the drive test plots are detailed in the above table -5, table 6 and table 7 for the respective SSAs.
The detail of Network coverage and Intra Circle Roaming (ICR) status of different service providers at various locations in the three SSAs is given in table-8.
The performance of the service providers with regard to the Drive Test revealed that all the service providers performed well within the QoS norms. BSNL was the only operator which could not meet the benchmarks of the prime network parameters namely Call Drop Rate, Voice Quality and Call Setup Success rate across the above SSAs.
AUDIT & ASSESSMENT OF QOS FOR QE-MARCH-2015-RAJASTHAN CIRCLE
TUV-SUD SOUTH ASIA PRIVATE LIMITED Page 66
8. GRAPHICAL REPRESENTATION (CELLULAR MOBILE SERVICE PROVIDERS)
AVERAGED QUARTERLY PMR
V/S
AVERAGED QUARTERLY 3-DAYs LIVE MEASURMENT
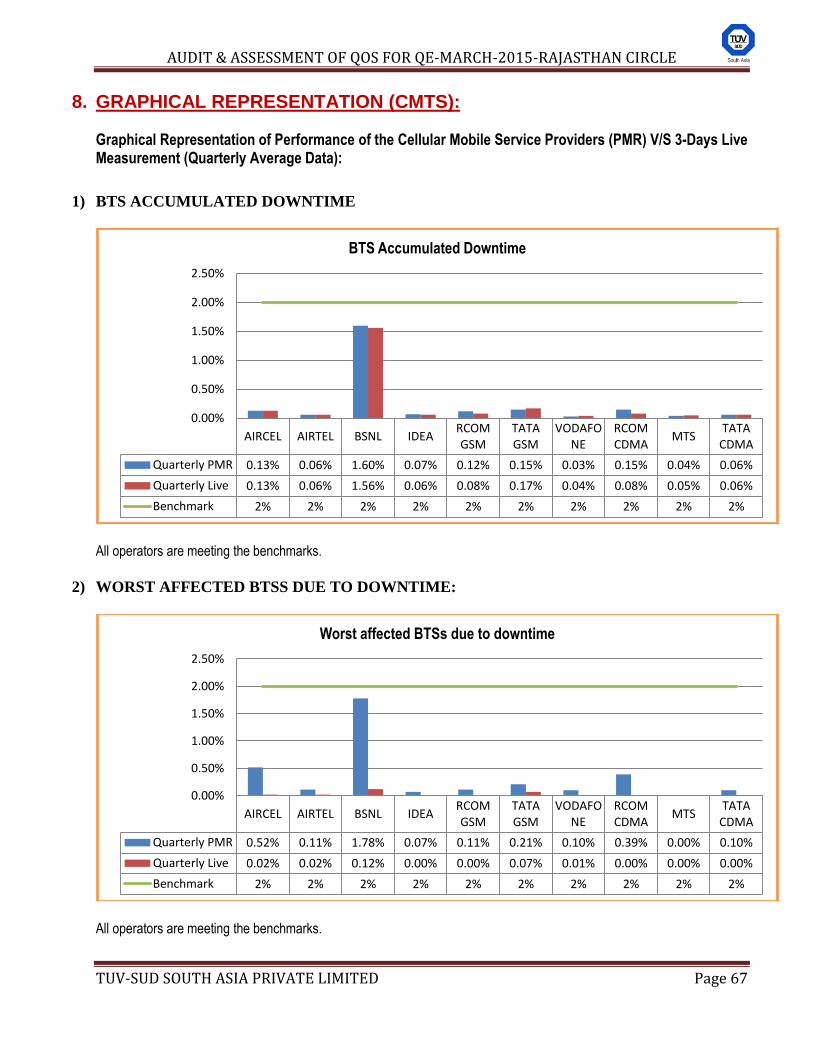
AUDIT & ASSESSMENT OF QOS FOR QE-MARCH-2015-RAJASTHAN CIRCLE
TUV-SUD SOUTH ASIA PRIVATE LIMITED Page 67
8. GRAPHICAL REPRESENTATION (CMTS):
Graphical Representation of Performance of the Cellular Mobile Service Providers (PMR) V/S 3-Days Live Measurement (Quarterly Average Data):
1) BTS ACCUMULATED DOWNTIME
All operators are meeting the benchmarks.
2) WORST AFFECTED BTSS DUE TO DOWNTIME:
All operators are meeting the benchmarks.
AIRCEL AIRTEL BSNL IDEA RCOM GSM
TATA GSM
VODAFONE
RCOM CDMA
MTS TATA
CDMA
Quarterly PMR 0.13% 0.06% 1.60% 0.07% 0.12% 0.15% 0.03% 0.15% 0.04% 0.06%
Quarterly Live 0.13% 0.06% 1.56% 0.06% 0.08% 0.17% 0.04% 0.08% 0.05% 0.06%
Benchmark 2% 2% 2% 2% 2% 2% 2% 2% 2% 2%
0.00%
0.50%
1.00%
1.50%
2.00%
2.50%
BTS Accumulated Downtime
AIRCEL AIRTEL BSNL IDEA RCOM GSM
TATA GSM
VODAFONE
RCOM CDMA
MTS TATA
CDMA
Quarterly PMR 0.52% 0.11% 1.78% 0.07% 0.11% 0.21% 0.10% 0.39% 0.00% 0.10%
Quarterly Live 0.02% 0.02% 0.12% 0.00% 0.00% 0.07% 0.01% 0.00% 0.00% 0.00%
Benchmark 2% 2% 2% 2% 2% 2% 2% 2% 2% 2%
0.00%
0.50%
1.00%
1.50%
2.00%
2.50%
Worst affected BTSs due to downtime
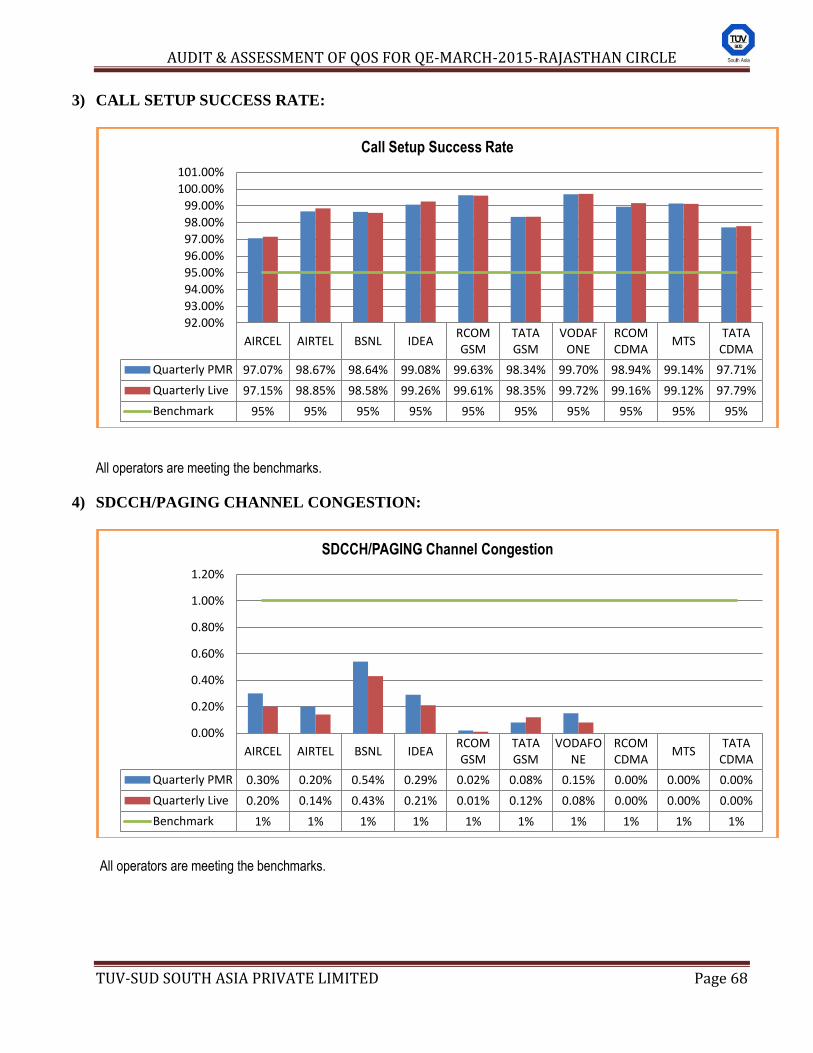
AUDIT & ASSESSMENT OF QOS FOR QE-MARCH-2015-RAJASTHAN CIRCLE
TUV-SUD SOUTH ASIA PRIVATE LIMITED Page 68
3) CALL SETUP SUCCESS RATE:
All operators are meeting the benchmarks.
4) SDCCH/PAGING CHANNEL CONGESTION:
All operators are meeting the benchmarks.
AIRCEL AIRTEL BSNL IDEA RCOM GSM
TATA GSM
VODAFONE
RCOM CDMA
MTS TATA
CDMA
Quarterly PMR 97.07% 98.67% 98.64% 99.08% 99.63% 98.34% 99.70% 98.94% 99.14% 97.71%
Quarterly Live 97.15% 98.85% 98.58% 99.26% 99.61% 98.35% 99.72% 99.16% 99.12% 97.79%
Benchmark 95% 95% 95% 95% 95% 95% 95% 95% 95% 95%
92.00%
93.00%
94.00%
95.00%
96.00%
97.00%
98.00%
99.00%
100.00%
101.00%
Call Setup Success Rate
AIRCEL AIRTEL BSNL IDEA RCOM GSM
TATA GSM
VODAFONE
RCOM CDMA
MTS TATA
CDMA
Quarterly PMR 0.30% 0.20% 0.54% 0.29% 0.02% 0.08% 0.15% 0.00% 0.00% 0.00%
Quarterly Live 0.20% 0.14% 0.43% 0.21% 0.01% 0.12% 0.08% 0.00% 0.00% 0.00%
Benchmark 1% 1% 1% 1% 1% 1% 1% 1% 1% 1%
0.00%
0.20%
0.40%
0.60%
0.80%
1.00%
1.20%
SDCCH/PAGING Channel Congestion
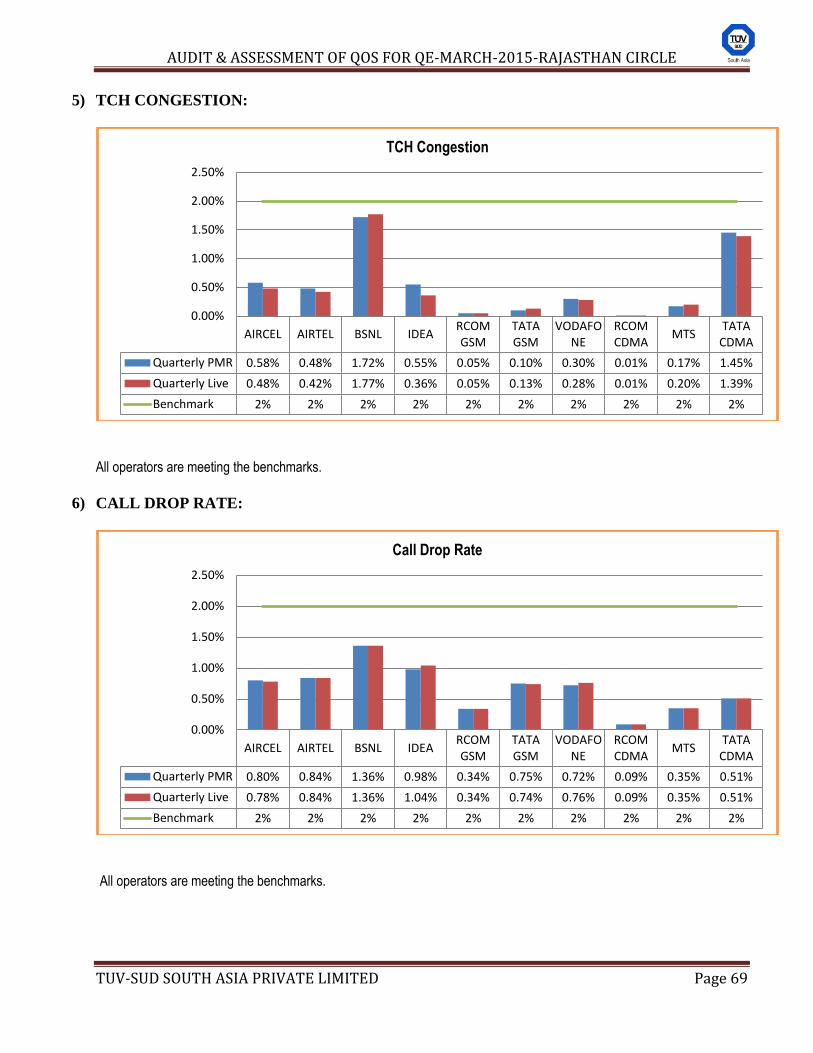
AUDIT & ASSESSMENT OF QOS FOR QE-MARCH-2015-RAJASTHAN CIRCLE
TUV-SUD SOUTH ASIA PRIVATE LIMITED Page 69
5) TCH CONGESTION:
All operators are meeting the benchmarks.
6) CALL DROP RATE:
All operators are meeting the benchmarks.
AIRCEL AIRTEL BSNL IDEA RCOM GSM
TATA GSM
VODAFONE
RCOM CDMA
MTS TATA
CDMA
Quarterly PMR 0.58% 0.48% 1.72% 0.55% 0.05% 0.10% 0.30% 0.01% 0.17% 1.45%
Quarterly Live 0.48% 0.42% 1.77% 0.36% 0.05% 0.13% 0.28% 0.01% 0.20% 1.39%
Benchmark 2% 2% 2% 2% 2% 2% 2% 2% 2% 2%
0.00%
0.50%
1.00%
1.50%
2.00%
2.50%
TCH Congestion
AIRCEL AIRTEL BSNL IDEA RCOM GSM
TATA GSM
VODAFONE
RCOM CDMA
MTS TATA
CDMA
Quarterly PMR 0.80% 0.84% 1.36% 0.98% 0.34% 0.75% 0.72% 0.09% 0.35% 0.51%
Quarterly Live 0.78% 0.84% 1.36% 1.04% 0.34% 0.74% 0.76% 0.09% 0.35% 0.51%
Benchmark 2% 2% 2% 2% 2% 2% 2% 2% 2% 2%
0.00%
0.50%
1.00%
1.50%
2.00%
2.50%
Call Drop Rate
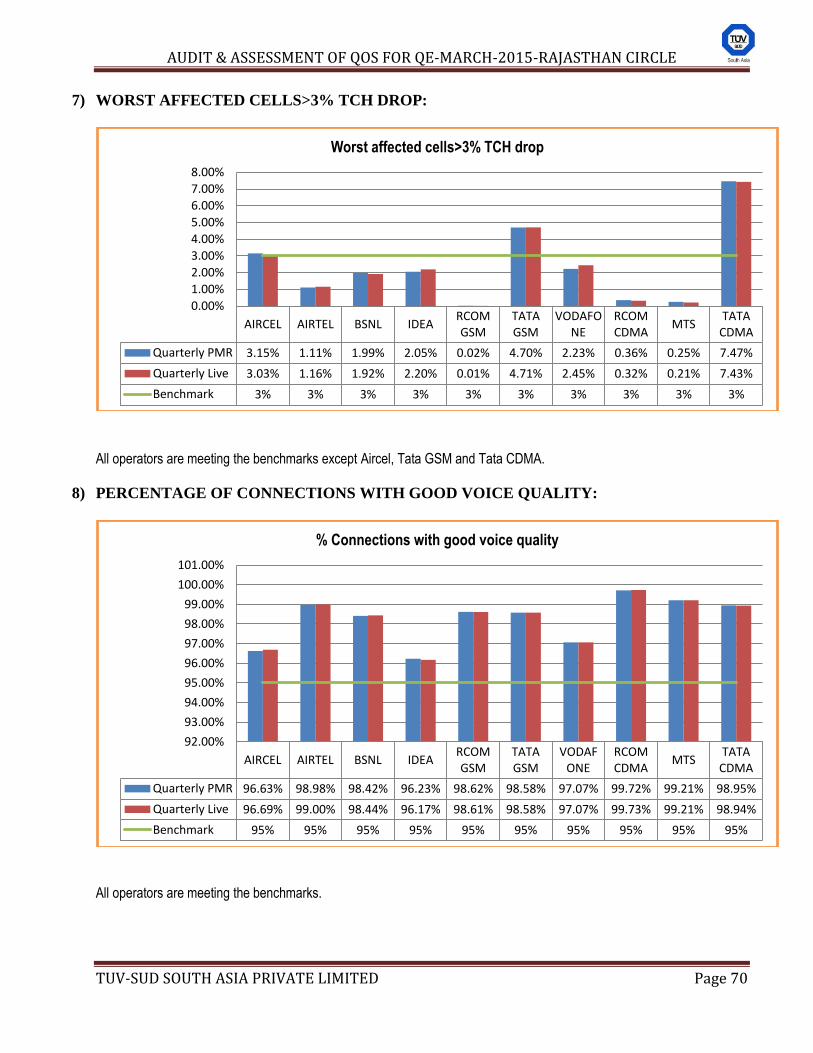
AUDIT & ASSESSMENT OF QOS FOR QE-MARCH-2015-RAJASTHAN CIRCLE
TUV-SUD SOUTH ASIA PRIVATE LIMITED Page 70
7) WORST AFFECTED CELLS>3% TCH DROP:
All operators are meeting the benchmarks except Aircel, Tata GSM and Tata CDMA.
8) PERCENTAGE OF CONNECTIONS WITH GOOD VOICE QUALITY:
All operators are meeting the benchmarks.
AIRCEL AIRTEL BSNL IDEA RCOM GSM
TATA GSM
VODAFONE
RCOM CDMA
MTS TATA
CDMA
Quarterly PMR 3.15% 1.11% 1.99% 2.05% 0.02% 4.70% 2.23% 0.36% 0.25% 7.47%
Quarterly Live 3.03% 1.16% 1.92% 2.20% 0.01% 4.71% 2.45% 0.32% 0.21% 7.43%
Benchmark 3% 3% 3% 3% 3% 3% 3% 3% 3% 3%
0.00%
1.00%
2.00%
3.00%
4.00%
5.00%
6.00%
7.00%
8.00%
Worst affected cells>3% TCH drop
AIRCEL AIRTEL BSNL IDEA RCOM GSM
TATA GSM
VODAFONE
RCOM CDMA
MTS TATA
CDMA
Quarterly PMR 96.63% 98.98% 98.42% 96.23% 98.62% 98.58% 97.07% 99.72% 99.21% 98.95%
Quarterly Live 96.69% 99.00% 98.44% 96.17% 98.61% 98.58% 97.07% 99.73% 99.21% 98.94%
Benchmark 95% 95% 95% 95% 95% 95% 95% 95% 95% 95%
92.00%
93.00%
94.00%
95.00%
96.00%
97.00%
98.00%
99.00%
100.00%
101.00%
% Connections with good voice quality