Embed Size (px)
Citation preview
UNEP FI and WWF Workshop: Innovative Financing for Sustainable Small & Medium Enterprises (SMEs) in Africa International Environment House, Geneva, Switzerland Wednesday 26th September 2007, 0900 – 1630 hrs
Background Reading
Contents Africa Competitiveness Report 2007, Chapters 1 & 21 by World Economic Forum, World Bank, and African Development Bank From Talk to Walk: Ideas to Optimize Development Impact2
by Clinton Global Initiative Financing SMEs in Africa3 by Celine Kaufmann Sustainable SMEs: Creating Value within Planetary Limits4 by Jenni Inglis, Consultant WWF Blended Value Investing: Capital Opportunities for Social & Environmental Impact5
by World Economic Forum On the Frontiers of Finance: Investing in Sustainable SMEs in Emerging Markets6
by Belinda Hoff, Institute for Responsible Investment, and Mareike Hussels, World Resources Institute
Venture Capital for Development7 by Alan J. Patricof, APAX Partners and Julie E. Sunderland Why doesn’t Africa get more Equity investment?8
by Todd Moss, Vijay Ramachandran, and Scott Standley; Center for Global Development
Risk Mitigation Mechanisms for Investment in Sustainable SMEs9 by DeRisk Advisory Services Financing Sustainable SMEs in Africa: a hierarchy of development needs and acknowledging the vital role of the Diaspora10 by Dr. Kimberly Ochs, London School of Economics
1 www.weforum.org/africa 2 www.dalberg.com/pdfs/taskforce.pdf 3 “Financing SMEs in Africa” by Celine Kaufmann, OECD Policy Insights No. 7, available at https://www.oecd.org/dataoecd/57/59/34908457.pdf 4 Research paper prepared for this workshop. 5 https://www.weforum.org/pdf/Initiatives/Blended_Value_Report_2006.pdf 6 Included with prior agreement from the authors of the paper. 7 Prepared for the Brookings Blum Roundtable: Private Sector in fight against global poverty, 2005 8 “Why Doesn’t Africa Get More Equity? Frontier Stock Markets, Asset Allocation of Global Emerging Market Funds”, by Working Paper 112, Februrary 2007, Center for Gobal Development 9 DRAFT of the research paper prepared for this workshop, and to be concluded after capturing inputs from the workshop delegates. 10 Winner of the Call-for-papers specifically conducted for this workshop.
Africa Competitiveness Report 2007 Chapters 1.1 & 1.2 By World Economic Forum, World Bank, Africa Development Bank (Full report can be found at www.weforum.org/africa)
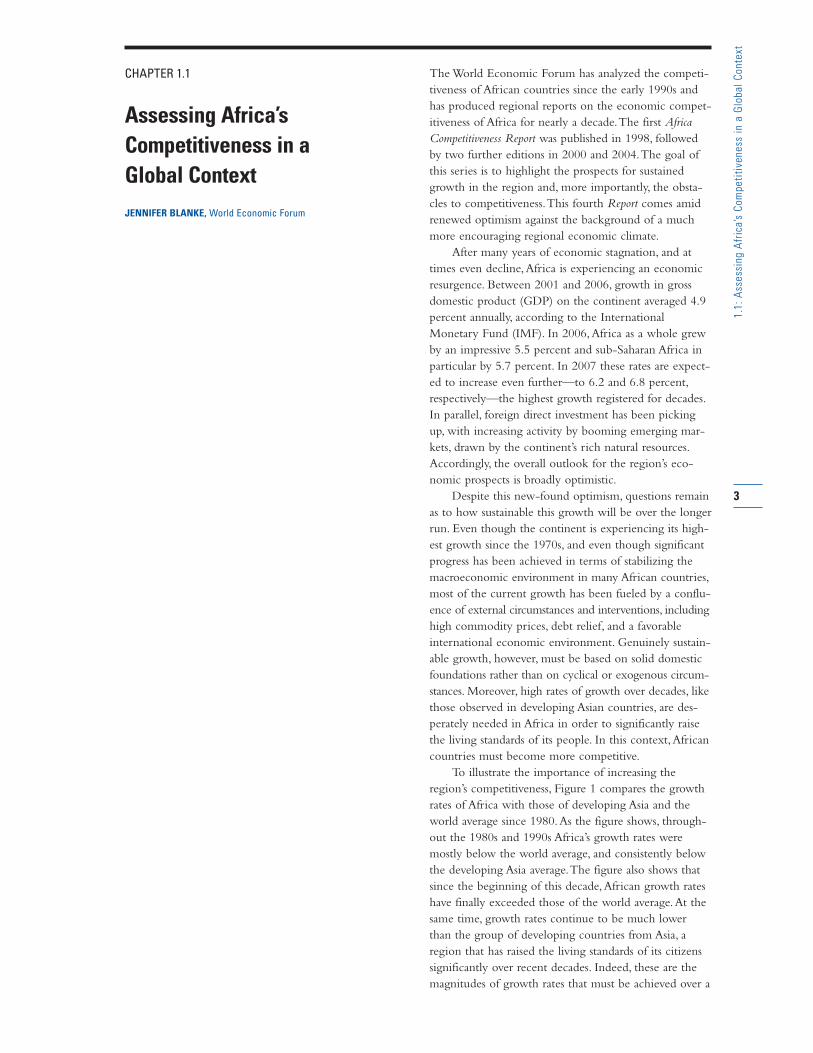
CHAPTER 1.1
Assessing Africa’s
Competitiveness in a
Global Context
JENNIFER BLANKE, World Economic Forum
The World Economic Forum has analyzed the competi-
tiveness of African countries since the early 1990s and
has produced regional reports on the economic compet-
itiveness of Africa for nearly a decade.The first Africa
Competitiveness Report was published in 1998, followed
by two further editions in 2000 and 2004.The goal of
this series is to highlight the prospects for sustained
growth in the region and, more importantly, the obsta-
cles to competitiveness.This fourth Report comes amid
renewed optimism against the background of a much
more encouraging regional economic climate.
After many years of economic stagnation, and at
times even decline,Africa is experiencing an economic
resurgence. Between 2001 and 2006, growth in gross
domestic product (GDP) on the continent averaged 4.9
percent annually, according to the International
Monetary Fund (IMF). In 2006,Africa as a whole grew
by an impressive 5.5 percent and sub-Saharan Africa in
particular by 5.7 percent. In 2007 these rates are expect-
ed to increase even further—to 6.2 and 6.8 percent,
respectively—the highest growth registered for decades.
In parallel, foreign direct investment has been picking
up, with increasing activity by booming emerging mar-
kets, drawn by the continent’s rich natural resources.
Accordingly, the overall outlook for the region’s eco-
nomic prospects is broadly optimistic.
Despite this new-found optimism, questions remain
as to how sustainable this growth will be over the longer
run. Even though the continent is experiencing its high-
est growth since the 1970s, and even though significant
progress has been achieved in terms of stabilizing the
macroeconomic environment in many African countries,
most of the current growth has been fueled by a conflu-
ence of external circumstances and interventions, including
high commodity prices, debt relief, and a favorable
international economic environment. Genuinely sustain-
able growth, however, must be based on solid domestic
foundations rather than on cyclical or exogenous circum-
stances. Moreover, high rates of growth over decades, like
those observed in developing Asian countries, are des-
perately needed in Africa in order to significantly raise
the living standards of its people. In this context,African
countries must become more competitive.
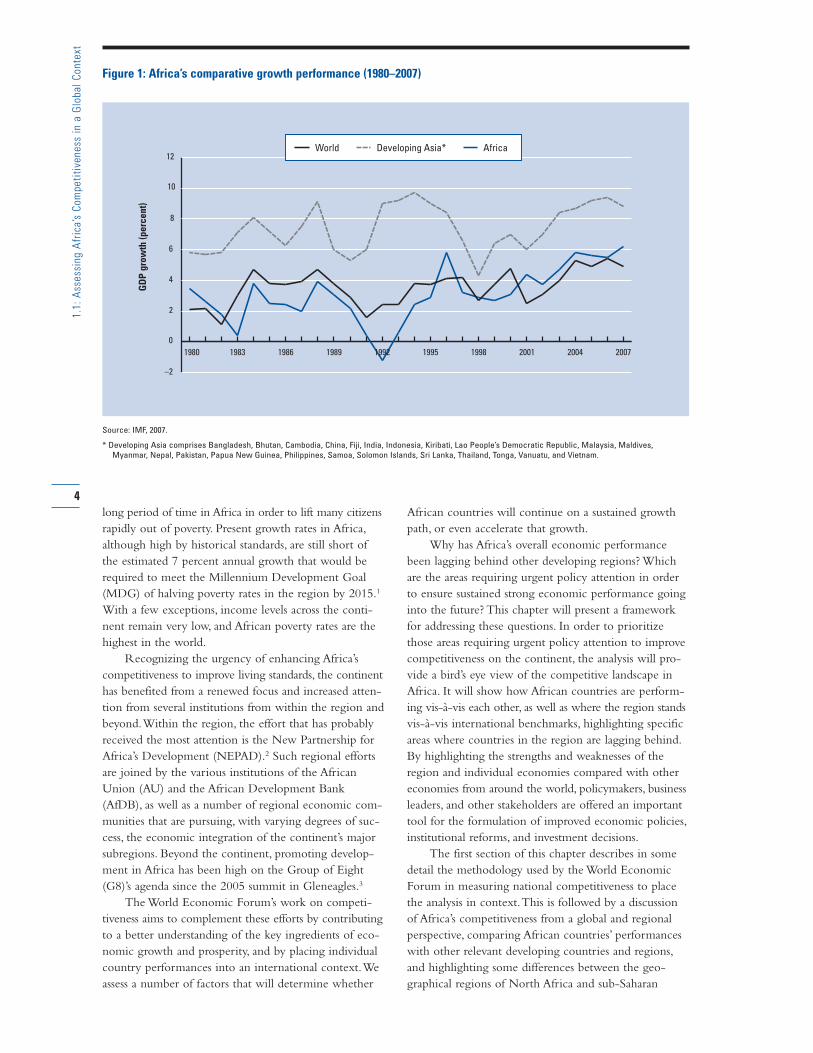
To illustrate the importance of increasing the
region’s competitiveness, Figure 1 compares the growth
rates of Africa with those of developing Asia and the
world average since 1980.As the figure shows, through-
out the 1980s and 1990s Africa’s growth rates were
mostly below the world average, and consistently below
the developing Asia average.The figure also shows that
since the beginning of this decade,African growth rates
have finally exceeded those of the world average.At the
same time, growth rates continue to be much lower
than the group of developing countries from Asia, a
region that has raised the living standards of its citizens
significantly over recent decades. Indeed, these are the
magnitudes of growth rates that must be achieved over a
3
1.1
: A
sse
ssin
g A
fric
a’s
Co
mp
eti
tive
ne
ss i
n a
Glo
ba
l C
on
text
long period of time in Africa in order to lift many citizens
rapidly out of poverty. Present growth rates in Africa,
although high by historical standards, are still short of
the estimated 7 percent annual growth that would be
required to meet the Millennium Development Goal
(MDG) of halving poverty rates in the region by 2015.1
With a few exceptions, income levels across the conti-
nent remain very low, and African poverty rates are the
highest in the world.
Recognizing the urgency of enhancing Africa’s
competitiveness to improve living standards, the continent
has benefited from a renewed focus and increased atten-
tion from several institutions from within the region and
beyond.Within the region, the effort that has probably
received the most attention is the New Partnership for
Africa’s Development (NEPAD).2 Such regional efforts
are joined by the various institutions of the African
Union (AU) and the African Development Bank
(AfDB), as well as a number of regional economic com-
munities that are pursuing, with varying degrees of suc-
cess, the economic integration of the continent’s major
subregions. Beyond the continent, promoting develop-
ment in Africa has been high on the Group of Eight
(G8)’s agenda since the 2005 summit in Gleneagles.3
The World Economic Forum’s work on competi-
tiveness aims to complement these efforts by contributing
to a better understanding of the key ingredients of eco-
nomic growth and prosperity, and by placing individual
country performances into an international context.We
assess a number of factors that will determine whether
African countries will continue on a sustained growth
path, or even accelerate that growth.
Why has Africa’s overall economic performance
been lagging behind other developing regions? Which
are the areas requiring urgent policy attention in order
to ensure sustained strong economic performance going
into the future? This chapter will present a framework
for addressing these questions. In order to prioritize
those areas requiring urgent policy attention to improve
competitiveness on the continent, the analysis will pro-
vide a bird’s eye view of the competitive landscape in
Africa. It will show how African countries are perform-
ing vis-à-vis each other, as well as where the region stands
vis-à-vis international benchmarks, highlighting specific
areas where countries in the region are lagging behind.
By highlighting the strengths and weaknesses of the
region and individual economies compared with other
economies from around the world, policymakers, business
leaders, and other stakeholders are offered an important
tool for the formulation of improved economic policies,
institutional reforms, and investment decisions.
The first section of this chapter describes in some
detail the methodology used by the World Economic
Forum in measuring national competitiveness to place
the analysis in context.This is followed by a discussion
of Africa’s competitiveness from a global and regional
perspective, comparing African countries’ performances
with other relevant developing countries and regions,
and highlighting some differences between the geo-
graphical regions of North Africa and sub-Saharan
4
1.1
: A
sse
ssin
g A
fric
a’s
Co
mp
eti
tive
ne
ss i
n a
Glo
ba
l C
on
text
–2
0
2
4
6
8
10
12
1980 1983 1986 1989 1992 1995 1998 2001 2004 2007
World Developing Asia* Africa
Source: IMF, 2007.
* Developing Asia comprises Bangladesh, Bhutan, Cambodia, China, Fiji, India, Indonesia, Kiribati, Lao People’s Democratic Republic, Malaysia, Maldives,
Myanmar, Nepal, Pakistan, Papua New Guinea, Philippines, Samoa, Solomon Islands, Sri Lanka, Thailand, Tonga, Vanuatu, and Vietnam.
Figure 1: Africa’s comparative growth performance (1980–2007)
GD
P g
row
th (
pe
rce
nt)
Africa.The next section includes a more detailed analy-
sis of the best performers in the region across the vari-
ous “pillars” of national competitiveness.This analysis
shows that there are strong individual country perform-
ances in a number of areas and highlights the existence
of best practices within the region.The final section
provides details on the competitive performances of
individual African countries, discussing both the com-
petitive strengths and weaknesses in each, and pointing
toward those areas most requiring policy attention.
Measuring competitiveness
In order to assess national competitiveness, the World
Economic Forum has developed the Global
Competitiveness Index (GCI).4 Competitiveness is defined
as the set of institutions, policies, and factors that drive
productivity and therefore set the sustainable current
and medium-term levels of economic prosperity.5 In this
sense competitiveness is not viewed as a zero-sum game,
such as competition among companies vying for a larger
portion of a given market share. Instead, by placing the
focus on the drivers and the facilitators of productivity,
improvements in one country’s competitiveness do not
exclude similar improvements in other countries.
We have learned from our years of research that
the measurement of competitiveness is a complex
undertaking.The GCI, albeit simple in structure, provides
a holistic overview of factors that are critical to driving
productivity and competitiveness, and groups them into
nine pillars: institutions (public and private), infrastructure,
the macroeconomy, health and primary education, higher
education and training, market efficiency (goods, labor, finan-
cial), technological readiness, business sophistication, and
innovation. Each of these pillars plays a critical role in
driving national competitiveness.The GCI is the most
comprehensive competitiveness index to date, measuring
the macro- and microeconomic drivers of competitive-
ness across a large number of countries.
The selection of these pillars, as well as the factors
that enter each of them, is based on the latest theoretical
and empirical research. It is important to note that none
of these factors alone can ensure competitiveness.The
value of increased spending in education will be under-
mined if rigidities in the labor market and other institu-
tional weaknesses make it difficult for new graduates to
gain access to suitable employment opportunities.
Attempts to improve the macroeconomic environment
—for example, bringing public finances under control—
are more likely to be successful and receive public sup-
port in countries where there is reasonable transparency
in the management of public resources, as opposed to
widespread corruption and abuse. Innovation or the
adoption of new technologies or upgrading management
practices will most likely not receive broad-based support
in the business community if protection of the domestic
market ensures that the returns to seeking rents are
higher than those for new investments.
The most competitive economies in the world will
therefore typically be those where concerted efforts have
been made to frame policies in a comprehensive way—
that is, those that recognize the importance of a broad
array of factors, their interconnection, and the need to
address the underlying weaknesses they reveal in a
proactive way.
The nine pillars are measured using both “hard”
data (such as inflation, Internet penetration, life
expectancy, and school enrollment rates) from public
sources and data from the World Economic Forum’s
Executive Opinion Survey, conducted annually among
top executives in all of the countries assessed.The
Survey provides crucial data on a number of qualitative
issues (for example, corruption, confidence in the public
sector, quality of schools) for which no hard data exist.6
Our sample covers 128 economies at different
stages of economic development, with GDP per capita
in the wealthiest country surpassing that of the poorest
country by a factor of 117, based on purchasing power
parity. Clearly policy priorities must evolve as countries
advance on the development path, since what it takes to
achieve productivity improvements in a less-advanced
economy—such as improving health, fighting illiteracy
and corruption, or constructing basic infrastructure
facilities such as roads and ports—will no longer be suf-
ficient to increase productivity in a more sophisticated
economic framework, where productivity gains from
these policies have often already been exploited.
To take this process into account, the concept of
stages of development has been introduced into the cal-
culation of the Index. Specifically, countries are separat-
ed into three stages, based on the idea that as countries
move along the development path, wages tend to
increase, and that in order to sustain this higher income,
productivity must improve.This concept is integrated
into the Index by attributing higher relative weights to
those pillars that are relatively more relevant for a coun-
try given its particular stage of development.
In the factor-driven stage countries compete based on
their factor endowments, primarily unskilled labor and
natural resources. Companies compete on the basis of
prices and sell basic products or commodities, with their
low productivity reflected in low wages.To maintain
competitiveness at this stage of development, competi-
tiveness hinges mainly on a stable macroeconomic
framework (pillar 1), well-functioning public and private
institutions (pillar 2), appropriate infrastructure (pillar 3),
and a healthy, literate workforce (pillar 4).
As wages rise with advancing development, countries
move into the efficiency-driven stage of development, when
they must begin to develop more efficient production
processes and increase product quality.At this point,
competitiveness becomes increasingly driven by higher
education and training (pillar 5), efficient markets (pillar
5
1.1
: A
sse
ssin
g A
fric
a’s
Co
mp
eti
tive
ne
ss i
n a
Glo
ba
l C
on
text
6), and the ability to harness the benefits of existing
technologies (pillar 7).
Finally, as countries move into the innovation-driven
stage, they are able to sustain higher wages and the asso-
ciated standard of living only if their businesses are able
to compete with new and unique products.At this stage,
companies must compete through innovation (pillar 9),
producing new and different goods using the most
sophisticated production processes (pillar 8).Thus,
although all nine pillars matter to a certain extent for all
countries, the importance of each one depends on a
country’s particular stage of development.
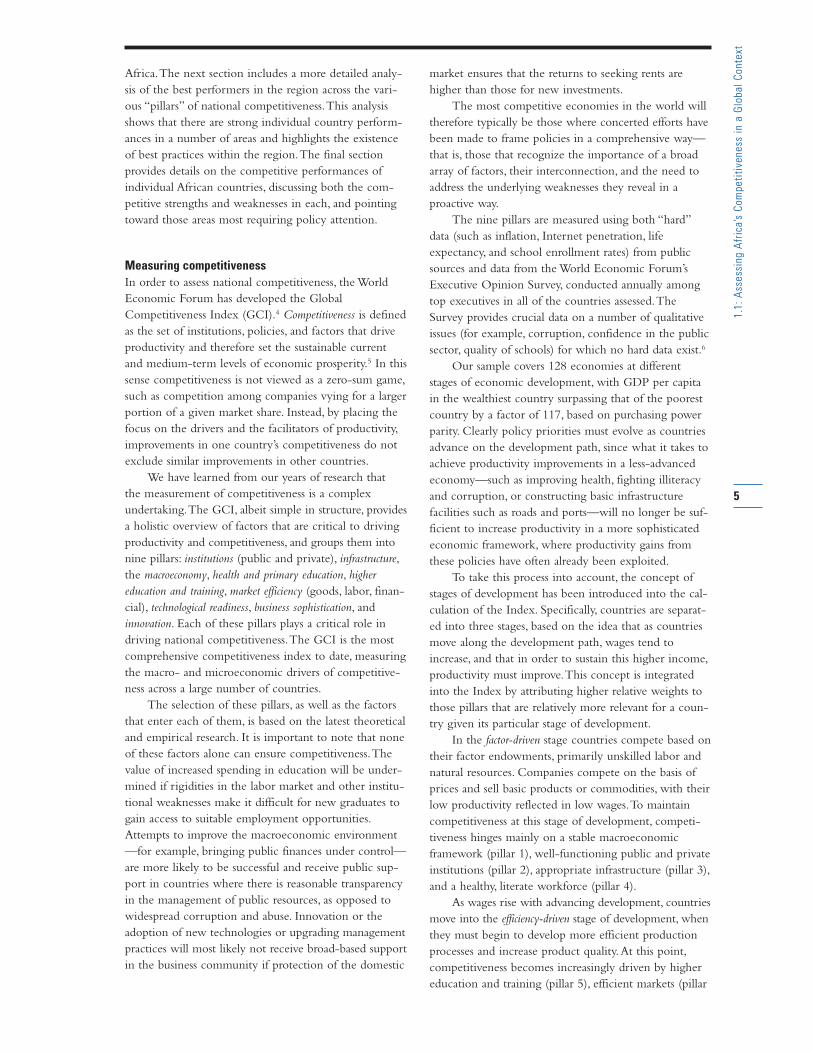
To account for this, the pillars are organized into
three subindexes, each critical to a particular stage of
development.The basic requirements subindex groups those
pillars most critical for countries in the factor-driven
stage.The efficiency enhancers subindex includes those pillars
critical for countries in the efficiency-driven stage.And
the innovation and sophistication factors subindex includes all
pillars critical to countries in the innovation driven
stage.The three subindexes are shown in Figure 2.
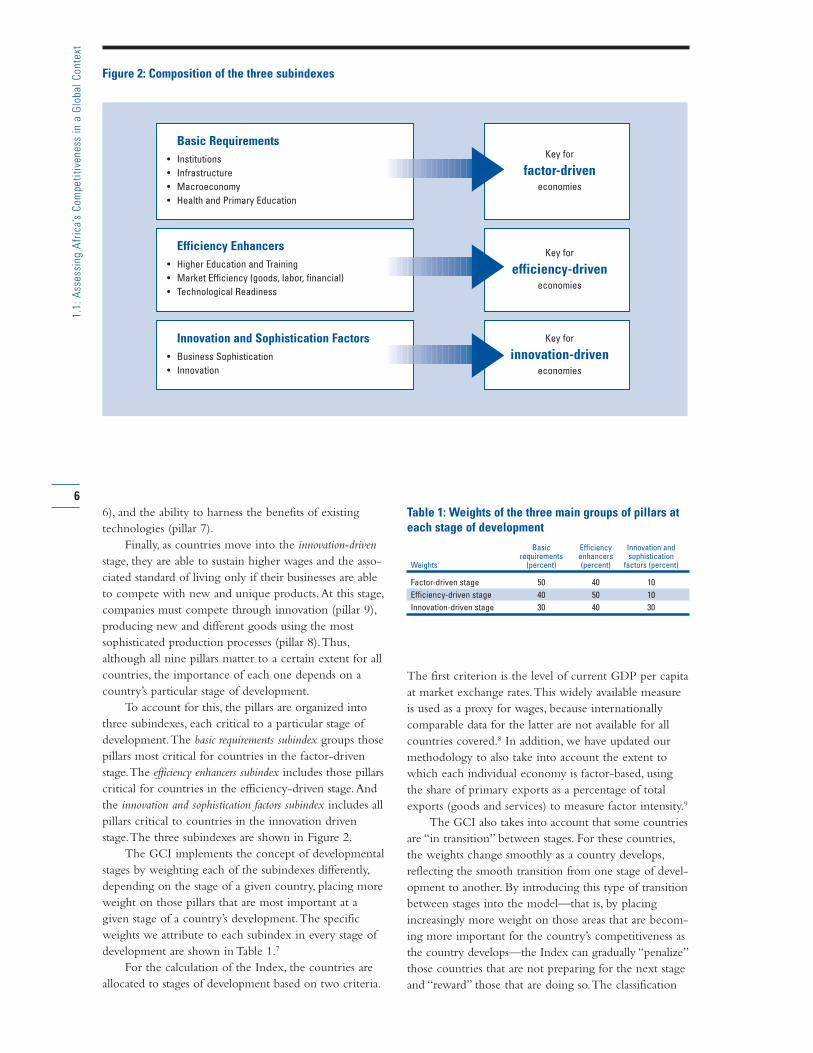
The GCI implements the concept of developmental
stages by weighting each of the subindexes differently,
depending on the stage of a given country, placing more
weight on those pillars that are most important at a
given stage of a country’s development.The specific
weights we attribute to each subindex in every stage of
development are shown in Table 1.7
For the calculation of the Index, the countries are
allocated to stages of development based on two criteria.
The first criterion is the level of current GDP per capita
at market exchange rates.This widely available measure
is used as a proxy for wages, because internationally
comparable data for the latter are not available for all
countries covered.8 In addition, we have updated our
methodology to also take into account the extent to
which each individual economy is factor-based, using
the share of primary exports as a percentage of total
exports (goods and services) to measure factor intensity.9
The GCI also takes into account that some countries
are “in transition” between stages. For these countries,
the weights change smoothly as a country develops,
reflecting the smooth transition from one stage of devel-
opment to another. By introducing this type of transition
between stages into the model—that is, by placing
increasingly more weight on those areas that are becom-
ing more important for the country’s competitiveness as
the country develops—the Index can gradually “penalize”
those countries that are not preparing for the next stage
and “reward” those that are doing so.The classification
6
1.1
: A
sse
ssin
g A
fric
a’s
Co
mp
eti
tive
ne
ss i
n a
Glo
ba
l C
on
text
Figure 2: Composition of the three subindexes
Basic Requirements
• Institutions
• Infrastructure
• Macroeconomy
• Health and Primary Education
Efficiency Enhancers
• Higher Education and Training
• Market Efficiency (goods, labor, financial)
• Technological Readiness
Innovation and Sophistication Factors
• Business Sophistication
• Innovation
Key for
factor-driveneconomies
Key for
efficiency-driveneconomies
Key for
innovation-driveneconomies
Table 1: Weights of the three main groups of pillars ateach stage of development
Basic Efficiency Innovation andrequirements enhancers sophistication
Weights (percent) (percent) factors (percent)
Factor-driven stage 50 40 10
Efficiency-driven stage 40 50 10
Innovation-driven stage 30 40 30
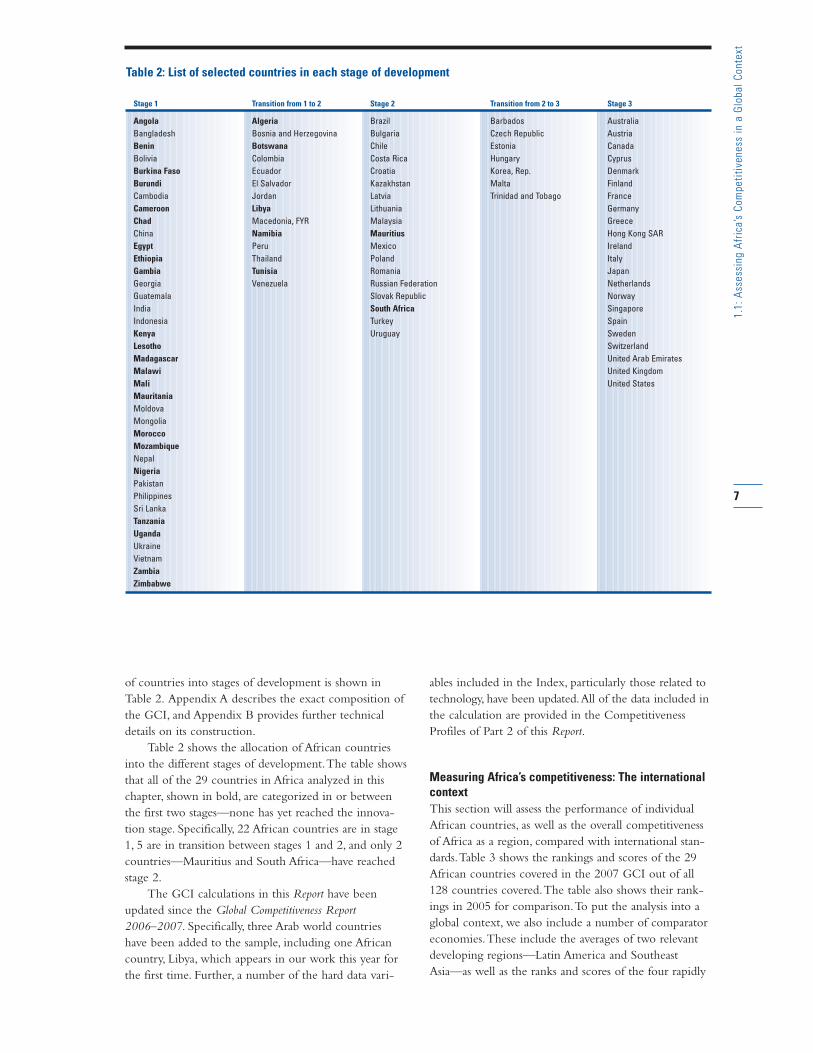
of countries into stages of development is shown in
Table 2. Appendix A describes the exact composition of
the GCI, and Appendix B provides further technical
details on its construction.
Table 2 shows the allocation of African countries
into the different stages of development.The table shows
that all of the 29 countries in Africa analyzed in this
chapter, shown in bold, are categorized in or between
the first two stages—none has yet reached the innova-
tion stage. Specifically, 22 African countries are in stage
1, 5 are in transition between stages 1 and 2, and only 2
countries—Mauritius and South Africa—have reached
stage 2.
The GCI calculations in this Report have been
updated since the Global Competitiveness Report
2006–2007. Specifically, three Arab world countries
have been added to the sample, including one African
country, Libya, which appears in our work this year for
the first time. Further, a number of the hard data vari-
ables included in the Index, particularly those related to
technology, have been updated.All of the data included in
the calculation are provided in the Competitiveness
Profiles of Part 2 of this Report.
Measuring Africa’s competitiveness: The internationalcontext
This section will assess the performance of individual
African countries, as well as the overall competitiveness
of Africa as a region, compared with international stan-
dards.Table 3 shows the rankings and scores of the 29
African countries covered in the 2007 GCI out of all
128 countries covered.The table also shows their rank-
ings in 2005 for comparison.To put the analysis into a
global context, we also include a number of comparator
economies.These include the averages of two relevant
developing regions—Latin America and Southeast
Asia—as well as the ranks and scores of the four rapidly
7
1.1
: A
sse
ssin
g A
fric
a’s
Co
mp
eti
tive
ne
ss i
n a
Glo
ba
l C
on
text
Table 2: List of selected countries in each stage of development
Stage 1 Transition from 1 to 2 Stage 2 Transition from 2 to 3 Stage 3
Angola Algeria Brazil Barbados Australia
Bangladesh Bosnia and Herzegovina Bulgaria Czech Republic Austria
Benin Botswana Chile Estonia Canada
Bolivia Colombia Costa Rica Hungary Cyprus
Burkina Faso Ecuador Croatia Korea, Rep. Denmark
Burundi El Salvador Kazakhstan Malta Finland
Cambodia Jordan Latvia Trinidad and Tobago France
Cameroon Libya Lithuania Germany
Chad Macedonia, FYR Malaysia Greece
China Namibia Mauritius Hong Kong SAR
Egypt Peru Mexico Ireland
Ethiopia Thailand Poland Italy
Gambia Tunisia Romania Japan
Georgia Venezuela Russian Federation Netherlands
Guatemala Slovak Republic Norway
India South Africa Singapore
Indonesia Turkey Spain
Kenya Uruguay Sweden
Lesotho Switzerland
Madagascar United Arab Emirates
Malawi United Kingdom
Mali United States
Mauritania
Moldova
Mongolia
Morocco
Mozambique
Nepal
Nigeria
Pakistan
Philippines
Sri Lanka
Tanzania
Uganda
Ukraine
Vietnam
Zambia
Zimbabwe
developing and large “BRIC” countries (Brazil, Russia,
India, and China).
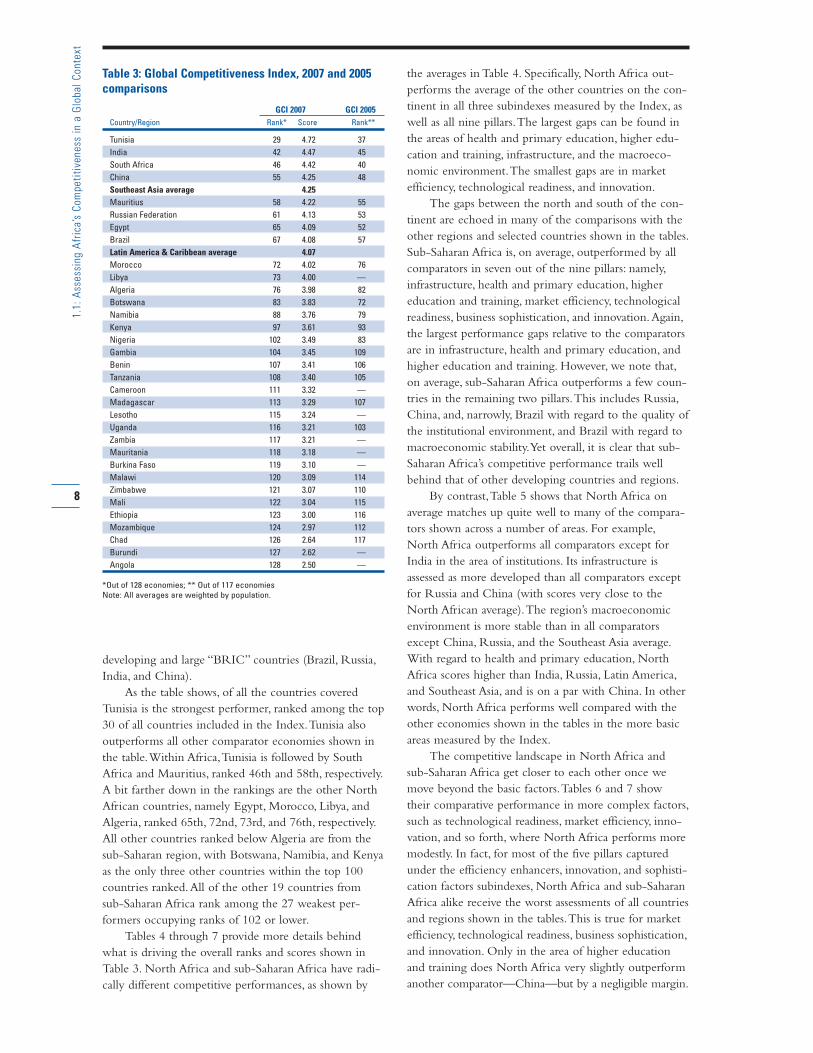
As the table shows, of all the countries covered
Tunisia is the strongest performer, ranked among the top
30 of all countries included in the Index.Tunisia also
outperforms all other comparator economies shown in
the table.Within Africa,Tunisia is followed by South
Africa and Mauritius, ranked 46th and 58th, respectively.
A bit farther down in the rankings are the other North
African countries, namely Egypt, Morocco, Libya, and
Algeria, ranked 65th, 72nd, 73rd, and 76th, respectively.
All other countries ranked below Algeria are from the
sub-Saharan region, with Botswana, Namibia, and Kenya
as the only three other countries within the top 100
countries ranked.All of the other 19 countries from
sub-Saharan Africa rank among the 27 weakest per-
formers occupying ranks of 102 or lower.
Tables 4 through 7 provide more details behind
what is driving the overall ranks and scores shown in
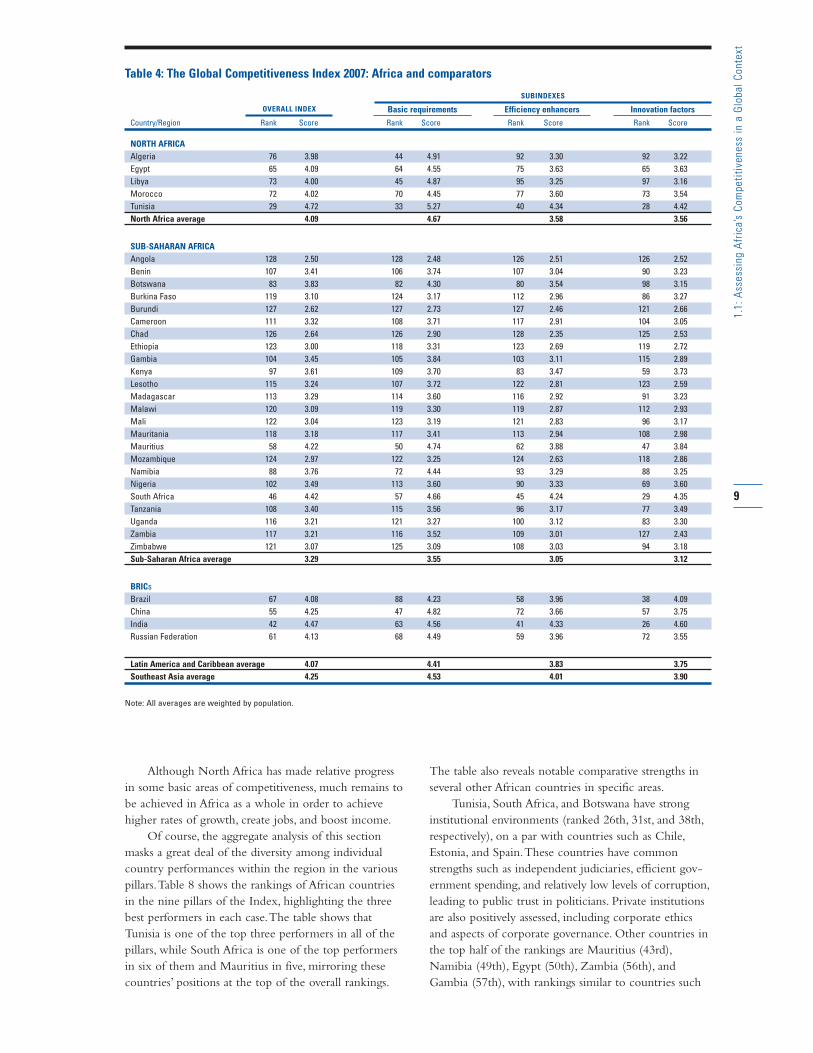
Table 3. North Africa and sub-Saharan Africa have radi-
cally different competitive performances, as shown by
the averages in Table 4. Specifically, North Africa out-
performs the average of the other countries on the con-
tinent in all three subindexes measured by the Index, as
well as all nine pillars.The largest gaps can be found in
the areas of health and primary education, higher edu-
cation and training, infrastructure, and the macroeco-
nomic environment.The smallest gaps are in market
efficiency, technological readiness, and innovation.
The gaps between the north and south of the con-
tinent are echoed in many of the comparisons with the
other regions and selected countries shown in the tables.
Sub-Saharan Africa is, on average, outperformed by all
comparators in seven out of the nine pillars: namely,
infrastructure, health and primary education, higher
education and training, market efficiency, technological
readiness, business sophistication, and innovation.Again,
the largest performance gaps relative to the comparators
are in infrastructure, health and primary education, and
higher education and training. However, we note that,
on average, sub-Saharan Africa outperforms a few coun-
tries in the remaining two pillars.This includes Russia,
China, and, narrowly, Brazil with regard to the quality of
the institutional environment, and Brazil with regard to
macroeconomic stability.Yet overall, it is clear that sub-
Saharan Africa’s competitive performance trails well
behind that of other developing countries and regions.
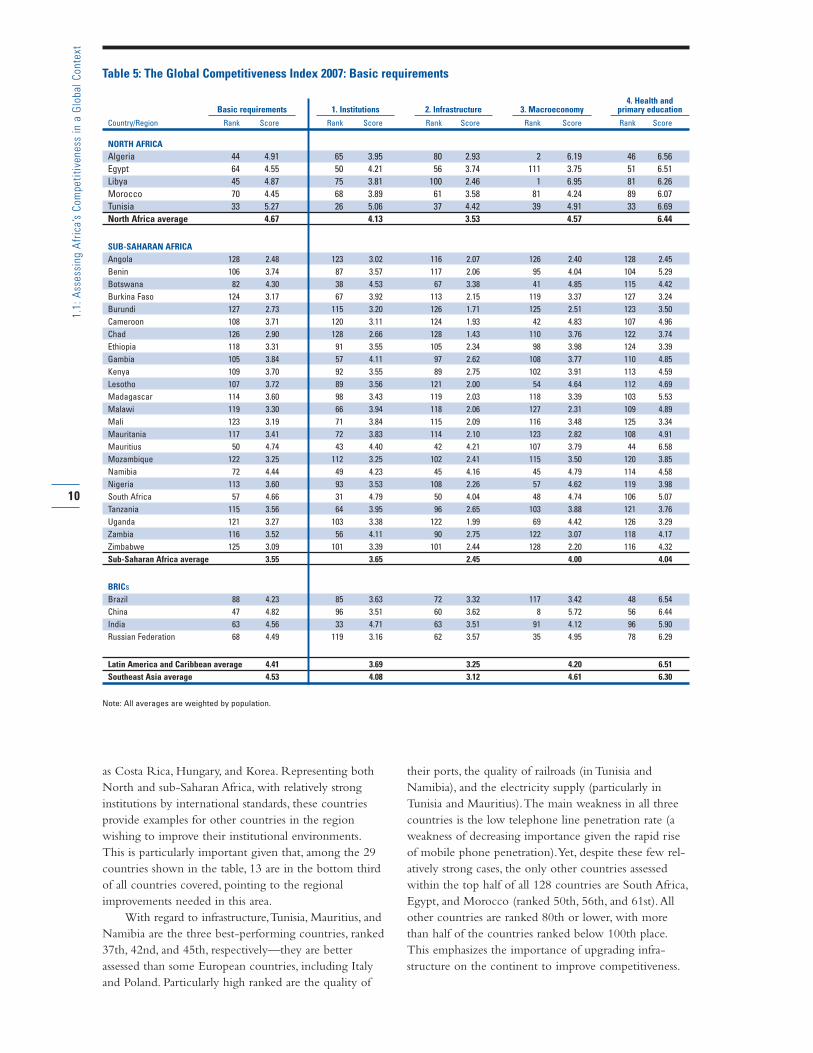
By contrast,Table 5 shows that North Africa on
average matches up quite well to many of the compara-
tors shown across a number of areas. For example,
North Africa outperforms all comparators except for
India in the area of institutions. Its infrastructure is
assessed as more developed than all comparators except
for Russia and China (with scores very close to the
North African average).The region’s macroeconomic
environment is more stable than in all comparators
except China, Russia, and the Southeast Asia average.
With regard to health and primary education, North
Africa scores higher than India, Russia, Latin America,
and Southeast Asia, and is on a par with China. In other
words, North Africa performs well compared with the
other economies shown in the tables in the more basic
areas measured by the Index.
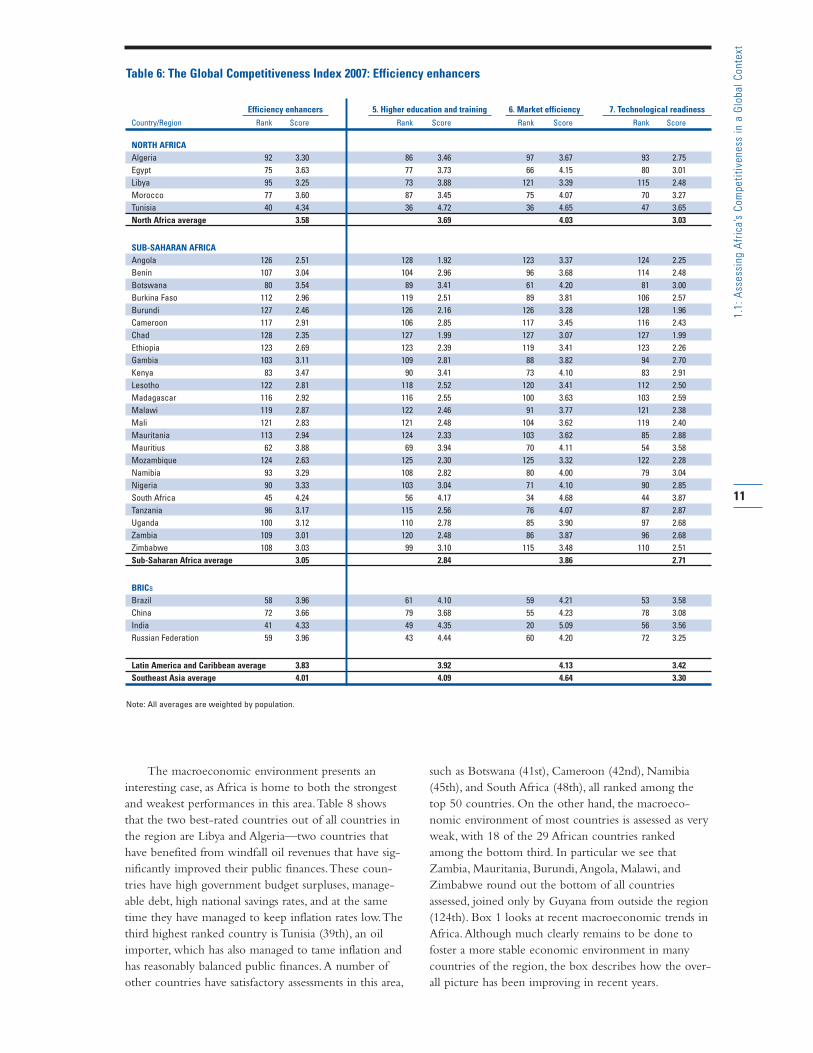
The competitive landscape in North Africa and
sub-Saharan Africa get closer to each other once we
move beyond the basic factors.Tables 6 and 7 show
their comparative performance in more complex factors,
such as technological readiness, market efficiency, inno-
vation, and so forth, where North Africa performs more
modestly. In fact, for most of the five pillars captured
under the efficiency enhancers, innovation, and sophisti-
cation factors subindexes, North Africa and sub-Saharan
Africa alike receive the worst assessments of all countries
and regions shown in the tables.This is true for market
efficiency, technological readiness, business sophistication,
and innovation. Only in the area of higher education
and training does North Africa very slightly outperform
another comparator—China—but by a negligible margin.
8
1.1
: A
sse
ssin
g A
fric
a’s
Co
mp
eti
tive
ne
ss i
n a
Glo
ba
l C
on
text
Table 3: Global Competitiveness Index, 2007 and 2005comparisons
GCI 2007 GCI 2005
Country/Region Rank* Score Rank**
Tunisia 29 4.72 37
India 42 4.47 45
South Africa 46 4.42 40
China 55 4.25 48
Southeast Asia average 4.25
Mauritius 58 4.22 55
Russian Federation 61 4.13 53
Egypt 65 4.09 52
Brazil 67 4.08 57
Latin America & Caribbean average 4.07
Morocco 72 4.02 76
Libya 73 4.00 —
Algeria 76 3.98 82
Botswana 83 3.83 72
Namibia 88 3.76 79
Kenya 97 3.61 93
Nigeria 102 3.49 83
Gambia 104 3.45 109
Benin 107 3.41 106
Tanzania 108 3.40 105
Cameroon 111 3.32 —
Madagascar 113 3.29 107
Lesotho 115 3.24 —
Uganda 116 3.21 103
Zambia 117 3.21 —
Mauritania 118 3.18 —
Burkina Faso 119 3.10 —
Malawi 120 3.09 114
Zimbabwe 121 3.07 110
Mali 122 3.04 115
Ethiopia 123 3.00 116
Mozambique 124 2.97 112
Chad 126 2.64 117
Burundi 127 2.62 —
Angola 128 2.50 —
*Out of 128 economies; ** Out of 117 economies
Note: All averages are weighted by population.
9
1.1
: A
sse
ssin
g A
fric
a’s
Co
mp
eti
tive
ne
ss i
n a
Glo
ba
l C
on
text
Country/Region Rank Score Rank Score Rank Score Rank Score
NORTH AFRICA
Algeria 76 3.98 44 4.91 92 3.30 92 3.22
Egypt 65 4.09 64 4.55 75 3.63 65 3.63
Libya 73 4.00 45 4.87 95 3.25 97 3.16
Morocco 72 4.02 70 4.45 77 3.60 73 3.54
Tunisia 29 4.72 33 5.27 40 4.34 28 4.42
North Africa average 4.09 4.67 3.58 3.56
SUB-SAHARAN AFRICA
Angola 128 2.50 128 2.48 126 2.51 126 2.52
Benin 107 3.41 106 3.74 107 3.04 90 3.23
Botswana 83 3.83 82 4.30 80 3.54 98 3.15
Burkina Faso 119 3.10 124 3.17 112 2.96 86 3.27
Burundi 127 2.62 127 2.73 127 2.46 121 2.66
Cameroon 111 3.32 108 3.71 117 2.91 104 3.05
Chad 126 2.64 126 2.90 128 2.35 125 2.53
Ethiopia 123 3.00 118 3.31 123 2.69 119 2.72
Gambia 104 3.45 105 3.84 103 3.11 115 2.89
Kenya 97 3.61 109 3.70 83 3.47 59 3.73
Lesotho 115 3.24 107 3.72 122 2.81 123 2.59
Madagascar 113 3.29 114 3.60 116 2.92 91 3.23
Malawi 120 3.09 119 3.30 119 2.87 112 2.93
Mali 122 3.04 123 3.19 121 2.83 96 3.17
Mauritania 118 3.18 117 3.41 113 2.94 108 2.98
Mauritius 58 4.22 50 4.74 62 3.88 47 3.84
Mozambique 124 2.97 122 3.25 124 2.63 118 2.86
Namibia 88 3.76 72 4.44 93 3.29 88 3.25
Nigeria 102 3.49 113 3.60 90 3.33 69 3.60
South Africa 46 4.42 57 4.66 45 4.24 29 4.35
Tanzania 108 3.40 115 3.56 96 3.17 77 3.49
Uganda 116 3.21 121 3.27 100 3.12 83 3.30
Zambia 117 3.21 116 3.52 109 3.01 127 2.43
Zimbabwe 121 3.07 125 3.09 108 3.03 94 3.18
Sub-Saharan Africa average 3.29 3.55 3.05 3.12
BRICs
Brazil 67 4.08 88 4.23 58 3.96 38 4.09
China 55 4.25 47 4.82 72 3.66 57 3.75
India 42 4.47 63 4.56 41 4.33 26 4.60
Russian Federation 61 4.13 68 4.49 59 3.96 72 3.55
Latin America and Caribbean average 4.07 4.41 3.83 3.75
Southeast Asia average 4.25 4.53 4.01 3.90
Note: All averages are weighted by population.
OVERALL INDEX Basic requirements
SUBINDEXES
Efficiency enhancers Innovation factors
Table 4: The Global Competitiveness Index 2007: Africa and comparators
Although North Africa has made relative progress
in some basic areas of competitiveness, much remains to
be achieved in Africa as a whole in order to achieve
higher rates of growth, create jobs, and boost income.
Of course, the aggregate analysis of this section
masks a great deal of the diversity among individual
country performances within the region in the various
pillars.Table 8 shows the rankings of African countries
in the nine pillars of the Index, highlighting the three
best performers in each case.The table shows that
Tunisia is one of the top three performers in all of the
pillars, while South Africa is one of the top performers
in six of them and Mauritius in five, mirroring these
countries’ positions at the top of the overall rankings.
The table also reveals notable comparative strengths in
several other African countries in specific areas.
Tunisia, South Africa, and Botswana have strong
institutional environments (ranked 26th, 31st, and 38th,
respectively), on a par with countries such as Chile,
Estonia, and Spain.These countries have common
strengths such as independent judiciaries, efficient gov-
ernment spending, and relatively low levels of corruption,
leading to public trust in politicians. Private institutions
are also positively assessed, including corporate ethics
and aspects of corporate governance. Other countries in
the top half of the rankings are Mauritius (43rd),
Namibia (49th), Egypt (50th), Zambia (56th), and
Gambia (57th), with rankings similar to countries such
10
1.1
: A
sse
ssin
g A
fric
a’s
Co
mp
eti
tive
ne
ss i
n a
Glo
ba
l C
on
text
Table 5: The Global Competitiveness Index 2007: Basic requirements
Country/Region Rank Score Rank Score Rank Score Rank Score Rank Score
NORTH AFRICA
Algeria 44 4.91 65 3.95 80 2.93 2 6.19 46 6.56
Egypt 64 4.55 50 4.21 56 3.74 111 3.75 51 6.51
Libya 45 4.87 75 3.81 100 2.46 1 6.95 81 6.26
Morocco 70 4.45 68 3.89 61 3.58 81 4.24 89 6.07
Tunisia 33 5.27 26 5.06 37 4.42 39 4.91 33 6.69
North Africa average 4.67 4.13 3.53 4.57 6.44
SUB-SAHARAN AFRICA
Angola 128 2.48 123 3.02 116 2.07 126 2.40 128 2.45
Benin 106 3.74 87 3.57 117 2.06 95 4.04 104 5.29
Botswana 82 4.30 38 4.53 67 3.38 41 4.85 115 4.42
Burkina Faso 124 3.17 67 3.92 113 2.15 119 3.37 127 3.24
Burundi 127 2.73 115 3.20 126 1.71 125 2.51 123 3.50
Cameroon 108 3.71 120 3.11 124 1.93 42 4.83 107 4.96
Chad 126 2.90 128 2.66 128 1.43 110 3.76 122 3.74
Ethiopia 118 3.31 91 3.55 105 2.34 98 3.98 124 3.39
Gambia 105 3.84 57 4.11 97 2.62 108 3.77 110 4.85
Kenya 109 3.70 92 3.55 89 2.75 102 3.91 113 4.59
Lesotho 107 3.72 89 3.56 121 2.00 54 4.64 112 4.69
Madagascar 114 3.60 98 3.43 119 2.03 118 3.39 103 5.53
Malawi 119 3.30 66 3.94 118 2.06 127 2.31 109 4.89
Mali 123 3.19 71 3.84 115 2.09 116 3.48 125 3.34
Mauritania 117 3.41 72 3.83 114 2.10 123 2.82 108 4.91
Mauritius 50 4.74 43 4.40 42 4.21 107 3.79 44 6.58
Mozambique 122 3.25 112 3.25 102 2.41 115 3.50 120 3.85
Namibia 72 4.44 49 4.23 45 4.16 45 4.79 114 4.58
Nigeria 113 3.60 93 3.53 108 2.26 57 4.62 119 3.98
South Africa 57 4.66 31 4.79 50 4.04 48 4.74 106 5.07
Tanzania 115 3.56 64 3.95 96 2.65 103 3.88 121 3.76
Uganda 121 3.27 103 3.38 122 1.99 69 4.42 126 3.29
Zambia 116 3.52 56 4.11 90 2.75 122 3.07 118 4.17
Zimbabwe 125 3.09 101 3.39 101 2.44 128 2.20 116 4.32
Sub-Saharan Africa average 3.55 3.65 2.45 4.00 4.04
BRICs
Brazil 88 4.23 85 3.63 72 3.32 117 3.42 48 6.54
China 47 4.82 96 3.51 60 3.62 8 5.72 56 6.44
India 63 4.56 33 4.71 63 3.51 91 4.12 96 5.90
Russian Federation 68 4.49 119 3.16 62 3.57 35 4.95 78 6.29
Latin America and Caribbean average 4.41 3.69 3.25 4.20 6.51
Southeast Asia average 4.53 4.08 3.12 4.61 6.30
Note: All averages are weighted by population.
Basic requirements 1. Institutions 3. Macroeconomy2. Infrastructure4. Health and
primary education
as Costa Rica, Hungary, and Korea. Representing both
North and sub-Saharan Africa, with relatively strong
institutions by international standards, these countries
provide examples for other countries in the region
wishing to improve their institutional environments.
This is particularly important given that, among the 29
countries shown in the table, 13 are in the bottom third
of all countries covered, pointing to the regional
improvements needed in this area.
With regard to infrastructure,Tunisia, Mauritius, and
Namibia are the three best-performing countries, ranked
37th, 42nd, and 45th, respectively—they are better
assessed than some European countries, including Italy
and Poland. Particularly high ranked are the quality of
their ports, the quality of railroads (in Tunisia and
Namibia), and the electricity supply (particularly in
Tunisia and Mauritius).The main weakness in all three
countries is the low telephone line penetration rate (a
weakness of decreasing importance given the rapid rise
of mobile phone penetration).Yet, despite these few rel-
atively strong cases, the only other countries assessed
within the top half of all 128 countries are South Africa,
Egypt, and Morocco (ranked 50th, 56th, and 61st).All
other countries are ranked 80th or lower, with more
than half of the countries ranked below 100th place.
This emphasizes the importance of upgrading infra-
structure on the continent to improve competitiveness.
Country/Region Rank Score Rank Score Rank Score Rank Score
NORTH AFRICA
Algeria 92 3.30 86 3.46 97 3.67 93 2.75
Egypt 75 3.63 77 3.73 66 4.15 80 3.01
Libya 95 3.25 73 3.88 121 3.39 115 2.48
Morocco 77 3.60 87 3.45 75 4.07 70 3.27
Tunisia 40 4.34 36 4.72 36 4.65 47 3.65
North Africa average 3.58 3.69 4.03 3.03
SUB-SAHARAN AFRICA
Angola 126 2.51 128 1.92 123 3.37 124 2.25
Benin 107 3.04 104 2.96 96 3.68 114 2.48
Botswana 80 3.54 89 3.41 61 4.20 81 3.00
Burkina Faso 112 2.96 119 2.51 89 3.81 106 2.57
Burundi 127 2.46 126 2.16 126 3.28 128 1.96
Cameroon 117 2.91 106 2.85 117 3.45 116 2.43
Chad 128 2.35 127 1.99 127 3.07 127 1.99
Ethiopia 123 2.69 123 2.39 119 3.41 123 2.26
Gambia 103 3.11 109 2.81 88 3.82 94 2.70
Kenya 83 3.47 90 3.41 73 4.10 83 2.91
Lesotho 122 2.81 118 2.52 120 3.41 112 2.50
Madagascar 116 2.92 116 2.55 100 3.63 103 2.59
Malawi 119 2.87 122 2.46 91 3.77 121 2.38
Mali 121 2.83 121 2.48 104 3.62 119 2.40
Mauritania 113 2.94 124 2.33 103 3.62 85 2.88
Mauritius 62 3.88 69 3.94 70 4.11 54 3.58
Mozambique 124 2.63 125 2.30 125 3.32 122 2.28
Namibia 93 3.29 108 2.82 80 4.00 79 3.04
Nigeria 90 3.33 103 3.04 71 4.10 90 2.85
South Africa 45 4.24 56 4.17 34 4.68 44 3.87
Tanzania 96 3.17 115 2.56 76 4.07 87 2.87
Uganda 100 3.12 110 2.78 85 3.90 97 2.68
Zambia 109 3.01 120 2.48 86 3.87 96 2.68
Zimbabwe 108 3.03 99 3.10 115 3.48 110 2.51
Sub-Saharan Africa average 3.05 2.84 3.86 2.71
BRICs
Brazil 58 3.96 61 4.10 59 4.21 53 3.58
China 72 3.66 79 3.68 55 4.23 78 3.08
India 41 4.33 49 4.35 20 5.09 56 3.56
Russian Federation 59 3.96 43 4.44 60 4.20 72 3.25
Latin America and Caribbean average 3.83 3.92 4.13 3.42
Southeast Asia average 4.01 4.09 4.64 3.30
Note: All averages are weighted by population.
Efficiency enhancers 6. Market efficiency 7. Technological readiness5. Higher education and training
Table 6: The Global Competitiveness Index 2007: Efficiency enhancers
The macroeconomic environment presents an
interesting case, as Africa is home to both the strongest
and weakest performances in this area.Table 8 shows
that the two best-rated countries out of all countries in
the region are Libya and Algeria—two countries that
have benefited from windfall oil revenues that have sig-
nificantly improved their public finances.These coun-
tries have high government budget surpluses, manage-
able debt, high national savings rates, and at the same
time they have managed to keep inflation rates low.The
third highest ranked country is Tunisia (39th), an oil
importer, which has also managed to tame inflation and
has reasonably balanced public finances.A number of
other countries have satisfactory assessments in this area,
such as Botswana (41st), Cameroon (42nd), Namibia
(45th), and South Africa (48th), all ranked among the
top 50 countries. On the other hand, the macroeco-
nomic environment of most countries is assessed as very
weak, with 18 of the 29 African countries ranked
among the bottom third. In particular we see that
Zambia, Mauritania, Burundi,Angola, Malawi, and
Zimbabwe round out the bottom of all countries
assessed, joined only by Guyana from outside the region
(124th). Box 1 looks at recent macroeconomic trends in
Africa.Although much clearly remains to be done to
foster a more stable economic environment in many
countries of the region, the box describes how the over-
all picture has been improving in recent years.
11
1.1
: A
sse
ssin
g A
fric
a’s
Co
mp
eti
tive
ne
ss i
n a
Glo
ba
l C
on
text
12
1.1
: A
sse
ssin
g A
fric
a’s
Co
mp
eti
tive
ne
ss i
n a
Glo
ba
l C
on
text
Country/Region Rank Score Rank Score Rank Score
NORTH AFRICA
Algeria 92 3.22 106 3.36 77 3.09
Egypt 65 3.63 57 4.22 83 3.04
Libya 97 3.16 88 3.57 98 2.75
Morocco 73 3.54 80 3.82 61 3.26
Tunisia 28 4.42 31 4.80 27 4.05
North Africa average 3.56 3.97 3.15
SUB-SAHARAN AFRICA
Angola 126 2.52 126 2.74 124 2.30
Benin 90 3.23 87 3.58 91 2.87
Botswana 98 3.15 98 3.43 92 2.87
Burkina Faso 86 3.27 101 3.40 70 3.14
Burundi 121 2.66 120 3.01 122 2.32
Cameroon 104 3.05 104 3.37 100 2.73
Chad 125 2.53 124 2.81 125 2.26
Ethiopia 119 2.72 123 2.94 117 2.50
Gambia 115 2.89 109 3.30 118 2.48
Kenya 59 3.73 68 4.04 48 3.42
Lesotho 123 2.59 125 2.80 120 2.37
Madagascar 91 3.23 102 3.39 78 3.07
Malawi 112 2.93 116 3.16 106 2.70
Mali 96 3.17 110 3.29 81 3.04
Mauritania 108 2.98 105 3.36 111 2.60
Mauritius 47 3.84 44 4.44 65 3.23
Mozambique 118 2.86 117 3.13 113 2.58
Namibia 88 3.25 85 3.60 89 2.91
Nigeria 69 3.60 75 3.87 52 3.33
South Africa 29 4.35 32 4.79 29 3.92
Tanzania 77 3.49 83 3.68 56 3.30
Uganda 83 3.30 93 3.49 73 3.11
Zambia 127 2.43 128 2.51 121 2.35
Zimbabwe 94 3.18 92 3.50 94 2.86
Sub-Saharan Africa average 3.12 3.57 3.05
BRICs
Brazil 38 4.09 38 4.61 38 3.56
China 57 3.75 65 4.05 46 3.44
India 26 4.60 25 5.06 26 4.14
Russian Federation 72 3.55 79 3.83 59 3.28
Latin America/Caribbean average 3.75 4.26 3.25
Southeast Asia average 3.90 4.33 3.48
Note: All averages are weighted by population.
Innovation factors 9. Innovation8. Business sophistication
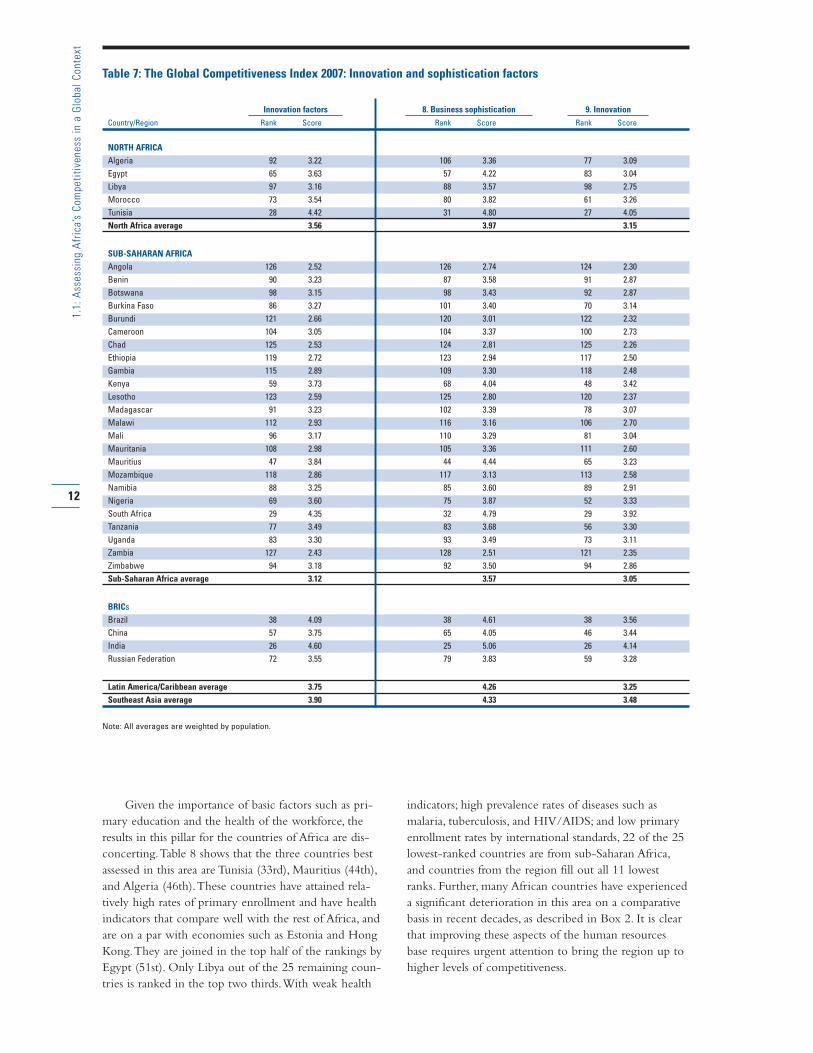
Table 7: The Global Competitiveness Index 2007: Innovation and sophistication factors
Given the importance of basic factors such as pri-
mary education and the health of the workforce, the
results in this pillar for the countries of Africa are dis-
concerting.Table 8 shows that the three countries best
assessed in this area are Tunisia (33rd), Mauritius (44th),
and Algeria (46th).These countries have attained rela-
tively high rates of primary enrollment and have health
indicators that compare well with the rest of Africa, and
are on a par with economies such as Estonia and Hong
Kong.They are joined in the top half of the rankings by
Egypt (51st). Only Libya out of the 25 remaining coun-
tries is ranked in the top two thirds.With weak health
indicators; high prevalence rates of diseases such as
malaria, tuberculosis, and HIV/AIDS; and low primary
enrollment rates by international standards, 22 of the 25
lowest-ranked countries are from sub-Saharan Africa,
and countries from the region fill out all 11 lowest
ranks. Further, many African countries have experienced
a significant deterioration in this area on a comparative
basis in recent decades, as described in Box 2. It is clear
that improving these aspects of the human resources
base requires urgent attention to bring the region up to
higher levels of competitiveness.
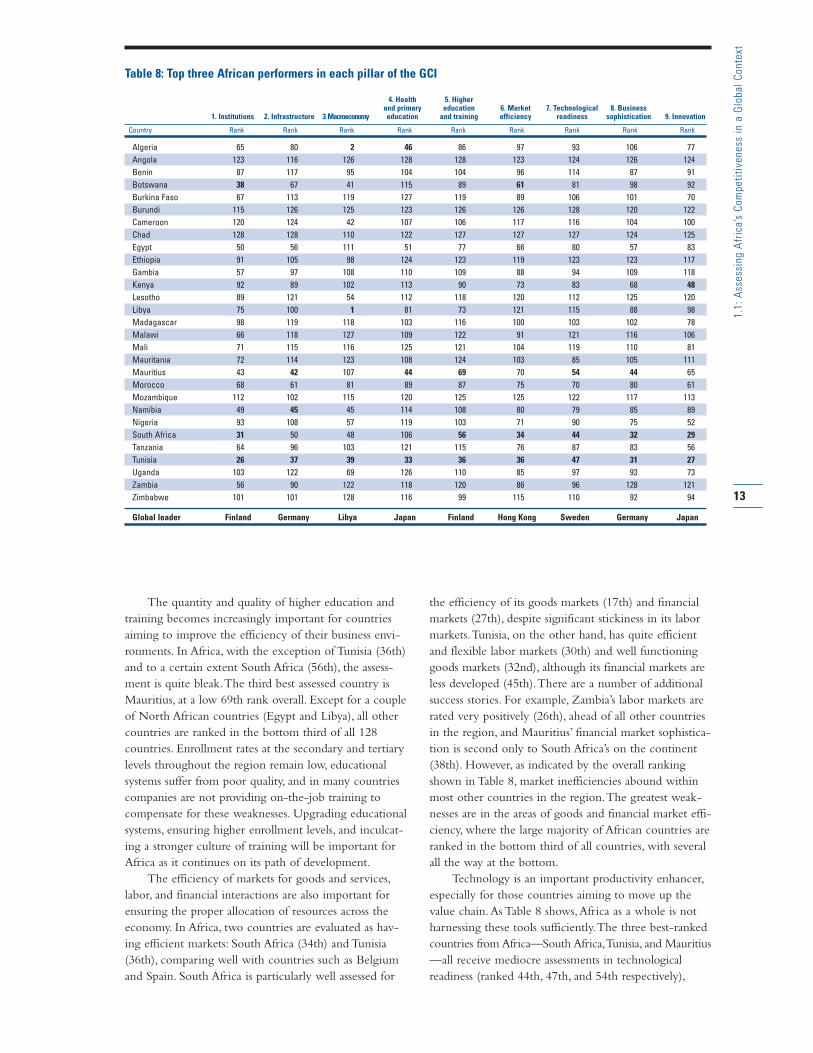
Table 8: Top three African performers in each pillar of the GCI
Country Rank Rank Rank Rank Rank Rank Rank Rank Rank
Algeria 65 80 2 46 86 97 93 106 77
Angola 123 116 126 128 128 123 124 126 124
Benin 87 117 95 104 104 96 114 87 91
Botswana 38 67 41 115 89 61 81 98 92
Burkina Faso 67 113 119 127 119 89 106 101 70
Burundi 115 126 125 123 126 126 128 120 122
Cameroon 120 124 42 107 106 117 116 104 100
Chad 128 128 110 122 127 127 127 124 125
Egypt 50 56 111 51 77 66 80 57 83
Ethiopia 91 105 98 124 123 119 123 123 117
Gambia 57 97 108 110 109 88 94 109 118
Kenya 92 89 102 113 90 73 83 68 48
Lesotho 89 121 54 112 118 120 112 125 120
Libya 75 100 1 81 73 121 115 88 98
Madagascar 98 119 118 103 116 100 103 102 78
Malawi 66 118 127 109 122 91 121 116 106
Mali 71 115 116 125 121 104 119 110 81
Mauritania 72 114 123 108 124 103 85 105 111
Mauritius 43 42 107 44 69 70 54 44 65
Morocco 68 61 81 89 87 75 70 80 61
Mozambique 112 102 115 120 125 125 122 117 113
Namibia 49 45 45 114 108 80 79 85 89
Nigeria 93 108 57 119 103 71 90 75 52
South Africa 31 50 48 106 56 34 44 32 29
Tanzania 64 96 103 121 115 76 87 83 56
Tunisia 26 37 39 33 36 36 47 31 27
Uganda 103 122 69 126 110 85 97 93 73
Zambia 56 90 122 118 120 86 96 128 121
Zimbabwe 101 101 128 116 99 115 110 92 94
Global leader Finland Germany Libya Japan Finland Hong Kong Sweden Germany Japan
The quantity and quality of higher education and
training becomes increasingly important for countries
aiming to improve the efficiency of their business envi-
ronments. In Africa, with the exception of Tunisia (36th)
and to a certain extent South Africa (56th), the assess-
ment is quite bleak.The third best assessed country is
Mauritius, at a low 69th rank overall. Except for a couple
of North African countries (Egypt and Libya), all other
countries are ranked in the bottom third of all 128
countries. Enrollment rates at the secondary and tertiary
levels throughout the region remain low, educational
systems suffer from poor quality, and in many countries
companies are not providing on-the-job training to
compensate for these weaknesses. Upgrading educational
systems, ensuring higher enrollment levels, and inculcat-
ing a stronger culture of training will be important for
Africa as it continues on its path of development.
The efficiency of markets for goods and services,
labor, and financial interactions are also important for
ensuring the proper allocation of resources across the
economy. In Africa, two countries are evaluated as hav-
ing efficient markets: South Africa (34th) and Tunisia
(36th), comparing well with countries such as Belgium
and Spain. South Africa is particularly well assessed for
the efficiency of its goods markets (17th) and financial
markets (27th), despite significant stickiness in its labor
markets.Tunisia, on the other hand, has quite efficient
and flexible labor markets (30th) and well functioning
goods markets (32nd), although its financial markets are
less developed (45th).There are a number of additional
success stories. For example, Zambia’s labor markets are
rated very positively (26th), ahead of all other countries
in the region, and Mauritius’ financial market sophistica-
tion is second only to South Africa’s on the continent
(38th). However, as indicated by the overall ranking
shown in Table 8, market inefficiencies abound within
most other countries in the region.The greatest weak-
nesses are in the areas of goods and financial market effi-
ciency, where the large majority of African countries are
ranked in the bottom third of all countries, with several
all the way at the bottom.
Technology is an important productivity enhancer,
especially for those countries aiming to move up the
value chain.As Table 8 shows,Africa as a whole is not
harnessing these tools sufficiently.The three best-ranked
countries from Africa—South Africa,Tunisia, and Mauritius
—all receive mediocre assessments in technological
readiness (ranked 44th, 47th, and 54th respectively),
1. Institutions 2. Infrastructure 3. Macroeconomy
4. Health and primary education
5. Higher education
and training6. Market efficiency
7. Technological readiness
8. Business sophistication 9. Innovation
13
1.1
: A
sse
ssin
g A
fric
a’s
Co
mp
eti
tive
ne
ss i
n a
Glo
ba
l C
on
text
The competitiveness of African countries
As mentioned above, Tunisia is the top-ranked country
in Africa, ranked 29th overall, a full 17 places ahead of
the second-ranked country on the continent, South
Africa (46th), and higher than all other comparators in
the tables.Tunisia displays comparative strengths across
many of the areas measured by the GCI.To begin, the
country has public institutions that are assessed as effi-
cient, with low levels of corruption (19th) rather well
protected property rights (36th), and an independent
judiciary (34th) as well as a strong security environment
in the country (20th). In terms of private institutions,
corporate ethics also get quite high marks (29th), on a
par with countries such as Spain and Portugal.
Tunisia also has a healthy workforce and provides
excellent access to primary schooling, particularly by
regional standards, with the educational system also get-
ting good marks. Goods markets in the country are
characterized by relatively few distortions, with little
time required to start a business (12th), and taxation that
is not perceived as distortionary (19th), although com-
petition is not as intense as in some other countries
(43rd). Labor markets are quite flexible and efficient
with relative ease for companies in hiring and firing in
the country (32nd), quite strong cooperation in labor-
employer relations (29th), and one of the best assessments
of the participation of women in the workforce (5th).
Given that Tunisia is presently in transition between
stages 1 and 2, all of these strengths, measured in the
basic requirements and efficiency enhancers subindexes,
support the country’s strong competitiveness.
Although innovation and business sophistication are
not yet considered to be fundamental for Tunisia’s com-
petitiveness, the country also demonstrates some strength
in this area. For example,Tunisian firms tend to produce
products relatively high on the value chain rather than
basic products (29th), and intellectual property is quite
well protected (31st). However, actual patenting remains
quite low (70th), suggesting that there is perhaps
untapped innovative potential in the economy.
With regard to competitive weaknesses, although
infrastructure as a whole receives a reasonable assessment
(37th), there are some areas of concern, most particularly
telephone lines (80th).The macroeconomic environment
is characterized by deficit spending (-2.8 percent of
GDP in 2005) that has led to a substantial buildup of
national debt.The national savings rate also remains low,
placing the country 50th on this indicator.
With regard to education, although as mentioned
above primary enrollment is positively assessed, secondary
and tertiary enrollment rates place the country 74th and
61st, respectively. Financial markets are also ranked only
as average, particularly for their level of sophistication
(60th), local equity market access (70th), and the per-
ceived soundness of banks (66th).
Finally,Tunisia could be harnessing new technologies
more effectively for productivity improvements—it is
ranked 47th in the area of technological readiness. In
particular, laws relating to ICTs are not seen as support-
ing their proliferation, and in fact, penetration rates of
new communication tools (mobile phones, Internet
users, personal computers) remain low by international
standards.
South Africa, ranked 46th overall, is the second
highest ranked country in Africa. It remains the top
performer in sub-Saharan Africa, ranking higher than all
other comparators in Table 3 except for Tunisia and
India. South Africa is sub-Saharan Africa’s economic
giant, accounting for a third of its GDP despite
accounting for only 6 percent of its population.10 Its
strong performance in the Index reflects this. Relative to
its overall rank, the country does particularly well in a
number of areas typically reserved for rich, innovation-
driven economies. Its economic sophistication is reflected
in high ranks for property rights (23rd), corporate ethics
(30th), and goods (19th), as well as financial market
efficiency (27th), business sophistication (32nd), and
innovation (29th). South Africa’s scientific research insti-
tutions are assessed as on a par with Hong Kong’s, and
the country has a higher rate of patenting than a number
of European countries, including Greece, Portugal, and
Russia.These combined strengths explain South Africa’s
position at the top of the regional ranking.
However, South Africa does face a number of
obstacles to competitiveness. For example, the country
ranks 126th in labor market flexibility, encompassing
hiring and firing practices, flexibility of wage determi-
nation, and union-employer relations. Flexibility of wage
determination in South Africa is also constrained by the
short supply of skilled labor.This year’s ranking for
higher education and training shows a drop to 57th
place from 47th last year.Tertiary enrollment of 15 per-
cent places the country 88th overall.Therefore, the
implementation of education and training programs that
deliver the skills necessary for a modern economy are a
key ingredient to boosting economic performance.
Infrastructure represents another challenge. South
Africa experienced a drop in ranking for this pillar, from
last year’s 35th place to 50th place this year, with partic-
ular concerns about the quality of the electricity supply
that has been increasingly plagued by interruptions
(73rd) and the low penetration rate of telephone lines
(85th).The government is aware of these challenges and
there are a number of efforts underway to address them,
with investments planned in the areas of utilities and
infrastructure.
Finally, lack of security remains an obstacle to doing
business in South Africa.The business costs of crime and
violence (116th) and the unreliability of police services
to protect from crime (92nd) are highlighted as particu-
lar concerns.These are areas that need to be tackled in
order to improve the country’s competitiveness outlook.
Mauritius is the third most competitive economy
in Africa, ranked 58th overall.The country is character-
20
1.1
: A
sse
ssin
g A
fric
a’s
Co
mp
eti
tive
ne
ss i
n a
Glo
ba
l C
on
text
ized by strong public institutions, with well-protected
property rights (29th), reasonable levels of judicial inde-
pendence (43rd), and a security situation that is very
good by regional standards (40th). Private institutions
are rated as accountable, with strong auditing and
accounting standards (34th) and corporate boards (37th),
assessed similar to countries such as Japan, for example.
The country’s infrastructure is quite well developed,
especially for the region. In particular air transport
(38th), ports (33rd), and the electricity supply (37th) are
of good quality, and the country has relatively abundant
telephone lines (43rd). Financial markets in Mauritius
are also highly developed (38th) with relatively abundant
capital for business development through a variety of
channels such as bank loans (36th) from a sound banking
system (38th), as well as by issuing shares on the stock
market (36th).
Mauritius also has comparative strengths with regard
to business sophistication (ranked 44th overall in this
pillar), an area that will become increasingly important
for the economy as it moves into the next, innovation-
driven stage of development.This includes some control
over the international distribution of its products (43rd)
and producing products already quite high on the value
chain (28th).
On the other hand, Mauritius faces some weaknesses
in its macroeconomic environment, with a government
budget deficit that places the country 110th out of 128,
relatively high inflation, and high interest rates.
With regard to human resources, there are low sec-
ondary and tertiary enrollment rates (placing Mauritius
64th and 83rd, respectively), and the educational system
does not get particularly good marks for quality (66th).
On a positive note, however, firms provide significant
on-the-job training to make up for this shortcoming
(34th). Beyond the educational weaknesses, labor markets
are extremely sticky and inefficient, with stringent hiring
and firing laws (118th), wages that are not flexibly
determined (122nd), and little relation between produc-
tivity and pay. Further, there are some health concerns
with regard to the workforce—particularly the high
incidence of tuberculosis—which places the country
82nd overall.
Egypt is the second-ranked country in North
Africa, at 65th place. Egypt’s main strengths can be
found in aspects of market efficiency.With regard to
goods market efficiency, the country benefits from low
taxation, little time required to start a business, and the
country’s large market size, which allows for economies
of scale. Egyptian businesses also have access to a rela-
tively large number of local suppliers (35th) and maintain
control over the international distribution of products
produced in the economy (31st).
There are also some strengths in aspects of the
country’s labor markets, such as flexibility in wage
determination (7th), a rather close relationship between
pay and productivity (31st), and reasonable private-sector
employment of women (38th). However, the labor market
is clearly fraught with some challenges, such as stringent
hiring and firing laws (100th) and a lack of cooperation
in relations between labor and employers (78th).
With regard to other weaknesses, Egypt’s drop of 12
places is attributable in large part to an extremely sharp
decline of 61 places in the macroeconomy pillar, as it
struggled with deteriorating government finances (the
government deficit amounted to 10.5 percent of GDP
in 2005, the second-highest deficit of all countries cov-
ered) leading the country to build up debt of over 100
percent of GDP by that year. Inflation has also remained
quite high in the country (11.4 percent in 2005), at a
time when inflation is generally low around the world,
thus placing it 112th.
Higher education and training is another area of
weakness, with enrollment rates at all levels that could
be improved, an educational system that gets poor marks
for quality (106th), and a lack of on-the-job training in
the country (84th).This is no doubt related to the lack
of technological readiness in the country (80th), with
low penetration rates of ICTs such as mobile phones
(94th). Innovation in the country also gets quite poor
marks (83rd), although this should be of secondary con-
cern given its stage of development, since it can still
benefit greatly from getting more of the basics right.
Morocco, ranked 72nd, moved up by four places
this year.The assessment of the country’s public institu-
tions has improved, especially in the area of security
(47th).There have also been some improvements in the
quality of the country’s infrastructure, although more
must be done to bring it up to world standards.
The results also show that Morocco has made
progress in improving technological readiness (see
Chapter 1.5), with big gains in firm-level technology
absorption and in technology transfer through FDI.The
country has seen an increase in Internet users and
improved innovation since the last competitiveness
assessment, in particular through stronger university-
industry research collaboration and better protection of
intellectual property rights.
Despite the overall positive trend, a number of
obstacles remain.Although public institutions have
improved, private institutions receive poor marks in
areas including corporate ethics (96th), the strength of
auditing and accounting standards (88th), and the effica-
cy of corporate boards in the country (102nd).
Further, despite some improvements, health
indicators remain worrisome, including infant mortality
(placing the country 91st) and tuberculosis incidence
(76th). Further, enrollment rates across all education
levels (primary, secondary, and tertiary) remain very low.
The human resources base is thus in need of an upgrad-
ing across a number of fronts.
There are also some weaknesses with regard to how
the country’s markets allocate resources. In particular,
Morocco’s goods markets are characterized by a lack of
21
1.1
: A
sse
ssin
g A
fric
a’s
Co
mp
eti
tive
ne
ss i
n a
Glo
ba
l C
on
text
local competition (71st) and a prevalence of trade barri-
ers (93rd), although setting up a business seems relatively
straightforward (with few procedures and little time
required for starting a new business in the country).
Libya is included in the Index for the first time in
this Report, and is ranked 73rd overall. Libya’s strengths
can be found in two areas: its security environment and
macroeconomic stability in the country.With regard to
security, Libya is characterized by low business costs of
terrorism (19th), low crime and violence more generally
(25th), and extremely low levels of organized crime
(10th).
In terms of its macroeconomic climate, Libya comes
in at an impressive first out of all the 128 countries in
this pillar, due to windfall income from high oil prices
in recent years. In 2005 the country had the second-
highest government surplus in the world (just behind
Kuwait), a negligible government debt ratio of just
above 1 percent, low interest rates, and low inflation.
Beyond these two areas of strength, Libya faces a
number of obstacles to its competitiveness throughout
the other pillars measured by the Index. Most notably
the country’s infrastructure requires upgrading (100th),
primary education enrollment is low (89th), and the
educational system receives extremely poor marks for
quality (123rd). Markets overall are not assessed as effi-
cient (121st), particularly financial markets (120th) and
labor markets (117th). Finally, the country is not har-
nessing new technologies for productivity improvements
(ranked 115th in technological readiness), with little
technology entering the country through FDI and low
uptake of ICTs.
Algeria is the lowest-ranked country in North
Africa, ranked 76th overall. Despite its trailing perform-
ance in the region, it is experiencing an encouraging
trend. Since last year’s assessment, the country has
moved up six places as a result of a better assessment of
the quality of its public institutions and continuing
improvements in its macroeconomic environment.With
regard to public institutions, there have been measurable
improvements in perceptions of government efficiency
(now ranked 46th) and evenhandedness of public offi-
cials in their dealings with the public (25th).
Algeria’s economy is also characterized by a strong
macroeconomic environment (where it is ranked 2nd,
just behind Libya) with its increasing revenues from oil
and gas sales boosting its performance relative to the
government budget balance and debt, while still manag-
ing to bring inflation down to very low levels.
However,Algeria continues to face a number of
obstacles to its competitiveness: for example, in the area
of market efficiency (97th) as well as technological
readiness (93rd), both of which are very important for
productivity improvements given its stage of develop-
ment. Furthermore, its low rank of 118 for the per-
ceived business costs of terrorism suggests that security
is still considered to be a major problem affecting the
business environment, imposing heavy costs that are not
conducive to sustained productivity improvements and
economic growth.
Botswana has been relatively successful, ranking
83rd—the third best performance in sub-Saharan Africa,
after South Africa and Mauritius.The government has
succeeded in using its wealth from key natural resources
and diamonds to invest in factors setting it on a more
sustainable growth path.Among the country’s strengths
are its reliable and legitimate institutions, ranking a high
19th worldwide for the efficiency of government spend-
ing, 27th for public trust of politicians, and 25th for
judicial independence. Botswana is known to be one of
the countries with the lowest levels of corruption in
Africa. Corporate ethics also receive relatively high
marks, ranked 41st overall.
The transparency and accountability of public insti-
tutions have contributed to a stable macroeconomic
environment (41st), with a low government budget
deficit and one of the highest national savings rates in
the world (although inflation remains a bit high by
international standards).
Financial markets are also assessed as developed by
regional standards, with a sound banking sector (40th),
some access to financing through venture capital (45th),
and by issuing shares on the local equity market (59th).
With regard to weaknesses, attainment rates at all
levels of the educational ladder remain low by interna-
tional standards, and the quality of the educational system
receives rather poor marks—an area clearly requiring
attention.Yet it is clear that the biggest obstacle facing
Botswana in its efforts to improve its competitiveness is
the health situation in the country. Botswana has the
highest HIV prevalence rate of all countries covered, as
well as very high malaria and tuberculosis prevalence
rates, which has led to one of the lowest life expectancies
in the world (only 40 years in 2004). Improving the
health and education levels of the workforce are clearly
the main priorities for the government at this stage.
Namibia is ranked just behind Botswana, at 88th
overall. Namibia also demonstrates a number of clear
competitive strengths: for example, the quality of the
institutional environment within the country is ranked
49th. Property rights in Namibia are well protected
(32nd) and the judiciary is perceived as independent
from undue influence (28th).With regard to private
institutions, auditing and accounting standards are quite
strong (39th) and firms are viewed as demonstrating rel-
atively good ethical behavior (53rd).
The quality of the country’s infrastructure is also
good by regional standards. In particular, aspects of the
transport infrastructure such as the quality of railroads
(35th) and ports (30th) are highly rated, although tele-
phone lines remain scarce (94th).
Financial markets are also sophisticated by regional
standards (57th), with relatively easy access to loans
(45th), a relatively sound banking sector (44th), and
22
1.1
: A
sse
ssin
g A
fric
a’s
Co
mp
eti
tive
ne
ss i
n a
Glo
ba
l C
on
text
some venture capital available (50th), although raising
funds by issuing shares on the local stock market is
deemed difficult (89th).
With regard to weaknesses, as in Botswana, health
indicators are extremely worrisome, including infant
mortality (94th), life expectancy (54 years, placing the
country 108th), and high prevalence rates of malaria and
tuberculosis, and high prevalence of HIV. Further, edu-
cational attainment rates are extremely low, with pri-
mary, secondary, and tertiary enrollment rates placing
the country 106th, 98th, and 102nd, respectively.The
quality of the educational system is assessed as being
among the worst of all countries in the Index, ranked
122nd overall. On a positive note, companies are making
up for this weakness by providing some on-the-job
training to staff (65th).
Namibia’s labor markets are not very flexible or
efficient, with stringent hiring and firing practices
(96th), friction in labor-employer relations (105th), and
little relation between pay and productivity. On a posi-
tive note, the brain drain from the country (55th) does
not seem to be as severe as in many other countries in
the region. Goods markets suffer from a number of
distortions, such as a long time required for starting a
business (95 days, placing the country 113th) and high
agricultural policy costs (97th).
Finally, the country could do more to harness new
technologies to improve its productivity levels.
Companies are not considered sufficiently aggressive in
absorbing new technologies (92rd) and Namibia has low
penetration rates of new technologies such as mobile
phones and the Internet.
Kenya is ranked considerably lower at 97th, the last
sub-Saharan African country within the top 100. Kenya
is an interesting case because its strengths lie in those
areas normally reserved for countries at higher stages of
development. For example, Kenya’s innovative capacity is
ranked an impressive 48th, with good scientific research
institutions (31st), high company spending on research
and development (34th), relatively strong research col-
laboration between universities and industry (50th), and
some availability of scientists and engineers within the
country (57th). Further, in terms of innovative “output,”
after South Africa, Kenya has the highest rate of patent-
ing in all of Africa.
Supporting this innovative potential is an educa-
tional system that—although educating a relatively small
proportion of the population compared with most other
countries (primary, secondary, and tertiary enrollment
rates are ranked 108th, 102nd, and 107th, respectively)—
is rated highly for quality (37th) for those who are for-
tunate enough to attend schools.The economy is also
supported by financial markets that are sophisticated by
international standards, with relatively easy access to
loans (58th) and share issues on the local stock market
(43rd).
However, there are a number of basic weaknesses
that are eroding at Kenya’s overall competitive potential.
The country’s public institutions are assessed as highly
inefficient, plagued by undue influence (95th), general
government inefficiency and red tape (104th), and with
very high levels of corruption (115th). Similarly, corpo-
rate ethics are assessed as lacking among the country’s
firms (91st).The security situation Kenya is also extremely
worrisome, particularly in crime and violence (118th).
As well as the low enrollment rates, workers are
subject to a high incidence of illnesses, with weak health
indicators and a high prevalence of diseases—particularly
tuberculosis, which is the highest of all countries covered
and contributes to the low life expectancy of 51 years.
Beyond these fundamental institutional and human
resource weaknesses, more could also be done to free
up goods and labor markets and to harness new
technologies.
All of the other countries from sub-Saharan Africa
are ranked below 100.While there are of course some
nuances to their performances, all of these countries face
significant obstacles to improving their competitiveness
and productivity levels. Rather than discussing the
difficulties facing each of these economies, it is perhaps
more useful to mention some of the key competitive-
ness issues facing some of the larger economies in the
region.
Nigeria,Africa’s most populous country, is ranked
102nd. It is plagued by weak and deteriorating institu-
tions—including a serious security problem—poor
assessments for its infrastructure and basic health and
education, and a significant change for the worse in
macroeconomic management, all of which have
depressed the country’s rank down from 83rd in 2005.
More generally, weaknesses abound throughout all of
the areas measured by the GCI.The rankings show that,
despite the country’s windfall revenues from record-high
oil prices, the large majority of the population remains
without access to basic health care and education, and
the basis for sustainable growth is not being put into
place.
Tanzania and Uganda, two of the region’s larger
economies, have not managed to significantly improve
their competitiveness in recent years and are ranked
108th and 116th, respectively. Even relative to these low
overall rankings, they do particularly poorly on health
and primary education (121st and 126th, respectively)
and on higher education and training (115th and 110th,
respectively).Although they do better on some of the
innovation factors, their failure to make a significant
improvement in the basic requirements subindex is like-
ly to continue to dent their economic prospects.
Zimbabwe, a country that showed so much prom-
ise until just a few years ago, is ranked among the least
competitive economies included in the GCI, at 121st
overall.The institutional environment is ranked among
the worst of all countries, with a complete absence of
23
1.1
: A
sse
ssin
g A
fric
a’s
Co
mp
eti
tive
ne
ss i
n a
Glo
ba
l C
on
text
property rights (ranked a rock-bottom 128th), high levels
of corruption (122nd), and a lack of even-handedness of
the government in its dealings with the public (119th)
as well as basic government inefficiency (124th).After a
number of years of mismanagement of the public
finances and monetary policy, Zimbabwe has sunk to
the bottom of all countries covered with regard to
macroeconomic stability (ranked 128th), with large
deficit spending, a negative national savings rate, and
raging hyperinflation that is unparalleled anywhere else
in the world today. Zimbabwe’s weaknesses abound
across the other areas measured by the Index, with weak
health indicators, low educational enrollment rates, and
very inefficient markets (particularly goods and labor
markets). It is clear that for Zimbabwe to get back on
track, improved governance affecting all levels of the
economy will be necessary to restore confidence in the
economy and to rebuild what was once one of Africa’s
stars.
Conclusions
This chapter has explored the various factors and policies
driving the competitiveness and economic performance
of African countries, providing a framework for priori-
tizing areas requiring policy attention and enhanced
investment.The discussion has included an analysis of
Africa’s competitiveness from a global and regional per-
spective, providing a sense of country-level performances
compared with the overall group of 128 economies
included in the Global Competitiveness Index (GCI).
Specific comparisons have been made with relevant
developing countries and regions, including Latin
America, economies of developing Asia, and the four
emerging BRIC countries. By placing individual coun-
try performances into an international context in this
way it has been possible to highlight those areas requiring
urgent attention within African countries to increase
competitiveness and to better ensure sustained strong
economic performance going into the future.
On average, the analysis has shown that the com-
petitiveness of most countries in Africa continues to lag
behind the rest of the world and even behind other
developing regions across all areas measured by the GCI.
The results thus provide a sense of the magnitude of the
efforts required in order to raise competitiveness levels.
Although the specific priority areas vary from
country to country, there are some common areas of
concern. For North African countries, which are already
assessed as doing comparatively well in some of the
more basic areas measured by the GCI, the focus should
be on improving the factors measured in the pillars of
the efficiency enhancers subindex: most particularly,
technological readiness and improved market efficiency.
In sub-Saharan Africa, efforts are needed on all
fronts within most countries.This includes upgrading
infrastructure and improvements in the health and edu-
cation of the workforce, as well as tackling weaknesses
in the areas of market efficiency and technological
readiness. Indeed, as shown by the results of the GCI,
several of the big economies in the region are receiving
high scores in the innovation and business sophistication
pillars relative to their overall ranking, while neglecting
more basic requirements that would help them migrate
into a higher stage of development and achieve more
sustainable growth.
Although much remains to be achieved, the fact
that there are a number of strong performers on the
continent in specific areas provides reason for optimism.
An analysis of the highest-ranked countries in Africa
across the various pillars of national competitiveness has
shown that that there are strong individual country per-
formances throughout the continent in areas as diverse
as institutional quality, macroeconomic stability, business
sophistication, and innovation.These countries can serve
as benchmarks for other economies in the region, as
points of reference in their efforts to improve their
competitiveness.
The relatively positive economic outlook across
much of Africa, coupled with the renewed focus and
increased attention from several institutions from within
the region and beyond, now provide a promising oppor-
tunity to make the institutional and structural changes
needed to put countries in the region on a more sus-
tainable growth path and to pave the way for a more
prosperous African future.
Notes1 IMF 2007.
2 NEPAD was set up in 2001 as a strategic framework to address “the
escalating poverty levels, underdevelopment and the continued
marginalisation of Africa” through improvements in the quality of
governance and leadership, infrastructure, and regional integra-
tion. Specifically, NEPAD aims to find African solutions to the con-
tinent’s economic woes, spearheaded by Africa’s leaders. Key for
improvements in Africa’s competitiveness is the potential of the
African Peer Review Mechanism (APRM), under which countries
voluntarily “open their books” to teams of African experts in vari-
ous spheres who assess and critique the countries’ political gov-
ernance, economic governance, corporate governance, and socio-
economic development. See NEPAD in Brief, available online at
http://www.nepad.org/2005/files/inbrief.php.
3 At Gleneagles, under the UK presidency, the G8 governments
(Canada, France, Germany, Italy, Japan, Russia, the United
Kingdom, and the United States) made clear commitments to
increase aid spending, ensure debt cancellation, and improve the
trading environment for developing countries, as well as increase
investments in education and health, among other things. Africa
will continue to remain high on the G8 agenda under the German
presidency, although the focus is likely to shift more toward
issues surrounding the investment climate and economic integra-
tion, as well as infrastructure and HIV/AIDS.
4 The GCI was developed by Xavier Sala-i-Martin and Elsa Artadi for
the World Economic Forum. For more details on the construction
of the GCI, see Chapter 1.1 in The Global Competitiveness Report
2006–2007.
5 In other words, these are the factors and policies supporting higher
levels of productivity and sustainable growth. Technically, the
index aims to measure the determinants of “A” in the production
function (or similarly, in classical growth equations).
24
1.1
: A
sse
ssin
g A
fric
a’s
Co
mp
eti
tive
ne
ss i
n a
Glo
ba
l C
on
text
6 Further information on the Executive Opinion Survey can be found in
Chapter 3.1 of The Global Competitiveness Report 2006–2007,
which is available from the World Economic Forum on request.
Please send requests to [email protected].
7 As explained by Sala-i-Martin and Artadi 2004, “The weights were
chosen using a maximum likelihood method of an econometric
model that had the growth rate of per capita GDP between 1960
and 2000 as the explanatory variable, and various proxies for basic
requirements, efficiency enhancers and innovation factors as inde-
pendent variables. The regression allowed countries in different
stages to have different coefficients. The coefficients that maxi-
mized likelihood, then, were ‘rounded’ and became the weights
for each stage.”
8 The factor-driven stage includes countries that have GDP per capita
below US$2,000. The efficiency-driven stage includes countries
with per capita income between US$2,000 and US$9,000. The
innovation-driven stage includes countries with GDP per capita
higher than US$17,000. Countries between the categories are
considered to be in transition, as discussed in the text.
9 All countries that export more than 50 percent of primary exports are
considered to be to some extent factor driven. The stage of
development for these countries is adjusted downward smoothly
depending on the exact primary export share. The higher the pri-
mary export share, the stronger the adjustment and the closer the
country will move to stage 1. For example, a country that exports
95 percent of primary products and that would be in stage 3
based on the income criteria will be in transition between stage 1
and 2. The income and primary exports criteria are weighted iden-
tically. Stages of development are dictated uniquely by income for
countries that export less than 50 percent primary products.
Countries that export only primary products would automatically
fall into the factor-driven stage (stage 1).
10 As measured by purchasing power parity (IMF 2006).
ReferencesAfrican Development Bank. 2006; Selected Statistics on African
Countries 2006 Volume XXV. Tunis: African Development Bank.
IMF (International Monetary Fund). Various years. Country Reports, vari-
ous countries. Washington, DC: International Monetary Fund.
———. 2006. Regional Economic Outlook: Sub-Saharan Africa,
(September 2006). Washington, DC: International Monetary Fund.
———. 2007. World Economic Outlook Database, (April 2007).
Washington, DC: International Monetary Fund.
Sala-i-Martin, X. and E. V. Artadi. 2004. “The Global Competitiveness
Index.” The Global Competitiveness Report 2004–2005.
Hampshire: Palgrave MacMillan. pp. 51–80.
World Bank. 2007. World Development Indicators Online.
World Economic Forum. 2006. The Global Competitiveness Report
2006–2007. Hampshire: Palgrave MacMillan.
25
1.1
: A
sse
ssin
g A
fric
a’s
Co
mp
eti
tive
ne
ss i
n a
Glo
ba
l C
on
text
CHAPTER 1.2
From Benchmarking to Impact:
Identifying Which Dimensions
Matter
REYES ATERIDO
MARY HALLWARD-DRIEMEIER
GIUSEPPE IAROSSI
at the World Bank
Chapter 1.1 has laid out a methodology for benchmark-
ing the competitiveness and business climate of African
countries. In setting priorities for reform, benchmarking
is an important place to begin—but it is not the last
step. Priorities should be set by an issue’s impact. Issues
with the greatest impact are often ones characterized by
the longest delays or highest regulatory costs, although
this is not necessarily always the case.What also matters
is how central the issue is to firm operations—to produc-
tivity and job creation—and what alternative coping
mechanisms are available to the firm. Linking investment
climate conditions to firm performance reinforces the
importance of finance, skills, infrastructure, and the rule
of law. However, such linking also underscores the idea
that that the impact of these conditions varies by who
you are and where you are.
The investment climate’s impact on job creation
and productivity is substantial. Costs and delays in
transportation, electricity, and crime alone can raise
overall costs by 20 to 30 percent, undermining whatever
advantage firms enjoyed by lower labor costs or greater
productive efficiency.1 In addition, weak property rights
and unpredictable enforcement of regulations weakens
incentive to invest and work hard. Improving the invest-
ment climate is recognized as one of the most important
ways to increase growth and expand opportunities—
particularly for poor people.2 In tackling the agenda
of economic growth, the challenge is to identify the
priorities for reform.
To be able to address this challenge better, the World
Bank’s program of Enterprise Surveys has interviewed
over 70,000 entrepreneurs and senior managers in 104
countries (see Appendix A for further information on
these surveys).The focus for this chapter are the 11,600
interviews in 34 countries in Africa.The Enterprise
Surveys program has four distinguishing features:
• First, the program can benchmark not only subjec-
tive rankings of investment constraints to business
performance (for example, the extent to which
electricity is rated as a problem), but also objective
measures of these constraints (for example, the
frequency and duration of outages, production lost
from outages, and the use and cost of generators).
• Second, it covers a wide range of issues—from
access to financial and infrastructure services, to
crime, corruption, and government regulations—
allowing a ranking of these issues.
29
1.2
: Fr
om
Be
nch
ma
rkin
g t
o I
mp
act
: Id
en
tify
ing
Wh
ich
Dim
en
sio
ns
Ma
tte
r
The views expressed here are those of the authors and do not neces-
sarily reflect the views of the Board of Executive Directors of the World
Bank or the governments they represent.
• Third, the data can also go beyond benchmarking
to test directly the impact of these objective
conditions on the actual performance of the firm,
for example, how the actual investment climate
conditions affect the productivity and employment
growth of respondents.
• Fourth, large, randomly selected samples of firms
allow for results to be compared across types
of firms, with particular attention paid here to
firm size.
For many of the countries in the region, the
Enterprise Surveys are the only source of detailed infor-
mation on firm performance and disaggregated objec-
tive indictors of a wide variety of business environment
indicators.
The next section demonstrates the range of pro-
ductivity and employment growth outcomes across the
region, including the results from Brazil, China, and
India, for comparison. It then moves to identify key
dimensions in the investment climate across countries in
the region that can help account for these patterns. First,
it examines the top constraints as reported by firms, links
them to objective measures of these constraints, and
looks at how these patterns vary across different group-
ings of countries. Second, it examines ways to prioritize
constraints from among obstacles in a longer list and to
identify which measures account for greater differences
across groups of countries.Third, it links the objective
measures of the investment climate directly to produc-
tivity and job creation across countries, illustrating the
potential gains from reform.While most of the chapter
analyzes the impact of the investment climate across
countries, the last section disaggregates the effects of the
various dimensions of the investment climate by types
of firm, focusing on firm size, ownership, and export
orientation.Access to finance, electricity, tax rates,
regulatory uncertainty, and corruption emerge as key
areas for reform—with specific priorities varying not
just across countries, but within countries too.
Firm performance across Africa
Growth rates in Africa have been rising in recent years
as greater macroeconomic stability has been achieved in
more countries and additional reforms have been under-
taken. But the key to maintaining growth is not simply
mobilizing more capital or labor.What is needed is
greater productivity—being able to produce more with
the same inputs.3 Productivity growth in Africa has been
lower than in other regions.The average productivity
growth from 1970 to 2000 was stagnant or even mildly
negative.4 Returns to investment have also been relatively
low. Investment rates are lower and the returns average
about half those of other developing countries.5 What is
encouraging is that the recent trends have been more
positive. Regional growth rates over the last five years
have been higher than in Latin America and the
Organisation of Economic Co-operation and
Development (OECD) countries, with the average
growth rate in Africa of just under 5 percent.
Within Africa, productivity varies tremendously—
both across countries and within countries. Some of
this is simply the result of differences of entrepreneurial
talent across individuals. Some of the variation reflects
differences in endowments or geography, but at least as
much mirrors differences in investment climate conditions
as illustrated in Figure 1 (see also Appendix B). Figure 1
shows how there are more productive firms in locations
with better investment climates or business environments.
The figure plots the share of firms in each country with
labor productivity above a benchmark against the Global
Competitiveness Index (GCI) discussed in Chapter 1.1.6
As the GCI captures many dimensions of the business
environment, it is a suitable summary measure to corre-
late against firm performance. Figure 1 uses as its bench-
mark the median labor productivity of all the small and
medium size firms (11–150 employees) combined into a
regional sample.
The first thing to note is that every country has
some firms that are above the regional median.
Productive firms exist in every location.The very best
firms do not operate only in the biggest economies or
the countries with the highest standards of living. Firms
can succeed even in poor investment climates.This is
not to say that reforms are unnecessary. Clearly, more
firms can achieve greater productivity when they oper-
ate in a stronger business environment. Based on these
samples of firms, over three-quarters of firms in Mauritius
and Namibia and two-thirds of firms in Algeria and
Botswana operate above the regional median, while only
10–15 percent of the firms in Gambia or Burundi do
so. Putting this into a broader international context,
about 80 percent of firms in a comparable study in
Brazil surpass the median African productivity level. In
China this is about 60 percent and, in India, 55 percent.
Thus, several countries in the region—including
Algeria, Botswana, Cameroon, Mauritius, Morocco,
Namibia, Senegal, Swaziland, and South Africa—have a
higher share of productive firms than China has.7
The relationship between productivity and the GCI
is not perfect. Egypt has a lower share of productive
firms than would be expected given the quality of its
business environment; Cameroon has a higher share.8
But correlations will almost never be perfect when
using a composite index.The investment climate is not
the only determinant of productivity—and an overall
index can underemphasize a particular dimension that is
constraining to a particular country.As the analysis here
shows, elements of the GCI have relatively more or less
impact for different groupings of firms and countries.
Aggregate analysis is very useful at highlighting the
30
1.2
: Fr
om
Be
nch
ma
rkin
g t
o I
mp
act
: Id
en
tify
ing
Wh
ich
Dim
en
sio
ns
Ma
tte
r
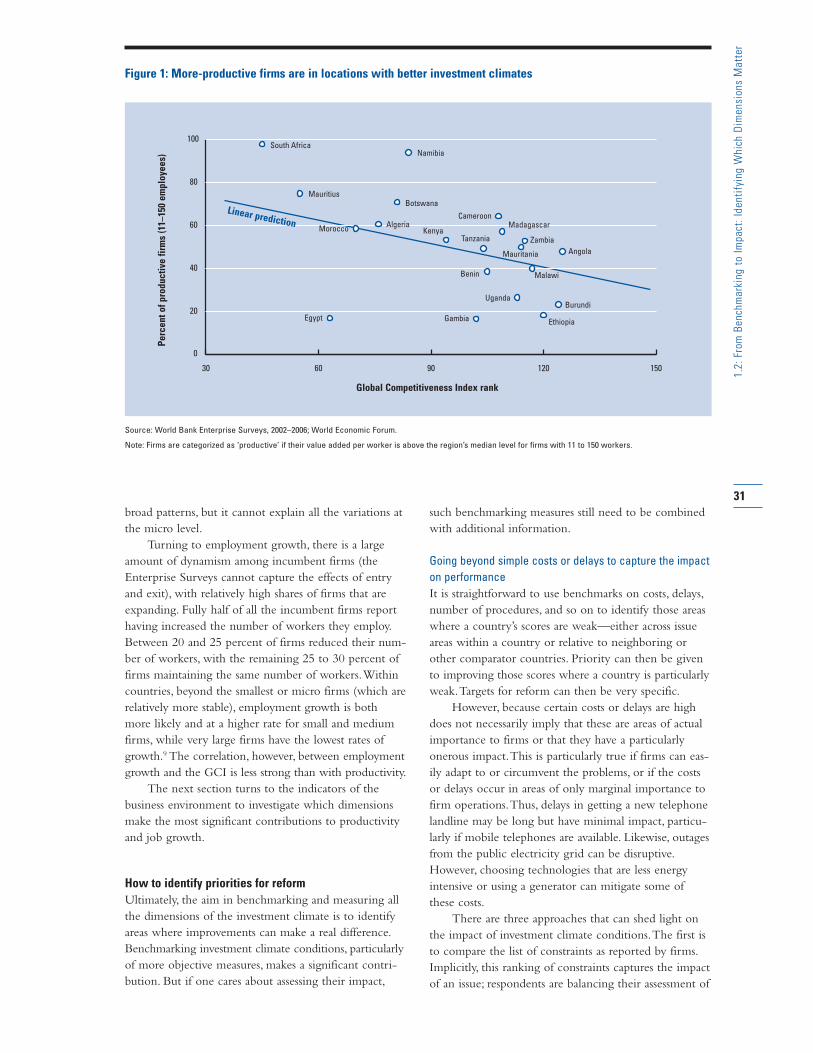
broad patterns, but it cannot explain all the variations at
the micro level.
Turning to employment growth, there is a large
amount of dynamism among incumbent firms (the
Enterprise Surveys cannot capture the effects of entry
and exit), with relatively high shares of firms that are
expanding. Fully half of all the incumbent firms report
having increased the number of workers they employ.
Between 20 and 25 percent of firms reduced their num-
ber of workers, with the remaining 25 to 30 percent of
firms maintaining the same number of workers.Within
countries, beyond the smallest or micro firms (which are
relatively more stable), employment growth is both
more likely and at a higher rate for small and medium
firms, while very large firms have the lowest rates of
growth.9 The correlation, however, between employment
growth and the GCI is less strong than with productivity.
The next section turns to the indicators of the
business environment to investigate which dimensions
make the most significant contributions to productivity
and job growth.
How to identify priorities for reform
Ultimately, the aim in benchmarking and measuring all
the dimensions of the investment climate is to identify
areas where improvements can make a real difference.
Benchmarking investment climate conditions, particularly
of more objective measures, makes a significant contri-
bution. But if one cares about assessing their impact,
such benchmarking measures still need to be combined
with additional information.
Going beyond simple costs or delays to capture the impact
on performance
It is straightforward to use benchmarks on costs, delays,
number of procedures, and so on to identify those areas
where a country’s scores are weak—either across issue
areas within a country or relative to neighboring or
other comparator countries. Priority can then be given
to improving those scores where a country is particularly
weak.Targets for reform can then be very specific.
However, because certain costs or delays are high
does not necessarily imply that these are areas of actual
importance to firms or that they have a particularly
onerous impact.This is particularly true if firms can eas-
ily adapt to or circumvent the problems, or if the costs
or delays occur in areas of only marginal importance to
firm operations.Thus, delays in getting a new telephone
landline may be long but have minimal impact, particu-
larly if mobile telephones are available. Likewise, outages
from the public electricity grid can be disruptive.
However, choosing technologies that are less energy
intensive or using a generator can mitigate some of
these costs.
There are three approaches that can shed light on
the impact of investment climate conditions.The first is
to compare the list of constraints as reported by firms.
Implicitly, this ranking of constraints captures the impact
of an issue; respondents are balancing their assessment of
31
1.2
: Fr
om
Be
nch
ma
rkin
g t
o I
mp
act
: Id
en
tify
ing
Wh
ich
Dim
en
sio
ns
Ma
tte
r
30 60 90 120 150
0
20
40
60
80
100South Africa
Mauritius
Algeria
Botswana
Namibia
MadagascarCameroon
Zambia
Mauritania Angola
Malawi
Burundi
Ethiopia
Morocco Kenya
Gambia
Benin
Uganda
Tanzania
Egypt
Figure 1: More-productive firms are in locations with better investment climates
Source: World Bank Enterprise Surveys, 2002–2006; World Economic Forum.
Note: Firms are categorized as ‘productive’ if their value added per worker is above the region’s median level for firms with 11 to 150 workers.
Global Competitiveness Index rank
Pe
rce
nt
of
pro
du
cti
ve f
irm
s (1
1–15
0 e
mp
loye
es)
Linear prediction
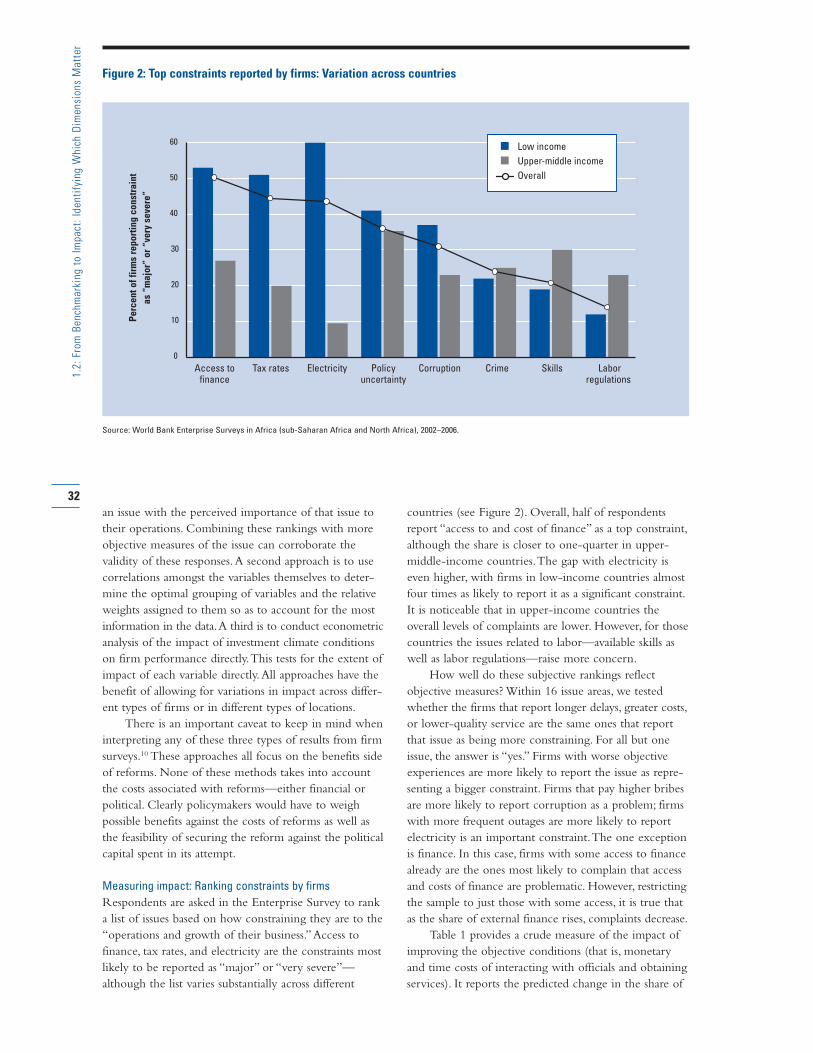
an issue with the perceived importance of that issue to
their operations. Combining these rankings with more
objective measures of the issue can corroborate the
validity of these responses.A second approach is to use
correlations amongst the variables themselves to deter-
mine the optimal grouping of variables and the relative
weights assigned to them so as to account for the most
information in the data.A third is to conduct econometric
analysis of the impact of investment climate conditions
on firm performance directly.This tests for the extent of
impact of each variable directly.All approaches have the
benefit of allowing for variations in impact across differ-
ent types of firms or in different types of locations.
There is an important caveat to keep in mind when
interpreting any of these three types of results from firm
surveys.10 These approaches all focus on the benefits side
of reforms. None of these methods takes into account
the costs associated with reforms—either financial or
political. Clearly policymakers would have to weigh
possible benefits against the costs of reforms as well as
the feasibility of securing the reform against the political
capital spent in its attempt.
Measuring impact: Ranking constraints by firms
Respondents are asked in the Enterprise Survey to rank
a list of issues based on how constraining they are to the
“operations and growth of their business.”Access to
finance, tax rates, and electricity are the constraints most
likely to be reported as “major” or “very severe”—
although the list varies substantially across different
countries (see Figure 2). Overall, half of respondents
report “access to and cost of finance” as a top constraint,
although the share is closer to one-quarter in upper-
middle-income countries.The gap with electricity is
even higher, with firms in low-income countries almost
four times as likely to report it as a significant constraint.
It is noticeable that in upper-income countries the
overall levels of complaints are lower. However, for those
countries the issues related to labor—available skills as
well as labor regulations—raise more concern.
How well do these subjective rankings reflect
objective measures? Within 16 issue areas, we tested
whether the firms that report longer delays, greater costs,
or lower-quality service are the same ones that report
that issue as being more constraining. For all but one
issue, the answer is “yes.” Firms with worse objective
experiences are more likely to report the issue as repre-
senting a bigger constraint. Firms that pay higher bribes
are more likely to report corruption as a problem; firms
with more frequent outages are more likely to report
electricity is an important constraint.The one exception
is finance. In this case, firms with some access to finance
already are the ones most likely to complain that access
and costs of finance are problematic. However, restricting
the sample to just those with some access, it is true that
as the share of external finance rises, complaints decrease.
Table 1 provides a crude measure of the impact of
improving the objective conditions (that is, monetary
and time costs of interacting with officials and obtaining
services). It reports the predicted change in the share of
32
1.2
: Fr
om
Be
nch
ma
rkin
g t
o I
mp
act
: Id
en
tify
ing
Wh
ich
Dim
en
sio
ns
Ma
tte
r
0
10
20
30
40
50
60
Figure 2: Top constraints reported by firms: Variation across countries
Source: World Bank Enterprise Surveys in Africa (sub-Saharan Africa and North Africa), 2002–2006.
Pe
rce
nt
of
firm
s re
po
rtin
g c
on
stra
int
as
“ma
jor”
or
“ve
ry s
eve
re”
Access tofinance
Tax rates Electricity Policy uncertainty
Corruption Crime Skills Labor regulations
� Low income
� Upper-middle income
Overall
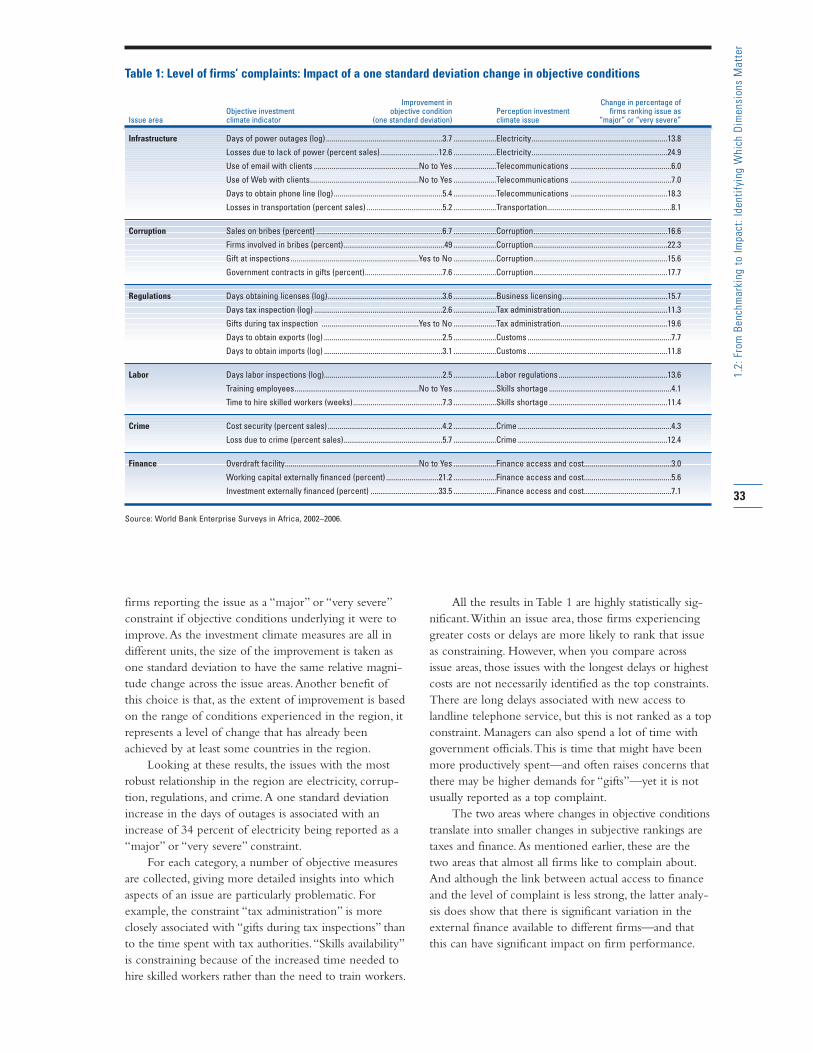
firms reporting the issue as a “major” or “very severe”
constraint if objective conditions underlying it were to
improve.As the investment climate measures are all in
different units, the size of the improvement is taken as
one standard deviation to have the same relative magni-
tude change across the issue areas.Another benefit of
this choice is that, as the extent of improvement is based
on the range of conditions experienced in the region, it
represents a level of change that has already been
achieved by at least some countries in the region.
Looking at these results, the issues with the most
robust relationship in the region are electricity, corrup-
tion, regulations, and crime.A one standard deviation
increase in the days of outages is associated with an
increase of 34 percent of electricity being reported as a
“major” or “very severe” constraint.
For each category, a number of objective measures
are collected, giving more detailed insights into which
aspects of an issue are particularly problematic. For
example, the constraint “tax administration” is more
closely associated with “gifts during tax inspections” than
to the time spent with tax authorities.“Skills availability”
is constraining because of the increased time needed to
hire skilled workers rather than the need to train workers.
All the results in Table 1 are highly statistically sig-
nificant.Within an issue area, those firms experiencing
greater costs or delays are more likely to rank that issue
as constraining. However, when you compare across
issue areas, those issues with the longest delays or highest
costs are not necessarily identified as the top constraints.
There are long delays associated with new access to
landline telephone service, but this is not ranked as a top
constraint. Managers can also spend a lot of time with
government officials.This is time that might have been
more productively spent—and often raises concerns that
there may be higher demands for “gifts”—yet it is not
usually reported as a top complaint.
The two areas where changes in objective conditions
translate into smaller changes in subjective rankings are
taxes and finance.As mentioned earlier, these are the
two areas that almost all firms like to complain about.
And although the link between actual access to finance
and the level of complaint is less strong, the latter analy-
sis does show that there is significant variation in the
external finance available to different firms—and that
this can have significant impact on firm performance.
33
1.2
: Fr
om
Be
nch
ma
rkin
g t
o I
mp
act
: Id
en
tify
ing
Wh
ich
Dim
en
sio
ns
Ma
tte
r
Table 1: Level of firms’ complaints: Impact of a one standard deviation change in objective conditions
Improvement in Change in percentage of Objective investment objective condition Perception investment firms ranking issue as
Issue area climate indicator (one standard deviation) climate issue “major” or “very severe”
Infrastructure Days of power outages (log) ............................................................3.7 ......................Electricity......................................................................13.8
Losses due to lack of power (percent sales)..............................12.6 ......................Electricity......................................................................24.9
Use of email with clients ......................................................No to Yes ......................Telecommunications ....................................................6.0
Use of Web with clients........................................................No to Yes ......................Telecommunications ....................................................7.0
Days to obtain phone line (log)........................................................5.4 ......................Telecommunications ..................................................18.3
Losses in transportation (percent sales) .......................................5.2 ......................Transportation................................................................8.1
Corruption Sales on bribes (percent) .................................................................6.7 ......................Corruption.....................................................................16.6
Firms involved in bribes (percent)....................................................49 ......................Corruption.....................................................................22.3
Gift at inspections ..................................................................Yes to No ......................Corruption.....................................................................15.6
Government contracts in gifts (percent)........................................7.6 ......................Corruption.....................................................................17.7
Regulations Days obtaining licenses (log)...........................................................3.6 ......................Business licensing......................................................15.7
Days tax inspection (log) ..................................................................2.6 ......................Tax administration.......................................................11.3
Gifts during tax inspection ..................................................Yes to No ......................Tax administration.......................................................19.6
Days to obtain exports (log) .............................................................2.5 ......................Customs ..........................................................................7.7
Days to obtain imports (log) .............................................................3.1 ......................Customs ........................................................................11.8
Labor Days labor inspections (log).............................................................2.5 ......................Labor regulations ........................................................13.6
Training employees................................................................No to Yes ......................Skills shortage ...............................................................4.1
Time to hire skilled workers (weeks)..............................................7.3 ......................Skills shortage .............................................................11.4
Crime Cost security (percent sales) ...........................................................4.2 ......................Crime ...............................................................................4.3
Loss due to crime (percent sales)...................................................5.7 ......................Crime .............................................................................12.4
Finance Overdraft facility.....................................................................No to Yes ......................Finance access and cost.............................................3.0
Working capital externally financed (percent) ...........................21.2 ......................Finance access and cost.............................................5.6
Investment externally financed (percent) ...................................33.5 ......................Finance access and cost.............................................7.1
Source: World Bank Enterprise Surveys in Africa, 2002–2006.
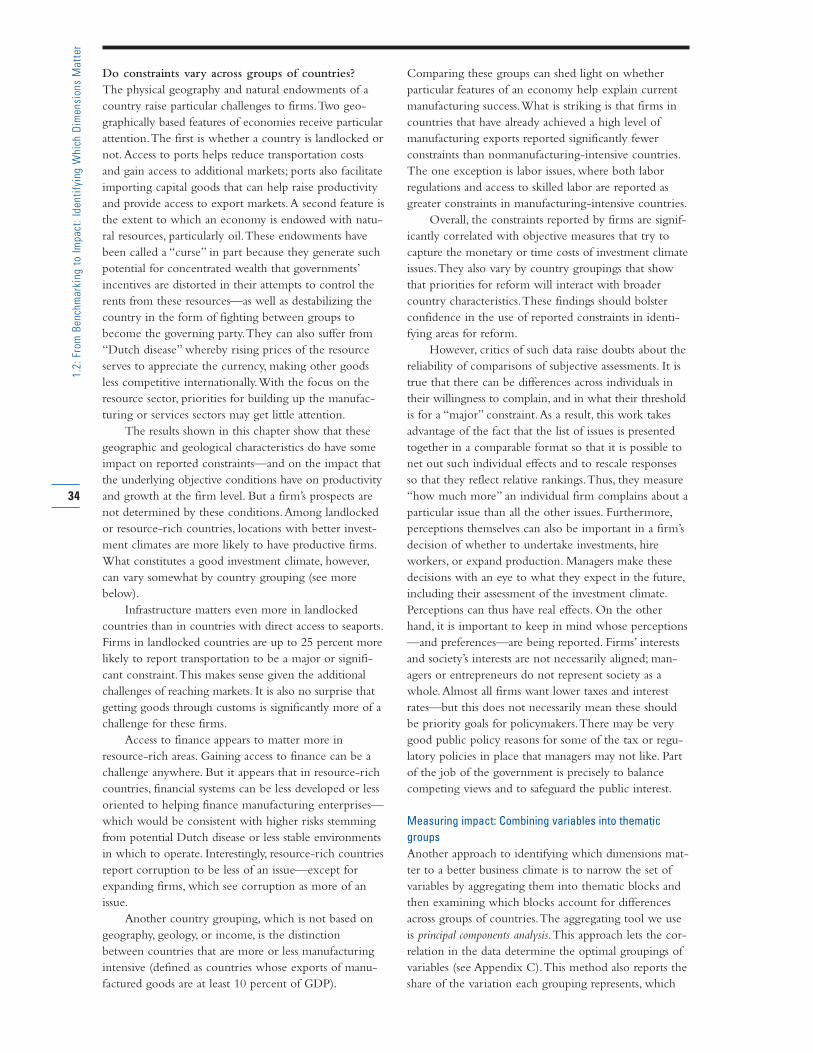
Do constraints vary across groups of countries?
The physical geography and natural endowments of a
country raise particular challenges to firms.Two geo-
graphically based features of economies receive particular
attention.The first is whether a country is landlocked or
not.Access to ports helps reduce transportation costs
and gain access to additional markets; ports also facilitate
importing capital goods that can help raise productivity
and provide access to export markets.A second feature is
the extent to which an economy is endowed with natu-
ral resources, particularly oil.These endowments have
been called a “curse” in part because they generate such
potential for concentrated wealth that governments’
incentives are distorted in their attempts to control the
rents from these resources—as well as destabilizing the
country in the form of fighting between groups to
become the governing party.They can also suffer from
“Dutch disease” whereby rising prices of the resource
serves to appreciate the currency, making other goods
less competitive internationally.With the focus on the
resource sector, priorities for building up the manufac-
turing or services sectors may get little attention.
The results shown in this chapter show that these
geographic and geological characteristics do have some
impact on reported constraints—and on the impact that
the underlying objective conditions have on productivity
and growth at the firm level. But a firm’s prospects are
not determined by these conditions.Among landlocked
or resource-rich countries, locations with better invest-
ment climates are more likely to have productive firms.
What constitutes a good investment climate, however,
can vary somewhat by country grouping (see more
below).
Infrastructure matters even more in landlocked
countries than in countries with direct access to seaports.
Firms in landlocked countries are up to 25 percent more
likely to report transportation to be a major or signifi-
cant constraint.This makes sense given the additional
challenges of reaching markets. It is also no surprise that
getting goods through customs is significantly more of a
challenge for these firms.
Access to finance appears to matter more in
resource-rich areas. Gaining access to finance can be a
challenge anywhere. But it appears that in resource-rich
countries, financial systems can be less developed or less
oriented to helping finance manufacturing enterprises—
which would be consistent with higher risks stemming
from potential Dutch disease or less stable environments
in which to operate. Interestingly, resource-rich countries
report corruption to be less of an issue—except for
expanding firms, which see corruption as more of an
issue.
Another country grouping, which is not based on
geography, geology, or income, is the distinction
between countries that are more or less manufacturing
intensive (defined as countries whose exports of manu-
factured goods are at least 10 percent of GDP).
Comparing these groups can shed light on whether
particular features of an economy help explain current
manufacturing success.What is striking is that firms in
countries that have already achieved a high level of
manufacturing exports reported significantly fewer
constraints than nonmanufacturing-intensive countries.
The one exception is labor issues, where both labor
regulations and access to skilled labor are reported as
greater constraints in manufacturing-intensive countries.
Overall, the constraints reported by firms are signif-
icantly correlated with objective measures that try to
capture the monetary or time costs of investment climate
issues.They also vary by country groupings that show
that priorities for reform will interact with broader
country characteristics.These findings should bolster
confidence in the use of reported constraints in identi-
fying areas for reform.
However, critics of such data raise doubts about the
reliability of comparisons of subjective assessments. It is
true that there can be differences across individuals in
their willingness to complain, and in what their threshold
is for a “major” constraint.As a result, this work takes
advantage of the fact that the list of issues is presented
together in a comparable format so that it is possible to
net out such individual effects and to rescale responses
so that they reflect relative rankings.Thus, they measure
“how much more” an individual firm complains about a
particular issue than all the other issues. Furthermore,
perceptions themselves can also be important in a firm’s
decision of whether to undertake investments, hire
workers, or expand production. Managers make these
decisions with an eye to what they expect in the future,
including their assessment of the investment climate.
Perceptions can thus have real effects. On the other
hand, it is important to keep in mind whose perceptions
—and preferences—are being reported. Firms’ interests
and society’s interests are not necessarily aligned; man-
agers or entrepreneurs do not represent society as a
whole.Almost all firms want lower taxes and interest
rates—but this does not necessarily mean these should
be priority goals for policymakers.There may be very
good public policy reasons for some of the tax or regu-
latory policies in place that managers may not like. Part
of the job of the government is precisely to balance
competing views and to safeguard the public interest.
Measuring impact: Combining variables into thematic
groups
Another approach to identifying which dimensions mat-
ter to a better business climate is to narrow the set of
variables by aggregating them into thematic blocks and
then examining which blocks account for differences
across groups of countries.The aggregating tool we use
is principal components analysis.This approach lets the cor-
relation in the data determine the optimal groupings of
variables (see Appendix C).This method also reports the
share of the variation each grouping represents, which
34
1.2
: Fr
om
Be
nch
ma
rkin
g t
o I
mp
act
: Id
en
tify
ing
Wh
ich
Dim
en
sio
ns
Ma
tte
r
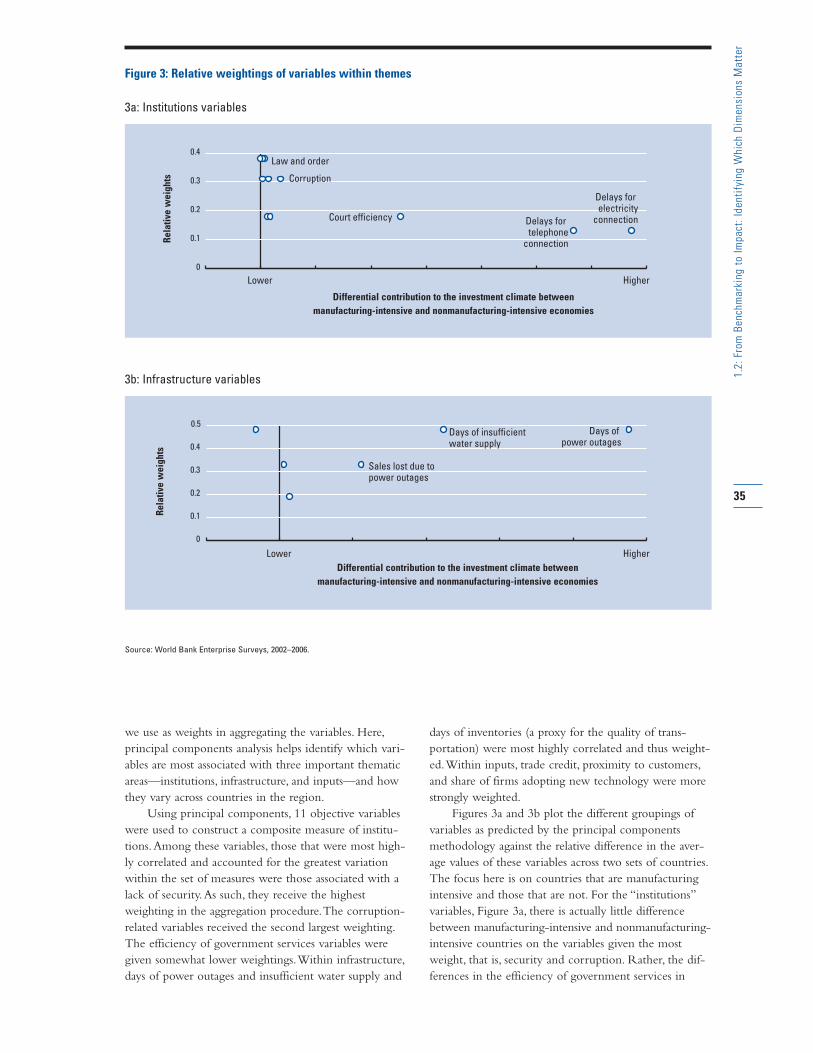
35
1.2
: Fr
om
Be
nch
ma
rkin
g t
o I
mp
act
: Id
en
tify
ing
Wh
ich
Dim
en
sio
ns
Ma
tte
r
Figure 3: Relative weightings of variables within themes
0
0.1
0.2
0.3
0.4
0.5Days of insufficientwater supply
Days of power outages
Sales lost due topower outages
3b: Infrastructure variables
Differential contribution to the investment climate between
manufacturing-intensive and nonmanufacturing-intensive economies
Re
lati
ve w
eig
hts
0
0.1
0.2
0.3
0.4Law and order
Corruption
Court efficiency
Delays for
electricityconnectionDelays for
telephoneconnection
3a: Institutions variables
Differential contribution to the investment climate between
manufacturing-intensive and nonmanufacturing-intensive economies
Re
lati
ve w
eig
hts
we use as weights in aggregating the variables. Here,
principal components analysis helps identify which vari-
ables are most associated with three important thematic
areas—institutions, infrastructure, and inputs—and how
they vary across countries in the region.
Using principal components, 11 objective variables
were used to construct a composite measure of institu-
tions.Among these variables, those that were most high-
ly correlated and accounted for the greatest variation
within the set of measures were those associated with a
lack of security.As such, they receive the highest
weighting in the aggregation procedure.The corruption-
related variables received the second largest weighting.
The efficiency of government services variables were
given somewhat lower weightings.Within infrastructure,
days of power outages and insufficient water supply and
days of inventories (a proxy for the quality of trans-
portation) were most highly correlated and thus weight-
ed.Within inputs, trade credit, proximity to customers,
and share of firms adopting new technology were more
strongly weighted.
Figures 3a and 3b plot the different groupings of
variables as predicted by the principal components
methodology against the relative difference in the aver-
age values of these variables across two sets of countries.
The focus here is on countries that are manufacturing
intensive and those that are not. For the “institutions”
variables, Figure 3a, there is actually little difference
between manufacturing-intensive and nonmanufacturing-
intensive countries on the variables given the most
weight, that is, security and corruption. Rather, the dif-
ferences in the efficiency of government services in
Source: World Bank Enterprise Surveys, 2002–2006.
Lower Higher
Lower Higher
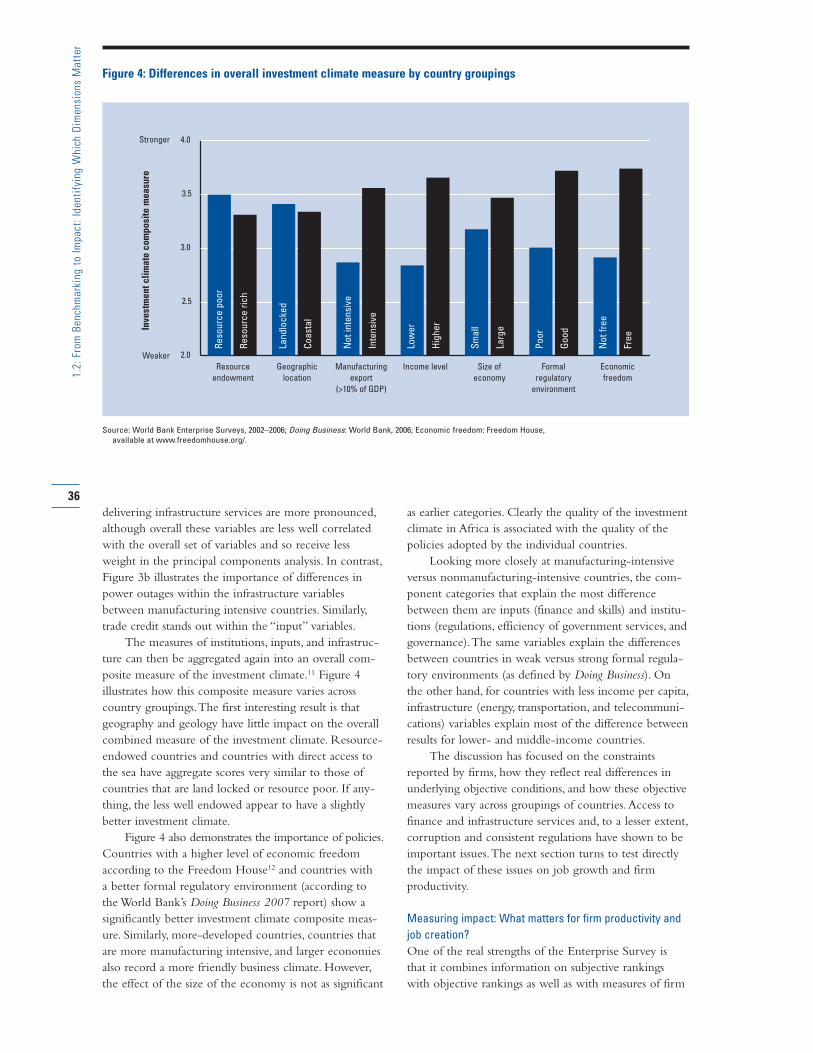
delivering infrastructure services are more pronounced,
although overall these variables are less well correlated
with the overall set of variables and so receive less
weight in the principal components analysis. In contrast,
Figure 3b illustrates the importance of differences in
power outages within the infrastructure variables
between manufacturing intensive countries. Similarly,
trade credit stands out within the “input” variables.
The measures of institutions, inputs, and infrastruc-
ture can then be aggregated again into an overall com-
posite measure of the investment climate.11 Figure 4
illustrates how this composite measure varies across
country groupings.The first interesting result is that
geography and geology have little impact on the overall
combined measure of the investment climate. Resource-
endowed countries and countries with direct access to
the sea have aggregate scores very similar to those of
countries that are land locked or resource poor. If any-
thing, the less well endowed appear to have a slightly
better investment climate.
Figure 4 also demonstrates the importance of policies.
Countries with a higher level of economic freedom
according to the Freedom House12 and countries with
a better formal regulatory environment (according to
the World Bank’s Doing Business 2007 report) show a
significantly better investment climate composite meas-
ure. Similarly, more-developed countries, countries that
are more manufacturing intensive, and larger economies
also record a more friendly business climate. However,
the effect of the size of the economy is not as significant
as earlier categories. Clearly the quality of the investment
climate in Africa is associated with the quality of the
policies adopted by the individual countries.
Looking more closely at manufacturing-intensive
versus nonmanufacturing-intensive countries, the com-
ponent categories that explain the most difference
between them are inputs (finance and skills) and institu-
tions (regulations, efficiency of government services, and
governance).The same variables explain the differences
between countries in weak versus strong formal regula-
tory environments (as defined by Doing Business). On
the other hand, for countries with less income per capita,
infrastructure (energy, transportation, and telecommuni-
cations) variables explain most of the difference between
results for lower- and middle-income countries.
The discussion has focused on the constraints
reported by firms, how they reflect real differences in
underlying objective conditions, and how these objective
measures vary across groupings of countries.Access to
finance and infrastructure services and, to a lesser extent,
corruption and consistent regulations have shown to be
important issues.The next section turns to test directly
the impact of these issues on job growth and firm
productivity.
Measuring impact: What matters for firm productivity and
job creation?
One of the real strengths of the Enterprise Survey is
that it combines information on subjective rankings
with objective rankings as well as with measures of firm
36
1.2
: Fr
om
Be
nch
ma
rkin
g t
o I
mp
act
: Id
en
tify
ing
Wh
ich
Dim
en
sio
ns
Ma
tte
r
2.0
2.5
3.0
3.5
4.0
Figure 4: Differences in overall investment climate measure by country groupings
Source: World Bank Enterprise Surveys, 2002–2006; Doing Business: World Bank, 2006; Economic freedom: Freedom House,
available at www.freedomhouse.org/.
Inve
stm
en
t c
lim
ate
co
mp
osi
te m
ea
sure
Resource
endowment
Geographic
location
Manufacturing
export
(>10% of GDP)
Income level Size of
economy
Formal
regulatory
environment
Economic
freedom
Stronger
Weaker
Re
sou
rce
po
or
Re
sou
rce
ric
h
Lan
dlo
cke
d
Co
ast
al
No
t in
ten
sive
Inte
nsi
ve
Low
er
Hig
he
r
Sm
all
Larg
e
Po
or
Go
od
No
t fr
ee
Fre
e
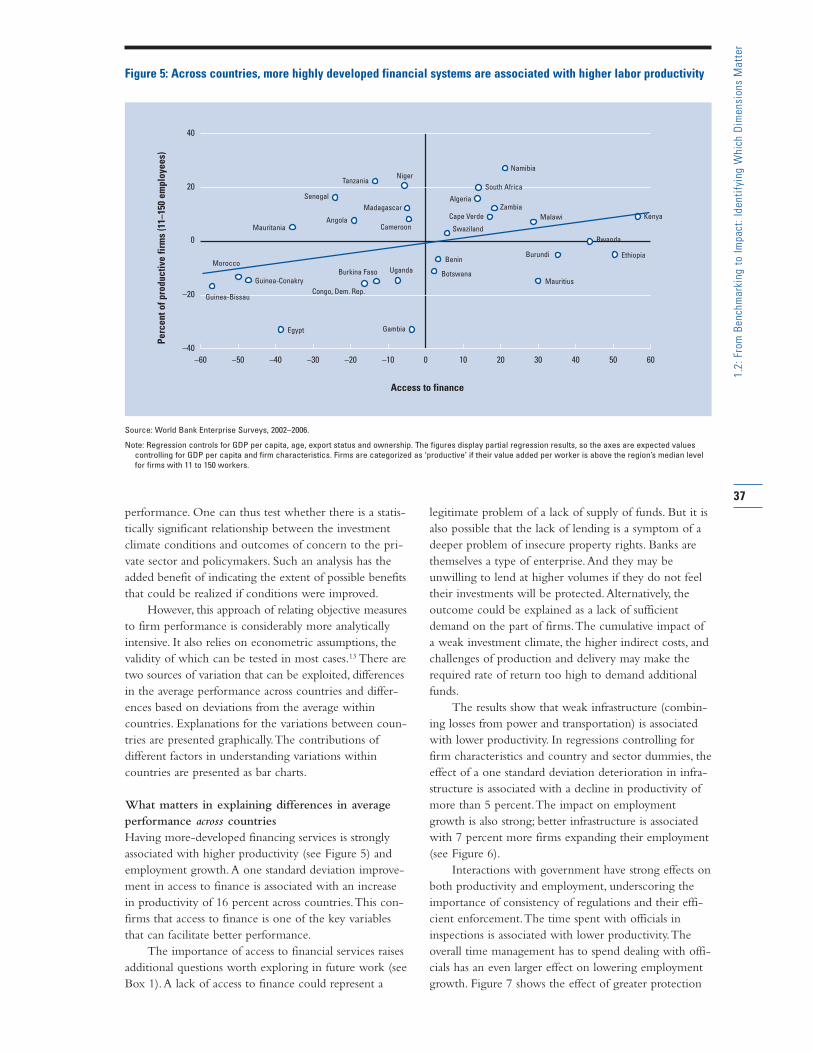
performance. One can thus test whether there is a statis-
tically significant relationship between the investment
climate conditions and outcomes of concern to the pri-
vate sector and policymakers. Such an analysis has the
added benefit of indicating the extent of possible benefits
that could be realized if conditions were improved.
However, this approach of relating objective measures
to firm performance is considerably more analytically
intensive. It also relies on econometric assumptions, the
validity of which can be tested in most cases.13 There are
two sources of variation that can be exploited, differences
in the average performance across countries and differ-
ences based on deviations from the average within
countries. Explanations for the variations between coun-
tries are presented graphically.The contributions of
different factors in understanding variations within
countries are presented as bar charts.
What matters in explaining differences in average
performance across countries
Having more-developed financing services is strongly
associated with higher productivity (see Figure 5) and
employment growth.A one standard deviation improve-
ment in access to finance is associated with an increase
in productivity of 16 percent across countries.This con-
firms that access to finance is one of the key variables
that can facilitate better performance.
The importance of access to financial services raises
additional questions worth exploring in future work (see
Box 1).A lack of access to finance could represent a
legitimate problem of a lack of supply of funds. But it is
also possible that the lack of lending is a symptom of a
deeper problem of insecure property rights. Banks are
themselves a type of enterprise.And they may be
unwilling to lend at higher volumes if they do not feel
their investments will be protected.Alternatively, the
outcome could be explained as a lack of sufficient
demand on the part of firms.The cumulative impact of
a weak investment climate, the higher indirect costs, and
challenges of production and delivery may make the
required rate of return too high to demand additional
funds.
The results show that weak infrastructure (combin-
ing losses from power and transportation) is associated
with lower productivity. In regressions controlling for
firm characteristics and country and sector dummies, the
effect of a one standard deviation deterioration in infra-
structure is associated with a decline in productivity of
more than 5 percent.The impact on employment
growth is also strong; better infrastructure is associated
with 7 percent more firms expanding their employment
(see Figure 6).
Interactions with government have strong effects on
both productivity and employment, underscoring the
importance of consistency of regulations and their effi-
cient enforcement.The time spent with officials in
inspections is associated with lower productivity.The
overall time management has to spend dealing with offi-
cials has an even larger effect on lowering employment
growth. Figure 7 shows the effect of greater protection
–60 –50 –40 –30 –20 –10 0 10 20 30 40 50 60
–40
–20
0
20
40
Guinea-Bissau
Guinea-Conakry
Morocco
Botswana
Benin
Swaziland
Mauritius
Ethiopia
Kenya
Rwanda
Malawi
Namibia
South Africa
Zambia
Egypt Gambia
Congo, Dem. Rep.
Mauritania
Senegal
Tanzania
Algeria
Cape VerdeAngola
Niger
Madagascar
Cameroon
Burundi
Burkina Faso Uganda
Figure 5: Across countries, more highly developed financial systems are associated with higher labor productivity
Source: World Bank Enterprise Surveys, 2002–2006.
Note: Regression controls for GDP per capita, age, export status and ownership. The figures display partial regression results, so the axes are expected values
controlling for GDP per capita and firm characteristics. Firms are categorized as ‘productive’ if their value added per worker is above the region’s median level
for firms with 11 to 150 workers.
Access to finance
Pe
rce
nt
of
pro
du
cti
ve f
irm
s (1
1–15
0 e
mp
loye
es)
37
1.2
: Fr
om
Be
nch
ma
rkin
g t
o I
mp
act
: Id
en
tify
ing
Wh
ich
Dim
en
sio
ns
Ma
tte
r
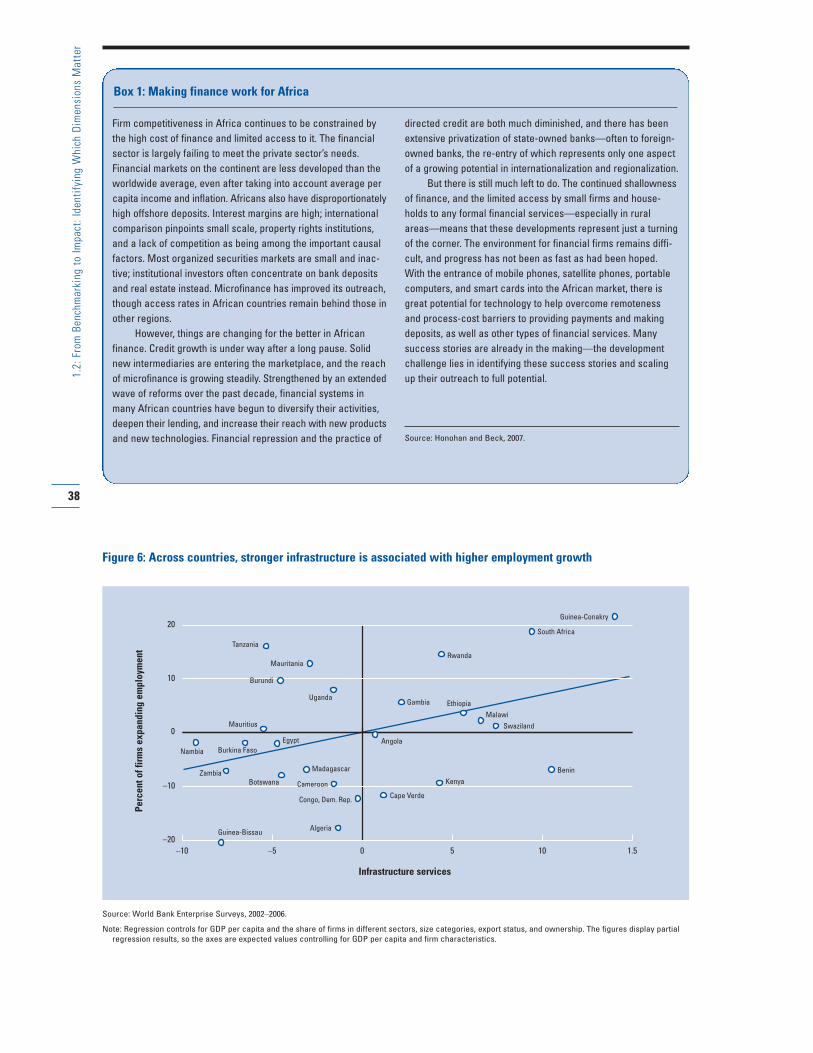
38
1.2
: Fr
om
Be
nch
ma
rkin
g t
o I
mp
act
: Id
en
tify
ing
Wh
ich
Dim
en
sio
ns
Ma
tte
r
–10 –5 0 5 10 1.5
–20
–10
0
10
20
Benin
Kenya
Cape Verde
AngolaEgypt
Madagascar
Burkina FasoNambia
Guinea-Bissau
Gambia
Rwanda
South Africa
Guinea-Conakry
Ethiopia
Malawi
Swaziland
Congo, Dem. Rep.
CameroonBotswana
Algeria
Zambia
Mauritius
Burundi
Tanzania
Mauritania
Uganda
Figure 6: Across countries, stronger infrastructure is associated with higher employment growth
Source: World Bank Enterprise Surveys, 2002–2006.
Note: Regression controls for GDP per capita and the share of firms in different sectors, size categories, export status, and ownership. The figures display partial
regression results, so the axes are expected values controlling for GDP per capita and firm characteristics.
Infrastructure services
Pe
rce
nt
of
firm
s e
xp
an
din
g e
mp
loym
en
t
Box 1: Making finance work for Africa
Firm competitiveness in Africa continues to be constrained by
the high cost of finance and limited access to it. The financial
sector is largely failing to meet the private sector’s needs.
Financial markets on the continent are less developed than the
worldwide average, even after taking into account average per
capita income and inflation. Africans also have disproportionately
high offshore deposits. Interest margins are high; international
comparison pinpoints small scale, property rights institutions,
and a lack of competition as being among the important causal
factors. Most organized securities markets are small and inac-
tive; institutional investors often concentrate on bank deposits
and real estate instead. Microfinance has improved its outreach,
though access rates in African countries remain behind those in
other regions.
However, things are changing for the better in African
finance. Credit growth is under way after a long pause. Solid
new intermediaries are entering the marketplace, and the reach
of microfinance is growing steadily. Strengthened by an extended
wave of reforms over the past decade, financial systems in
many African countries have begun to diversify their activities,
deepen their lending, and increase their reach with new products
and new technologies. Financial repression and the practice of
directed credit are both much diminished, and there has been
extensive privatization of state-owned banks—often to foreign-
owned banks, the re-entry of which represents only one aspect
of a growing potential in internationalization and regionalization.
But there is still much left to do. The continued shallowness
of finance, and the limited access by small firms and house-
holds to any formal financial services—especially in rural
areas—means that these developments represent just a turning
of the corner. The environment for financial firms remains diffi-
cult, and progress has not been as fast as had been hoped.
With the entrance of mobile phones, satellite phones, portable
computers, and smart cards into the African market, there is
great potential for technology to help overcome remoteness
and process-cost barriers to providing payments and making
deposits, as well as other types of financial services. Many
success stories are already in the making—the development
challenge lies in identifying these success stories and scaling
up their outreach to full potential.
Source: Honohan and Beck, 2007.
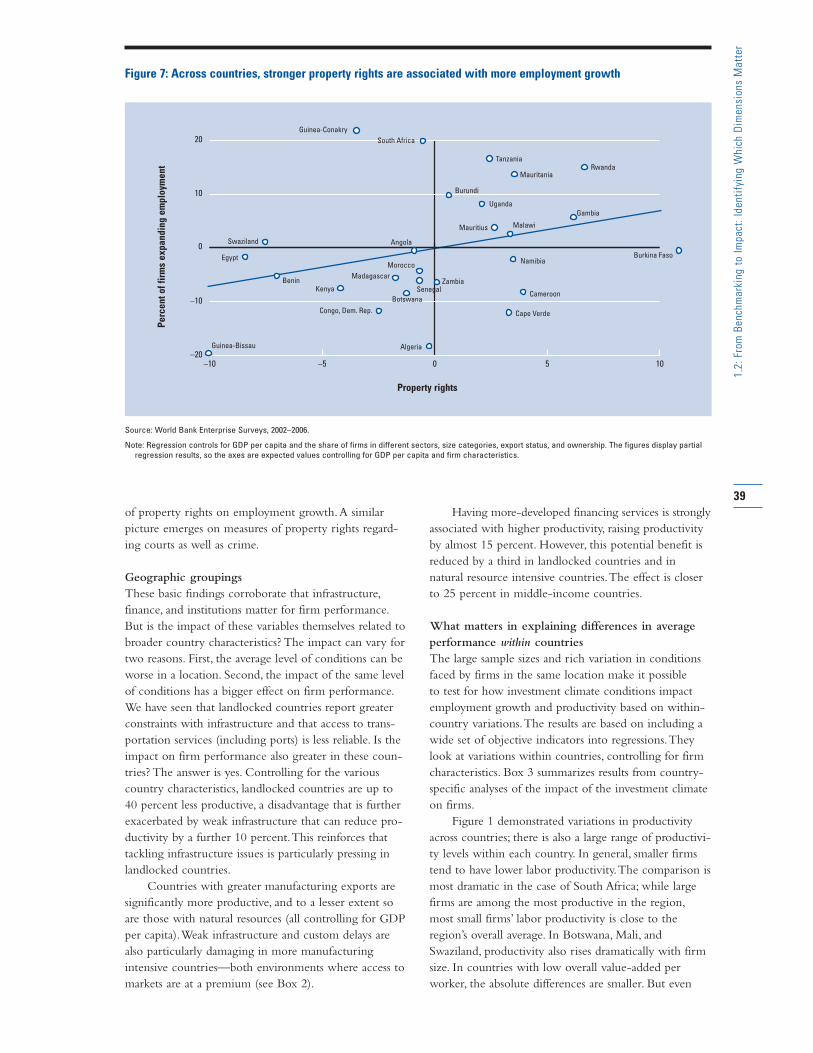
–10 –5 0 5 10–20
–10
0
10
20
SenegalZambia
Cape Verde
Cameroon
Namibia
Malawi
Uganda
Burundi
Tanzania
MauritaniaRwanda
Gambia
AngolaSwaziland
Benin
Egypt
Kenya
Congo, Dem. Rep.
Algeria
Botswana
Madagascar
Mauritius
Guinea-Conakry
Guinea-Bissau
South Africa
Morocco
Burkina Faso
Figure 7: Across countries, stronger property rights are associated with more employment growth
Source: World Bank Enterprise Surveys, 2002–2006.
Note: Regression controls for GDP per capita and the share of firms in different sectors, size categories, export status, and ownership. The figures display partial
regression results, so the axes are expected values controlling for GDP per capita and firm characteristics.
Property rights
Pe
rce
nt
of
firm
s e
xp
an
din
g e
mp
loym
en
t
of property rights on employment growth.A similar
picture emerges on measures of property rights regard-
ing courts as well as crime.
Geographic groupings
These basic findings corroborate that infrastructure,
finance, and institutions matter for firm performance.
But is the impact of these variables themselves related to
broader country characteristics? The impact can vary for
two reasons. First, the average level of conditions can be
worse in a location. Second, the impact of the same level
of conditions has a bigger effect on firm performance.
We have seen that landlocked countries report greater
constraints with infrastructure and that access to trans-
portation services (including ports) is less reliable. Is the
impact on firm performance also greater in these coun-
tries? The answer is yes. Controlling for the various
country characteristics, landlocked countries are up to
40 percent less productive, a disadvantage that is further
exacerbated by weak infrastructure that can reduce pro-
ductivity by a further 10 percent.This reinforces that
tackling infrastructure issues is particularly pressing in
landlocked countries.
Countries with greater manufacturing exports are
significantly more productive, and to a lesser extent so
are those with natural resources (all controlling for GDP
per capita).Weak infrastructure and custom delays are
also particularly damaging in more manufacturing
intensive countries—both environments where access to
markets are at a premium (see Box 2).
Having more-developed financing services is strongly
associated with higher productivity, raising productivity
by almost 15 percent. However, this potential benefit is
reduced by a third in landlocked countries and in
natural resource intensive countries.The effect is closer
to 25 percent in middle-income countries.
What matters in explaining differences in average
performance within countries
The large sample sizes and rich variation in conditions
faced by firms in the same location make it possible
to test for how investment climate conditions impact
employment growth and productivity based on within-
country variations.The results are based on including a
wide set of objective indicators into regressions.They
look at variations within countries, controlling for firm
characteristics. Box 3 summarizes results from country-
specific analyses of the impact of the investment climate
on firms.
Figure 1 demonstrated variations in productivity
across countries; there is also a large range of productivi-
ty levels within each country. In general, smaller firms
tend to have lower labor productivity.The comparison is
most dramatic in the case of South Africa; while large
firms are among the most productive in the region,
most small firms’ labor productivity is close to the
region’s overall average. In Botswana, Mali, and
Swaziland, productivity also rises dramatically with firm
size. In countries with low overall value-added per
worker, the absolute differences are smaller. But even
39
1.2
: Fr
om
Be
nch
ma
rkin
g t
o I
mp
act
: Id
en
tify
ing
Wh
ich
Dim
en
sio
ns
Ma
tte
r
40
1.2
: Fr
om
Be
nch
ma
rkin
g t
o I
mp
act
: Id
en
tify
ing
Wh
ich
Dim
en
sio
ns
Ma
tte
r
Box 2: Improving prospects for exports
Recently, there has been much concern about Africa’s export
performance. Africa’s share of world exports has declined in
recent decades, and most countries in Africa are still highly
dependent upon a narrow range of primary commodities for
their export earnings. The poor performance of manufacturing
exports has been a particular concern—especially as exporting
can help improve productivity.1
There are a number of dimensions in which policies can
help. Easing restrictive trade and customs regulations appears
to encourage exporting. In recent years, many countries—
including most of the countries in this study—have reduced
tariff and nontariff barriers to trade. However, other problems
remain. For example, customs administration is slow and prone
to corruption in many African countries—enterprises in
Tanzania reported that on average it takes about 12 days
for exports and 19 days for imports to clear customs. In
comparison, it takes only 2 and 3 days for exports and imports
respectively to clear customs in the Philippines. Steps to
improve customs administration could therefore be helpful.
For example, reducing physical inspections of goods when
appropriate and minimizing contacts between customs adminis-
tration staff and importers and exporters could reduce both
processing times and opportunities for corruption.2 Programs
to encourage exports, such as duty-drawback schemes, are
often poorly administered with long delays for payments and
refunds.
Improving infrastructure is often highlighted as a way to
improve exports. However, in an eight-country study in Africa,
the empirical results provide only relatively weak support for
the assertion that the quality of domestic transportation infra-
structure affects export performance. Instead, improving
communications facilities held greater promise. Enterprises
with Internet connections are more likely to export than enter-
prises without. The Internet provides an important tool to
contact suppliers and customers, to learn more about overseas
markets, and to publicize a firm’s products. In addition,
increasing the use of information technology—and improving
procedures so that it is used efficiently—can often accelerate
customs processing. A recent program in Ghana reduced
average processing times from weeks to only a few days.3
Source: Clarke, 2005.
1 See Bigsten et al., 2003; Mengistae and Pattillo, 2004.
2 See De Wulf, 2003; De Wulf and Finateu, 2002.
3 World Bank, 2004.
there, proportionately some of the differences are large.
In Burundi and Uganda, median large firms are twice as
productive as median small firms.
Which dimensions of the investment climate are
associated with these differences in productivity within
country? Figure 8 shows the relative contributions of
the most significant variables, taking into account differ-
ences in capital intensity, firm age, firm ownership, and
sector.The most significant impact is associated with the
control of corruption. Reducing irregular payments and
the discretionary interpretation of regulations by 10 per-
cent is associated with a 2 percent rise in productivity.
Regulations, particularly inefficient delivery of services,
were also important. Improving the efficiency of services
by 10 percent would be associated with a rise in pro-
ductivity of 1 percent.The role of finance was, surpris-
ingly, not always significant. If it was entered on its own,
it did indeed have a large and significant impact on
productivity. However, once all the other dimensions
were included simultaneously, variables such as the share
of financing from formal external sources only remained
significant in certain country groupings (especially
manufacturing-intensive, middle-income, and resource-
rich countries).
Turning to employment growth, a somewhat differ-
ent set of variables is important. In this area, improving
access to finance would have the largest impact. Increasing
by 10 percent the extent to which firms have overdrafts
or use formal external sources to finance investments
would be associated with a 4 percent increase in
employment growth. Improving the availability of
skilled workers had the second biggest impact, followed
by regulations (efficiency of government services), infra-
structure (electricity and transportation), and property
rights (see Figure 9).
It is striking that the objective measures associated
with firms’ reported top constraints are all statistically
significantly associated with firm performance, whether
that is higher productivity or higher employment
growth. (The one exception is tax rates, for which the
Enterprise Survey did not include objective indicators
in all countries.) Access to finance, electricity, regulatory
uncertainty (property rights and consistency of enforce-
ment), and corruption are repeatedly identified as the
key variables impacting performance outcomes.
Does “who you are” affect what matters to you?
The discussion so far has focused on comparisons at the
national level. But the data reveal that there is a great
deal of variation across different types of firms within
countries too. More than export status or ownership, the
size of the firm matters.
41
1.2
: Fr
om
Be
nch
ma
rkin
g t
o I
mp
act
: Id
en
tify
ing
Wh
ich
Dim
en
sio
ns
Ma
tte
r
Box 3: Impact of investment climate issues at the country level (selected countries)
The specific investment climate issues for each country
have been reported in the respective Investment Climate
Assessments, published regularly by the World Bank Group.
The Investment Climate Profiles, which draw on the same
World Bank data, are available at the end of this Report. Here
are some of the highlights for selected countries from different
country groupings.
South Africa has the highest average firm productivity levels.
Production tends to be capital intensive and shows high labor
costs compared with China, Malaysia, and Poland. Labor costs
are disproportionately high for managers. The main investment
climate constraints are lack of skills, macroeconomic instability,
labor regulations, and crime. Exporting firms complain specifi-
cally about the lack of macroeconomic instability, which is
understandable given the extent of the fluctuations of the rand
in recent years. Domestic firms report greater concerns about
the lack of access to and cost of financing. Firms are often
self-reliant, particularly with regard to financing and to training.
The cost of crime is high. In contrast with many other countries
in southern Africa, losses due to power outages are modest and
the cost of power is low. Tax rates are also relatively low, but
costs associated with crime are high. Employment growth for
permanent workers is higher in some specific sectors, mostly in
large firms. The construction sector is expanding significantly,
an indication that there is optimism about South Africa’s
continued prospects.
Kenya has a comparable share to that of China and higher
than India of firms performing above the region’s median level
of value-added per worker. But its labor costs are higher than
both of these countries. And China and India produce the same
value-added per worker with lower levels of capital. Exports
have grown in Kenya, but much of this has been driven by a
few successful firms. It has a well-developed financial sector
and a falling cost of capital. But its interest rate spreads remain
high and there are high transaction costs of capital for smaller
firms, both contributing to relatively low rates of investment.
The main investment climate constraints are corruption, crime,
and infrastructure.
Only 40 percent of Zambia’s firms achieve a level of labor
productivity above the region’s median. It has relatively
capital-intensive industries, about three times higher than its
East African comparators. Nominal wages are low, but they
are offset by low productivity, poorly educated workers, and
costly labor regulation requirements. The main constraints of
investment climate include four elements.
1. The high cost of capital depresses incentives for investment,
especially for smaller firms with no access to microfinance.
The average surveyed firm with a loan paid an annual
interest rate of over 28 percent. It is not uncommon for
collateral requirements to well exceed the value of the
loan being sought.
2. Despite reform, taxation and tax administration continue to
inhibit profitability. The tax burden in Zambia is high relative
to that of comparator countries. Frequent and unpredictable
changes in procedures and badly trained officials with
wide discretionary powers invite corruption and arbitrary
practices.
3. Of the firms in Zambia, 57 percent cite regulatory uncertain-
ty as an important problem, compared with only 28 percent
of Ugandan firms. Inconsistent policies—such as the recent
change in immigration laws requiring all non-Zambians to
renew unexpired permits at high costs—increase firms’
perceived risk in investment.
4. Perceptions of weak law enforcement and fierce corruption
hinder investment. Although 77 percent of Zambian firms
claimed losses from theft or other crimes in the previous
year, less than half of these cases were reported and only
a quarter of these were solved.
Source: World Bank Investment Climate Assessments for the respective
countries, 2002–2006.
Note: For additional examples, please visit http://www1.worldbank.org/
rped/index.asp.
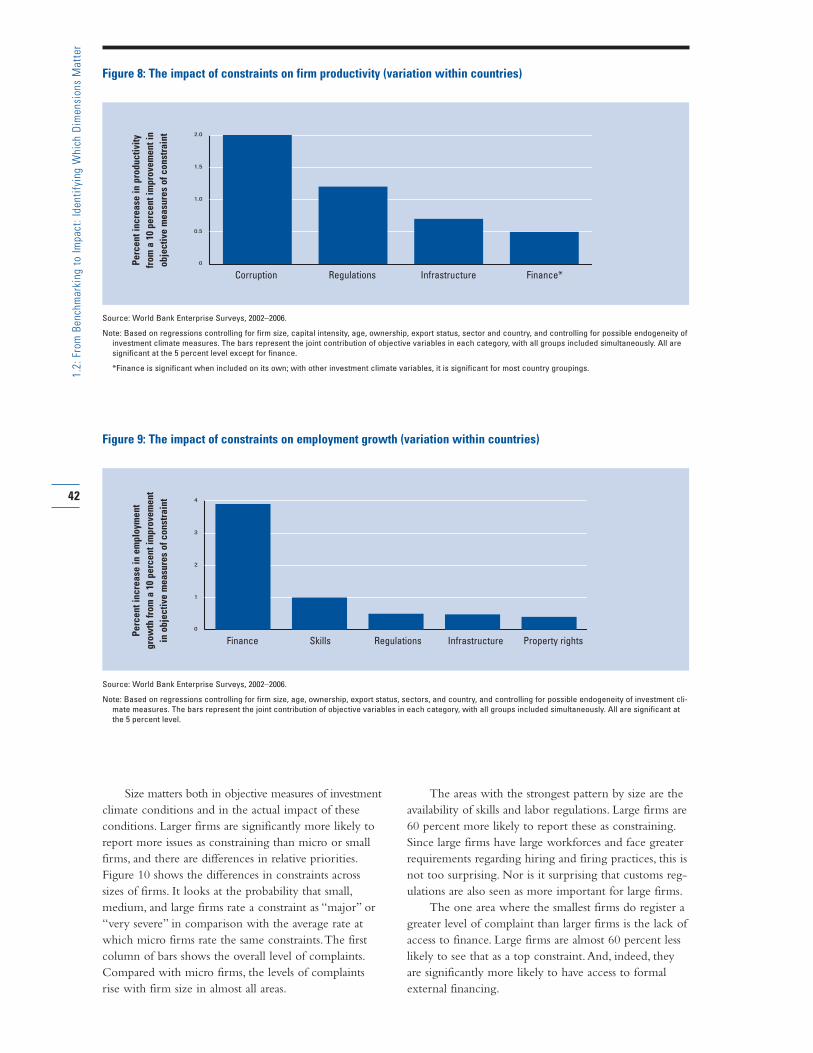
Size matters both in objective measures of investment
climate conditions and in the actual impact of these
conditions. Larger firms are significantly more likely to
report more issues as constraining than micro or small
firms, and there are differences in relative priorities.
Figure 10 shows the differences in constraints across
sizes of firms. It looks at the probability that small,
medium, and large firms rate a constraint as “major” or
“very severe” in comparison with the average rate at
which micro firms rate the same constraints.The first
column of bars shows the overall level of complaints.
Compared with micro firms, the levels of complaints
rise with firm size in almost all areas.
The areas with the strongest pattern by size are the
availability of skills and labor regulations. Large firms are
60 percent more likely to report these as constraining.
Since large firms have large workforces and face greater
requirements regarding hiring and firing practices, this is
not too surprising. Nor is it surprising that customs reg-
ulations are also seen as more important for large firms.
The one area where the smallest firms do register a
greater level of complaint than larger firms is the lack of
access to finance. Large firms are almost 60 percent less
likely to see that as a top constraint.And, indeed, they
are significantly more likely to have access to formal
external financing.
42
1.2
: Fr
om
Be
nch
ma
rkin
g t
o I
mp
act
: Id
en
tify
ing
Wh
ich
Dim
en
sio
ns
Ma
tte
r
0
0.5
1.0
1.5
2.0
Figure 8: The impact of constraints on firm productivity (variation within countries)
Source: World Bank Enterprise Surveys, 2002–2006.
Note: Based on regressions controlling for firm size, capital intensity, age, ownership, export status, sector and country, and controlling for possible endogeneity of
investment climate measures. The bars represent the joint contribution of objective variables in each category, with all groups included simultaneously. All are
significant at the 5 percent level except for finance.
*Finance is significant when included on its own; with other investment climate variables, it is significant for most country groupings.
Corruption Regulations Infrastructure Finance*
Pe
rce
nt
inc
rea
se i
n p
rod
uc
tivi
ty
fro
m a
10
pe
rce
nt
imp
rove
me
nt
in
ob
jec
tive
me
asu
res
of
co
nst
rain
t
0
1
2
3
4
Figure 9: The impact of constraints on employment growth (variation within countries)
Source: World Bank Enterprise Surveys, 2002–2006.
Note: Based on regressions controlling for firm size, age, ownership, export status, sectors, and country, and controlling for possible endogeneity of investment cli-
mate measures. The bars represent the joint contribution of objective variables in each category, with all groups included simultaneously. All are significant at
the 5 percent level.
Finance Skills Regulations Infrastructure Property rights
Pe
rce
nt
inc
rea
se i
n e
mp
loym
en
t
gro
wth
fro
m a
10
pe
rce
nt
imp
rove
me
nt
in o
bje
cti
ve m
ea
sure
s o
f c
on
stra
int
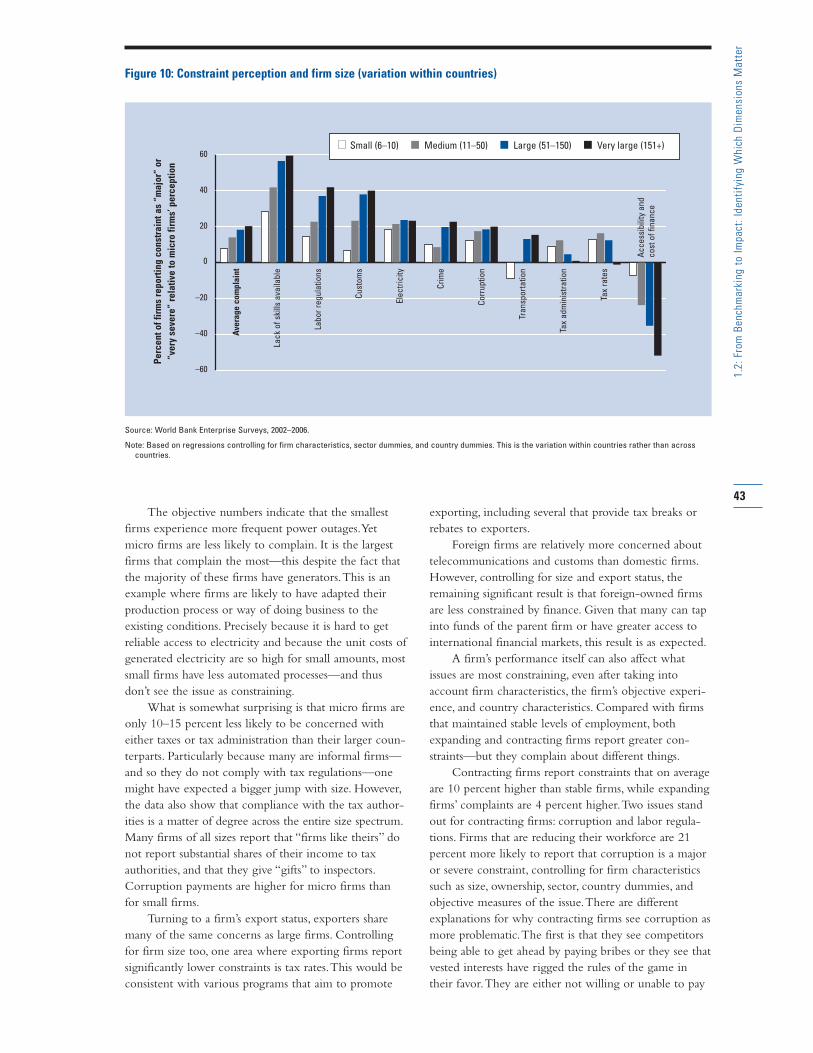
The objective numbers indicate that the smallest
firms experience more frequent power outages.Yet
micro firms are less likely to complain. It is the largest
firms that complain the most—this despite the fact that
the majority of these firms have generators.This is an
example where firms are likely to have adapted their
production process or way of doing business to the
existing conditions. Precisely because it is hard to get
reliable access to electricity and because the unit costs of
generated electricity are so high for small amounts, most
small firms have less automated processes—and thus
don’t see the issue as constraining.
What is somewhat surprising is that micro firms are
only 10–15 percent less likely to be concerned with
either taxes or tax administration than their larger coun-
terparts. Particularly because many are informal firms—
and so they do not comply with tax regulations—one
might have expected a bigger jump with size. However,
the data also show that compliance with the tax author-
ities is a matter of degree across the entire size spectrum.
Many firms of all sizes report that “firms like theirs” do
not report substantial shares of their income to tax
authorities, and that they give “gifts” to inspectors.
Corruption payments are higher for micro firms than
for small firms.
Turning to a firm’s export status, exporters share
many of the same concerns as large firms. Controlling
for firm size too, one area where exporting firms report
significantly lower constraints is tax rates.This would be
consistent with various programs that aim to promote
exporting, including several that provide tax breaks or
rebates to exporters.
Foreign firms are relatively more concerned about
telecommunications and customs than domestic firms.
However, controlling for size and export status, the
remaining significant result is that foreign-owned firms
are less constrained by finance. Given that many can tap
into funds of the parent firm or have greater access to
international financial markets, this result is as expected.
A firm’s performance itself can also affect what
issues are most constraining, even after taking into
account firm characteristics, the firm’s objective experi-
ence, and country characteristics. Compared with firms
that maintained stable levels of employment, both
expanding and contracting firms report greater con-
straints—but they complain about different things.
Contracting firms report constraints that on average
are 10 percent higher than stable firms, while expanding
firms’ complaints are 4 percent higher.Two issues stand
out for contracting firms: corruption and labor regula-
tions. Firms that are reducing their workforce are 21
percent more likely to report that corruption is a major
or severe constraint, controlling for firm characteristics
such as size, ownership, sector, country dummies, and
objective measures of the issue.There are different
explanations for why contracting firms see corruption as
more problematic.The first is that they see competitors
being able to get ahead by paying bribes or they see that
vested interests have rigged the rules of the game in
their favor.They are either not willing or unable to pay
43
1.2
: Fr
om
Be
nch
ma
rkin
g t
o I
mp
act
: Id
en
tify
ing
Wh
ich
Dim
en
sio
ns
Ma
tte
r
–60
–40
–20
0
20
40
60
Figure 10: Constraint perception and firm size (variation within countries)
Source: World Bank Enterprise Surveys, 2002–2006.
Note: Based on regressions controlling for firm characteristics, sector dummies, and country dummies. This is the variation within countries rather than across
countries.
Ave
rag
e c
om
pla
int
Lac
k o
f sk
ills
ava
ilab
le
Lab
or
reg
ula
tio
ns
Cu
sto
ms
Ele
ctr
icit
y
Cri
me
Co
rru
pti
on
Tra
nsp
ort
ati
on
Tax
ad
min
istr
ati
on
Tax
rate
s
Ac
ce
ssib
ility
an
d
co
st o
f fi
na
nc
e
Pe
rce
nt
of
firm
s re
po
rtin
g c
on
stra
int
as
“ma
jor”
or
“ve
ry s
eve
re”
rela
tive
to
mic
ro f
irm
s’ p
erc
ep
tio
n
� Small (6–10) � Medium (11–50) � Large (51–150) � Very large (151+)
to secure these benefits, and so they are not able to
thrive in this environment—and identify the corrupt
system as being in part to blame. Second, the potential
benefits to a firm of paying bribes are not the ones of
greatest importance to declining firms. If bribes are
intended as speed money to obtain licenses or govern-
ment services, these may be more beneficial to expanding
than contracting firms. So corruption is more of a cost
without a benefit.A third explanation is that officials
may seek out declining firms for additional payments.
These firms are likely to be less well positioned to seek
recourse, and so may reinforce the firm’s decline.
Contracting firms are also 19.5 percent more likely to
report labor regulations as a major or severe constraint.
As many labor regulations aim to protect workers and
often restrict a firm’s ability to fire people, this is not
surprising.
In contrast, firms that are expanding and hiring
workers see the lack of finance and crime as key con-
straints. Expanding firms are 10 percent more likely to
report finance as a major constraint, even though most
of these firms do have access to some external finance.
The fact that the issues that constrain expanding firms
are not always the same that constrain contracting firms
reinforces the message that priorities can vary by who
you are.
Does the impact of objective measures also vary by “who
you are”?
That subjective rankings of constraints can vary by who
you are—for example, small or large firms—could be
the result of differences in the objective conditions faced
by different firms, or could be because the same condi-
tion has differential effects by type of firm.This section
tests for the latter effects.There is some evidence for this
differential effect in terms of corruption and property
rights, although less so for finance and infrastructure.
The results are more pronounced in their effect on
employment growth than on productivity.
Lessening regulatory burdens, including the time
spent with officials, are associated with higher growth,
particularly for small firms.These interactions could be
providing openings for bribes—and indeed the impact
of corruption is greater on small firms. It could also be
that officials are more likely to be providing beneficial
services to larger firms. Consistent with this too is the
importance of strengthening property rights. Such
reforms would benefit all firms, but particularly the
smallest firms.
Greater access to finance and reliable infrastructure
helps all firms. Smaller firms report less access to reliable
services. Looking at individual measures of infrastruc-
ture, the same improvement in electricity would have an
additional impact on smaller firms, but the effect is only
1 percent of employment growth.
Within finance, the effects vary somewhat over
sources of finance. For micro firms, access to an over-
draft accounts for much of its boost to employment
growth. For larger firms, there is an additional boost of
3 percent to employment growth based on access to
formal loans. Overall, smaller firms do complain more
about access to finance as an obstacle to the growth of
their firm.As they are significantly less likely to have
access to external finance and finance is positively asso-
ciated with employment growth, improving access to
finance will benefit the smaller firms the most.
Conclusion
The factors that firms report as being constraining are
indeed those that have the greatest impact on productiv-
ity and job growth.Access to finance is the top con-
straint overall.Across countries this variable is strongly
associated with higher productivity, while the effect
within country is stronger for employment growth.
Infrastructure ranks as the second constraint. It is highly
correlated with employment growth, across and within
countries, and also affects productivity within countries.
Property rights are also correlated with employment
growth, particularly for smaller firms.
The results of the Enterprise Surveys also confirm
that the prescriptions are not universal.Top constraints
vary by country (see the Investment Climate Profiles in
Part 2.2) and they vary within country by firm charac-
teristics and by a firm’s performance. Unreliable or cost-
ly infrastructure is particularly constraining in land-
locked countries, where it hampers access to markets,
and in countries with greater concentration of manufac-
turing exports, where timely delivery is increasingly
important.A more-developed financial system and con-
sistent regulations are associated with better outcomes,
particularly in lower-income countries.And addressing
skills and improving access to finance are most helpful
to expanding firms, while labor regulations and corrup-
tion are most constraining to contracting firms.
Notes1 Eifert et al. 2005.
2 World Bank 2004.
3 The chapter looks at two measures of productivity. Labor productivity
is value-added per worker, while total factor productivity also con-
trols for the capital intensity of production. The figures in the
chapter that illustrate outcomes across country use the simpler
labor productivity. However, the variations within country look at
total factor productivity.
4 Bosworth and Collins 2003, p. 122.
5 Ndulu et al. 2007, p.50.
6 Labor productivity is measured as value-added per worker. As pro-
ductivity can vary by firm size and the size distribution varies
across country samples, this chart is restricted to small and medi-
um sized firms between 10 and 150 employees. It does not
weight country samples, but treats each observation equally.
Figures are converted to 2005 US dollars. Note that the choice of
base year can affect the results of countries with volatile
exchange rates, such as South Africa.
44
1.2
: Fr
om
Be
nch
ma
rkin
g t
o I
mp
act
: Id
en
tify
ing
Wh
ich
Dim
en
sio
ns
Ma
tte
r
7 The results are based on the survey samples. If census data were
available, these proportions could be estimated more precisely.
8 Some of these differences can be the result of differences in sam-
pling. The guidelines for sampling were the same for all countries.
However, in some cases the available population frame had differ-
ent size cutoffs (that is, firms had a minimum of 5, 10, or 20
employees), or the key sectors selected had slightly different size
distribution of firms. How recently the sampling frame was con-
structed also had some impact, as smaller firms were more likely
to move or close down. The figures in this chapter are restricted
to firms in the 11–150 employee range to improve comparability.
9 For many small business owners, these microenterprises are not the
start of an ambitious entrepreneurial endeavor, but rather repre-
sent the only opportunity available. And, because many of them
would face increased costs of complying with regulations if they
were to expand in size, it is natural that employment growth is
lower among these firms.
10 On the technical side, the representativeness of the respondents is
important. It should be noted that although firms were randomly
selected, the size distribution of firms does vary slightly across
countries because of differences in available sample frames. To
ensure that the size distribution is not driving results, most of the
cross-country comparisons use only small and medium firms.
11 A fourth dimension of aggregate indicators (for example, inflation,
trade openness, and so on) was also added at this stage, but
received the lowest weighting.
12 See www.freedomhouse.org/.
13 One potential concern is the extent of reverse causation: that it is
the firm’s performance that determines the investment climate
condition. For many of the issues this is improbable, but for some
it is a possibility. For example, measures of regulatory burden,
corruption, and finance could all be affected by how well the firm
is doing. More-productive firms should face an easier time
accessing finance. The effect on corruption could actually go
either way—officials could target better performing firms as they
are on the radar screen and would have a greater ability to pay,
but they could also have greater recourse against such officials.
To control for possible endogeneity, investment climate conditions
are averaged by firm size-sector-location. This approach makes
the indicator exogenous to the particular firm while representing
the broader environment in which it operates. This is equivalent
to using size-sector-location dummies as instruments. The test of
over-identifying restrictions shows one cannot reject their validity
as instruments.
Another potential concern is omitted variable bias. The results
shown here control for all the investment climate variables simul-
taneously. The variables cover many dimensions of the broader
investment climate, making it less likely that a significant variable
is omitted. The variables are all jointly significant at the 1 percent
level.
ReferencesBigsten, A. and M. Soderbom. 2006. “What Have We Learnt from a
Decade of Manufacturing Enterprise Surveys in Africa?” World
Bank Research Observer 26: 241–65.
Bigsten, A., P. Collier, S. Dercon, M. Fafchamps, B. Gauthier, J. W.
Gunning, A. Oduro, R. Oostendorp, C. Patillo, M. Söderbom, and
A. Zeufack. 2003. “Credit Constraints in Manufacturing
Enterprises in Africa.” Journal of African Economies 12: 104–25.
Bosworth, B. and S. Collins. 2003. “ The Empirics of Growth: An
Update.” Brookings Papers on Economic Activity Issue 2:
113–206.
Carlin, W., M. Schaffer, and P. Seabright. 2006. “What Are the Real
Bottlenecks? A Lagrangian Approach to Identifying Constraints on
Growth from Survey Data.” CEPR Discussion Paper No. 5719.
London: Center for Economic Policy Research.
Clarke, G.R.G. 2005. “Beyond Tariffs and Quotas: Why Don’t African
Manufacturers Export More?” World Bank Policy Research
Working Paper 3617. Washington, DC: World Bank.
De Wulf, L. 2003. “Uganda: Issues and Lessons in Customs Reforms.”
Washington, DC: World Bank.
De Wulf L. and E. Finateu. 2002. ”Best Practices in Customs
Administrative Reform —-Lessons from Morocco.” World Bank
PREM Note 67. Washington, DC: World Bank.
Dollar, D., M. Hallward-Driemeier, and T. Mengistae. 2005. “Investment
Climate and Firm Performance in Developing Countries.”
Economic Development and Cultural Change 54 (1):1–31.
Eigert, B., A.Gelb, and V. Ramachandran. 2005. “Business Environment
and Comparative Advantage in Africa: Evidence from the
Investment Climate Data.” Center for Global Development
Working Paper 56. Washington, DC.
Honohan P. and T. Beck. 2007. Making Finance Work for Africa.
Washington, DC: World Bank.
Mengistae T. and C. Pattillo. 2004. ”Export Orientation and Productivity
in Sub-Saharan Africa.” International Monetary Fund Staff Papers
51 (2): 327–53.
Ndulu, B., L. Chakraborti, L. Lijane, V. Ramachandran, and J. Wolgin,
2007. “Challenges of African Growth: Opportunities, Constraints
and Strategic Direction.” Washington, DC: The International Bank
for Reconstruction and Development/World Bank.
Söderbom, M. and F. Teal. 2004. “Size and Efficiency in African
Manufacturing Firms: Evidence from Firm-Level Panel Data.”
Journal of Development Economics 73: 369–94.
Van Biesebroeck, J. 2005. “Firm Size Matters: Growth and Productivity
Growth in African Manufacturing.” Economic Development and
Cultural Change 53 (3): 545–83.
World Bank. Various years. Investment Climate Assessments.
http://www1.worldbank.org/rped/index.asp.
———. 2000. Can Africa Claim the 21st Century? Washington, DC:
World Bank.
———. 2004. The World Development Report 2005: A Better
Investment Climate for Everyone. New York: Oxford University
Press.
———. 2006. Doing Business 2007: How to Reform. Washington, DC:
World Bank.
45
1.2
: Fr
om
Be
nch
ma
rkin
g t
o I
mp
act
: Id
en
tify
ing
Wh
ich
Dim
en
sio
ns
Ma
tte
r
From Talk to Walk: Ideas to Optimize Development Impact Report of the Task Force on Capacity for Program Delivery: A Clinton Global Initiative Commitment By Dalberg Development Advisors Section 2.6 - Improving Delivery in Enterprise Financing (Full report can be found at www.dalberg.com/pdfs/taskforce)
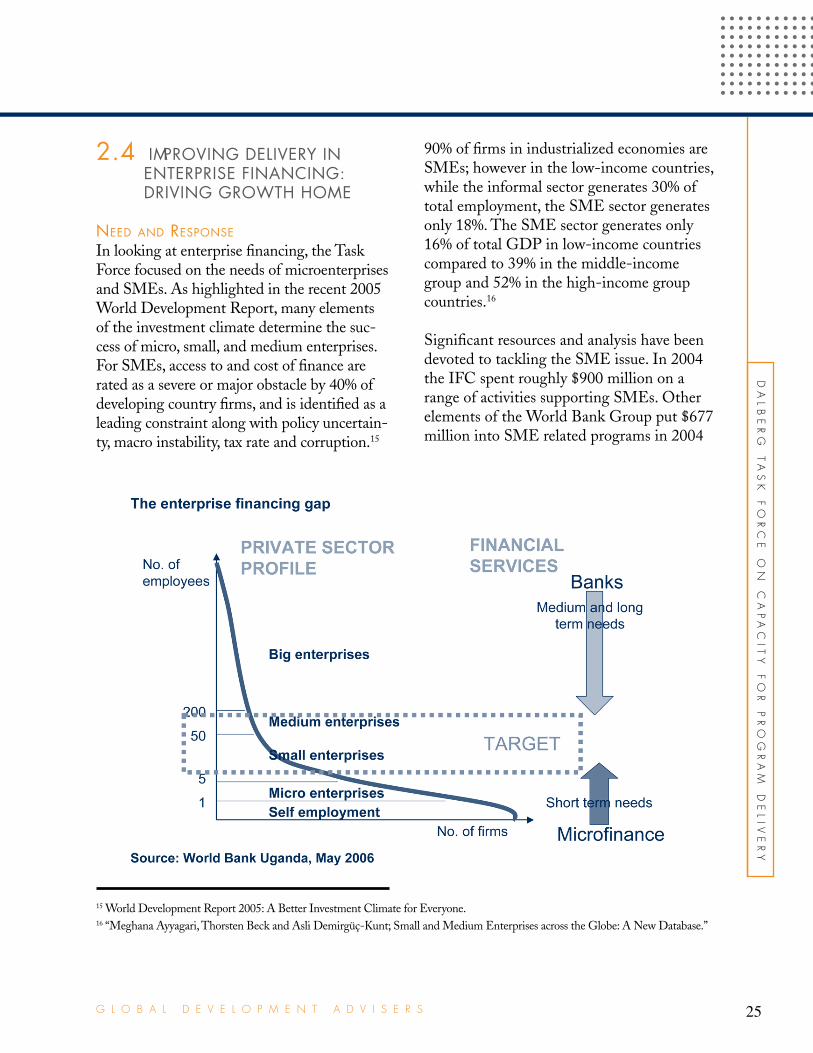
...................................................................................................
DA
LB
ER
G
TA
SK
F
OR
CE
O
N
CA
PA
CIT
Y
FO
R
PR
OG
RA
M
DE
LIV
ER
Y
25G L O B A L D E V E L O P M E N T A D V I S E R S
2.4 IMPROVING DELIVERY IN
ENTERPRISE FINANCING:
DRIVING GROWTH HOME
NEED AND RESPONSE
In looking at enterprise financing, the Task Force focused on the needs of microenterprises and SMEs. As highlighted in the recent 2005 World Development Report, many elements of the investment climate determine the suc-cess of micro, small, and medium enterprises. For SMEs, access to and cost of finance are rated as a severe or major obstacle by 40% of developing country firms, and is identified as a leading constraint along with policy uncertain-ty, macro instability, tax rate and corruption.15
90% of firms in industrialized economies are SMEs; however in the low-income countries, while the informal sector generates 30% of total employment, the SME sector generates only 18%. The SME sector generates only 16% of total GDP in low-income countries compared to 39% in the middle-income group and 52% in the high-income group countries.16
Significant resources and analysis have been devoted to tackling the SME issue. In 2004 the IFC spent roughly $900 million on a range of activities supporting SMEs. Other elements of the World Bank Group put $677 million into SME related programs in 2004
15 World Development Report 2005: A Better Investment Climate for Everyone.16 “Meghana Ayyagari, Thorsten Beck and Asli Demirgüç-Kunt; Small and Medium Enterprises across the Globe: A New Database.”
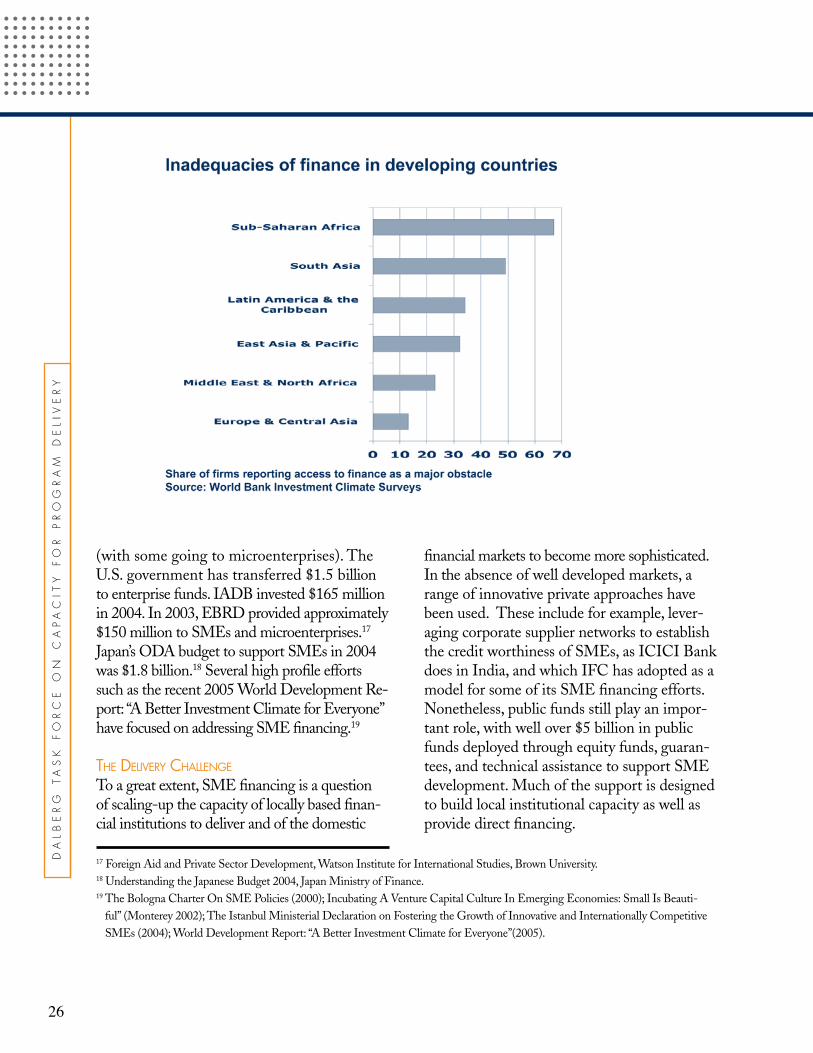
26
...................................................................................................
DA
LB
ER
G
TA
SK
F
OR
CE
O
N
CA
PA
CIT
Y
FO
R
PR
OG
RA
M
DE
LIV
ER
Y
financial markets to become more sophisticated. In the absence of well developed markets, a range of innovative private approaches have been used. These include for example, lever-aging corporate supplier networks to establish the credit worthiness of SMEs, as ICICI Bank does in India, and which IFC has adopted as a model for some of its SME financing efforts. Nonetheless, public funds still play an impor-tant role, with well over $5 billion in public funds deployed through equity funds, guaran-tees, and technical assistance to support SME development. Much of the support is designed to build local institutional capacity as well as provide direct financing.
(with some going to microenterprises). The U.S. government has transferred $1.5 billion to enterprise funds. IADB invested $165 million in 2004. In 2003, EBRD provided approximately $150 million to SMEs and microenterprises.17
Japan’s ODA budget to support SMEs in 2004 was $1.8 billion.18 Several high profile efforts such as the recent 2005 World Development Re-port: “A Better Investment Climate for Everyone” have focused on addressing SME financing.19
THE DELIVERY CHALLENGE
To a great extent, SME financing is a question of scaling-up the capacity of locally based finan-cial institutions to deliver and of the domestic
17 Foreign Aid and Private Sector Development, Watson Institute for International Studies, Brown University.18 Understanding the Japanese Budget 2004, Japan Ministry of Finance.19 The Bologna Charter On SME Policies (2000); Incubating A Venture Capital Culture In Emerging Economies: Small Is Beauti-
ful” (Monterey 2002); The Istanbul Ministerial Declaration on Fostering the Growth of Innovative and Internationally Competitive
SMEs (2004); World Development Report: “A Better Investment Climate for Everyone”(2005).
28
...................................................................................................
DA
LB
ER
G
TA
SK
F
OR
CE
O
N
CA
PA
CIT
Y
FO
R
PR
OG
RA
M
DE
LIV
ER
Y
A conservative estimate of the finance gap in Africa suggests that at least $35 billion is needed simply to serve the needs of current SMEs. If SMEs constituted appropriate levels of their country’s GDP, the finance gap becomes significantly larger. While lo-cal capacity and investment environment is the backbone of SME growth, international investment serves to further address the financing gap. The key issues associated with increasing access to SME finance are related to (i) slow disbursement of capital; (ii) high fund management and transaction costs; and (iii) limited/untapped local management and technical capacity.20
THE OPPORTUNITY: THE POTENTIAL IMPACT OF AD-
DRESSING A POORLY FUNCTIONING SUPPLY CHAIN
While a development supply chain lens is not intended to address all elements of busi-ness climate, the approach of raising issues of cost, speed, and accountability highlights key opportunities to increase disbursement, reduce management costs, and develop capacity. The chart on the following page summarizes the nature and potential impact of the opportunity by supply chain phase.
Our approach enabled us to both diagnose barriers to successfully delivering on the promise of poverty alleviation through de-velopment focused enterprise financing, and to identify practical and sustainable solu-tions to overcome these barriers.
Our analysis identified reducing fund man-agement costs as a critical challenge, and thus we focused on opportunities to reduce the costs of serving SMEs which require investments between $10,000 and $1 mil-lion. Efforts such as the Shell Foundation supported GroFin in Africa seek to use an integrated model to deploy risk capital under $1 million per company. By develop-ing a core support team leveraged by strong local investment teams, GroFin seeks to reduce the management costs for under $1 million investments, at the same time providing a skills base to local talent. Like-wise, Small Enterprise Assistance Funds (SEAF) seeks to build the skills of local management talent by supporting educa-tional programs. TechnoServe engages its resources to provide hands on support and mentorship to entrepreneurs in developing countries. Endeavor focuses on identifying and cultivating high impact entrepreneurs. E+Co, a non-profit with nine offices serv-ing over thirty developing countries, has pioneered investing in over 120 clean energy enterprises by providing services and capital. Scaling efforts like these is the beginning of an approach to address key issues high-lighted in the sector.
POTENTIAL SOLUTIONS
These recommendations are limited to those identified through the functional lens of the SME funding supply chain. A salient feature of this approach is the highlighting
20 “Unleashing Entrepreneurship,” UN Commission on the Private Sector & Development, 2004.
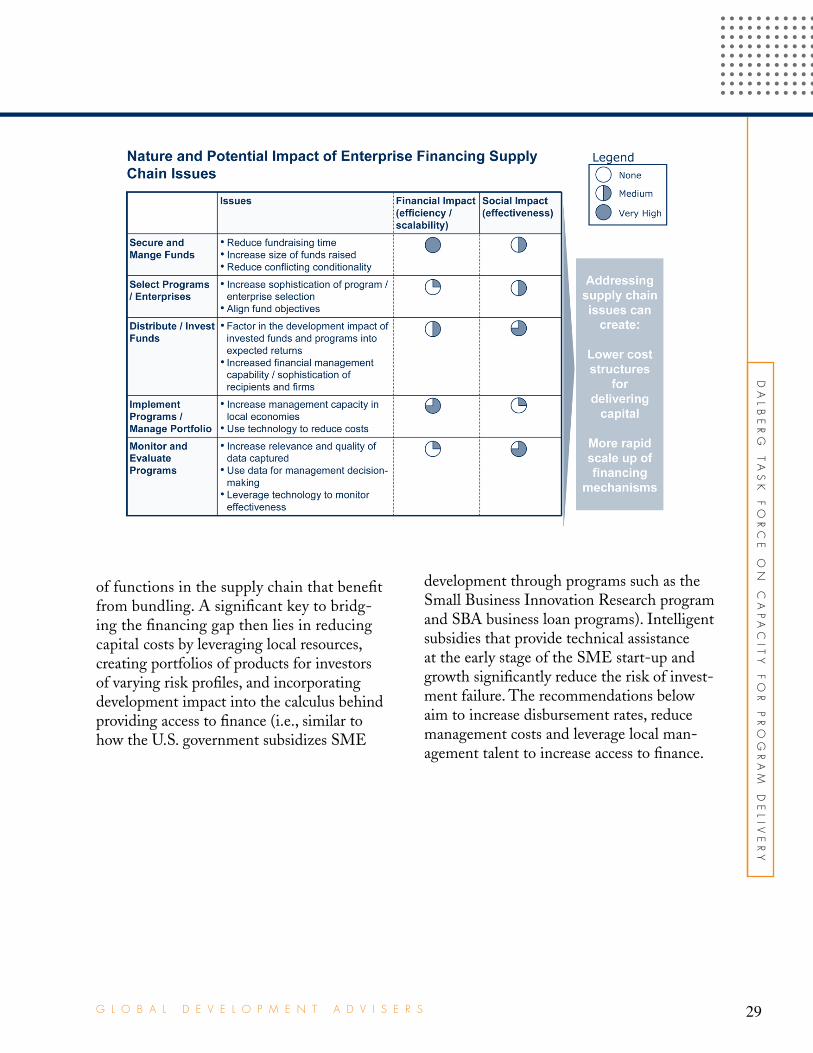
...................................................................................................
DA
LB
ER
G
TA
SK
F
OR
CE
O
N
CA
PA
CIT
Y
FO
R
PR
OG
RA
M
DE
LIV
ER
Y
29G L O B A L D E V E L O P M E N T A D V I S E R S
of functions in the supply chain that benefit from bundling. A significant key to bridg-ing the financing gap then lies in reducing capital costs by leveraging local resources, creating portfolios of products for investors of varying risk profiles, and incorporating development impact into the calculus behind providing access to finance (i.e., similar to how the U.S. government subsidizes SME
development through programs such as the Small Business Innovation Research program and SBA business loan programs). Intelligent subsidies that provide technical assistance at the early stage of the SME start-up and growth significantly reduce the risk of invest-ment failure. The recommendations below aim to increase disbursement rates, reduce management costs and leverage local man-agement talent to increase access to finance.
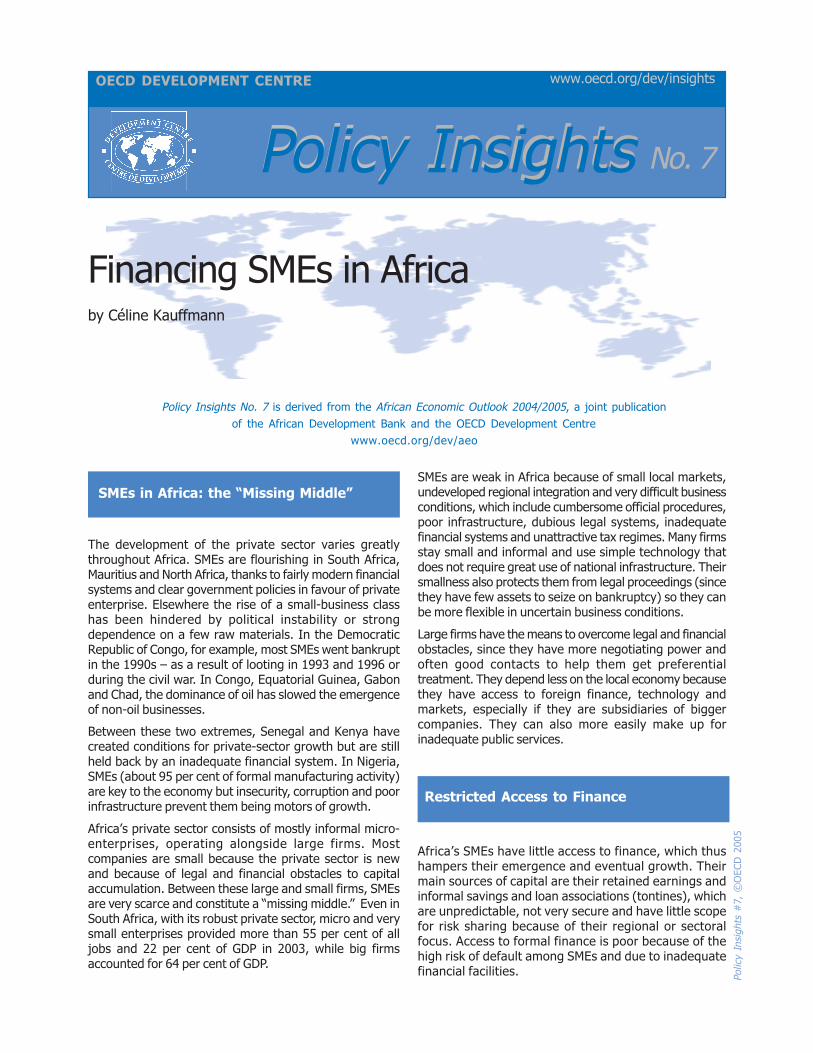
Polic
y In
sights
#7,
©O
ECD
2005
Financing SMEs in Africa
OECD DEVELOPMENT CENTRE www.oecd.org/dev/insights
No. 7Policy InsightsPolicy Insights
Policy Insights No. 7 is derived from the African Economic Outlook 2004/2005, a joint publication
of the African Development Bank and the OECD Development Centre
www.oecd.org/dev/aeo
by Céline Kauffmann
The development of the private sector varies greatlythroughout Africa. SMEs are flourishing in South Africa,Mauritius and North Africa, thanks to fairly modern financialsystems and clear government policies in favour of privateenterprise. Elsewhere the rise of a small-business classhas been hindered by political instability or strongdependence on a few raw materials. In the DemocraticRepublic of Congo, for example, most SMEs went bankruptin the 1990s – as a result of looting in 1993 and 1996 orduring the civil war. In Congo, Equatorial Guinea, Gabonand Chad, the dominance of oil has slowed the emergenceof non-oil businesses.
Between these two extremes, Senegal and Kenya havecreated conditions for private-sector growth but are stillheld back by an inadequate financial system. In Nigeria,SMEs (about 95 per cent of formal manufacturing activity)are key to the economy but insecurity, corruption and poorinfrastructure prevent them being motors of growth.
Africa’s private sector consists of mostly informal micro-enterprises, operating alongside large firms. Mostcompanies are small because the private sector is newand because of legal and financial obstacles to capitalaccumulation. Between these large and small firms, SMEsare very scarce and constitute a “missing middle.” Even inSouth Africa, with its robust private sector, micro and verysmall enterprises provided more than 55 per cent of alljobs and 22 per cent of GDP in 2003, while big firmsaccounted for 64 per cent of GDP.
SMEs are weak in Africa because of small local markets,undeveloped regional integration and very difficult businessconditions, which include cumbersome official procedures,poor infrastructure, dubious legal systems, inadequatefinancial systems and unattractive tax regimes. Many firmsstay small and informal and use simple technology thatdoes not require great use of national infrastructure. Theirsmallness also protects them from legal proceedings (sincethey have few assets to seize on bankruptcy) so they canbe more flexible in uncertain business conditions.
Large firms have the means to overcome legal and financialobstacles, since they have more negotiating power andoften good contacts to help them get preferentialtreatment. They depend less on the local economy becausethey have access to foreign finance, technology andmarkets, especially if they are subsidiaries of biggercompanies. They can also more easily make up forinadequate public services.
Africa’s SMEs have little access to finance, which thushampers their emergence and eventual growth. Theirmain sources of capital are their retained earnings andinformal savings and loan associations (tontines), whichare unpredictable, not very secure and have little scopefor risk sharing because of their regional or sectoralfocus. Access to formal finance is poor because of thehigh risk of default among SMEs and due to inadequatefinancial facilities.
SMEs in Africa: the “Missing Middle”
Restricted Access to Finance
No. 14
www.oecd.org/dev/insights Policy Insights, No. 7, May 2005
22222
Polic
y In
sights
#7,
©O
ECD
2005
Small business in Africa can rarely meet the conditions setby financial institutions, which see SMEs as a risk becauseof poor guarantees and lack of information about theirability to repay loans. The financial system in most of Africais under-developed however and so provides few financialinstruments. Capital markets are in their infancy,shareholding is rare and no long-term financing is availablefor SMEs. Non-bank financial intermediaries, such as micro-credit institutions, could be a big help in lending money tothe smallest SMEs but they do not have the resources tofollow up their customers when they expand.
Improving business conditions, boosting the capacity ofSMEs, expanding the financial sector and strengtheninglinks between firms will permanently increase SMEs’ accessto finance.
Improving business conditions
Proper information, a key to deciding whether to make aloan, would be helped by adopting clear accountingstandards, setting up independent, competent and reputableaccounting firms and creating more credit bureauxsupplying data on the solvency of firms.
An impartial legal system that can help settle contractdisputes, commercial law reform and drafting and clarifyingland titles, as well as effective bankruptcy procedures, arevital for growth of the business sector.
A country’s tax laws can either coax small businesses intothe formal sector of the economy or keep them out of it.Governments should also make sure that they pay SMEspromptly, since public contracts are vital to the financialsecurity of these firms.
Helping SMEs meet the requirementsof formal financing
Apart from the need to boost SME capacities, some financialinstruments can help provide missing information or reducethe risk stemming from some SMEs’ lack of transparency.Franchising, which is very popular in Southern and EastAfrica with the encouragement of South Africa, allows useof a brand name or know-how that reduces the risk offailure. Warehouse-receipt financing (in South Africa, Kenyaand Zambia) guarantees loans with agricultural stocks.Other financial instruments, such as leasing and factoring,can reduce risk effectively for credit institutions but arestill little used in Africa.
Credit associations that reduce risk by sharing it are morecommon. They help financial institutions choose to whomto lend, by guaranteeing the technical viability of projects,
and sometimes providing guarantees. But growth of thesebodies is limited by the lack of organisation among SMEsin Africa and by their focus on certain sectors andgeographical areas.
Governments and donor sources have thus preferred creationof guarantee funds to ensure repayment in case of default.In several countries, especially in Central Africa, this hasnot worked since provision of a guarantee has meant lessrigorous choice of investment projects and a lower rate ofdebt recovery. Elsewhere, notably in Mozambique, borrowersand financial institutions have worked together to maintaina good rate of recovery and to reduce interest rates.
Making the financial system more accessibleto SMEs
Most African financial systems are fragmented. The“missing middle” in the pattern of size of firm is matchedby one in the range of financing available. Lack of fundingfor SMEs has partly been made up for by micro-creditinstitutions, whose growth is due to the flexible loans theyoffer small businesses. In Angola, Novobanco provides loansfree of bank charges, without a minimum deposit and withinformal guarantees (property assets and a guarantor),as well as permanent contact with loan managers. Thoughadapted to local needs, however, micro-credit institutionsremain fragile and modest-sized.
As well as lacking trained staff, micro-credit institutionsface limited expansion because of their limited funds. Theirmainly short-term finance means they cannot easily turnthe savings they collect into medium or long-term loans.They are also up against the cost of refinancing throughthe formal banking sector and have no access to refinancingeither by the central bank or by venture capital. Micro-credit institutions could be put on a firmer financial footingby developing and adapting long-term savings products thatexist elsewhere, such as life insurance and home-savingplans, and encouraging the setting up of specialisedrefinance banks such as Mali’s “solidarity bank” (Banquemalienne de solidarité), or working more closely with theformal banking sector (Benin’s SME support organisationPAPME and the local Bank of Africa).
Some countries (such as Kenya) have dealt with the lack offunding by supporting growth of smaller commercial banksor (in Ghana) of rural banks, so as to bring traditional banksand SMEs closer geographically and business-wise. SouthAfrica passed two laws in early 2005 to expand the bankingsystem to include savings and loan institutions (second-tierbanks) and co-operative banks (third-tier banks) while easingbanking regulations so the newcomers could still be flexiblein providing loans. In many countries, commercial banksare also setting up their own micro-credit services.
Removing the obstacles to access for SMEs’ to financerequires that commercial banks, micro-credit institutions,community groups and business development services
Increasing SME Access to Finance: A FourPronged Approach
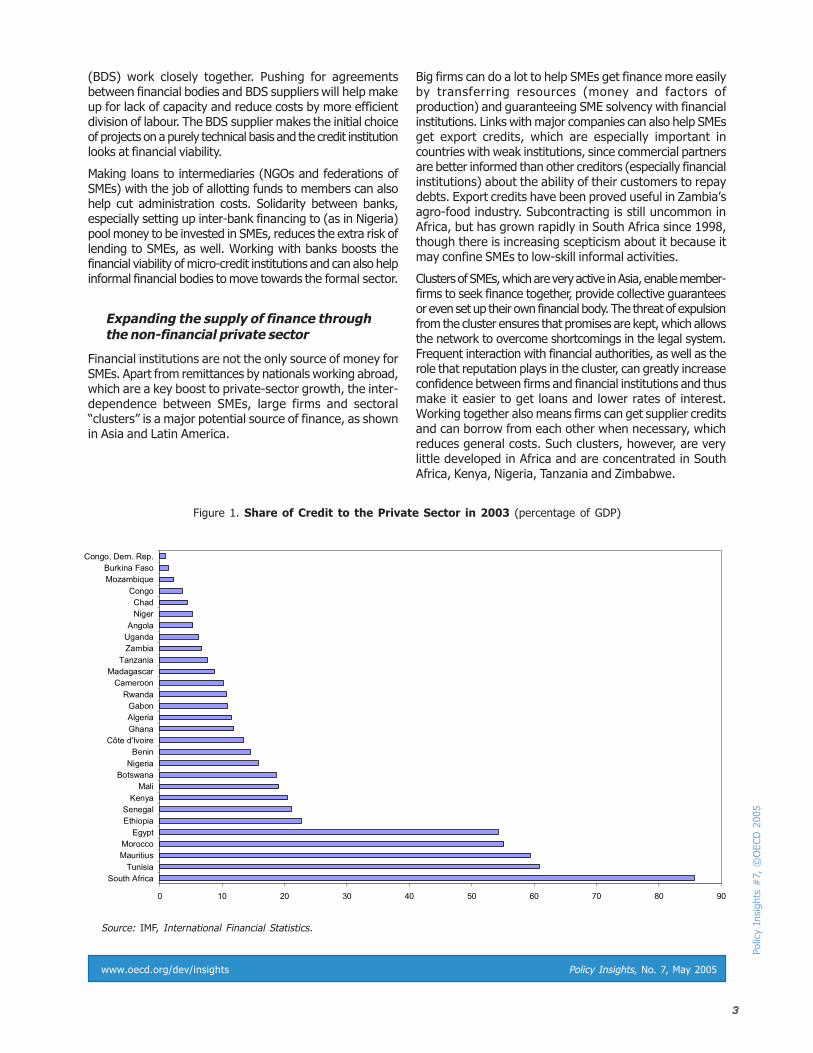
January 2004
OECD Development Centre Policy Insights, No. 1, March 2004 33333
www.oecd.org/dev/insights Policy Insights, No. 7, May 2005
Polic
y In
sights
#7,
©O
ECD
2005
(BDS) work closely together. Pushing for agreementsbetween financial bodies and BDS suppliers will help makeup for lack of capacity and reduce costs by more efficientdivision of labour. The BDS supplier makes the initial choiceof projects on a purely technical basis and the credit institutionlooks at financial viability.
Making loans to intermediaries (NGOs and federations ofSMEs) with the job of allotting funds to members can alsohelp cut administration costs. Solidarity between banks,especially setting up inter-bank financing to (as in Nigeria)pool money to be invested in SMEs, reduces the extra risk oflending to SMEs, as well. Working with banks boosts thefinancial viability of micro-credit institutions and can also helpinformal financial bodies to move towards the formal sector.
Expanding the supply of finance throughthe non-financial private sector
Financial institutions are not the only source of money forSMEs. Apart from remittances by nationals working abroad,which are a key boost to private-sector growth, the inter-dependence between SMEs, large firms and sectoral“clusters” is a major potential source of finance, as shownin Asia and Latin America.
Big firms can do a lot to help SMEs get finance more easilyby transferring resources (money and factors ofproduction) and guaranteeing SME solvency with financialinstitutions. Links with major companies can also help SMEsget export credits, which are especially important incountries with weak institutions, since commercial partnersare better informed than other creditors (especially financialinstitutions) about the ability of their customers to repaydebts. Export credits have been proved useful in Zambia’sagro-food industry. Subcontracting is still uncommon inAfrica, but has grown rapidly in South Africa since 1998,though there is increasing scepticism about it because itmay confine SMEs to low-skill informal activities.
Clusters of SMEs, which are very active in Asia, enable member-firms to seek finance together, provide collective guaranteesor even set up their own financial body. The threat of expulsionfrom the cluster ensures that promises are kept, which allowsthe network to overcome shortcomings in the legal system.Frequent interaction with financial authorities, as well as therole that reputation plays in the cluster, can greatly increaseconfidence between firms and financial institutions and thusmake it easier to get loans and lower rates of interest.Working together also means firms can get supplier creditsand can borrow from each other when necessary, whichreduces general costs. Such clusters, however, are verylittle developed in Africa and are concentrated in SouthAfrica, Kenya, Nigeria, Tanzania and Zimbabwe.
0 10 20 30 40 50 60 70 80 90
South Africa
Tunisia
Mauritius
Morocco
Egypt
Ethiopia
Senegal
Kenya
Mali
Botswana
Nigeria
Benin
Côte d'Ivoire
Ghana
Algeria
Gabon
Rwanda
Cameroon
Madagascar
Tanzania
Zambia
Uganda
Angola
Niger
Chad
Congo
Mozambique
Burkina Faso
Congo, Dem. Rep.
Figure 1. Share of Credit to the Private Sector in 2003 (percentage of GDP)
Source: IMF, International Financial Statistics.
No. 14
www.oecd.org/dev/insights Policy Insights, No. 7, May 2005
44444
Policy
Insi
ghts
#7,
©O
ECD
2005
Development Centre Policy Insightswww.oecd.org/dev/insights
Development Centre Policy Briefswww.oecd.org/dev/briefs
Development Centre Working Paperswww.oecd.org/dev/wp
Readers are encouraged to quote or reproduce material from OECDDevelopment Centre Policy Insights for their own publications. Inreturn, the Development Centre requests due acknowledgementand a copy of the publication. Full text of Policy Insights and moreinformation on the Centre and its work are available on its web site:www.oecd.org/dev
OECD Development Centre ”Le Seine St Germain”12 boulevard des Iles
92130 Issy-les-Moulineaux, FranceTel: 33 (0)1 45.24.82.00
Fax: 33 (0)1 44.30.61.49
E-mail: [email protected]
The opinions expressed in this paper are those of the author and do not necessarily reflect those of the OECD,
the Development Centre or their member countries.
Facts about SMEs in Africa
Very few countries have working definitions of SMEs, except some members of UEMOA/WAEMU and Mauritius andMorocco. So data on this is hard to compare, though patterns can be seen and countries can be ranked by extent ofSME activity:
• Nearly 80 per cent of firms in Congo have fewer than five workers. The country has 2 100 firms in the formal and10 000 in the informal sector.
• A 1997 survey in Benin showed that of the 666 SMEs counted, half were in commerce and the rest were mostlyin construction, or were pharmacies and restaurants. Only 17 per cent were in manufacturing.
• SMEs in Kenya employed some 3.2 million people in 2003 and accounted for 18 per cent of national GDP.
• SMEs in Senegal contribute about 20 per cent of national value-added.
• Nigerian SMEs account for some 95 per cent of formal manufacturing activity and 70 per cent of industrial jobs.
• In Morocco, 93 per cent of all industrial firms are SMEs and account for 38 per cent of production, 33 per cent ofinvestment, 30 per cent of exports and 46 per cent of all jobs.
• Micro and very small businesses in South Africa provided more than 55 per cent of total employment and 22 percent of GDP in 2003. Small firms accounted for 16 per cent of both jobs and production and medium and large firms26 per cent of jobs and 62 per cent of production.
Source: African Development Bank and OECD Development Centre, African Economic Outlook (2004-2005).
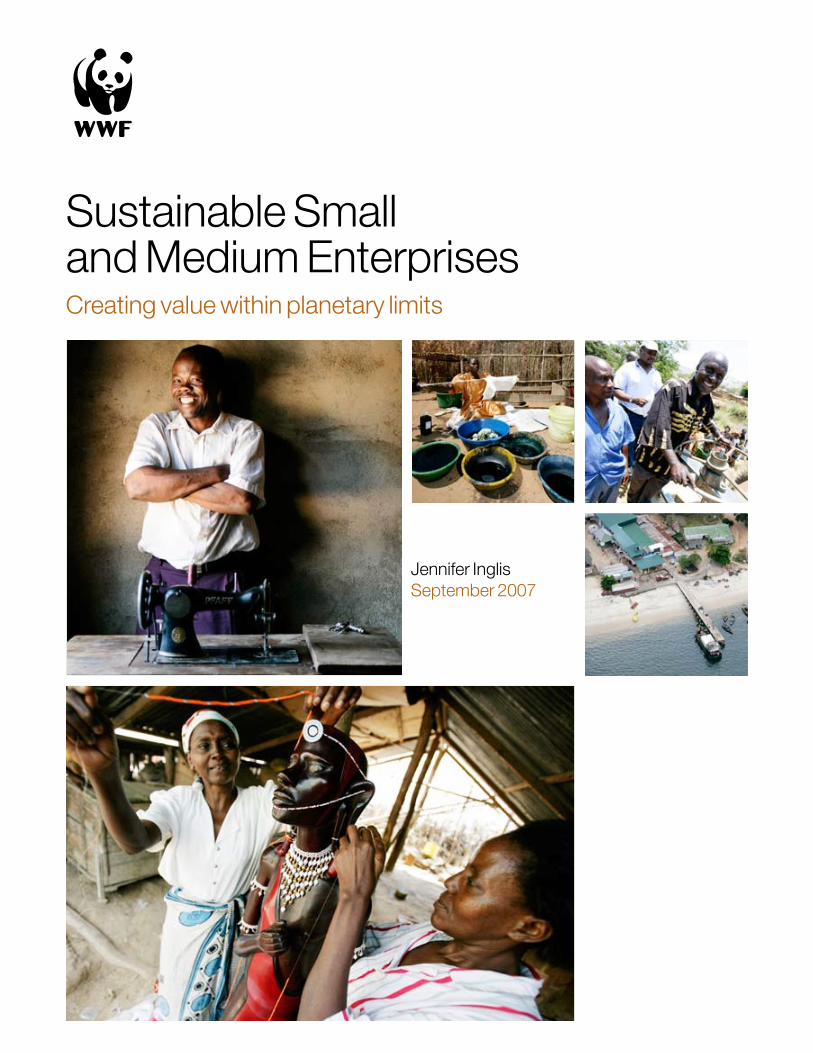
Sustainable Small and Medium EnterprisesCreating value within planetary limits
Jennifer InglisSeptember 2007
Foreword
WWF’s Living Planet Report shows us that globally we are using
the Earth’s natural resources faster than they can be renewed.
We are liquidating our planet’s natural capital and threatening the
potential for future generations to live in harmony with nature.
Our challenge is to find new ways to improve standards of living
and eradicate poverty while reducing impact on the natural world.
Small and Medium Enterprises (SMEs), as major employers in
all economies, offer a unique opportunity to create possibilities
for people, the environment, local and national economies and
investors. These possibilities range from increasing labour,
protecting natural resources, and securing long term return on
investment. SMEs are well positioned to embrace particular
sectors that are low in ecological impact but high in labour
requirements. For example, solar electricity enables a society
to learn and develop, requires skilled technicians, and delivers
energy services without carbon emissions. Most importantly,
SMEs have the potential to make a contribution to designing
new systems that require less extraction and pollution than
our existing models. SMEs are also of particular relevance to
emerging economies where there is a great need for development
opportunities. The solution to our global challenges will be
through the simultaneously addressing these environmental and
social concerns. Given their unique positioning in this context,
sustainable SMEs are well poised to be supported as a
catalyst for local and global change.
WWF presents this briefing document as a contribution to
the investment communities who are considering investing in
sustainable SMEs in Africa. It forms part of the background
documentation to a 2007 workshop hosted jointly by UNEP-FI
and WWF-UK. The workshop provides an opportunity for private,
public and philanthropic investors interested in SME investments
in Africa to gain new understanding of sustainable SME investing
in Africa, to explore alternative financing models, and to create a
network with like-minded individuals and organisations.
The innovative SME investment and risk mitigation mechanisms
necessary are explored in other discussion papers (De Risk, 2007)
contributing to this workshop. The input of participants in the
workshop is then sought to develop the agenda for further action.
About the author
Independent consultant Jennifer Inglis wrote this report for WWF. She works in a number of ways to create businesses and business practices that contribute to sustainable development – as an entrepreneur, employee, consultant and non-executive. She is active in the social enterprise movement in the UK and has expertise in many areas including policy around public sector procurement. She previously worked in capital investment in the food industry. She is a recent graduate of the MSc in Responsibility and Business Practice at the University of Bath.
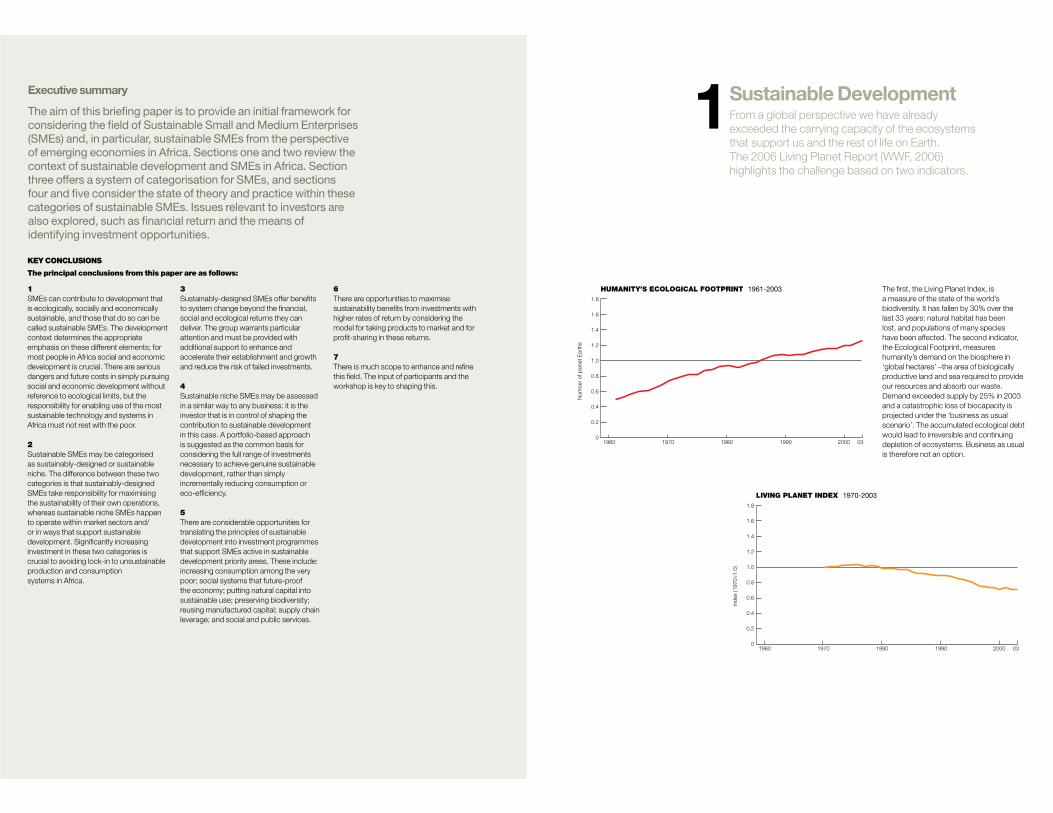
The first, the Living Planet Index, is a measure of the state of the world’s biodiversity. It has fallen by 30% over the last 33 years: natural habitat has been lost, and populations of many species have been affected. The second indicator, the Ecological Footprint, measures humanity’s demand on the biosphere in ‘global hectares’ –the area of biologically productive land and sea required to provide our resources and absorb our waste. Demand exceeded supply by 25% in 2003 and a catastrophic loss of biocapacity is projected under the ‘business as usual scenario’. The accumulated ecological debt would lead to irreversible and continuing depletion of ecosystems. Business as usual is therefore not an option.
Executive summary
The aim of this briefing paper is to provide an initial framework for
considering the field of Sustainable Small and Medium Enterprises
(SMEs) and, in particular, sustainable SMEs from the perspective
of emerging economies in Africa. Sections one and two review the
context of sustainable development and SMEs in Africa. Section
three offers a system of categorisation for SMEs, and sections
four and five consider the state of theory and practice within these
categories of sustainable SMEs. Issues relevant to investors are
also explored, such as financial return and the means of
identifying investment opportunities.
Sustainable DevelopmentFrom a global perspective we have already exceeded the carrying capacity of the ecosystems that support us and the rest of life on Earth. The 2006 Living Planet Report (WWF, 2006) highlights the challenge based on two indicators.
1
1
SMEs can contribute to development that is ecologically, socially and economically sustainable, and those that do so can be called sustainable SMEs. The development context determines the appropriate emphasis on these different elements; for most people in Africa social and economic development is crucial. There are serious dangers and future costs in simply pursuing social and economic development without reference to ecological limits, but the responsibility for enabling use of the most sustainable technology and systems in Africa must not rest with the poor.
2
Sustainable SMEs may be categorised as sustainably-designed or sustainable niche. The difference between these two categories is that sustainably-designed SMEs take responsibility for maximising the sustainability of their own operations, whereas sustainable niche SMEs happen to operate within market sectors and/or in ways that support sustainable development. Significantly increasing investment in these two categories is crucial to avoiding lock-in to unsustainable production and consumption systems in Africa.
KEY CONCLUSIONS
The principal conclusions from this paper are as follows:
3
Sustainably-designed SMEs offer benefits to system change beyond the financial, social and ecological returns they can deliver. The group warrants particular attention and must be provided with additional support to enhance and accelerate their establishment and growth and reduce the risk of failed investments.
4
Sustainable niche SMEs may be assessed in a similar way to any business: it is the investor that is in control of shaping the contribution to sustainable development in this case. A portfolio-based approach is suggested as the common basis for considering the full range of investments necessary to achieve genuine sustainable development, rather than simply incrementally reducing consumption or eco-efficiency.
5
There are considerable opportunities for translating the principles of sustainable development into investment programmes that support SMEs active in sustainable development priority areas. These include: increasing consumption among the very poor; social systems that future-proof the economy; putting natural capital into sustainable use; preserving biodiversity; reusing manufactured capital; supply chain leverage; and social and public services.
6
There are opportunities to maximise sustainability benefits from investments with higher rates of return by considering the model for taking products to market and for profit-sharing in these returns.
7
There is much scope to enhance and refine this field. The input of participants and the workshop is key to shaping this.
HUMANITY’S ECOLOGICAL FOOTPRINT 1961-2003
Num
ber
of p
lanet
Eart
hs
1960 1970 1980 1990 2000 03
1.8
1.6
1.4
1.2
1.0
0.8
0.6
0.4
0.2
0
LIVING PLANET INDEX 1970-2003
Ind
ex (1970=
1.0
)
1960 1970 1980 1990 2000 03
1.8
1.6
1.4
1.2
1.0
0.8
0.6
0.4
0.2
0
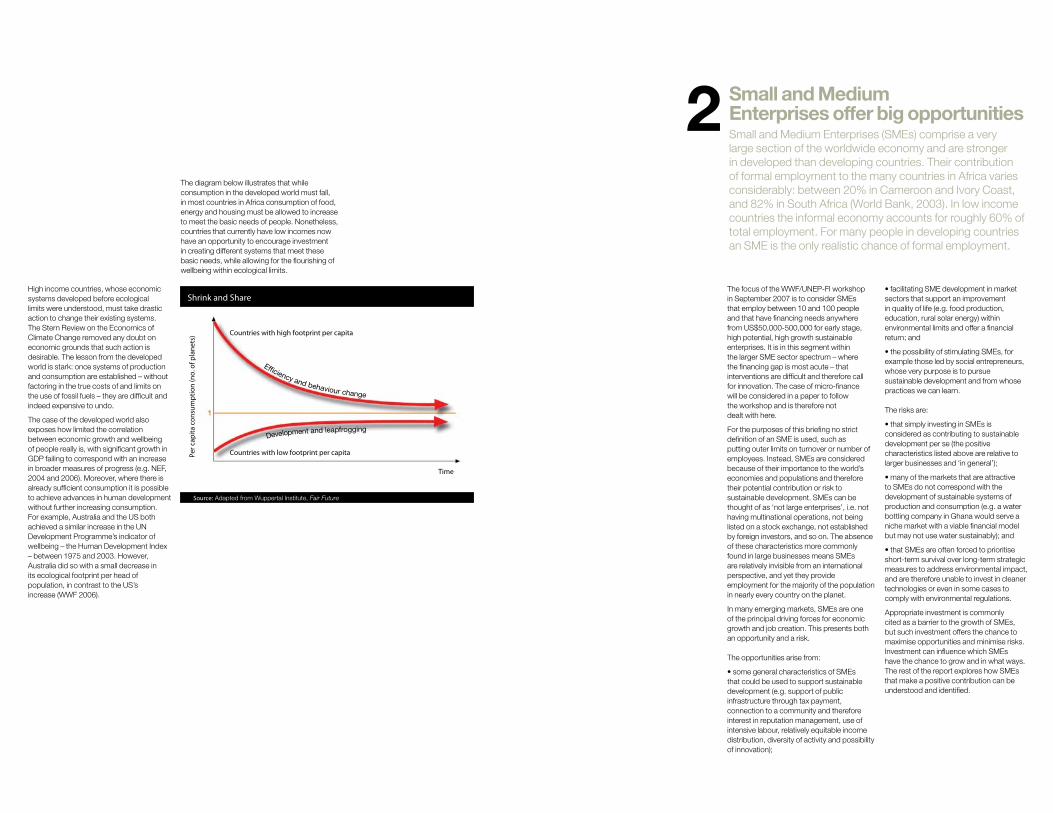
High income countries, whose economic systems developed before ecological limits were understood, must take drastic action to change their existing systems. The Stern Review on the Economics of Climate Change removed any doubt on economic grounds that such action is desirable. The lesson from the developed world is stark: once systems of production and consumption are established – without factoring in the true costs of and limits on the use of fossil fuels – they are difficult and indeed expensive to undo.
The case of the developed world also exposes how limited the correlation between economic growth and wellbeing of people really is, with significant growth in GDP failing to correspond with an increase in broader measures of progress (e.g. NEF, 2004 and 2006). Moreover, where there is already sufficient consumption it is possible to achieve advances in human development without further increasing consumption. For example, Australia and the US both achieved a similar increase in the UN Development Programme’s indicator of wellbeing – the Human Development Index – between 1975 and 2003. However, Australia did so with a small decrease in its ecological footprint per head of population, in contrast to the US’s increase (WWF 2006).
The focus of the WWF/UNEP-FI workshop in September 2007 is to consider SMEs that employ between 10 and 100 people and that have financing needs anywhere from US$50,000-500,000 for early stage, high potential, high growth sustainable enterprises. It is in this segment within the larger SME sector spectrum – where the financing gap is most acute – that interventions are difficult and therefore call for innovation. The case of micro-finance will be considered in a paper to follow the workshop and is therefore not dealt with here.
For the purposes of this briefing no strict definition of an SME is used, such as putting outer limits on turnover or number of employees. Instead, SMEs are considered because of their importance to the world’s economies and populations and therefore their potential contribution or risk to sustainable development. SMEs can be thought of as ‘not large enterprises’, i.e. not having multinational operations, not being listed on a stock exchange, not established by foreign investors, and so on. The absence of these characteristics more commonly found in large businesses means SMEs are relatively invisible from an international perspective, and yet they provide employment for the majority of the population in nearly every country on the planet.
In many emerging markets, SMEs are one of the principal driving forces for economic growth and job creation. This presents both an opportunity and a risk.
The opportunities arise from:
• some general characteristics of SMEs that could be used to support sustainable development (e.g. support of public infrastructure through tax payment, connection to a community and therefore interest in reputation management, use of intensive labour, relatively equitable income distribution, diversity of activity and possibility of innovation);
• facilitating SME development in market sectors that support an improvement in quality of life (e.g. food production, education, rural solar energy) within environmental limits and offer a financial return; and
• the possibility of stimulating SMEs, for example those led by social entrepreneurs, whose very purpose is to pursue sustainable development and from whose practices we can learn.
The risks are:
• that simply investing in SMEs is considered as contributing to sustainable development per se (the positive characteristics listed above are relative to larger businesses and ‘in general’);
• many of the markets that are attractive to SMEs do not correspond with the development of sustainable systems of production and consumption (e.g. a water bottling company in Ghana would serve a niche market with a viable financial model but may not use water sustainably); and
• that SMEs are often forced to prioritise short-term survival over long-term strategic measures to address environmental impact, and are therefore unable to invest in cleaner technologies or even in some cases to comply with environmental regulations.
Appropriate investment is commonly cited as a barrier to the growth of SMEs, but such investment offers the chance to maximise opportunities and minimise risks. Investment can influence which SMEs have the chance to grow and in what ways. The rest of the report explores how SMEs that make a positive contribution can be understood and identified.
Small and MediumEnterprises offer big opportunitiesSmall and Medium Enterprises (SMEs) comprise a very large section of the worldwide economy and are stronger in developed than developing countries. Their contribution of formal employment to the many countries in Africa varies considerably: between 20% in Cameroon and Ivory Coast, and 82% in South Africa (World Bank, 2003). In low income countries the informal economy accounts for roughly 60% of total employment. For many people in developing countries an SME is the only realistic chance of formal employment.
2P
er
cap
ita
co
nsu
mp
tio
n (
no
. of
pla
ne
ts)
Countries with low footprint per capita
Countries with high footprint per capita
Time
Shrink and Share
Source: Adapted from Wuppertal Institute, Fair Future
The diagram below illustrates that while consumption in the developed world must fall, in most countries in Africa consumption of food, energy and housing must be allowed to increase to meet the basic needs of people. Nonetheless, countries that currently have low incomes now have an opportunity to encourage investment in creating different systems that meet these basic needs, while allowing for the flourishing of wellbeing within ecological limits.
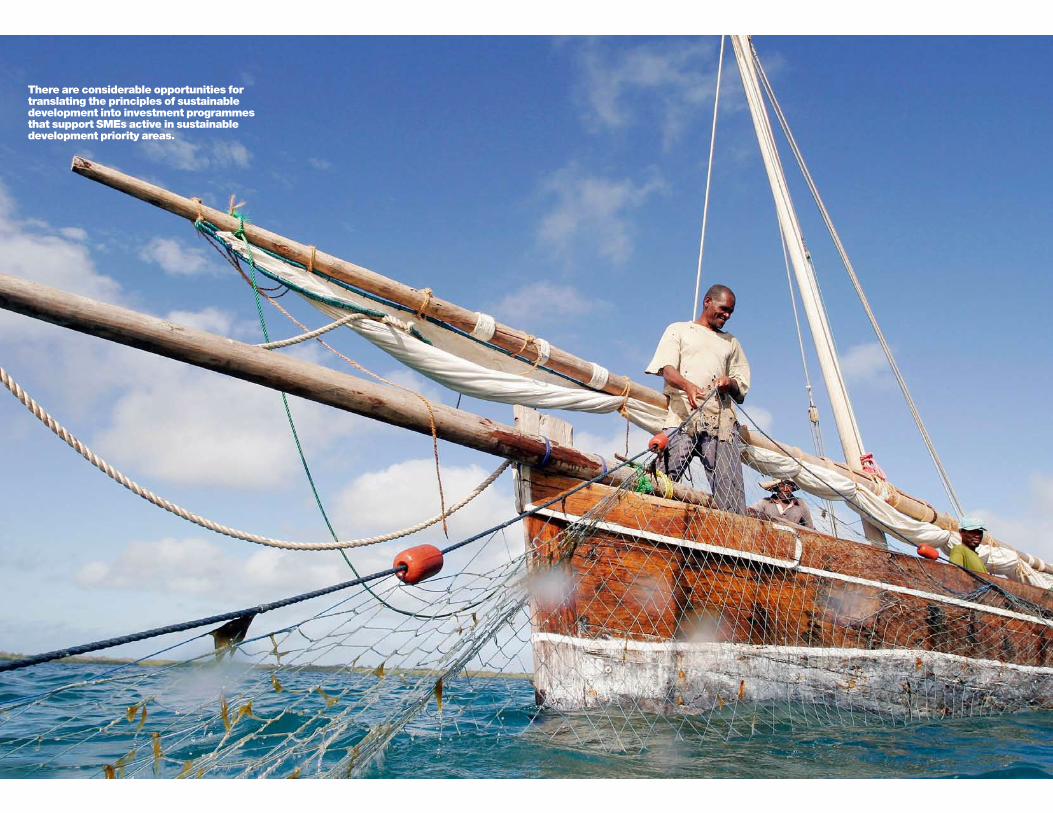
There are considerable opportunities for translating the principles of sustainable development into investment programmes that support SMEs active in sustainable development priority areas.
WW
F-U
K r
eg
iste
red
charit
y num
ber
10
81
24
7
A c
om
pany
limite
d b
y g
uara
nte
e n
um
ber
40
16
72
5
©1
98
6 P
and
a s
ymb
ol
and
®“W
WF”
Reg
iste
red
Tra
dem
ark
of W
WF-W
orld
Wid
e F
und
Fo
r N
atu
re (Fo
rmerly
Wo
rld W
ildlif
e F
und
)”
Prin
ted
on r
ecyc
led
pap
er
Pro
ject
num
ber
22
95
/ J
uly
20
07
Sustainable development has been defined as a commitment to “improving the quality of human life while living within the carrying capacity of supporting ecosystems” (IUCN et al., 1991) and thus includes social development.
There is no commonly accepted definition of a sustainable SME (or of a sustainable enterprise, or a sustainable business). Indeed the term ‘sustainable SME’ was used in a report on investment in emerging markets that noted:
“At present, the world of sustainable SME financing consists of disparate capital aggregators and other special purpose intermediaries that link capital to SMEs – these aggregators often have specific goals, such as poverty alleviation, biodiversity and land conservation, clean energy production, support for high-growth potential businesses, and so on. Development agencies, mission- based institutional investors, and philanthropists jointly fund many of these ‘niche’ projects, but to date there is no general place for sustainable SMEs in their investment portfolios.” (IRI 2006.)
The report recommended a more coherent definition of and approach to the sustainable SME. As a starting point for a coherent definition of the field, two categories of sustainable SMEs may be identified:
1
SMEs that are internally led/driven to contribute to sustainable development to the maximum possible extent; and
2
SMEs that happen to support sustainable development in some way that is appropriate to the context within which they operate (including social and economic development, as will be explored later).
We can consider both of these to be sustainablility-oriented SMEs, which for brevity will be referred to as sustainable SMEs, although it must be remembered that they are on a journey rather than at a destination. We could label the first category as sustainably-designed SMEs and the second as sustainable niche SMEs. The characteristics and principles behind these two categories will be explored further in sections four and five.
It is worth noting that these two categories do not by any means describe all SMEs. A further two categories of SMEs can be identified:
3
Those that don’t make a particular contribution to sustainable development because they maintain and reinforce the status quo, but do not have practices that are socially or environmentally more negative than their industry norm. This category may include a significant proportion of existing SMEs. Supporting them to manage their environmental impact will be important. Possibilities for this support include investing in SMEs (in category one or two, above) that offer environmental management services to these businesses, and giving them access to cleaner technologies – for example, as part of a supply chain of a multinational.
4
Those that are deliberately, ignorantly or as a result of desperation causing disproportionate social or environmental problems. This could be an important group to intervene with in terms of impact on sustainable development. And while dealing with them directly would require regulations and enforcement, investment might be used to create alternatives for the desperate and ignorant.
In conclusion, while there are opportunities for investment to be used to address the environmental and social practices of a wider group of SMEs, the primary focus of this report is on positively screened investment in sustainable SMEs in the categories of ‘sustainably designed’ and ‘sustainable niche’ because the possibility of changing the system lies with this group.
Conceptual and theoretical models
It is a challenge to put sustainable development into operation – to decide ‘what to do today’ – within the context of the system conditions necessary for sustainability. Several attempts have been made to address how an individual enterprise can go about this from a fundamental perspective. Three contributions to the field are:
1
Beyond the Business Case for Corporate Sustainability (Dyllick and Hockerts, 2002), which proposes six criteria for assessing sustainable ‘corporations’ based on a business case, a natural case and a societal case for sustainability. These criteria appear as appropriate to small and medium-sized enterprises as they are to corporations. However, to expect any one enterprise to address all six criteria fully is highly ambitious. A possible solution is explored later in the report.
2
Designing the sustainable enterprise (Parrish, 2007), which stands out as an unusual contribution to the field because of its clarity on the first principles of a sustainable enterprise. It requires the enterprise to have designed itself to realise both survival (sustainability) and purpose (qualitative improvement). The survival conditions are (approximately) that stakeholders support the enterprise, that it maintains ecologically and socially sustaining functions, and that it allows primary stakeholders to meet their basic needs. This represents an even broader understanding of a sustainable enterprise than Beyond the Business Case proposes.
3
Sustainable business design based on The Natural Step Principles (Waage, 2003), which are:
(i) nature is not subject to systematically increasing concentrations of substances extracted from the Earth’s crust;
(ii) nature is not subject to systematically increasing concentrations of substances produced by society;
(iii) nature is not subject to systematically increasing degradation by physical means; and
(iv) the ability of humans to meet their needs worldwide is not systematically undermined.
The best known example of a business in transition towards meeting these conditions is Interface, with its commitment to create the “protypical company of the 21st century”. This has been interpreted as ‘zero waste’, with only benign emissions, using only renewable energy, with closed loop recycling and having resource-efficient logistics. Clearly such a model is valid for industrial operations on a large scale, and indeed Interface has a whole research institution behind the effort. The Natural Step principles should also be applicable to SMEs, but they might need to work together to create the system transition necessary.
The common points from the above three models are that:
• they deal with the fact that nature’s services cannot entirely be substituted with manufacturing and therefore expose the limits of the ‘business case’-oriented approach to sustainable development often adopted by organisations that are not deliberately sustainably designed;
• it is clearly ambitious for a single enterprise to meet all true conditions for sustainability; and
• it is clearly an emerging field in which academia may be ahead of practice.
Practical developments in Sustainable Enterprise
Although examples of enterprises that have been designed fully in accordance with any theory of sustainable enterprise are few, there are many enterprises and entrepreneurs who push the boundaries of what is considered normal SME practice. The main ways this has been done are described in this section.
Emphasis on ‘ecological’ or ‘social’ enterprise only
In several developed economies there are efforts to promote the idea of ecologically or socially motivated enterprise. There are various interpretations of what this actually means in practice, and some disagreement over the roles and importance of profit and democracy in such enterprises. Generally speaking these enterprises tend to focus on a contribution either to living within ecological limits or improving social conditions or equity in some way. This split is perhaps testament to the difficulty of putting a completely sustainable enterprise into operation.
Sometimes social enterprise is used as a blanket term to cover ecologically and socially motivated enterprises – see www.socialenterprise.org.uk. There are various routes into social enterprise: the US route is primarily for ‘non-profit organisations’ to become enterprising through earned income – see www.se-alliance.org; the UK route is very mixed, but with more emphasis on alternative business practice.
Sustainably-designed SMEsSmall and Medium Sized Enteprirses (SMEs) are a large section of the economy worldwide being stronger in developed than developing countries. Their contribution to the many countries on the African Continent varies considerably (e.g. from 30% to 90% of employment) and broadly in line with a country’s income, but even in the poorest country, SMEs are a significant employer. For many people in developing countries an SME is the only realistic chance of employment.
4Positioning the bar forsustainable SMEsThere is no doubt that SMEs in general are important in the context of development (WBCSD, 2007), but does investing generally in SMEs promote sustainable development?
3
Cooperatives
Cooperatives are perhaps a special case of social enterprise – although they were around for more than 140 years before the term social enterprise appeared – where democratic control is required and equity between cooperators is particularly valued. One of the seven principles is “concern for the community”, which is interpreted on the ICA website www.ica.coop as a commitment to “work for the sustainable development of the community”. It is not always clear how this is interpreted by individual cooperatives.
In many places, including in some countries in Africa, they comprise a large section of the economy, and many will be large enterprises. For example, in Kenya, cooperatives put their contribution to GDP at 45%, with 31% of national savings and deposits. They have about 70% of the coffee, 76% of the dairy, 90% of pyrethrum (a biodegradable insecticide) and 95% of cotton markets (ICA, 2006). However, there are small and medium-size producer cooperatives, particularly in the agricultural sector. The interest of the cooperative movement in further embracing sustainable development by reinvesting its resources in small ‘sustainably designed’ cooperatives should be explored.
Emphasis on entrepreneurship rather than organisation form
In the context of entrepreneurship rather than enterprise there is also some polarisation – in this case into ‘eco-preneurs’ and ‘social entrepreneurs’. Eco-preneur is usually a term for an entrepreneur concerned with profit-making green ventures – a double bottom line. On the other hand the various foundations that support social entrepreneurs tend to focus on social innovation as the important aspect (for example, Skoll’s “pioneer of innovations that benefit humanity”), rather than how the innovation is delivered. So, while many social entrepreneurs do work within social enterprises, they are also found inside the public and private sector, and there are many whose projects require philanthropic support because they are a long way ahead of what a market will support.
Challenges for sustainably-designed ideas
On the whole, the more sustainable the behaviour of an enterprise, the more it is swimming against a tide (Barter, 2007), and the harder it is to sustain such an enterprise in the current market. After all, not many customers, investors, regulatory frameworks and other enabling factors for enterprise are aligned to valuing sustainable behaviour.
If there is no incentive, capacity or willingness in the market to value what the enterprise produces, then no matter how much contribution it could theoretically make to sustainable development it will be financially unsustainable. This is another way of saying that an SME cannot be sustainable in the context of an unsustainable system. A truly sustainably-designed enterprise will be constantly looking for ways to improve the sustainability of its behaviour by building a market that values this behaviour.
Opportunities arising from sustainably-designed SMEs
Applying any pure theory of sustainable enterprise would yield a small, although very important pool of potential investees. They are important because a sustainably-designed SME:
• challenges the accepted view of what an SME is capable of achieving, what can be valued in an (economic) system, and the necessary qualities of leadership;
• may deliver activities that would be considered ‘public service’ in the developed world but need to be undertaken privately, through charity or not at all in some emerging economies;
• is likely to create disproportionate value beyond the financial bottom line; and
• an create new business practice ahead of changes in norms and legislation.
Summary of characteristics of a sustainably-designed SME
A sustainably-designed SME is one that is inherently driven to find ways to maximise its positive contribution to sustainable development through its choice of business activity in relation to environmental challenges, its breadth and depth of service to society, and/or its degree of ecological and social return in comparison to economic value.
Return on investment in Sustainably designed SMEs
Since a sustainably-designed SME is deliberately trying to create value beyond financial value, it would seem that a method for assessing this value, centred on what it is trying to achieve, would be useful in deciding whether it is worthy of investment.
It has been noted that “whilst social ventures (i.e. a type of sustainably-designed SME) are typically credited with producing social value and financial ventures financial, they in fact both produce both to varying degrees” (Emerson, 2005). In recognition that the mainstream system does not fully value social and ecological impacts, Social Return on Investment (SROI) analysis was pioneered by Roberts Enterprise Development Fund (REDF) for considering philanthropic investment. The objective of SROI analysis is: “to more accurately capture the value generated or destroyed by organisations. As such, the concept at the heart of SROI analysis is valuation. Monetisation is a means to the end of valuation.” (Scholten, et al. 2006.)
SROI analysis may be used for investment selection. It may also be of particular interest as a tool for strategic planning and management within a sustainably-designed SME since it will offer some measure or value for what it is the organisation is designed to achieve.
Nurturing sustainably-designed SMEs
Sustainably-designed enterprise is in its infancy across the world, so it is necessary to have realistic expectations for Africa. Sustainably-designed enterprises might come from a charitable organisation or NGO, an established cooperative, or from the leadership of an ecologically or socially motivated entrepreneur. Their values may correspond with public service delivery, so public sector purchases and even aid-related purchases may be useful customer bases.
Given that the purpose of these enterprises is to deliver maximum sustainable development, the investment decision needs to focus on the quality of their design. To avoid concerns about creating dependency on philanthropy, their entrepreneurial capacity and intent should be assessed. As previously explored, these enterprises face a particularly difficult balancing act but produce value in terms of system change that warrants some calculated risk taking. Indeed their potential contribution to sustainable development punches such long way above their weight that there may be little justification for turning them away from investment and many good reasons for helping them to position their service to be marketable.
There are also some essential investments to be made in enabling conditions to allow SMEs to thrive. These include:
• supporting trade associations where sustainable business practice may be exchanged between practitioners, and lobbying may develop;
• supporting secondary marketing cooperatives to provide good access to customers;
• providing sector-specific (market and sustainable development) research; and
• standardising evaluation methodologies.
Patient and far-sighted investors are crucial to this group.
Kenya ‘Goodwoods’
WWF’s Goodwoods project in Kenya is working to conserve critical forest habitats while enabling producers to reach new markets. This is done by enabling wood carvers to shift from traditionally preferred forest hardwoods such as ebony to farm-grown neem, providing sustainable livelihoods for carvers and tree owners. The supply chain comprises some 3,600 farmers, 5,000 carvers from Akamba Handicraft Cooperative Society, and a marketing company called the Centre for International Markets Access (CIMA), which was formed to help carvers meet quality standards, develop new designs and reach export markets. Forest Stewardship Council (FSC) certification was achieved in 2005 and successfully audited in 2006. Carvers now earn slightly more from FSC neem carvings than from ebony because neem logs are cheaper, easier to carve and less flawed. The final product is comparable to ebony in quality.
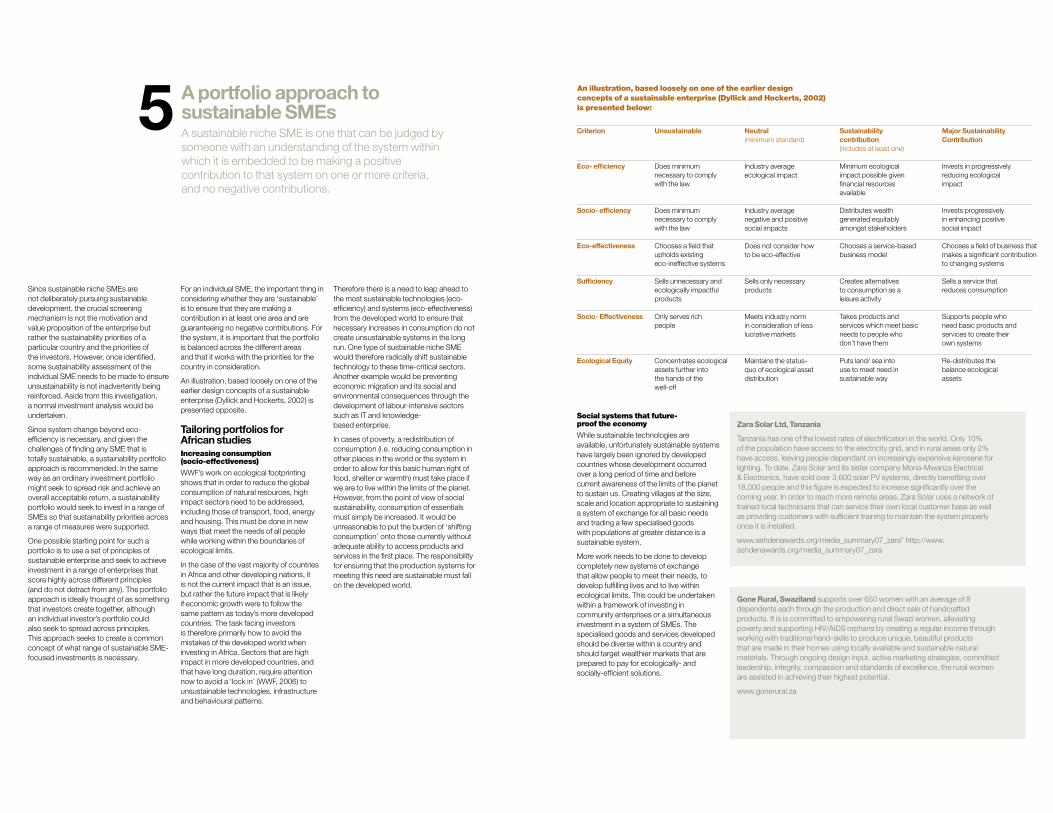
Since sustainable niche SMEs are not deliberately pursuing sustainable development, the crucial screening mechanism is not the motivation and value proposition of the enterprise but rather the sustainability priorities of a particular country and the priorities of the investors. However, once identified, some sustainability assessment of the individual SME needs to be made to ensure unsustainability is not inadvertently being reinforced. Aside from this investigation, a normal investment analysis would be undertaken.
Since system change beyond eco-efficiency is necessary, and given the challenges of finding any SME that is totally sustainable, a sustainability portfolio approach is recommended. In the same way as an ordinary investment portfolio might seek to spread risk and achieve an overall acceptable return, a sustainability portfolio would seek to invest in a range of SMEs so that sustainability priorities across a range of measures were supported.
One possible starting point for such a portfolio is to use a set of principles of sustainable enterprise and seek to achieve investment in a range of enterprises that score highly across different principles (and do not detract from any). The portfolio approach is ideally thought of as something that investors create together, although an individual investor’s portfolio could also seek to spread across principles. This approach seeks to create a common concept of what range of sustainable SME-focused investments is necessary.
For an individual SME, the important thing in considering whether they are ‘sustainable’ is to ensure that they are making a contribution in at least one area and are guaranteeing no negative contributions. For the system, it is important that the portfolio is balanced across the different areas and that it works with the priorities for the country in consideration.
An illustration, based loosely on one of the earlier design concepts of a sustainable enterprise (Dyllick and Hockerts, 2002) is presented opposite.
Tailoring portfolios for African studies
Increasing consumption (socio-effectiveness)
WWF’s work on ecological footprinting shows that in order to reduce the global consumption of natural resources, high impact sectors need to be addressed, including those of transport, food, energy and housing. This must be done in new ways that meet the needs of all people while working within the boundaries of ecological limits.
In the case of the vast majority of countries in Africa and other developing nations, it is not the current impact that is an issue, but rather the future impact that is likely if economic growth were to follow the same pattern as today’s more developed countries. The task facing investors is therefore primarily how to avoid the mistakes of the developed world when investing in Africa. Sectors that are high impact in more developed countries, and that have long duration, require attention now to avoid a ‘lock in’ (WWF, 2006) to unsustainable technologies, infrastructure and behavioural patterns.
Therefore there is a need to leap ahead to the most sustainable technologies (eco-efficiency) and systems (eco-effectiveness) from the developed world to ensure that necessary increases in consumption do not create unsustainable systems in the long run. One type of sustainable niche SME would therefore radically shift sustainable technology to these time-critical sectors. Another example would be preventing economic migration and its social and environmental consequences through the development of labour-intensive sectors such as IT and knowledge-based enterprise.
In cases of poverty, a redistribution of consumption (i.e. reducing consumption in other places in the world or the system in order to allow for this basic human right of food, shelter or warmth) must take place if we are to live within the limits of the planet. However, from the point of view of social sustainability, consumption of essentials must simply be increased. It would be unreasonable to put the burden of ‘shifting consumption’ onto those currently without adequate ability to access products and services in the first place. The responsibility for ensuring that the production systems for meeting this need are sustainable must fall on the developed world.
Social systems that future-proof the economy
While sustainable technologies are available, unfortunately sustainable systems have largely been ignored by developed countries whose development occurred over a long period of time and before current awareness of the limits of the planet to sustain us. Creating villages at the size, scale and location appropriate to sustaining a system of exchange for all basic needs and trading a few specialised goods with populations at greater distance is a sustainable system.
More work needs to be done to develop completely new systems of exchange that allow people to meet their needs, to develop fulfilling lives and to live within ecological limits. This could be undertaken within a framework of investing in community enterprises or a simultaneous investment in a system of SMEs. The specialised goods and services developed should be diverse within a country and should target wealthier markets that are prepared to pay for ecologically- and socially-efficient solutions.
An illustration, based loosely on one of the earlier design
concepts of a sustainable enterprise (Dyllick and Hockerts, 2002)
is presented below:
Criterion
Eco- efficiency
Socio- efficiency
Eco-effectiveness
Sufficiency
Socio- Effectiveness
Ecological Equity
Unsustainable
Does minimum necessary to comply with the law
Does minimum necessary to comply with the law
Chooses a field that upholds existing eco-ineffective systems
Sells unnecessary and ecologically impactful products
Only serves rich people
Concentrates ecological assets further into the hands of the well-off
Neutral
(minimum standard)
Industry average ecological impact
Industry average negative and positive social impacts
Does not consider how to be eco-effective
Sells only necessary products
Meets industry norm in consideration of less lucrative markets
Maintains the status-quo of ecological asset distribution
Sustainability
contribution
(includes at least one)
Minimum ecological impact possible given financial resources available
Distributes wealth generated equitably amongst stakeholders
Chooses a service-based business model
Creates alternatives to consumption as a leisure activity
Takes products and services which meet basic needs to people who don’t have them
Puts land/ sea into use to meet need in sustainable way
Major Sustainability
Contribution
Invests in progressively reducing ecological impact
Invests progressively in enhancing positive social impact
Chooses a field of business that makes a significant contribution to changing systems
Sells a service thatreduces consumption
Supports people who need basic products and services to create their own systems
Re-distributes the balance ecological assets
A portfolio approach to sustainable SMEsA sustainable niche SME is one that can be judged by someone with an understanding of the system within which it is embedded to be making a positive contribution to that system on one or more criteria, and no negative contributions.
5
Zara Solar Ltd, Tanzania
Tanzania has one of the lowest rates of electrification in the world. Only 10% of the population have access to the electricity grid, and in rural areas only 2% have access, leaving people dependant on increasingly expensive kerosene for lighting. To date, Zara Solar and its sister company Mona-Mwanza Electrical & Electronics, have sold over 3,600 solar PV systems, directly benefiting over 18,000 people and this figure is expected to increase significantly over the coming year. In order to reach more remote areas, Zara Solar uses a network of trained local technicians that can service their own local customer base as well as providing customers with sufficient training to maintain the system properly once it is installed.
www.ashdenawards.org/media_summary07_zara” http://www.ashdenawards.org/media_summary07_zara
Gone Rural, Swaziland supports over 650 women with an average of 8 dependents each through the production and direct sale of handcrafted products. It is is committed to empowering rural Swazi women, alleviating poverty and supporting HIV/AIDS orphans by creating a regular income through working with traditional hand-skills to produce unique, beautiful products that are made in their homes using locally available and sustainable natural materials. Through ongoing design input, active marketing strategies, committed leadership, integrity, compassion and standards of excellence, the rural women are assisted in achieving their highest potential.
www.gonerural.za
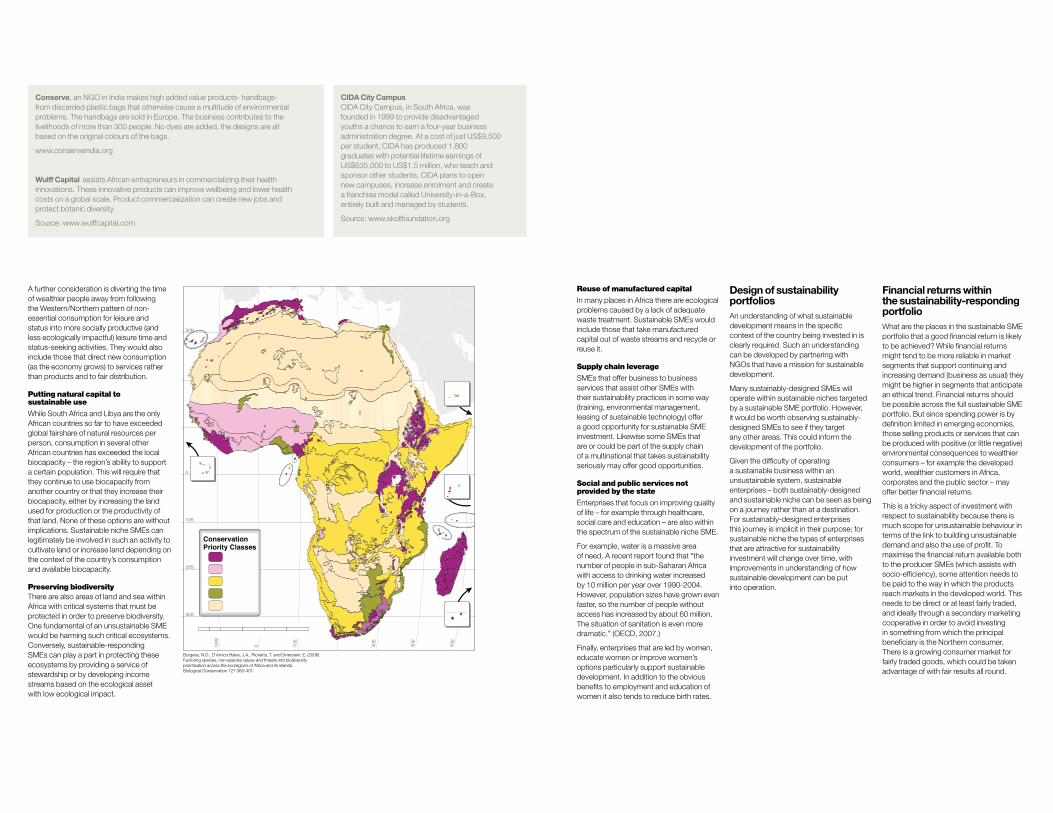
Reuse of manufactured capital
In many places in Africa there are ecological problems caused by a lack of adequate waste treatment. Sustainable SMEs would include those that take manufactured capital out of waste streams and recycle or reuse it.
Supply chain leverage
SMEs that offer business to business services that assist other SMEs with their sustainability practices in some way (training, environmental management, leasing of sustainable technology) offer a good opportunity for sustainable SME investment. Likewise some SMEs that are or could be part of the supply chain of a multinational that takes sustainability seriously may offer good opportunities.
Social and public services not provided by the state
Enterprises that focus on improving quality of life – for example through healthcare, social care and education – are also within the spectrum of the sustainable niche SME.
For example, water is a massive area of need. A recent report found that “the number of people in sub-Saharan Africa with access to drinking water increased by 10 million per year over 1990-2004. However, population sizes have grown even faster, so the number of people without access has increased by about 60 million. The situation of sanitation is even more dramatic.” (OECD, 2007.)
Finally, enterprises that are led by women, educate women or improve women’s options particularly support sustainable development. In addition to the obvious benefits to employment and education of women it also tends to reduce birth rates.
Design of sustainability portfolios
An understanding of what sustainable development means in the specific context of the country being invested in is clearly required. Such an understanding can be developed by partnering with NGOs that have a mission for sustainable development.
Many sustainably-designed SMEs will operate within sustainable niches targeted by a sustainable SME portfolio. However, it would be worth observing sustainably-designed SMEs to see if they target any other areas. This could inform the development of the portfolio.
Given the difficulty of operating a sustainable business within an unsustainable system, sustainable enterprises – both sustainably-designed and sustainable niche can be seen as being on a journey rather than at a destination. For sustainably-designed enterprises this journey is implicit in their purpose; for sustainable niche the types of enterprises that are attractive for sustainability investment will change over time, with improvements in understanding of how sustainable development can be put into operation.
A further consideration is diverting the time of wealthier people away from following the Western/Northern pattern of non-essential consumption for leisure and status into more socially productive (and less ecologically impactful) leisure time and status-seeking activities. They would also include those that direct new consumption (as the economy grows) to services rather than products and to fair distribution.
Putting natural capital to sustainable use
While South Africa and Libya are the only African countries so far to have exceeded global fairshare of natural resources per person, consumption in several other African countries has exceeded the local biocapacity – the region’s ability to support a certain population. This will require that they continue to use biocapacity from another country or that they increase their biocapacity, either by increasing the land used for production or the productivity of that land. None of these options are without implications. Sustainable niche SMEs can legitimately be involved in such an activity to cultivate land or increase land depending on the context of the country’s consumption and available biocapacity.
Preserving biodiversity
There are also areas of land and sea within Africa with critical systems that must be protected in order to preserve biodiversity. One fundamental of an unsustainable SME would be harming such critical ecosystems. Conversely, sustainable-responding SMEs can play a part in protecting these ecosystems by providing a service of stewardship or by developing income streams based on the ecological asset with low ecological impact.
CIDA City Campus
CIDA City Campus, in South Africa, was founded in 1999 to provide disadvantaged youths a chance to earn a four-year business administration degree. At a cost of just US$9,500 per student, CIDA has produced 1,800 graduates with potential lifetime earnings of US$635,000 to US$1.5 million, who teach and sponsor other students. CIDA plans to open new campuses, increase enrolment and create a franchise model called University-in-a-Box, entirely built and managed by students.
Source: www.skollfoundation.org
Conserve, an NGO in India makes high added value products- handbags- from discarded plastic bags that otherwise cause a multitude of environmental problems. The handbags are sold in Europe. The business contributes to the livelihoods of more than 300 people. No dyes are added, the designs are all based on the original colours of the bags.
www.conserveindia.org
Wulff Capital assists African entrepreneurs in commercializing their health innovations. These innovative products can improve wellbeing and lower health costs on a global scale. Product commercialization can create new jobs and protect botanic diversity.
Source: www.wulffcapital.com
20S
10S
30N
30S
10W
0
0 10E
30E
50E
40E
ConservationPriority Classes
Burgess, N.D., D’Amico Hales, J.A., Ricketts, T. and Dinerstein, E. (2006) Factoring species, non-species values and threats into biodiversity prioritisation across the ecoregions of Africa and its islands. Biological Conservation 127 383-401.
Financial returns within the sustainability-responding portfolio
What are the places in the sustainable SME portfolio that a good financial return is likely to be achieved? While financial returns might tend to be more reliable in market segments that support continuing and increasing demand (business as usual) they might be higher in segments that anticipate an ethical trend. Financial returns should be possible across the full sustainable SME portfolio. But since spending power is by definition limited in emerging economies, those selling products or services that can be produced with positive (or little negative) environmental consequences to wealthier consumers – for example the developed world, wealthier customers in Africa, corporates and the public sector – may offer better financial returns.
This is a tricky aspect of investment with respect to sustainability because there is much scope for unsustainable behaviour in terms of the link to building unsustainable demand and also the use of profit. To maximise the financial return available both to the producer SMEs (which assists with socio-efficiency), some attention needs to be paid to the way in which the products reach markets in the developed world. This needs to be direct or at least fairly traded, and ideally through a secondary marketing cooperative in order to avoid investing in something from which the principal beneficiary is the Northern consumer. There is a growing consumer market for fairly traded goods, which could be taken advantage of with fair results all round.
Summary and next stepsIt is possible to invest in SMEs in Africa in a way that supports sustainable development. Conversely if one fails to take account of the sustainability contribution and impact of investments there is a risk of undermining development and ecological needs. This has implications not only for the security of an investment but also for macroeconomic, social and environmental concerns.
6
To make investment in SMEs work for sustainable development, it would be necessary to:
• build consensus on making a coherent Africa-wide portfolio of investment decisions within a framework that can deal with the range of measures necessary for true sustainability, not just eco-efficiency;
• set up investment vehicles specifically focused on investing in sustainably-designed enterprises, and support their development by building knowledge and creating ‘enabling’ environments including a trade association;
• target investment in SMEs in Africa towards meeting basic needs and in leaping ahead to sustainable technologies and developing sustainable systems;
• invest in business to business services in environmental management services and physical infrastructure – for example, leasing environmentally efficient equipment; and
• protect the maximum sustainability return of financially attractive investments – for example, through fairtrade and secondary marketing cooperatives, and research into sustainable business.
Further work needs to be done to:
• explore more possibilities for designing thematic programmes within the portfolio approach: specific priorities for regions, countries or even sub-national level should be identified;
• test the practice of sustainable enterprise against sustainable enterprise design theories, and collect and share performance data where the burden of interpretation must fall on those with resources and perspective (such as universities);
• identify possible sources of sustainably-designed SMEs, including establishing the interest of the cooperative movement in further embracing sustainable development by reinvesting its resources in small sustainably-designed cooperatives; and
• establish consensus across different types of investment communities (public, private and philanthropic) on what constitutes sustainable SMEs, so that a consistent definition is used across the board, as a prerequisite to good collaboration.
References and bibliography
African Economic Outlook 2007, Organisation for Economic Co-operation and Development (OECD), 2007.Barter, N, Companies that Swim Against the Tide? Exploring Sufficiency?, Corporate Responsibility Research Conference 15-17 July 2007, University of Leeds. www.crrconference.org/downloads/2007barter.pdfBonini and Emerson, Maximising Blended Value, 2005. www.blendedvalue.orgBurgess, ND, D’Amico Hales, JA, Ricketts, T, and Dinerstein, E (2006) Factoring species, non-species values and threats into biodiversity prioritisation across the ecoregions of Africa and its islands. Biological Conservation 127, 383-401.Chasing Progress, Beyond Measuring Economic Growth, New Economics Foundation, NEF, 2004. De Risk Advisory Services, Risk Mitigation Mechanisms and Investment in Sustainable SMEs, 2007.Dyllick and Hockerts, “Beyond the Business Case for Corporate Sustainability”, Business Strategy and the Environment 11, 130-141, 2002.International Co-operative Alliance Annual Report, (ICA) 2006.Investing in the Backbone of Emerging Markets, Boston College Center for Corporate Citizenship’s Institute for Responsible Investment (IRI), 2006.Living Planet Report 2006, WWF, ZSL, Global Footprint Network, 2006.One Planet Business, WWF and SustainAbility, 2007.Parrish, BD, “Designing the Sustainable Enterprise”, Futures, Volume 39, 2007, pp 846-860. Promoting Small and Medium Enterprises for Sustainable Development, SNV and WBCSD, 2007.REDF (Philanthropic Investment in USA) www.redf.orgScholten, Nicholls, Olsen and Galimidi, Social Return on Investment, A guide to SROI Analysis, 2006.Small and Medium Enterprises across the Globe: A New Database, World Bank, 2003.Social Enterprise Alliance (USA) http://se-alliance.orgSocial Enterprise Coalition (UK) www.socialenterprise.org.ukStarik and Rands, “Weaving an integrated Web; Multilevel and Multisystem perspectives of ecologically sustainable organisations”, Academy of Management Review, 1995, Vol 20 No 4, 908-935.Stern, N, The Stern Review on the Economics of Climate Change, HM Treasury, 2006.The Happy Planet Index, New Economics Foundation (NEF), 2006. Waage (ed), Ants, Galileo and Gandhi, Greenleaf, 2003.
WWF-UK
Panda House, Weyside ParkGodalming, Surrey GU7 1XRt: +44 (0)1483 426444f: +44 (0)1483 426409
The mission of WWF is to stop the degradation of the planet’s natural environment and to build a future in which humans live in harmony with nature, by• conserving the world’s biological diversity• ensuring that the use of renewable natural resources is sustainable• reducing pollution and wasteful consumption
wwf.org.uk
All images © Brent Stirton/Getty Images/WWF-UK
WW
F-U
K r
egis
tere
d c
harit
y num
ber
1081247 A
com
pany
limite
d b
y guara
nte
e n
um
ber
4016725 ©
1986 P
and
a s
ymb
ol a
nd
®“W
WF”
Regis
tere
d T
rad
em
ark
of W
WF-W
orld
Wid
e F
und
For
Natu
re (Form
erly
World
Wild
life F
und
)” P
rinte
d o
n r
ecyc
led
pap
er
Pro
ject
num
ber
2407 /
Sep
tem
ber
2007
Blended Value Investing: Capital Opportunities for Social and Environmental Impact By World Economic Forum Selected Sections (Full report can be found at: https://www.weforum.org/pdf/Initiatives/Blended_Value_Report_2006.pdf)
42 Blended Value Investing: Capital Opportunities for Social and Environmental Impact
Introduction
The universe of international blended value privateequity investments is enormous, ranging frominformal micro-capital investments by individuals allthe way to professional private equity fundsinvesting hundreds of millions of dollars indeveloping economies. Investment strategies rangefrom social-value maximizing approaches toblended-value investment methodologies to strictlyprofit-maximizing investing. Given the broad rangeof investors, funds and deals in this realm, thissection cannot be exhaustively comprehensive.Instead, it examines a range of methods deployedin the United States, followed by three very differentinternational investment approaches, eachdeliberately adapting standard private equitypractices to generate blended value returns.
The Crucial Role of Private Equity Investment in
Developing Economies
Private equity investment is essential to buildingrobust private sectors that create employment,improve living standards and produce tax revenues.Equity investors are usually more risk-tolerant thandebt investors. They commit their capital for anuncertain term and have a residual claim onearnings only after all debt obligations have beensatisfied. Equity investors face a host of other risks,several of which are explored below.
Equity investments are particularly suitable for earlystage companies that will have unpredictable cashflows and accordingly are not suitable for debtinvestments. Unlike lenders, who maintain anarm's-length relationship with their borrowers inmost circumstances, private equity investors canmitigate some of their risks by exercising a largemeasure of influence or control over theinvestments, and such investor engagement oftenencourages transfers of best practices andorganizational capacity building. That involvementcan help businesses build better, more efficientbusiness processes, improve their corporategovernance, forge partnerships with otherbusinesses, and work more productively with otherlocal institutions. The investors can also advocatefor and/or support the entrepreneur’s efforts tocreate, social and environmental value that, in turn,often builds enhanced economic value.
A Survey of Risks and Challenges
Private equity investors in developing economiesface a variety of formidable risks that tend to bemore severe than similar investments in developedeconomies. Savvy investors can deploy tactics tominimize some of these potential hazards, butmany of them cannot be eliminated; all of them canchallenge the likelihood of fully risk-adjusted marketreturns.
Corporate governance: Many cultures andeconomies lack a tradition and expectation ofcorporate governance that protects allstakeholders. Small enterprises particularly areoften not subject to regulations that wouldencourage optimal governing practices. Remoteinvestors not steeped in local culture may find itdifficult to implement prudent governance.
Management competence: Frequently,entrepreneurs do not have the opportunities towork in well-run companies before starting theirown businesses. Without widely availablemanagement training or relevant previousexperience, enterprises in developing economiesoften lack well-trained managers.
Multiple ways of extracting value: Developedeconomies have established (and narrowly defined)means of extracting value from specific companiesthrough interest, dividends or a sale of business. Inmany cultures, returns are generated in other ways.Examples include directing business to othercompanies controlled by a business’s principals orhiring family and friends (in the developed world,such practices would be decried as self-dealing orcronyism). Such practices are by no meansconfined to developing economies, but in manycultures, these practices are considered legitimateways of distributing value.
Corruption and graft: Certain countries andeconomic sectors face this obstacle more severelythan others. Operating a business that does notengage in such practices can engender a very realcompetitive disadvantage when competing against
business that do.36
Bureaucracy: In many parts of the world,businesses face great bureaucratic regulatoryhurdles when founding and operating businesses.Particularly when bureaucracy and corruptioninteract, the effect can dramatically chill a country’s
investment climate.37
Innovations in Private Equity Investing
43Blended Value Investing: Capital Opportunities for Social and Environmental Impact
Country risk - political and macroeconomic
volatility: With less political and economic stabilityin developing countries, private enterprises face agrave range of hazards from coups d’etat tocurrency devaluations. The duration of equityinvestments and the extraordinary difficulty inbuilding currency hedges make currency exchangefluctuations a significant risk.
Rule of law and enforcement of contracts:Many investors take a well-developed code ofcorporate law and a relatively functional judiciary forgranted. Such conditions make contractsenforceable and give recourse to entities that havebeen wronged. Without them, an enterprise mustcarefully attempt to do business only with entitiesthat will honour their contracts and obligations. Inmany emerging economies, the law and judiciaryare not dependable, which increases transactioncosts and risks.
Exits: Realizing a return either through a sale orpublic offering can be especially difficult when suchstrategies are rarely practiced or supported by arobust financial sector. Sales and ownershiptransfers depend not only on the presence ofbuyers and sellers (which may be relatively thin inemerging economic environments), but also requiresupporting professional services and infrastructure,including banking, accounting and legal services.Such support may also be in short supply in lessdeveloped economies.
Innovations in Private Equity Investing
44 Blended Value Investing: Capital Opportunities for Social and Environmental Impact
As venture capital (VC) has generated spectacularfinancial value in the United States and otherdeveloped economies, many investors have soughtto deploy risk capital with VC-like models thatdeliberately seek returns in multiple dimensions. Ina number of locations in the United States,innovative blended value investors have sought tolink community development investing to venture
capital.38 These investors make equity investmentsavailable to small enterprises that would createlocal employment opportunities and otherwiseenhance the local communities. As many of thesefunds are dedicated to a specific geographic ormunicipal area, they significantly limit the number ofcompanies in which they can invest. Furthermore,the nature of the returns they seek often renderstheir financial returns concessionary.
The Community Development Venture CapitalAlliance, an investors’ trade association, offers avariety of tools for exploring these investment
strategies and the funds that deploy them.39 RISE
Capital Market Report: The Double Bottom Line
Private Equity Landscape in 2002/2003, publishedby the Columbia Business School’s ResearchInitiative on Social Entrepreneurship (RISE) inJanuary 2004, remains an excellent starting pointfor further examination of blended value venture
capital investing in the United States.40
Pacific Community Ventures
Founded in 1999, Pacific Community Ventures(PCV) has become a leader in the area ofcommunity development venture capital. PCVenhances and invests in businesses that bringeconomic opportunities to low-incomecommunities in California. PCV manages twoventure capital funds, PCV Investment Partners Iand II. The organization also offers “BusinessAdvisory Services”, capacity-building assistance forarea businesses and social purpose enterprisesthat corroborate the organization’s mission.
PCV invests in companies that operate in or nearlow-income communities and employ the residentsof those communities. The investment screenassesses the quality of employment opportunitiesthat the company offers, including the quality ofbenefits and potential for advancement. The fundsmeasure multiple returns on a variety ofparameters, which they then make available to the
public.41 The fund makes US$ 1 million to US$ 5million in equity investments in companies thatrealize annual revenues of at least US$ 5 million
and have the potential to grow in ways that enrichtheir employees. The funds will invest alone, butoften they invest in syndicates that includeinvestors not using blended value investmentframeworks.
PCV recently realized significant gains whenportfolio company Timbuk2 was acquired by aprivate equity fund. The liquidity event triggeredsignificant cash payouts to local, non-managementemployees, many of whom live in economicallydepressed areas, in some cases doubling annualsalaries. While this sort of event is usually a verygood thing for investors, it rarely touchesemployees.
Environmental and Clean Technology Funds
Another relevant class of venture capital fundsdirects investments at an industry or sector that willgenerate multiple returns. A significant number ofsuch funds direct their capital to renewable energyor clean technology. Many of these funds do notmake substantial changes to the standard venturemodel, and may be managed in a fashion all butindistinguishable from their peers on Sand Hill Roadin Palo Alto, California—the difference, however, istheir focus on leveraging environmental valuethrough the application of market rate capitalinvestments.
Expansion Capital Partners, LLC
Expansion Capital Partners (ECP) investsspecifically in clean technology, which it defines as“[t]echnologies that offer dramatic improvements inresource productivity, creating more economicvalue with less energy, less materials and lesswaste. These technologies significantly lower costand improve profitability, with short payback
periods."42 Expansion offers a compellinginvestment thesis for focusing on this sector, notingthat these markets are growing quickly, thatcompanies in the space have been under-investedto date, and that venture investments in clean techoffer investors a measure of diversification beyondthe typical venture capital industry foci. Expansionseeks equity investment opportunities in companiesrealizing US$ 2 million to US$ 20 million in revenueswith the potential to grow considerably larger. Itstarget investments range in size from US$ 500,000to US$ 2 million, and the fund aims to realize anIRR in excess of 25% (before subtracting fees andcarried interest). Investors in ECP include an arrayof both individuals and private foundations.
Variations on Traditional Venture Capital
45Blended Value Investing: Capital Opportunities for Social and Environmental Impact
Solstice Capital
With offices in Boston, Massachusetts and Tucson,Arizona, Solstice Capital bills itself as an “early-stage, diversified, positive-impact venture fund”investing in alternative energy, environment, lifesciences, education and information technology.The partners have committed to investing 50% oftheir two funds in socially responsible investments.Solstice notes that “socially responsive investmentscan generate superior venture capital returns andmake a positive contribution to the natural and
social environments.”43
Solstice is affiliated with Village Ventures PartnerFunds, a network of affiliated venture capitalinvestors focused on investing in Americangeographic areas that have been typicallyoverlooked by venture investors. Village Venturescentralizes many of its partners’ administrative andoperational services, allowing the partners to focuson their core investment responsibilities. Affiliationwith Village Ventures also improves Solstice’s dealflow exposure. Solstice’s two funds, formed in1995 and 2001, manage a total of US$ 85 million.Solstice’s early stage investments tend to range insize from US$ 500,000 to US$ 1 million, and thefirm is committed to syndicating its investmentsand regularly co-invests with other firms.
Blended Value Angel Investing
Many businesses are not suited to venture capital,which, particularly in its established and widelypracticed forms, only invests in a relatively narrowtype of business. Most businesses take too long tomature before a liquidity event, are not likely toachieve the financial return hurdles that VCsrequire, or are in industries that garner littleattention from venture capitalists.
Entrepreneurs not able to secure venture capital willturn to angel investors, individual private equityinvestors who commit their personal capital andassistance to private enterprises that do not meetventure capitalists’ investment profile. In the US,angel financing remains a loosely definedinvestment class that can be difficult to assess.Angel investors have a wide range of motivationsand approaches to their investments, but mostinvest in ventures operating in the industries wherethey have had previous success, where theirhuman capital can be as helpful as their financialcapital.
In the United States, the angel investor capitalmarket, such as it is, in many ways remains aninefficient and somewhat localized market; that is,investors and angel investors are often connectedthrough interpersonal networks, not through anykind of market intermediary. Because an angelinvestor is accountable only to him or herself (anddoes not have a fiduciary duty to maximize financialprofits for limited partners), an angel can invest inventures as they suit him or her. Accordingly, onemight expect that angels would be a fruitful sourceof capital for entrepreneurs deliberately generatingblended returns—if they could find one another.
Investors’ Circle (IC) aims to help blended valueprivate investors find ventures that will corroboratethe blend of returns they seek. Though itsmembers are both individual private equityinvestors and venture-style funds, Investors Circledescribes itself as “a leading social venture capitalintermediary whose mission is to support early-stage, private companies that drive the transition toa sustainable economy. Founded in 1992, IC hasbecome one of the nation’s oldest and largestinvestor networks, and the only one devoted
specifically to sustainability.”44 A brief survey of theInvestors' Circle website will present the readerwith an array of funds making blended-value privateequity investments in the US.
First Case Study: ProFund 45
By the end of 2005, ProFund, the first commercialmicrofinance equity fund, had exited itsinvestments, distributed the profits to its investors,
and closed its doors—all according to plan.46 Overthe course of its ten-year life, ProFunddemonstrated irrefutably that one could generateprofits by investing in MFIs even throughexceptionally challenging economic and politicalconditions. Whereas ProFund was the only investorof its kind when founded in 1995, by the time thefund distributed its gains ten years later, at least 20other MFI equity funds had embarked on similar
investment strategies.47 In 2003, the proliferation ofthis investment strategy led to the creation of theCouncil of Microfinance Equity Funds, amembership organization aiming to advance the
field of microfinance equity investing.48
Not only is Profind’s financial return, at the end ofthe day, an illustrative example, the fund’sadministration and the sponsors’ public “post-mortem” examinations have revealed a variety ofnuanced lessons.
Variations on Traditional Venture Capital
Variations on Traditional Venture Capital
46 Blended Value Investing: Capital Opportunities for Social and Environmental Impact
ProFund’s Founding Premises
ProFund was predicated on a clear fundamentalneed: MFIs in Latin America needed more capital.The fund proposed to meet that need through equityinvestments. Between the need and ProFund’ssolution was the fundamental principle that a socialmission and financial value creation are not onlycompatible, but they can be mutually reinforcing.
Sponsors ACCION International, Calmeadow,FUNDES, SIDI and Mr Fernando Romero invested inProFund to generate social returns, to capturefinancial returns, and to demonstrate a model thathad the potential to magnify the social and financialgains created by microfinance. Those sponsorscontracted with Costa Rican fund manager andconsulting firm Omtrix, SA to manage the fund, andOmtrix president Alex Silva became the CEO ofProFund. Silva’s work has been central to thedevelopment of the ProFund approach and he isreferenced throughout the balance of this discussion.
In founding ProFund, the sponsors articulated apreference for equity investments in MFIs for avariety of reasons. First, some MFI managers wouldprefer equity investments, with their longer-terminvestment horizon and lack of regular cashoutflows. Nevertheless, the higher risk associatedwith equity investments made such capital scarcerthan other sources. Second, financial institutions canonly borrow up to a certain multiple of their equityinvestments (a requirement that varies by regulatoryregime), so equity investments can facilitate follow-on debt investments. Third, the equity investmentencouraged engagement and influence that could beexercised through membership on the investees’boards of directors, where ProFund’s directors couldintroduce best practices where appropriate. Finally,in order to accept equity investments, MFIs had toacquire a certain level of sophistication. If an investeeMFI was not already a private financial institution, itwould either need to become one or would need towork with ProFund to craft a quasi-equity investmentstructure. Accordingly, the presence of ProFundencouraged MFIs to become more professionallymanaged.
The Mechanics of ProFund 50
In founding the fund, the investors stipulated thatProFund would have a finite lifespan, ceasingoperations in ten to twelve years after exiting all ofits investments. The requirement forced the fundmanagers to deal with one of the most persistentbarriers to private equity investment in microfinanceand in developing economies in general: the lack ofeasy opportunities to liquidate investments.(ProFund’s operational solutions to this challengeare elaborated later in this case study.) Thefounders also recognized that the fund would onlyspur similar investments if it could demonstraterealized returns for the whole portfolio, andstipulating the fund’s ultimate liquidation guaranteedthat ProFund would produce a conclusive,indisputable initial rate of return (IRR).
According to standard investment funds’ practice,ProFund employed an investment committee thatwas ultimately responsible for investment decisions.The fund’s professional staff uncovered andscreened potential deals, negotiated and thenmonitored investments, identified exits, and servedas a technical assistance resource to portfolioinvestments. Between the staff and investors,ProFund had extensive microfinance experience,and it could assist investees through the full rangeof their financing, strategy and operationschallenges.
Though the professional staff had extensiveresponsibilities, the fund’s charter ambitiouslyrestricted administration to three percent ofcommitted capital. At the fund’s launch, this capafforded ProFund only two full-time professionalstaff (plus an administrative employee and the inputof paid consultants and other professional servicesservice providers). Eventually, when the fund’s sizeincreased (reaching US$ 22 million in 1998 withmore than 15 shareholders), Omtrix was able tobring in an additional full-time staffer. Eventually, thefund reduced full-time staff size as it began to exitinvestments.
Quickly, Omtrix recognized that the initial premise ofminimal investment engagement and relativelyhands-off management was impractical. Many ofthe fund’s initial investees were “NGO conversions”,MFIs that were moving from not-for-profit models toindependent financial institutions capable ofhandling equity investments. Over the fund’s firstthree years, these conversions required significantattention from the staff. In later years, the investeeprofile evolved such that many investments were in
“ProFund does not perceive a conflict between poverty alleviation and
profitability. In fact, it believes that financial viability is a necessity for the
long-term success of poverty alleviation efforts in microfinance.
Accordingly, while most of ProFund’s shareholders are interested in the
development of the microfinance industry, the fund seeks primarily to
receive an adequate return on its investments, which it considers the
most efficient way to entice commercial capital into the sector.”49
newly created financial institutions, which alsocompelled highly engaged management. Whenmacroeconomic turmoil began to sweep LatinAmerica in the late 1990s, the staff found itselffurther stretched, making at least one deal thatsaved a healthy MFI from defaulting as a result of
temporary macroeconomic shocks.51 ACCION andother sponsors readily acknowledge that the staff’sextraordinary commitment and industry are largelyresponsible for the fund’s positive results. Theirexperience reveals that close engagement is criticalto such a fund’s success, and, of course, highengagement requires a commitment ofadministrative costs.
Given the risk associated with equity investments, asoundly diversified portfolio was indispensable toProFund’s success. The resulting portfolio achieveddiversification in countries, organizational forms(NGO-administered, existing financial institutions,and conversions from NGO to financial institution),
market penetration and organizational maturity.52 Toprotect against undue investment concentration,the fund set a US$ 4 million cap on any singleinvestment. While the fund aimed to hold asubstantial equity position in each investee (at leastten percent of its outstanding shares), ProFundopted not to take controlling positions; a 20-30%target became the norm.
ProFund’s operations grappled with a profound,large-scale shift in the microfinance world, as thecentre of gravity for MFIs’ organizational formsshifted from NGOs to independent financialinstitutions. Not only did the fund develop expertisein effecting NGO conversions, it also learned tocreate near-equity investment structures incircumstances where the MFI could not acceptequity investments due to its corporate form, by-laws or regulatory environment. Cataloguing thespecific nature of those investment remains beyondthe scope of this paper, but the resultinginvestments typically resembled subordinated debtor preferred equity. In some cases, they involvedperiodic cash flows, and many such investmentvehicles included redemption clauses that providedinvestment exits on pre-arranged terms.
Once the fund finished liquidating its investmentsand distributing the proceeds to its shareholders,ProFund had realized a net IRR of 6.65%.
Key Lessons
Over the ten-year life of ProFund, its investors andstaff learned numerous lessons about managing amicrofinance equity fund. Silva explores many ofthose operations lessons in his essay, “Investing inMicrofinance: ProFund’s Story”, and readers areencouraged to refer to that document for a more
detailed exploration of those themes.53
In its survey of microfinance, “The Hidden Wealth ofthe Poor”, The Economist said of ProFund’s returns(before the fund had exited the last of itsinvestments):
At first sight, its returns look unexciting: just six percentannually, despite lots of risk. But on close examinationthis was a remarkable performance. All of ProFund’scapital was contributed in dollars and then invested inlocal currency. In every country it operated in, its dollarreturns were reduced by local currency depreciations,reflecting the economic chaos in Latin America duringthat decade. Two of the countries in which it hadinvestments, Paraguay and Ecuador, suffered system-wide financial collapse. Haiti, Venezuela and Bolivia faced
riots and revolutions.54
In spite of significant currency losses, Silvaindicates that “in most cases . . . the subsequentoperational gains and intrinsic appreciation weremore than enough to offset currency related lossesand provide for the fund’s positive overall yield.”
Silva attributes the net gains to a number of criticalfactors. The first is the operational excellence of theinvestees’ own management as measured by theirability to lend to more customers and do so withincreasingly lower overhead costs. Silva has alsoacknowledged that ProFund’s early entry into thismarket place enabled it to “cherry pick” the bestinvestments at a lower investment cost, thanks toits lack of competition for deals. (Interestingly, Silvaobserves considerably more financing activity and,in turn, competition for deals in 2006. He hasstated that he would not run ProFund II in the samegeography because funding alternatives now exist,diminishing the likely success of a new fund—andfurther proving the success of ProFund as an
inspiring demonstration of concept.) 55
Silva further identifies two other necessaryconditions for profitable microfinance equityinvesting: the MFI must be located in a country thatprovides a sufficient “enabling environment”, andthe MFI’s corporate governance must be soundand independent. In referring to the appropriateenvironment, he points to a country’s regulatory
Variations on Traditional Venture Capital
47Blended Value Investing: Capital Opportunities for Social and Environmental Impact
and legal milieu. He cites an illustrative example:“[W]hen the Colombian government imposed tightinterest ceilings and thus prevented [ProFundinvestee] Finamerica from recuperating the highoperating costs associate with microfinance,”ProFund should have recognized the change in theinvestment environment and exited the
investment.56 (Unfortunately, ProFund did not act intime, and the fund eventually realized a loss on thatinvestment.)
Successfully planning for exits at the time of theinvestments’ inception was another key successfactor. Silva notes: “No investment was approved
without some sort of negotiated exit possibility.”57
With liquidity events remaining an elusive goal formost private equity in developing markets,ProFund’s example presents a variety oftransferable operational lessons. The fund relied onseveral such exit strategies, many of which aresuitable for liquidating minority positions, which canbe especially difficult to sell when most buyers areseeking controlling interest.
• Put Options: These agreements gave ProFundthe right to sell shares in the investment to aparticular buyer, usually a larger co-investor, on aparticular date at a price determined by theinvestment’s performance. The options typicallyprovided a guaranteed exit opportunity of lastresort that did not necessarily ensure a profit.
• Controlling Block Shareholders’
Agreements: Under such a contract, a numberof minority investors agree to coordinate in sellingtheir shares in unison so that a buyer can buy acontrolling stake by aggregating several smallershareholders’ stakes.
• Management buy-outs: ProFund alsonegotiated provisions by which an MFI’smanagement could purchase ProFund’s shares.Such arrangements may also involve sellerfinancing, in which ProFund would arrange forthe managers to borrow the funds that theywould in turn use to buy out the investors. Whilethis arrangement ensures that an interested partywill purchase the shares, it also introduces the
potential of moral hazard.58
• Redemption: When ProFund relied on quasi-equity structures, it typically included aredemption feature that would coincide withProFund’s closure and liquidation date.
Such provisions ensured that the fund would beable to liquidate investments, though the preferredexit remained selling the shares to a strategicbuyer. Potentially offering greater exit multiples,such buyers also include “local financial institutions. . . and international socially responsible investors(including the equity funds).” Nevertheless, “[p]rivateindividual or corporate sector buyers, while present,have not yet become a major force, and there issome reluctance to sell to such buyers unless they
are convincingly socially motivated.” 59
Interpreting the Results and Looking to the Future
Particularly considering the macroeconomicenvironment in which ProFund operated, its resultsare remarkable—and they are made even more sogiven the “experimental” nature of the fund.Nevertheless, Silva observes that a similar fund, iflaunched in 2005 in the same geography, would behard-pressed to replicate ProFund’s financialresults. Silva points to the “downscaling” of manymainstream banks that have moved tomicrofinance products and otherwise servepreviously un-banked poor people. He notes thatdownscaling may have a profound impact on howfinancial services are rendered to the poor.
He notes, “Coupled with lower cost of funds andunderutilized infrastructure, the commercial banksare clearly more professional and know financialintermediation better than [most] MFIs. In manycountries, downscaling is already as big as all MFIscombined.” Such developments help bring financialservices to more poor people by creating increasedcompetition for microentrepreneurial business. Thatincreased competition might cramp the returns ofMFI equity funds, but it might also introduce newexit opportunities for MFI equity investors asdownscaling banks choose between building andbuying microlending capabilities.
By 2005, a host of other microfinance equity fundswere investing with similar models (though all atearlier stages in the funds’ lives). They willeventually contribute their data to the discussion ofthe asset class, and their experience will helpestablish the extent to which ProFund’s financialreturns can be attributed to its being the first tomarket or to other factors, including the quality ofthe fund’s management and the overall nature ofthe investment strategy. These funds will alsocontribute to the body of best demonstratedpractices, which will help investors and managersunderstand how to replicate and eventually improveupon ProFund’s results.
Variations on Traditional Venture Capital
48 Blended Value Investing: Capital Opportunities for Social and Environmental Impact
Inescapably, ProFund’s experience throws foreignexchange risk into sharp relief. Even when oneinvests anticipating returns on par with mainstreamAmerican private equity portfolios (in the realm of30-40%), a major currency devaluation can quicklyeliminate hard-won investment returns. Of course,developing markets and international blended valueinvestors are quick to point out that foreignexchange rates can and do move in the otherdirection, and in many markets in the mid-2000s,they did just that. Nevertheless, the financial returnson investments in developing economies remainexceptionally sensitive to foreign exchange volatility,which as yet cannot satisfactorily be mitigated.Many well-informed would-be international blendedvalue investors have avoided such investments (inequity and in debt) largely due to the uncontrollableand vaguely predictable foreign exchange risk.When financial services entrepreneurs and financialinstitutions develop a mechanism that managessome foreign exchange risk at a reasonable cost, itwill likely open these investments to dramaticinflows of capital.
Concluding Thoughts
Equity investing in MFIs is a critical investmentstrategy, but it lacks single risk-reward profile.Equity investors, even more than debt investors,buy into the operations of the MFIs they support;the strong fundamentals of microlending alone willnot generate MFI equity returns unless the financialinstitution is well managed. With the equityinvestors even further behind debt holders in theirclaim on an MFI’s free cash flows, an equityinvestor must be that much more certain thatsufficient cash flows will accumulate. Theextraordinary range of corporate forms, lendingmodels, and management strategies employed byMFIs makes equity investing a complex proposition.For example, the risk profile of an MFI convertingfrom NGO to independent financial institution willdiffer significantly from an established financialinstitution that is extending its conventional modelsto new markets. Accordingly, perceptive, astutefund managers with deep microfinance and capitalmarkets experience are absolutely essential to thesuccess of equity funds.
ProFund has proven unambiguously that one cancreate social and financial value by investing in MFIequity, but investors have a long way to go beforetruly understanding the risk-reward profile of someof these investments. Fortunately, other blendedvalue investors have engaged in this investmentstrategy and in due time will help reveal its nature.
Second Case Study: Aavishkaar India Micro
Venture Capital Fund 60
Founding Aavishkaar
Aavishkaar founder and CEO Vineet Rai discoveredthe need for micro-scale equity investments as theCEO of the Grassroots Innovation AugmentationNetwork (GIAN), an incubator for rural ventures inIndia. The entrepreneurs working with GIAN werecaught between established financing mechanisms.Microfinance was not appropriate for theseinventors; many had grown too large for microloans.Furthermore, these entrepreneurs were oftencreative inventors who had developed novel ways ofaddressing problems. Their inventions still requiredinvestment before they would generate predictablecash flows; accordingly, they were simply not suitedto debt financing.
Rai’s entrepreneurs faced financial institutions thatwere not equipped to help them grow. Many bankssimply did not have programmes for working withsmall enterprises, especially those that weredispersed throughout rural areas. While India has avital and growing venture capital market, most VCsare located in the cities (to be close to the clustersof innovation), and they operate almost exclusively ata scale that is an order of magnitude larger thanGIAN’s entrepreneurs. Rural India simply does notoffer an angel network that could finance theseenterprises.
Thus, Rai’s entrepreneurs faced a grave funding gapbetween microfinance investment products (usuallywell below US$ 1,000) and established venturecapital fund investments (typically beyond US$1,000,000). The rural entrepreneurs being incubatedby GIAN needed flexible equity financing, patientcapital that would help them build their enterprises’capacity and open further opportunities for growth.
After meeting with Indians living in Singapore, whothemselves were contemplating more sustainableways of supporting their motherland, Rai and hisassociates conceived of a new financing entity toaddress that gap, and Aavishkaar India MicroVenture Capital was born. In Hindi, Aavishkaarmeans innovation, and it invests in innovative ruralenterprises that are “socially relevant,
environmentally friendly, and commercially viable.” 61
Like traditional venture capital, Aavishkaar focuseson innovations that have the potential to benefit fromeconomies of scale. Unlike the typical venture capitalmodel, Aavishkaar invests only in small enterprisesthat could make a difference in the lives of ruralIndians.
Variations on Traditional Venture Capital
49Blended Value Investing: Capital Opportunities for Social and Environmental Impact
Managing Regulatory Constraints
Beginning in 2002, Aavishkaar approached India’sSecurities and Exchange Board (SEBI) with theintention of formally incorporating as a venturecapital fund. Formal incorporation posed a numberof obstacles, including a minimum fund size thatexceeded Aavishkaar’s initial capacity to invest. Theminimum fund size delayed Aavishkaar’s initialventure investments while it worked to build asufficiently large fund. The founders opened aSingaporean sister company, AavishkaarInternational, to pool overseas investors’ capital forinvestment in Aavishkaar as a single entity, anarrangement prompted by SEBI’s regulations. Thefund ultimately met its regulatory requirements andformally incorporated in May 2002.
Dr V. Anantha Nageswaran, a member ofAavishkaar’s management board, indicates thatIndian regulations do not encourage the flow ofcapital into non-traditional VC investments. Henotes: “If banks could be allowed to contribute to .. . non-traditional venture capital funds, and if suchcontributions counted toward their obligations tothe priority sector, then the flow of funds to thenon-traditional venture capital industry would
increase.” 62 Furthermore, some flexibility in the sizeand structure of the regulated venture fund wouldencourage further growth.
Fund and Deal Profile
Aavishkaar’s investors are mostly individuals, andthey have committed an average of about US$16,000 to the fund. In late 2005, the fund totalledabout US$ 1.3 million, and it had placed sixinvestments, with several others nearingcompletion.
Investments are scaled appropriately to the targetcompanies that Aavishkaar aims to support, andthe deals range in size from US$ 10,000 to US$100,000 with the average being about US$ 30,000.Aavishkaar seeks an ownership stake ofapproximately 26%. While the investments aresmaller than those of a typical VC, Aavishkaartargets VC-level returns for each investment, aimingfor a 32% internal rate of return (IRR). Nevertheless,Rai anticipates a rate of enterprise failure that willlikely exceed the typical VC’s rate, and heanticipates the overall fund’s IRR ultimately to be inthe range of 5 to 10%.
He anticipates the duration of a typical investmentwill be as long as seven to nine years, which isconsiderably longer than the typical holding periodof a standard VC. Accordingly, the fund has not yet
exited a deal. Nevertheless, those exits are likelyultimately to come in the form of a share buyback(in which the entrepreneur repurchases shares inhis or her own company either with accumulatedearnings or with commercially available debt),merger or sale of the enterprise, but Rai does notrule out the possibility that one of these enterpriseswill ultimately be sold on the public markets.
Investment Example
One of Aavishkaar’s first investments was in ShriKamdenu Electronics Private Ltd (SKEPL) in April2003. The fund invested about US$ 36,000 for a26% stake in the company, which developsappropriate technology for dairy cooperatives.SKEPL’s product portfolio includes automated milkcollection and analysis systems that are suitable foruse in India’s tens of thousands of milkcooperatives. The product has the potential tomake milk production safer and more efficient,thereby potentially improving the lots of the millionsof milk co-op members.
Lessons Learned (or Lessons Learning)
Rai and everyone associated with Aavishkaar treattheir fund as a carefully executed, high-stakesexperiment. With a risk tolerance suitable to SiliconValley, Rai declares that even if Aavishkaar fails, itwill have been a success in that it will advance thestate of the discourse about financing innovativerural entrepreneurs. He is confident that a privateequity market will eventually grow up around theseentrepreneurs, and Aavishkaar’s approach mayhasten the day it arrives. Nevertheless, heacknowledges that the market is miniscule, and afailure now could hobble the asset class for a longtime.
In its several years of operation, Aavishkaar hasseen its deal flow improve gradually butcontinuously, and the investment pipeline is nowbetter suited to the size of the fund than it was inthe early days. As Aavishkaar establishes areputation, it sees more potential deals, includingmany that fall out of its focus area. Fund managersmust resist the temptation to make largerinvestments that do not strictly fit the fund’sinvestment focus. The temptation to move towardlarger deals is great, as larger deals are, from afinancial perspective, more efficient ways ofdeploying capital. Rai ultimately observes thatAavishkaar’s small investment scale will limit itsprofitability, and it is difficult to imagine that thereturns can be sufficiently large to overcome thecosts associated with supporting the investments(e.g.: due diligence, investment monitoring and
Variations on Traditional Venture Capital
50 Blended Value Investing: Capital Opportunities for Social and Environmental Impact
technical assistance). Without substantial returns,Rai raises concerns about retaining his capable andpassionate staff. He needs employees withsubstantial professional financial experience andthe opportunity costs for such professionals can bequite high.
In spite of these challenges, Aavishkaar haslaunched a viable fund in an investment space thathas not yet had the benefit of competitors who canaddress the same challenges that Rai faces. Theprospect of competition is very appealing to Rai, asother funds will help wring out inefficiencies, attractmore capital to the sector, and ultimately make itmore viable for rural entrepreneurs to take risks forthe sake of building value. Though Aavishkaar stillhas no direct competitors, the fund has attractedthe attention of other investors who are consideringsimilar investment strategies, with one similar fundapparently close to launching.
Third Case Study: ShoreCap International
and ShoreCap Exchange63
ShoreCap International (SCI) is a private equity fundinvesting in MFIs and banking institutions thatfinance small- and medium-sized enterprises(SMEs) in Africa, Asia and Eastern Europe. SCI isnot the only private equity fund investing in suchinstitutions. This document refers to other MFIequity investors, but there is an increasing numberof funds investing primarily in financial institutionsserving SMEs in emerging economies. The BalkanFinancial Sector Equity Fund (managed byDevelopment Finance Equity Partners) would serveas one of several examples.
SCI adopts active roles in the companies in which itinvests. Its work is corroborated and advanced byShoreCap Exchange (SCE), an American not-for-profit organization that provides technicalassistance to banks in SCI’s portfolio and to othersimilar institutions. Both SCI and SCE were spunout of ShoreBank Corporation in the US, and theirwork draws considerably on ShoreBank’s path-breaking and market-leading communitydevelopment banking model in the US.
ShoreBank Corporation
ShoreBank began operating in Chicago, Illinois,USA in 1973, practicing what is now commonlycalled community development banking. The bankhas become a diversified, full-service institutionoffering financial products and services designed to
enhance economic development in underservedAmerican communities. The bank expandedoutside of Chicago in 1986, and now it haslocations in communities across the United States(including Detroit, Cleveland, Michigan’s UpperPeninsula, Portland, Oregon, and Costal Oregonand Washington). ShoreBank Advisory Servicesextends the bank’s work to other financialinstitutions outside of the ShoreBank network. In1994, the bank entered the field of environmentalbanking, bringing its investment practices to bearon conservation and environmental improvement.
The bank now manages over US$ 1.7 billion inassets committed to community development, andits net income exceeds US$ 7 million per year. JanPiercy, a ShoreBank Executive Vice-President andformer US Executive Director of the World Bank,notes that ShoreBank’s original bank in Chicagonow outperforms many of its peer banks that donot have a community development investmentfocus.
The bank began working internationally in 1983with the Grameen Bank in Bangladesh. And in the1990s, its work expanded to Poland, Pakistan, theformer Soviet Union and elsewhere.
Introduction to ShoreCap International
Funding SCI
SCI was launched in July 2003 with US$ 28.3million in committed capital from 14 differentinstitutions. The fund is structured as something ofa hybrid between a permanent investmentcorporation and a limited-life investment fund. Ithas a mandate to invest funds for five years,concluding its investment activity in 2008. SCI doesnot have a terminal date or a requirement toliquidate its holdings by a particular deadline. Until2008, the fund’s directors can determine whetherto re-invest any realized gains or to distribute themto investors. After 2008, investors themselves candetermine whether they would like to have thosegains paid out or reinvested. The fund managersaim to invest US$ 23 million of the fund, reservingseveral million dollars to make follow-oninvestments and to support the fund’s expenses(with very little current income, the fund must relylargely on its committed capital to fund expenses).SCI expects a seven percent IRR for the fund itself,which is concessionary to the risk-adjusted marketrate.
Variations on Traditional Venture Capital
51Blended Value Investing: Capital Opportunities for Social and Environmental Impact
Investors
The fund’s 14 investors committed an average ofUS$ 2 million to SCI, and their investments rangefrom US$ 250,000 to US$ 4 million. They includedevelopment finance institutions, sociallyresponsible investment funds, foundations and oneglobal commercial bank, ABN AMRO. TheNetherlands-based bank’s American subsidiaryLaSalle Bank had worked with ShoreBank to meetits community investment obligations under theCommunity Reinvestment Act. Spurred in part bythe investments made with ShoreBank’sassistance, the LaSalle and ABN AMRO executivesrecognized that community development clientswould be their future mainstream clients.Accordingly, ABN AMRO invested in SCI to learnmore about its future mainstream clients inemerging economies.
Investment Parameters
SCI invests in financial institutions that providefinancing and banking services tomicroentrepreneurs and small businesses thatcreate economic opportunities for poor people. Thefund invests in regulated banks, MFIs, and otherfinancial institutions as long as at least 50% of theinstitution’s assets are dedicated to financing small-and micro-sized enterprises that employ low-income people. Typically, it invests US$ 500,000 toUS$ 2.5 million in equity with some convertible orsubordinated debt, and its investments are made inlocal currencies. SCI’s hurdle returns on equity are12%, and it anticipates an average holding periodof five to seven years. Though SCI does not takemajority stakes in any of its investments, it doestake board seats, often placing a top ShoreBankexecutive on the bank’s board. The fund currentlyoperates in Africa, Asia and non-EU EasternEuropean countries.
Deal Flow
Paul Christensen, president and COO of ShoreCapManagement, the fund manager, indicates that it ismuch easier to identify microfinance deals, giventhe prominence of the sector and the fact thatthere are other investors seeking similar deals.Identifying investment prospects is morecomplicated for institutions that finance SMEs.ShoreBank’s Advisory Services often sources suchdeals, and occasionally, existing SCI investmentsrefer other potential investments. In some cases,
Christensen and his team prospect by travellingthroughout Asia, Africa and Eastern Europe seekingfinancial institutions that might be investmentprospects. SCI lists investment pipelineopportunities in Ghana, Uganda, Afghanistan andAzerbaijan, among other countries.
Measurement and Monitoring
SCI expected to have made eight investments BYlate 2005, totalling US$ 9.5 million, with severalother likely investments pending. Through itsregular monitoring and involvement of SCE, SCIremains in close contact with the banks in which itinvests. Not only does it track the financialperformance of its investments, SCI also works toassess its investments’ social impacts. Christensenreports that tracking impact outputs for MFIinvestments is easier than doing so for SME-oriented investments. Some of SCI’s MFIinvestments are already assessed by MFI ratingorganizations that track metrics like number andsize of new loans and the gender mix of borrowers.In measuring the fund’s SME investment impact,SCI has deployed many of the tools thatcommunity development banks use in the US. Theyattempt to measure the number of smallbusinesses associated with the banks, along withthe total number and quality of new jobs created.Nevertheless, the dispersed nature of theinvestments and the cost of measuring both makeit difficult to compile accurate and complete data.
Introduction to ShoreCap Exchange
SCE is an independent American not-for-profitorganization that operates internationally and isfunded primarily by grants. SCE supports many ofSCI’s investments by offering technical assistancein the areas of organizational capacity-building,best practices transfer and “banker-to-banker peerexchange.” While donors support SCE’s work,client banks must make co-payments (determinedon a sliding scale) for the services, ensuring thatthey are fully invested in the capacity building andknowledge transfer that SCE facilitates. SCE alsosponsors a variety of exchange programmes thatencourage knowledge transfer between bankers indeveloped economies with their colleaguesoperating in developing economies. SCE’sinvolvement not only encourages positivedevelopment outcomes, but it helps to lower therisks associated with SCI’s investments.
Variations on Traditional Venture Capital
52 Blended Value Investing: Capital Opportunities for Social and Environmental Impact
SCI Looks to the Future
Nearly halfway through the investment process atthe end of 2005, Christensen suggests thatShoreCap’s future international private investmentfunds will likely have a sharper geographic focus.He notes that it can be a challenge to cover Africa,Asia and Eastern Europe with a staff appropriate fora US$ 28 million fund. Beyond regionalspecialization, Christensen sees opportunities toexpand this investment model to the low-incomehousing sectors of developing economies. He seesboth viable potential business models and theopportunity to finance a substantial developmentimpact, and he predicts that more capital will flowinto low-cost housing finance in the next severalyears.
Fourth Case Study: Actis 64
Whereas Aavishkaar and ShoreCap were bothfounded as unorthodox approaches to privateequity investment specifically intended to createblended value, Actis is a mainstream private equityfund with over US$ 3 billion under managementand generating market-rate financial returns. With ahistory stretching back to 1948, Actis’s ingrainedorganizational values and investment strategieshave driven the firm to generate multiple returnsbefore it ever articulated a blended valueinvestment strategy.
Actis’s History and Investment Focus
Until its management buyout in 2004, Actis was apart of CDC Group PLC (formerly CommonwealthDevelopment Corporation), which was whollyowned by the UK government. As the UnitedKingdom left its former colonies in the 1940s, itformed the CDC to begin establishing privatesectors in the nations it departed. Initial investmentvehicles were debt instruments with some privateequity investments, but over 50 years the fundchanged the balance of investments so that by2005 its assets were almost exclusively privateequity (consistent with a standard private equityfund’s allocation).
Ultimately, CDC’s management and the UKgovernment pursued a privatization plan that wouldallow existing management and employees to buyout 60% of the company, thus converting it into aconventionally organized private equity fund. Themanagement completed the buyout in 2004, whenthe management company was renamed Actis.
While the government still owns 40% of themanagement company, Actis now raisesinvestment funds in accordance with typical privateequity practice.
Actis has 16 offices, most of them located in thedeveloping economies where the fund invests,including five offices in Africa, four in Central andSouth Asia and one in China. Staffed by over 90investment professionals, the firm has developed adeep understanding of the markets in which itoperates. Being geographically close to theirmarkets, Actis’s investment professionals maintainclose engagement with their investments.
The deal sizes typically range from US$ 10 millionto US$ 50 million, and the fund invests only inhealthy, established enterprises with high growthpotential. It selects sectors on a local basis,enabling it to choose those that offer the bestpotential for growth and benefit for the localeconomy, while avoiding those where corruption,environmental liabilities or other potential hazardsmake investments unappealing.
Between 2004 and 2005, Actis raised six regionalfunds and an umbrella fund investing in theregionally defined funds. If Actis meets its targetfund sizes, the new pools of capital will representover US$ 450 million directed to investments inAfrica, US$ 225 million to China, US$ 325 million toIndia, and US$ 225 dedicated to South andSoutheast Asia. Since 1998, it has exited over 50%of its South Asian investments, generating a grossIRR of 34%. In the same time period, it exitednearly half of its investments in Africa with a grossIRR of 23%. Though it has exited only two of eightinvestments in China, the realized gross IRR forthat portfolio has been 54%.
Generating Multiple Returns
Actis’s engagement in generating multiple returnsbegins at the investment screen, as it avoidscompanies that have poor reputations, will beplaced at competitive disadvantage by upholdinghonest business practices, or will be potentiallyresistant to Actis’s responsible engagement. Withinthe company, Actis aims to improve corporategovernance, health and safety standards and/orenvironmental practices. In some of the changes itadvocates, Actis resembles a progressive activistshareholder. It does so because such practices areingrained in the firm’s values and because theyincrease financial value.
Variations on Traditional Venture Capital
53Blended Value Investing: Capital Opportunities for Social and Environmental Impact
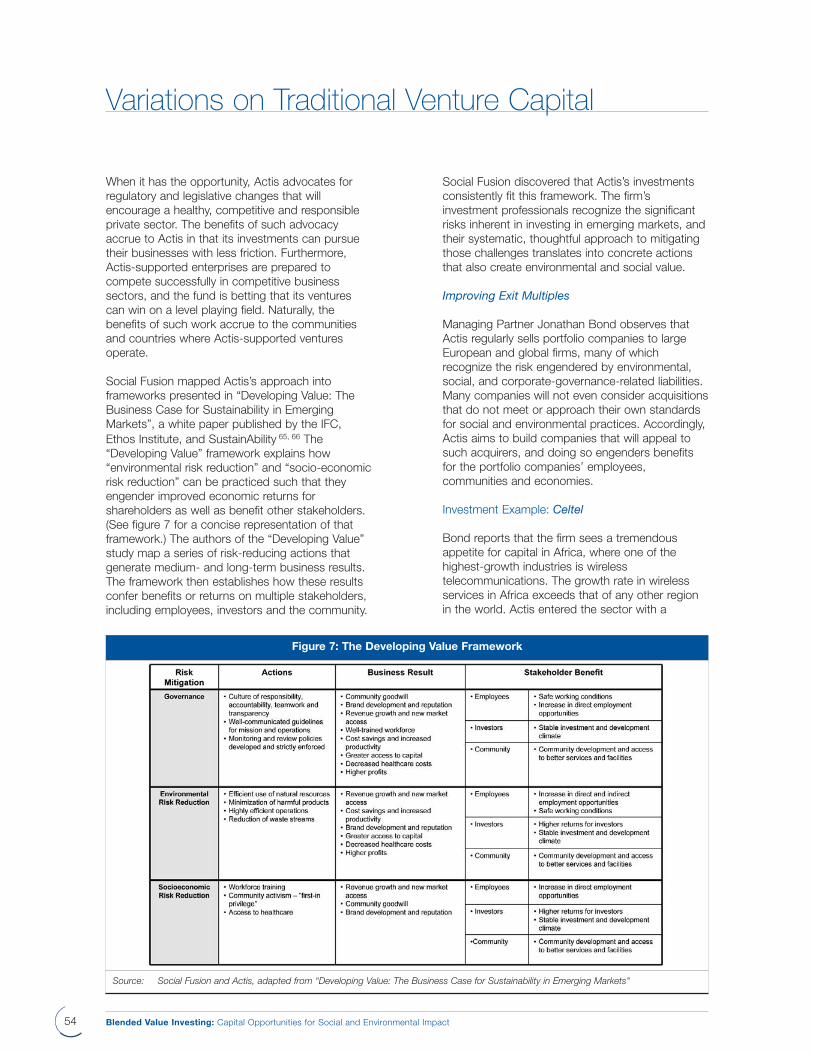
When it has the opportunity, Actis advocates forregulatory and legislative changes that willencourage a healthy, competitive and responsibleprivate sector. The benefits of such advocacyaccrue to Actis in that its investments can pursuetheir businesses with less friction. Furthermore,Actis-supported enterprises are prepared tocompete successfully in competitive businesssectors, and the fund is betting that its venturescan win on a level playing field. Naturally, thebenefits of such work accrue to the communitiesand countries where Actis-supported venturesoperate.
Social Fusion mapped Actis’s approach intoframeworks presented in “Developing Value: TheBusiness Case for Sustainability in EmergingMarkets”, a white paper published by the IFC,
Ethos Institute, and SustainAbility 65, 66 The“Developing Value” framework explains how“environmental risk reduction” and “socio-economicrisk reduction” can be practiced such that theyengender improved economic returns forshareholders as well as benefit other stakeholders.(See figure 7 for a concise representation of thatframework.) The authors of the “Developing Value”study map a series of risk-reducing actions thatgenerate medium- and long-term business results.The framework then establishes how these resultsconfer benefits or returns on multiple stakeholders,including employees, investors and the community.
Social Fusion discovered that Actis’s investmentsconsistently fit this framework. The firm’sinvestment professionals recognize the significantrisks inherent in investing in emerging markets, andtheir systematic, thoughtful approach to mitigatingthose challenges translates into concrete actionsthat also create environmental and social value.
Improving Exit Multiples
Managing Partner Jonathan Bond observes thatActis regularly sells portfolio companies to largeEuropean and global firms, many of whichrecognize the risk engendered by environmental,social, and corporate-governance-related liabilities.Many companies will not even consider acquisitionsthat do not meet or approach their own standardsfor social and environmental practices. Accordingly,Actis aims to build companies that will appeal tosuch acquirers, and doing so engenders benefitsfor the portfolio companies’ employees,communities and economies.
Investment Example: Celtel
Bond reports that the firm sees a tremendousappetite for capital in Africa, where one of thehighest-growth industries is wirelesstelecommunications. The growth rate in wirelessservices in Africa exceeds that of any other regionin the world. Actis entered the sector with a
Variations on Traditional Venture Capital
54 Blended Value Investing: Capital Opportunities for Social and Environmental Impact
Figure 7: The Developing Value Framework
Source: Social Fusion and Actis, adapted from “Developing Value: The Business Case for Sustainability in Emerging Markets"
significant investment in Celtel, a pan-Africanwireless service provider, shortly after Celtel’sfounding in 1998. By the time of the company’ssale in March 2005, Actis had invested a total ofUS$ 77 million, representing 9.3% of thecompany’s shares. Kuwaiti wireless concern MTCpurchased Celtel for US$ 3.4 billion, giving Actis a77% gross IRR. Of the US$ 3.4 billion purchaseprice, Bond reports that some US$ 2 billionrepresented goodwill, value the acquirers ascribedto knowing that Celtel’s contracts were alldependable, that the company had alwaysoperated to the highest ethical standards, and thatit would not discover any fraud or hidden liabilities.
While it owned Celtel, Actis had many opportunitiesto advocate for multiple returns. The firm workedwith government officials in the African countrieswhere the company operated (particularly in thosewhere it was among the largest taxpayers) toensure that taxation and other business regulationswere transparent and uniformly practiced. Celtelalso instituted strong employee-developmentprogrammes and strict environmental protections.Furthermore, Celtel is active in many of thecommunities it serves, sponsoring varioushealthcare, education and other communityinitiatives.
Opportunities
In potential financial returns, Actis sees tremendousopportunities for investing in emerging markets.Especially in Africa, the firm is not wanting forinvestment opportunities. While the risks remainsignificant, the firm and other experienced privateequity investors with personnel in-country are wellpositioned to reduce that risk, often in ways thatengender positive returns in other dimensions ofvalue.
Gillian Arthur is the head of Actis’s OperationsGroup, which ensures that the firm’s approach tohealth and safety, social and environmental issuesis integrated throughout the investment lifecycle.She notes that Actis’s most significant andimmediate impact may be in the realm of employeehealth and safety, and Actis pushes its portfoliocompanies constantly to improve workingconditions and opportunities for their employees.Actis will have ample opportunity to make suchimprovements as it invests recently raised funds incountries that have poor reputations forsafeguarding employee health and safety.
Interest in blended value investing is buildingmomentum. More and more capital is being guidednot just by a conscience but by a proactive,sophisticated set of ethics. With the assistance ofSocial Fusion, Actis is currently exploring howinvestments in Actis can play a role in blendedvalue investment strategies. To that end, SocialFusion has convened a series of “investorroundtable” events that have brought Actis partnerstogether with potential blended investors in order to
exchange ideas and discuss opportunities.67 Itshould be noted clearly that Actis does notpromote itself as a “socially responsible” investmentmanager, per se. Instead, it is transparentlypresenting its goals and practices to investors whocan then determine how or whether an investment
in Actis has a role in their portfolios.68
In conclusion, as this modest slice of thedeveloping private equity market universedemonstrates, private equity investment can bevery flexible and can adapt to the variety ofopportunities arising in developing economies.Making private investment work for internationalblended value creation will require additional time tobuild upon this initial track record to increase theexperience of those structuring these funds andexpand the capacity of both funds and supportingintermediaries working in this area of capitalallocation. There are promising developments, such
as the launch of VantagePoint,69 a non-profitworking regionally with investors to help expandventure capital options in emerging markets and
the ongoing work of Endeavor,70 providing supportto entrepreneurs in emerging markets, both ofwhich reflect the growing interest in and promisingdevelopments of venture capital expanding intothese emerging markets.
Variations on Traditional Venture Capital
55Blended Value Investing: Capital Opportunities for Social and Environmental Impact
59Blended Value Investing: Capital Opportunities for Social and Environmental Impact
Of Opportunity and Risk
This paper has documented just some of theimproving prospects for applying mainstreaminvesting practices toward achieving social andenvironmental goals. Strategies such asmicrofinance and social enterprise, initially havingbeen launched primarily with philanthropic support,are now approaching the status of “mainstream”investment opportunities for banks, foundationsand high net worth individuals interested in doingwell while doing good. For those who believe in thepower of market forces and free enterprise—aswell as the need to create a more just world—theseare exciting times.
These transitions from philanthropic capital tofinancial investment capital are particularly unusualand even anomalous events in the history of capitalmarkets. While investors may analyze and learnfrom the “non-profit to for-profit” transformation ofhospitals as well as specific financing innovationssuch as the affordable housing tax credit, there arevirtually no historical examples of wide-scaleeconomic initiatives that began on a philanthropic(wealth transferring) platform and segued to a risk-oriented (wealth creating) platform capable ofattracting private capital. In this nearlyunprecedented situation, one must carefully re-evaluate the usual rules for gauging risk and returnas they apply to this major capital marketstransformation.
In the context of a blended value capital market,there is real risk and there is real return. However,to an outsider trying to determine whether or not toinvest in or contribute to a microfinance entity or afor-profit social enterprise, the investment decisionis quite simply not as straightforward as it would befor investors considering traditional investmentopportunities. This complexity arises from capitalmarkets that heretofore did not reflect the truenature of value; instead, they artificially broke valueinto components that over simplified the goals ofcreating value. Those capital marketscorresponded to two very different sectors (onenon-profit and the other for profit) that, of course,still exist today. Each has its own rules, regulationsand relevant approaches to analysis. Nevertheless,value is a more complicated construct, andmaximizing it with consistency will require thatinvestors revise their rules for investing capital. Theymust be careful to combine the best aspects ofphilanthropic and financial investing, and they mustbe especially wary of combining the strategies inways that obscure risks and jeopardize overall,long-term blended value creation.
Developments in financial instruments, portfoliotheory, creative market-based problem solving, andtheir underlying conceptions of value are veryencouraging. They should be supported, expandedand celebrated as being revolutions in thought andpractice that create real value. At the same time, itis critical to reflect on the risks present in any
emerging market and to define what mechanisms
should be in place to minimize those risks. Ifefficient markets capable of attracting significantcapital to blended value investments are ever goingto emerge, would-be market participants mustobserve and address the characteristics thatcurrently prevent the nascent blended value capitalmarkets from functioning as efficiently as moreestablished, efficient capital markets.
Many of the extraordinary projects documented inthis paper—and so many other innovations notaddressed herein—are, quite simply, in jeopardy. Atthis stage of development, blended value investingstrategies are poised either to become victims oftheir own success or—with careful guidance—toemerge victorious as new waves of capital areprudently deployed in blended value investments.Should significant new blended value investmentsturn out to be founded on poor due diligence orfaulty risk-management, those mistakes could sourthe market for years to come. The collapse of anyof the initial funds and investment instrumentscurrently capitalizing the next stage of blendedvalue investing would not only spell the end of thatparticular offering; it would make it extremelydifficult for future offerings to find investors. TheChinese character for “change” is a combination ofthose for “risk” and “opportunity”, and such is thechange in process.
Early financial failures would deal a significant setback to all those around the world who areattempting to bring new investment strategies toother emerging areas of economic development.Funds targeting small- and medium-sizedenterprises in emerging economies, newly seededrenewable energy funds, community developmentventure capital funds, and many others havereason to be concerned and to ensure that earlyinvestment decisions are made wisely. This concernis not to say that mistakes cannot or should not bemade. If the risk associated with these deals isappropriately priced and the markets are indeedefficient, some investors will lose money. Thesemarkets do not need to ensure that investors neverlose money (doing so would distort the market inways that would ultimately hurt value creation).Instead, the emerging market participants mustensure that every deal either succeeds or, in the
A Cautionary Conclusion: Maximizing BlendedValue Returns by Embracing Market Fundamentals
60 Blended Value Investing: Capital Opportunities for Social and Environmental Impact
words of Tom Peters, “fails forward”. Participantsdo not need to prevent all losses of money, butthey must avert the catastrophic failure that arisesfrom incompetence, hubris or malfeasance.
Looking to the Future of a Blended Value
Capital Market
For years the focus of a great deal of work hasbeen upon the challenge of how to build themicrofinance capital market—and many haveworked to address that challenge. At the sametime, another, broader question remains:
How do we create investment strategies that are bankable
and socially valuable, capable of providing capital to
microfinance, social enterprise, small- to medium-sized
enterprises, community development finance and more?
Microfinance and other blended value creationsystems share challenges in gaining access tomainstream capital flows, though eachprogrammatic area stands in a unique position—itsown particular distance from that ultimate goal.Nevertheless, a series of approaches, principlesand concrete steps will help participants respond tothe common challenges shared by everyoneinterested in applying financial investment strategiesfor social and environmental gain.
Defining the “Push” Investing Past and the “Pull”
Investing Future
Several decades ago, the hundreds of millions ofdollars initially needed to launch and growmicrofinance were provided with little or noexpectation of financial return to the initial investors.One might characterize this investment as a “pushstrategy,” driven by the suppliers of capital:• It was pushed by donors, philanthropic
organizations (foundations) and governmentalorganizations, which in turn created the MFIs todeploy the funds.
• They pushed capital into microcredit because ofits remarkable ability to create sustainablemicroenterprises started and owned by the poor.
• Philanthropic investors pushed it with little initialregard for whether the capital would be returnedand, in many cases, limited understanding ofwhether it had been well deployed.
And it has been a successful strategy!
These early individual and institutional philanthropicinvestments demonstrated that poor people indeveloping countries could “help themselves” in asustainable manner. These early philanthropic“investors” played the role of risk-tolerant angelinvestors as they helped capitalize a new industry.Nevertheless, they differed from traditional angelinvestors in that they had no expectation of aneventual liquidity event that would provide themwith not only a return of capital invested, but areturn on capital invested—a reward for theirassumed risk.
Now, contrast this “push” flow of capital with thetypical risk-seeking capital flow, wherein instead ofbeing pushed, risk capital is “pulled” into a deal bythe demand for capital: • Entrepreneurs and investment opportunities pull
early investors into investments with upsidefinancial potential, and there is an expectation offuture liquidity events. Typically, venture capitalistsdo not create the enterprises they fund; instead,entrepreneurs approach them with opportunities(and most venture capitalists reject moreproposals than they fund).
• The early successes are tempered by earlylosses.
• If early success is sustained and scaled, thiscondition pulls even more capital, and mezzanineinvestors buy out early-stage investors as a newcapital market is created.
Where this system works well—and there arenumerous examples—great wealth is created, andrevolutionary businesses are born. Along the way,the providers of capital come to learn about therisks and returns associated with the newbusinesses and investment strategies in partbecause they expect, accept and analyze failedinvestments. Furthermore, the investmentopportunities become more standardized and theemerging markets form the necessary infrastructureto facilitate future flows of capital.
In the rush and enthusiasm for creating new capitalmarkets that support blended value systems,investors must not forget this axiom of investing:
Mainstream capital is not brave. It does not like going places
where the rules are unclear or subject to multiple
interpretations. It does not like to go where the expected
returns are not calculated clearly and plausibly and where the
risk is not fully detailed and explained.
A Cautionary Conclusion: Maximizing BlendedValue Returns by Embracing Market Fundamentals
61Blended Value Investing: Capital Opportunities for Social and Environmental Impact
Furthermore, mainstream capital does not flow toinvestments simply because it might have positivesocial impact. In fact, conventional wisdomsuggests that pursuing financial return oninvestment (ROI) is agnostic at best and antitheticalat worst to social return on investment (SROI).Blended value investing stipulates that investorscan generate both types of value as an integrated,blended return, but it recognizes that investmentsmust provide the reasonably predictable potentialto generate financial ROI to attract (or pull) capitalinto deals in the first place. Without the potential forROI that approaches the risk-adjusted market ratereturn, investments will be confined to philanthropiccapital flows and will never have access to themuch larger mainstream capital flows that have ROIas their highest priority. Importantly, suchinvestments do not necessarily need to offer largeROIs; instead, it is crucial they have relativelypredictable returns subject to well-understoodrisks. This mainstream capital currently is notflowing to blended value investments in largeenough volumes, and the only way to pull it towardthese investments is to structure them so that theycan generate financial returns.
Blended value market participants must ensure thatthe present enthusiasm does not eclipse the tasksand disciplines required to build a functioning,efficient, liquid, self-correcting capital market thatwill provide ongoing, sustainable value for investorsand entrepreneurs. The balance of this paper willpresent the core elements necessary for thecreation of an effective, vibrant emerging marketnot simply for microfinance, but for the entireblended value arena made up of microfinance,social enterprise, for-profit social ventures and,indeed, any alternative financial offering that seeksto combine financial returns with social and/orenvironmental value creation.
Bringing such a global infrastructure into existencewill not be easy. While this paper sets out a seriesof goals, the path to reach them is not clear, nor isachieving them at all assured. All practitioners needto assess what structures must be created and—perhaps more importantly—what business andinvestment principles must be maintained in orderto achieve these goals. As explained later, theseemerging markets require not only new and refinedinvestment products and infrastructure, they alsoneed participants to conduct their business withgreater transparency, being more publiclythoughtful about failures and mistakes. Afundamental first step in building this infrastructureis for all potential investors in any investments thataim to generate both financial and social returns tovet each offering according to the degree to whichthe investment under consideration meets therelevant conditions described below.
A Cautionary Conclusion: Maximizing BlendedValue Returns by Embracing Market Fundamentals
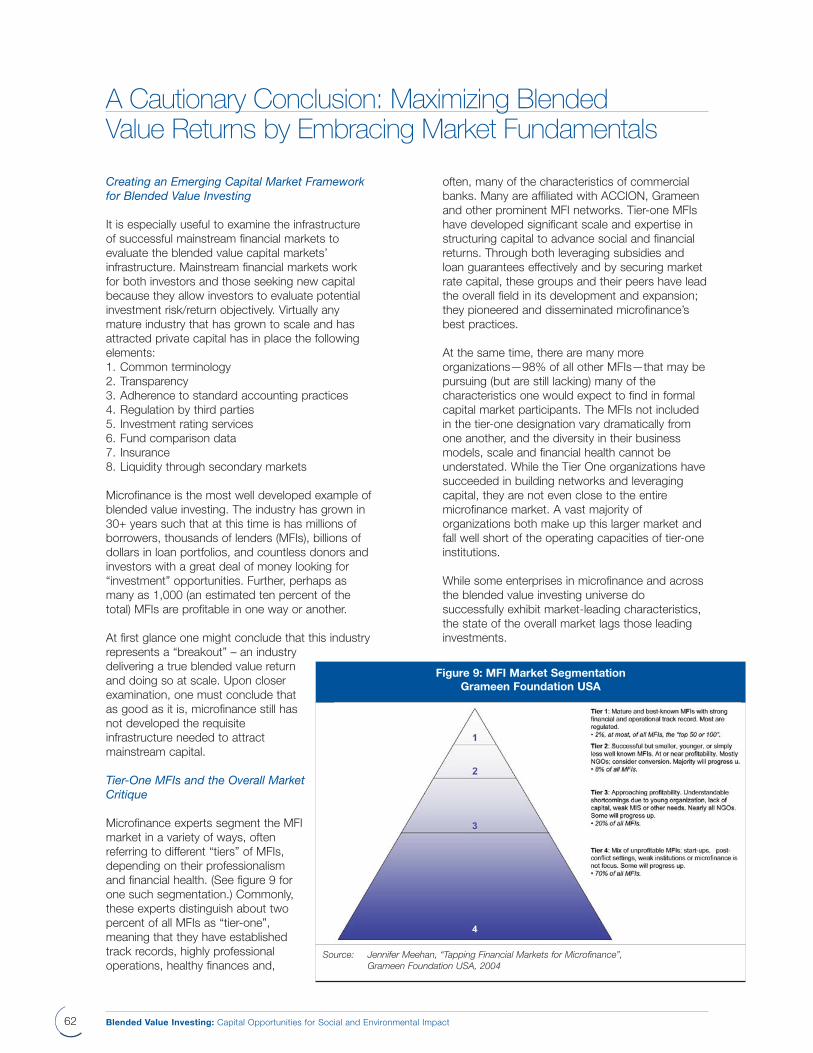
62 Blended Value Investing: Capital Opportunities for Social and Environmental Impact
Creating an Emerging Capital Market Framework
for Blended Value Investing
It is especially useful to examine the infrastructureof successful mainstream financial markets toevaluate the blended value capital markets’infrastructure. Mainstream financial markets workfor both investors and those seeking new capitalbecause they allow investors to evaluate potentialinvestment risk/return objectively. Virtually anymature industry that has grown to scale and hasattracted private capital has in place the followingelements:1. Common terminology2. Transparency3. Adherence to standard accounting practices4. Regulation by third parties5. Investment rating services6. Fund comparison data7. Insurance8. Liquidity through secondary markets
Microfinance is the most well developed example ofblended value investing. The industry has grown in30+ years such that at this time is has millions ofborrowers, thousands of lenders (MFIs), billions ofdollars in loan portfolios, and countless donors andinvestors with a great deal of money looking for“investment” opportunities. Further, perhaps asmany as 1,000 (an estimated ten percent of thetotal) MFIs are profitable in one way or another.
At first glance one might conclude that this industryrepresents a “breakout” – an industrydelivering a true blended value returnand doing so at scale. Upon closerexamination, one must conclude thatas good as it is, microfinance still hasnot developed the requisiteinfrastructure needed to attractmainstream capital.
Tier-One MFIs and the Overall Market
Critique
Microfinance experts segment the MFImarket in a variety of ways, oftenreferring to different “tiers” of MFIs,depending on their professionalismand financial health. (See figure 9 forone such segmentation.) Commonly,these experts distinguish about twopercent of all MFIs as “tier-one”,meaning that they have establishedtrack records, highly professionaloperations, healthy finances and,
often, many of the characteristics of commercialbanks. Many are affiliated with ACCION, Grameenand other prominent MFI networks. Tier-one MFIshave developed significant scale and expertise instructuring capital to advance social and financialreturns. Through both leveraging subsidies andloan guarantees effectively and by securing marketrate capital, these groups and their peers have leadthe overall field in its development and expansion;they pioneered and disseminated microfinance’sbest practices.
At the same time, there are many moreorganizations—98% of all other MFIs—that may bepursuing (but are still lacking) many of thecharacteristics one would expect to find in formalcapital market participants. The MFIs not includedin the tier-one designation vary dramatically fromone another, and the diversity in their businessmodels, scale and financial health cannot beunderstated. While the Tier One organizations havesucceeded in building networks and leveragingcapital, they are not even close to the entiremicrofinance market. A vast majority oforganizations both make up this larger market andfall well short of the operating capacities of tier-oneinstitutions.
While some enterprises in microfinance and acrossthe blended value investing universe dosuccessfully exhibit market-leading characteristics,the state of the overall market lags those leadinginvestments.
A Cautionary Conclusion: Maximizing BlendedValue Returns by Embracing Market Fundamentals
Figure 9: MFI Market Segmentation
Grameen Foundation USA
Source: Jennifer Meehan, “Tapping Financial Markets for Microfinance”,
Grameen Foundation USA, 2004
63Blended Value Investing: Capital Opportunities for Social and Environmental Impact
The following section assesses the broad state ofplay within the blended value investing arena byfocusing on the particular silo of microfinance. Thecritique of the broad field should not take awayfrom the work and quality organizations that havebeen created by many individuals, nor should it betaken to apply to every MFI. Rather, this
assessment raises concerns about the overall state
of the market and its implications for achieving real
sustainable scale capable of tapping into
mainstream financial service sectors.
Market Characteristics Explained
1. Common Terminology: Any industry must beable to describe its inner workings to outsiderswishing to evaluate performance. Microcredithas done an admirable job of developingterminology and metrics that facilitate descriptionand analysis of MFIs. Numerous industrydescriptive manuals and financial models areavailable. Unfortunately, many of thesedescriptions and associated metrics weredeveloped to identify, describe and quantify thesubsidies that are available to non-profit MFIs.Most MFIs are still operating as not-for-profitentities today and, as such, account for theiroperating results using not-for-profit terminology,this language can be confusing if not misleadingto potential investors, especially those whotypically invest only in for-profit entities. For aninvestor to understand and evaluate theoperational performance of a given MFI, theremust be a clear delineation of subsidies and therole they have played and will play in the futureperformance of the MFI.
Even the contemporary measures of financialperformance tend to evince MFIs’ non-profitorigins. The Economist’s recent survey ofmicrofinance makes this point clearly:
No matter whether those terms and acronymsare defensible or not, they clearly befuddlemainstream financial actors as represented bythe authors of the article, whose statementssuggest that microfinance’s vocabularies makethe industry appear parochial and quaint.
A second and more problematic issue withterminology is that no consistent and objectivemeasure of impact is promulgated. As thecapital markets develop and capital is “pulled” tomicrofinance, there should be objectivestandards by which investors can judge thesocial impact of their investment. Unfortunately,what passes for impact measures today isusually a simple tabulation of microborrowersserved and the average size of their loans. ManyMFIs have established their own impactmeasurement regimes, but there appears to belittle successful effort to pull those measurementschemes into a single unified approach.
Opportunities for improvement:
• Commercial financiers and regulated MFIscould continue to develop a common set ofterminology that reflects the language andassumptions of mainstream international capitalmarkets.
• After MFIs have standardized their languagearound inputs and financial performance,foundations and other NGOs might sponsorimpact-assessment studies by independentthird parties and academic researchprofessionals.
2. Transparency: As not-for-profits operating indeveloping countries, many MFIs have fewpublic reporting requirements. The transparencyof the industry is driven primarily by two factors:the decision of individual MFIs who voluntarilymake their results public and the mandatoryreporting performed by the MFIs that areregulated and therefore obligated to reportresults. Even with this level of transparency,rigorous evaluation of MFIs is difficult. MFIs inmany parts of the world now voluntarily reportresults to industry associations and these resultsare aggregated and benchmarked. For investorswanting to analyze an MFI and to compareresults to other organizations by size, geography,product, etc., the transparency issue isproblematic.
A Cautionary Conclusion: Maximizing BlendedValue Returns by Embracing Market Fundamentals
“The foggiest place in the industry is ‘on the ground’ (another favourite
microfinance term), where familiar words suddenly become oddly
unintelligible. An item labelled ‘profit’ lets you keep mum about the losses
transferred to a money-losing charity affiliate. An 'operationally
sustainable' business is one that can pay for its running costs but not its
capital, which is often the largest single expense for a financial firm. But
the worst thing are the acronyms, which make learned analyses of
microfinance next to unreadable. All this may sound trivial, but industry
practitioners seem to care deeply.”76
64 Blended Value Investing: Capital Opportunities for Social and Environmental Impact
Organizations like the Microfinance Exchange(MiX) are working to increase outsiders’ accessto the characteristics and performance of MFIs,but that information is voluntarily provided and insome cases may not be current. While manyMFI investment funds and MFI networks havedetailed information about the MFIs with whichthey work, that information is not necessarilybeing shared and aggregated in any one placeso that the MFIs’ initial transparency becomesopaque.
Opportunities for improvement:
• Market participants can encourage efforts likeMiX and related efforts.
• Investors and MFI networks can combine duediligence and isolated market intelligence fromvarious actors, making them available throughclearinghouses like MiX.
3. Adherence to Standard Accounting
Practices: Many MFIs operate as not-for-profitorganizations, and many control wholly ownedsubsidiaries engaged in related endeavours.Furthermore, most MFIs are not audited, andthose that are tend to use small, country-basedauditing firms. While many such firms utilizeInternational Accounting Standards (IAS),application of these standards remainsquestionable. For investors, this condition posesa problem.
Opportunities for improvement:
• Market participants can form a reportingstandards-setting board like the InternationalAccounting Standards Board used todetermine generally accepted internationalaccounting standards. Such a board can focuson fitting international accounting standards tomicrofinance instead of creating a new set ofmicrofinance-specific standards.
• Any emerging accounting standards mustincorporate means of tracking subsidies as wellas their intended outcome.
• Individual investors and funds can thendemand financial statements prepared inaccordance with those standards.
• Lobbying in appropriate legislatures can ensurethat the international accounting standards willfit the emerging regulatory regimes for MFIs.
4. Regulation by Third Parties: In the developedworld, financial services businesses areregulated by governmental agencies. Alas, it isnot often the case with MFIs. In the developingworld there is often, at best, a loose regulatoryframework either in place or under development.
The net result is that MFIs function as banks butare not regulated as banks. Such mandatedperformance requirements such as capitaladequacy, liquidity, reserves, reporting, etc. areoften either non-existent or ignored. MFIs tendto be viewed by their host governments asNGOs (non-governmental organizations) and arerelatively free to operate as they wish withvirtually no oversight. For investors this conditionposes obvious risks.
This condition varies dramatically depending onMFIs’ corporate structures. In some counties,NGO MFIs can make the same loans as canregulated MFIs, while the latter will be bound bymuch more stringent regulations than the former.Countries that do regulate MFIs have regulationsthat vary from one anther dramatically (allowingor not allowing MFIs to raise capital in certainways, promulgating different capital adequacyrequirements, etc.), which forces potentialinvestors to become experts in a variety ofregulatory regimes.
The question of regulation is complicated by anumber of factors. First, many MFIs are NGOsand therefore not regulated as financialinstitutions—but some are indeed regulatedunder other frameworks. Second, regulationsdiffer from one country to the next (coordinatingthem would be overwhelmingly daunting). Finally,on a case-by-case basis, some of thoseregulations might be cumbersome andburdensome. In general it should beacknowledged that this is a significant issuebeing addressed by a number of actors.
Opportunities for improvement:
• Investors like ProFund can help MFIs convert toregulated MFIs.
• Market participants can support the creation ofthird-party international recommendations ortemplates for MFI regulations.
5. Investment Rating Services: Withinmainstream capital markets, most investors areunable or unwilling to conduct the type ofcomparative analysis that leads to soundinvestment decisions. Instead, they rely on third-party credit rating entities such as Moody’s,Standard and Poor’s and others. The microcreditindustry has not developed in a way that hasprompted the development of independentrating agencies, a problem that may remain inplace until MFIs and their associated financingdeals grow sufficiently large to warrant the costand attention of mainstream ratings agencies.
A Cautionary Conclusion: Maximizing BlendedValue Returns by Embracing Market Fundamentals
65Blended Value Investing: Capital Opportunities for Social and Environmental Impact
Early investors did not expect a “financial return”on their philanthropic investments so they hadno need for ratings. Microfinance agencies doexist, but unlike the large rating agencies, thesemicrocredit-specific rating agencies look only atmicrocredit. Accordingly, mainstream investorssee such agencies as lacking credibility,sometimes reporting in terms that do notcoincide with those used in mainstreaminvesting. As microfinance and related industriesbegin to attract funds from risk-seekinginvestors, this lack of rating services will posesignificant problems for achieving meaningfulscale. Furthermore, standardized and reputablerating agencies will lower the cost ofinvestments’ due diligence, which currentlyexceeds the typical costs associated withinitiating similarly sized investments in moremainstream markets.
Opportunities for improvement:
• Ratings services such as Standard and Poor’s,Moody’s and others must have incentives toenter this realm
• Local branches of some of these agencieshave rated some MFIs (see ACCION affiliatessection); their experience would surely bevaluable in expanding the practice.
• Here, a “smart subsidy” or creative blendedvalue investment would advance the cause if itcould creatively encourage the mainstreamratings agencies to develop microfinance ratingmethodologies and to overcome the hurdle ofscale.
• MFIs need to see value in being rated, and sofinanciers and foundations alike can give themincentives—in the form of a lower cost ofcapital or a subsidy to purchase the ratingservices—to be rated by an appropriateagency.
6. Fund Comparison Data: While there is somepublic information to allow comparison betweenMFIs themselves, virtually nothing exists to allowinvestors to compare the operating results of theincreasing number of funds investing in MFIs.For a variety of reasons, these funds are likely tobe the vehicles of significant capital flowing intomicrofinance. There are between 50 and 100 ofthese funds in operation today around theworld—with more on the way. Virtually all ofthem are private funds and publish little to nopublic data. A prospective microfinance investorhas little if any means of finding a complete listof funds, comparing their investment terms, andunderstanding their investment results and non-financial impact.
The MFI fund world is relatively small, withrelatively few actors. Accordingly, the informationon past funds should not be difficult toaggregate. Nevertheless, the relatively earlystage of many of these funds (which have notfully repaid principal lent or have not liquidatedequity investments) makes some of themhesitant to share data. A recent report publishedby CGAP aggregates data (as of 2004) on manyforeign funds (though the data are not rendered
for side-by-side comparison).77 The reportindicates that many of those funds sharedinvestors. Some funds have been focused onkeeping their investors through emotional appeal(characteristic of not-for-profit investors) insteadof through a clear statement of performance anda comparison to the investors’ other options.
Opportunities for improvement:
• MFI fund investors need to invest on the basisof expected performance and should demandperformance and comparison data.
• An independent group should study existingfunds and assemble the data in a way thatmakes comparison easy.
• The industry would also benefit from a definitiveforum (a Wall Street Journal, of sorts) in whichfund managers can announce and promotenew funds and where existing funds can reportperformance data.
7. Insurance: Most investors, or the funds inwhich they invest, are able to obtain insurance tohelp manage risk. The microcredit industry hasyet to develop the scale necessary to interestthe insurance industry. Accordingly, such thingsas foreign exchange risk, errors and omissionsrisks, directors and officer’s risk, assetappropriation risk, political risk and others aregenerally uninsurable. While there is some abilityto account for these risks through aggressiveunderwriting and risk sharing within funds, mostinvestors would appear to have few options andrelatively little appreciation of the true relative riskassociated with an investment in microcredit orsimilar offerings.
Opportunities for improvement:
• The small scale of MFIs (relative to mainstreamfinancial institutions) will remain a barrier tocreating these insurance products, butmainstream insurers operating in MFIs’ homecountries may have the means and experienceto offer such products.
A Cautionary Conclusion: Maximizing BlendedValue Returns by Embracing Market Fundamentals
66 Blended Value Investing: Capital Opportunities for Social and Environmental Impact
• Early iterations may need to be subsidized byother (possibly philanthropic) actors who mightprovide assets to underwrite policies thatwould be administered by the mainstreaminsurers.
• Ultimately, as the insurers learned more aboutthe associated risks, mainstream underwritingcapital would enter the market.
8. Liquidity through secondary markets: At therisk of stating the painfully obvious, for a truecapital market to exist there must, in fact, be amarket. Clearly, there is a primary microfinancecapital market where equity is placed or loansmade. From that point on, virtually all of theequity and debt invested in microfinance issimply illiquid. It can not be traded or sold freelyamong willing investors. This simple fact makesit very difficult for the average investor toconsider taking a position. At present there isnot even discussion among those in themicrocredit industry on how or when asecondary market might develop.
Opportunities for improvement:
• The conditions above suggest that there is notyet the demand to buy microfinanceinvestments on a secondary market; insteadinvestors seem interested in investing theircapital in new issues, in part because thosenew issues directly help poor entrepreneurs,while transactions on a secondary marketwould not.
• Spurring a secondary market when there seemto be no buyers would be a dubious prospect,and creating such a market place before it isdemanded would amount to a new “push”investment strategy that would likely not bearfruit.
• Pushing MFIs and investments to adhere to theconditions enumerated above would help makea secondary market more viable and likely.
Implications for the Creation of a Blended Value
Capital Market
Moving the entire industry in the direction of thetier-one institutions (and even beyond them) will bevery difficult. Traditional market forces will certainlypush some institutions in the right direction (indeed,those forces are already doing so, and they arebringing mainstream commercial banks in tomicrolending in many parts of the world).Nevertheless, subsidies—some with very legitimatesocial-value creating outcomes, and some withcounter-productive outcomes—will prevent theentire sector from looking like those tier-oneinstitutions.
At a recent conference on microfinance, BowmanCutter, Managing Partner of Wall Street investmentfirm Warburg Pincus and Chair of the Board ofmicrofinance fund Microvest, shared hisperspective on the state of the microcredit capitalmarket. Cutter spoke at length about the effort,time and resources expended to bring Microvest
into being.78 He observed that he and hiscolleagues created from scratch virtually all of theirwork; they had no templates or standardprocedures to use as models. He observed that ifevery step toward building a microfinance capitalmarket turns out to be as hard as startingMicrovest, maybe the industry should rethink itsstrategy.
Fortunately, Cutter also provided real hope. Henoted that he started in the investment bankingprofession more than 30 years ago. At that time,the profession was effectively in a start-up modeand that everything they did then was a “one-off”creation. He noted that today investment banking isa robust and very successful industry attracting andsuccessfully managing billions of dollars annuallyand that microcredit feels like investment bankingdid 30 years ago.
The success of investment banking was built on afirm's appetite for capital and an investor's desireto put capital at risk. That situation exists today inthe broad range of BVI investment opportunities.The microfinance business needs many billions ofdollars to fund loan portfolios so that hundreds ofmillions of people can begin to create income andwealth and ultimately raise themselves frompoverty. Similar demand for capital exists in the BVIsegments that would fund affordable housing andcommunity development, environmental protection,health, education and related services for the poorin all countries. As was the case in microcredit
A Cautionary Conclusion: Maximizing BlendedValue Returns by Embracing Market Fundamentals
67Blended Value Investing: Capital Opportunities for Social and Environmental Impact
there are many case studies that could have beenadded to those in this paper to make the point thatthere are successful, hard-won interventionsalready in the market.
However, there are a number of steps that precedethe creation of this blended value capital market.
Silos Versus Value Chains
First, blended value market participants, bothinvestors and investees, must collaborate acrosstheir relative areas of interest (for examplecommunity development finance and bankingactors could work more directly with microfinancepractitioners to address common challenges). Allshould work to “come out of their silos”.
Silos breed isolation and the need of everyorganization in a given field of endeavour to doeverything in virtual isolation. When applied toindustries such as microcredit or communitydevelopment, it means the major players withintheir respective organizations are both vertically andhorizontally integrated. They build theirorganizations and attendant support structures.Because the connecting tissue that ties entitiestogether into value chains is not present, they goabout doing everything for themselves. Theydevelop no set of core competencies that whenpaired with others with different core competenciesallow the formation of a true network of firms allaligned in their purpose and relying on each others'strengths to add value to the end customer.
These value chains or collaborative networks arehow business is done in the for profit arena. Oneneed only look as far as a Wal-Mart, Boeing orCisco Systems to see business models based, attheir very foundation, on the assumption thatnetworks add value; going it alone does not.
What are the implications of this for thoseinterested in building a blended value capitalmarket? Leaders in the various BVI areas couldconstruct value chains, ensuring their organizationsdevelop core competencies and distribute commonwork. What is more, they should reach out toexisting players operating outside their BVI areaand enlist them in this effort.
This is exactly what the Calvert Foundation did bygoing to the Depository Trust Company (DTC) tohandle the clearing and holding of communityinvestment notes. The foundation knew this servicewas vital to its business model. It also knewmainstream investors require such a service. Rather
than build an alternative or survive without it,Calvert Foundation created with DTC a value chainthat added value for the customer. In reflecting onhow the case studies presented in this paperevolved, one is struck by how often the successfulinitiative was characterized by the sponsor reachingout to others and building value chains.
Value chains are resource-conserving by design. Asuccessful value chain involves bringing togetherthe best firms in a way that minimizes overlap orredundancy. Who, exactly, benefits whenredundancies are eliminated and the very bestplayers are joined along a line where each is therebecause of a core competency? Quite simply,everyone. Scarce resources are preserved, firmsare there because they add value in their areas ofstrength and investors get the best return becausethe customers get the best good or service at thebest price. The value chain should become themodel of how every BVI initiative is organized.
The second and concluding thought is that thisprocess will take time—a lot of time—and willrequire the building of systems that are, today, notin place. The time is necessary because, at itsmost basic, building successful BVI initiativescapable of attracting and rewarding large amountsof capital is about changing culture—the culture oftraditional financial services groups, NGOs,foundations and other participating entitiesstructured to address the needs of either for-profitor non-profit actors. Conceptually and technically, itreally is not hard to imagine microcredit oraffordable housing or community developmentbeing able to arrange themselves into competitivevalue chains. In most cases the leaders of thevarious BVI segments have a foot in each world,the economic and the social. Their employees,boards and stakeholders expect them to bemission-oriented yet financially successful. That isvery hard to do and requires that culture change toaccommodate the needed alteration in missionexecution.
But if it will be hard for the operators of BVendeavours to change culture, imagine how hard itwill be for investors. The dominant culture assertsthat one cannot mix mission with money. Even thesocially motivated investor merely winks at thenotion that a very well-run microfinance institutioncan address poverty and earn a respectable returnon investment. They hear the story and see thepictures but suffer a cognitive dissonance. Thisdissonance is, of course, what led the founders ofthe microcredit industry to initially approachphilanthropists.
A Cautionary Conclusion: Maximizing BlendedValue Returns by Embracing Market Fundamentals
68 Blended Value Investing: Capital Opportunities for Social and Environmental Impact
A Progression of Investors
Many critiques of microfinance-backed assetsaddress barriers to the widespread adoption ofthose securities by institutional and othermainstream investors. While emerging blendedvalue capital market participants must not forgetthis investor segment is its long-term goal, it wouldbe wise to pursue a systematic plan that will bringthese investments ever closer to that mainstreaminvestor pool by targeting other strategic investorswho can help advance the cause.
Most institutional investors require a defined assetclass (wherein the securities bear a certainuniformity of structure so that the securities’behaviour can be better understood if notpredicted). Most mainstream market participantswould assert that most blended value investmentproducts can not yet be considered legitimatemembers of an asset class. In spite of the recentand effective productization of microfinance bonds,the issues remain too different, there remain toofew of these securities, and they have existed fortoo little time for financial analysts to understandtheir aggregate behaviour.
Furthermore, institutional investors with fiduciaryresponsibilities will often not even invest in a newfund or investment product in the mainstreamcapital markets. Typically, professional investors willavoid fund managers and funds that do not have ademonstrated multi-year track record of managingthat particular investment with that particularinvestment style. They do so because they need tobuild the expected performance of any giveninvestment into sophisticated asset allocation andportfolio models. As long as such quantitativemodels are built on historical performanceinformation, such investors will need to wait foryears until blended value securities can reachsufficient scale and can generate several years ofperformance data. This condition is a factor of timeand it cannot be accelerated.
Instead, market participants offering blended valueinvestments can target other investors strategically(as indeed many already have). Currently, it is a rareblended value investor who can construct areasonably diversified portfolio even ofmicrofinance-backed investments. To do so,investors must have sufficient capital (in the tens ifnot hundreds of millions of dollars) to dedicate tosuch a portfolio, and they must have a dedicatedstaff that can research potential deals and canthoughtfully assemble it.
Thus far, many of these investors have beendevelopment banks and foundations that have boththe scale of investment and staff to effect it. Thiscondition leaves high net worth individuals—thosewith limited staffing resources and a desire todeploy capital in the hundreds of thousands to thelow millions of dollars—limited options for blendedvalue investing. As more and more such investorsexpress interest, there may be a place forinvestment funds that can syndicate high net worthindividuals’ investments and then place those fundsinto a well-diversified portfolio of blended valueinvestments. Such intermediaries could help theseinvestments get “pulled” closer to mainstreaminvestments by making them accessible to the nextstage of investor (after the way has been blazed bydevelopment banks and foundations). If thesefinancial intermediaries build properly diversifiedportfolios, they will be able to sustain theoccasional inevitable losses on individualinvestments.
When high net worth individuals can buy blendedvalue investments, they will eventually andincreasingly ask their professional wealth advisersto incorporate such investments into their overallportfolios. Those advisers, in turn, will bring a newset of mainstream capital resources to bear onthese emerging investments as they research andanalyze these new investments.
Accordingly, blended value market participantsshould continue to focus on “socially responsibleinvestors”, individuals who would purchase blendedvalue investments first because of their expectedSROI and second because of their expected ROI,because those investors can help these assetclasses establish a track record and because theycan bring additional resources to bear on theanalysis of such assets. Nevertheless, in doing so,advisers and investors must diligently focus on thefundamentals and risks of such investments asthough they were purchased purely for theirexpected ROI.
Failing Forward
In any market, particularly an emerging market thathas few precedents, there will be occasionalimbalances of supply and demand. At times priceswill be too high, and at other times they will be toolow. As the markets learn to price risk and digestmarket and non-market events, prices will likelyswing; some people will make money, and somewill lose. The blended value capital markets mustanticipate this sort of volatility and must face itwithout avoiding it.
A Cautionary Conclusion: Maximizing BlendedValue Returns by Embracing Market Fundamentals
69Blended Value Investing: Capital Opportunities for Social and Environmental Impact
Market participants should structure theirinvestments so that market shocks engendermarket corrections, not market collapses. Keys todoing so are diversification (at least in terms ofgeography, financial instrument and fund managers)and conscious risk mitigation. As mentionedelsewhere in this study, foreign exchange riskremains largely unmitigated in many internationalblended value financing strategies. Drastic currencydevaluations have the potential to destroy returnsand collapse private-investor-supported markets forinternational lending unless market participants candevelop facilities to understand and begin tomanage foreign exchange risks.
Fortunately, a number of such initiatives are underdevelopment. Investment advisers such as Omtrixand others have been at the forefront of advancingsuch foreign exchange hedges where they have notexisted in the past.
Furthermore, open communication aboutinvestment methodologies, pricing, failures andequity-holders’ profits will be essential to pricingthese blended value investments correctly. Keepingthe data private introduces the chance that otherfunds will erroneously price risk. When substantialcapital enters (or fails to enter) a market based onmispriced risk, that market is prone to dramaticfailure. Markets cannot accurately price the riskassociated with their securities unless they openlyexplore failures as well as successes.
Investors must also be exceedingly rigorous aboutentering and exiting investments. They must beespecially careful to understand how the drive tocreate SROI can affect an inclination to enter ill-advised investments and their decisions to exit (ornot exit) underperforming investments. Investorsmust have the fortitude to take losses and cut offinvestments that are not obviously salvageable.
The emerging blended value capital markets simplycannot afford for participants to be secretive abouttheir data, ashamed of their failures, or fragmentedin their terminology.
Conclusion
This paper explores various capital structures thathave successfully been used to financemicrofinance, community development and relatedareas. We suggest these blended value investingpractices be extended to other value-generatingprojects or sectors. It must be stated that such aprogression will not be easy, swift or painless.Microfinance has the benefit of over 30 years ofrefinement—a three-decade head start on otherblended value investments. Furthermore,microlending itself has some very appealingcharacteristics that are not necessarily shared byother blended value strategies. The fundamentaleconomics of microfinance are so strong becausethey are built on many loans to many peoplediversified across business sectors. Given thatthose microentrepreneurs are operating inpredominantly cash-oriented economies, oftentimes providing essential goods and services, theyare somewhat insulated from macroeconomicfluctuations. Furthermore, those entrepreneurs canshift their businesses very quickly, exiting andentering new business areas as conditions dictate.
Other potential blended value investment vehiclesmay not possess such appealing risk-rewardfundamentals. Accordingly, investors andintermediaries will need to structure and priceinvestments such that they account for thoseunique risk characteristics. Microfinance’s lessonscannot be applied wholesale and unthinkingly toother blended value investment systems.Nevertheless, the market participants aiming tobring new capital flows to low-cost housing, smallscale irrigation, and so many other systems canand should learn from the laborious 30+ yearjourney that microfinance and its capital marketshave undertaken. Undoubtedly, much can belearned from careful research into the majormicrofinance innovations that led it from aphilanthropically supported enterprise to onesupportable by mainstream capital. Building uponthe great strides made by those within microfinanceand community banking, sustainable financialinnovations hold the promise of expanding intocountless areas of both social need and marketdemand.
A Cautionary Conclusion: Maximizing BlendedValue Returns by Embracing Market Fundamentals
On the Frontiers of Finance Investing in Sustainable SMEs in Emerging Markets
A Discussion Paper for the Geneva Private Capital Symposium
September 24th-25th, 2007
Belinda Hoff, Boston College Institute for Responsible Investment
Mareike Hussels, World Resources Institute
Contributing Authors: Virginia Barreiro, World Resources Institute
Ray Cheung Jesse Last, World Resources Institute
David Wood, Boston College Institute for Responsible Investment
Research supported by:
2
Section 1
1.1 Introduction
Small and medium enterprises (SMEs)1 are a critical component of vital economies. They play an important role in innovation, economic growth, employment creation, and the provision of goods and services to underserved communities, especially in rural areas. Sustainability oriented SMEs that work in environmental sectors or those that serve low-income communities generate additional benefits for society and the environment. Through its New Ventures Project, the World Resources Institute has promoted the creation and growth of such enterprises in emerging economies since 1999. With the sustainable enterprise sector gaining considerable momentum, we feel that it is timely to offer some scrutiny of our own experience from working with entrepreneurs and investors, as well as that of other practitioners in the sustainable SME finance sector. We teamed up with the Boston College Institute for Responsible Investment (IRI) to compile the information and provide it as a basis for discussion in this paper. With the support of the UN Foundation the IRI convened two working groups of Sustainable SME funds during 2006. The purpose of these dialogues was to promote greater understanding of the impact of these funds and to identify ideas to overcome the challenges they face in achieving scale.
Much of this paper is informed by interviews we conducted with 20 fund managers that operate SME funds in emerging markets and developing countries, most of them focusing on sustainable SMEs. In addition we convened a group of these 17 fund managers at a workshop co-convened with the International Finance Corporation (IFC) in May 2007. An overview of the funds and their investment models is provided in section three and in a summary matrix in the annex.
The aim of this study is to provide an overview of the current landscape of sustainable SME finance, clarify key challenges, and inspire discussion among fund managers, investors, entrepreneurs, and the donor community. We see a clear demand for an action oriented dialogue on how the sustainable enterprise sector can best be supported to reach scale, attract additional finance and become more effective in meeting return expectations and development goals. We invite you to join this process and welcome your comments and feedback on this paper.
�
1 As a global orientation to define SMEs, the IFC established a metric in 2003 that defines a Small Enterprise between 5 and 49 employees, and a Medium Enterprise between 50 and 250 employees.
New Ventures - A new way of doing business WRI’s New Ventures Project works with profitable SMEs that safeguard the environment and engage local communities. Our initiative serves as an accelerator for innovative business models that deliver triple-bottom-line benefits by tapping into new market trends from Brazilian fuel cells to rural WiFi access in Asia.
Working in Brazil, Mexico, China, India and Indonesia, New Ventures identifies outstanding entrepreneurs, helps them improve their business plans through training and one-on-one mentoring and connects them with investors. We have supported more than 150 SMEs that have attracted over $43 million in investment, grown their revenues, supplied to large international business and become leaders in their sectors.
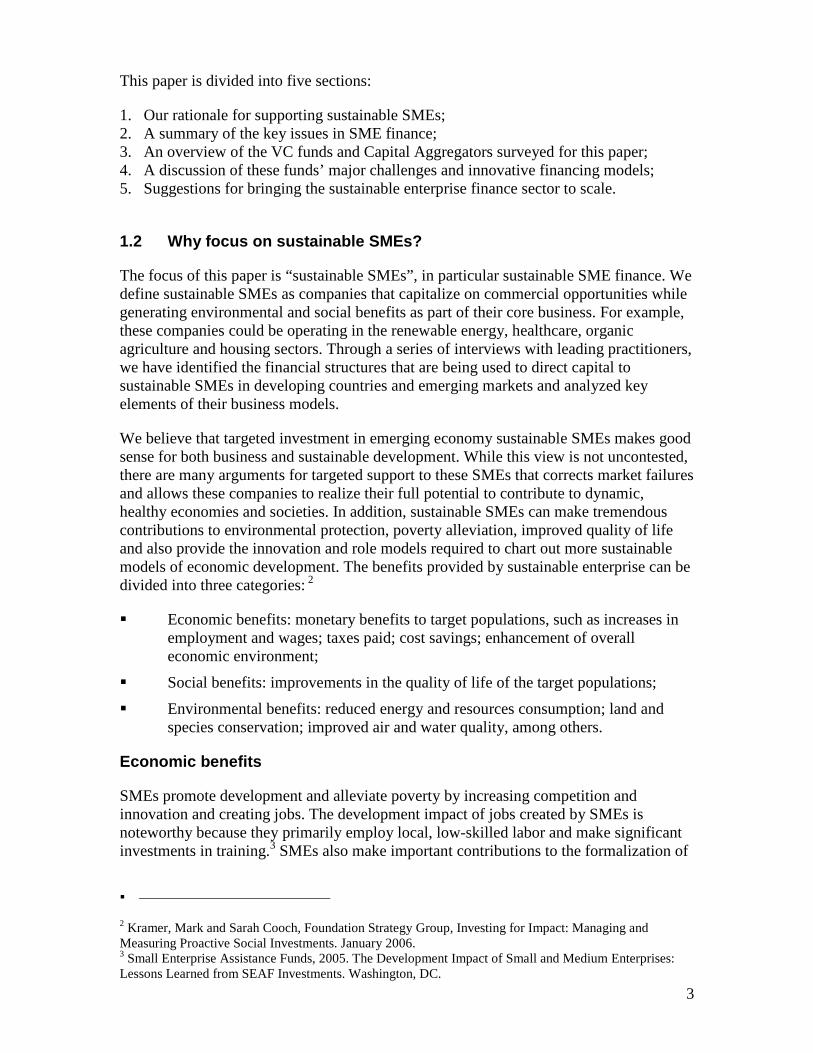
3
This paper is divided into five sections:
1. Our rationale for supporting sustainable SMEs; 2. A summary of the key issues in SME finance; 3. An overview of the VC funds and Capital Aggregators surveyed for this paper; 4. A discussion of these funds’ major challenges and innovative financing models; 5. Suggestions for bringing the sustainable enterprise finance sector to scale.
1.2 Why focus on sustainable SMEs?
The focus of this paper is “sustainable SMEs”, in particular sustainable SME finance. We define sustainable SMEs as companies that capitalize on commercial opportunities while generating environmental and social benefits as part of their core business. For example, these companies could be operating in the renewable energy, healthcare, organic agriculture and housing sectors. Through a series of interviews with leading practitioners, we have identified the financial structures that are being used to direct capital to sustainable SMEs in developing countries and emerging markets and analyzed key elements of their business models.
We believe that targeted investment in emerging economy sustainable SMEs makes good sense for both business and sustainable development. While this view is not uncontested, there are many arguments for targeted support to these SMEs that corrects market failures and allows these companies to realize their full potential to contribute to dynamic, healthy economies and societies. In addition, sustainable SMEs can make tremendous contributions to environmental protection, poverty alleviation, improved quality of life and also provide the innovation and role models required to chart out more sustainable models of economic development. The benefits provided by sustainable enterprise can be divided into three categories: 2
� Economic benefits: monetary benefits to target populations, such as increases in employment and wages; taxes paid; cost savings; enhancement of overall economic environment;
� Social benefits: improvements in the quality of life of the target populations;
� Environmental benefits: reduced energy and resources consumption; land and species conservation; improved air and water quality, among others.
Economic benefits
SMEs promote development and alleviate poverty by increasing competition and innovation and creating jobs. The development impact of jobs created by SMEs is noteworthy because they primarily employ local, low-skilled labor and make significant investments in training.3 SMEs also make important contributions to the formalization of
�
2 Kramer, Mark and Sarah Cooch, Foundation Strategy Group, Investing for Impact: Managing and Measuring Proactive Social Investments. January 2006. 3 Small Enterprise Assistance Funds, 2005. The Development Impact of Small and Medium Enterprises: Lessons Learned from SEAF Investments. Washington, DC.
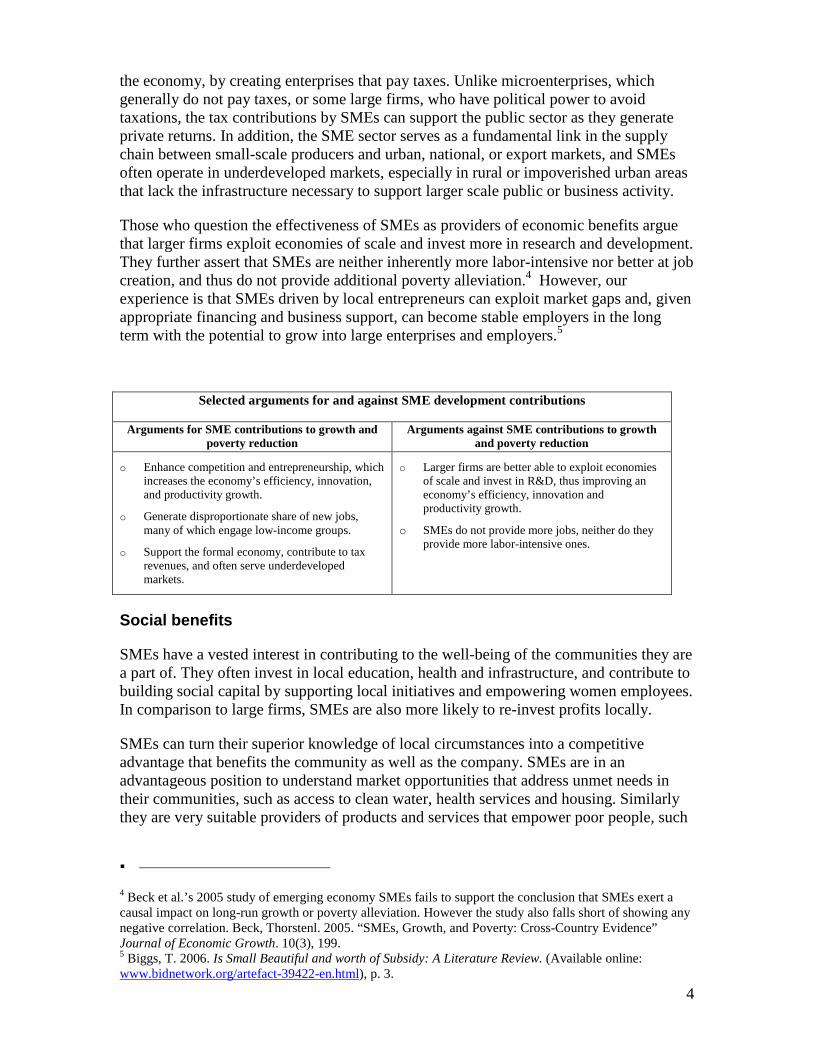
4
the economy, by creating enterprises that pay taxes. Unlike microenterprises, which generally do not pay taxes, or some large firms, who have political power to avoid taxations, the tax contributions by SMEs can support the public sector as they generate private returns. In addition, the SME sector serves as a fundamental link in the supply chain between small-scale producers and urban, national, or export markets, and SMEs often operate in underdeveloped markets, especially in rural or impoverished urban areas that lack the infrastructure necessary to support larger scale public or business activity.
Those who question the effectiveness of SMEs as providers of economic benefits argue that larger firms exploit economies of scale and invest more in research and development. They further assert that SMEs are neither inherently more labor-intensive nor better at job creation, and thus do not provide additional poverty alleviation.4 However, our experience is that SMEs driven by local entrepreneurs can exploit market gaps and, given appropriate financing and business support, can become stable employers in the long term with the potential to grow into large enterprises and employers.5
Selected arguments for and against SME development contributions
Arguments for SME contributions to growth and poverty reduction
Arguments against SME contributions to growth and poverty reduction
o Enhance competition and entrepreneurship, which increases the economy’s efficiency, innovation, and productivity growth.
o Generate disproportionate share of new jobs, many of which engage low-income groups.
o Support the formal economy, contribute to tax revenues, and often serve underdeveloped markets.
o Larger firms are better able to exploit economies of scale and invest in R&D, thus improving an economy’s efficiency, innovation and productivity growth.
o SMEs do not provide more jobs, neither do they provide more labor-intensive ones.
Social benefits
SMEs have a vested interest in contributing to the well-being of the communities they are a part of. They often invest in local education, health and infrastructure, and contribute to building social capital by supporting local initiatives and empowering women employees. In comparison to large firms, SMEs are also more likely to re-invest profits locally.
SMEs can turn their superior knowledge of local circumstances into a competitive advantage that benefits the community as well as the company. SMEs are in an advantageous position to understand market opportunities that address unmet needs in their communities, such as access to clean water, health services and housing. Similarly they are very suitable providers of products and services that empower poor people, such
�
4 Beck et al.’s 2005 study of emerging economy SMEs fails to support the conclusion that SMEs exert a causal impact on long-run growth or poverty alleviation. However the study also falls short of showing any negative correlation. Beck, Thorstenl. 2005. “SMEs, Growth, and Poverty: Cross-Country Evidence” Journal of Economic Growth. 10(3), 199. 5 Biggs, T. 2006. Is Small Beautiful and worth of Subsidy: A Literature Review. (Available online: www.bidnetwork.org/artefact-39422-en.html), p. 3.
5
as microfinance or affordable telecommunications. Moreover, because of their understanding of local culture, SMEs are well positioned to engage low-income communities as producers, for instance through support for agricultural co-operatives.
Additionally, many SMEs engage in business that preserves and enhances local culture, such as arts and crafts, sustainable agriculture or forestry, and – if well managed – eco-tourism. The example of Fideos Coronilla highlights the difference a socially oriented company can make by engaging marginalized communities as employers, employing low skilled labor and providing critical benefits and support to the community.
Environmental benefits
SMEs that address environmental challenges primarily operate in the following sectors: clean technology, renewable energy and energy savings, organic agriculture, certified forestry, eco-tourism and green construction. The deterioration of ecosystems and their
decreasing ability to provide natural resources and vital regulating services, such as the climate system and water cycles, is creating market opportunities for products and services that address these challenges. Some sectors such as renewable energy, and organic food products have already developed strong commercial potential in developed markets and are increasingly profitable in emerging economies. Sustainable SMEs tap into these opportunities, innovate locally oriented solutions to environmental challenges and drive the development of “green markets” that value environmental externalities.
Often, environmentally sound products are particularly relevant for developing country conditions. For example biomass, solar or wind energy can be well-suited to provide electricity in rural
Transforming coffee supply chains Richard Trubey and the rest of the team behind Solar Trade Corporation (STC) have created an innovative coffee drying system powered by biomass and solar energy that cuts nearly 90 percent of electricity and eliminates the use of fire wood or diesel in coffee drying. STC is also offering hermetic storage systems that preserve the quality of dried coffee at origin and in transport. With its Café Solar® brand, STC aims to transform the coffee supply chain.
STC’s comprehensive approach gives local farmers the independence to dry and store their own coffee while providing a 34 percent production cost savings. STC is also using its low-emission system to capitalize on emerging opportunities in carbon-trading markets. The enterprise is working with the government of Honduras to set a goal of transitioning 1/3 of the country’s coffee production to solar power and design a carbon market for trading by producers. Farmers using the STC system will easily out-compete producers using conventional dryers that consume large amounts of increasingly expensive energy.
Building opportunities for marginalized communities Fideos Coronilla is a Bolivian-based company that offers organic, gluten-free snacks made from traditional Andean grain. The company purchases the grains for its products from local farmers’ cooperatives, directly benefiting 6,800 farmers and their families. One of Coronilla’s inputs, the rare Andean grain cañawa, is grown in remote and isolated areas of the country. The population of these isolated regions belongs to the poorest of the poor in Bolivia and the sales to Coronilla are helping greatly in raising their living standards.
The company is also an important source of employment, training and education for the community. Coronilla provides employment and benefits, such as healthcare, milk subsidies and formal education, to more than 30 workers a high-proportion of which are low-skilled and female. The company contributes to a local educational organization, coordinates educational meetings on health and hygiene and sponsors a student award. As a result Coronilla’s employees are healthier than the average local worker and have increased the chances for their children to lead healthier and more productive lives.
6
and off-grid communities and in the process reduce the unhealthy and environmentally damaging use of firewood and charcoal.
Section 2: Overview financial actors
2.1 Types of SME finance and financial actors
In well functioning financial systems, SMEs are able to access a range of financing options as their business grows. For example, a typical SME in the US will start with a combination of personal savings, contributions from friends and family, debt from banks and potentially start up funds from angel or venture capital investors. As their needs change, SMEs can access additional sources of capital, including trade finance/supplier credit, factoring, leasing arrangements, commercial debt, private equity (venture capital) and ultimately aim for an initial public offering to obtain further financing.6 Each of these options brings firms into contact with different financial actors and the sources of capital that are best suited to different parts of the business cycle. The ability to graduate from one form of financing to the next is critical to the company’s success.
SMEs in developing countries typically operate in a less supportive environment. Often SMEs are too small for commercial lenders, and too big for microfinance institutions. Reasons for this situation are varied and include an incomplete financial institutional infrastructure, a lack of competition among local banks, restrictions on capital allocations by local investors, or macroeconomic policies that emphasize government debt. The lack of familiarity of banks with business opportunities in the SME sector, perceived risk, high transaction costs and asymmetrical information pose additional difficulties, compounded by lack of credit scoring mechanisms and experience with relationship lending – lending based on a close, long-term bank-borrower relationship.7 For providers of risk capital, the historically poor market for exit and low shareholder protection mechanisms are impediments to investment in developing countries.
�
6 Hamilton, B. (1990). How to Write a Business Plan, contained in the US SBA publication Financing for the Small Business (FM-14). Online at: www.ussba.gov. OECD, The SME Financing Gap, Vol 1. p. 42. 7 Wendel, Charles B., and Matthew Harvey. 2006. “SME Credit Scoring: Key Initiatives, Opportunities, and Issues”. Access Finance. (World Bank Group) No. 10, 1 and 6.
Partnering with local banks: Shorebank, Shared Interest and Rio Bravo ShoreCap International (a subsidiary of ShoreBank Corporation) invests in local banking institutions in developing countries. A key part of ShoreCap’s approach is to provide technical assistance to investee institutions through its affiliate ShoreCap Exchange. Such assistance can encompass a variety of institutional capacity building measures, including transfer of specialized micro and small business lending technologies, as well as more specific training on assessing the environmental risks associated with investments. Shared Interest operates an open-ended, loan guarantee facility through a related entity in South Africa, Thembani International Guarantee Fund (Thembani). Guarantees are provided to businesses providing services to rural and underserved communities including micro-finance, low-cost housing, small manufacturing, retail businesses, and agriculture. Thembani works closely with local banks with a two-way referral service for clients. Thembani’s guarantees allow these businesses to access loans that would otherwise be unavailable which, in turn, exposes local banks to the SME sector creating opportunities for them to gain a better understanding of these customers. Rio Bravo, a Brazilian investment firm, is partnering with a large Brazilian bank for a $125 million sustainability venture capital fund that is about to be launched for fundraising. The partnership will allow Rio Bravo access to the bank’s extensive network of commercial relationships across the country and the bank in turn will gain experience in the field of sustainability driven business.
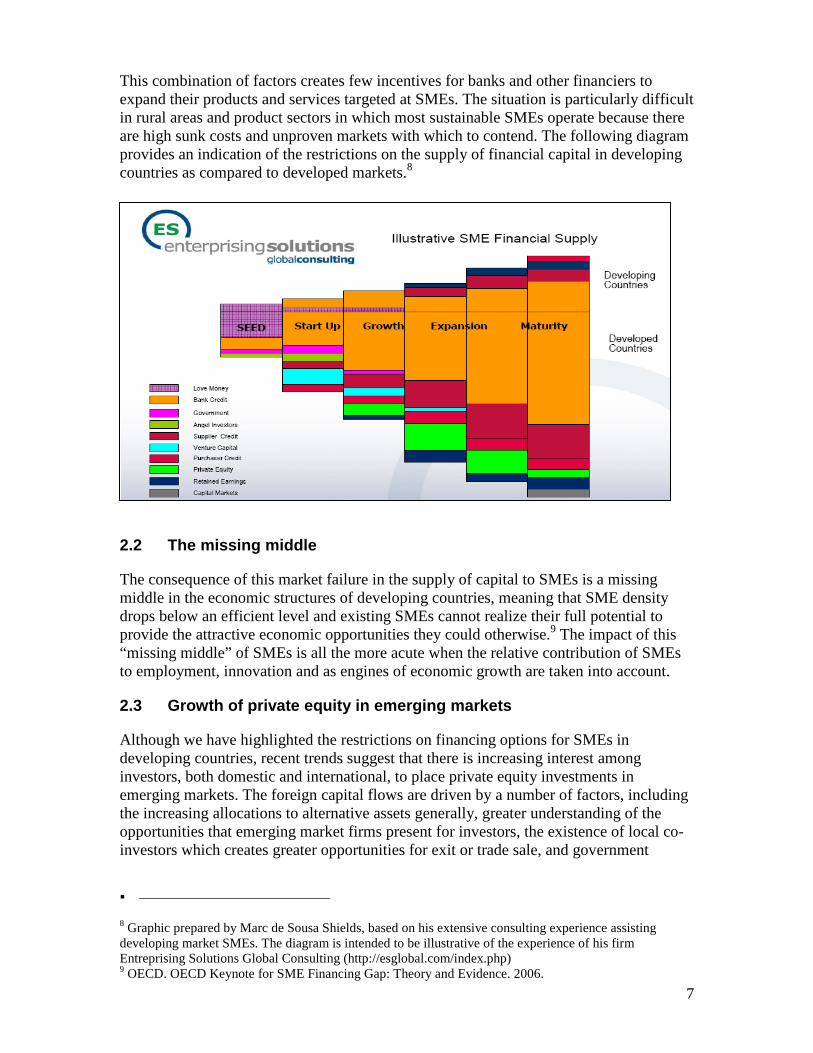
7
This combination of factors creates few incentives for banks and other financiers to expand their products and services targeted at SMEs. The situation is particularly difficult in rural areas and product sectors in which most sustainable SMEs operate because there are high sunk costs and unproven markets with which to contend. The following diagram provides an indication of the restrictions on the supply of financial capital in developing countries as compared to developed markets.8
2.2 The missing middle
The consequence of this market failure in the supply of capital to SMEs is a missing middle in the economic structures of developing countries, meaning that SME density drops below an efficient level and existing SMEs cannot realize their full potential to provide the attractive economic opportunities they could otherwise.9 The impact of this “missing middle” of SMEs is all the more acute when the relative contribution of SMEs to employment, innovation and as engines of economic growth are taken into account.
2.3 Growth of private equity in emerging markets
Although we have highlighted the restrictions on financing options for SMEs in developing countries, recent trends suggest that there is increasing interest among investors, both domestic and international, to place private equity investments in emerging markets. The foreign capital flows are driven by a number of factors, including the increasing allocations to alternative assets generally, greater understanding of the opportunities that emerging market firms present for investors, the existence of local co-investors which creates greater opportunities for exit or trade sale, and government
�
8 Graphic prepared by Marc de Sousa Shields, based on his extensive consulting experience assisting developing market SMEs. The diagram is intended to be illustrative of the experience of his firm Entreprising Solutions Global Consulting (http://esglobal.com/index.php) 9 OECD. OECD Keynote for SME Financing Gap: Theory and Evidence. 2006.
8
policies that create improved financial stability.10 Attractive return prospects coupled with these improvements to the investment climate have led to substantial increases in flows of international capital to emerging market private equity funds. In 2006, private equity funds in emerging markets raised $33.2 billion in capital commitments. This represents a 29 percent increase over the $25.8 billion raised in 2005 and more than a 400 percent increase over the $6.5 billion raised in 2004. Moreover, a 2007 EMPEA11 survey of Limited Partner interest in emerging market private equity reveals promising trends. Just fewer than 80 percent of those interviewed expected to increase their commitments to emerging markets over the next three to five years.12
In addition to increased international flows, in many emerging markets, there is also a growing pool of local capital that is seeking out alternative asset classes, including private equity. With changes to macroeconomic policy making government bonds less attractive and growing pools of local savings through shifts to pension policies, local institutional investors are looking for ways to maintain returns and diversify their portfolios. There is also growing awareness of the virtuous cycle that is created for economic development through well-functioning financial markets and the need to harness local savings to contribute to facilitate market development.
Experience of the Small Enterprise Assistance Funds (SEAF) in Colombia and Peru SEAF has a long history of investing in SMEs and proving the market for SME financing. To establish a fund in Colombia and Peru, SEAF, with the support of USAID, worked closely with the governments of both countries to amend regulations that restricted the investment choices available to public pension funds. These restrictions did not permit private equity investment limiting the funds’ ability to diversify their portfolios. SEAF tackled the problem with an integrated approach: The patient capital provided by USAID permitted SEAF to establish a fund administrator and build credibility in Colombia and Peru while it worked with the multiple regulators and the pension funds to identify the regulatory barriers, negotiate and draft the needed modifications and push the changes through the various levels of government. SEAF brought in experienced US venture capital and small business investors to make the case to the government and regulators, demonstrated its capacity to meet the transparency, valuation, fiscal control and reporting requirements for a regulated fund administrator and lined up a pipeline of potential investments. With a viable private equity investment vehicle and investment commitments from international development finance institutions such as SECO, BIO and USAID, the local governments had an incentive to approve the required regulatory amendments and the pension funds and insurance companies were ready to invest. The groundbreaking result was that, for the first time, pension funds and insurance companies were able to invest in private equity funds. As a result, SMEs in these countries were able to access regulated capital that had previously been off-limits. Opening the door to these new sources of capital is a critical piece of the development equation because it means that domestic resources can now be channeled toward helping the local economies grow.
�
10 The International Bank for Reconstruction and Development, “Global Development Finance 2007.” The World Bank. Washington DC, 2007 11 EMPEA is the Emerging Markets Private Equity Association founded in 2004, comprised primarily of private equity fund managers, but also includes institutional investors, service providers and others with an interest in the asset class. 12 EMPEA, “Survey of Limited Partner Interest in Emerging Markets Private Equity.” May, 2007
9
2.4 A view on sustainable enterprise finance in Chi na
For Chinese entrepreneur Chen He, one would think that finding financiers for her Tianjin Lotus Biological Technology Company would not be a problem. After all, the firm, which produces non-toxic seed fertilizers that strengthen crop growth while reducing the use of chemical fertilizers, has been doubling its revenues for each of the last three years with annual sales now topping 675,000 RMB. However, Chen He has not been so fortunate. “I have not received any loans or any private investment. The banks and venture capitalists say my company is too small and that I have too little collateral to justify the risks,” explained Chen He. With the exception of a 70,000 RMB municipal government grant, she has invested over close to 3 million RMB of her own money into the company since its founding in 2003.
Chen He’s predicament reflects the continued financing challenges of China’s SMEs, which number over 4.3 million firms and account for 60 percent of China’s GDP. Despite the country’s booming economy and the massive surges in foreign investment, SMEs still find it difficult to raise the necessary capital to build up their businesses. This situation is particularly evident for smaller businesses and those in new sectors, such as the green industries that are being promoted by the government to counter China’s worsening ecological conditions. Of the $420 million cleantech venture capital that was estimated by Clean Tech Venture Capital to be invested in China in 2006, very little made it into the hands of SME entrepreneurs, such as Chen Jing of the Jiangsu Ruikang Organic Food Corporation. With the help of some bank loans her small business has grown to a 10 million RMB gross revenue earning firm, but is still unable to attract venture capital investment. According to Chen Jing, the reason for her rejection is that the revenues are simply not big enough: “How can I grow without the investment? It’s like the old Chinese saying – having the horse run without feeding it grass!” When looking at potential firms, most venture capitalists use the benchmark of 50 million RMB in gross revenues, before taking a serious look at the growth potential of the business.
The reasons for SME’s financing struggle are not simply because of size. Stephen Guo is director of research at China Environment Fund (CEF), a fund that invests exclusively in Chinese green industries. According to Guo, venture capital investors are hesitant about the smaller companies because they often lack proven management and finance skills. “A lot of these businesses are run by people who are technical experts and not managers,” said Mr. Guo who meets as many as 80 firms a month.
To make matters even harder, China lacks a culture of angel investors, affluent individuals who are willing to front start-up costs during the difficult phase of setting up an enterprise. As a result, the remaining formal channels of capital for SMEs are the banks and government. But banks are reluctant about lending to the small businesses because of their little collateral and perceived inability to service their debt. Institutions that do loan require their borrowers to have their debt collateralized through credit guarantee centers, which can be extremely expensive. Ruikang Organic Food Corporation was only able to secure a 2 million RMB loan from the local bank after paying the credit guarantee center a fee of 500,000 RMB. Although this amount was later deducted from the principal borrowed, as a down payment it represents a prohibitive proportion of the capital requirements for many SMEs.
Liu Zheng, of the Shenyang SME Credit Guarantee Center noted that too many lenders inappropriately use the same measures of performance for smaller companies as they do for larger ones, and the risks are often overestimated. “For SMEs, non-financial factors are comparatively more important than the financial ones,” said Liu who uses the seven standards – character, ability, margin, purpose, amount, repayment, and insurance, when evaluating perspective clients. The center has provided guarantees for over 1,000 SME loans worth a total of 400 million RMB. Out of the total amount borrowed, bad debts accounted for less than .001 percent.
Fortunately, there is help. Organizations like the World Resources Institute’s New Ventures Program, which helps sustainable entrepreneurs improve their management and finance skills, while working with venture capitalists to invest in the more promising companies. The Chinese government is also trying to better the situation and reduce the bottlenecks of SME financing. Policies already implemented include a three-year business tax exemption for qualified SME credit guarantee centers. Another big boost has been the passage this year of a new property law, which should help SME collateralize their assets and secure bank financing.
10
What could be the biggest saving grace for sustainable SMEs is that China’s deteriorating environmental problems have created enormous demand for new technologies and services. Deutsche Bank projects environmental investments in China to grow annually by 16 percent and reach a cumulative USD230 billion by 2010. With the ability to develop niche and cutting edge products, smaller firms are in prime position to capture the demand that could lead them to financial success. “China’s environment needs all the help it can get. The more companies in the sector, the better it is for the environment,” observed CEF’s Guo. Indeed, the belief that they can make a positive contribution for China’s development is driving many of China’s small green entrepreneurs to overcome their struggles. “My product can really help farmers and protect the environment,” said Chen He of the Tianjin Lotus Biological Technology Company. “I know the problems I am facing now are only temporary!”
Section 3. Overview of existing funds & Capital Agg regators
3.1 Information gathering
Recognizing the positive social and environmental impacts as well as the financial opportunities, that can be achieved through a vibrant sustainable SME sector, a number of innovative financial intermediaries are identifying ways to channel more capital to sustainable SMEs whether through direct investment or using other mechanisms to bridge the financing gap. Poor management is frequently cited as the principal reason for small business failure, with inadequate or ill-timed financing a close second.13 By providing access to the right sort of capital, at the right time, coupled with technical assistance and business development services, these funds are helping to create long-lasting businesses that have tangible environmental, social and economic impact.
In order to gain a better understanding of the ways that funds are overcoming the barriers to sustainable SME investment in emerging markets, we conducted 20 interviews with leading funds and convened 17 of them in a workshop with the IFC. The purpose of our interviews was to find out how the funds were structured and identify the challenges they are facing in bringing their operations to scale. In this section we provide a brief overview of the funds, while in the next we discuss their challenges.
The interviewed funds are listed below and further details about size, sector focus, funding sources and investment mechanisms are provided in the annex.
� Acumen Fund � Axial Par � Asia West Environment Fund III, Asia West
�
13 United States Small Business Administration, “Finance Start-up”, Available online: http://www.sba.gov/smallbusinessplanner/start/financestartup/SERV_FINANBASICS.html
WRI-IFC fund managers workshop On May 8th, 2007, WRI and IFC hosted a workshop for fund managers that invest in clean technology, clean energy, and biodiversity in emerging markets. The event convened 17 fund managers from Latin America, Africa, Eastern Europe and Asia whose exchange of experience greatly helped to inform this paper. Discussion focused on fundraising, the project pipeline, technical assistance and monitoring and evaluation. From the workshop emerged a strong interest for additional networking opportunities, specifically for sustainability oriented fund managers from or operating in emerging markets and developing countries.
11
� China Environment Fund, Tsing Capital � E+Co � Econergy Clean Tech Fund, Econergy � Environmental Investment Partners (Continental Wind Partners, European
Investments & Partners) � Evolution One Fund, Inspired Evolution Investment Management � Fondo EcoEmpresas, The Nature Conservancy � Grofin � Photovoltaic Market Transformation Initiative, Impax and IT Power UK & India � Rio Bravo Sustainability I � Root Capital (formerly Ecologic Finance) � Shared Interest � Shorebank � Small Enterprise Assistance Funds (SEAF) � Southern African Cleantech & Sustainability Fund, Inspire South Africa � Stratus VC III, The Stratus Group � Triodos Renewable Energy for Development Fund, IT Power India � Verde Ventures, Conservation International
3.2 Characteristics of the funds examined
The funds interviewed are all focused on investing in sustainable SMEs in emerging markets and developing countries. Some funds are based in country, while others are internationally based with local offices and investment teams. The range of different business models they represent can best be captured by looking at the two ends of the spectrum that emerged:
� Locally based venture capital funds that are realizing opportunities for financial and sustainability returns by targeting growth sectors such as cleantech and renewable energy (VC Funds).
� The second group we describe as “capital aggregators” - internationally based funds with a primary focus on creating positive economic, social, and environmental impact by supporting sustainable SMEs and generating financial returns for investors (Capital Aggregators).
We found that the local VC Funds tend to have higher levels of risk while the Capital Aggregators use a blended capital approach, combining capital from fully risk adjusted sources to softer mission-focused funds from donors (elaborated in section 4.2).
VC Funds tend to make investments of between $1million and $5 million, putting them at the “medium” end of the SME spectrum. These funds are mostly structured as limited partnerships, and primarily target opportunities in growing environmental markets, such as renewable energy, energy efficiency, organic food products and new materials. In contrast, the Capital Aggregators tend make investments between $20,000 to 1 million, using a variety of instruments from “standard” equity investments to straight debt, with a range of quasi-equity structures in between that permit the fund to participate in the upside of the portfolio company while being structured as a debt investment.
The returns generated also varies across funds, with the local VC Funds seeking market
12
rate equity returns and the Capital Aggregators’ targets and performance ranging from preservation of the initial capital to market rate debt returns. For many funds, the local regulatory environment has a strong influence over the structure of their investments. In some cases creditors receive greater practical protections than shareholders, while in others it is the preference of the SME/entrepreneur to obtain debt rather than equity financing due to either cultural preferences or capacity to receive and manage an equity investment.
Some of the key features of these two groups are listed in the table below.
VC Funds Capital Aggregators Date of creation (trend) 2002 – 2007 1998 – 2001 Size of fund (USD) 10-35 million
(current fundraising up to 150m) 5-20 million per fund (NB some managers were operating multiple funds with up to $100 million in total assets).
Av. investment size (USD) 1-5 million; mostly medium sized companies
20,000 – 1 million
Investment model VC model, equity investments and some convertible debt; seeking risk adjusted rates of returns; fund managed locally
Mix of debt & equity; HQ often in US/EU; return expectations range from proving model to local interest rates
Funding model Patient capital & commercial investment; Early investors mostly family offices and development finance institutions, now increasingly local institutional investors
Combination of risk capital and soft donor funded capital; instruments include debt; promissory notes; partnership structures; private investment vehicles limited to accredited investors; combination of separately raised equity and debt pools
The interviews and broader conversations also indicate significant growth in sustainable enterprise finance. Many of the VC Funds interviewed were either still in or had recently completed their fundraising phase. In Brazil alone, a new sustainability fund has just started investing and two more are being raised this year. Other players are emerging in Central America, two funds are raising capital in South Africa, and the pioneer in cleantech investment in China, the China Environment Fund (CEF), is raising its third fund, after completing two successful exits through IPO this year. CEF and Axial Par, the oldest VC Funds of those interviewed, were both capitalized by family offices while the more recent funds are targeting local institutional investors and international financial institutions, demonstrating the growing recognition of commercial opportunities in this space. And while the VC Funds have, to date, mostly focused on environmental companies, where the commercial opportunities are clearest, there are indications of a wave of commercial fund creation focusing on BOP business opportunities.
Similar growth is evident among the Capital Aggregators. While some of the older Capital Aggregators have been operating funds since the early 1990s, many raised their first rounds of capital between 1998 and 2001. Currently, we are seeing existing players growing in size or raising follow-on funds, as well as number of new funds recently created, such as Agora Partnerships and Care Enterprise Partners. All funds have, in some form, combined capital with technical assistance and business development services. Although this model raises costs, it also helps to mitigate the risk of business failure.
13
Further, almost all of the Capital Aggregators are engaged in some form of monitoring and evaluation of their economic, social and environmental impacts. These additional costs are both sources of challenges for the Capital Aggregators, and in some cases the VC Funds, which we outline in greater detail in the following section.
Section 4 – Challenges
4.1 Introductory comments
SME financing is a complicated business anywhere in the world, but the funds interviewed for this paper were up against an impressive range of challenges from a restrictive business environment, to the lack of a good project pipeline and supportive financial infrastructure to the trials of operating in sectors without a long track record. In the following section we will focus on three challenges cited as significant pieces of the sustainable SME fundraising puzzle by the fund managers interviewed: fundraising and coordination of blended capital; technical assistance to entrepreneurs; and monitoring and evaluation of economic, social and environmental benefits. In our view an analysis of these issues also provides a map for areas of intervention by mission driven investors and development institutions. Smart deployment of capital by investors and donors will go a long way in scaling sustainable SME finance and unlocking additional capital.
The Aspen Institute, Acumen Fund and Dalberg Global Development Advisors launched a “Private Sector in Development Initiative” in 2006 and have convened three meetings of key players in the sustainable SME sector in the US since then. The aim of the Initiative is to build a stronger “movement” around sustainable SME finance, mobilize additional capital and put the building blocks into place that will allow the sector to grow. The Initiative seeks to facilitate the right approaches, services and partnerships required to generate the deal flow, invest responsibly, measure effectively and ultimately build sustainable enterprises.14 WRI and IRI are part of this Initiative and will engage the other participants for further development of this research.
4.2 Fundraising challenges
Among the funds interviewed, there is a clear division between those funds seeking commercial risk capital and those coordinating and “blending” different types of capital spanning commercial capital to philanthropic grants. While some of the fundraising challenges identified are common to both groups, funds seeking blended capital had to overcome different, and some additional, obstacles in obtaining finance. More so than the VC Funds, they have to balance the tension between needing to prove the financial viability of the sustainable SME sector as an asset class and remaining focused on achieving positive non-financial (social, economic and environmental) impacts.
�
14 The group’s development of shared metrics is outlined in section 4.3.
14
Increasing mainstream investor interest in sustainable SME financing
With private equity investment only recently starting to grow in many emerging markets, mainstream local investors are often not very familiar with this asset class. For example, in Brazil (one of the most vibrant equity markets of the regions included in the survey), only recently have investors needed to take on more risk and seek out alternative asset classes beyond government bonds in order to achieve high returns. In some cases, as shown with the example of SEAF in Colombia and Peru (see section 2.3), legislative intervention has been required to permit local investors to consider private equity as an investment opportunity and achieve greater portfolio diversity. Even in those regions where investors are becoming comfortable with private equity investment, there is a lack of familiarity with sustainable sectors. This creates an additional hurdle for funds focused on organic agriculture or renewable energy, for example, as some of these sectors demand a longer investment cycle than traditional venture capital and therefore require investors with longer time horizons and patient capital.
Perhaps the biggest challenge to fundraising identified by participants at the WRI-IFC workshop was proving that the sustainable SME sector can be profitable in the long term. Fund managers raised concerns about the difficulty in attracting international investors when they, themselves, had relatively short track records. This problem, shared with new entrants in developed markets, creates a dilemma for fund managers in that they need capital to create a pipeline and prove the viability of the sector, yet cannot raise the initial capital required to do so. In particular, upfront expenses to train local investment teams and to start creating a pipeline mean that without the support of patient capital - whether from individuals, foundations, or development finance institutions - it can be hard to achieve the scale needed to prove the model.
Challenges of blended capital
The core concept of blended capital is that it brings together investors seeking different rates of single, double or triple bottom line returns, from those seeking purely financial returns to those only interested in the social, environmental or economic impact. In essence, the softer capital operates as a “smart subsidy” for the Capital Aggregators and some VC Funds.15 These subsidies are justified as the interventions made by the funds help to rectify existing market failures and are made on a commercial basis at the SME level, helping to avoid moral hazard. Unsurprisingly, funds that use this approach feel a tension between maintaining a deal flow that generates attractive financial returns to some investors, while at the same time delivering the non-financial impacts sought by others.
�
15 As set out in the UNCDF’s Blue Book on Inclusive Financial Sectors for Development, the four broad categories of “smart subsidies” are those that seek to overcome the financing gap for SMEs by:
(1) improving risk mitigation opportunities; (2) fostering greater transparency among borrowers; (3) increasing efficiency and reducing costs thereby permitting scale; and (4) enhancing innovation among lenders.
UNCDF. 2006. Building Inclusive Financial Sectors for Development: Executive Summary. (Online at: www.uncdf.org/English/microfinance/pubs/bluebook/index.php). “The Blue Book”, 20.
15
Among the Capital Aggregators we interviewed, a number of different approaches are used in order to bring together different sources of capital.
� Offering investors different levels of risk exposure. For example, creating different tranches within the fund or combining a range of different instruments to raise capital are ways to achieve this.
Examples of risk apportioning structures: E+Co and Root Capital
E+Co, a small scale clean energy fund, blends public and private capital via a range of instruments to meet its capital requirements. The primary investment vehicle is a managed account with a coherent set of investment guidelines, transparent governance and multiple options for investors, lenders and grantmakers, allowing for a layering of financial, social and environmental returns. This is supplemented with loans (issued as promissory notes) and donations, which covers costs such as business development services and monitoring and evaluation costs. E+Co has also established a subsidiary fund management corporation, E+Capital Latin America, and special purpose partnerships that more closely resemble traditional fund structures. E+Co Capital Latin America manages an Inter-American Development Bank sponsored fund in Central America, CAREC.
Root Capital provides short term and long term loans to producers in rural, low-income communities in Latin America, Africa and Asia. Using funds from socially minded investors, Root Capital seeks to prove that these environmentally-sustainable SMEs – such as organic coffee cooperatives, lead-free ceramics producers and ecotourism enterprises – are in fact bankable. To mitigate portfolio risk, Root Capital uses a three-way “factoring” model whereby the loans are guaranteed with future purchase contracts that the SMEs hold with buyers. Contributors to Root Capital’s capital pool include agricultural product importers, international coffee roasters, high-net worth individuals, foundations, religious institutions, and socially responsible investment firms. Some supporters are investors seeking a financial return while others are donors providing grant funding. Root Capital issues promissory notes to investors with interest rates averaging 2.6 percent over a 1-5 year period. In case of a loan default, Root Capital takes the first loss position, followed by their investors who share risk equally. Additionally, for certain Root Capital loans placed under a USAID Development Credit Authority (DCA) Guarantee, the U.S. government provides 50 percent risk sharing on the loan in case of default.
� Raising funds explicitly for different purposes and maintaining capital in segregated funds for these purposes.
Segregated funds for blend capital: The Nature Conservancy and Grofin The Nature Conservancy (TNC) established its Fondo EcoEmpresas as a separate entity, in which it co-invested alongside a group of partners including the Inter-American Development Bank (IADB )/Multilateral Investment Fund, Corporacion Andina de Fomento (Andean Regional Development Bank) and socially responsible investors. TNC purchased its shares with grant-based funds, which allowed a number of smaller donors to contribute to the venture, despite the minimum amount required for direct investment. The total committed risk capital of $5.2 million is supplemented by a separate technical assistance facility, managed through TNC. The technical assistance pool was provided on a grant basis by donors including the IADB, IFC/GEF, foundations, and TNC donors. Interestingly, TNC found that because of the tax benefits afforded by charitable contributions, many individuals preferred to support the venture by allowing TNC to purchase shares with their donations or by contributing to the technical assistance facility than by direct investment in the fund.
While Grofin , an African SME fund, does not find securing capital to be a problem, close attention is paid to the composition of the investor base for its funds. This involves balancing
16
local and international investors as well as considering the non-financial benefits that some investors bring, for example multi-national companies who play a key role in pipeline development. Investors in Grofin’s funds include banks (50 percent), development finance institutions (18 percent), local currency investors (14 percent) and corporations (18 percent), who all participate on equal terms. In order to supplement these equity contributions, Grofin has special co-finance arrangements with local banks whereby a predetermined pool of capital is available to make loans to portfolio companies. Co-finance arrangements are done on the same risk-reward basis as fund capital and Grofin is responsible for administering the pool.
Communicating the nuances of these blended capital structures and maintaining them present significant challenges to the Capital Aggregators, with even the most flexible types of capital coming at a cost. The two issues we focus on here are:
� Difficulties in explaining the concept of blended capital and ensuring transparency around the use of “smart subsidies”.
� High transaction costs associated with coordinating different types of capital due to timeframes, the “fundraising treadmill” and priority areas for different organizations.
Explaining concept of blended capital and ensuring transparency
As the idea of blended capital and applying commercial solutions to development problems is still a relatively new innovation, many Capital Aggregators reported difficulty in communicating the benefits and nuances of their approaches to potential investors and donors. In particular, this related to justifying the use of “smart subsidy” in order to preserve returns for commercial parties.
We do not to suggest that the application of “smart subsidies” by these funds is inconsistent with best practice.16 Rather, we emphasize that a key feature of best practice that we identified among fund managers was transparency around their structure and the application of the smart subsidies. There must be understanding of the risks and costs associated with achieving scale in order for the existing funds to play their role of proving the model of sustainable SME finance and encouraging new entrants and investors.
High transaction costs associated with capital coordination
Many fund managers observed that considerable time is required in order to obtain different types of capital. Given the relatively small amounts that are being asked of different donors, a disproportionate amount of staff time and resources are required to bring funds to scale. Many funds noted that a more streamlined fundraising process would allow them to focus more time and resources on assisting entrepreneurs and making investments. The difference in the grant funding process (cyclical) and the investment process (ongoing) poses an additional coordination challenge. Funds also noted the need to tailor their pitch so that the social, environmental and economic impacts were both broadly defined to capture a wide audience, but still specific enough to attract
�
16 UNCDF. 2006. Building Inclusive Financial Sectors for Development: Executive Summary. (Online at: www.uncdf.org/English/microfinance/pubs/bluebook/index.php). “The Blue Book”, 20.
17
those funders that would take the riskier positions in the funds on the basis of the high non-financial returns.
The complicated timing for philanthropic grants can affect the funds ability to provide ongoing technical assistance. For example, Capital Aggregators were concerned that the cycle for SME finance – the shortest of which is ten years – was far longer than the typical program cycles for grant-making institutions. As these grants often fund key components of the funds’ pipeline development, due diligence and risk management processes, they are a critical ingredient for financial success over the term of the fund.
Funds also reported a tension created by the additional costs associated with achieving the social, environmental and economic impact that are required to attract grants both in terms of pipeline development and ongoing technical assistance. In particular, maintaining a focus on those businesses most affected by the financing gap can increase the risk exposure of the fund without commensurate increases to potential financial returns. Thus it is important for funds to identify investors and donors that prioritize the non-financial returns, in order to maintain their focus on those sustainable SMEs most in need of financing.
4.3 Monitoring and evaluation
For most of the funds with an explicit focus on sustainable enterprise, the proof of positive environmental and social impacts is key to fulfilling their own mission as well as attracting capital from mission-driven investors. At the same time, monitoring and evaluation is a complex, costly and time-intensive undertaking for a fund. The following section provides a short discussion of the rationale for monitoring and evaluation, the challenges of implementation, examples of current practice, as well as opportunities to move forward with a sector-wide approach.
The key reasons to tackle the monitoring and evaluation challenge can be summarized as follows:
� Understanding, quantifying and monitoring social and/or environmental impacts of its investment activities is essential to fulfilling a sustainability fund’s mandate, and the information is critical for strategic planning and maximizing impact;
� Credible demonstration of positive development impacts helps attract capital from governments and foundations;17
� A methodology for capturing non-financial aspects of a company can reduce the cost of due diligence, contribute to risk management and to the strategic positioning of the portfolio company.
�
17 Commercial investors seem less concerned with rigorous proof of non-financial benefits at this point, but this may change as the sustainable investment space becomes more competitive and the credible demonstration of sustainability impacts becomes a competitive advantage.
18
Environmental impact tracking paves the way for additional financing E+Co, an investor in clean energy enterprises, has a comprehensive indicators matrix for monitoring both environmental and social goals and impacts and has dedicated staff for this in headquarters and field offices. The information E+Co is gathering with its monitoring and evalution system was useful when the fund started facilitating the sale of carbon offsets for selected companies in its portfolio. E+Co estimates that 80 percent of the required information needed to monetize the carbon value of its investees companies is already collected through their ongoing monitoring and evaluation. This places E+Co in a unique opportunity to access international carbon markets for the benefit of companies in Africa, Asia and Latin America who might otherwise never see financial return from their carbon emission reductions.
Many of the funds interviewed are measuring and reporting on the social and environmental impacts of their investments. In particular, the Capital Aggregators note that the demand for monitoring and evaluation of social and environmental impact is driven by their investors, which is reflected in the more systematic approaches to monitoring and reporting of these funds as opposed to the VC Funds whose investors are generally less concerned with comprehensive proof of non-financial impacts.
Implementation challenges
While the benefits of monitoring and evaluation are compelling, the challenges of implementation are daunting. Starting with the selection of the right indicators to the entrepreneur’s capacity to generate meaningful data and the costliness of such an undertaking, the barriers to developing and implementing monitoring systems are considerable. In a practical context, there is an inherent tension between credibility and feasibility of a monitoring and evaluation system. The right balance - comprehensive without being cost-prohibitive - is hard to strike. The question is what a monitoring and evaluation system could look like that is cost-effective, scaleable across different sectors and funding models, and still generates meaningful information.
What to measure?
Monitoring and evaluation starts with the question of what to measure. Taking economic, social and environmental impacts as the three main categories of non-financial performance, there is a need to recognize the different challenges for each of these categories. While socio-economic benefits can be relatively easy to measure, environmental and social impacts present greater challenges. Many environmental impacts are quantifiable and, in some cases, where accepted market values such as the trading price for carbon emissions credits exist, they can even be monetized. Others, such as ecosystem change, involve complex science and even in purely qualitative terms, are difficult to convey to a non-expert audience. Social benefits related to quality of life or changes in government policy are equally difficult to capture and are this point mostly reported upon qualitatively.
How to measure?
Precise measurements for impact evaluation, including control groups, and external assurance, is not a realistic expectation for SME monitoring. However, any assumptions used to arrive at conclusions about impact need to be transparent and plausible. The critical elements of the impact chain are outputs (results of activities, such the sale of x-number of biomass cookstoves), outcomes (the change achieved, such as saved fuelwood and improved health), and impacts (the change occurring as a result of the investment).
19
The difficulty of establishing causation has led most funds to track outputs as a proxy for quantitative measures of impact, and to complement this reporting with a narrative description of less tangible outcomes of an investment.18
Examples of Acumen Fund’s quantitative social impact measures: � Over 3,500 squatters in safe, legal housing � Over 12,000 new women clients borrowing for sustainable livelihoods � A bednet that costs $7 is protecting more than 6,000,000 Tanzanians from Malaria for five years. � More than 100,000 rural villagers in India with access to safe, affordable water from community water
systems � Poor farmers with dramatically increased incomes from the more than 80,000 drip irrigation systems
sold in India
Who is measuring?
Measurements can be made by entrepreneurs themselves, the fund managers who have invested in them, or third parties.19 The least costly approach is to have portfolio companies periodically provide data to the investor in preformatted templates. However, the capacity of many entrepreneurs to provide data that goes beyond simple indicators is limited. SMEs, especially in the start-up phase have a range of urgent priorities around financing and basic business operations that make it difficult to spend time on impact monitoring. Significant involvement of the fund manager or a third party in capacity building and additional investment into monitoring systems may be required to put the entrepreneur in a position to report reliable information independently. New Ventures is building capacity for self-reporting of sustainability impacts among a pilot group of ten entrepreneurs as described in the adjacent box.
A more time-intensive and costly approach is to send fund representatives into the field to work with the entrepreneur to collect or certify the data and to improve the business’ record- keeping. These field representatives visit the portfolio companies, conduct interviews with employees and other stakeholders, and thus develop a more complete picture of outcomes and impacts. In practice, a mix of self-reporting and technical assistance from the fund manager is often required.
�
18 Kramer, Mark and Sarah Cooch2006. Investing for Impact. Managing and Measuring Proactive Social Investments. (Foundation Strategy Group, online: www.fsg-impact.org/app/content/ideas/item/287). 19 Kramer, Mark and Sarah Cooch. 2006. Investing for Impact. Managing and Measuring Proactive Social Investments. (Foundation Strategy Group, online: www.fsg-impact.org/app/content/ideas/item/287).
Sustainability reporting for SMEs New Ventures is piloting a sustainability reporting project with a group of ten sustainability focused SMEs in Brazil, Mexico, China, India and Indonesia. Consultants are working with each company to develop a small sustainability report based on the guidelines for SME reporting by the Global Reporting Initiative. Each report covers 6-8 economic, social and environmental indicators, as well as the company’s vision and policy regarding sustainability. The reports, as well s an analysis of the process will be published in early 2008. It is already apparent, though, that the process is a significant learning experience for the participating entrepreneurs. Despite many challenges, some of them still unresolved, we have already received feedback about the usefulness of this report for marketing, and for conversations with potential investors or buyers with environmental and social standards.
20
Finally, third-party research studies can be used to develop an in-depth analysis of the non-financial impacts of investment activities. Because of the high cost associated with such an approach, it tends to be used in situations where significant grant funding is available. The approach does not offer itself as an option for widespread monitoring and evaluation, though it may offer a path towards developing a coherent and partially replicable system of measurement.
Who pays?
Even without using comprehensive third party studies, many funds that systematically monitor impacts rely on grant funding to finance the additional cost. SEAF distinguished itself by conducting comprehensive impact assessments of 18 portfolio companies in two separate studies, with funding by three bilateral donors and one foundation as described in the box below.
The development impact of SMEs: Lessons learned from SEAF investments SEAF’s impact assessment used a case study approach to analyze the impacts of 18 investee companies from Eastern Europe, Latin America and Asia. Based on IFC methodology, the study measured the incremental effects of each investment over time on stakeholders, such as investors, employees, customers, suppliers, local communities and others. SEAF concluded that every dollar invested in these SMEs generates, on average, an additional 12 dollars in the local economy.
It took SEAF over a year to develop the impact assessment and two full-time staff to develop and implement it for the first ten companies. Another year was spent on the second phase study that added eight more companies and implemented a data survey of 30 additional companies. Some of the lessons learned include that training internal staff as well as the entrepreneurs is critical for success, but time consuming.
The results of the impact assessment are available on SEAF’s website.20 Beyond the direct analysis of the information, SEAF reports that entrepreneurs and in-country staff felt that completing the impact assessment allowed them to think about development issues as they related to their companies and that it was interesting information that could be used for other purposes, such as marketing. SEAF also believes that the impact assessment helped them in making the case for SME investment with new and existing investors as the non-financial benefits of SME investing can now be more clearly articulated and quantified alongside the projected financial return.
Among sustainability funds operated by commercial investment management firms, monitoring of extra-financial impacts is less common, though not entirely unusual. This is in part due to a different mandate with stronger emphasis on financial returns, and in part to stricter cost control at the fund level. While several funds have systems in place to monitor very basic environmental and social information, the Brazilian Fund Axial Par stands out for its comprehensive, self-financed monitoring.
�
20 SEAF. 2007. http://www.seafweb.org/impact.htm
Axial Par raises the bar for impact monitoring of venture capital investments Axial Par , within its team of five, has a dedicated staff person who works with investees to monitor employment generated, biodiversity preservation, creation of industry clusters, development impacts, output/input ratios, product cycles and other indicators. Axial Par uses the Natural Step method for the establishment of benchmarks and the Global Reporting Initiative Guidelines to guide investee companies towards self-reporting on sustainability performance, as well as pursuing independent verification. To date, Axial Par has been able to provide this assistance without external funding.
21
Moving forward
Currently, the majority of Capital Aggregators and many venture capital funds conduct some kind of impact monitoring and many of them have invested significant time and capital into systems development, staff training and technical assistance to entrepreneurs. Most funds have ambitions to further improve their systems, and new entrants, even in the commercial space, seem to have relatively ambitious goals for impact monitoring.
However, the current situation - where most funds are currently using a home-grown system with different methodologies and indicators - is creating significant inefficiencies. Entrepreneurs may have to comply with varying reporting requirements, and it is virtually impossible to make any meaningful comparison of impacts across different funds. At the same time, intermediaries themselves feel the lack of common standards as they often face a range of different demands from their investors regarding the type and detail of information required. See the box about International Financial Institutions’ development indicators below for a description of a harmonization initiative among these institutions.
Despite the investments already made, many funds and investors agree on the need for standardization, or at least harmonization of what should be measured, who should measure it, and how to verify the information. Not only would it reduce transaction costs, it would also help the sector aggregate data in meaningful quantities and start establishing a basis for comparison of investments.21
Acumen Fund, the Aspen Institute and Dalberg Global Development Advisors have facilitated discussions to build consensus among key practitioners toward a common framework, a set of baseline metrics and comparable approach to financial and non-financial accounting. A common metrics platform would encompass capital providers, intermediaries, and enterprises. While no definite list of indicators has yet been established, there is convergence around metrics such as jobs created, wage growth, revenue growth, number of customers served, local suppliers supported, total “base of the pyramid” providers, and others. Additional metrics could include additional finance mobilized, quality of data, comparable charitable impact, and carbon offsets. Acumen Fund and Google.org are in the early stages of working together to make an on-line portfolio management data system available to other practitioners in the field to support this initiative.
�
21 Kramer and Cooch identified three key elements of a standardized approach: Financial return and socio-economic benchmarks by asset class; qualitative guides for social and environmental performance indicators; technology that streamlines and automates the collection, aggregation, and reporting processes. Kramer, Mark and Sarah Cooch. 2006. Investing for Impact. Managing and Measuring Proactive Social Investments. (Foundation Strategy Group, online: www.fsg-impact.org/app/content/ideas/item/287).
22
International Financial Institutions (IFIs) harmoni ze core development indicators An IFI working group on Private Equity Funds has started to address monitoring inefficiencies by agreeing upon a set of development indicators with common definitions and consistent tracking methods. The four core indicators - internal rate of return, employment at investee companies, compliance with international environmental and social standards, and compliance with core labor standards – are complemented by 21 optional indicators that cover economic, social, environmental governance, capital markets and private enterprise metrics. The indicators and methodology will be published 22 to support fund managers in tracking positive development effects of their investments, harmonize the IFI assessment of development effects of private equity financing, and create data-bases calculated according to a harmonized methodology.
Broad agreement on a set of basic, easily measurable indicators would certainly be a significant step forward. Further to these, sector specific indicators around environmental and social impacts could be developed collaboratively by specialized funds. This would eventually give rise to an evolving list of optional indicators. While every fund may only monitor and report on a small selection of indicators, the aim would be to achieve agreement among key players on what and how to measure for a specific sector.
4.4 Technical assistance
In most emerging markets and developing countries the number of investment-ready projects is very limited. SMEs in developed countries have a wealth of resources that assist them in steering their businesses on the most effective path. As these support services for entrepreneurs are lacking or insufficient in most developing countries, it is often the financiers that fill this gap with extensive support to the entrepreneur, ranging from accounting to marketing and business strategy. Often technical assistance is required from very early stages, including for the identification of potential projects, feasibility and technical studies and for making business ideas presentable and bankable.
All funds interviewed provide some type of technical assistance and business development to their portfolio companies. In the case of the VC Funds this is primarily the involvement in strategic planning and management typical of VC investors, but often also includes working with companies prior to investment to get them to investment grade. For the Capital Aggregators, support before the investment is even more common. For many of them technical assistance is a key part of the due diligence process as this allows the fund manager to
�
22 The indicators library will be hosted at http://www.empea.net/research-information/empea-research-surveys/
Examples of areas covered by technical assistance Financial literacy: After years of providing financial education and management training on an as-needed basis during the due diligence process, Root Capital launched Root Capacity, a formal financial education program, in 2006. The program, supported with grant funding from the MIF/IDB and private donors, aims to strengthen the loan applicant pool and prepare rural SMEs to obtain financing from mainstream banks. Strengthening local provides and creating clusters: Verde Ventures, a fund focused on biodiversity conservation, obtained a grant to increase the local availability of technical assistance from third party providers, for example accountants or marketing consultants. Verde Ventures also works with other business development providers, such as Technoserve, which allows the fund to complement its own technical assistance, which includes building industries around SME value chains, for example supporting local jewelry and craft manufacturers in eco-tourism areas.
23
assess the viability of the business and the entrepreneurs (E+Co, Grofin). Other Capital Aggregators focus on strengthening their investees’ operations and facilitating access to international supply chains (eg Root Capital, Verde Ventures, EcoEmpresas). Especially the funds focused on clean energy provide assistance focused on technical knowledge and the specific market (E+Co, Econergy Cleantech Fund, Continental Wind Partners). The costs associated with these services in many cases impacts net returns to investors.
Covering costs
Technical assistance costs can take up 10-30 percent of the investment depending on the region and project size. Econergy’s CleanTech Fund, which invests in small scale renewable energy projects and alternative technologies in Latin America, needed one to two years of ground work before starting to make its investments. The fund managers need to work with most projects to get them to the advanced stage of development, until they reached “investment grade” status and when they were able to invest. Without technical assistance, only one or two in 40 projects that apply for funding would be considered investment grade.
Many of the Capital Aggregators use grant money or soft capital, to cover technical assistance costs, while most funds operating with a venture capital approach cover this support with their management fee. Some felt, though, that it was critical that the SMEs themselves were required to contribute to the cost in order to ensure the services were valued. For example Grofin and SEAF charge for the tailor-made business development services they provide. This helps to recoup a part of the cost of providing these services and also ensures that the entrepreneur is invested in the process by attaching a value to the assistance received.
Sometimes the costs of technical assistance can be lowered by investing in an entrepreneur across different growth stages or bundling the assistance with paid-for business development services. Some funds are also beginning to look more intensively for co-investment opportunities, as this may allow them to leverage the experience and insights of different investors, including sharing of due diligence cost. Nonetheless, the fundraising for grants to cover the much-needed technical assistance means additional effort on the part of the fund manager and many cite the lack of technical assistance funds as a significant challenge. Although many in the development community talk about the need to integrate TA funding with investment capital, to date, it has not been the norm for the same international financial institutions to both invest in a fund and provide TA alongside. This has led to the inefficiencies that fund managers describe in the fundraising process.
Local fund management capacity challenges
In addition to the lack of entrepreneurial capacity, in many countries private equity/venture capital is a relatively young sector and there are few individuals with the training and experience required for professional fund management. Especially institutions with a large number of funds in different countries, such as Grofin in Africa and SEAF throughout Eastern Europe, South America, Africa and Asia, cite hiring, training and retaining local staff as one of their principal challenges. The Capital Aggregators agree that investors need to recognize the need to support internal capacity building at the fund level in order to bring the sector to scale.
24
5. Conclusions
Sustainable SMEs that offer economic, social and environmental benefits need to be part of any long-term sustainable development strategy for emerging economies and developing countries. These businesses provide employment, link rural communities to markets, stimulate entrepreneurship and innovation, and have the potential to contribute to poverty alleviation and environmental protection. However, for sustainable SMEs to realize their potential and provide positive societal impacts, they need to be able to access the right type of capital at the right time throughout the business cycle.
However, despite the increasing flows of foreign investment to developing countries, sustainable SMEs continue to fall into a financing gap – both because of their size and a lack of understanding of their specific financing needs. The availability of financial resources is not the main barrier, but rather it is the ineffective deployment of these that creates this financing gap.
Innovations in financial mechanisms and investment practices can address this issue while also providing attractive triple bottom line returns to investors. Several funds are already proving the viability of sustainable SME finance and the commercial markets for these companies are growing. However, as this paper has identified, a number of challenges still exist that prevent the sector from reaching scale at the pace needed to address urgent global issues. Prominent among these are: the existence of a ‘financing gap’; high transaction costs; and a lack of coordination and standardization among current investors.
In our view, the positive externalities of sustainable SME investments may justify the use of smart subsidies in these areas, whether as grants for technical assistance and business development services or below-market rate financial returns. We believe that this approach could significantly increase the financing options available to sustainable SMEs. Scaling up in sustainable SME finance could lead to a tipping point where relevant information becomes more widespread, due diligence costs are reduced, and co-investment opportunities help to mitigate risk, particularly for new players.
Moving forward, we believe that efforts should focus on:
Greater collaboration between aggregators, VC funds and local banks
Better coordination and networking between aggregators, local VC funds and banks would provide opportunities for co-investment and pipeline sharing. Feedback from the WRI-IFC workshop indicates that there is significant interest in collaboration, but limited opportunities to do so, particularly across different countries and regions. In addition some aggregators report that collaboration with local banks has been critical to the success of their model.
Improved coordination and effectiveness of blended capital
A better understanding of blended capital requirements is needed to fully tap into the potential of this fundraising approach. On the part of the intermediaries, particularly the aggregators, this requires transparency in blended capital accounting. Investors and donors, in turn, need to be educated about blended capital models and then called upon to help improve the coordination of different types of capital and reduce the related
25
transaction costs.
Clarity around the different components of blended capital would allow for more targeted allocation of capital. The participation of different players such as development banks, foundations, commercial investors, and national and international aid agencies needs to be orchestrated in a way that maximizes the effectiveness of the different types of capital they each can provide: grant funding for technical assistance and business development services; public or philanthropic patient and risk capital; and private sector risk capital.
Harmonization of monitoring and evaluation
The lack of standardization in monitoring and evaluation approaches is creating major inefficiencies across the sector. A common methodology and a library of shared metrics would greatly enhance transparency and comparability, reduce transaction cost, and allow for a better understanding of the positive social and environmental impacts of sustainable SMEs. Ultimately, VC funds should also be engaged in these efforts, so as to work towards an approach that can be adapted to a variety of financing models, including return driven funds. A commonly accepted approach may also allow fund managers to satisfy a broader number of investors and donors with one reporting template.
Today’s world is the richest it has ever been. Global GDP (PPP) is up to $66 trillion (2006 est.), yet 4 billion people are unable to benefit from this growing wealth and continue to struggle in a cycle of poverty. A financial system that prioritizes short term gains leads to overexploitation of natural resources and is undermining nature’s regulating services that are vital for life on this planet.
Given the right support, sustainable SMEs can be critical actors in building more inclusive economies with a vibrant, innovative private sector that provides smart business solutions to environmental and poverty challenges.
This paper aims to stimulate a greater dialogue among stakeholders and private and public sector leaders. It will be reviewed by a group of stakeholders, revised and released in Spring 2008. We welcome all comments and questions. Please send yours to Mareike Hussels at [email protected].
Brookings Blum Roundtable
Venture Capital for Development 1
VENTURE CAPITAL FOR DEVELOPMENTBY ALAN J. PATRICOF, APAX PARTNERS
AND
JULIE E. SUNDERLAND
Prepared for the Brookings Blum Roundtable: The Private Sector in the Fight against Global Poverty
Session III: Does Size Matter? SME’s, Microfinance & Large Nationals August 4, 2005
IInnttrroodduuccttiioonn
The developing world, and Africa in particular, faces a dearth of risk capital that has and will continue to constrain growth. Donors need to face the reality that the young companies that can really move the needle on innovation, inspiration and employment need high-risk, reasonably-sized, equity investments to grow, not the limited doles of short-term, high interest debt currently provided.
In the developed world, the young growth companies critical to innovative capacity and employment generation are financed with long-term, permanent equity capital. When a company is growing rapidly, it cannot generate sufficient cash through its current operations to support the investment required to generate future growth, nor can it afford to pay current interest or amortize the principal associated with loans. Angel investors and venture capitalists provide the equity capital that enables young businesses to take risks, build plants, develop technology and implement their long-term strategies to compete on a global basis.
Yet, companies in the poorest countries of the world have almost no access to this type of capital. Entrepreneurs struggle to build businesses with meager personal assets that rarely allow them to achieve the scale of operations required to be competitive. When entrepreneurs can get a loan—the only form of financing available in the market—the requirement to service the capital on a current basis puts undue pressure on their balance sheet, their ability to re-invest in the growth of their business and their willingness to take risks.
Brookings Blum Roundtable
Venture Capital for Development 2
This past year has seen a renewed call to action to address persistent poverty in the developing world, especially in Africa. The key message from most of the discussions has been a call for an increase in development aid. But just spending more money is not going to build the long-term functional economies that will create the employment and wealth creation to get Africa and other poor countries out of their poverty trap. We need to get money into the hands of entrepreneurs who can build the businesses to enhance Africa’s global competitive advantage and produce goods and services affordable to the world’s poor.
We propose a specific program, an equity investment initiative funded by donors, which can have a real impact on business formation in the developing world. In partnership with local governments and investors, the program would provide equity capital and technical assistance to the subset of young Small and Medium Enterprises (SMEs) in developing countries which are truly growth-oriented and which the capital markets are not adequately supporting. These suggestions are offered as a beginning not an end; any initiative must strive to create over time viable private capital markets that can provide appropriate commercial instruments with reasonable financial rewards.
GGrroowwtthh MMaatttteerrss MMoorree tthhaann SSiizzee
The current landscape of companies in Africa and other poor countries and their requirements for capital and assistance is most often described in terms of the size of companies. The “Micro” enterprise sector is typically defined as companies with less than 10 employees and generally includes small-scale traders, artisanal producers and farmers. Increasingly, these types of enterprises have been provided with capital and technical assistance by the burgeoning and successful microfinance industry. The “Large” enterprise sector is typically defined as anything with more than 100 employees and therefore includes multinationals and almost all established local companies such as privatized infrastructure providers and financial institutions. In most cases, local and international capital markets provide these types of companies with the necessary capital. The in-between, small and medium-enterprise (“SME”) sector, however, remains both the life-blood of the economy and the most challenging for policy makers to understand and financiers—whether commercial or donor—to serve.1
This one-size-fits-all categorization of companies with between 10 and 100 or more employees as SMEs hides variations in characteristics that are critical to their capital and assistance needs, and their potential development impact. Most of the companies in the SME-size category in developing countries are similar to micro-enterprises in that they provide basic employment and income generation for a family or farming cooperative group. Because these types of “necessity entrepreneurs”—traders, niche domestic service providers and agricultural producer groups—are oriented toward generating immediate income, they are unlikely to have or be able to re-invest capital in 1
Size definitions vary by country and organization; “small businesses” or SMEs are typically defined as companies
with less than 100, 250 or 500 employees. Micro-enterprises are typically defined as less than 10 employees.
Brookings Blum Roundtable
Venture Capital for Development 3
their businesses and take risks to grow significantly. As a result, these types of enterprises are unlikely to reach an economic scale to become globally competitive. On the other hand, they can also usually generate enough cash flow to service some form of debt. Many access working capital or trade finance through informal networks and a number of specialized providers of debt financing for this type of company have recently emerged.
A smaller segment of companies in this SME-size category, including high potential start-ups, have the potential to grow and become modern, globally competitive enterprises. These types of companies are run by “opportunity entrepreneurs” committed to innovating, adding value to exports, applying technology, achieving scale in production and re-investing profit in their business. And like their U.S. counterparts, they can have a multiplier effect on employment and overall economic growth. If these companies are successful in growing and reinvesting capital in their business, they can continue to expand direct employment, increase indirect income generation through sourcing local inputs, and pay taxes. Perhaps as important, successful companies and entrepreneurs can have a powerful demonstration impact: seeding and stabilizing clusters of related firms, inspiring other entrepreneurs to grow their businesses and serving as role models for youth. Unlike their “necessity entrepreneur” brethren, the impact of the capital invested in growth-oriented SMEs run by “opportunity entrepreneurs” can continue to have a compounding development impact.
But unlike in the United States and other developed economies, in most developing countries these segments of growth-oriented SMEs are virtually absent. In high-income countries, the SME sector has been estimated to contribute more than 50% to gross GDP, not to mention being the engine of new job creation and a source of as much as half of the innovation in these economies. In low-income countries, however, the contribution of the SME sector to gross GDP has been estimated at 16% and, in most African countries the SME sector has been estimated at less than 10%.2 This absent segment of companies that are undergoing the risky but creative process of growing from small to medium to large-scale could explain much of the weakness in the overall economic growth of developing countries.
There are three basic explanations for the underdevelopment of the SME sector in developing countries: a weak business environment, a lack of managerial or technical capacity, and a lack of access to capital. We will not attempt to explain all three factors but will focus on the access to capital for growth-oriented SMEs.3 It should be noted, however, that without progress by local governments in creating an investment climate and business environment that is supportive of entrepreneurship and growth-oriented businesses, any policies related to increasing access to capital for SMEs will have limited impact.
2
Source: Meghana, Demigurc-Kunt, Beck, “Small and Medium Enterprises Across the Globe: A New Database,”
World Bank Policy Research Working Paper No. 3127 (August 2003)3
For a full discussion of all three factors see: Patricof and Sunderland, “Big Ideas: Small is Still Beautiful,” The
Milken Institute Review (2nd Quarter 2005) pp. 90-94
Brookings Blum Roundtable
Venture Capital for Development 4
RRiisskk--RReewwaarrdd IImmbbaallaanncceess
In developed country environments, young companies are financed by various types of risk capital providers through a number of rounds of investment: friends and family supplying very early capital; angel investors such as retired businessmen providing start-up capital; and formal venture capitalists providing early-stage and growth capital. Each of these types of investors has specialized skills and information to evaluate the risks and rewards of the business plan at each stage of investment and to help the entrepreneur build the business. By the time a successful young company has graduated out of this risk capital market, it should have the cash flow and/or track record to access more formal capital markets such as banks and public markets. These public markets and mergers and acquisitions activity provide the critical high potential exit for the early risk capital providers.
Almost all developing countries lack this early risk capital market. This does not reflect neglect from development experts at the development finance institutions (“DFIs”). Surveys of the SME sector in developing countries have consistently identified lack of access to capital as a key constraint to growth.4 In response, over the last two decades a range of schemes, from direct investments in the SME sector to venture capital programs and SME loan guarantee programs, have been attempted.
Most of these DFI-funded programs, however, have had limited success. Loan programs have often suffered from lack of utilization by the SME sector, high default rates and currency devaluations. Equity investments in SMEs through the nascent private equity and venture capital industry have generated mostly poor returns and many business failures. As evidenced in recently gathered data on the emerging market private equity industry, private equity funds in emerging markets (including a mix of both venture capital and larger private equity transactions) have globally only returned capital to investors, delivering a -0.3% IRR return over a 5 and 10 year horizon. Venture capital investments have been shown to be even more difficult to manage. Data from EBRD’s analysis of its funds in Eastern Europe shows that investments of less than $2.5 million didn’t even return capital while investments greater than $10 million delivered returns significantly above the emerging market private equity benchmark.5
4
There are numerous region and country-specific surveys of the dynamics of the SME sector and constraints to
growth. For a most recent general evaluation of the SME sector in 54 countries see: Beck, Demirguc-Kunt, and Maksimovic, “Financial and Legal Constraints to Growth: Does Size Matter?” Journal of Finance (Volume 60 Issue 1 February 2005) p. 1375
Statistical performance data from Cambridge Associates Emerging Market Venture Capital and Private Equity
Index have only recently been made publicly available. See Emerging Market Private Equity Newsletter (Volume 1, Number 2, June 2005) for a summary of the data. The EBRD analysis of the performance of its investments funds between 1992 and 2002 was presented in detail at the IFC Global Annual Private Equity Conference May 2004. General performance data for the EBRD sponsored funds is available at www.ebrd.com/country/sector/fi/index.htm.
Brookings Blum Roundtable
Venture Capital for Development 5
For investments of less than $250,000 the challenges to delivering net returns to investors becomes even greater. Analyzing the portfolios of leading global SME funds shows that, without even taking into account transaction costs, the gross realizations and valuations on these investments barely return capital to the funds, compared to healthier multiples on larger investments. When even small transaction costs are incorporated into the returns calculations, the base capital on the small investments is quickly eroded.6
The result of these historical returns is that commercial investors in developing countries necessarily migrate toward larger deals. Even the leading global SME funds, reacting to pressure from their primarily DFI investor base to demonstrate commercial returns, have increasingly abandoned smaller SME equity investments and migrated toward minimum size investments from $500,000 to $1M, and most frequently to $2M, with a large component of their investments structured as interest bearing securities.
With the renewed focus on private sector development and the importance placed on the SME sector, however, the development finance industry is desperately seeking a scaleable solution for delivering capital to the SME sector. As evidenced in the returns data, the difficulty with such a model is that, in most cases, the challenges of building growth-oriented companies in these markets mean that equity investments cannot deliver returns that justify the risks on a commercial basis.
There are a number of reasons for this:
Early Stage of Investment. In many of the most promising developing countries, a stabilized economy and adequately functioning business environments have only been a condition of the past decade. Unless a product of privatization, high growth potential companies will often be start-ups or early stage companies with unproven products and marketing strategies, and limited track records. Investing in start-ups is notoriously difficult and risky—even commercial venture capitalists in the sophisticated U.S. market like to have some proof of a business plan and as a result leave the earliest stages of investment to angel investors.
Weak Managerial Capacity. Many developing countries have extraordinary raw entrepreneurial talent -- as evidenced in the traders who effectively move large flows of goods across borders. But building and managing a modern enterprise that can add value and compete in international markets requires significantly different business language, contacts, and technical skills to which few of these raw entrepreneurs have access. For example, the stringent needs for quality control and timely delivery on contracts can be challenging for a businessman accustomed to the chaotic African trading environment to understand.
6
The Authors have worked closely with leading SME funds, including evaluating the underlying portfolios of the
funds and the key factors affecting returns. The Authors wish to acknowledge the support of these fund managers in contributing to the development of the ideas in this paper.
Brookings Blum Roundtable
Venture Capital for Development 6
Business Environment Risks. In addition to the usual risks of starting and growing a company, these entrepreneurs must battle the hurdles created by government regulation, infrastructure weaknesses and even cultural impediments. Studies have shown that weaknesses in the business environment disproportionately affect smaller businesses.7 What these studies do not adequately convey is the day-to-day drain on resources and morale of dealing with issues such as official corruption, power outages, lack of communication, and poor roads that destroy vehicles and increase delivery times.
Few Exit Opportunities. While local capital markets have been established in many developing countries, they have thus far been open primarily to large and established companies. The M&A market in most of these markets also remains nascent. Therefore, with limited possibility for exits from equity investments, investors have focused on debt instruments that are appropriate only for cash flow generating companies.
High Transaction Costs and Limited Deal Flow. For the investors themselves, investing in the SME sector presents difficult challenges. Investing in a small company takes many if not more resources than a larger transaction. Furthermore, the scale of most of these markets means that there just isn’t, at this point in time, the potential to create that many high growth-oriented companies in any given country. As a result, the overhead costs involved in setting up an investment operation can be extremely high on a per deal basis.
Currency Risk. For international investors, currency volatility can further erode returns. Many positive return investments produce negative or minimal returns when converted to U.S. dollars.
These factors make SME investing in growth-oriented companies in developing countries difficult, if not impossible, to justify in commercial terms. The companies themselves are most often early stage under any definition with unproven and inexperienced entrepreneurs. The markets in which they operate exacerbate the company risks. Even if the companies are successful, the rewards are difficult to achieve. The investor will have trouble getting liquidity from the investment and the transaction and overhead costs associated with investment management activity further erode the returns.
Without some form of balancing incentive, therefore, commercial investors who expect returns to justify their risks are not likely to invest in the SME sector in these countries in the near future. At the same time, to meet the financial objectives established by their shareholders, most of the DFI investors continue to demand commercial level returns from SME investing. Because their incentive structure often rewards large top-line
7
See Beck 2005 cited above. See also: Mead and Liedholm, “The Dynamics of Micro and Small Enterprises in
Developing Countries,” World Development (Vol. 26, No. 1 1998), pp. 61-74, for a discussion of the relationship between firm growth, failure rates and macro-economic conditions.
Brookings Blum Roundtable
Venture Capital for Development 7
disbursements of capital, the DFI investors also rarely get excited by the volume of capital appropriate to the SME segment.
This does not mean that DFI investors should abandon the sector. Rather, it is time for the DFI investors to be realistic about what effective investing in this sector really takes, and adjust their thinking and benchmarks accordingly. We strongly believe if the DFI community wants to build young, growth-oriented SMEs in these markets , they will need to accept the risk-reward imbalance and begin to promote models for SME investing that take into account the high risks, high transaction costs, low volume, and below market rates of returns endemic to the sector.
AA BBaallaanncciinngg AAcctt
This type of reorientation in approach sounds simple in concept but is difficult to execute in practice because it requires a careful balancing act between creating market-driven incentives that enforce commercial discipline at the investment and company level and achieving the development objective of building businesses. Distorting capital markets with too much cheap capital or creating uncompetitive companies is always a danger when providing below-market funding to the private sector. Therefore, any initiative must strive to create over time viable private capital markets that can provide appropriate commercial instruments with reasonable financial rewards.
We propose, therefore, a program to create a pool of capital to invest equity or equity-like instruments in growth-oriented SMEs. The funds would, as much as possible in a given market, seek to leverage and build the nascent commercial risk capital market.
Capitalization. Capital for the funds would be sourced from DFI investors, from local governments, and, crucially, with some participation, however modest, from private local sources. The donor investors and governments should be willing to accept very modest rates of return and directly support operating and transaction costs, allowing local private investors to manage the investments and take a disproportionate amount of the returns.
Investment Activities. Capital from these funds should be available in amounts ranging from $100,000 to $2 million to invest in SMEs with the demonstrated ability to absorb capital and a growth strategy that can have a multiplier effect on employment. Investments should be in the form of quasi-equity with no forced amortization or current servicing required. Investors will receive returns from appreciation in the value of equity ownership where possible but more often in the form of payments linked to participation in increased revenues and free cash flow as generated.
Linkages to Pure Commercial Markets. In addition to being managed by local private investors, the funds should work closely with other local financial institutions to graduate their companies for later stage financing from purely commercial sources. This could be achieved through pre-financing of companies
Brookings Blum Roundtable
Venture Capital for Development 8
referred by the banking sector, working closely with banks to get loan financing for existing portfolio companies, and co-investing at later stages of financing with commercial venture capital funds.
Technical Assistance. Capital alone will not be enough to develop growth-oriented SMEs in these markets. These companies need management training, advice from experienced business people, technical knowledge of equipment and processes, market information and insights to build their businesses. A parallel component of the funds will be dedicated to grant funding for technical and managerial assistance to the portfolio companies through existing assistance programs. The technical and managerial assistance component of the program should be fully integrated into the investment activities.
Investment Skills. If local investors have appropriate skills and knowledge, they are much more likely to understand the risks and rewards of the SME sector and will be better placed to manage them on a day-to-day basis. Pairing local investors with skilled international fund managers could transfer the necessary knowledge and skills. Involving experienced venture capitalists in the overall management of the program should also allow for transfer of knowledge and skills.
Linking with the Diaspora. The flow of entrepreneurs from the Indian and Chinese diasporas has had a significant impact on the quality of the young companies in those economies. The African diaspora has also begun to generate both the capital and the entrepreneurs that could significantly boost the SME sector’s potential. The program should provide incentives for investment by the diaspora communities, encourage diaspora entrepreneurs to develop new companies in their home countries and involve senior business people from the diaspora in the program.
Commitment of the Companies. The companies themselves will also need to be active participants in the program; in exchange for capital, they would commit to produce audited statements, pay taxes and abide by the rules of corporate governance.
The program will need to be adapted to the on-the-ground characteristics of the SME sector, the human resources, and the financial markets in a given country or region. Equity capital is not a one size-fits-all solution for the SME sector. In fact, in smaller or less developed countries, it may only be appropriate for a few companies. Regional funds therefore may be appropriate for regions with fragmented local markets and limited deal flow. The risks associated with the investments will also vary by the characteristics of the macro-economy and the financial markets. Smaller investments with higher leverage rates may be needed in underdeveloped markets whereas larger investments with lower leverage rates may be acceptable in more developed markets.
Brookings Blum Roundtable
Venture Capital for Development 9
CCoonncclluussiioonn
In all of the discussion of aid and poverty, we sometimes lose sight of the fact that making the poor not poor requires employment, and preferably employment sustained by productive economic activity rather than capricious donor funding. Foreign direct investment can provide some of this employment and micro-enterprise activity can support basic income generation. But a vibrant indigenous private sector presents the best prospect for enduring progress in creating the employment and wealth creation that will pull Africa and other poor countries out of poverty. A “private sector”, however, does not spontaneously emerge from the pages of commission and consultant reports. Rather, young businesses must grow to become the larger, established institutions that can really move the needle on employment.
Apple Computer, Microsoft and Fedex did not start out with loans. If their founders had been required to finance their early growth with the short-term, collateralized, high interest loans currently available in developing countries, the businesses would not even have gotten off the ground. Instead, friends and family, angel investors, venture capitalists and even the U.S. Government’s Small Business Administration provided risk capital to build these successful U.S. companies.
In developing countries, we must similarly find a way to get equity capital into the hands of entrepreneurs who have the capacity to build young businesses. We believe our program provides a good place to start.
Electronic copy of this paper is available at: http://ssrn.com/abstract=981196
Working Paper Number 112 February 2007
Why Doesn’t Africa Get More Equity Investment? Frontier Stock Markets, Firm Size and
Asset Allocations of Global Emerging Market Funds By Todd Moss, Vijaya Ramachandran and Scott Standley
Abstract
This paper addresses the question of investment in sub-Saharan African listed securities by examining characteristics of the continent’s 15 equity markets, the rise and fall of African regional funds, and the asset allocation trends for global emerging market (GEM) funds. The data shows that South Africa is now a leading destination of capital, but that few managers invest elsewhere on the continent. However, we find that African markets are not treated differently than other markets and present evidence that small market size and low levels of liquidity are a binding deterrent for foreign institutional investors. Thus, orthodox market variables rather than market failure appear to explain Africa’s low absolute levels of inward equity flows. The paper then turns to new data from firm surveys to explore why African firms remain small. The implications of our findings are threefold: (a) efforts to encourage greater private investment in these markets should concentrate on domestic audiences and specialized regional funds, (b) the depth and success of the Johannesburg Stock Exchange can perhaps be better utilized to benefit other parts of the continent, and (c) any long-term strategy should concentrate on the underlying barriers to firm entry and growth.
The Center for Global Development is an independent think tank that works to reduce global poverty and inequality through rigorous research and active engagement with the policy community. Use and dissemination of this Working Paper is encouraged, however reproduced copies may not be used for commercial purposes. Further usage is permitted under the terms of the Creative Commons License. The views expressed in this paper are those of the author and should not be attributed to the directors or funders of the Center for Global Development. The authors are grateful for funding from the World Bank.
www.cgdev.org
________________________________________________________________________
Electronic copy of this paper is available at: http://ssrn.com/abstract=981196
Why Doesn’t Africa Get More Equity Investment? Frontier Stock Markets, Firm Size, and Asset Allocations of
Global Emerging Market Funds
Todd Moss, Vijaya Ramachandran, and Scott Standley1
I. Introduction
The rapid integration of international financial markets has been one of the starkest examples of globalization. The impressive rise of private capital flows to emerging markets, from $25 billion in 1990 to $300 billion in 2005, has been a key feature of this trend. Part of this expansion in financial flows has been enabled by the growth of equity funds dedicated to investing in publicly-listed securities in developing countries.2 The number of emerging market funds grew from just a handful at the beginning of the 1990s to over 100 by the end of that decade (Kaminsky, Lyons, and Schmukler 2001).3 Sub-Saharan Africa has also participated in this trend, with South Africa rising into the ranks of the leading destination emerging markets and a number of regional funds specifically targeting the continent. At the behest of local governments, and with some donor encouragement, Africa has also expanded the number of its domestic stock exchanges from five in the late 1980s to fifteen today. Despite this modest headway, Africa’s “frontier markets”—those outside South Africa—still receive a tiny fraction of emerging markets investment and the widespread reaction in Africa has been of disappointment. Policymakers in both African and donor capitals have fretted about this lack of response by private investors and frequently ask: why is Africa not receiving more equity
investment?
There are two schools of thought. The first “market failure” view is that Africa is somehow different and investors are not responding rationally to the continent’s investment opportunities because of some hurdle: a lack of information, perceptions of excessive risk, or another, perhaps unknown, variable that systematically discourages investors from bringing their capital into Africa. A second “market works” view argues that there is nothing unusual or exotic about
1Todd Moss ([email protected]) is Senior Fellow at the Center for Global Development. Vijaya Ramachandran
([email protected]) is Assistant Professor at the Georgeown Public Policy Institute and Visiting Fellow at CGD. Scott Standley ([email protected]) was a researcher at CGD when this paper was completed and is currently a Research Officer in the Independent Evaluation Office of the IMF. The authors thank the World Bank for funding this work. We thank Jenni Chamberlain, Ryan Floyd, Alan Gelb, Liliana Rojas-Suarez, John Simon, and Tom Gibian for comments, as well as participants at the African Economic Research Consortium workshop in Nairobi on and participants at a seminar at the World Bank in Washington DC. We are also grateful to Sarah Rose for research assistance. All errors and opinions expressed in this paper are solely those of its authors and do not necessarily reflect the views of affiliated institutions or national authorities. 2 This paper deals only with funds targeting listed securities publicly traded on local stock markets, and explicitly does not cover either private equity or foreign direct investment (FDI). The universe of private equity funds, venture capital, and other asset classes are areas of future research for CGD. FDI is also beyond this paper. Recent data suggests FDI grown considerably in recent years, and not only to mineral/oil exporters. 3 See also Lavelle 1999 on the role of the international financial institutions in helping to launch new closed-end funds.
Africa and that investors value African investments like any other. If they are avoiding the continent it is likely because of orthodox reasons such as liquidity or market size.
This paper seeks to answer this question by looking at the characteristics of African equity markets and the activities of the two primary groups of foreign institutional investors: regional funds (which, by definition, invest in companies listed on African stock markets) and global emerging market funds (which, by definition, invest in developing countries but not necessarily any particular geographic region). A scan of the 94 global emerging market funds for which we have data shows that they all invest in South Africa, but almost none invest elsewhere on the continent. But we also find that African markets are not fundamentally different from those in other regions given their relative size. After correlating market and country data with the asset allocation of these funds, we find that African markets are not treated differently than other markets, which suggests that a primary deterrent for foreign institutional investors is the small size and low levels of liquidity for available shares. That is, for the GEM asset class, the evidence points strongly in the direction of a “market works” view and that Africa’s market “problem” is mostly one of size.
The implication of our findings is that, at least in the near to medium term, African equity markets are likely to remain targeted primarily by highly-specialized niche funds with specific mandates to invest in the region. Those that seek to encourage greater private investment in these markets should focus their efforts on this handful of foreign players and, probably more importantly, domestic institutional and individual investors. A strategy for longer-term growth of these markets should concentrate on the underlying factors preventing market expansion, namely the barriers to firm entry and growth that would allow more and larger firms—which could potentially list on local exchanges and be exposed to a greater number of potential investors. Surely, Africa’s frontier equity markets can play a more prominent role in their host economies, but it is not yet clear that they are unusually underperforming given their environments. The current emphasis on fixing perceived market failures is not only attempting to tackle a problem that may in fact not exist, but is diverting policymakers’ attention away from the real economic constraints. Interventions to boost equity investments based on fixing the “market failure” are thus akin to attacking the symptoms rather than the cause.
Section 2 of this paper frames why these questions about equity investment are important for economic development, how they fit into current academic debates, and how they might affect the range of options facing policymakers seeking to encourage greater flows to the poorest regions. Section 3 looks specifically at Africa’s equity markets and some of the dominant characteristics, including how these markets compare with those in other regions. Section 4 documents the rise and fall (and perhaps rise again) of regional funds. Section 5 analyses the asset allocation of global emerging market funds, concluding that African firms and markets are too small to attract much attention from this particular asset class of investors. Section 6 looks at why African firms remain small using data from firm surveys on the barriers to firm growth in Africa. Section 7 concludes with implications for policymakers.
2
II. Why is equity investment relevant to development?
Questions about stock market characteristics and equity investment flows to Africa are directly relevant to the development community in at least three ways. At the broadest level, there are thought to be strong links between the financial sector and economic growth. Schumpeter (1934) was an early proponent of the idea that finance was important for economic development, claiming that the system for allocating capital has a substantial impact on economic growth. (Others, such as Robinson (1952), questioned the direction of causality, suggesting that perhaps capital chased growth rather than the other way around.) In the seminal works on finance in developing countries, McKinnon (1973) and Shaw (1973) interpreted evidence from a number of emerging economies as strongly suggesting that Schumpeter was largely correct and that financial systems facilitated economic growth. More recent empirical research by King and Levine (1993) suggests a strong correlation between financial development and economic growth, while Caprio and Demirguc-Kunt (1997) found that higher levels of long term finance were associated with higher productivity and growth. Research by Levine and Zervos (1996) suggests that stock markets themselves are correlated with improved economic performance.
There are multiple ways in which capital markets might be expected to have such an impact on development: to serve as a source of long-term capital for financing investment, to expand the menu of financial instruments available to savers (allowing risk diversification and encouraging resource mobilization), and to continuously monitor the corporate sector. In addition, deep financial systems facilitate the trading of risk, allocate capital, monitor managers, mobilize savings, and ease the exchange of goods, services, and financial contracts (Levine 1996). There is even some evidence that institutional investors in particular (as opposed to individuals or smallholders) have an especially positive impact on corporate governance (Samuel 1996). While foreign private capital flows are increasingly viewed as playing these roles in emerging markets—with private capital displacing official flows for many countries—this trend is just barely beginning in Africa’s frontier markets (Ndikumana 2001; Kenny and Moss 1998).
This paper also contributes to the ongoing debates about the factors behind capital flow trends.The literature on the determinants of capital flows to emerging markets frequently differentiates between the global (“push”) factors and the local (“pull”) factors. The most significant push factors tend to be interest rates in industrialized countries and investor diversification (Chuhan, Claessens and Mamingi, 1993; Fernandez-Arias and Montiel, 1996; Frankel and Okongwu, 1995; Fernandez-Arias, 1994). The major pull factors are related to the strength of an economy, the profitability of its firms, and a country’s perceived policy and risk environment (Offerdal, 1996; Bhattacharya, Montiel and Sharma, 1996). In general, the consensus view is that push factors help to influence the overall appetite for emerging markets among investors, but that pull factors are crucial in determining where precisely those flows are placed—a conclusion that is consistent with our findings.
Lastly, and more immediately, this paper aims to help inform policymakers both in African and in donor capitals as they consider, devise, and implement strategies to catalyze private investment. Substantial efforts are underway to try to encourage greater investment in sub-Saharan Africa: policy reforms, publicly-backed equity funds, subsidies for promotion activities, and technical assistance, among many such interventions thought to compensate for some failure in the marketplace. However, if the constraints to higher flows and the decision-making process
3
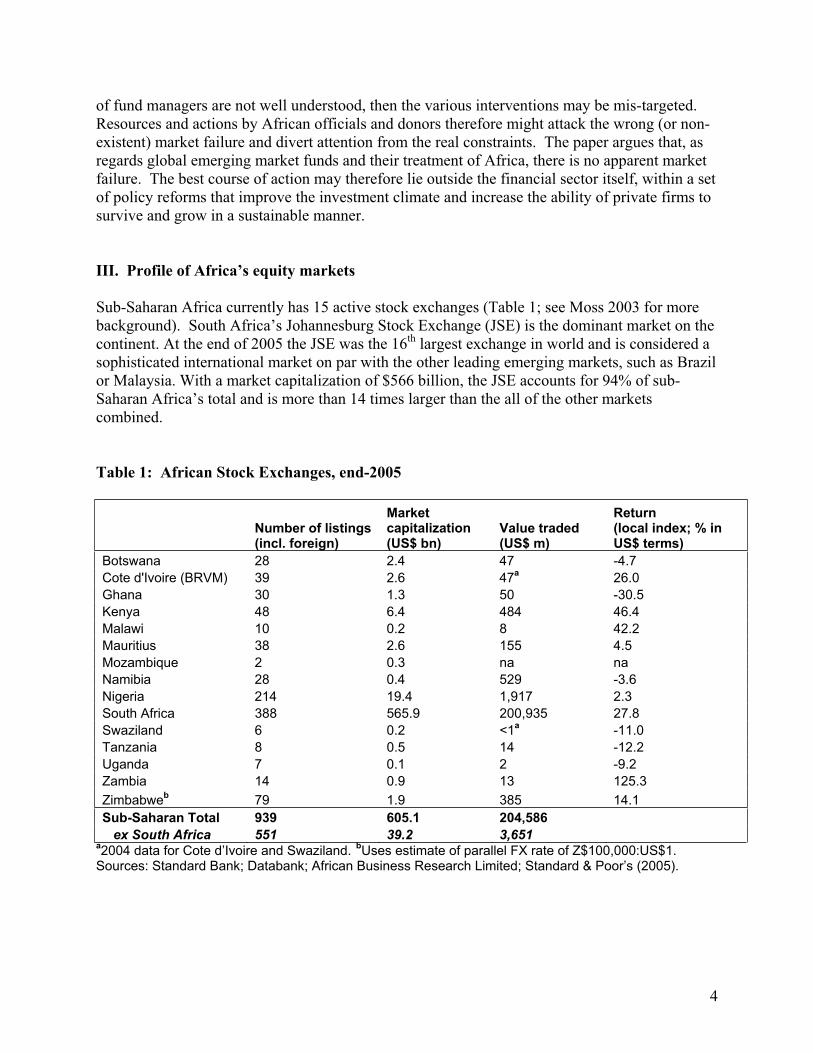
of fund managers are not well understood, then the various interventions may be mis-targeted. Resources and actions by African officials and donors therefore might attack the wrong (or non-existent) market failure and divert attention from the real constraints. The paper argues that, as regards global emerging market funds and their treatment of Africa, there is no apparent market failure. The best course of action may therefore lie outside the financial sector itself, within a set of policy reforms that improve the investment climate and increase the ability of private firms to survive and grow in a sustainable manner.
III. Profile of Africa’s equity markets
Sub-Saharan Africa currently has 15 active stock exchanges (Table 1; see Moss 2003 for more background). South Africa’s Johannesburg Stock Exchange (JSE) is the dominant market on the continent. At the end of 2005 the JSE was the 16th largest exchange in world and is considered a sophisticated international market on par with the other leading emerging markets, such as Brazil or Malaysia. With a market capitalization of $566 billion, the JSE accounts for 94% of sub-Saharan Africa’s total and is more than 14 times larger than the all of the other markets combined.
Table 1: African Stock Exchanges, end-2005
Number of listings (incl. foreign)
Marketcapitalization(US$ bn)
Value traded (US$ m)
Return (local index; % in US$ terms)
Botswana 28 2.4 47 -4.7
Cote d'Ivoire (BRVM) 39 2.6 47a
26.0
Ghana 30 1.3 50 -30.5
Kenya 48 6.4 484 46.4
Malawi 10 0.2 8 42.2
Mauritius 38 2.6 155 4.5
Mozambique 2 0.3 na na
Namibia 28 0.4 529 -3.6
Nigeria 214 19.4 1,917 2.3
South Africa 388 565.9 200,935 27.8
Swaziland 6 0.2 <1a
-11.0
Tanzania 8 0.5 14 -12.2
Uganda 7 0.1 2 -9.2
Zambia 14 0.9 13 125.3
Zimbabweb
79 1.9 385 14.1
Sub-Saharan Total 939 605.1 204,586
ex South Africa 551 39.2 3,651a2004 data for Cote d’Ivoire and Swaziland.
bUses estimate of parallel FX rate of Z$100,000:US$1.
Sources: Standard Bank; Databank; African Business Research Limited; Standard & Poor’s (2005).
4
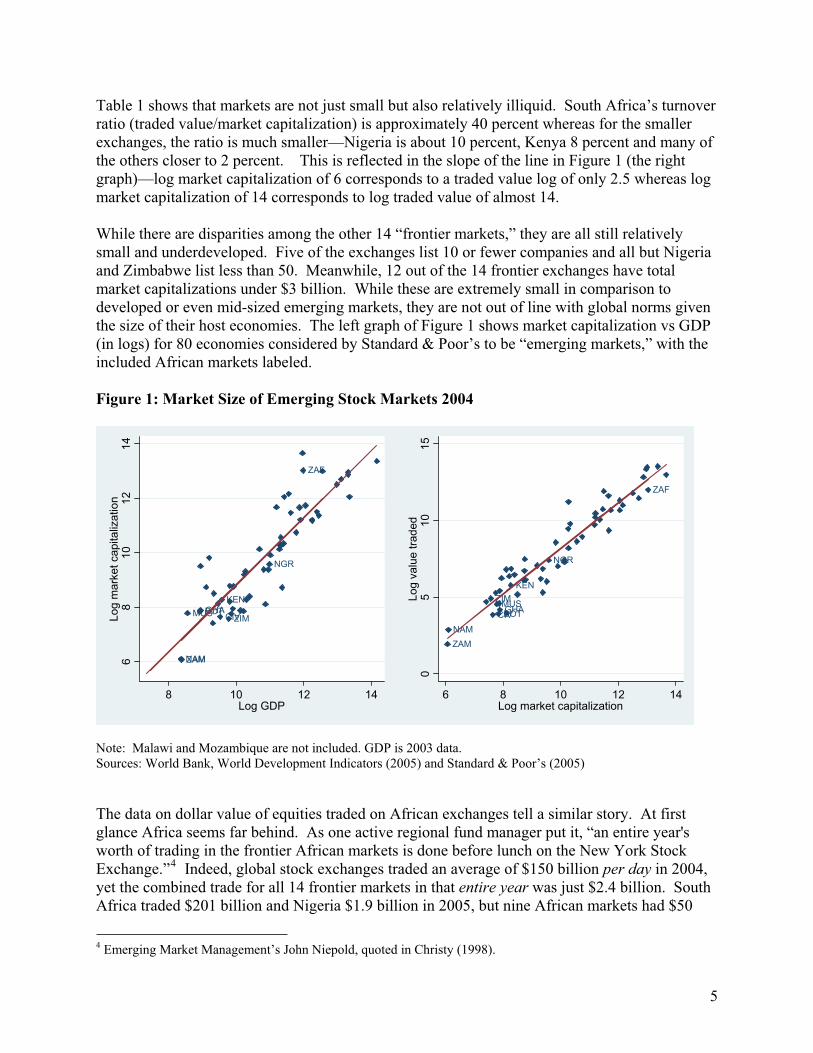
Table 1 shows that markets are not just small but also relatively illiquid. South Africa’s turnover ratio (traded value/market capitalization) is approximately 40 percent whereas for the smaller exchanges, the ratio is much smaller—Nigeria is about 10 percent, Kenya 8 percent and many of the others closer to 2 percent. This is reflected in the slope of the line in Figure 1 (the right graph)—log market capitalization of 6 corresponds to a traded value log of only 2.5 whereas log market capitalization of 14 corresponds to log traded value of almost 14.
While there are disparities among the other 14 “frontier markets,” they are all still relatively small and underdeveloped. Five of the exchanges list 10 or fewer companies and all but Nigeria and Zimbabwe list less than 50. Meanwhile, 12 out of the 14 frontier exchanges have total market capitalizations under $3 billion. While these are extremely small in comparison to developed or even mid-sized emerging markets, they are not out of line with global norms given the size of their host economies. The left graph of Figure 1 shows market capitalization vs GDP (in logs) for 80 economies considered by Standard & Poor’s to be “emerging markets,” with the included African markets labeled.
Figure 1: Market Size of Emerging Stock Markets 2004
BOTCIV
GHAKEN
MUS
NAM
NGR
ZAF
ZAM
ZIM
68
10
12
14
Log m
ark
et capitaliz
ation
8 10 12 14Log GDP
BOTCIVGHA
KEN
MUS
NAM
NGR
ZAF
ZAM
ZIM
05
10
15
Lo
g v
alu
e tra
de
d
6 8 10 12 14Log market capitalization
Note: Malawi and Mozambique are not included. GDP is 2003 data. Sources: World Bank, World Development Indicators (2005) and Standard & Poor’s (2005)
The data on dollar value of equities traded on African exchanges tell a similar story. At first glance Africa seems far behind. As one active regional fund manager put it, “an entire year's worth of trading in the frontier African markets is done before lunch on the New York Stock Exchange.”4 Indeed, global stock exchanges traded an average of $150 billion per day in 2004, yet the combined trade for all 14 frontier markets in that entire year was just $2.4 billion. South Africa traded $201 billion and Nigeria $1.9 billion in 2005, but nine African markets had $50
4 Emerging Market Management’s John Niepold, quoted in Christy (1998).
5
million or less in trading activity for the entire year, and six had less than $15 million. Even though these are very small absolute amounts—especially compared with the $43 billion traded in Mexico or $639 billion in South Korea that same year—they are consistent with global trends based on market size (Figure 1, right graph). Again, Africa’s frontier markets are undersized in absolute terms, but are not outliers given their relative size.
In addition to the market-wide annual trading data, we also have a unique window into trading in Africa’s frontier markets through information provided by Securities Africa, an advisory firm that works with nearly all the major institutional players in Africa. Because of low liquidity and a dearth of large blocks, these markets often act in practice more like private equity with advisors/brokers actively putting together most institutional-sized deals. Table 2 shows a snapshot of the available blocks on offer at a particular recent point in time. Consistent with the annual data showing low overall trading sizes, this table shows the very small number of large blocks available for trading: across all the frontier markets, there were only 3 bids and 2 offers for blocks greater than $5 million, and only 14 bids and 8 offers greater than $1 million. In addition, of the 85 total blocks (both bids and offers) available to the marketplace, more than half are less than $500,000. As we will see below, this shortage of sizeable blocks of shares excludes a priori many funds which have minimum trade sizes that cannot be met by this kind of trading activity.
6
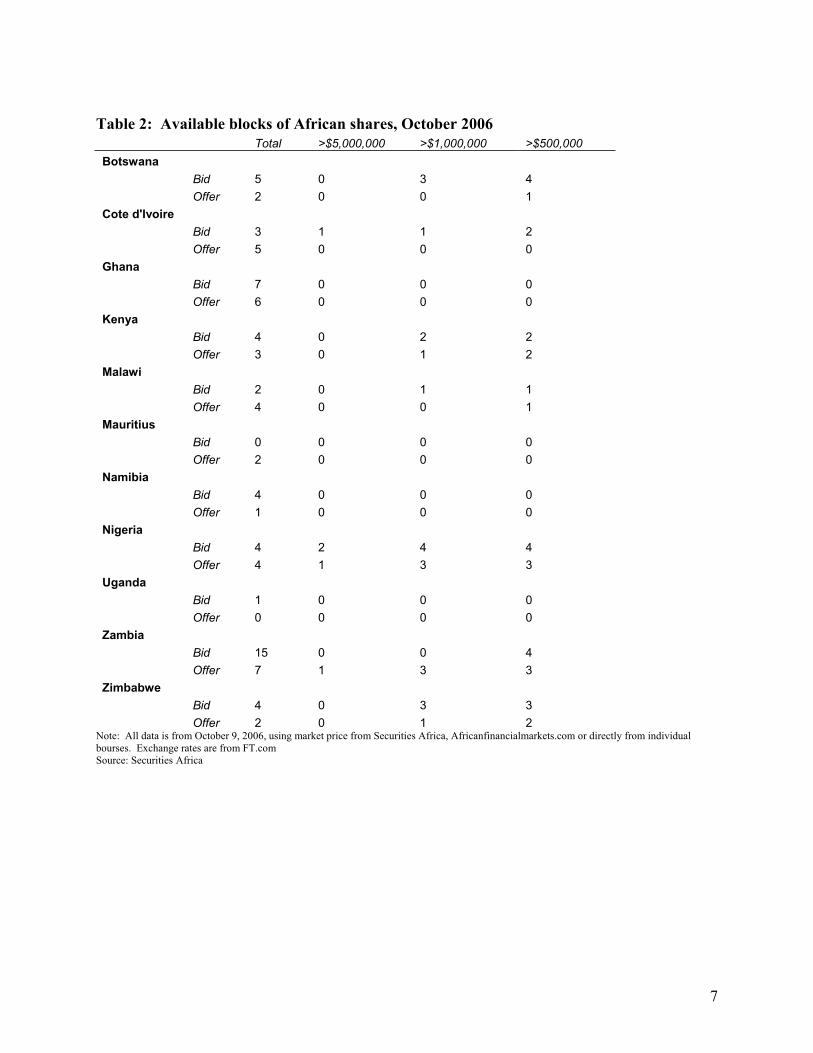
Table 2: Available blocks of African shares, October 2006
Total >$5,000,000 >$1,000,000 >$500,000
Botswana
Bid 5 0 3 4
Offer 2 0 0 1
Cote d'Ivoire
Bid 3 1 1 2
Offer 5 0 0 0
Ghana
Bid 7 0 0 0
Offer 6 0 0 0
Kenya
Bid 4 0 2 2
Offer 3 0 1 2
Malawi
Bid 2 0 1 1
Offer 4 0 0 1
Mauritius
Bid 0 0 0 0
Offer 2 0 0 0
Namibia
Bid 4 0 0 0
Offer 1 0 0 0
Nigeria
Bid 4 2 4 4
Offer 4 1 3 3
Uganda
Bid 1 0 0 0
Offer 0 0 0 0
Zambia
Bid 15 0 0 4
Offer 7 1 3 3
Zimbabwe
Bid 4 0 3 3
Offer 2 0 1 2Note: All data is from October 9, 2006, using market price from Securities Africa, Africanfinancialmarkets.com or directly from individual bourses. Exchange rates are from FT.com Source: Securities Africa
7
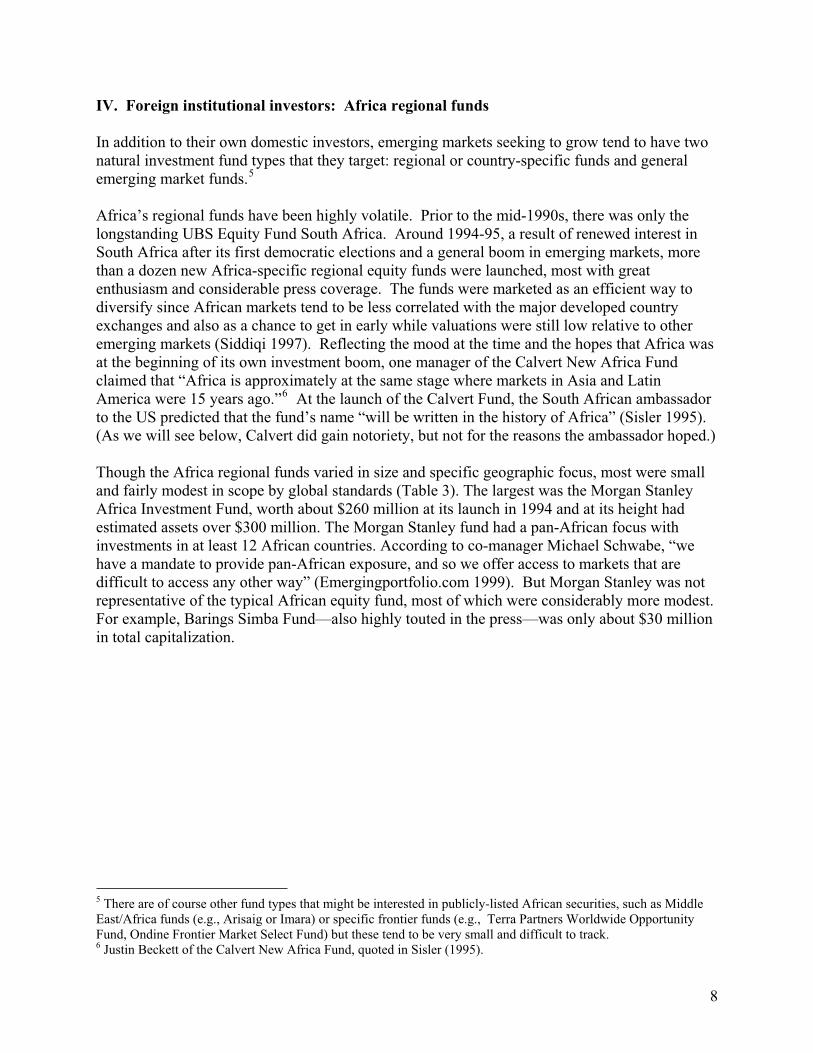
IV. Foreign institutional investors: Africa regional funds
In addition to their own domestic investors, emerging markets seeking to grow tend to have two natural investment fund types that they target: regional or country-specific funds and general emerging market funds.5
Africa’s regional funds have been highly volatile. Prior to the mid-1990s, there was only the longstanding UBS Equity Fund South Africa. Around 1994-95, a result of renewed interest in South Africa after its first democratic elections and a general boom in emerging markets, more than a dozen new Africa-specific regional equity funds were launched, most with great enthusiasm and considerable press coverage. The funds were marketed as an efficient way to diversify since African markets tend to be less correlated with the major developed country exchanges and also as a chance to get in early while valuations were still low relative to other emerging markets (Siddiqi 1997). Reflecting the mood at the time and the hopes that Africa was at the beginning of its own investment boom, one manager of the Calvert New Africa Fund claimed that “Africa is approximately at the same stage where markets in Asia and Latin America were 15 years ago.”6 At the launch of the Calvert Fund, the South African ambassador to the US predicted that the fund’s name “will be written in the history of Africa” (Sisler 1995). (As we will see below, Calvert did gain notoriety, but not for the reasons the ambassador hoped.)
Though the Africa regional funds varied in size and specific geographic focus, most were small and fairly modest in scope by global standards (Table 3). The largest was the Morgan Stanley Africa Investment Fund, worth about $260 million at its launch in 1994 and at its height had estimated assets over $300 million. The Morgan Stanley fund had a pan-African focus with investments in at least 12 African countries. According to co-manager Michael Schwabe, “we have a mandate to provide pan-African exposure, and so we offer access to markets that are difficult to access any other way” (Emergingportfolio.com 1999). But Morgan Stanley was not representative of the typical African equity fund, most of which were considerably more modest. For example, Barings Simba Fund—also highly touted in the press—was only about $30 million in total capitalization.
5 There are of course other fund types that might be interested in publicly-listed African securities, such as Middle East/Africa funds (e.g., Arisaig or Imara) or specific frontier funds (e.g., Terra Partners Worldwide Opportunity Fund, Ondine Frontier Market Select Fund) but these tend to be very small and difficult to track. 6 Justin Beckett of the Calvert New Africa Fund, quoted in Sisler (1995).
8
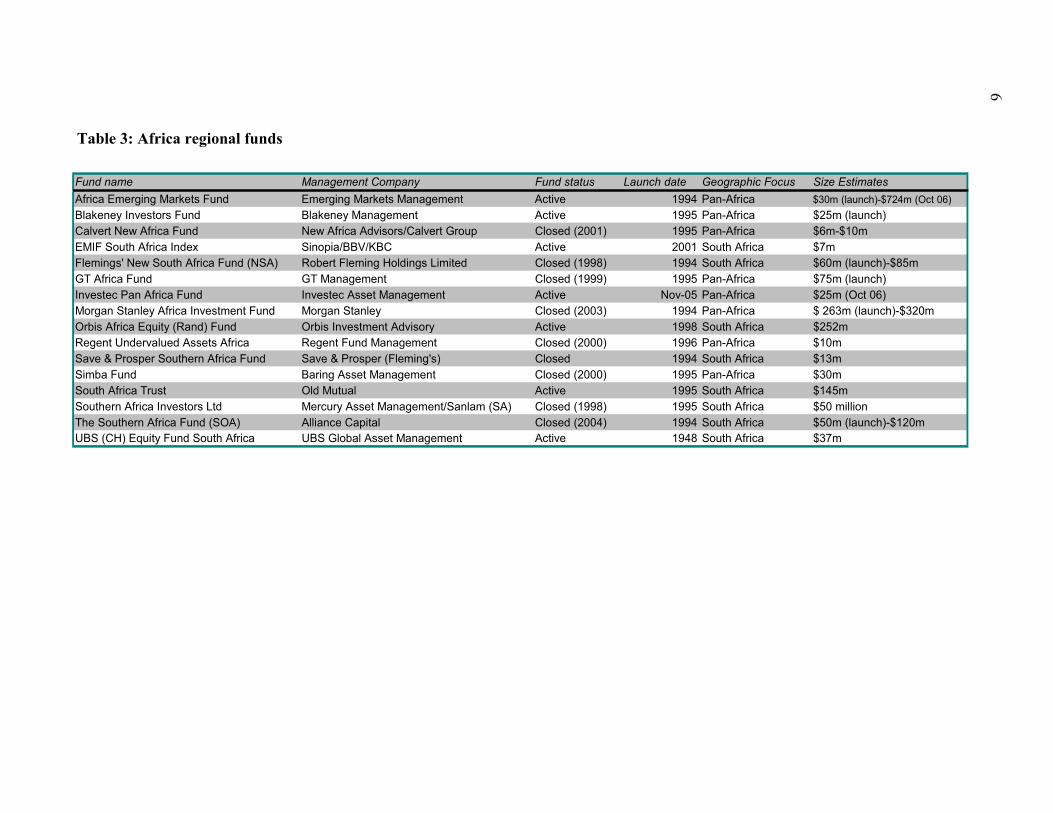
Fund name Management Company Fund status Launch date Geographic Focus Size Estimates
Africa Emerging Markets Fund Emerging Markets Management Active 1994 Pan-Africa $30m (launch)-$724m (Oct 06)
Blakeney Investors Fund Blakeney Management Active 1995 Pan-Africa $25m (launch)
Calvert New Africa Fund New Africa Advisors/Calvert Group Closed (2001) 1995 Pan-Africa $6m-$10m
EMIF South Africa Index Sinopia/BBV/KBC Active 2001 South Africa $7m
Flemings' New South Africa Fund (NSA) Robert Fleming Holdings Limited Closed (1998) 1994 South Africa $60m (launch)-$85m
GT Africa Fund GT Management Closed (1999) 1995 Pan-Africa $75m (launch)
Investec Pan Africa Fund Investec Asset Management Active Nov-05 Pan-Africa $25m (Oct 06)
Morgan Stanley Africa Investment Fund Morgan Stanley Closed (2003) 1994 Pan-Africa $ 263m (launch)-$320m
Orbis Africa Equity (Rand) Fund Orbis Investment Advisory Active 1998 South Africa $252m
Regent Undervalued Assets Africa Regent Fund Management Closed (2000) 1996 Pan-Africa $10m
Save & Prosper Southern Africa Fund Save & Prosper (Fleming's) Closed 1994 South Africa $13m
Simba Fund Baring Asset Management Closed (2000) 1995 Pan-Africa $30m
South Africa Trust Old Mutual Active 1995 South Africa $145m
Southern Africa Investors Ltd Mercury Asset Management/Sanlam (SA) Closed (1998) 1995 South Africa $50 million
The Southern Africa Fund (SOA) Alliance Capital Closed (2004) 1994 South Africa $50m (launch)-$120m
UBS (CH) Equity Fund South Africa UBS Global Asset Management Active 1948 South Africa $37m
9
Table 3: Africa regional funds
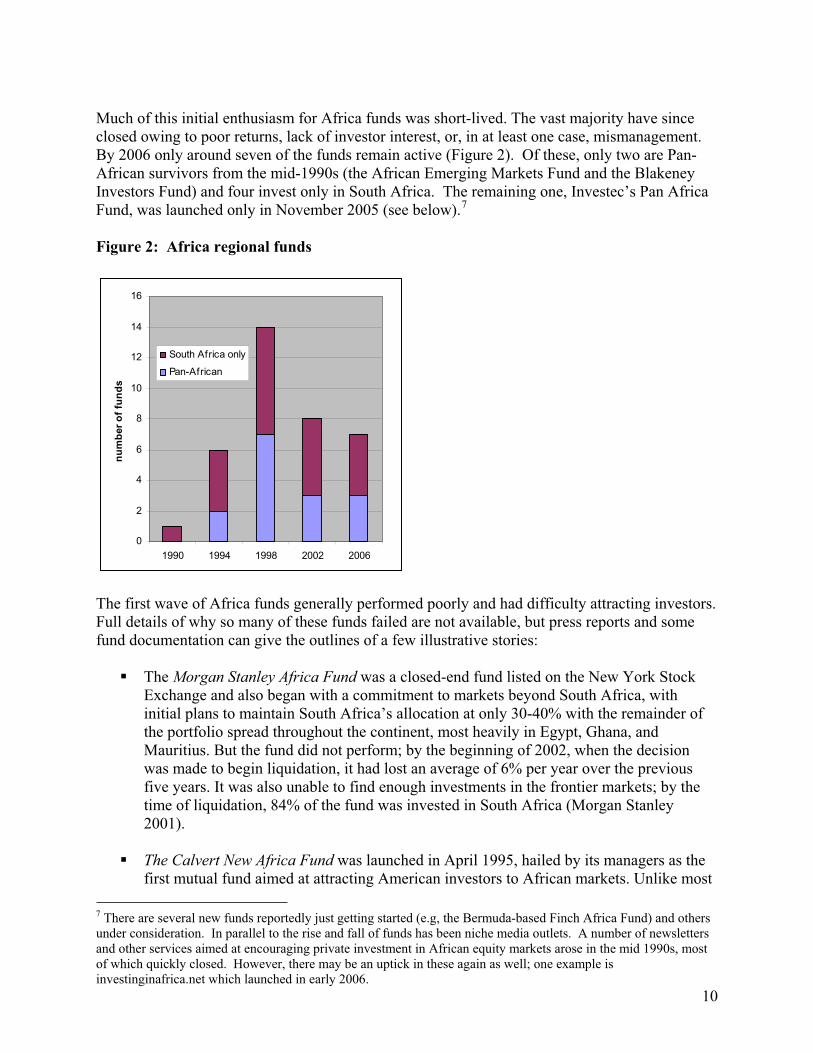
Much of this initial enthusiasm for Africa funds was short-lived. The vast majority have since closed owing to poor returns, lack of investor interest, or, in at least one case, mismanagement. By 2006 only around seven of the funds remain active (Figure 2). Of these, only two are Pan-African survivors from the mid-1990s (the African Emerging Markets Fund and the Blakeney Investors Fund) and four invest only in South Africa. The remaining one, Investec’s Pan Africa Fund, was launched only in November 2005 (see below).7
Figure 2: Africa regional funds
0
2
4
6
8
10
12
14
16
1990 1994 1998 2002 2006
nu
mb
er
of
fun
ds
South Africa only
Pan-African
The first wave of Africa funds generally performed poorly and had difficulty attracting investors.Full details of why so many of these funds failed are not available, but press reports and some fund documentation can give the outlines of a few illustrative stories:
The Morgan Stanley Africa Fund was a closed-end fund listed on the New York Stock Exchange and also began with a commitment to markets beyond South Africa, with initial plans to maintain South Africa’s allocation at only 30-40% with the remainder of the portfolio spread throughout the continent, most heavily in Egypt, Ghana, and Mauritius. But the fund did not perform; by the beginning of 2002, when the decision was made to begin liquidation, it had lost an average of 6% per year over the previous five years. It was also unable to find enough investments in the frontier markets; by the time of liquidation, 84% of the fund was invested in South Africa (Morgan Stanley 2001).
The Calvert New Africa Fund was launched in April 1995, hailed by its managers as the first mutual fund aimed at attracting American investors to African markets. Unlike most
10
7 There are several new funds reportedly just getting started (e.g, the Bermuda-based Finch Africa Fund) and others under consideration. In parallel to the rise and fall of funds has been niche media outlets. A number of newsletters and other services aimed at encouraging private investment in African equity markets arose in the mid 1990s, most of which quickly closed. However, there may be an uptick in these again as well; one example is investinginafrica.net which launched in early 2006.
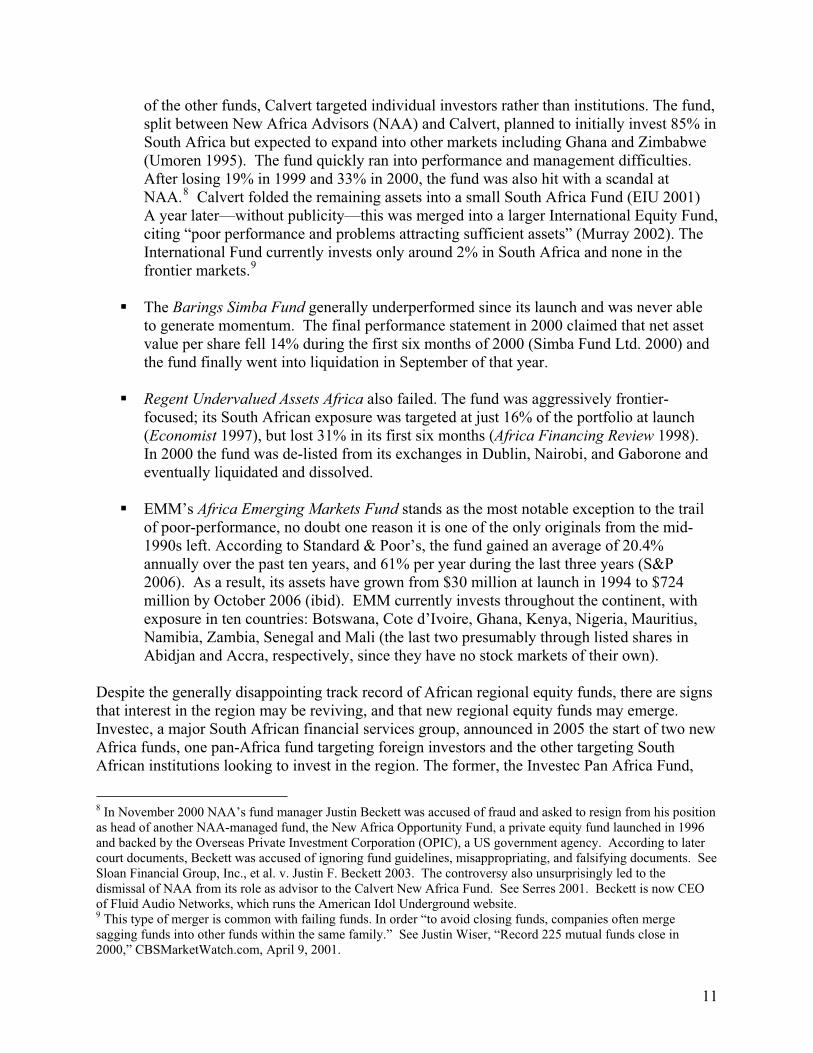
of the other funds, Calvert targeted individual investors rather than institutions. The fund, split between New Africa Advisors (NAA) and Calvert, planned to initially invest 85% in South Africa but expected to expand into other markets including Ghana and Zimbabwe (Umoren 1995). The fund quickly ran into performance and management difficulties. After losing 19% in 1999 and 33% in 2000, the fund was also hit with a scandal at NAA.8 Calvert folded the remaining assets into a small South Africa Fund (EIU 2001) A year later—without publicity—this was merged into a larger International Equity Fund, citing “poor performance and problems attracting sufficient assets” (Murray 2002). The International Fund currently invests only around 2% in South Africa and none in the frontier markets.9
The Barings Simba Fund generally underperformed since its launch and was never able to generate momentum. The final performance statement in 2000 claimed that net asset value per share fell 14% during the first six months of 2000 (Simba Fund Ltd. 2000) and the fund finally went into liquidation in September of that year.
Regent Undervalued Assets Africa also failed. The fund was aggressively frontier-focused; its South African exposure was targeted at just 16% of the portfolio at launch (Economist 1997), but lost 31% in its first six months (Africa Financing Review 1998).In 2000 the fund was de-listed from its exchanges in Dublin, Nairobi, and Gaborone and eventually liquidated and dissolved.
EMM’s Africa Emerging Markets Fund stands as the most notable exception to the trail of poor-performance, no doubt one reason it is one of the only originals from the mid-1990s left. According to Standard & Poor’s, the fund gained an average of 20.4% annually over the past ten years, and 61% per year during the last three years (S&P 2006). As a result, its assets have grown from $30 million at launch in 1994 to $724 million by October 2006 (ibid). EMM currently invests throughout the continent, with exposure in ten countries: Botswana, Cote d’Ivoire, Ghana, Kenya, Nigeria, Mauritius, Namibia, Zambia, Senegal and Mali (the last two presumably through listed shares in Abidjan and Accra, respectively, since they have no stock markets of their own).
Despite the generally disappointing track record of African regional equity funds, there are signs that interest in the region may be reviving, and that new regional equity funds may emerge. Investec, a major South African financial services group, announced in 2005 the start of two new Africa funds, one pan-Africa fund targeting foreign investors and the other targeting South African institutions looking to invest in the region. The former, the Investec Pan Africa Fund,
8 In November 2000 NAA’s fund manager Justin Beckett was accused of fraud and asked to resign from his position as head of another NAA-managed fund, the New Africa Opportunity Fund, a private equity fund launched in 1996 and backed by the Overseas Private Investment Corporation (OPIC), a US government agency. According to later court documents, Beckett was accused of ignoring fund guidelines, misappropriating, and falsifying documents. See Sloan Financial Group, Inc., et al. v. Justin F. Beckett 2003. The controversy also unsurprisingly led to the dismissal of NAA from its role as advisor to the Calvert New Africa Fund. See Serres 2001. Beckett is now CEO of Fluid Audio Networks, which runs the American Idol Underground website. 9 This type of merger is common with failing funds. In order “to avoid closing funds, companies often merge sagging funds into other funds within the same family.” See Justin Wiser, “Record 225 mutual funds close in 2000,” CBSMarketWatch.com, April 9, 2001.
11
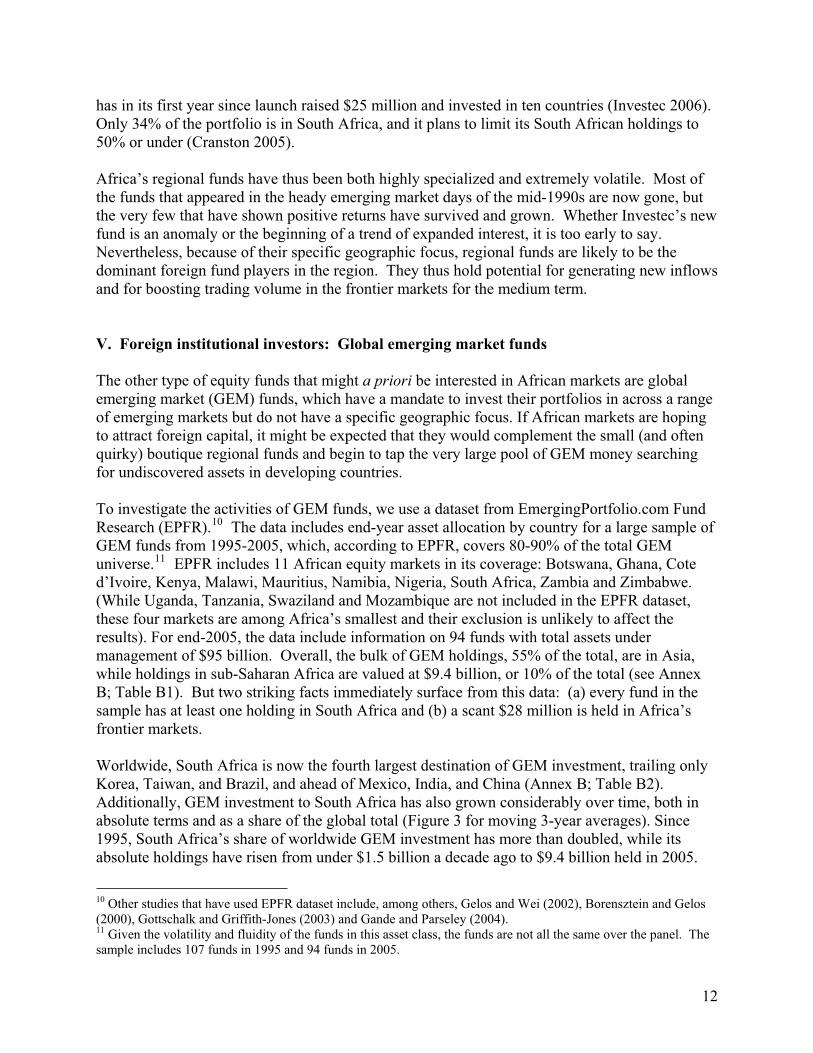
has in its first year since launch raised $25 million and invested in ten countries (Investec 2006). Only 34% of the portfolio is in South Africa, and it plans to limit its South African holdings to 50% or under (Cranston 2005).
Africa’s regional funds have thus been both highly specialized and extremely volatile. Most of the funds that appeared in the heady emerging market days of the mid-1990s are now gone, but the very few that have shown positive returns have survived and grown. Whether Investec’s new fund is an anomaly or the beginning of a trend of expanded interest, it is too early to say. Nevertheless, because of their specific geographic focus, regional funds are likely to be the dominant foreign fund players in the region. They thus hold potential for generating new inflows and for boosting trading volume in the frontier markets for the medium term.
V. Foreign institutional investors: Global emerging market funds
The other type of equity funds that might a priori be interested in African markets are global emerging market (GEM) funds, which have a mandate to invest their portfolios in across a range of emerging markets but do not have a specific geographic focus. If African markets are hoping to attract foreign capital, it might be expected that they would complement the small (and often quirky) boutique regional funds and begin to tap the very large pool of GEM money searching for undiscovered assets in developing countries.
To investigate the activities of GEM funds, we use a dataset from EmergingPortfolio.com Fund Research (EPFR).10 The data includes end-year asset allocation by country for a large sample of GEM funds from 1995-2005, which, according to EPFR, covers 80-90% of the total GEM universe.11 EPFR includes 11 African equity markets in its coverage: Botswana, Ghana, Cote d’Ivoire, Kenya, Malawi, Mauritius, Namibia, Nigeria, South Africa, Zambia and Zimbabwe. (While Uganda, Tanzania, Swaziland and Mozambique are not included in the EPFR dataset, these four markets are among Africa’s smallest and their exclusion is unlikely to affect the results). For end-2005, the data include information on 94 funds with total assets under management of $95 billion. Overall, the bulk of GEM holdings, 55% of the total, are in Asia, while holdings in sub-Saharan Africa are valued at $9.4 billion, or 10% of the total (see Annex B; Table B1). But two striking facts immediately surface from this data: (a) every fund in the sample has at least one holding in South Africa and (b) a scant $28 million is held in Africa’s frontier markets.
Worldwide, South Africa is now the fourth largest destination of GEM investment, trailing only Korea, Taiwan, and Brazil, and ahead of Mexico, India, and China (Annex B; Table B2). Additionally, GEM investment to South Africa has also grown considerably over time, both in absolute terms and as a share of the global total (Figure 3 for moving 3-year averages). Since 1995, South Africa’s share of worldwide GEM investment has more than doubled, while its absolute holdings have risen from under $1.5 billion a decade ago to $9.4 billion held in 2005.
10 Other studies that have used EPFR dataset include, among others, Gelos and Wei (2002), Borensztein and Gelos (2000), Gottschalk and Griffith-Jones (2003) and Gande and Parseley (2004). 11 Given the volatility and fluidity of the funds in this asset class, the funds are not all the same over the panel. The sample includes 107 funds in 1995 and 94 funds in 2005.
12
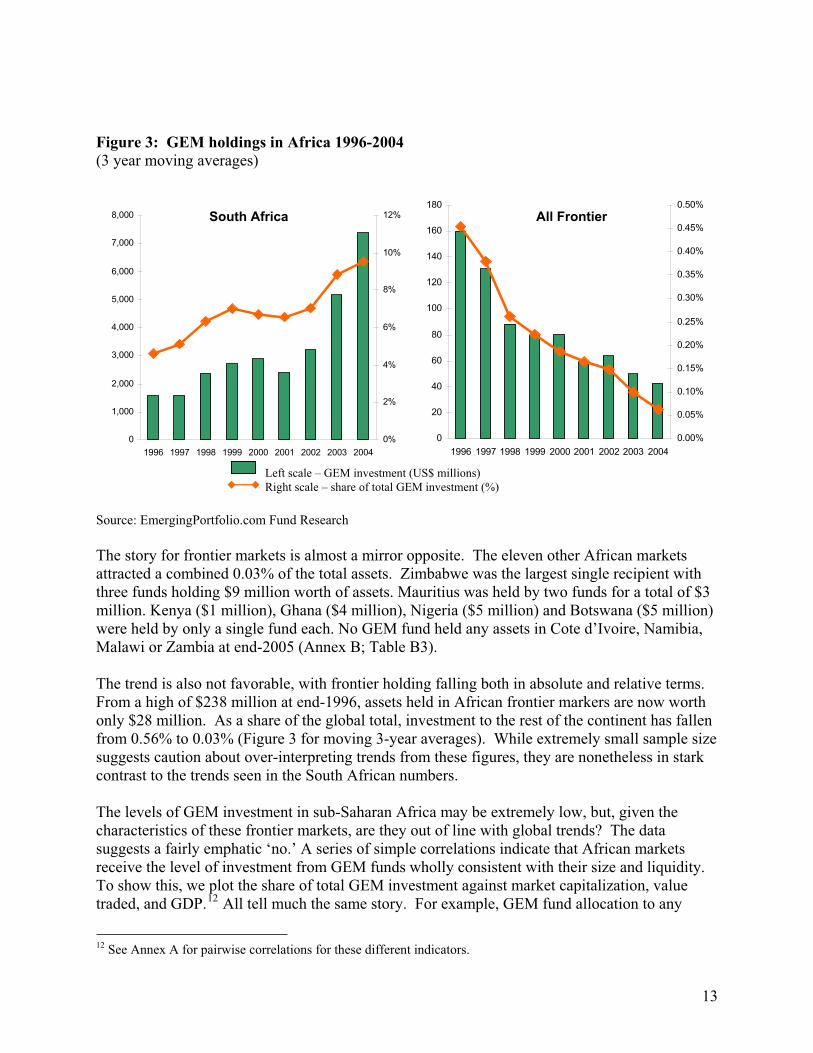
Figure 3: GEM holdings in Africa 1996-2004
(3 year moving averages)
Left scale – GEM investment (US$ millions)
Right scale – share of total GEM investment (%)
0
20
40
60
80
100
120
140
160
180
1996 1997 1998 1999 2000 2001 2002 2003 2004
0.00%
0.05%
0.10%
0.15%
0.20%
0.25%
0.30%
0.35%
0.40%
0.45%
0.50%
0
1,000
2,000
3,000
4,000
5,000
6,000
7,000
8,000
1996 1997 1998 1999 2000 2001 2002 2003 2004
0%
2%
4%
6%
8%
10%
12%South Africa All Frontier
Source: EmergingPortfolio.com Fund Research
The story for frontier markets is almost a mirror opposite. The eleven other African markets attracted a combined 0.03% of the total assets. Zimbabwe was the largest single recipient with three funds holding $9 million worth of assets. Mauritius was held by two funds for a total of $3 million. Kenya ($1 million), Ghana ($4 million), Nigeria ($5 million) and Botswana ($5 million) were held by only a single fund each. No GEM fund held any assets in Cote d’Ivoire, Namibia, Malawi or Zambia at end-2005 (Annex B; Table B3).
The trend is also not favorable, with frontier holding falling both in absolute and relative terms. From a high of $238 million at end-1996, assets held in African frontier markers are now worth only $28 million. As a share of the global total, investment to the rest of the continent has fallen from 0.56% to 0.03% (Figure 3 for moving 3-year averages). While extremely small sample size suggests caution about over-interpreting trends from these figures, they are nonetheless in stark contrast to the trends seen in the South African numbers.
The levels of GEM investment in sub-Saharan Africa may be extremely low, but, given the characteristics of these frontier markets, are they out of line with global trends? The data suggests a fairly emphatic ‘no.’ A series of simple correlations indicate that African markets receive the level of investment from GEM funds wholly consistent with their size and liquidity. To show this, we plot the share of total GEM investment against market capitalization, value traded, and GDP.12 All tell much the same story. For example, GEM fund allocation to any
12 See Annex A for pairwise correlations for these different indicators.
13
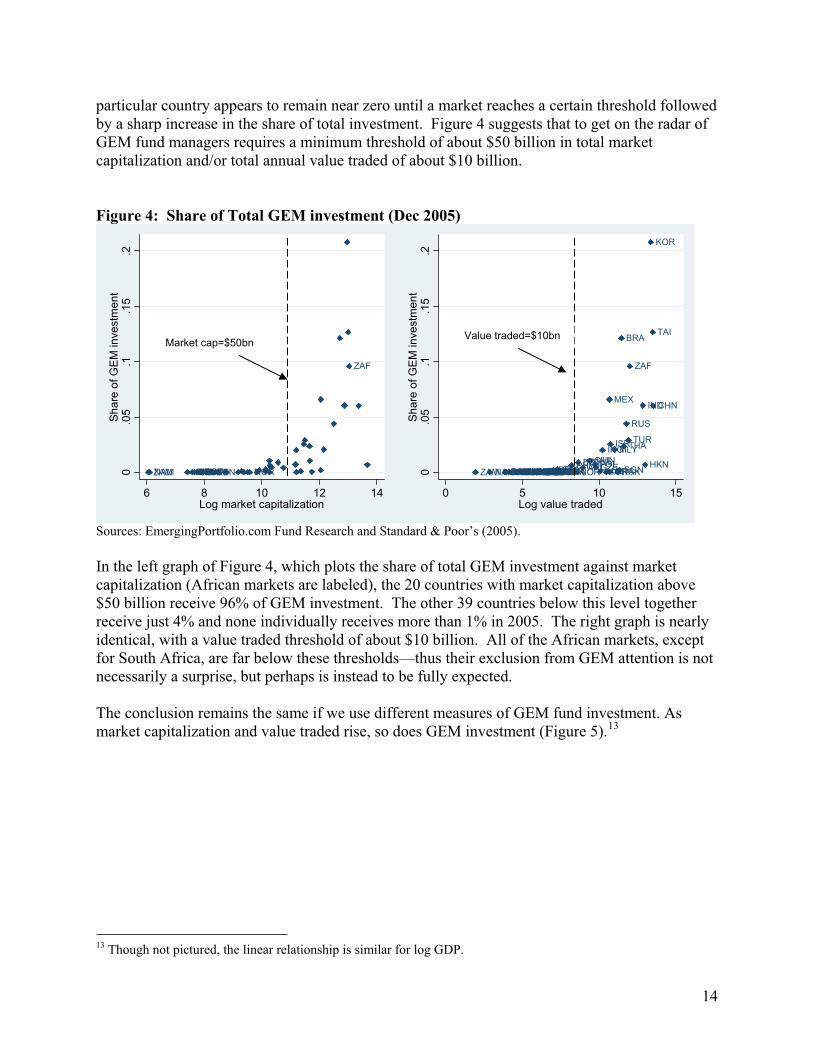
particular country appears to remain near zero until a market reaches a certain threshold followed by a sharp increase in the share of total investment. Figure 4 suggests that to get on the radar of GEM fund managers requires a minimum threshold of about $50 billion in total market capitalization and/or total annual value traded of about $10 billion.
Figure 4: Share of Total GEM investment (Dec 2005)
BOTCIVGHAKENMUSNAM NGR
ZAF
ZAM ZIM0.0
5.1
.15
.2S
hare
of G
EM
investm
ent
6 8 10 12 14Log market capitalization
ARGAUTBAHBANBOT
BRA
BUL
CHL
CHN
COLCIV CROCYPCZE
ECUEGY
ESTGHA GRCHKNHUN
IND
INOISR
JORKAZKEN
KOR
LATLEBLIT
MLY
MUS
MEX
MARNAM NGROMA PAKPAN PERPHL POLPRTROM
RUS
SGNSLVSLN
ZAF
SLK
TAI
THA
TUN
TUR
UKRVENZAM ZIM0.0
5.1
.15
.2S
hare
of G
EM
investm
ent
0 5 10 15Log value traded
Market cap=$50bn Value traded=$10bn
Sources: EmergingPortfolio.com Fund Research and Standard & Poor’s (2005).
In the left graph of Figure 4, which plots the share of total GEM investment against market capitalization (African markets are labeled), the 20 countries with market capitalization above $50 billion receive 96% of GEM investment. The other 39 countries below this level together receive just 4% and none individually receives more than 1% in 2005. The right graph is nearly identical, with a value traded threshold of about $10 billion. All of the African markets, except for South Africa, are far below these thresholds—thus their exclusion from GEM attention is not necessarily a surprise, but perhaps is instead to be fully expected.
The conclusion remains the same if we use different measures of GEM fund investment. As market capitalization and value traded rise, so does GEM investment (Figure 5).13
13 Though not pictured, the linear relationship is similar for log GDP.
14
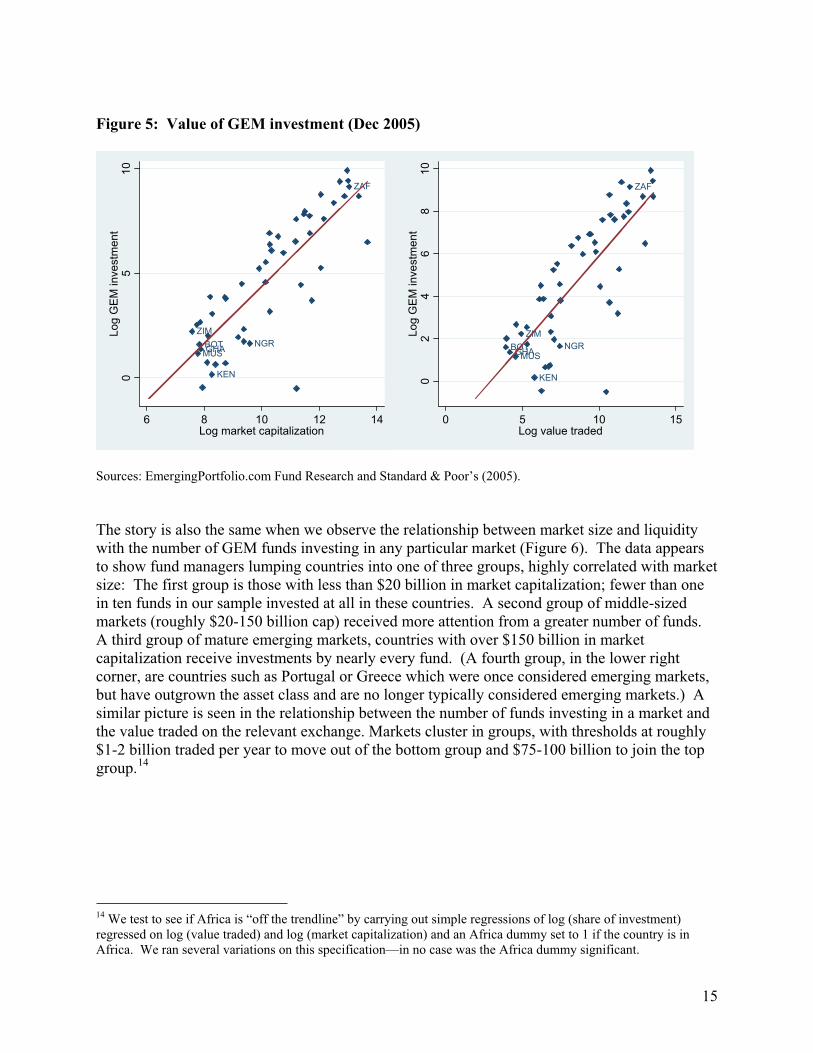
Figure 5: Value of GEM investment (Dec 2005)
BOTGHA
KEN
MUSNGR
ZAF
ZIM
05
10
Lo
g G
EM
in
ve
stm
en
t
6 8 10 12 14Log market capitalization
BOTGHA
KEN
MUSNGR
ZAF
ZIM
02
46
81
0L
og
GE
M in
ve
stm
en
t0 5 10 15
Log value traded
Sources: EmergingPortfolio.com Fund Research and Standard & Poor’s (2005).
The story is also the same when we observe the relationship between market size and liquidity with the number of GEM funds investing in any particular market (Figure 6). The data appears to show fund managers lumping countries into one of three groups, highly correlated with market size: The first group is those with less than $20 billion in market capitalization; fewer than one in ten funds in our sample invested at all in these countries. A second group of middle-sized markets (roughly $20-150 billion cap) received more attention from a greater number of funds. A third group of mature emerging markets, countries with over $150 billion in market capitalization receive investments by nearly every fund. (A fourth group, in the lower right corner, are countries such as Portugal or Greece which were once considered emerging markets, but have outgrown the asset class and are no longer typically considered emerging markets.) A similar picture is seen in the relationship between the number of funds investing in a market and the value traded on the relevant exchange. Markets cluster in groups, with thresholds at roughly $1-2 billion traded per year to move out of the bottom group and $75-100 billion to join the top group.14
14 We test to see if Africa is “off the trendline” by carrying out simple regressions of log (share of investment) regressed on log (value traded) and log (market capitalization) and an Africa dummy set to 1 if the country is in Africa. We ran several variations on this specification—in no case was the Africa dummy significant.
15
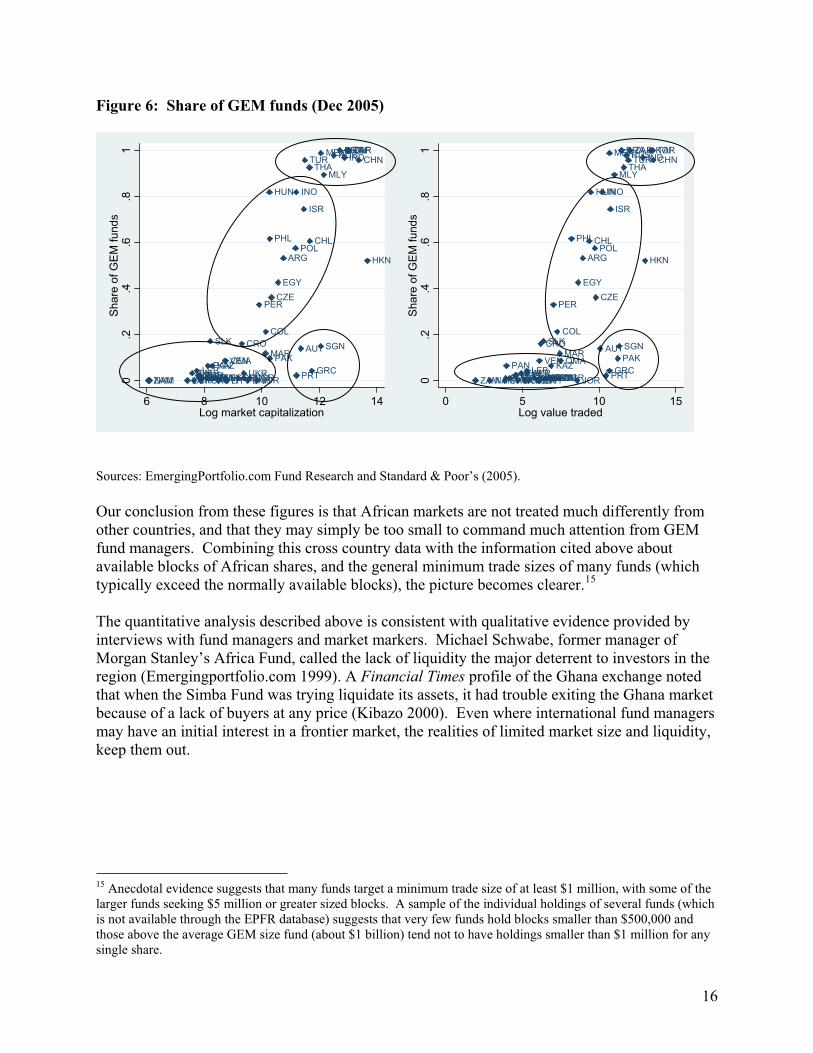
Figure 6: Share of GEM funds (Dec 2005)
ARG
AUT
BAHBANBOT
BRA
BUL
CHL
CHN
COL
CIV
CRO
CYP
CZE
ECU
EGY
ESTGHAGRC
HKN
HUN
IND
INO
ISR
JOR
KAZ
KEN
KOR
LATLEB
LIT
MLY
MUS
MEX
MAR
NAM NGR
OMA PAKPAN
PER
PHLPOL
PRTROM
RUS
SGN
SLV SLN
ZAF
SLK
TAI
THA
TUN
TUR
UKR
VEN
ZAMZIM
0.2
.4.6
.81
Share
of G
EM
funds
6 8 10 12 14Log market capitalization
ARG
AUT
BAHBANBOT
BRA
BUL
CHL
CHN
COL
CIV
CRO
CYP
CZE
ECU
EGY
ESTGHAGRC
HKN
HUN
IND
INO
ISR
JOR
KAZ
KEN
KOR
LATLEB
LIT
MLY
MUS
MEX
MAR
NAM NGR
OMA PAKPAN
PER
PHLPOL
PRTROM
RUS
SGN
SLVSLN
ZAF
SLK
TAI
THA
TUN
TUR
UKR
VEN
ZAMZIM
0.2
.4.6
.81
Share
of G
EM
funds
0 5 10 15Log value traded
Sources: EmergingPortfolio.com Fund Research and Standard & Poor’s (2005).
Our conclusion from these figures is that African markets are not treated much differently from other countries, and that they may simply be too small to command much attention from GEM fund managers. Combining this cross country data with the information cited above about available blocks of African shares, and the general minimum trade sizes of many funds (which typically exceed the normally available blocks), the picture becomes clearer.15
The quantitative analysis described above is consistent with qualitative evidence provided by interviews with fund managers and market markers. Michael Schwabe, former manager of Morgan Stanley’s Africa Fund, called the lack of liquidity the major deterrent to investors in the region (Emergingportfolio.com 1999). A Financial Times profile of the Ghana exchange noted that when the Simba Fund was trying liquidate its assets, it had trouble exiting the Ghana market because of a lack of buyers at any price (Kibazo 2000). Even where international fund managers may have an initial interest in a frontier market, the realities of limited market size and liquidity, keep them out.
15 Anecdotal evidence suggests that many funds target a minimum trade size of at least $1 million, with some of the larger funds seeking $5 million or greater sized blocks. A sample of the individual holdings of several funds (which is not available through the EPFR database) suggests that very few funds hold blocks smaller than $500,000 and those above the average GEM size fund (about $1 billion) tend not to have holdings smaller than $1 million for any single share.
16
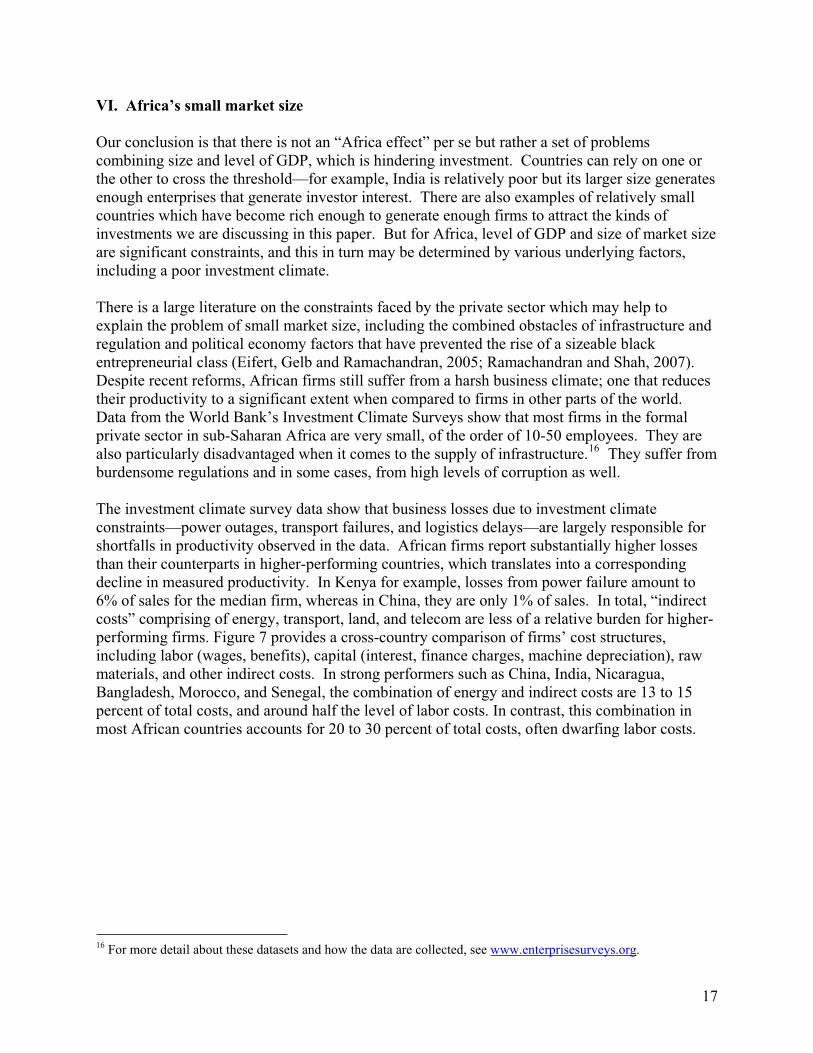
VI. Africa’s small market size
Our conclusion is that there is not an “Africa effect” per se but rather a set of problems combining size and level of GDP, which is hindering investment. Countries can rely on one or the other to cross the threshold—for example, India is relatively poor but its larger size generates enough enterprises that generate investor interest. There are also examples of relatively small countries which have become rich enough to generate enough firms to attract the kinds of investments we are discussing in this paper. But for Africa, level of GDP and size of market size are significant constraints, and this in turn may be determined by various underlying factors, including a poor investment climate.
There is a large literature on the constraints faced by the private sector which may help to explain the problem of small market size, including the combined obstacles of infrastructure and regulation and political economy factors that have prevented the rise of a sizeable black entrepreneurial class (Eifert, Gelb and Ramachandran, 2005; Ramachandran and Shah, 2007). Despite recent reforms, African firms still suffer from a harsh business climate; one that reduces their productivity to a significant extent when compared to firms in other parts of the world.Data from the World Bank’s Investment Climate Surveys show that most firms in the formal private sector in sub-Saharan Africa are very small, of the order of 10-50 employees. They are also particularly disadvantaged when it comes to the supply of infrastructure.16 They suffer from burdensome regulations and in some cases, from high levels of corruption as well.
The investment climate survey data show that business losses due to investment climate constraints—power outages, transport failures, and logistics delays—are largely responsible for shortfalls in productivity observed in the data. African firms report substantially higher losses than their counterparts in higher-performing countries, which translates into a corresponding decline in measured productivity. In Kenya for example, losses from power failure amount to 6% of sales for the median firm, whereas in China, they are only 1% of sales. In total, “indirect costs” comprising of energy, transport, land, and telecom are less of a relative burden for higher-performing firms. Figure 7 provides a cross-country comparison of firms’ cost structures, including labor (wages, benefits), capital (interest, finance charges, machine depreciation), raw materials, and other indirect costs. In strong performers such as China, India, Nicaragua, Bangladesh, Morocco, and Senegal, the combination of energy and indirect costs are 13 to 15 percent of total costs, and around half the level of labor costs. In contrast, this combination in most African countries accounts for 20 to 30 percent of total costs, often dwarfing labor costs.
16 For more detail about these datasets and how the data are collected, see www.enterprisesurveys.org.
17
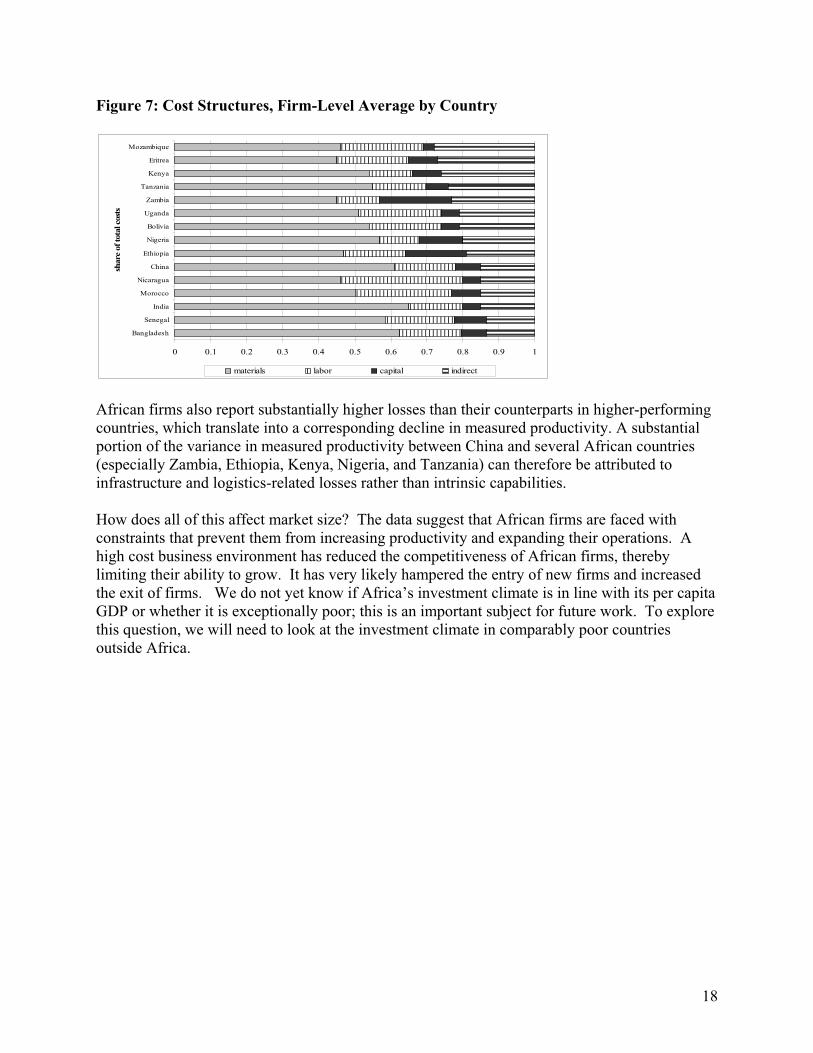
Figure 7: Cost Structures, Firm-Level Average by Country
0 0.1 0.2 0.3 0.4 0.5 0.6 0.7 0.8 0.9 1
Bangladesh
Senegal
India
Morocco
Nicaragua
China
Ethiopia
Nigeria
Bolivia
Uganda
Zambia
Tanzania
Kenya
Eritrea
Mozambique
share
of to
tal co
sts
materials labor capital indirect
African firms also report substantially higher losses than their counterparts in higher-performing countries, which translate into a corresponding decline in measured productivity. A substantial portion of the variance in measured productivity between China and several African countries (especially Zambia, Ethiopia, Kenya, Nigeria, and Tanzania) can therefore be attributed to infrastructure and logistics-related losses rather than intrinsic capabilities.
How does all of this affect market size? The data suggest that African firms are faced with constraints that prevent them from increasing productivity and expanding their operations. A high cost business environment has reduced the competitiveness of African firms, thereby limiting their ability to grow. It has very likely hampered the entry of new firms and increased the exit of firms. We do not yet know if Africa’s investment climate is in line with its per capita GDP or whether it is exceptionally poor; this is an important subject for future work. To explore this question, we will need to look at the investment climate in comparably poor countries outside Africa.
18
19
VII. Conclusion
Africa has made significant progress in developing its domestic capital markets. Information on African markets is improving, regulatory and financial sector reforms have been implemented, and countries are beginning to adopt modern technologies such as automated trading and central depository systems. South Africa has successfully risen into the ranks of the leading emerging market destinations. However, the rest of the continent remains largely outside the expansion in global financial flows witnessed over the past two decades. Africa’s “frontier markets” remain firmly off the radar of international portfolio fund managers, with the exception of a handful of Africa fund managers— and possibly Nigeria whose market capitalization has recently topped $30bn. This paper suggests, however, that the overall level of GEM investment in African markets is consistent with global trends. Given the size and liquidity constraints that characterize these markets, the amount of attention from equity fund managers seems in line with global norms.
This analysis broadly supports the “market works” view of why Africa does not get more equity investment, but has some substantial implications for strategies to grow these markets and attract new investors. This conclusion suggests that many of the public policy interventions intended to increase equity investment in Africa are unlikely to have a significant impact in the short and medium terms. The implications for Africa and policymakers are threefold. First, for the foreseeable future, foreign fund investment in the frontier markets will be limited largely to those funds with regional specialties. Investment promotion efforts should therefore focus on increasing domestic institutional and individual investment and concentrate foreign efforts on raising the number of regional funds rather than attempting to lure general emerging market funds.
Second, the depth and success of the Johannesburg Stock Exchange need not remain constrained within South Africa’s borders. Botswana, Namibia, and others have increased cross-listings—a trend that should continue to be encouraged. While wholesale regionalization of bourses faces significant barriers, there are other cooperative arrangements that would allow frontier markets to benefit more fully from the liquidity and exposure of the JSE (Irving 2005; Okeahalam 2005).
Finally, a long-term strategy for attracting equity investment should concentrate on increasing the supply of available securities—since demand will come naturally through the market. Increasing supply means tackling the barriers of small market and firm size to encourage the growth of more and larger firms on the continent. Solutions to increasing the size and scope of the African private sector must focus on improving the investment climate, reducing the level of risk and uncertainty, and providing greater means for small, indigenous firms to survive and grow without inducing large distortions. While these issues are far beyond the scope of this paper, it is worth emphasizing that addressing the problem of private sector growth—rather than attempting to fight imagined “market failures”—is a crucial component of any overall plan to increase equity investments in the region.
20
References
Africa Financing Review (1998). “Botswana – Stock market report,” p. 1, November 1.
Barber, Simon (2000). “Politics hover in background as US-based fund sacks boss,” Business
Day, November 8.
Bhattacharya, Amar, Peter J. Montiel and Sunil Sharma (1996). “Private Capital Flows to Sub-Saharan Africa: An Overview of Trends and Determinants,” in Zubair Iqbal and Ravi Kanbur. External Finance for Low Income Countries, Washington: IMF, pp. 207-232.
Borensztein, Eduardo and R. Gaston Gelos (2000). “A Panic-Prone Pack?: The Behavior of Emerging Market Mutual Funds,” IMF Working Paper No. 00/198, Washington: International Monetary Fund.
Caprio, Gerard, Jr. and Asli Demirguc-Kunt (1997). “The Role of Long-Term Finance: Theory and Evidence,” Working Paper No. 1746, Washington: World Bank.
Christy, John (1998). “Bright spots on the Dark Continent,” Forbes, October.
Chuhan, Punam, Stijn Claessens and Nlandu Mamingi (1993). “Equity and Bond Flows to Asia and Latin America,” World Bank Working Paper No. 1160, Washington: World Bank.
Cranston, Stephen (2005). “A Shot in the Dark,” Financial Mail, December 16.
Economist (1997). “African stockmarkets: no joke,” January 11.
Eifert, Ben, Alan Gelb and Vijaya Ramachandran (2005). “Business Environment and Comparative Advantage in Africa: Evidence from the Investment Climate Data,” Working paper 56, Washington: Center for Global Development.
EIU (2001). Business Africa, April 16.
Emergingportfolio.com (1999). “Fund Profile: Morgan Stanley Africa Investment Fund,” September.
Fernandez-Arias, Eduardo (1994). “The New Wave of Private Capital Inflows: Push or Pull?” Policy Research Working Paper No. 1312, Washington: World Bank.
Fernandez-Arias, Eduardo and Peter Montiel (1996). “The Surge in Capital Inflows to Developing Countries: An Analytical Overview.” World Bank Economic Review, Vol. 10, No. 1, pp. 51-77.
Frankel, Jeffrey A. and Chudozie Okongwu (1995). “Liberalized Portfolio Capital Inflows in Emerging Markets: Sterilization, Expectations, and the Incompleteness of Interest Rate Convergence,” NBER Working Paper Series, No. 5156, Cambridge: National Bureau of Economic Research.
Gande, Amar and David Parsley (2004). “The behaviour pattern of foreign equity investors during the financial crises of the late 1990s,” Vanderbilt University.
Gelos, Gaston R. and Shang-Jin Wei (2002). “Transparency and International Investor Behavior,” IMF Working Papers 02/174, Washington: International Monetary Fund.
21
Gottschalk, Ricardo and Stephany Griffith-Jones (2003). “The behaviour pattern of foreign equity investors during the financial crises of the late 1990s,” Institute of Development Studies, Brighton: University of Sussex.
Investec (2006). Pan Africa Fund, Q3, 2006 update, Investec Asset Management.
Irving, Jacqueline (2005). Regional Integration of Stock Exchanges in Eastern and Southern Africa: Progress and Prospects,” IMF Working Paper 05/122, Washington: IMF.
Kaminsky, Graciela, Richard Lyons and Sergio Schmukler (2001). “Mutual Fund Investment in Emerging Markets: An Overview,” Policy Research Working Paper No. 2529, Washington: World Bank.
Kenny, Charles and Todd Moss (1998). “Stock Markets in Africa: Emerging Lions or White Elephants?” World Development, Vol. 26, No. 5.
Kibazo, Joel (2000). “Survey-Ghana,” Financial Times, November 29.
King, Robert and Ross Levine (1993). “Finance and Growth: Schumpeter Might be Right,” Quarterly Journal of Economics, Vol. 108, No. 3, pp. 717-738.
Lavelle, Kathryn (1999). “International financial Institutions and Emerging Capital Markets in Africa,” Review of International Political Economy, Vol. 6, No. 2, pp. 200-224.
Levine, Ross (1996). “Financial Development and Economic Growth: Views and Agenda,” Policy Research Working Paper No. 1678, Washington: World Bank.
Levine, Ross and Sara Zervos (1996). “Stock Market Development and Long Run Growth,” World Bank Economic Review, Vol. 10, No. 2.
McKinnon, Ronald (1973). Money and Capital in Economic Development, Washington: The Brookings Institution.
Morgan Stanley (2001). “Morgan Stanley Africa Investment Fund Inc, 2001 Annual Report.”
Moss, Todd, (2003). Adventure Capitalism: Globalization and the political economy of stock
markets in Africa, New York: Palgrave MacMillan.
Murray, Sarah (2002). “Development social priorities in new markets,” Financial Times,December 19.
Ndikumana, Leonce (2001). “Financial Markets and Economic Development in Africa,” PERI Working Paper 17, Political Economy Research Institute, Amherst: University of Massachusetts.
Offerdal, Erik (1996). “The Response of Investment and Growth to Adjustment Policies,” Finance & Development, June, pp. 18-20.
Okeahalam, Charles (2005). “Strategic Alliances and Mergers of Financial Exchanges: The Case of the SADC,” Journal of Southern African Studies, Vol. 31, No. 1.
Ramachandran, Vijaya and Manju Kedia Shah (2007). “Why Are There So Few Black-Owned Businesses in Africa?,” CGD Working Paper 104.
Ramachandran, Vijaya, Manju Kedia Shah, and Gaiv Tata (2006). “Does Influence Peddling Impact Industrial Competition? Evidence from the Africa Investment Climate Surveys,” World Bank, forthcoming.
Robinson, Joan (1952). The Rate of Interest and Other Essays, London: Macmillan.
Samuel, Cherian (1996). “Stock Market and Investment: The Governance Role of the Market,” Working Paper No. 1578, Washington: World Bank.
Schneider, Friedrich and Robert Klinglmair (2004). “Shadow Economies around the World: What do we know?” WP 2004-03, Linz: Center for Research in Economics, Management and the Arts.
Schumpeter, Joseph (1934). The Theory of Economic Development, Cambridge: Harvard University Press.
Serres, Chris (2001). “Business pals’ venture in Africa ends in suit, split,” The News and
Observer, March 11.
Shaw, Edward (1973). Financial Deepening in Economic Development, New York: Oxford University Press.
Siddiqi, Moin (1997). “Although Africa is still relatively small as an emerging market, the potential for growth is substantial,” African Business, November 3.
Simba Fund Limited (2000). “Preliminary Statement of Half-Yearly Results in respect of the Company’s Interim Accounting Period from 1st January to 30th June 2000.”
Sisler, Peter (1995). “US group launches Africa money fund,” United Press International, April 12.
Sloan Financial Group, Inc., et al. v. Justin F. Beckett (2003). North Carolina Reports and North Carolina Court of Appeals Reports.
Standard & Poor’s (2006). Data retrieved October 2006 from http://www.funds-sp.com.
Tangri, Roger (2000). The Politics of Patronage in Africa: Parastatals, Privatization and Private
Enterprise in Africa, Trenton: Africa World Press.
Umoren, Rose (1995). “First Pan-African Mutual Fund Flounders,” Inter Press Service,September 27.
World Bank (2006). Doing Business 2007: How to Reform, Washington.
Xaba, Jantjie, Pat Horn and Shirin Motala (2002). “The Informal Sector in Sub-Saharan Africa,” Employment Sector 2002/10 Working Paper on the Informal Economy, Geneva: International Labor Office.
22
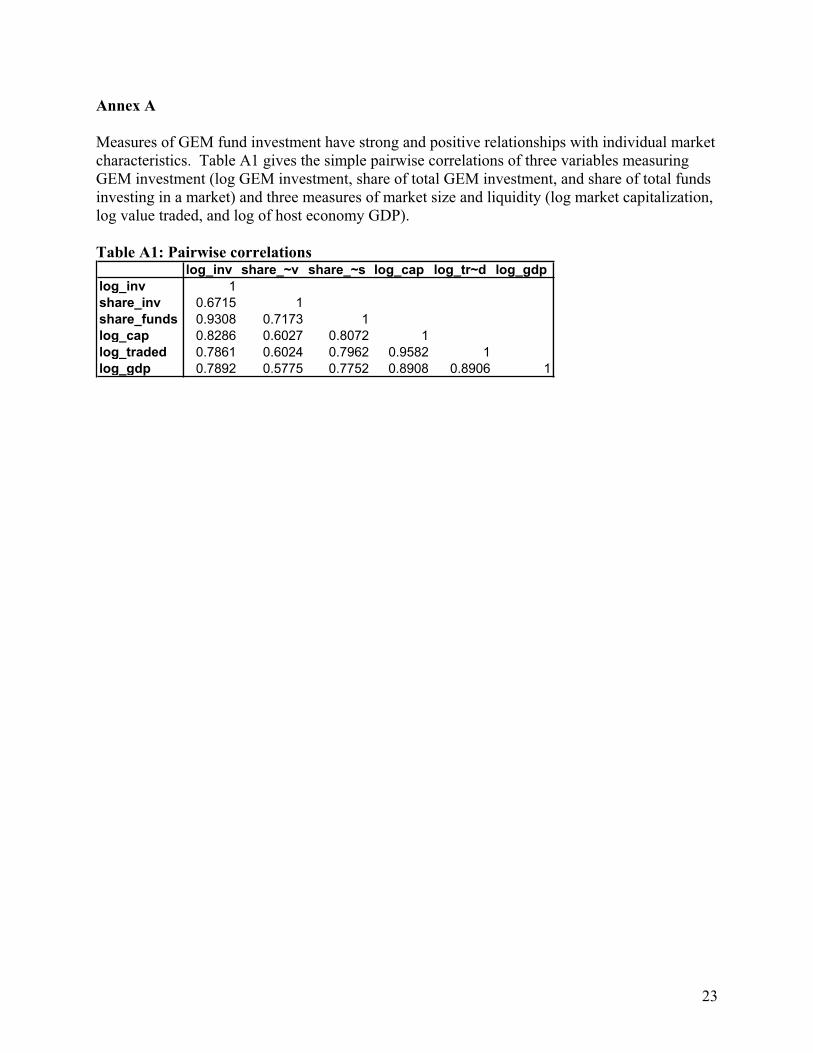
Annex A
Measures of GEM fund investment have strong and positive relationships with individual market characteristics. Table A1 gives the simple pairwise correlations of three variables measuring GEM investment (log GEM investment, share of total GEM investment, and share of total funds investing in a market) and three measures of market size and liquidity (log market capitalization, log value traded, and log of host economy GDP).
Table A1: Pairwise correlations log_inv share_~v share_~s log_cap log_tr~d log_gdp
log_inv 1share_inv 0.6715 1share_funds 0.9308 0.7173 1log_cap 0.8286 0.6027 0.8072 1log_traded 0.7861 0.6024 0.7962 0.9582 1log_gdp 0.7892 0.5775 0.7752 0.8908 0.8906 1
23
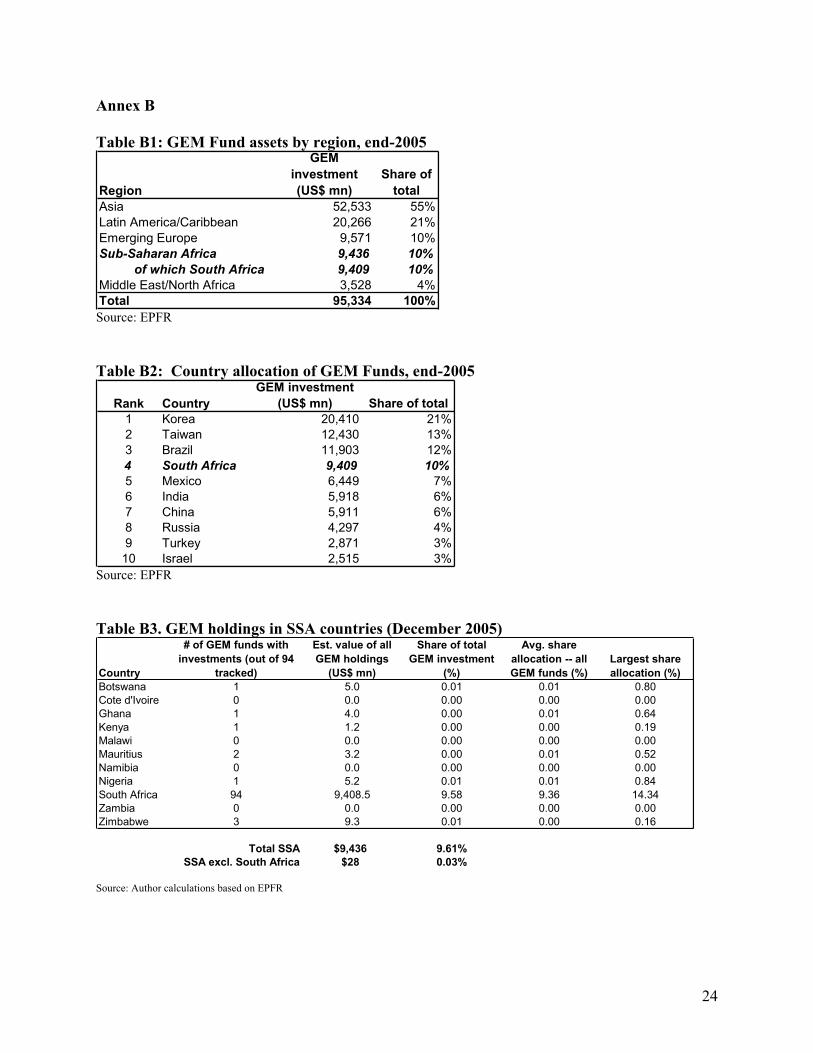
Annex B
Table B1: GEM Fund assets by region, end-2005
Region
GEM
investment
(US$ mn)
Share of
total
Asia 52,533 55%Latin America/Caribbean 20,266 21%
Emerging Europe 9,571 10%
Sub-Saharan Africa 9,436 10%
of which South Africa 9,409 10%
Middle East/North Africa 3,528 4%Total 95,334 100%
Source: EPFR
Table B2: Country allocation of GEM Funds, end-2005
Rank Country
GEM investment
(US$ mn) Share of total
1 Korea 20,410 21%2 Taiwan 12,430 13%
3 Brazil 11,903 12%
4 South Africa 9,409 10%
5 Mexico 6,449 7%6 India 5,918 6%
7 China 5,911 6%8 Russia 4,297 4%
9 Turkey 2,871 3%10 Israel 2,515 3%
Source: EPFR
Table B3. GEM holdings in SSA countries (December 2005)
Country
# of GEM funds with
investments (out of 94
tracked)
Est. value of all
GEM holdings
(US$ mn)
Share of total
GEM investment
(%)
Avg. share
allocation -- all
GEM funds (%)
Largest share
allocation (%)
Botswana 1 5.0 0.01 0.01 0.80Cote d'Ivoire 0 0.0 0.00 0.00 0.00Ghana 1 4.0 0.00 0.01 0.64
Kenya 1 1.2 0.00 0.00 0.19Malawi 0 0.0 0.00 0.00 0.00Mauritius 2 3.2 0.00 0.01 0.52
Namibia 0 0.0 0.00 0.00 0.00Nigeria 1 5.2 0.01 0.01 0.84
South Africa 94 9,408.5 9.58 9.36 14.34Zambia 0 0.0 0.00 0.00 0.00Zimbabwe 3 9.3 0.01 0.00 0.16
Total SSA $9,436 9.61%
SSA excl. South Africa $28 0.03%
Source: Author calculations based on EPFR
24
WWF/UNEP FI Risk Paper 1 DeRisk Advisory Services Ltd.
DeRiskDeRisk Advisory Services Ltd.
DRAFT - DRAFT - DRAFT - DRAFT
DRAFT - DRAFT - DRAFT - DRAFT
DRAFT - DRAFT - DRAFT - DRAFT
DRAFT - DRAFT - DRAFT - DRAFT
WWF/UNEP-FI workshop on Innovative Financing for Sustainable Small and Medium Enterprises in Africa Risk mitigation mechanisms and investment in sustainable SMEs Geneva, 26 September 2007 Version 18 September 2007 Prepared by DeRisk Advisory Services Ltd. DeRisk Advisory Services Ltd. is a risk mitigation specialist for investors in businesses and projects in developing countries, providing unique access to a wide spectrum of risk coverage and services. We work with debt, equity, corporate, philanthropic, and other developing country investors, as they deploy capital beyond the security—and limitations—of more mature and liquid financial markets.
DRAFT – For delegate review and input only
WWF/UNEP FI Risk Paper 2 DeRisk Advisory Services Ltd.
DeRiskDeRisk Advisory Services Ltd.
DRAFT - DRAFT - DRAFT - DRAFT
DRAFT - DRAFT - DRAFT - DRAFT
DRAFT - DRAFT - DRAFT - DRAFT
DRAFT - DRAFT - DRAFT - DRAFT
CONTENTS 1 Executive summary ................................................................................................. 0 2 Introduction .......................................................................................................... 0
2.1 Definitions ....................................................................................................... 0 2.2 Objectives ....................................................................................................... 0 2.3 Geographic focus ............................................................................................... 0
3 Risk as a hurdle to increased SME financing .................................................................... 0 4 Investment risk mitigation mechanisms........................................................................... 0
4.1 Introduction...................................................................................................... 0 4.2 Mechanism evaluation framework............................................................................ 0 4.3 The mechanisms ................................................................................................ 0
5 High-potential risk mitigation mechanisms ....................................................................... 0 5.1 Local Bank Unsecured Lending Facility...................................................................... 0 5.2 Private Sector Investment Enhancement Fund ............................................................. 0 5.3 Fund-Linked Technical Assistance............................................................................ 0
6 Preliminary open issues and next steps .......................................................................... 0 6.1 Preliminary open issues........................................................................................ 0 6.2 Preliminary next steps......................................................................................... 0
7 Annexes ............................................................................................................... 0 7.1 Annex 1: Mechanism evaluation criteria .................................................................... 0 7.2 Annex 2: Detailed mechanism list............................................................................ 0
WWF/UNEP FI Risk Paper 3 DeRisk Advisory Services Ltd.
DeRiskDeRisk Advisory Services Ltd.
DRAFT - DRAFT - DRAFT - DRAFT
DRAFT - DRAFT - DRAFT - DRAFT
DRAFT - DRAFT - DRAFT - DRAFT
DRAFT - DRAFT - DRAFT - DRAFT
1 Executive summary
In order for Africa to benefit from sustained and far-reaching growth, its small and medium size enterprise (SMEs) sector must continue to grow. And in order for this growth to be environmentally sustainable, “sustainable SMEs” – either SMEs whose business models are aimed at bettering the environment or SMEs that are run in an environmentally sustainable manner – should help drive it. An increasing number of SMEs require more access to outside capital in order to do so – capital whose price is commensurate with the actual investment risk and is easier to access. There are a variety of reasons why more capital is not flowing to SMEs. Others at the WWF/UNEP-FI workshop on Innovative Financing for Sustainable Small and Medium Enterprises in Africa will address issues surrounding the supply of capital, the visibility of “investible” SMEs, restrictions on management know-how, among others. This paper addresses the issue of risk – both real and perceived – as an SME investment hu rdle by assessing the potential for specific risk mitigation mechanisms to reduce inves tment risk in a scalable and replicable manner. The result is a presentation of three mecha nisms that could potentially be developed and/or more widely deployed in partnershi p with organizations like those participating in the WWF/UNEP-FI workshop. A wide variety of risk mitigation mechanisms are currently employed to eliminate or at least reduce the business, market and country risks related to SME investment in Africa. This paper provides concrete examples – or potential applications – in the following categories:
Table 1: Overview of SME Investment Risk Mitigation Mechanisms
Mechanism Example Risk impact
Diversification � GroFin Aspire funds in Africa � All risks: stabilizes investment returns
Due Diligence / Assurance
� Deloitte & Touche due diligence / assurance services � Business risk: negative screening of bad risks
Fund Enhancement
� [Anonymous] European relief agency “first loss” anchor investment in an East Africa SME fund
� Business risk: partial coverage against underlying business failure
Guarantee � Grameen Foundation “Growth Guarantee” network � USAID – Development Credit Authority guarantees � GARI Loan Guarantee Fund � World Bank / IBRD partial credit “re-guarantees”
� Business risk: partial coverage against underlying business failure
Hedging � ING Bank commodity and currency derivatives � Distributed Capital Group “DFT-Hedge” for currencies in
developing markets � FMO TCX Fund
� Market risk: minimizes volatility of business cash flows or investment returns related dependent on asset prices (e.g. currencies, commodities)
Private Sector Insurance
� Hiscox (Lloyd’s syndicate) political risk insurance � Atradius credit insurance � Aureol Insurance Company (Sierra Leone)
� Business and/or country risks: insures against losses due to specific risk events
Public Sector Insurance
� MIGA political risk insurance � GIFF index insurance facility � UEP Global Environment Facility
� Business and/or country risks: insures against losses due to specific risk events
Securitization � Blue Orchard/OPIC/DWM microfinance bond � AWS profit-sharing bond
� All risks: stabilizes investment returns
Technical Assistance
� Business Development Initiative - DfID-funded generic TA � SME Sustainable Opportunities Initiative – IFC-funded
sustainability-oriented TA
� Business risk: active management of risk
WWF/UNEP FI Risk Paper 4 DeRisk Advisory Services Ltd.
DeRiskDeRisk Advisory Services Ltd.
DRAFT - DRAFT - DRAFT - DRAFT
DRAFT - DRAFT - DRAFT - DRAFT
DRAFT - DRAFT - DRAFT - DRAFT
DRAFT - DRAFT - DRAFT - DRAFT
The paper uses a framework to assess and rank the above mechanisms in terms of deployment potential as defined by:
� Potential for impact on investment risk reduction � Scalability and/or replicability potential � Cost of adaptation/development and deployment � Application to risk mitigation of sustainable SME investment � Relevance to the organizational mandates of required supporting/partnering institutions
Three mechanisms emerge as having considerable risk mitigation potential for sustainable SME investment in Africa.
Table 2: High-potential Mechanisms
Mechanism Summary Impact Input / resources required
Guarantee - Local Bank Unsecured Lending Facility
Theoretical mechanism with potential for development: A local bank unsecured lending facility would provide developing country lending institutions with partial credit guarantees, funded with their own risk capital, on lending portfolios.
� Business risk mitigation : provides partial substitute for SME collateral for domestic financing
� Sustainability : possible promotion of sustainable SMEs
� Donor/DFI : Concept/facility development funding
� Local investors : facility co-investors
� Charity/NGO: sustainability criteria
Enhancement – Private Sector Investment Enhancement Fund
Theoretical mechanism with potential for development: A private sector investment enhancement fund would use its balance sheet to provide investment guarantees, credit enhancement to local and international investors in SMEs. Funded by private sector, "social" and / or philanthropic capital, it could also provide “first loss” or other direct investment enhancement to both equity and debt investors in – and from – any geographic region.
� Business risk mitigation : broad, versatile coverage against business failure, collateral substitute for domestic and international investors
� Sustainability : likely promotion of sustainable SMEs given support of donor/philanthropic institutions
� Donor/DFI: Concept/facility development funding
� Auditors/TA providers : DD/Assurance/TA partnerships
� Charity/NGO: sustainability criteria marketing
Technical Assistance – Fund-linked technical assistance
Existing mechanism with potential for replication : A facility funded by UK Department for International Development called the Business Development Initiative (BDI) provides its sister organization, a Sierra Leone/West Africa-focused PE fund, with additional financial resources to identify, assess and develop potential SME investment opportunities.
� Business risk mitigation : enables investors to potentially screen against – and later control – business risks leading to enterprise failure
� Sustainability : likely promotion of sustainable SMEs given support of donor/philanthropic institutions
� Donor/DFI : facility development and capitalization funds
� Charity/NGO: sustainability criteria, marketing
Next steps
1. Gain feedback from workshop delegates on the validity of this draft paper � Are there missing/other mechanisms that could be assessed? � Is the assessment framework appropriate? � What is the risk mitigation potential of selected mechanisms from your perspective? � Which, if any other mechanisms potentially more interesting to you? � Where are the data/analysis gaps from your perspective
2. Revise/complete assessment of highest potential mechanisms, and close data gaps 3. Identify partners to help develop/deploy one or more mechanisms
As this research paper is in working draft form, wo rkshop delegate views on the analysis and conclusions presented is critical.
WWF/UNEP FI Risk Paper 5 DeRisk Advisory Services Ltd.
DeRiskDeRisk Advisory Services Ltd.
DRAFT - DRAFT - DRAFT - DRAFT
DRAFT - DRAFT - DRAFT - DRAFT
DRAFT - DRAFT - DRAFT - DRAFT
DRAFT - DRAFT - DRAFT - DRAFT
2 Introduction
This document is a draft of a research paper prepared by DeRisk Advisory Services for delegates in the WWF/UNEP-FI workshop on Innovative Financing for Sustainable Small and Medium Enterprises (SMEs) in Africa. The paper will provide data and background information for one of the workshop topics: “mitigating sustainable SME investment risk”. DeRisk Advisory Services Ltd. is a risk mitigation specialist for investors in businesses and projects in developing countries, providing unique access to a wide spectrum of risk coverage and services. We work with debt, equity, corporate, philanthropic, and other developing country investors, as they deploy capital beyond the security—and limitations—of more mature and liquid financial markets.
2.1 Definitions
This paper will use definitions of “SMEs” and “sustainability” proposed in another workshop paper entitled “Sustainable Small and Medium Enterprises - Creating Value within Planetary Limits” (J. Englis 2007).
SME: businesses “…that employ between 10 and 100 people and with financing needs anywhere from USD 50,000 to 500,000 for early stage, high potential, high growth sustainable enterprises.”
The WWF/UNEP FI workshop will also distinguish between “sustainable” and “normal” SMEs.
Sustainable SME: “…two categories of Sustainable SMEs may be identified: 1. SMEs that are internally led / driven to contribute to sustainable development to the maximum
possible and 2. SMEs that happen to support sustainable development in some way that is appropriate to the
context within which they operate…” For the sake of clarity, the paper’s definition of “sustainable development”:
Sustainable development : “…may be defined as a commitment to ‘improving the quality of human life while living within the carrying capacity of supporting ecosystems’ (IUCN et al., 1991) and thus includes social development.”
2.2 Objectives
The paper has the following objectives: 1. Present risk mitigation mechanisms are currently used, and which could potentially be developed, for SME investment – with a specific foc us on Africa The paper will provide a “long list” of risk mitigation mechanisms currently used and any new risk mitigation mechanisms that could be employed to reduce the risk of investing in sustainable SMEs. The purpose of this section is to give delegates to the meeting an overview of:
� Which mechanisms already exist in some fashion
� Which innovative mechanisms are potentially disposed to being adapted to make it less risky for investors, especially from the private financial sector, to invest in SMEs.
WWF/UNEP FI Risk Paper 6 DeRisk Advisory Services Ltd.
DeRiskDeRisk Advisory Services Ltd.
DRAFT - DRAFT - DRAFT - DRAFT
DRAFT - DRAFT - DRAFT - DRAFT
DRAFT - DRAFT - DRAFT - DRAFT
DRAFT - DRAFT - DRAFT - DRAFT
The paper will also elaborate and employ a framework for assessing the “long list” of mechanisms for their potential in reducing the risk of investing in sustainable SMEs. The framework will enable an assessment of:
� Which mechanisms are the most likely to reduce risks material to SME investors
� Potential for, and cost of, wider application and / or replication
� Which of these might most benefit from partnership with donor and philanthropic institutions
2. Present and assess in greater detail a small num ber of mechanisms with the greatest potential for impact on sustainable SME investing Based on this assessment framework described above, the paper will present a “short list” of high-potential mechanisms for more detailed discussion. The purpose of this section is to provide delegates with:
� A framework for analysis and advancement of a number of concrete cases with potential for near-term development
� An overview of requirements, roles, responsibilities, rewards and risks for mechanism sponsors, developers, users, potential partners and stakeholders
� Any open issues to be resolved and / or further analysis still required
3. Gain input and feedback from Africa SME investme nt practitioners and stakeholders
As this research paper is in working draft form, workshop delegate views on the analysis and conclusions presented is critical.
2.3 Geographic focus
The paper will present and assess potential risk mitigation mechanisms in the context of applicability to SME investment in Africa. While challenging investment conditions exist in other developing countries in regions like Latin America and Southeast Asia, sub-Saharan Africa is consistently at the bottom of human1 and economic2 development indices and warrants continued development efforts.
3 Risk as a hurdle to increased SME financing
All countries require a wide variety of building blocks to develop and grow sustainably – a healthy SME base being a fundamental one. SMEs themselves also have substantial requirements in order to develop and grow – straightforward and merit-based access to affordable finance being equally fundamental. Taking the perspective of a potential investor in SMEs, this paper assumes that investment risk is a major obstacle to such access to finance for sustainable SMEs in Africa.
Clearly, there are considerable obstacles to access to finance, which are not directly tied to investment risk. From the perspective of investors in general – and local investors specifically, hurdles include:
� Lack of SME investing know-how � Effort intensity of SME investing vs. lucrative alternative investments (e.g. high-yield
government debt) vs. SME investment � High cost of local capital � Lack of skilled resources to operate and work in SMEs in Africa
1 UNDP 2 CIA World Fact Book / IMF
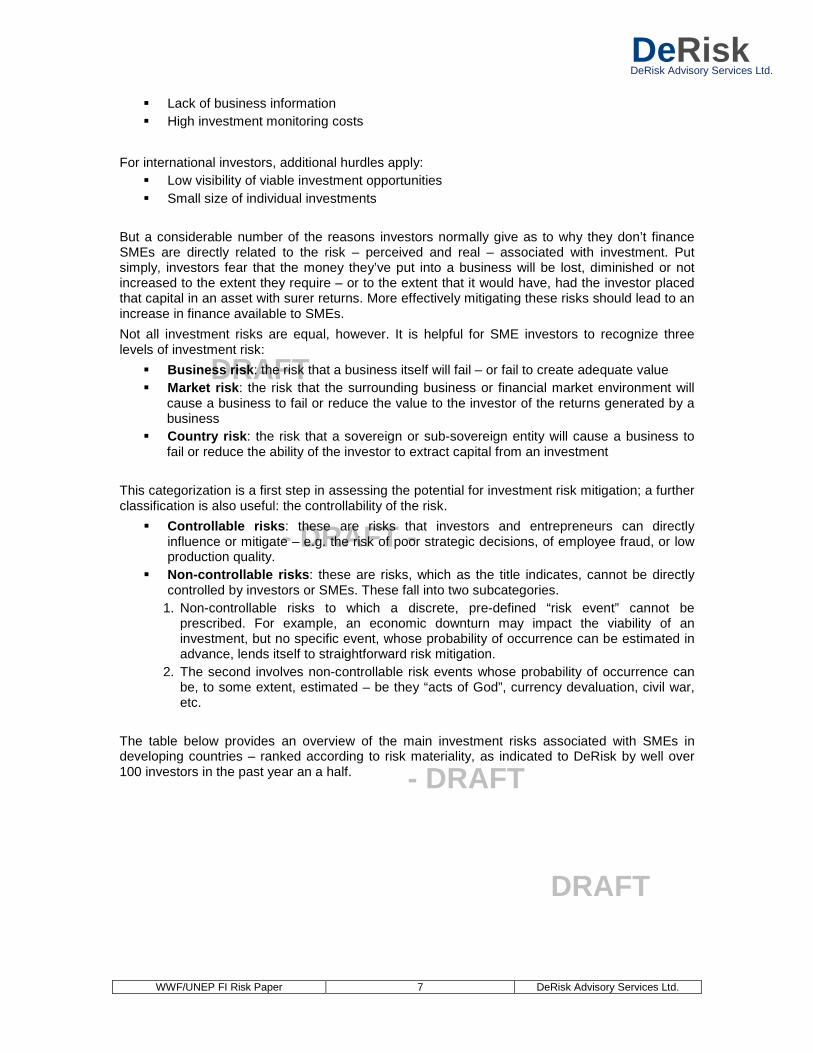
WWF/UNEP FI Risk Paper 7 DeRisk Advisory Services Ltd.
DeRiskDeRisk Advisory Services Ltd.
DRAFT - DRAFT - DRAFT - DRAFT
DRAFT - DRAFT - DRAFT - DRAFT
DRAFT - DRAFT - DRAFT - DRAFT
DRAFT - DRAFT - DRAFT - DRAFT
� Lack of business information � High investment monitoring costs
For international investors, additional hurdles apply: � Low visibility of viable investment opportunities � Small size of individual investments
But a considerable number of the reasons investors normally give as to why they don’t finance SMEs are directly related to the risk – perceived and real – associated with investment. Put simply, investors fear that the money they’ve put into a business will be lost, diminished or not increased to the extent they require – or to the extent that it would have, had the investor placed that capital in an asset with surer returns. More effectively mitigating these risks should lead to an increase in finance available to SMEs.
Not all investment risks are equal, however. It is helpful for SME investors to recognize three levels of investment risk:
� Business risk : the risk that a business itself will fail – or fail to create adequate value � Market risk : the risk that the surrounding business or financial market environment will
cause a business to fail or reduce the value to the investor of the returns generated by a business
� Country risk : the risk that a sovereign or sub-sovereign entity will cause a business to fail or reduce the ability of the investor to extract capital from an investment
This categorization is a first step in assessing the potential for investment risk mitigation; a further classification is also useful: the controllability of the risk.
� Controllable risks : these are risks that investors and entrepreneurs can directly influence or mitigate – e.g. the risk of poor strategic decisions, of employee fraud, or low production quality.
� Non-controllable risks : these are risks, which as the title indicates, cannot be directly controlled by investors or SMEs. These fall into two subcategories.
1. Non-controllable risks to which a discrete, pre-defined “risk event” cannot be prescribed. For example, an economic downturn may impact the viability of an investment, but no specific event, whose probability of occurrence can be estimated in advance, lends itself to straightforward risk mitigation.
2. The second involves non-controllable risk events whose probability of occurrence can be, to some extent, estimated – be they “acts of God”, currency devaluation, civil war, etc.
The table below provides an overview of the main investment risks associated with SMEs in developing countries – ranked according to risk materiality, as indicated to DeRisk by well over 100 investors in the past year an a half.
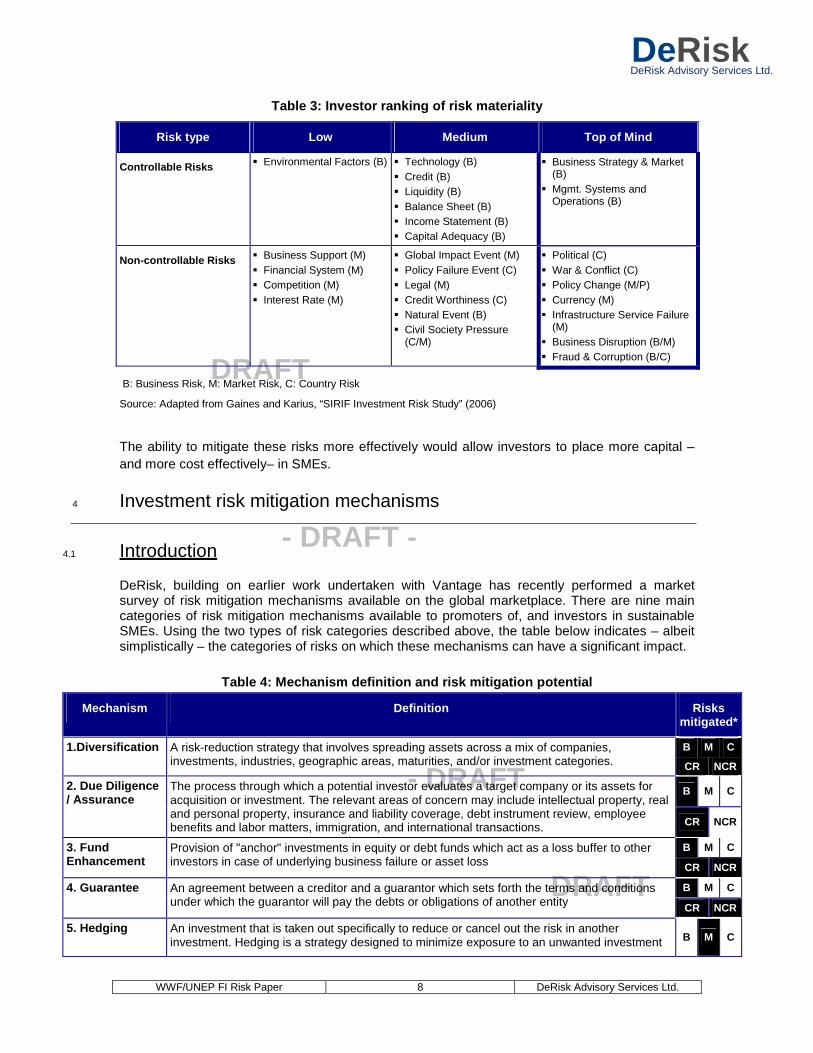
WWF/UNEP FI Risk Paper 8 DeRisk Advisory Services Ltd.
DeRiskDeRisk Advisory Services Ltd.
DRAFT - DRAFT - DRAFT - DRAFT
DRAFT - DRAFT - DRAFT - DRAFT
DRAFT - DRAFT - DRAFT - DRAFT
DRAFT - DRAFT - DRAFT - DRAFT
Table 3: Investor ranking of risk materiality
Risk type Low Medium Top of Mind
Controllable Risks � Environmental Factors (B) � Technology (B) � Credit (B) � Liquidity (B) � Balance Sheet (B) � Income Statement (B) � Capital Adequacy (B)
� Business Strategy & Market (B)
� Mgmt. Systems and Operations (B)
Non-controllable Risks � Business Support (M) � Financial System (M) � Competition (M) � Interest Rate (M)
� Global Impact Event (M) � Policy Failure Event (C) � Legal (M) � Credit Worthiness (C) � Natural Event (B) � Civil Society Pressure
(C/M)
� Political (C) � War & Conflict (C) � Policy Change (M/P) � Currency (M) � Infrastructure Service Failure
(M) � Business Disruption (B/M) � Fraud & Corruption (B/C)
B: Business Risk, M: Market Risk, C: Country Risk
Source: Adapted from Gaines and Karius, “SIRIF Investment Risk Study” (2006)
The ability to mitigate these risks more effectively would allow investors to place more capital – and more cost effectively– in SMEs.
4 Investment risk mitigation mechanisms
4.1 Introduction
DeRisk, building on earlier work undertaken with Vantage has recently performed a market survey of risk mitigation mechanisms available on the global marketplace. There are nine main categories of risk mitigation mechanisms available to promoters of, and investors in sustainable SMEs. Using the two types of risk categories described above, the table below indicates – albeit simplistically – the categories of risks on which these mechanisms can have a significant impact.
Table 4: Mechanism definition and risk mitigation p otential
Mechanism Definition Risks mitigated*
B M C 1.Diversification A risk-reduction strategy that involves spreading assets across a mix of companies, investments, industries, geographic areas, maturities, and/or investment categories. CR NCR
B M C 2. Due Diligence / Assurance
The process through which a potential investor evaluates a target company or its assets for acquisition or investment. The relevant areas of concern may include intellectual property, real and personal property, insurance and liability coverage, debt instrument review, employee benefits and labor matters, immigration, and international transactions. CR NCR
B M C 3. Fund Enhancement
Provision of "anchor" investments in equity or debt funds which act as a loss buffer to other investors in case of underlying business failure or asset loss CR NCR
B M C 4. Guarantee An agreement between a creditor and a guarantor which sets forth the terms and conditions under which the guarantor will pay the debts or obligations of another entity CR NCR
5. Hedging An investment that is taken out specifically to reduce or cancel out the risk in another investment. Hedging is a strategy designed to minimize exposure to an unwanted investment B M C
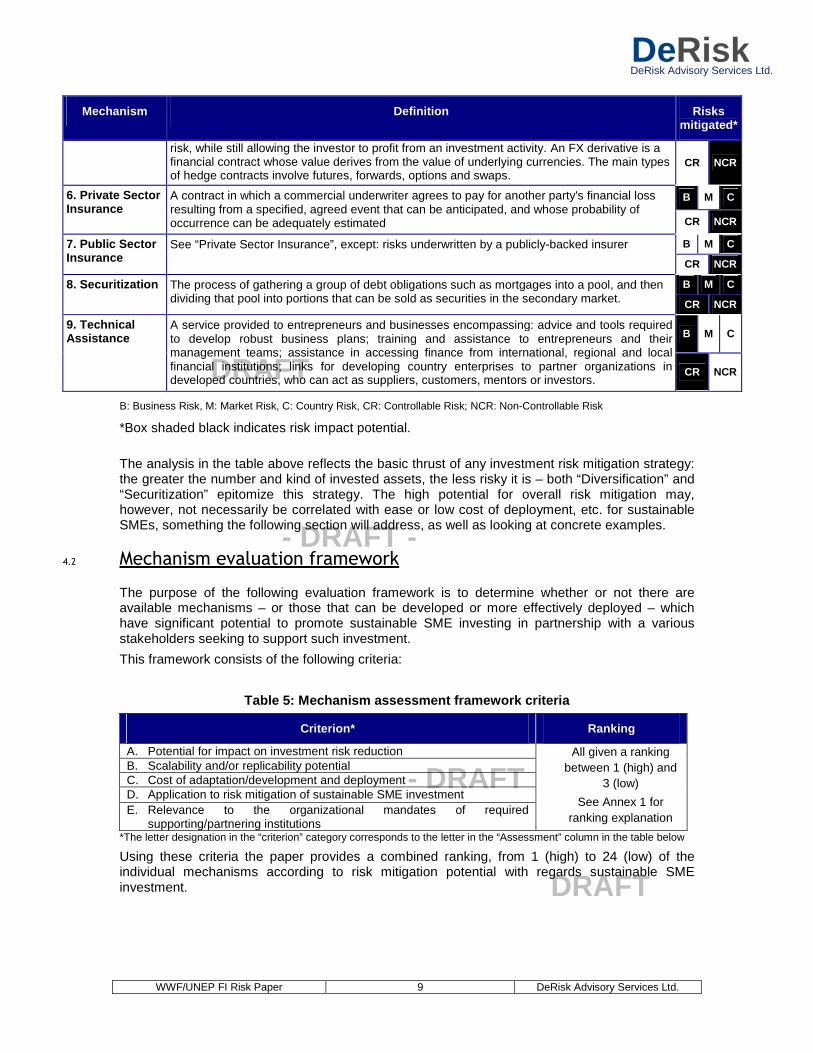
WWF/UNEP FI Risk Paper 9 DeRisk Advisory Services Ltd.
DeRiskDeRisk Advisory Services Ltd.
DRAFT - DRAFT - DRAFT - DRAFT
DRAFT - DRAFT - DRAFT - DRAFT
DRAFT - DRAFT - DRAFT - DRAFT
DRAFT - DRAFT - DRAFT - DRAFT
Mechanism Definition Risks mitigated*
risk, while still allowing the investor to profit from an investment activity. An FX derivative is a financial contract whose value derives from the value of underlying currencies. The main types of hedge contracts involve futures, forwards, options and swaps.
CR NCR
B M C 6. Private Sector Insurance
A contract in which a commercial underwriter agrees to pay for another party's financial loss resulting from a specified, agreed event that can be anticipated, and whose probability of occurrence can be adequately estimated CR NCR
B M C 7. Public Sector Insurance
See “Private Sector Insurance”, except: risks underwritten by a publicly-backed insurer
CR NCR
B M C 8. Securitization The process of gathering a group of debt obligations such as mortgages into a pool, and then dividing that pool into portions that can be sold as securities in the secondary market. CR NCR
B M C 9. Technical Assistance
A service provided to entrepreneurs and businesses encompassing: advice and tools required to develop robust business plans; training and assistance to entrepreneurs and their management teams; assistance in accessing finance from international, regional and local financial institutions; links for developing country enterprises to partner organizations in developed countries, who can act as suppliers, customers, mentors or investors.
CR NCR
B: Business Risk, M: Market Risk, C: Country Risk, CR: Controllable Risk; NCR: Non-Controllable Risk
*Box shaded black indicates risk impact potential. The analysis in the table above reflects the basic thrust of any investment risk mitigation strategy: the greater the number and kind of invested assets, the less risky it is – both “Diversification” and “Securitization” epitomize this strategy. The high potential for overall risk mitigation may, however, not necessarily be correlated with ease or low cost of deployment, etc. for sustainable SMEs, something the following section will address, as well as looking at concrete examples.
4.2 Mechanism evaluation framework
The purpose of the following evaluation framework is to determine whether or not there are available mechanisms – or those that can be developed or more effectively deployed – which have significant potential to promote sustainable SME investing in partnership with a various stakeholders seeking to support such investment.
This framework consists of the following criteria:
Table 5: Mechanism assessment framework criteria
Criterion* Ranking
A. Potential for impact on investment risk reduction B. Scalability and/or replicability potential C. Cost of adaptation/development and deployment D. Application to risk mitigation of sustainable SME investment E. Relevance to the organizational mandates of required
supporting/partnering institutions
All given a ranking between 1 (high) and
3 (low)
See Annex 1 for ranking explanation
*The letter designation in the “criterion” category corresponds to the letter in the “Assessment” column in the table below
Using these criteria the paper provides a combined ranking, from 1 (high) to 24 (low) of the individual mechanisms according to risk mitigation potential with regards sustainable SME investment.
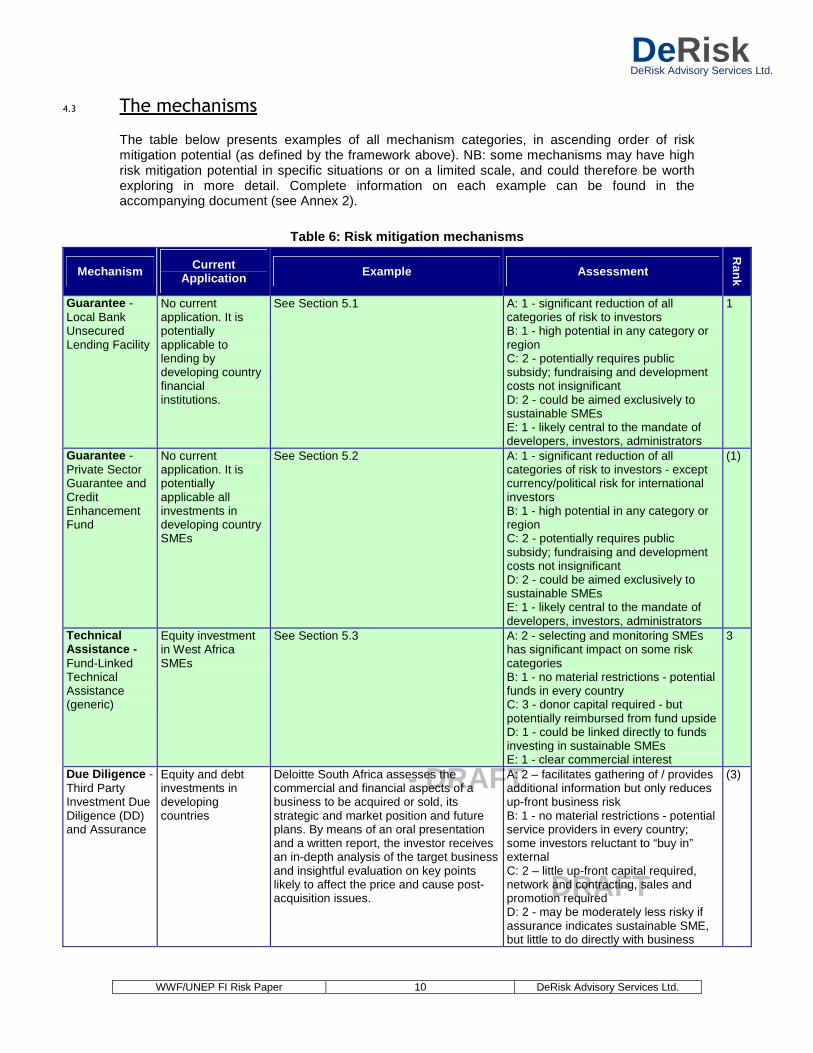
WWF/UNEP FI Risk Paper 10 DeRisk Advisory Services Ltd.
DeRiskDeRisk Advisory Services Ltd.
DRAFT - DRAFT - DRAFT - DRAFT
DRAFT - DRAFT - DRAFT - DRAFT
DRAFT - DRAFT - DRAFT - DRAFT
DRAFT - DRAFT - DRAFT - DRAFT
4.3 The mechanisms
The table below presents examples of all mechanism categories, in ascending order of risk mitigation potential (as defined by the framework above). NB: some mechanisms may have high risk mitigation potential in specific situations or on a limited scale, and could therefore be worth exploring in more detail. Complete information on each example can be found in the accompanying document (see Annex 2).
Table 6: Risk mitigation mechanisms
Mechanism Current Application Example Assessment
Rank
Guarantee - Local Bank Unsecured Lending Facility
No current application. It is potentially applicable to lending by developing country financial institutions.
See Section 5.1 A: 1 - significant reduction of all categories of risk to investors B: 1 - high potential in any category or region C: 2 - potentially requires public subsidy; fundraising and development costs not insignificant D: 2 - could be aimed exclusively to sustainable SMEs E: 1 - likely central to the mandate of developers, investors, administrators
1
Guarantee - Private Sector Guarantee and Credit Enhancement Fund
No current application. It is potentially applicable all investments in developing country SMEs
See Section 5.2 A: 1 - significant reduction of all categories of risk to investors - except currency/political risk for international investors B: 1 - high potential in any category or region C: 2 - potentially requires public subsidy; fundraising and development costs not insignificant D: 2 - could be aimed exclusively to sustainable SMEs E: 1 - likely central to the mandate of developers, investors, administrators
(1)
Technical Assistance - Fund-Linked Technical Assistance (generic)
Equity investment in West Africa SMEs
See Section 5.3 A: 2 - selecting and monitoring SMEs has significant impact on some risk categories B: 1 - no material restrictions - potential funds in every country C: 3 - donor capital required - but potentially reimbursed from fund upside D: 1 - could be linked directly to funds investing in sustainable SMEs E: 1 - clear commercial interest
3
Due Diligence - Third Party Investment Due Diligence (DD) and Assurance
Equity and debt investments in developing countries
Deloitte South Africa assesses the commercial and financial aspects of a business to be acquired or sold, its strategic and market position and future plans. By means of an oral presentation and a written report, the investor receives an in-depth analysis of the target business and insightful evaluation on key points likely to affect the price and cause post-acquisition issues.
A: 2 – facilitates gathering of / provides additional information but only reduces up-front business risk B: 1 - no material restrictions - potential service providers in every country; some investors reluctant to “buy in” external C: 2 – little up-front capital required, network and contracting, sales and promotion required D: 2 - may be moderately less risky if assurance indicates sustainable SME, but little to do directly with business
(3)
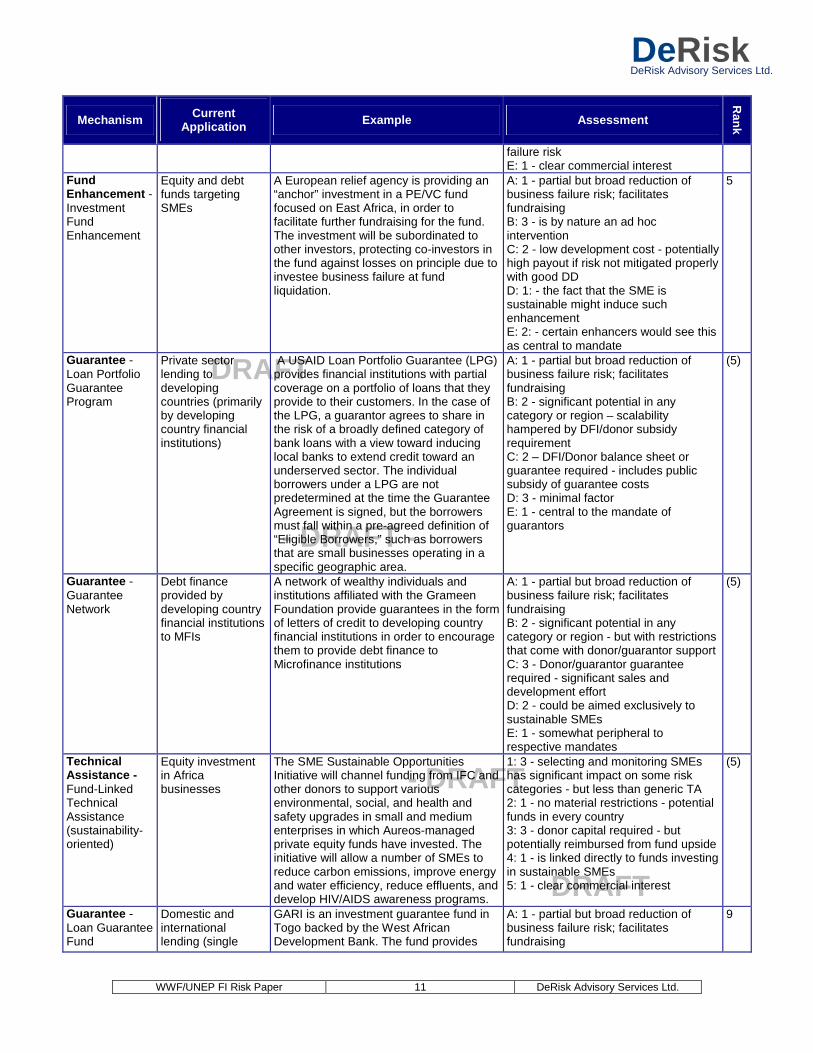
WWF/UNEP FI Risk Paper 11 DeRisk Advisory Services Ltd.
DeRiskDeRisk Advisory Services Ltd.
DRAFT - DRAFT - DRAFT - DRAFT
DRAFT - DRAFT - DRAFT - DRAFT
DRAFT - DRAFT - DRAFT - DRAFT
DRAFT - DRAFT - DRAFT - DRAFT
Mechanism Current Application Example Assessment
Rank
failure risk E: 1 - clear commercial interest
Fund Enhancement - Investment Fund Enhancement
Equity and debt funds targeting SMEs
A European relief agency is providing an “anchor” investment in a PE/VC fund focused on East Africa, in order to facilitate further fundraising for the fund. The investment will be subordinated to other investors, protecting co-investors in the fund against losses on principle due to investee business failure at fund liquidation.
A: 1 - partial but broad reduction of business failure risk; facilitates fundraising B: 3 - is by nature an ad hoc intervention C: 2 - low development cost - potentially high payout if risk not mitigated properly with good DD D: 1: - the fact that the SME is sustainable might induce such enhancement E: 2: - certain enhancers would see this as central to mandate
5
Guarantee - Loan Portfolio Guarantee Program
Private sector lending to developing countries (primarily by developing country financial institutions)
A USAID Loan Portfolio Guarantee (LPG) provides financial institutions with partial coverage on a portfolio of loans that they provide to their customers. In the case of the LPG, a guarantor agrees to share in the risk of a broadly defined category of bank loans with a view toward inducing local banks to extend credit toward an underserved sector. The individual borrowers under a LPG are not predetermined at the time the Guarantee Agreement is signed, but the borrowers must fall within a pre-agreed definition of “Eligible Borrowers,” such as borrowers that are small businesses operating in a specific geographic area.
A: 1 - partial but broad reduction of business failure risk; facilitates fundraising B: 2 - significant potential in any category or region – scalability hampered by DFI/donor subsidy requirement C: 2 – DFI/Donor balance sheet or guarantee required - includes public subsidy of guarantee costs D: 3 - minimal factor E: 1 - central to the mandate of guarantors
(5)
Guarantee - Guarantee Network
Debt finance provided by developing country financial institutions to MFIs
A network of wealthy individuals and institutions affiliated with the Grameen Foundation provide guarantees in the form of letters of credit to developing country financial institutions in order to encourage them to provide debt finance to Microfinance institutions
A: 1 - partial but broad reduction of business failure risk; facilitates fundraising B: 2 - significant potential in any category or region - but with restrictions that come with donor/guarantor support C: 3 - Donor/guarantor guarantee required - significant sales and development effort D: 2 - could be aimed exclusively to sustainable SMEs E: 1 - somewhat peripheral to respective mandates
(5)
Technical Assistance - Fund-Linked Technical Assistance (sustainability-oriented)
Equity investment in Africa businesses
The SME Sustainable Opportunities Initiative will channel funding from IFC and other donors to support various environmental, social, and health and safety upgrades in small and medium enterprises in which Aureos-managed private equity funds have invested. The initiative will allow a number of SMEs to reduce carbon emissions, improve energy and water efficiency, reduce effluents, and develop HIV/AIDS awareness programs.
1: 3 - selecting and monitoring SMEs has significant impact on some risk categories - but less than generic TA 2: 1 - no material restrictions - potential funds in every country 3: 3 - donor capital required - but potentially reimbursed from fund upside 4: 1 - is linked directly to funds investing in sustainable SMEs 5: 1 - clear commercial interest
(5)
Guarantee - Loan Guarantee Fund
Domestic and international lending (single
GARI is an investment guarantee fund in Togo backed by the West African Development Bank. The fund provides
A: 1 - partial but broad reduction of business failure risk; facilitates fundraising
9
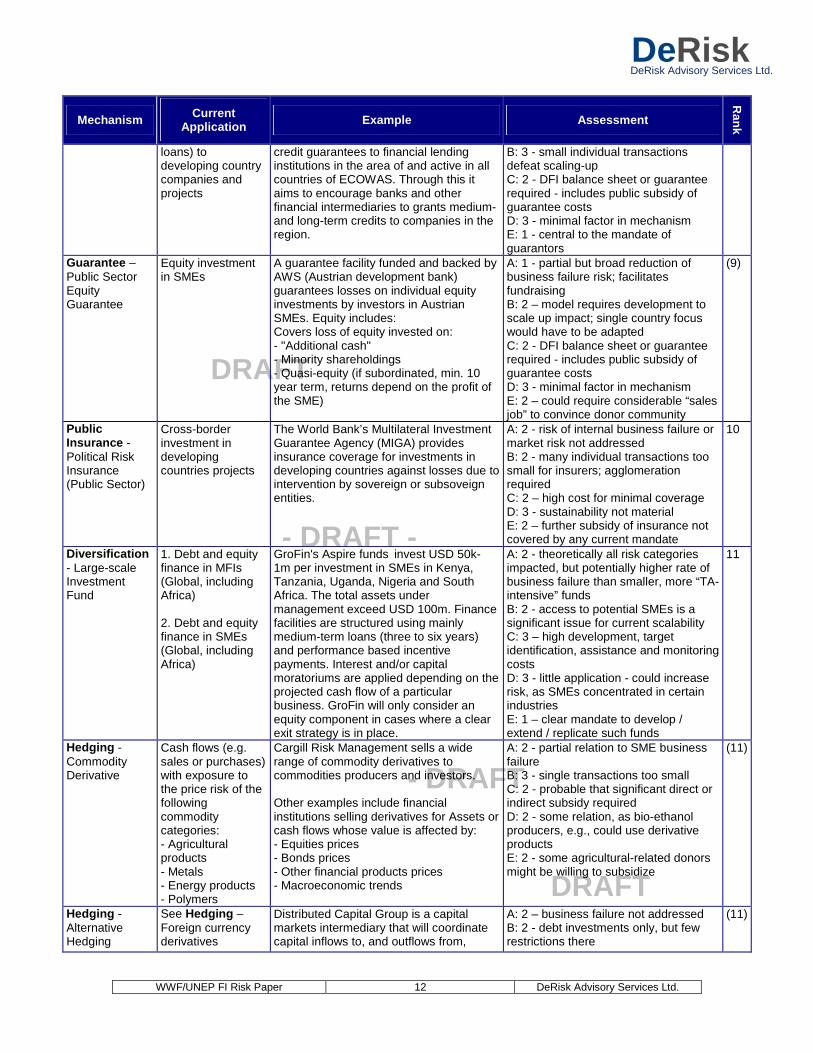
WWF/UNEP FI Risk Paper 12 DeRisk Advisory Services Ltd.
DeRiskDeRisk Advisory Services Ltd.
DRAFT - DRAFT - DRAFT - DRAFT
DRAFT - DRAFT - DRAFT - DRAFT
DRAFT - DRAFT - DRAFT - DRAFT
DRAFT - DRAFT - DRAFT - DRAFT
Mechanism Current Application Example Assessment
Rank
loans) to developing country companies and projects
credit guarantees to financial lending institutions in the area of and active in all countries of ECOWAS. Through this it aims to encourage banks and other financial intermediaries to grants medium- and long-term credits to companies in the region.
B: 3 - small individual transactions defeat scaling-up C: 2 - DFI balance sheet or guarantee required - includes public subsidy of guarantee costs D: 3 - minimal factor in mechanism E: 1 - central to the mandate of guarantors
Guarantee – Public Sector Equity Guarantee
Equity investment in SMEs
A guarantee facility funded and backed by AWS (Austrian development bank) guarantees losses on individual equity investments by investors in Austrian SMEs. Equity includes: Covers loss of equity invested on: - "Additional cash" - Minority shareholdings - Quasi-equity (if subordinated, min. 10 year term, returns depend on the profit of the SME)
A: 1 - partial but broad reduction of business failure risk; facilitates fundraising B: 2 – model requires development to scale up impact; single country focus would have to be adapted C: 2 - DFI balance sheet or guarantee required - includes public subsidy of guarantee costs D: 3 - minimal factor in mechanism E: 2 – could require considerable “sales job” to convince donor community
(9)
Public Insurance - Political Risk Insurance (Public Sector)
Cross-border investment in developing countries projects
The World Bank’s Multilateral Investment Guarantee Agency (MIGA) provides insurance coverage for investments in developing countries against losses due to intervention by sovereign or subsoveign entities.
A: 2 - risk of internal business failure or market risk not addressed B: 2 - many individual transactions too small for insurers; agglomeration required C: 2 – high cost for minimal coverage D: 3 - sustainability not material E: 2 – further subsidy of insurance not covered by any current mandate
10
Diversification - Large-scale Investment Fund
1. Debt and equity finance in MFIs (Global, including Africa) 2. Debt and equity finance in SMEs (Global, including Africa)
GroFin's Aspire funds invest USD 50k- 1m per investment in SMEs in Kenya, Tanzania, Uganda, Nigeria and South Africa. The total assets under management exceed USD 100m. Finance facilities are structured using mainly medium-term loans (three to six years) and performance based incentive payments. Interest and/or capital moratoriums are applied depending on the projected cash flow of a particular business. GroFin will only consider an equity component in cases where a clear exit strategy is in place.
A: 2 - theoretically all risk categories impacted, but potentially higher rate of business failure than smaller, more “TA-intensive” funds B: 2 - access to potential SMEs is a significant issue for current scalability C: 3 – high development, target identification, assistance and monitoring costs D: 3 - little application - could increase risk, as SMEs concentrated in certain industries E: 1 – clear mandate to develop / extend / replicate such funds
11
Hedging - Commodity Derivative
Cash flows (e.g. sales or purchases) with exposure to the price risk of the following commodity categories: - Agricultural products - Metals - Energy products - Polymers
Cargill Risk Management sells a wide range of commodity derivatives to commodities producers and investors. Other examples include financial institutions selling derivatives for Assets or cash flows whose value is affected by: - Equities prices - Bonds prices - Other financial products prices - Macroeconomic trends
A: 2 - partial relation to SME business failure B: 3 - single transactions too small C: 2 - probable that significant direct or indirect subsidy required D: 2 - some relation, as bio-ethanol producers, e.g., could use derivative products E: 2 - some agricultural-related donors might be willing to subsidize
(11)
Hedging - Alternative Hedging
See Hedging – Foreign currency derivatives
Distributed Capital Group is a capital markets intermediary that will coordinate capital inflows to, and outflows from,
A: 2 – business failure not addressed B: 2 - debt investments only, but few restrictions there
(11)
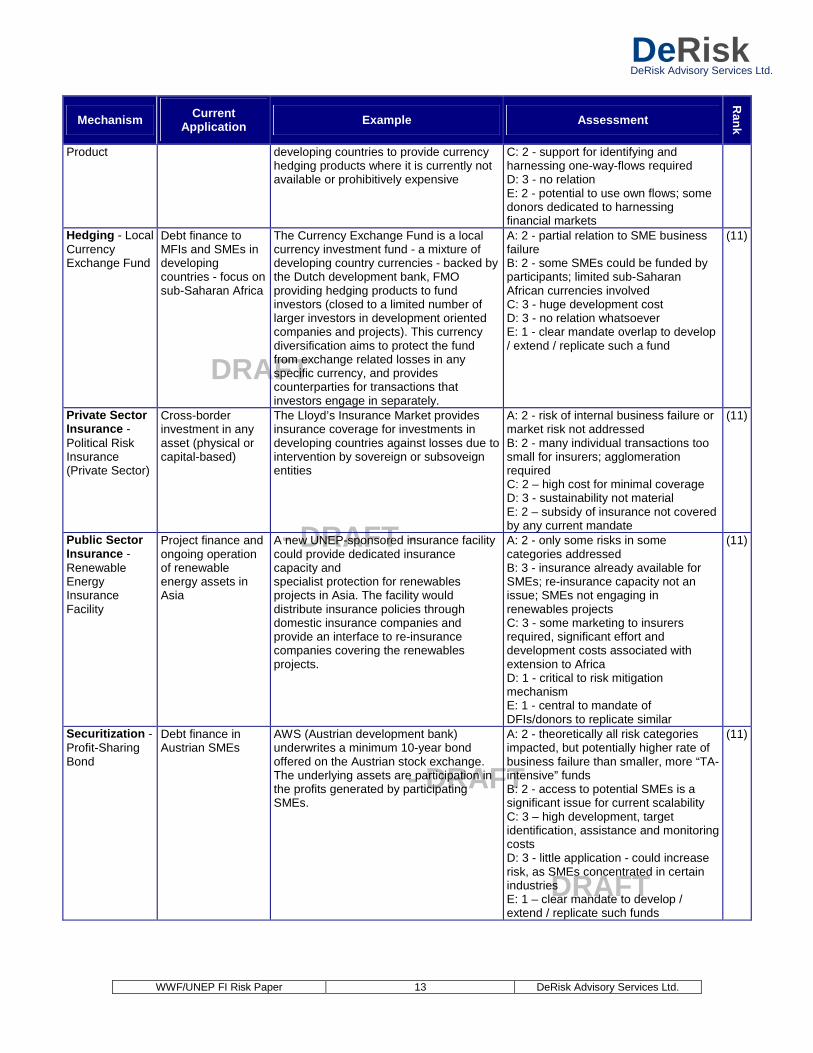
WWF/UNEP FI Risk Paper 13 DeRisk Advisory Services Ltd.
DeRiskDeRisk Advisory Services Ltd.
DRAFT - DRAFT - DRAFT - DRAFT
DRAFT - DRAFT - DRAFT - DRAFT
DRAFT - DRAFT - DRAFT - DRAFT
DRAFT - DRAFT - DRAFT - DRAFT
Mechanism Current Application Example Assessment
Rank
Product developing countries to provide currency hedging products where it is currently not available or prohibitively expensive
C: 2 - support for identifying and harnessing one-way-flows required D: 3 - no relation E: 2 - potential to use own flows; some donors dedicated to harnessing financial markets
Hedging - Local Currency Exchange Fund
Debt finance to MFIs and SMEs in developing countries - focus on sub-Saharan Africa
The Currency Exchange Fund is a local currency investment fund - a mixture of developing country currencies - backed by the Dutch development bank, FMO providing hedging products to fund investors (closed to a limited number of larger investors in development oriented companies and projects). This currency diversification aims to protect the fund from exchange related losses in any specific currency, and provides counterparties for transactions that investors engage in separately.
A: 2 - partial relation to SME business failure B: 2 - some SMEs could be funded by participants; limited sub-Saharan African currencies involved C: 3 - huge development cost D: 3 - no relation whatsoever E: 1 - clear mandate overlap to develop / extend / replicate such a fund
(11)
Private Sector Insurance - Political Risk Insurance (Private Sector)
Cross-border investment in any asset (physical or capital-based)
The Lloyd’s Insurance Market provides insurance coverage for investments in developing countries against losses due to intervention by sovereign or subsoveign entities
A: 2 - risk of internal business failure or market risk not addressed B: 2 - many individual transactions too small for insurers; agglomeration required C: 2 – high cost for minimal coverage D: 3 - sustainability not material E: 2 – subsidy of insurance not covered by any current mandate
(11)
Public Sector Insurance - Renewable Energy Insurance Facility
Project finance and ongoing operation of renewable energy assets in Asia
A new UNEP-sponsored insurance facility could provide dedicated insurance capacity and specialist protection for renewables projects in Asia. The facility would distribute insurance policies through domestic insurance companies and provide an interface to re-insurance companies covering the renewables projects.
A: 2 - only some risks in some categories addressed B: 3 - insurance already available for SMEs; re-insurance capacity not an issue; SMEs not engaging in renewables projects C: 3 - some marketing to insurers required, significant effort and development costs associated with extension to Africa D: 1 - critical to risk mitigation mechanism E: 1 - central to mandate of DFIs/donors to replicate similar
(11)
Securitization - Profit-Sharing Bond
Debt finance in Austrian SMEs
AWS (Austrian development bank) underwrites a minimum 10-year bond offered on the Austrian stock exchange. The underlying assets are participation in the profits generated by participating SMEs.
A: 2 - theoretically all risk categories impacted, but potentially higher rate of business failure than smaller, more “TA-intensive” funds B: 2 - access to potential SMEs is a significant issue for current scalability C: 3 – high development, target identification, assistance and monitoring costs D: 3 - little application - could increase risk, as SMEs concentrated in certain industries E: 1 – clear mandate to develop / extend / replicate such funds
(11)
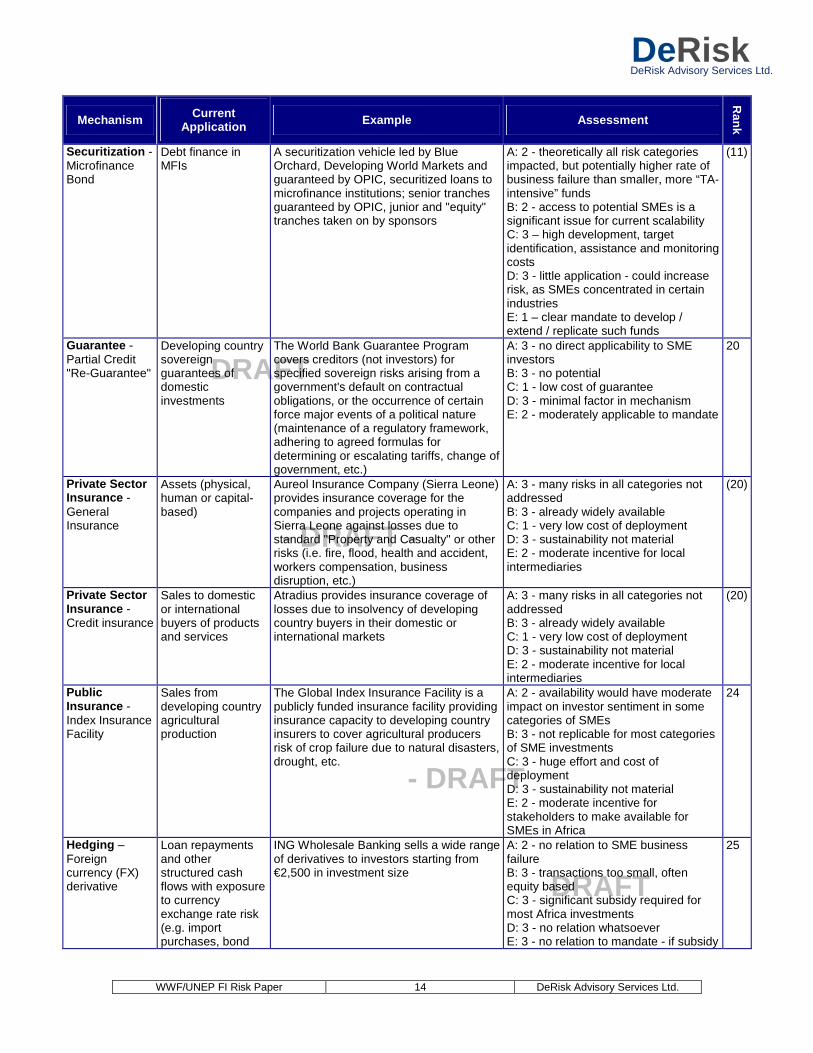
WWF/UNEP FI Risk Paper 14 DeRisk Advisory Services Ltd.
DeRiskDeRisk Advisory Services Ltd.
DRAFT - DRAFT - DRAFT - DRAFT
DRAFT - DRAFT - DRAFT - DRAFT
DRAFT - DRAFT - DRAFT - DRAFT
DRAFT - DRAFT - DRAFT - DRAFT
Mechanism Current Application Example Assessment
Rank
Securitization - Microfinance Bond
Debt finance in MFIs
A securitization vehicle led by Blue Orchard, Developing World Markets and guaranteed by OPIC, securitized loans to microfinance institutions; senior tranches guaranteed by OPIC, junior and "equity" tranches taken on by sponsors
A: 2 - theoretically all risk categories impacted, but potentially higher rate of business failure than smaller, more “TA-intensive” funds B: 2 - access to potential SMEs is a significant issue for current scalability C: 3 – high development, target identification, assistance and monitoring costs D: 3 - little application - could increase risk, as SMEs concentrated in certain industries E: 1 – clear mandate to develop / extend / replicate such funds
(11)
Guarantee - Partial Credit "Re-Guarantee"
Developing country sovereign guarantees of domestic investments
The World Bank Guarantee Program covers creditors (not investors) for specified sovereign risks arising from a government's default on contractual obligations, or the occurrence of certain force major events of a political nature (maintenance of a regulatory framework, adhering to agreed formulas for determining or escalating tariffs, change of government, etc.)
A: 3 - no direct applicability to SME investors B: 3 - no potential C: 1 - low cost of guarantee D: 3 - minimal factor in mechanism E: 2 - moderately applicable to mandate
20
Private Sector Insurance - General Insurance
Assets (physical, human or capital-based)
Aureol Insurance Company (Sierra Leone) provides insurance coverage for the companies and projects operating in Sierra Leone against losses due to standard "Property and Casualty" or other risks (i.e. fire, flood, health and accident, workers compensation, business disruption, etc.)
A: 3 - many risks in all categories not addressed B: 3 - already widely available C: 1 - very low cost of deployment D: 3 - sustainability not material E: 2 - moderate incentive for local intermediaries
(20)
Private Sector Insurance - Credit insurance
Sales to domestic or international buyers of products and services
Atradius provides insurance coverage of losses due to insolvency of developing country buyers in their domestic or international markets
A: 3 - many risks in all categories not addressed B: 3 - already widely available C: 1 - very low cost of deployment D: 3 - sustainability not material E: 2 - moderate incentive for local intermediaries
(20)
Public Insurance - Index Insurance Facility
Sales from developing country agricultural production
The Global Index Insurance Facility is a publicly funded insurance facility providing insurance capacity to developing country insurers to cover agricultural producers risk of crop failure due to natural disasters, drought, etc.
A: 2 - availability would have moderate impact on investor sentiment in some categories of SMEs B: 3 - not replicable for most categories of SME investments C: 3 - huge effort and cost of deployment D: 3 - sustainability not material E: 2 - moderate incentive for stakeholders to make available for SMEs in Africa
24
Hedging – Foreign currency (FX) derivative
Loan repayments and other structured cash flows with exposure to currency exchange rate risk (e.g. import purchases, bond
ING Wholesale Banking sells a wide range of derivatives to investors starting from €2,500 in investment size
A: 2 - no relation to SME business failure B: 3 - transactions too small, often equity based C: 3 - significant subsidy required for most Africa investments D: 3 - no relation whatsoever E: 3 - no relation to mandate - if subsidy
25
WWF/UNEP FI Risk Paper 15 DeRisk Advisory Services Ltd.
DeRiskDeRisk Advisory Services Ltd.
DRAFT - DRAFT - DRAFT - DRAFT
DRAFT - DRAFT - DRAFT - DRAFT
DRAFT - DRAFT - DRAFT - DRAFT
DRAFT - DRAFT - DRAFT - DRAFT
Mechanism Current Application Example Assessment
Rank
payments, fixed dividends etc.)
is the strategy
Hedging - DFI-Intermediated Hedge
The following IBRD loan types: - Fixed-Spread - Variable-Spread - Fixed-Rate Single Currency - Currency Pool - Single Currency Pool
The IBRD acts as a market intermediary to provide sovereign borrowers access to hedging products for IBRD loans. IBRD hedges comprise only those that are available on commercial markets.
A: 3 - too far removed B: 3 - no direct application for SME investors C: 3 - complete retrofit required D: 3 - no relation E: 3 – no mandate to lend to private sector institutions
26
5 High-potential risk mitigation mechanisms
Based on the assessment framework described above, the three highest ranked mechanisms were:
1. Local Bank Unsecured Lending Facility 2. Private Sector Guarantee and Credit Enhancement Fund 3. Fund-Linked Technical Assistance (generic)
The following section addresses these specific mechanisms in more detail.
5.1 Local Bank Unsecured Lending Facility
5.1.1 Summary
A local bank unsecured lending facility would provide developing country lending institutions with partial credit guarantees, funded with their own risk capital, on lending portfolios.
In the absence of sufficient collateral, domestic financial institutions avoid lending to otherwise viable SMEs. A third party guarantee against SME loan portfolio losses provides a valid substitute but generally requires direct subsidy from donors or multi-/bi-lateral development finance institutions (DFIs).
Pooling risk capital from developing country banks and investors in order to fund a market-based guarantee facility could solve this issue of scalability. It could also address the issues of additionality and moral hazard: given that guaranteed banks would “own” the losses (and positive returns) of such a facility, it would more readily attract banks wanting to engage in new lending, and motivate them to do so more responsibly.
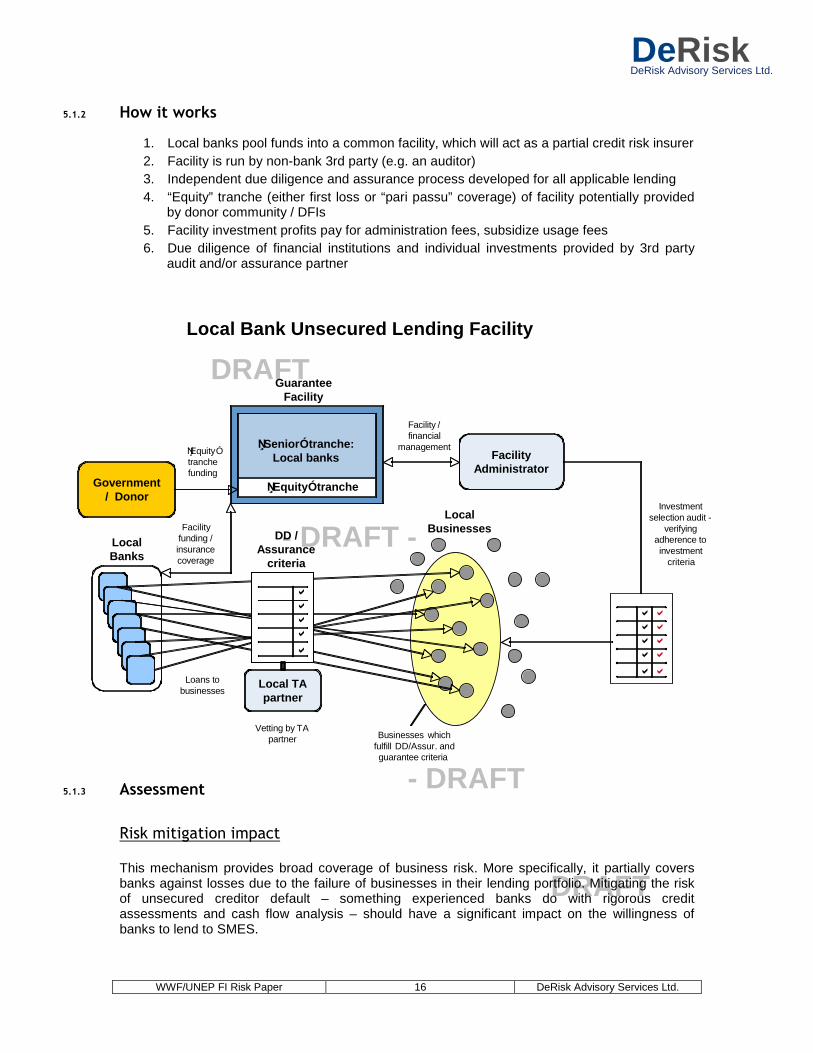
WWF/UNEP FI Risk Paper 16 DeRisk Advisory Services Ltd.
DeRiskDeRisk Advisory Services Ltd.
DRAFT - DRAFT - DRAFT - DRAFT
DRAFT - DRAFT - DRAFT - DRAFT
DRAFT - DRAFT - DRAFT - DRAFT
DRAFT - DRAFT - DRAFT - DRAFT
5.1.2 How it works
1. Local banks pool funds into a common facility, which will act as a partial credit risk insurer 2. Facility is run by non-bank 3rd party (e.g. an auditor) 3. Independent due diligence and assurance process developed for all applicable lending 4. “Equity” tranche (either first loss or “pari passu” coverage) of facility potentially provided
by donor community / DFIs 5. Facility investment profits pay for administration fees, subsidize usage fees 6. Due diligence of financial institutions and individual investments provided by 3rd party
audit and/or assurance partner
5.1.3 Assessment
Risk mitigation impact
This mechanism provides broad coverage of business risk. More specifically, it partially covers banks against losses due to the failure of businesses in their lending portfolio. Mitigating the risk of unsecured creditor default – something experienced banks do with rigorous credit assessments and cash flow analysis – should have a significant impact on the willingness of banks to lend to SMES.
Local TApartner
Local Bank Unsecured Lending Facility
Government/ Donor
ĥEquityÓ tranche
ĥSeniorÓ tranche:Local banks
GuaranteeFacility
FacilityAdministrator
�
�
�
�
�
�
�
�
�
�
LocalBanks
�
�
�
�
�
LocalBusinesses
DD /Assurance
criteria
Investmentselection audit -
verifyingadherence toinvestment
criteria
Facility /financial
managementĥEquityÓtranchefunding
Facilityfunding /insurancecoverage
Loans tobusinesses
Vetting by TApartner Businesses which
fulfill DD/Assur. andguarantee criteria
WWF/UNEP FI Risk Paper 17 DeRisk Advisory Services Ltd.
DeRiskDeRisk Advisory Services Ltd.
DRAFT - DRAFT - DRAFT - DRAFT
DRAFT - DRAFT - DRAFT - DRAFT
DRAFT - DRAFT - DRAFT - DRAFT
DRAFT - DRAFT - DRAFT - DRAFT
Depending on the terms and conditions of the guarantees, business failure due to political risks may or may not be covered.
Scalability
The mechanism is highly scalable to the extent that it is replicable. Given disparate market requirements, as well as the difficulty of coordinating users and funders in different countries, a multi-country facility could be less effective than one unique to a single country or a major financial center. Where there are well-capitalized banks and low penetration of SME lending, however, such a facility could be feasible.
Cost of development
The development, piloting and launching of a single-country facility would involve four categories of costs.
1. Mechanism concept development 2. Partnership development 3. Marketing 4. Piloting
As a cost benchmark for such a facility, the development costs of an insurance facility proposed by the broker Marsh for UNEP’s Global Environment Facility is estimated at USD 800,000
Application to sustainable SMEs
The logical application of the facility would be for all SME lending deemed by participating banks to generate sufficient returns. Negative screening of unsustainable SMEs would enable mechanism to encourage funding of sustainable SMEs, but this might decrease the likelihood that banks will participate – given the oft-lamented dearth of SME investments in general, much less “sustainable” ones. Further subsidy by a sustainability-minded stakeholder of guarantee costs for lending to sustainable SMEs might help overcome this hurdle.
Other restrictions or limitations
� Does not address issue of pipeline of potential SME investments or loan monitoring skills / costs
� No application for equity investment (although less costly access to debt capital can have an indirect effect on the willingness of equity investors to invest alongside lenders)
5.1.4 Required stakeholder analysis
Despite its potential commercial viability, no single bank or other commercial entity is likely to develop and pilot such a facility, due to significant upfront costs. The skills and coordination required, and untested nature of the mechanism, would also make it too risky. Additional stakeholders are required.
The key stakeholders required to develop and launch the guarantee facility, and corresponding relevance the respective institutions, are as follows:
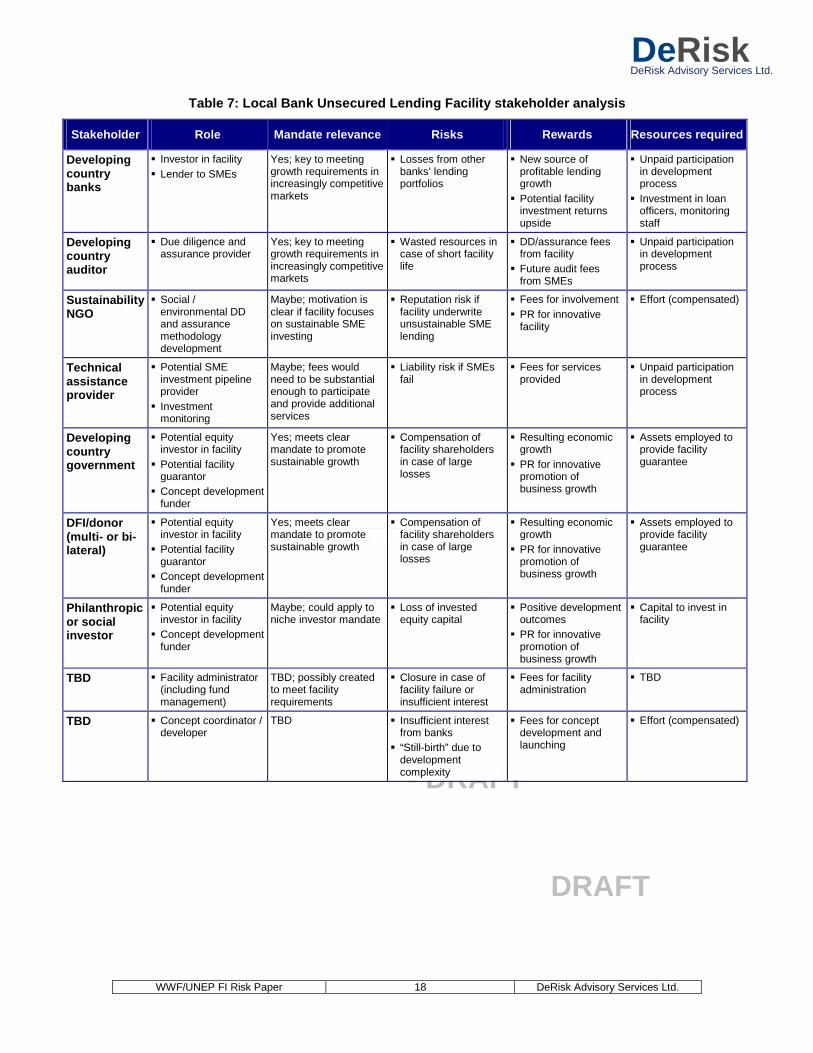
WWF/UNEP FI Risk Paper 18 DeRisk Advisory Services Ltd.
DeRiskDeRisk Advisory Services Ltd.
DRAFT - DRAFT - DRAFT - DRAFT
DRAFT - DRAFT - DRAFT - DRAFT
DRAFT - DRAFT - DRAFT - DRAFT
DRAFT - DRAFT - DRAFT - DRAFT
Table 7: Local Bank Unsecured Lending Facility stak eholder analysis
Stakeholder Role Mandate relevance Risks Rewards Resources required
Developing country banks
� Investor in facility � Lender to SMEs
Yes; key to meeting growth requirements in increasingly competitive markets
� Losses from other banks’ lending portfolios
� New source of profitable lending growth
� Potential facility investment returns upside
� Unpaid participation in development process
� Investment in loan officers, monitoring staff
Developing country auditor
� Due diligence and assurance provider
Yes; key to meeting growth requirements in increasingly competitive markets
� Wasted resources in case of short facility life
� DD/assurance fees from facility
� Future audit fees from SMEs
� Unpaid participation in development process
Sustainability NGO
� Social / environmental DD and assurance methodology development
Maybe; motivation is clear if facility focuses on sustainable SME investing
� Reputation risk if facility underwrite unsustainable SME lending
� Fees for involvement � PR for innovative
facility
� Effort (compensated)
Technical assistance provider
� Potential SME investment pipeline provider
� Investment monitoring
Maybe; fees would need to be substantial enough to participate and provide additional services
� Liability risk if SMEs fail
� Fees for services provided
� Unpaid participation in development process
Developing country government
� Potential equity investor in facility
� Potential facility guarantor
� Concept development funder
Yes; meets clear mandate to promote sustainable growth
� Compensation of facility shareholders in case of large losses
� Resulting economic growth
� PR for innovative promotion of business growth
� Assets employed to provide facility guarantee
DFI/donor (multi- or bi-lateral)
� Potential equity investor in facility
� Potential facility guarantor
� Concept development funder
Yes; meets clear mandate to promote sustainable growth
� Compensation of facility shareholders in case of large losses
� Resulting economic growth
� PR for innovative promotion of business growth
� Assets employed to provide facility guarantee
Philanthropic or social investor
� Potential equity investor in facility
� Concept development funder
Maybe; could apply to niche investor mandate
� Loss of invested equity capital
� Positive development outcomes
� PR for innovative promotion of business growth
� Capital to invest in facility
TBD � Facility administrator (including fund management)
TBD; possibly created to meet facility requirements
� Closure in case of facility failure or insufficient interest
� Fees for facility administration
� TBD
TBD � Concept coordinator / developer
TBD � Insufficient interest from banks
� “Still-birth” due to development complexity
� Fees for concept development and launching
� Effort (compensated)
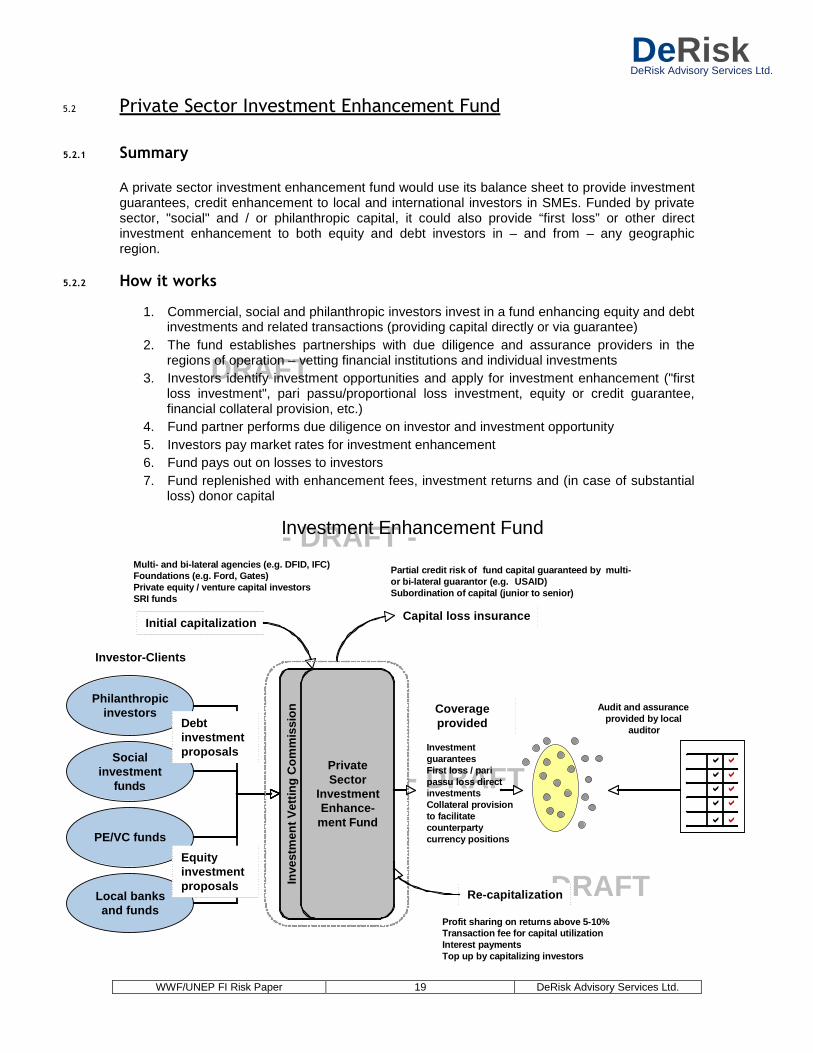
WWF/UNEP FI Risk Paper 19 DeRisk Advisory Services Ltd.
DeRiskDeRisk Advisory Services Ltd.
DRAFT - DRAFT - DRAFT - DRAFT
DRAFT - DRAFT - DRAFT - DRAFT
DRAFT - DRAFT - DRAFT - DRAFT
DRAFT - DRAFT - DRAFT - DRAFT
5.2 Private Sector Investment Enhancement Fund
5.2.1 Summary
A private sector investment enhancement fund would use its balance sheet to provide investment guarantees, credit enhancement to local and international investors in SMEs. Funded by private sector, "social" and / or philanthropic capital, it could also provide “first loss” or other direct investment enhancement to both equity and debt investors in – and from – any geographic region.
5.2.2 How it works
1. Commercial, social and philanthropic investors invest in a fund enhancing equity and debt investments and related transactions (providing capital directly or via guarantee)
2. The fund establishes partnerships with due diligence and assurance providers in the regions of operation – vetting financial institutions and individual investments
3. Investors identify investment opportunities and apply for investment enhancement ("first loss investment", pari passu/proportional loss investment, equity or credit guarantee, financial collateral provision, etc.)
4. Fund partner performs due diligence on investor and investment opportunity 5. Investors pay market rates for investment enhancement 6. Fund pays out on losses to investors 7. Fund replenished with enhancement fees, investment returns and (in case of substantial
loss) donor capital
Inve
stm
ent V
ettin
g C
omm
issi
on
PE/VC funds
Local banksand funds
Socialinvestment
funds
Philanthropicinvestors
Investor-Clients
Coverageprovided
Profit sharing on returns above 5-10% Transaction fee for capital utilization Interest payments Top up by capitalizing investors
Re-capitalization
Multi- and bi-lateral agencies (e.g. DFID, IFC) Foundations (e.g. Ford, Gates) Private equity / venture capital investors SRI funds
Initial capitalization
Partial credit risk of fund capital guaranteed by multi-or bi-lateral guarantor (e.g. USAID)
Subordination of capital (junior to senior)
Capital loss insurance
Debtinvestmentproposals
Equityinvestmentproposals
PrivateSector
InvestmentEnhance-
ment Fund
�
�
�
�
�
�
�
�
�
�
Audit and assuranceprovided by local
auditor
Investmentguarantees
First loss / paripassu loss directinvestments
Collateral provisionto facilitatecounterpartycurrency positions
Investment Enhancement Fund
WWF/UNEP FI Risk Paper 20 DeRisk Advisory Services Ltd.
DeRiskDeRisk Advisory Services Ltd.
DRAFT - DRAFT - DRAFT - DRAFT
DRAFT - DRAFT - DRAFT - DRAFT
DRAFT - DRAFT - DRAFT - DRAFT
DRAFT - DRAFT - DRAFT - DRAFT
5.2.3 Assessment
Risk mitigation impact
Similar to the local bank facility example above, the private sector investment enhancement fund This mechanism provides broad coverage of business risk, but is more versatile – covering a wider range of debt and equity investments. Beyond loss protection, it could have a significant impact the ability of private sector SME funds to raise commercial capital as well as more easily engage in financial transactions requiring collateral (e.g. currency hedging).
Currency risk and – depending on the terms and conditions of the enhancement – political risk would not be covered.
Scalability
If established in a developed country, a single enhancement fund could serve international SME investors on a large scale more easily than domestic investors, given the concentrated nature of the former and local network required to serve the latter.
A commercially viable business model for such a fund, however, would spawn similar initiatives in developed and developing countries.
Cost of development
A conservative estimate for development costs for a full facility would be in line with the local bank guarantee facility above (USD 800,000). Beyond this, fund equity and guarantees would need to be raised/secured.
There is the potential to test the concept with a single SME or SME fund transaction (similar to the Grameen Foundation Growth Guarantees cited in section 4.3) using funds or a guarantee provided by a social investor, donor or DFI.
Application to sustainable SMEs
The fund’s enhancement tools would apply to sustainable and normal SMEs alike. Depending on the respective agendas of fund equity providers and guarantors with regards sustainable SME investing, the fund could focus solely on sustainable SME investment enhancement.
Other restrictions or limitations
� Does not address issue of pipeline of potential SME investments or loan monitoring skills / costs
� Ready application to developing country investors would require more extensive local networks
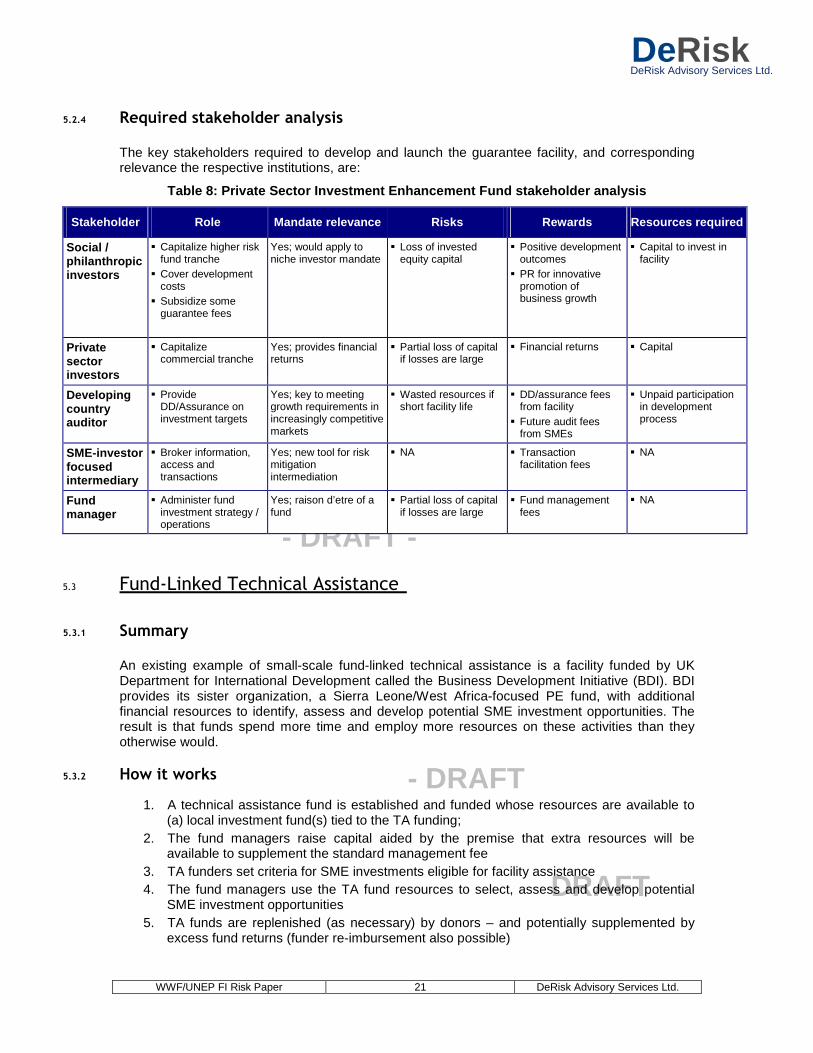
WWF/UNEP FI Risk Paper 21 DeRisk Advisory Services Ltd.
DeRiskDeRisk Advisory Services Ltd.
DRAFT - DRAFT - DRAFT - DRAFT
DRAFT - DRAFT - DRAFT - DRAFT
DRAFT - DRAFT - DRAFT - DRAFT
DRAFT - DRAFT - DRAFT - DRAFT
5.2.4 Required stakeholder analysis
The key stakeholders required to develop and launch the guarantee facility, and corresponding relevance the respective institutions, are:
Table 8: Private Sector Investment Enhancement Fund stakeholder analysis
Stakeholder Role Mandate relevance Risks Rewards Resources required
Social / philanthropic investors
� Capitalize higher risk fund tranche
� Cover development costs
� Subsidize some guarantee fees
Yes; would apply to niche investor mandate
� Loss of invested equity capital
� Positive development outcomes
� PR for innovative promotion of business growth
� Capital to invest in facility
Private sector investors
� Capitalize commercial tranche
Yes; provides financial returns
� Partial loss of capital if losses are large
� Financial returns
� Capital
Developing country auditor
� Provide DD/Assurance on investment targets
Yes; key to meeting growth requirements in increasingly competitive markets
� Wasted resources if short facility life
� DD/assurance fees from facility
� Future audit fees from SMEs
� Unpaid participation in development process
SME-investor focused intermediary
� Broker information, access and transactions
Yes; new tool for risk mitigation intermediation
� NA � Transaction facilitation fees
� NA
Fund manager
� Administer fund investment strategy / operations
Yes; raison d’etre of a fund
� Partial loss of capital if losses are large
� Fund management fees
� NA
5.3 Fund-Linked Technical Assistance
5.3.1 Summary
An existing example of small-scale fund-linked technical assistance is a facility funded by UK Department for International Development called the Business Development Initiative (BDI). BDI provides its sister organization, a Sierra Leone/West Africa-focused PE fund, with additional financial resources to identify, assess and develop potential SME investment opportunities. The result is that funds spend more time and employ more resources on these activities than they otherwise would.
5.3.2 How it works
1. A technical assistance fund is established and funded whose resources are available to (a) local investment fund(s) tied to the TA funding;
2. The fund managers raise capital aided by the premise that extra resources will be available to supplement the standard management fee
3. TA funders set criteria for SME investments eligible for facility assistance 4. The fund managers use the TA fund resources to select, assess and develop potential
SME investment opportunities 5. TA funds are replenished (as necessary) by donors – and potentially supplemented by
excess fund returns (funder re-imbursement also possible)
WWF/UNEP FI Risk Paper 22 DeRisk Advisory Services Ltd.
DeRiskDeRisk Advisory Services Ltd.
DRAFT - DRAFT - DRAFT - DRAFT
DRAFT - DRAFT - DRAFT - DRAFT
DRAFT - DRAFT - DRAFT - DRAFT
DRAFT - DRAFT - DRAFT - DRAFT
5.3.3 Assessment
Risk mitigation impact
This instrument potentially addresses two key SME investment risks: selecting good investments and making sure they stay good investments. While not a guarantee against business and investment failure – nor does it address certain market risks (e.g. currency risk) or political risk - TA provides the best possible coverage of controllable business risks.
Scalability
Given the increasing number of funds operating in the SME space in Africa, the relative straightforward process for enabling this service (funds provide their own additional TA capacity), and the huge upside for such funds, replication in multiple markets should be assured. Additionally, a single TA fund could be tied to multiple SME funds fulfilling the investment criteria of the former.
Cost of development
Development of a fund-linked TA facility would involve investment criteria development, eligible fund marketing and selection, TA facility fundraising and ongoing fund monitoring. A rough estimate for a pilot would be:
Capital required: USD 2m (for sustainable SME funds pilot) Development funds required: 3 FTEs x 6 months = USD 300,000 Ongoing monitoring costs: 30 days/year x 3 years = USD 90,000 Total: USD 2.4m
Application to sustainable SMEs
The facility funds would apply to sustainable and standard SME funds alike. In the event of donor interest in sustainable SMEs, the investment criteria could be adapted to fulfill sustainability criteria.
Other restrictions or limitations
� Requires at least partial direct subsidy – a significant initial outlay for any donor that may partially be recouped if the fund performs well
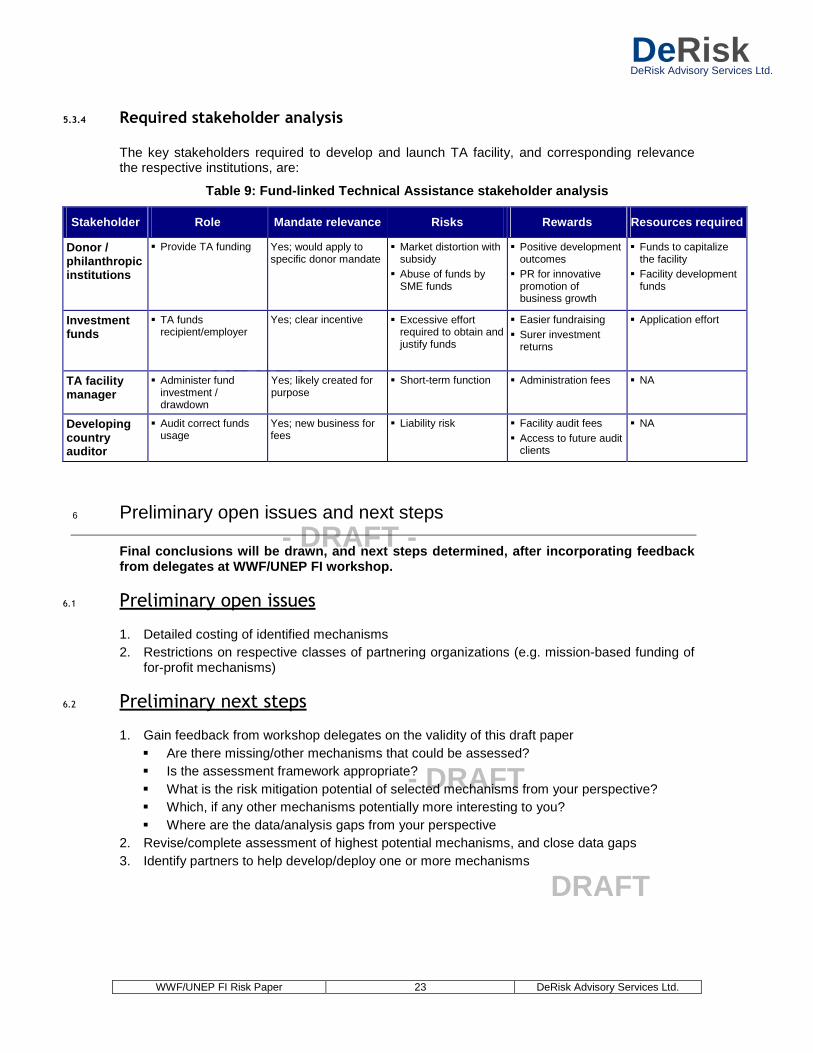
WWF/UNEP FI Risk Paper 23 DeRisk Advisory Services Ltd.
DeRiskDeRisk Advisory Services Ltd.
DRAFT - DRAFT - DRAFT - DRAFT
DRAFT - DRAFT - DRAFT - DRAFT
DRAFT - DRAFT - DRAFT - DRAFT
DRAFT - DRAFT - DRAFT - DRAFT
5.3.4 Required stakeholder analysis
The key stakeholders required to develop and launch TA facility, and corresponding relevance the respective institutions, are:
Table 9: Fund-linked Technical Assistance stakehold er analysis
Stakeholder Role Mandate relevance Risks Rewards Resources required
Donor / philanthropic institutions
� Provide TA funding Yes; would apply to specific donor mandate
� Market distortion with subsidy
� Abuse of funds by SME funds
� Positive development outcomes
� PR for innovative promotion of business growth
� Funds to capitalize the facility
� Facility development funds
Investment funds
� TA funds recipient/employer
Yes; clear incentive � Excessive effort required to obtain and justify funds
� Easier fundraising � Surer investment
returns
� Application effort
TA facility manager
� Administer fund investment / drawdown
Yes; likely created for purpose
� Short-term function � Administration fees � NA
Developing country auditor
� Audit correct funds usage
Yes; new business for fees
� Liability risk � Facility audit fees � Access to future audit
clients
� NA
6 Preliminary open issues and next steps
Final conclusions will be drawn, and next steps det ermined, after incorporating feedback from delegates at WWF/UNEP FI workshop.
6.1 Preliminary open issues
1. Detailed costing of identified mechanisms 2. Restrictions on respective classes of partnering organizations (e.g. mission-based funding of
for-profit mechanisms)
6.2 Preliminary next steps
1. Gain feedback from workshop delegates on the validity of this draft paper � Are there missing/other mechanisms that could be assessed? � Is the assessment framework appropriate? � What is the risk mitigation potential of selected mechanisms from your perspective? � Which, if any other mechanisms potentially more interesting to you? � Where are the data/analysis gaps from your perspective
2. Revise/complete assessment of highest potential mechanisms, and close data gaps 3. Identify partners to help develop/deploy one or more mechanisms
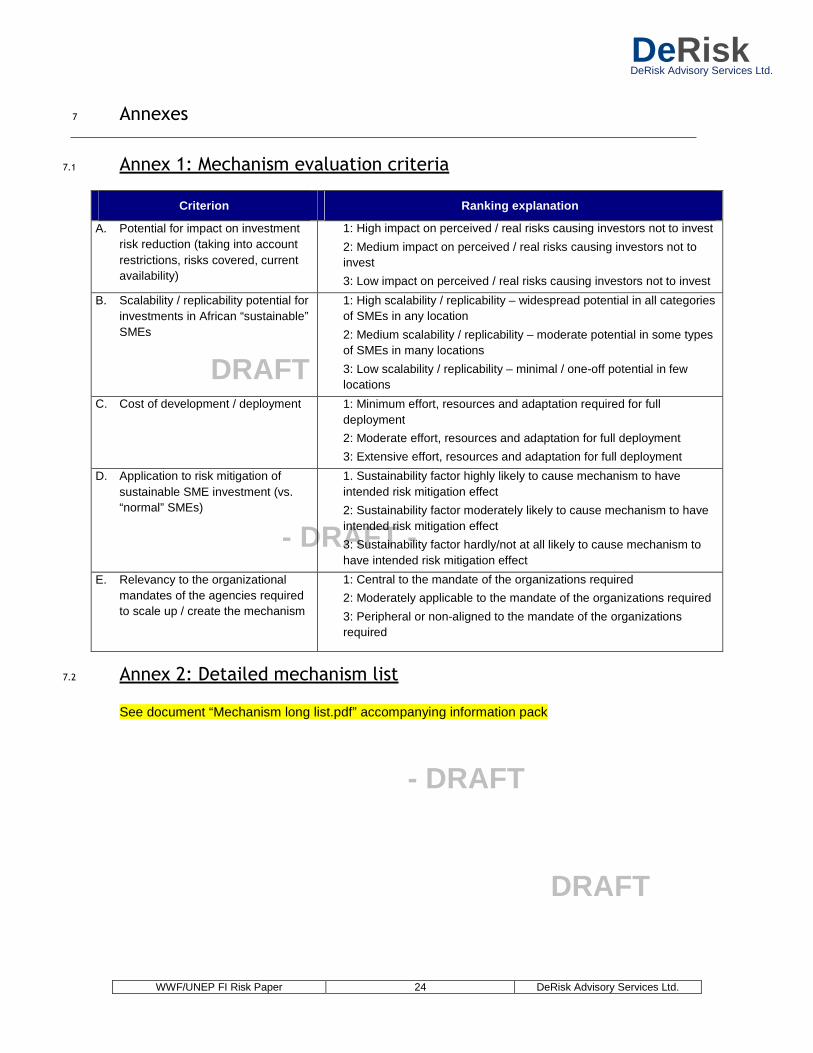
WWF/UNEP FI Risk Paper 24 DeRisk Advisory Services Ltd.
DeRiskDeRisk Advisory Services Ltd.
DRAFT - DRAFT - DRAFT - DRAFT
DRAFT - DRAFT - DRAFT - DRAFT
DRAFT - DRAFT - DRAFT - DRAFT
DRAFT - DRAFT - DRAFT - DRAFT
7 Annexes
7.1 Annex 1: Mechanism evaluation criteria
Criterion Ranking explanation
A. Potential for impact on investment risk reduction (taking into account restrictions, risks covered, current availability)
1: High impact on perceived / real risks causing investors not to invest
2: Medium impact on perceived / real risks causing investors not to invest
3: Low impact on perceived / real risks causing investors not to invest
B. Scalability / replicability potential for investments in African “sustainable” SMEs
1: High scalability / replicability – widespread potential in all categories of SMEs in any location
2: Medium scalability / replicability – moderate potential in some types of SMEs in many locations
3: Low scalability / replicability – minimal / one-off potential in few locations
C. Cost of development / deployment 1: Minimum effort, resources and adaptation required for full deployment
2: Moderate effort, resources and adaptation for full deployment
3: Extensive effort, resources and adaptation for full deployment
D. Application to risk mitigation of sustainable SME investment (vs. “normal” SMEs)
1. Sustainability factor highly likely to cause mechanism to have intended risk mitigation effect
2: Sustainability factor moderately likely to cause mechanism to have intended risk mitigation effect
3: Sustainability factor hardly/not at all likely to cause mechanism to have intended risk mitigation effect
E. Relevancy to the organizational mandates of the agencies required to scale up / create the mechanism
1: Central to the mandate of the organizations required
2: Moderately applicable to the mandate of the organizations required
3: Peripheral or non-aligned to the mandate of the organizations required
7.2 Annex 2: Detailed mechanism list
See document “Mechanism long list.pdf” accompanying information pack
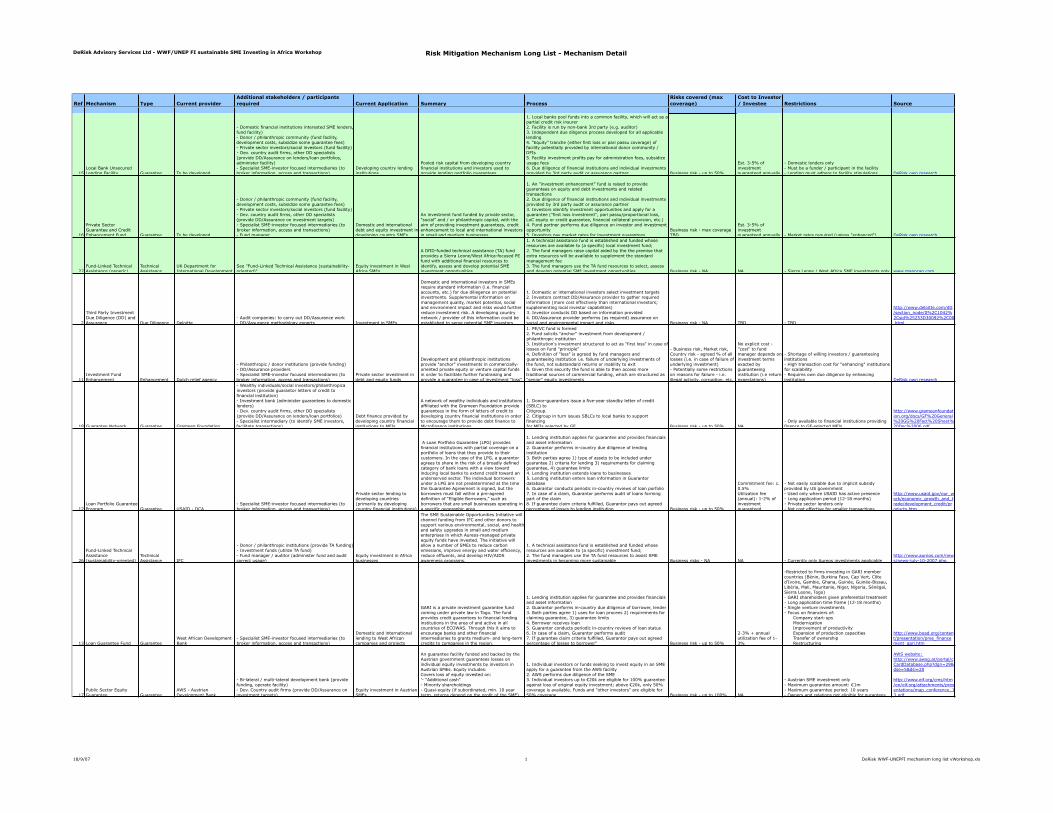
DeRisk Advisory Services Ltd - WWF/UNEP FI sustainable SME Investing in Africa Workshop Risk Mitigation Mechanism Long List - Mechanism Detail
Ref Mechanism Type Current providerAdditional stakeholders / participants required Current Application Summary Process
Risks covered (max coverage)
Cost to Investor / Investee Restrictions Source
15Local Bank Unsecured Lending Facility Guarantee To be developed
- Domestic financial institutions interested SME lenders, fund facility)- Donor / philanthropic community (fund facility, development costs, subsidize some guarantee fees) - Private sector investors/social investors (fund facility)- Dev. country audit firms, other DD specialists (provide DD/Assurance on lenders/loan portfolios, administer facility)- Specialist SME-investor focused intermediaries (to broker information, access and transactions)
Developing country lending institutions
Pooled risk capital from developing country financial institutions and investors used to provide lending portfolio guarantees
1. Local banks pool funds into a common facility, which will act as a partial credit risk insurer2. Facility is run by non-bank 3rd party (e.g. auditor)3. Independent due diligence process developed for all applicable lending4. “Equity” tranche (either first loss or pari passu coverage) of facility potentially provided by international donor community / DFIs5. Facility investment profits pay for administration fees, subsidize usage fees6. Due diligence of financial institutions and individual investments provided by 3rd party audit or assurance partner Business risk - up to 50%
Est. 3-5% of investment guaranteed annually
- Domestic lenders only- Must be a funder / participant in the facility- Lending must adhere to facility stipulations DeRisk own research
16
Private Sector Guarantee and Credit Enhancement Fund Guarantee To be developed
- Donor / philanthropic community (fund facility, development costs, subsidize some guarantee fees) - Private sector investors/social investors (fund facility)- Dev. country audit firms, other DD specialists (provide DD/Assurance on investment targets)- Specialist SME-investor focused intermediaries (to broker information, access and transactions)- Fund manager
Domestic and international debt and equity investment in developing country SMEs
An investment fund funded by private sector, "social" and / or philanthropic capital, with the aim of providing investment guarantees, credit enhancement to local and international investors in small and medium businesses
1. An "investment enhancement" fund is raised to provide guarantees on equity and debt investments and related transactions2. Due diligence of financial institutions and individual investments provided by 3rd party audit or assurance partner3. Investors identify investment opportunities and apply for a guarantee ("first loss investment", pari passu/proportional loss, LoC equity or credit guarantee, financial collateral provision, etc.)4. Fund partner performs due diligence on investor and investment opportunity 5. Investors pay market rates for investment guarantees
Business risk - max coverage TBD
Est. 3-5% of investment guaranteed annually - Market rates required (unless "enhanced") DeRisk own research
27Fund-Linked Technical Assistance (generic)
Technical Assistance
UK Department for International Development
See "Fund-Linked Technical Assistance (sustainability-oriented)"
Equity investment in West Africa SMEs
A DfID-funded technical assistance (TA) fund provides a Sierra Leone/West Africa-focused PE fund with additional financial resources to identify, assess and develop potential SME investment opportunities
1. A technical assistance fund is established and funded whose resources are available to (a specific) local investment fund; 2. The fund managers raise capital aided by the the premise that extra resources will be available to supplement the standard management fee3. The fund managers use the TA fund resources to select, assess and develop potential SME investment opportunities Business risk - NA NA - Sierra Leone / West Africa SME investments only www.manocap.com
2
Third Party Investment Due Diligence (DD) and Assurance Due Diligence Deloitte
- Audit companies: to carry out DD/Assurance work- DD/Assurance methodology experts Investment in SMEs
Domestic and international investors in SMEs require standard information (i.e. financial accounts, etc.) for due diliegence on potential investments. Supplemental information on management quality, market potential, social and environment impact and risks would further reduce investment risk. A developing country network / provider of this information could be established to serve potential SME investors
1. Domestic or international investors select investment targets2. Investors contract DD/Assurance provider to gather required information (more cost effectively than international investors; supplementing local investor capabilities)3. Investor conducts DD based on information provided4. DD/Assurance provider performs (as required) assurance on social and environmental impact and risks Business risk - NA TBD - TBD
http://www.deloitte.com/dtt/section_node/0%2C1042%2Csid%25253D30092%2C00.html
11Investment Fund Enhancement Enhancement Dutch relief agency
- Philanthropic / donor institutions (provide funding)- DD/Assurance providers- Specialist SME-investor focused intermediaries (to broker information, access and transactions)
Private sector investment in debt and equity funds
Development and philanthropic institutions provide "anchor" investments in commercially-oriented private equity or venture capital funds in order to facilitate further fundraising and provide a guarantee in case of investment "loss"
1. PE/VC fund is formed2. Fund solicits "anchor" investment from development / philanthropic institution3. Institution's investment structured to act as "first loss" in case of losses on fund "principle" 4. Definition of "loss" is agreed by fund managers and guaranteeing institution i.e. failure of underlying investments of the fund, not substandard returns or inability to exit 5. Given this security the fund is able to then access more traditional sources of commercial funding, which are structured as "senior" equity investments
- Business risk, Market risk, Country risk - agreed % of all losses (i.e. in case of failure of underlying investment) - Potentially some restrictions on reasons for failure - i.e. illegal activity, corruption, etc.
No explicit cost - "cost" to fund manager depends on investment terms exacted by guaranteeing institution (i.e return expectations)
- Shortage of willing investors / guaranteeing institutions- High transaction cost for "enhancing" institutions for scalability- Requires own due diligence by enhancing institution DeRisk own research
18 Guarantee Network Guarantee Grameen Foundation
- Wealthy individuals/social investors/philanthropica investors (provide guarantor letters of credit to financial institution)- Investment bank (administer guarantees to domestic lenders)- Dev. country audit firms, other DD specialists (provide DD/Assurance on lenders/loan portfolios)- Specialist intermediary (to identify SME investors, facilitate transactions)
Debt finance provided by developing country financial institutions to MFIs
A network of wealthy individuals and institutions affiliated with the Grameen Foundation provide guarantees in the form of letters of credit to developing country financial institutions in order to encourage them to provide debt finance to Microfinance institutions
1. Donor-guarantors issue a five-year standby letter of credit (SBLC) toCitigroup. 2. Citigroup in turn issues SBLCs to local banks to support financingfor MFIs selected by GF Business risk - up to 50% NA
- Only available to financial institutions providing finance to GF-selected MFIs
http://www.grameenfoundation.org/docs/GF%20General%20GG%20Fact%20Sheet%20Dec%2006.pdf
12Loan Portfolio Guarantee Program Guarantee USAID - DCA
- Specialist SME-investor focused intermediaries (to broker information, access and transactions)
Private sector lending to developing countries (primarily by developing country financial institutions)
A Loan Portfolio Guarantee (LPG) provides financial institutions with partial coverage on a portfolio of loans that they provide to their customers. In the case of the LPG, a guarantor agrees to share in the risk of a broadly defined category of bank loans with a view toward inducing local banks to extend credit toward an underserved sector. The individual borrowers under a LPG are not predetermined at the time the Guarantee Agreement is signed, but the borrowers must fall within a pre-agreed definition of “Eligible Borrowers,” such as borrowers that are small businesses operating in a specific geographic area.
1. Lending institution applies for guarantee and provides financials and asset information2. Guarantor performs in-country due diligence of lending institution3. Both parties agree 1) type of assets to be included under guarantee 2) criteria for lending 3) requirements for claiming guarantee, 4) guarantee limits4. Lending institution extends loans to businesses5. Lending institution enters loan information in Guarantor database6. Guarantor conducts periodic in-country reviews of loan porfolio7. In case of a claim, Guarantor performs audit of loans forming part of the claim8. If guarantee claim criteria fulfilled, Guarantor pays out agreed percentage of losses to lending institution Business risk - up to 50%
Commitment fee: c. 0.5%Utilization fee (annual): 1-2% of investment guaranteed
- Not easily scalable due to implicit subsidy provided by US government- Used only where USAID has active presence- Long application period (12-18 months)- Private sector lenders only- Not cost effective for smaller transactions
http://www.usaid.gov/our_work/economic_growth_and_trade/development_credit/products.htm
26
Fund-Linked Technical Assistance (sustainability-oriented)
Technical Assistance IFC
- Donor / philanthropic institutions (provide TA funding)- Investment funds (utilize TA fund)- Fund manager / auditor (administer fund and audit correct usage)
Equity investment in Africa businesses
The SME Sustainable Opportunities Initiative will channel funding from IFC and other donors to support various environmental, social, and health and safety upgrades in small and medium enterprises in which Aureos-managed private equity funds have invested. The initiative will allow a number of SMEs to reduce carbon emissions, improve energy and water efficiency, reduce effluents, and develop HIV/AIDS awareness programs.
1. A technical assistance fund is established and funded whose resources are available to (a specific) investment fund; 2. The fund managers use the TA fund resources to assist SME investments in becoming more sustainable Business risks - NA NA - Currently only Aureos investments applicable
http://www.aureos.com/news/news-july-10-2007.php
13 Loan Guarantee Fund GuaranteeWest African Development Bank
- Specialist SME-investor focused intermediaries (to broker information, access and transactions)
Domestic and international lending to West African companies and projects
GARI is a private investment guarantee fund coming under private law in Togo. The fund provides credit guarantees to financial lending institutions in the area of and active in all countries of ECOWAS. Through this it aims to encourage banks and other financial intermediaries to grants medium- and long-term credits to companies in the region.
1. Lending institution applies for guarantee and provides financials and asset information2. Guarantor performs in-country due diligence of borrower, lender 3. Both parties agree 1) uses for loan procees 2) requirements for claiming guarantee, 3) guarantee limits4. Borrower receives loan5. Guarantor conducts periodic in-country reviews of loan status6. In case of a claim, Guarantor performs audit7. If guarantee claim criteria fulfilled, Guarantor pays out agreed percentage of losses to borrower" Business risk - up to 50%
2-3% + annual utilization fee of 1-3%
-Restricted to firms investing in GARI member countries (Bénin, Burkina Faso, Cap Vert, Côte d’Ivoire, Gambie, Ghana, Guinée, Guinée-Bissau, Libéria, Mali, Mauritanie, Niger, Nigeria, Sénégal, Sierra Leone, Togo) - GARI shareholders given preferential treatment- Long application time frame (12-18 months)- Single venture investments- Focus on financiers of: Company start-ups Modernization Improvement of productivity Expansion of production capacities Transfer of ownership Restructuring
http://www.boad.org/content/presentation/pres_financement_gari.htm
17Public Sector Equity Guarantee Guarantee
AWS - Austrian Development Bank
- Bi-lateral / multi-lateral development bank (provide funding, operate facility)- Dev. Country audit firms (provide DD/Assurance on investment targets)
Equity investment in Austrian SMEs
An guarantee facility funded and backed by the Austrian government guarantees losses on individual equity investments by investors in Austrian SMEs. Equity includes:Covers loss of equity invested on:'- "Additional cash"- Minority shareholdings- Quasi-equity (if subordinated, min. 10 year term, returns depend on the profit of the SME)
1. Individual investors or funds seeking to invest equity in an SME apply for a guarantee from the AWS facility2. AWS performs due diligence of the SME3. Individual investors up to €20k are eligible for 100% guarantee against loss of original equity investment; above €20k, only 50% coverage is available. Funds and "other investors" are eligible for 50% coverage Business risk - up to 100% NA
- Austrian SME investment only- Maximum guarantee amount: €1m- Maximum guararntee period: 10 years- Owners and relations not eligible for gurantees
AWS website: http://www.awsg.at/portal/cCardDatabase.php?dgn=29&dse=5&dsi=20
http://www.eif.org/cms/htm/en/eif.org/attachments/presentations/map_conference_13.pdf
18/9/07 1 DeRisk WWF-UNEPFI mechanism long list vWorkshop.xls
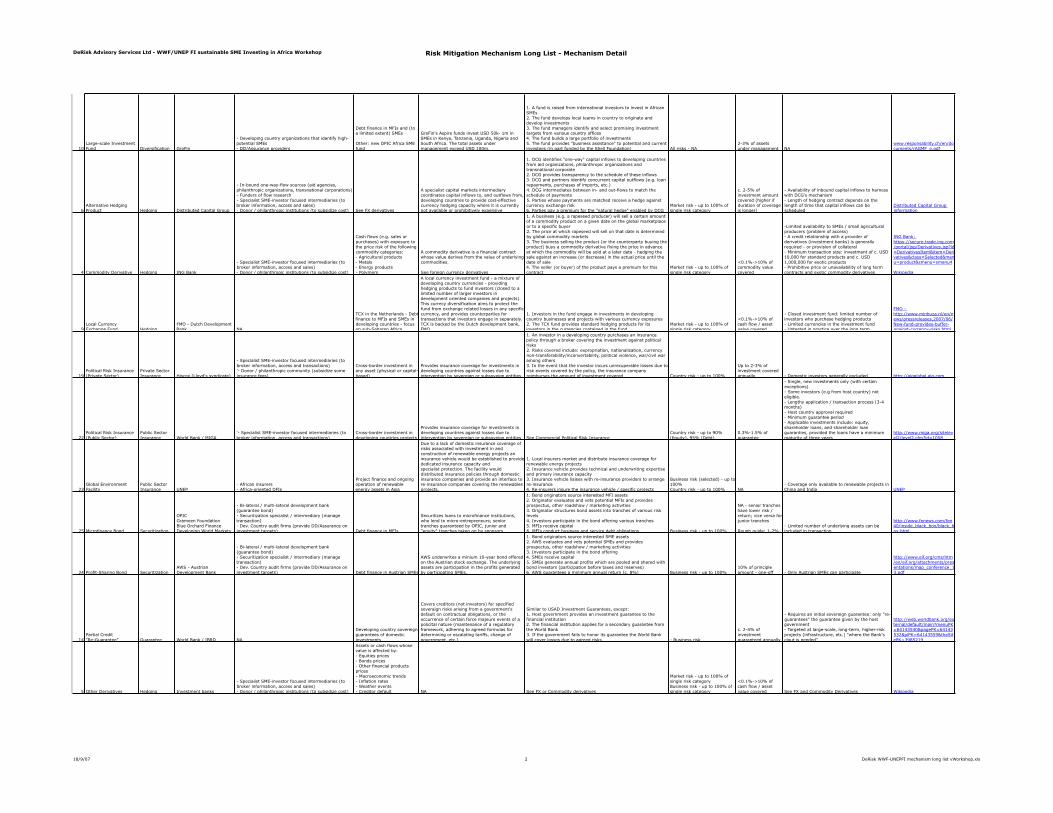
DeRisk Advisory Services Ltd - WWF/UNEP FI sustainable SME Investing in Africa Workshop Risk Mitigation Mechanism Long List - Mechanism Detail
10Large-scale Investment Fund Diversification GroFin
- Developing country organizations that identify high-potential SMEs- DD/Assurance providers
Debt finance in MFIs and (to a limited extent) SMEs
Other: new OPIC Africa SME fund
GroFin's Aspire funds invest USD 50k- 1m in SMEs in Kenya, Tanzania, Uganda, Nigeria and South Africa. The total assets under management exceed USD 100m.
1. A fund is raised from international investors to invest in African SMEs2. The fund develops local teams in country to originate and develop investments3. The fund managers identify and select promising investment targets from various country offices4. The fund builds a large portfolio of investments5. The fund provides "business assistance" to potential and current investees (in part funded by the Shell Foundation) All risks - NA
2-3% of assets under management NA
www.responsability.ch/en/documents/rAGMF_e.pdf
6Alternative Hedging Product Hedging Distributed Capital Group
- In-bound one-way-flow sources (aid agencies, philanthropic organizations, transnational corporations)- Funders of flow research- Specialist SME-investor focused intermediaries (to broker information, access and sales)- Donor / philanthropic institutions (to subsidize cost) See FX derivatives
A specialist capital markets intermediary coordinates capital inflows to, and outflows from, developing countries to provide cost-effective currency hedging capacity where it is currently not available or prohibitively expensive
1. DCG identifies "one-way" capital inflows to developing countries from aid organizations, philanthropic organizations and transnational corporate2. DCG provides transparency to the schedule of these inflows3. DCG and partners identify concurrent capital outflows (e.g. loan repayments, purchases of imports, etc.)4. DCG intermediates between in- and out-flows to match the schedule of payments5. Parties whose payments are matched receive a hedge against currency exchange risk6. Parties pay a premium for the "natural hedge" enabled by DCG
Market risk - up to 100% of single risk category
c. 2-5% of investment amount covered (higher if duration of coverage is longer)
- Availability of inbound capital inflows to harness with DCG's mechanism- Length of hedging contract depends on the length of time that capital inflows can be scheduled
Distributed Capital Group information
4 Commodity Derivative Hedging ING Bank
- Specialist SME-investor focused intermediaries (to broker information, access and sales)- Donor / philanthropic institutions (to subsidize cost)
Cash flows (e.g. sales or purchases) with exposure to the price risk of the following commodity categories:- Agricultural products- Metals- Energy products- Polymers
A commodity derivative is a financial contract whose value derives from the value of underlying commodities.
See foreign currency derivatives
1. A business (e.g. a rapeseed producer) will sell a certain amount of a commodity product on a given date on the global marketplace or to a specific buyer2. The price at which rapeseed will sell on that date is determined by global commodity markets3. The business selling the product (or the counterparty buying the product) buys a commodity derivative fixing the price in advance at which the commodity will be sold at a later date - hedging the sale against an increase (or decrease) in the actual price until the date of sale4. The seller (or buyer) of the product pays a premium for this contract
Market risk - up to 100% of single risk category
<0.1%->10% of commodity value covered
-Limited availability to SMEs / small agricultural producers (problem of access)- A credit relationship with a provider of derivatives (investment banks) is generally required - or provision of collateral- Minimum transaction size: investment of c. USD 10,000 for standard products and c. USD 1,000,000 for exotic products- Prohibitive price or unavailability of long term contracts and exotic commodity derivatives
ING Bank: https://secure.trade.ing.com/portal/jsp/Derivatives.jsp?id=DerivativesItem&item=Derivatives&class=Selected&menu=product&smenu=smenu4
Wikipedia
9Local Currency Exchange Fund Hedging
FMO - Dutch Development Bank NA
TCX in the Netherlands - Debt finance to MFIs and SMEs in developing countries - focus on sub-Saharan Africa
A local currency investment fund - a mixture of developing country currencies - providing hedging products to fund investors (closed to a limited number of larger investors in development oriented companies and projects). This currecy diversification aims to protect the fund from exchange related losses in any specific currency, and provides counterparties for transactions that investors engage in separately. TCX is backed by the Dutch development bank, FMO
1. Investors in the fund engage in investments in developing country businesses and projects with various currency exposures2. The TCX fund provides standard hedging products for its investors in the currencies contained in the fund
Market risk - up to 100% of single risk category
<0.1%->10% of cash flow / asset value covered
- Closed investment fund: limited number of investors who purchase hedging products- Limited currencies in the investment fund- Untested in practice over the long term
FMO - http://www.minbuza.nl/en/news/pressreleases,2007/06/New-fund-provides-buffer-against-currency-risks.html
19Political Risk Insurance (Private Sector)
Private Sector Insurance Hiscox (Lloyd's syndicate)
- Specialist SME-investor focused intermediaries (to broker information, access and transactions)'- Donor / philanthropic community (subsidize some insurance fees)
Cross-border investment in any asset (physical or capital-based)
Provides insurance coverage for investments in developing countries against losses due to intervention by sovereign or subsoveign entities
1. An investor in a developing country purchases an insurance policy through a broker covering the investment against political risks2. Risks covered include: expropriation, nationalization, currency non-transferability/inconvertability, political violence, war/civil war among others3. In the event that the investor incurs unrecuperable losses due to risk events covered by the policy, the insurance company reimburses the amount of investment covered Country risk - up to 100%
Up to 2-3% of investment covered annually - Domestic investors generally excluded http://aigglobal.aig.com
22Political Risk Insurance (Public Sector)
Public Sector Insurance World Bank / MIGA
'- Specialist SME-investor focused intermediaries (to broker information, access and transactions)
Cross-border investment in developing countries projects
Provides insurance coverage for investments in developing countries against losses due to intervention by sovereign or subsoveign entities See Commercial Political Risk Insurance
Country risk - up to 90% (Equity), 95% (Debt)
0.3%-1.5% of guarantee
- Single, new investments only (with certain exceptions)- Some investors (e.g from host country) not eligible. - Lengthy application / transaction process (3-4 months)- Host country approval required- Minimum guarantee period- Applicable investments include: equity, shareholder loans, and shareholder loan guaranties, provided the loans have a minimum maturity of three years
http://www.miga.org/sitelevel2/level2.cfm?id=1058
23Global Environment Facility
Public Sector Insurance UNEP
- African insurers- Africa-oriented DFIs
Project finance and ongoing operation of renewable energy assets in Asia
Due to a lack of domestic insurance coverage of risks associated with investment in and construction of renewable energy projects an insurance vehicle would be established to provide dedicated insurance capacity andspecialist protection. The facility would distributed insurance policies through domestic insurance companies and provide an interface to re-insurance companies covering the renewables projects.
1. Local insurers market and distribute insurance coverage for renewable energy projects2. Insurance vehicle provides technical and underwriting expertise and primary insurance capacity3. Insurance vehicle liaises with re-insurance providers to arrange re-insurance4. Re-insurers insure the insurance vehicle / specific projects
Business risk (selected) - up to 100%Country risk - up to 100% NA
- Coverage only available to renewable projects in China and India UNEP
25 Microfinance Bond Securitization
OPICGrameen FoundationBlue Orchard FinanceDeveloping World Markets
- Bi-lateral / multi-lateral development bank (guarantee bond)- Securitization specialist / intermediary (manage transaction)- Dev. Country audit firms (provide DD/Assurance on investment targets) Debt finance in MFIs
Securitizes loans to microfinance institutions, who lend to micro-entrepreneurs; senior tranches guaranteed by OPIC, junior and "equity" tranches taken on by sponsors
1. Bond originators source interested MFI assets2. Originator evaluates and vets potential MFIs and provides prospectus, other roadshow / marketing activities3. Originator structures bond assets into tranches of various risk levels4. Investors participate in the bond offering various tranches5. MFIs receive capital6. MFIs conduct business and service debt obligations Business risk - up to 100%
NA - senior tranches have lower risk / return; vice versa for junior tranches
Rough guide: 1-2%- Limited number of underlying assets can be included in transaction
http://www.fenews.com/fen40/inside_black_box/black_box.html
24 Profit-Sharing Bond SecuritizationAWS - Austrian Development Bank
- Bi-lateral / multi-lateral development bank (guarantee bond)- Securitization specialist / intermediary (manage transaction)- Dev. Country audit firms (provide DD/Assurance on investment targets) Debt finance in Austrian SMEs
AWS underwrites a minium 10-year bond offered on the Austrian stock exchange. The underlying assets are participation in the profits generated by participating SMEs.
1. Bond originators source interested SME assets2. AWS evaluates and vets potential SMEs and provides prospectus, other roadshow / marketing activities3. Investors participate in the bond offering4. SMEs receive capital5. SMEs generate annual profits which are pooled and shared with bond investors (participation before taxes and reserves)6. AWS guarantees a minimum annual return (c. 8%) Business risk - up to 100%
10% of principle amount - one-off - Only Austrian SMEs can participate
http://www.eif.org/cms/htm/en/eif.org/attachments/presentations/map_conference_13.pdf
14Partial Credit "Re-Guarantee" Guarantee World Bank / IBRD NA
Developing country sovereign guarantees of domestic investments
Covers creditors (not investors) for specified soveraign risks arising from a government's default on contractual obligations, or the occurrence of certain force majeure events of a policital nature (maintenance of a regulatory framework, adhering to agreed formulas for determining or escalating tariffs, change of government, etc.)
Similar to USAD Investment Guarantees, except:1. Host government provides an investment guarantee to the financial institution2. The financial institution applies for a secondary guarantee from the World Bank3. If the government fails to honor its guarantee the World Bank will cover losses due to agreed risks - Business risk
c. 2-4% of investment guaranteed annually
- Requires an initial sovereign guarantee: only "re-guarantees" the guarantee given by the host government- Targeted at large-scale, long-term, higher-risk projects (infrastructure, etc.) "where the Bank's clout is needed"
http://web.worldbank.org/external/default/main?menuPK=64143540&pagePK=64143532&piPK=64143559&theSitePK=3985219
5 Other Derivatives Hedging Investment banks
- Specialist SME-investor focused intermediaries (to broker information, access and sales)- Donor / philanthropic institutions (to subsidize cost)
Assets or cash flows whose value is affected by:- Equities prices- Bonds prices- Other financial products prices- Macroeconomic trends- Inflation rates- Weather events- Creditor default NA See FX or Commodity derivatives
Market risk - up to 100% of single risk categoryBusiness risk - up to 100% of single risk category
<0.1%->10% of cash flow / asset value covered See FX and Commodity Derivatives Wikipedia
18/9/07 2 DeRisk WWF-UNEPFI mechanism long list vWorkshop.xls
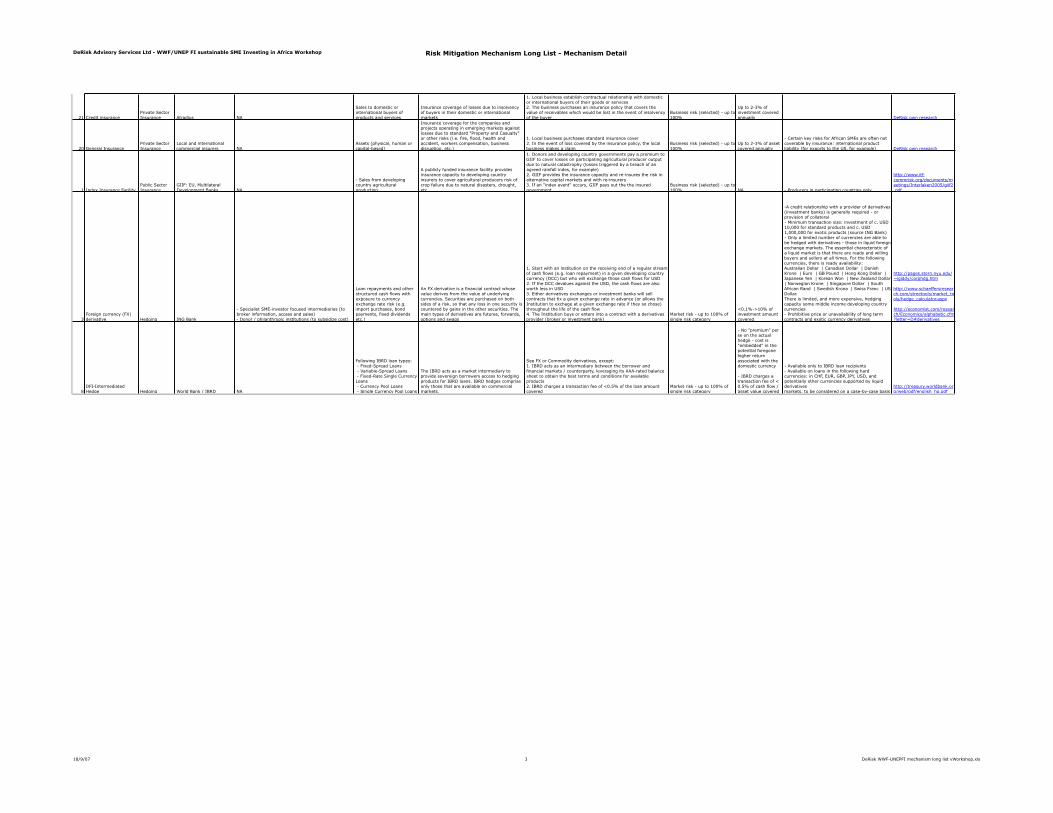
DeRisk Advisory Services Ltd - WWF/UNEP FI sustainable SME Investing in Africa Workshop Risk Mitigation Mechanism Long List - Mechanism Detail
21 Credit insurancePrivate Sector Insurance Atradius NA
Sales to domestic or international buyers of products and services
Insurance coverage of losses due to insolvency of buyers in their domestic or international markets
1. Local business establish contractual relationship with domestic or international buyers of their goods or services2. The business purchases an insurance policy that covers the value of receivables which would be lost in the event of insolvency of the buyer
Business risk (selected) - up to 100%
Up to 2-3% of investment covered annually DeRisk own research
20 General InsurancePrivate Sector Insurance
Local and international commercial insurers NA
Assets (physical, human or capital-based)
Insurance coverage for the companies and projects operating in emerging markets against losses due to standard "Property and Casualty" or other risks (i.e. fire, flood, health and accident, workers compensation, business disruption, etc.)
1. Local business purchases standard insurance cover2. In the event of loss covered by the insurance policy, the local business makes a claim
Business risk (selected) - up to 100%
Up to 2-3% of asset covered annually
- Certain key risks for African SMEs are often not coverable by insurance: international product liability (for exports to the US, for example) DeRisk own research
1 Index Insurance Facility Public Sector Insurance
GIIF: EU, Multilateral Development Banks NA
- Sales from developing country agricultural production
A publicly funded insurance facility provides insurance capacity to developing country insurers to cover agricultural producers risk of crop failure due to natural disasters, drought, etc.
1. Donors and developing country governments pay a premium to GIIF to cover losses on participating agricultural producer output due to natural catastrophy (losses triggered by a breach of an agreed rainfall indes, for example)2. GIIF provides the insurance capacity and re-insures the risk in alternative capital markets and with re-insurers3. If an "index event" occurs, GIIF pays out the the insured government
Business risk (selected) - up to 100% NA - Producers in participating countries only
http://www.itf-commrisk.org/documents/meetings/Interlaken2005/giif2.pdf
3Foreign currency (FX) derivative Hedging ING Bank
- Specialist SME-investor focused intermediaries (to broker information, access and sales)- Donor / philanthropic institutions (to subsidize cost)
Loan repayments and other structured cash flows with exposure to currency exchange rate risk (e.g. import purchases, bond payments, fixed dividends etc.)
An FX derivative is a financial contract whose value derives from the value of underlying currencies. Securities are purchased on both sides of a risk, so that any loss in one security is countered by gains in the other securities. The main types of derivatives are futures, forwards, options and swaps
1. Start with an institution on the receiving end of a regular stream of cash flows (e.g. loan repayment) in a given developing country currency (DCC) but who will exchange those cash flows for USD2. If the DCC devalues against the USD, the cash flows are also worth less in USD3. Either derivatives exchanges or investment banks will sell contracts that fix a given exchange rate in advance (or allows the Institution to exchage at a given exchange rate if they so chose) throughout the life of the cash flow4. The Institution buys or enters into a contract with a derivatives provider (broker or investment bank)
Market risk - up to 100% of single risk category
<0.1%->10% of investment amount covered
-A credit relationship with a provider of derivatives (investment banks) is generally required - or provision of collateral- Minimum transaction size: investment of c. USD 10,000 for standard products and c. USD 1,000,000 for exotic products (source ING Bank)- Only a limited number of currencies are able to be hedged with derivatives - those in liquid foreign exchange markets. The essential characteristic of a liquid market is that there are ready and willing buyers and sellers at all times. For the following currencies, there is ready availability: Australian Dollar | Canadian Dollar | Danish Krone | Euro | GB Pound | Hong Kong Dollar | Japanese Yen | Korean Won | New Zealand Dollar | Norwegian Krone | Singapore Dollar | South African Rand | Swedish Krona | Swiss Franc | US Dollar. There is limited, and more expensive, hedging capacity some middle income developing country currencies- Prohibitive price or unavailability of long term contracts and exotic currency derivatives
http://pages.stern.nyu.edu/~igiddy/corphdg.htm
http://www.schaeffersresearch.com/streetools/market_tools/hedge_calculator.aspx
http://economist.com/research/Economics/alphabetic.cfm?letter=D#derivatives
8DFI-Intermediated Hedge Hedging World Bank / IBRD NA
Following IBRD loan types: - Fixed-Spread Loans - Variable-Spread Loans - Fixed-Rate Single Currency Loans - Currency Pool Loans - Single Currency Pool Loans
The IBRD acts as a market intermediary to provide sovereign borrowers access to hedging products for IBRD loans. IBRD hedges comprise only those that are available on commercial markets.
See FX or Commodity derivatives, except:1. IBRD acts as an intermediary between the borrower and financial markets / counterparty, leveraging its AAA-rated balance sheet to obtain the best terms and conditions for available products2. IBRD charges a transaction fee of <0.5% of the loan amount covered
Market risk - up to 100% of single risk category
- No "premium" per se on the actual hedge - cost is "embedded" in the potential foregone higher return associated with the domestic currency
- IBRD charges a transaction fee of < 0.5% of cash flow / asset value covered
- Available only to IBRD loan recipients- Available on loans in the following hard currencies: in CHF, EUR, GBP, JPY, USD, and potentially other currencies supported by liquid derivativesmarkets, to be considered on a case-by-case basis
http://treasury.worldbank.org/web/pdf/english_hp.pdf
18/9/07 3 DeRisk WWF-UNEPFI mechanism long list vWorkshop.xls
Ochs Abstract
Financing Sustainable Small and Medium Sized Enterprises in Africa: a hierarchy ofdevelopmental needs and acknowledging the vital role of the Diaspora
Dr Kimberly OchsLondon School of Economics and Political Science, TH Marshall FellowThe Negropolis Foundation for Africa of tomorrow, Board Member
Abstract:According to the World Bank, the global flow of formal remittances in 2005 was US$167 billion,or twice as much as global development aid. It is estimated that an additional 20-40% ischannelled informally to the home country. Yet, in international development and financingstrategies, the role of the Diaspora, and particularly the highly skilled, is not taken into account.This paper highlights the important role of the Diaspora to the development of small and mediumenterprises (SMEs) in Africa. The first section reviews the significance of the Diaspora toeconomic development. This section also discusses research on the African Diaspora and theirambitions and plans for investment and new business generation in the region. The second sectiondiscusses the obstacles and challenges to SME development in Africa, as identified by theDiaspora community who are optimally positioned to contribute skills and local knowledge to thegrowth of SMEs. Herein lies a hierarchy of needs for the development of SMEs. The final sectionsuggests initiatives to promote the financing of sustainable small and medium enterprises inAfrica, which address the needs and a framework for ‘hybrid’ collaboration between government,business, the private sector, NGOs, and universities.
Ochs 1
Financing Sustainable Small and Medium Sized Enterprises in Africa: a hierarchy ofdevelopmental needs and acknowledging the vital role of the Diaspora
According to the World Bank, the global flow of formal remittances in 2005 was US$167 billion,or twice as much as global development aid. It is estimated that an additional 20-40% ischannelled informally to the home country. Yet, in international development and financingstrategies, the role of the Diaspora, and particularly the highly skilled, is not taken into account.This paper highlights the important role of the Diaspora to the development of small and mediumenterprises (SMEs) in Africa. The first section reviews the significance of the Diaspora toeconomic development. This section also discusses research on the African Diaspora and theirambitions and plans for investment and new business generation in the region. The second sectiondiscusses the obstacles and challenges to SME development in Africa, as identified by theDiaspora community who are optimally positioned to contribute skills and local knowledge to thegrowth of SMEs. Herein lies a hierarchy of needs for the development of SMEs. The final sectionsuggests initiatives to promote the financing of sustainable small and medium enterprises inAfrica, which address the needs and a framework for ‘hybrid’ collaboration between government,business, the private sector, NGOs, and universities.
Migration central to development – role of the DiasporaAn estimated 5 million Africans are leaving Africa (Africa Recruit 2006). These migrants,referred to as the Diaspora, represent a hidden and often untapped resource with great potential tochange the landscape of small and medium sized enterprises in their home countries. Many ofthese migrants are highly skilled. In 2000, 31.4% of African migrants in OECD countries weretertiary educated (compared to 23% in 1990), which includes IT specialists, scientists, andengineers (Commonwealth Secretariat, 2007, p.13). As of 2006, 28% of the total physicianstrained in Sub-Saharan Africa were working abroad (Ibid.). These are international individuals,with indigenous knowledge of the region, significant skills and experience, and who are vestedand active stakeholders in Africa’s future. As Africa Recruit, a joint venture mobilisationprogramme of the New Partnership for Africa’s Development (NEPAD) and the CommonwealthBusiness Council, reported:
Our research shows us that Africans want to increase investment in Africa. WhileAfrican governments have put in place various policies to facilitate investment bylarge multinationals, little has been done to enable the inflow of investment fromprivate individuals (Africa Recruit, 2006, p. 8).
An Africa Recruit survey of 1327 responses from Kenyans in the Diaspora from all professionalcategories, including accounting, information technology, banking, finance, education, health andlaw found that (Commonwealth Secretariat, 2007):• 78% plan to go back to Kenya in the immediate future or at an earlier date.• 70% of surveyed Diaspora responded plan to become self-employed immediately upon
return to Kenya, with an additional 12% play to become self-employed after initially takingup a job.
• 60% left Africa for career and/or professional reasons• 55% of those interviews sent home more than $300 per month to be used for investment.
The top three areas of which were setting up and running a business, real estate, and capitalmarket investment.
• 82% of the respondents remit for sustenance purposes
Another study of the African Diaspora (Africa Recruit 2006, p.8) from various countries (235respondents) found that:
Ochs 2
• 40% had a professional background in agriculture, with 31% having a Masters degree• 35% of respondents had over 8 years of work experience
This data for the agricultural sector is particularly notable, given that agriculture accounts foralmost 70-80% of the employment in Africa and almost 35-50% of GDP (Africa Recruit, 2006,11). With this desire to engage in Africa’s economy and business development comes thepotential to transform brain drain into brain gain. The Diaspora are playing and will continue toplay a significant role in financing development in Africa, and African countries are relying moreon the stable foreign direct investment (FDI) flows and remittances from indigenous Africansliving abroad (Africa Recruit, 2006). Sierra Leone is attracting post-war investment in socialcapital from its Diaspora community. Overseas Nigerians are investing in business givenattractive capital markets in Nigeria. It is estimated that currently about US$1 billion is remittedto Kenya annually from the Diaspora community of Kenyans living abroad (Kenya DiasporaInvestment Forum, 2006, p.2).
Obstacles and challenges to the Diaspora’s role in sustainable financeThis section discusses the challenges to creation and sustainability of SMEs in Africa, asconceived in a hierarchy of development needs, conceived by this author. What emerges from thisdiscussion is also a framework for collaboration - among government, business, universities,NGOs, international organisations - to address each level to support the financing and integrationof SME enterprises in Africa.
(1) Physiological needsAfrica is on target to miss all eight of the Millennium Development Goals by 2015, whichpotentially means continued poverty and hunger, lack of access to quality education, persistentgender inequality, continued health problems including high rates of child mortality, HIV/AIDS,tuberculosis. These are basic physiological needs for the development of African society and theAfrican economy. How can sustainable SMEs exist if these needs are not met and investorconfident remains low? The promotion of the agricultural sector is paramount to mitigating riskand achieving the physiological needs of Africans. As reported by the Director of Food Securityand Sustainable Development, Josué Dioné, the overall economy of most African countries,including their potential to the achieve the MDGs, is dependent on the agricultural sector. Nearlyone-third of Africans still suffer from chronic hunger, despite spending $25 billion annually onfood and agriculture imports and receiving $2 billion in food aid (Dioné, 2007).
(2) InfrastructurePhysiological needs are closely tied to infrastructure – water, roads, energy sources – is alsofundamental to the development and growth of SMEs, to support trade, distribution, and increaseinvestor confidence. According to Dr. Wani Tombe Laco, a Sudanese economist, Africa usesonly 4% of its water ‘due to the inappropriate allocation of contracts to dubious firms, corruptionand selfishness’ (Laco, 2007). This also includes real estate, where in some countries the industryis unregulated and title deed fraud or illegal allocations of land are not uncommon.
(3) Security and safetyCrime, theft, and poor security are concerns for entrepreneurs and business people conductingtrade through Africa. But lack of security, theft, fraud, and money laundering impact investorconfidence. Part of the financing strategy has to address the needs to SMEs to provide a safe andfair marketplace.
Ochs 3
(4) Policy initiatives and incentivesThis could come from one of three groups, or through a partnership with includes one, two or allthree: government, private sector, or third sector. Private sector partnership with government isvery strong and policies have been developed that are conducive to business and investment.These might include national and/or international reforms, such as fiscal reforms for povertyreduction, or initiatives to achieve macro-economic stability or and improve governance.
(5) Human capitalLack of access to technical expertise and capacity building resources are obvious barriers to theexpansion of the sustainable SME sector, but given that many of the most highly qualified andskilled are working outside of Africa, the involvement of the Diaspora is key to the developmentof business and entrepreneurship in Africa. This also includes the regional migration of skilledtalent within and across Africa.
(6) Social capital / knowledge networksThis includes formal and informal Diaspora networks, but across countries abroad and with thehome country. The objective is to get a ‘critical mass’, and building a means to define andinstitutionalise commitments from the Diaspora to the home territory. A small group might serveas a springboard to launch projects, or to lobby together for favourable policy changes.
(7) Financial mechanismsIf an estimated 20-40% of monies are being remitted informally – perhaps tucked into the soles ofshoes, or packages sent home – it suggests outrageous inefficiencies in current mechanisms ofmoney transfer and ways to facilitate investment opportunities back home.
Addressing these needs from the Diaspora perspectiveIn conclusion, this paper summarises and puts forward several suggestions advocated by experts,policy makers, and researchers, which take into consideration the important role of the Diasporain the development of creating sustainable SMEs on the African continent. They consider thespecific needs of the Diaspora, to assume their key role in the development of SME enterprisesand economic progress in Africa, but require cooperation from the diverse range of stakeholders.
In addressing the specific role of the Diaspora, the following recommendations are put forward:
(1) Physiological needs Greater attention to the agricultural sector, and support for agricultural SMEs are both essential.Another challenge is turning “brain drain” into “brain circulation”, so that doctors, nurses,teachers who have spent time working abroad are able to return home to opportunities to use theirnew skills and talents. Incentives for returning doctors to start their own clinics, or for teachers toreturn to take up posts or advance professionally are currently lacking (CommonwealthSecretariat, 2007).
(2) InfrastructureOne challenge remains in ways and means for the Diaspora community to invest directly insupporting infrastructure development. As an example, there might be the creation ofinfrastructure bonds or mutual funds that invest in government securities whose proceeds mightbe used for infrastructure development.
Ochs 4
(3) Security and safety – Many African nations are still lacking the infrastructure for adequatelegislative and judiciary systems to monitor and prosecute corruption and theft. Much of thisresponsibility lies within government, to improve law enforcement structures.
(4) Policy incentivesLiberalizing the agriculture export sector and be export market orientated, which requiresgovernmental and inter-governmental trade initiatives as well as a committed private sector.There is also room to improve the processes to register companies, or to obtain permits andlicenses to run businesses. Incentives, which might include tax exemptions or incentives toencourage investment from the Diaspora into their home countries, or special interest rates for theDiaspora, particularly during the business start-up phase when machinery and equipment mightneed to be imported from abroad. Greater participation in home government issues might also befacilitated with dual citizenship or right to representation in political affairs, enhancing trade andinvestment, and studying models from elsewhere – such as India, Israel, and China.
(5) Human capitalThe creation of partnerships between African Universities and Universities in the UK or US havefacilitated the sharing of knowledge, whilst keeping African talent in Africa. Partnershipsbetween schools of engineering and business schools have helped African-based entrepreneursdevelop skills that they will need to set up SMEs, receiving guidance from faculty and professorsin industrialised countries. A further step in this process is building partnerships between theDiaspora business community and African business community to facilitate trade.
(6) Social capital / knowledge networksThere is room for greater communication between African-based companies and Diasporanetworks. Additionally, this includes the sensitisation of the public and private sectorstakeholders on Diaspora issues, to create a foundation for partnerships across Africa andbetween Africa and industrialised countries. Much is to be learned from the Indian Diaspora andtheir role in building partnerships and confidence in the US technology industry to createpartnerships with companies based in India and Indians returning to their home after spendingtime in the US or Europe.
(7) Financial incentives and mechanisms Financial institutions need to develop packages that suit the needs of the Diaspora. Furtherexamples might include tax holidays for those who want to start-up businesses back home, or arelaxed import duty on machinery or capital equipment that needs to be imported. Banks abroadcould also work closely with African banks to facilitate real estate purchases by non-residentnationals. This might also include greater access to e-banking. There is significant room forfinancial institutions to contribute, including services to facilitate the transmittance ofremittances, facilities to make available foreign currency mortgages, and online banking.
ConclusionThe well-documented success stories and critics of microfinance both recognise that the carefulconsideration of context is essential to creating sustainable financing solutions. Promotingsustainable finance in Africa requires much more than the expansion of financial services. Thispaper sought out to propose a hierarchy of needs, which might be used for the coordinatedplanning to achieve sustainable financing solutions for African SMEs. Improving financialincentives and mechanisms are merely at the top of the pyramid.
Ochs 5
REFERENCES
Africa Recruit (2006) Africa Diaspora Investment Report 2006. Harnessing the Role of theDiaspora Agriculture and Investment or Skills Option for the Diaspora? 23-24 November 2006.London UK. (www.africadiaspora.com)
Commonwealth Secretariat (2007) Report on the Pre-Global Forum on Migration andDevelopment. London: Commonwealth Secretariat.
Kenya Diaspora Investment Forum (2006) Kenya Diaspora Investment Forum. 9 December 2006.
Dioné, J. D. (2007) Welcome address at the Ad-hoc Expert Group Meeting on Agricultural andRural Transformation in Africa. 23-25 April 2007. Addis Ababa, Ethiopia.http://www.uneca.org/eca_resources/Speeches/2007_speeches/070423_speech_dione.htm
Laco, W.T. (2007) in No Author: “Sudanese Economist says at current pace, Africa may notachieve the MDGs, even in 100 years”. http://www.uneca.org/mdgs/Story0700403.asp.