Embed Size (px)
Citation preview
UNEP ENVIRONMENTAL ASSESSMENTEXPO 2010 SHANGHAI, CHINA
U N I T E D N A T I O N S E N V I R O N M E N T P R O G R A M M E
UN
EP EN
VIRO
NM
ENTA
L AS
SES
SM
ENT: EX
PO
20
10
—S
HA
NG
HA
I, CH
INA
Job Number: DCP/1209/NA
United Nations Environment ProgrammeP.O. Box 30552 Nairobi 00100, Kenya
tel: +254 20 762 1234fax: +254 20 762 3927
e-mail: [email protected]
www.unep.org
UNEP ENVIRONMENTAL ASSESSMENTEXPO 2010
SHANGHAI, CHINA
UNITED NATIONS ENVIRONMENT PROGRAMME
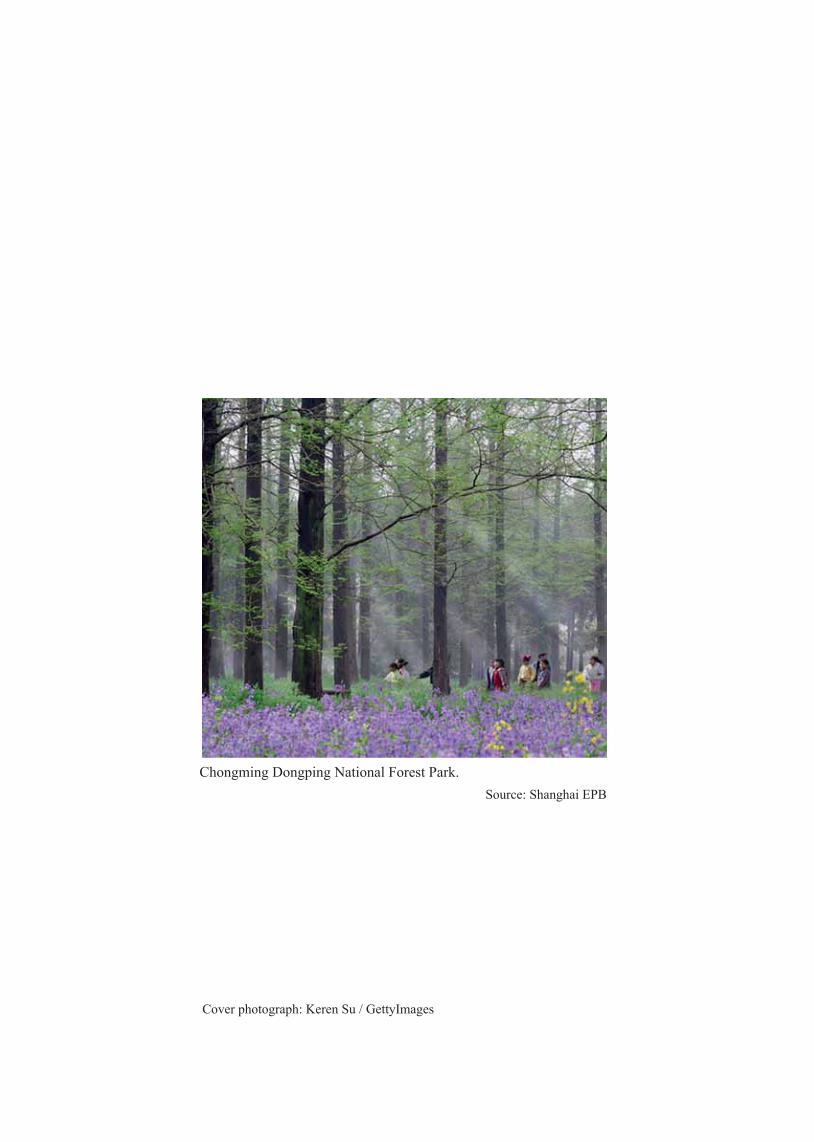
Chongming Dongping National Forest Park.
Source: Shanghai EPB
Cover photograph: Keren Su / GettyImages
UNEP
Env
iron
men
tal A
sses
smen
t
Expo 2010 Shanghai, China
3
Contents
Acknowledgements .............................................................................................................. 6Foreword............................................................................................................................... 7
1. Introduction .......................................................................................................................... 91.1 UNEP and Expo 2010 ................................................................................................... 101.2 Green Expo ................................................................................................................... 10
World Expos and the Environment ................................................................................. 10The Theme of Expo 2010: Better City, Better Life ......................................................... 10The Concept of a Green Expo ..........................................................................................11
1.3 Shanghai and its Environmental Governance ............................................................... 12Basic information about Shanghai .................................................................................. 12Environmental Governance ............................................................................................. 12
1.4 Scope of the Report ...................................................................................................... 141.5 Research Methodology ................................................................................................. 16
2. Air Quality .......................................................................................................................... 182.1 China’s Air Quality Standard........................................................................................ 192.2 Shanghai’s Air Pollution Control Measures ................................................................. 21
Energy Structure, Efciency and Fuel ............................................................................ 21Industrial Sector .............................................................................................................. 23Transport Sector .............................................................................................................. 23Dust and Construction ..................................................................................................... 24
2.3 Annual Trends in Air Quality ....................................................................................... 252.4 Comments and Recommendations ............................................................................... 30
Decoupling Development and Pollution ......................................................................... 30Expo as a catalyst ............................................................................................................ 33Regional Collaboration ................................................................................................... 33Ongoing improvement of monitoring standards and scope ............................................ 34Promoting Monitoring Experience .................................................................................. 36
3. Transportation .................................................................................................................... 373.1 Public Transport............................................................................................................ 38
Prioritization of Public Transport .................................................................................... 39Rapid Transit System ...................................................................................................... 39Public Buses and BRT ..................................................................................................... 41
3.2 New Energy Vehicles .................................................................................................... 43Supercapacitor Trolleybus ............................................................................................... 43Battery-Supercapacitor Electric Bus ............................................................................... 44Hydrogen fuel-cell vehicles ............................................................................................ 45Hybrid buses .................................................................................................................... 46New Energy Vehicles in the World Expo 2010 ............................................................... 46
3.3 Car Growth Restriction Measures ................................................................................ 48
UNEP
Env
iron
men
tal A
sses
smen
tExpo 2010 Shanghai, China
4
Auctioning of Car License .............................................................................................. 48Car-free Day .................................................................................................................... 49
3.4 Vehicle Emission Control ............................................................................................. 49Vehicle Emission Standards ............................................................................................ 49Obsolete Vehicle Phasing-out .......................................................................................... 50Access Restriction ........................................................................................................... 50Vehicles Inspection and Maintenance ............................................................................. 50
3.5 Comments and Recommendations ............................................................................... 51Green Transport Vision ................................................................................................... 51Recommendations for Further Improvements ................................................................ 51Beyond Shanghai ............................................................................................................ 52
4. Energy ................................................................................................................................. 544.1 Improving the Energy Structure ................................................................................... 554.2 Dependency on Coal for Electricity ............................................................................. 584.3 Energy Efciency ......................................................................................................... 644.4 Renewable Energy ........................................................................................................ 65
Wind Power ..................................................................................................................... 65Solar PV .......................................................................................................................... 68Solar Thermal Heaters and Solar Street Lamps .............................................................. 69
4.5 Comments and Recommendations ............................................................................... 72Demand-side management .............................................................................................. 73Data on Climate-friendly Technologies .......................................................................... 74Higher Renewable Energy Ambition .............................................................................. 75
5. Solid Waste ......................................................................................................................... 765.1 Domestic Solid waste ................................................................................................... 77
Waste Treatment strategy ................................................................................................ 78Waste Treatment Facilities .............................................................................................. 79
5.2 Hazardous Waste .......................................................................................................... 825.3 Waste in the Expo Venues ............................................................................................. 825.4 Comments and Recommendations ............................................................................... 83
Developing toward a zero-waste society ......................................................................... 83Creative public engagement ............................................................................................ 84Expo 2010 and Waste Reduction Strategy ...................................................................... 85Addressing under-capacity issue ..................................................................................... 85
6. Water ................................................................................................................................... 866.1 Water Sources & Their Protection ................................................................................ 876.2 Water Quality ................................................................................................................ 896.3 Sewage Treatment ........................................................................................................ 90
Urban Sewage Treatment ................................................................................................ 91
UNEP
Env
iron
men
tal A
sses
smen
t
Expo 2010 Shanghai, China
5
Constructed Wetland for Rural Areas .............................................................................. 926.4 River Clean Up ............................................................................................................... 94
Suzhou Creek .................................................................................................................. 946.5 Results of Clean Up Efforts ............................................................................................ 956.5 Eutrophication and Algae Blooms .................................................................................. 986.6 Comments and Recommendations ................................................................................. 99
Enhancing Regional Cooperation ................................................................................... 99Reducing Fertilizers to Decrease Eutrophication ............................................................ 99Furthering Current Efforts ............................................................................................. 100
7. Green Coverage and Protected Areas ............................................................................ 1017.1 Urban Areas .................................................................................................................. 1027.2 Rural Areas ................................................................................................................... 1037.3 Protected Areas ............................................................................................................. 1057.4 Comments and Recommendations ............................................................................... 107
8. The Expo Site .................................................................................................................... 1088.1 Site Selection and Planning .......................................................................................... 109
Cleaning-up of The Site .................................................................................................111Preservation and Utilization of Old Factory Buildings ..................................................111Post-Expo Utilization of Facilities .................................................................................111
8.2 Environmental Management ..........................................................................................1128.3 Green technologies and measures in the Expo Site .......................................................1148.4 Expo Axis and Permanent Pavilions ..............................................................................1178.5 Urban Best Practices Area ............................................................................................ 1238.6 Green Visions of Participants’ Pavilions ...................................................................... 1288.7 Comments and Recommendations ............................................................................... 133
9. Climate Neutrality ........................................................................................................... 1349.1 Climate Neutrality and Major Events ........................................................................... 1359.2 Experience of the Beijing Olympics ............................................................................. 1359.3 Shanghai World Expo 2010 and carbon neutrality ....................................................... 1369.4 Comments and Recommendations ............................................................................... 136
10. Public Participation ....................................................................................................... 13810.1 Communications and Campaigns ............................................................................... 13910.2 NGO Engagement ....................................................................................................... 14010.3 Comments and Recommendations ............................................................................. 141
Comprehensive Communications Strategy ................................................................... 142Activating NGOs Participation ..................................................................................... 142Promoting Green Citizenship ........................................................................................ 143
Bibliography ....................................................................................................................... 144Internet Sources ............................................................................................................. 146
UNEP
Env
iron
men
tal A
sses
smen
tExpo 2010 Shanghai, China
6
ACKNOWLEDGEMENTS
Author: Lo Sze Ping, Expert on Major Events and the Environment, Division of Communications and Public Information, UNEP
Reviewed by:Hartmut Stahl, Elizabeth Khaka, Surya Chandak, Niclas Svenningsen, James Kagai, Mark Radka, Naomi Poulton, Pascal Ouandji, Vered Ehsani, Patricia Kim, Mia Turner, Wang Zhijia, Isabelle Meister, Pan Wenjing, Jamie Choi, Yang Ailun, Edward Chan, Wu Kaming
Produced by the UNEP Division of Communications and Public InformationDirector of Publication: Satinder BindraCoordinator: Theodore ObenLayout and Design: Enid NgairaPrinting: UNON, Publishing Services Section, Nairobi, ISO 14001:2004-certied.
With special thanks to:Zhang Quan, Director, Shanghai Environmental Protection BureauSun Jian, Deputy Director, Shanghai Environmental Protection BureauTang Xiaoyan, Professor of Peking University, Member of Chinese Academy of EngineeringSarah Liao Sau-tung, Former Secretary for the Environment, Transport and Works of Hong Kong,Wu Chengjian, Chief, Environmental Protection Division, Bureau of Shanghai World Expo CoordinationWang Jue, Chief, Science, Technology & Standards Division, Shanghai Environmental Protection BureauBai Guoqiang, Deputy Chief, Ofce of Shanghai Environmental Protection Committee, Shanghai Environmental Protection BureauXu Zhanguo, Deputy Chief, Ofce of Shanghai Environmental Protection Committee, Shanghai Environmental Protection BureauWei Haiping, Deputy Chief Engineer, Shanghai Environment Monitoring CenterWang Min, Engineer, Natural Conservation Institute, Shanghai Academy of Environmental SciencesSu Jinghua, Engineer, Natural Conservation Institute, Shanghai Academy of Environmental SciencesWu Dongwen, Engineer, Institute of Environmental Management & Technology, Shanghai Academy of Environmental SciencesZhang Jianyu, Director, China Program, Environmental Defense Fund Wang Limin, Deputy Conservation Director of Operations, Beijing Ofce, World Wide Fund for NatureYong Yi, Program Ofcer, Shanghai Program Ofce, World Wide Fund for Nature Nicole Kang, Executive Director, Shanghai Oasis ecological Conservation CenterLi Bing, Board Chair, Shanghai Oasis ecological Conservation Center
UNEP
Env
iron
men
tal A
sses
smen
t
Expo 2010 Shanghai, China
7
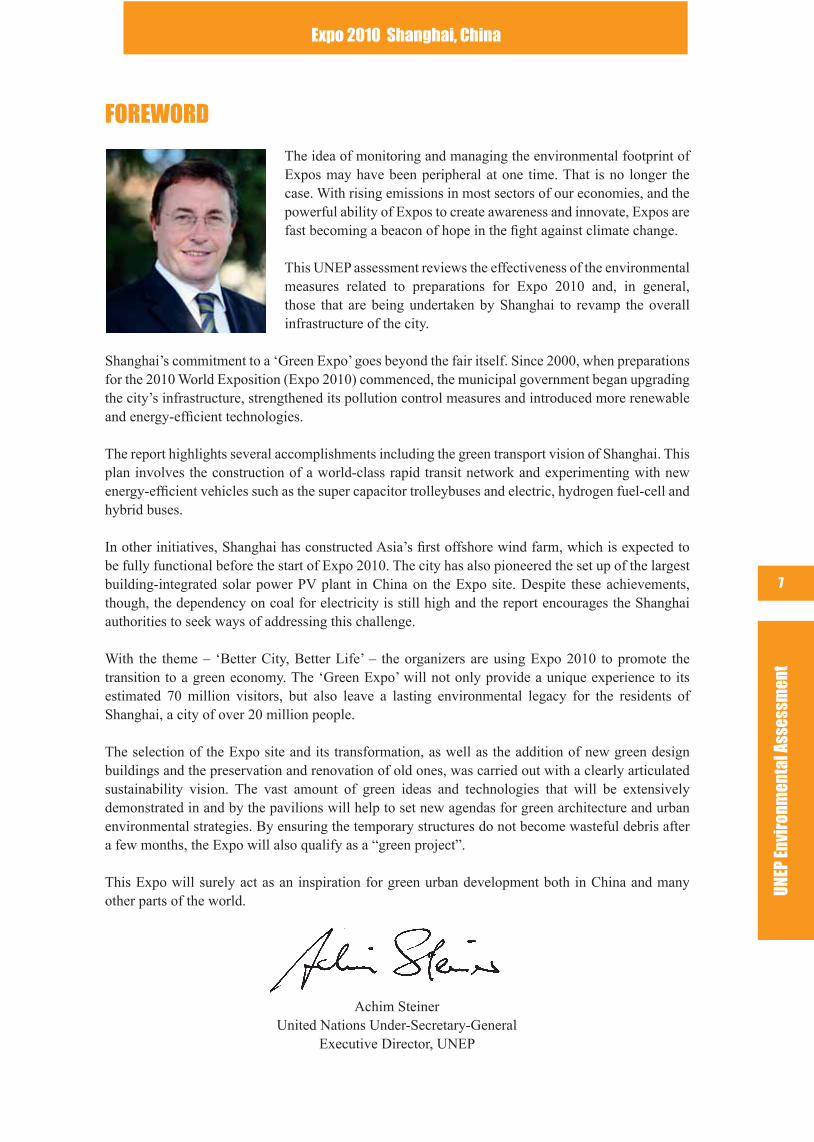
FOREWORD
The idea of monitoring and managing the environmental footprint of Expos may have been peripheral at one time. That is no longer the case. With rising emissions in most sectors of our economies, and the powerful ability of Expos to create awareness and innovate, Expos are fast becoming a beacon of hope in the ght against climate change.
This UNEP assessment reviews the effectiveness of the environmental measures related to preparations for Expo 2010 and, in general, those that are being undertaken by Shanghai to revamp the overall infrastructure of the city.
Shanghai’s commitment to a ‘Green Expo’ goes beyond the fair itself. Since 2000, when preparations for the 2010 World Exposition (Expo 2010) commenced, the municipal government began upgrading the city’s infrastructure, strengthened its pollution control measures and introduced more renewable and energy-efcient technologies.
The report highlights several accomplishments including the green transport vision of Shanghai. This plan involves the construction of a world-class rapid transit network and experimenting with new energy-efcient vehicles such as the super capacitor trolleybuses and electric, hydrogen fuel-cell and hybrid buses.
In other initiatives, Shanghai has constructed Asia’s rst offshore wind farm, which is expected to be fully functional before the start of Expo 2010. The city has also pioneered the set up of the largest building-integrated solar power PV plant in China on the Expo site. Despite these achievements, though, the dependency on coal for electricity is still high and the report encourages the Shanghai authorities to seek ways of addressing this challenge.
With the theme – ‘Better City, Better Life’ – the organizers are using Expo 2010 to promote the transition to a green economy. The ‘Green Expo’ will not only provide a unique experience to its estimated 70 million visitors, but also leave a lasting environmental legacy for the residents of Shanghai, a city of over 20 million people.
The selection of the Expo site and its transformation, as well as the addition of new green design buildings and the preservation and renovation of old ones, was carried out with a clearly articulated sustainability vision. The vast amount of green ideas and technologies that will be extensively demonstrated in and by the pavilions will help to set new agendas for green architecture and urban environmental strategies. By ensuring the temporary structures do not become wasteful debris after a few months, the Expo will also qualify as a “green project”.
This Expo will surely act as an inspiration for green urban development both in China and many other parts of the world.
Achim Steiner United Nations Under-Secretary-General
Executive Director, UNEP
UNEP
Env
iron
men
tal A
sses
smen
tExpo 2010 Shanghai, China
8
Phot
o: c
ourt
esy
vyon
yx.c
om
The MagnaoliaShanghai's city flower
UNEP
Env
iron
men
tal A
sses
smen
t
Expo 2010 Shanghai, China
9
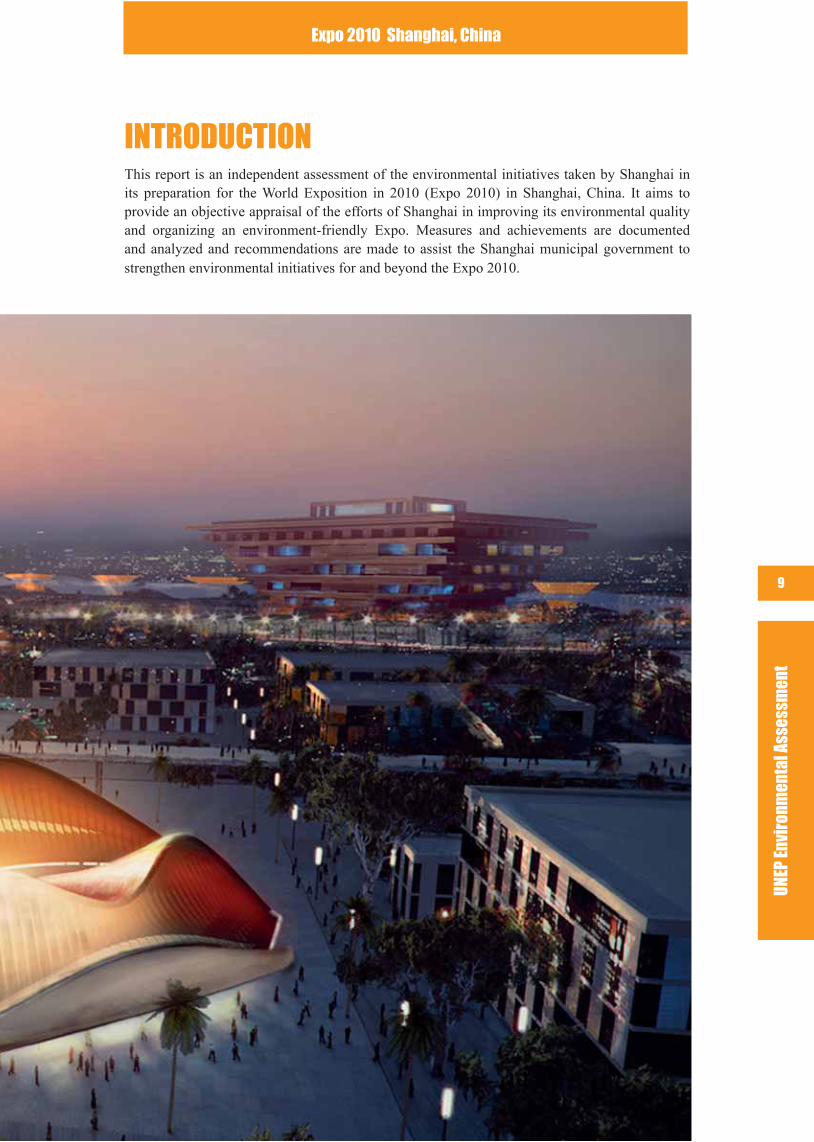
INTRODUCTIONThis report is an independent assessment of the environmental initiatives taken by Shanghai in its preparation for the World Exposition in 2010 (Expo 2010) in Shanghai, China. It aims to provide an objective appraisal of the efforts of Shanghai in improving its environmental quality and organizing an environment-friendly Expo. Measures and achievements are documented and analyzed and recommendations are made to assist the Shanghai municipal government to strengthen environmental initiatives for and beyond the Expo 2010.
UNEP
Env
iron
men
tal A
sses
smen
tExpo 2010 Shanghai, China
10
1.1 UNEP AND EXPO 2010
UNEP’s involvement with Expo 2010 in Shanghai started in 2004 when Klaus Toepfer, the UNEP Executive Director at the time, became an environment advisor to the Mayor of Shanghai. In May 2007, the current Executive Director of UNEP, Achim Steiner, paid a visit to the Expo Site. A series of discussions and visits led to the signing of a Memorandum of Understanding in March 2009 between the Bureau of Shanghai World Expo Coordination and UNEP. UNEP agreed to support the greening of Expo 2010 in the following areas:
Provision of expertise and support for developing a ‘Green Guide’ for 2010 Expo;Conducting an environmental assessment of the preparations of Expo 2010 and releasing a report of the assessment;Jointly organizing with the Expo Bureau a high level forum during Expo 2010;Facilitating an exchange of views between the Expo Bureau and international NGOs on Expo related issues
This Expo 2010 assessment is the third environmental assessment of a mass event in China and follows two previous UNEP reports on the Beijing 2008 Olympics Games (published in November 2007 and February 2009 respectively).
1.2 GREEN EXPO
World Expos and the EnvironmentThe history of World Expositions reects the progress of how human societies relate to nature. Since the inauguration of the rst Expo in London in 1851, more than 40 fairs have been organized. Achievements of the industrial revolution were dominant themes of the Expos in the 19th century, while those in the 20th century focused primarily on economic prosperity and technological progress with occasional calls for a peaceful world.
Environmental concerns were rst introduced to expos, in 1974 in Spokane, United States, with the theme “Celebrating Tomorrow’s Fresh New Environment”. Since then, the concept of sustainable development has gradually become more prominent. The Expos in the new millennium put even more emphasis on the environment. The Hanover Expo 2000 took “Humankind-Nature-Technology – a new world arising” as one of the major themes. The Aichi Expo 2005 in Aichi, Japan was organized around the theme of “Nature’s Wisdom”, expressing ecological co-existence, renewable technology, and the wonders of nature. The Shanghai Expo 2010 follows this trend.
The Theme of Expo 2010: Better City, Better LifeThe theme of Expo 2010 is “Better City, Better Life”, which focuses on the relationship between the city and the environment. Exhibitions and events will be organized to explore the challenges faced by cities around the world and the need to strike a balance between urban development and a sustainable future. It represents the central concern of our times: the sustainability of urban living in a nite world.
UNEP
Env
iron
men
tal A
sses
smen
t
Expo 2010 Shanghai, China
11
The Concept of a Green ExpoPreparation for the Shanghai Expo 2010 started in 2000. Committed to a Green Expo, the organizer has endeavoured to: 1) minimize negative environmental impacts; 2) showcase green solutions for a sustainable future; and 3) make the city greener.
The organizer chose the theme “Better City, Better Life” to promote the Green Expo concept. They also carried out the following measures to reduce negative environmental impacts:
Sustainability considerations in site selection and planningEnvironmental management throughout the ExpoDevelopment and demonstration of green technologies and eco-designsPost-event utilization of venues and facilitiesTaking responsibility to mitigate climate changeInternational cooperation and public participation
Shanghai’s commitment to a Green Expo goes beyond the fair itself. Since 2000, the municipal government has scaled up and accelerated its environmental initiatives. The hundred-year old city is being modernized to become a green example for urban development in the future. Extensive efforts have been initiated to upgrade urban infrastructure, strengthen pollution control measures, utilize cleaner and more energy-efcient technologies and promote renewable energies.
The idea of a Green Expo aims at not only beneting the 70 million expected visitors, but also leaving a green legacy for the citizens of Shanghai and contributing to worldwide initiatives of making cities more sustainable.
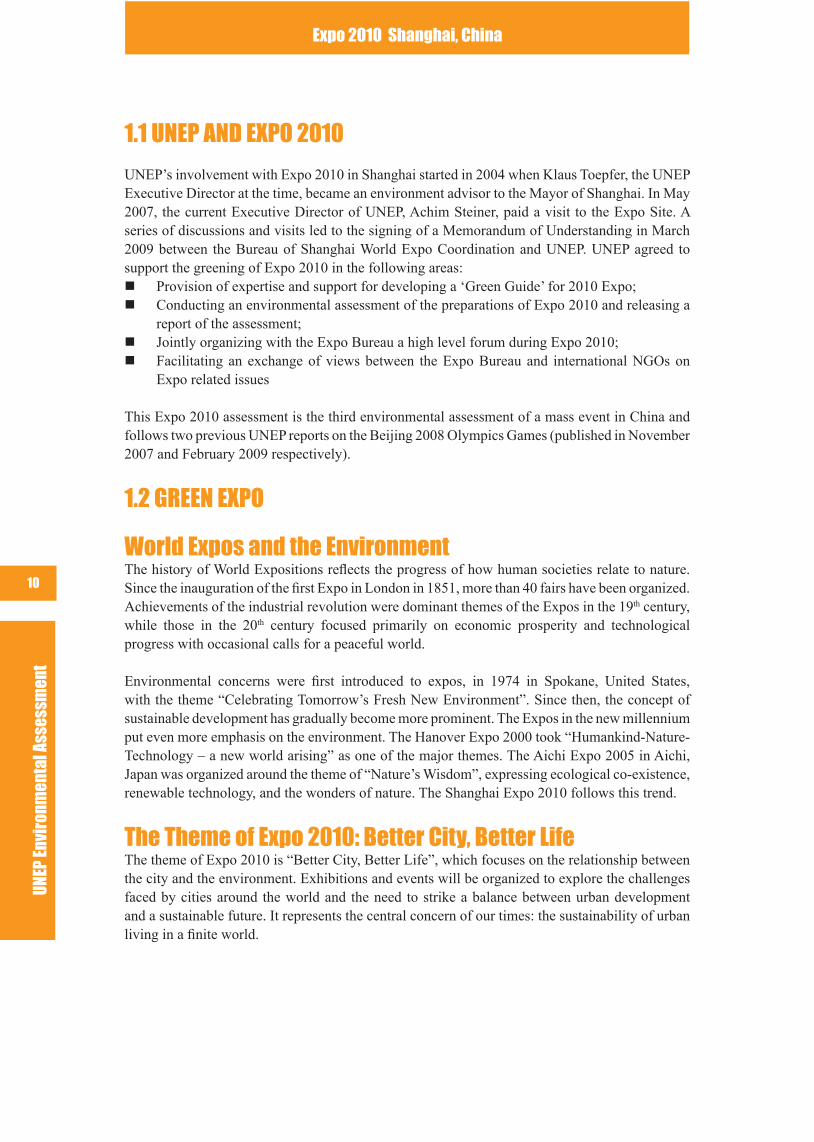
The emblem of Expo 2010 is inspired by the shape of the Chinese character shi (世, literally meaning “the world”). It depicts an image of three persons, representing he/she, you and me, holding hands together, and symbolizes the unity of the human race.
The mascot, Haibao, is modeled after the Chinese character ren (人, literally meaning “people”). In the form of a water drop with the colour of the ocean, Haibao symbolizes the nature-loving character of human beings and the readiness of the Chinese people to embrace the world.
UNEP
Env
iron
men
tal A
sses
smen
tExpo 2010 Shanghai, China
12
1.3 SHANGHAI AND ITS ENVIRONMENTAL GOVERNANCE
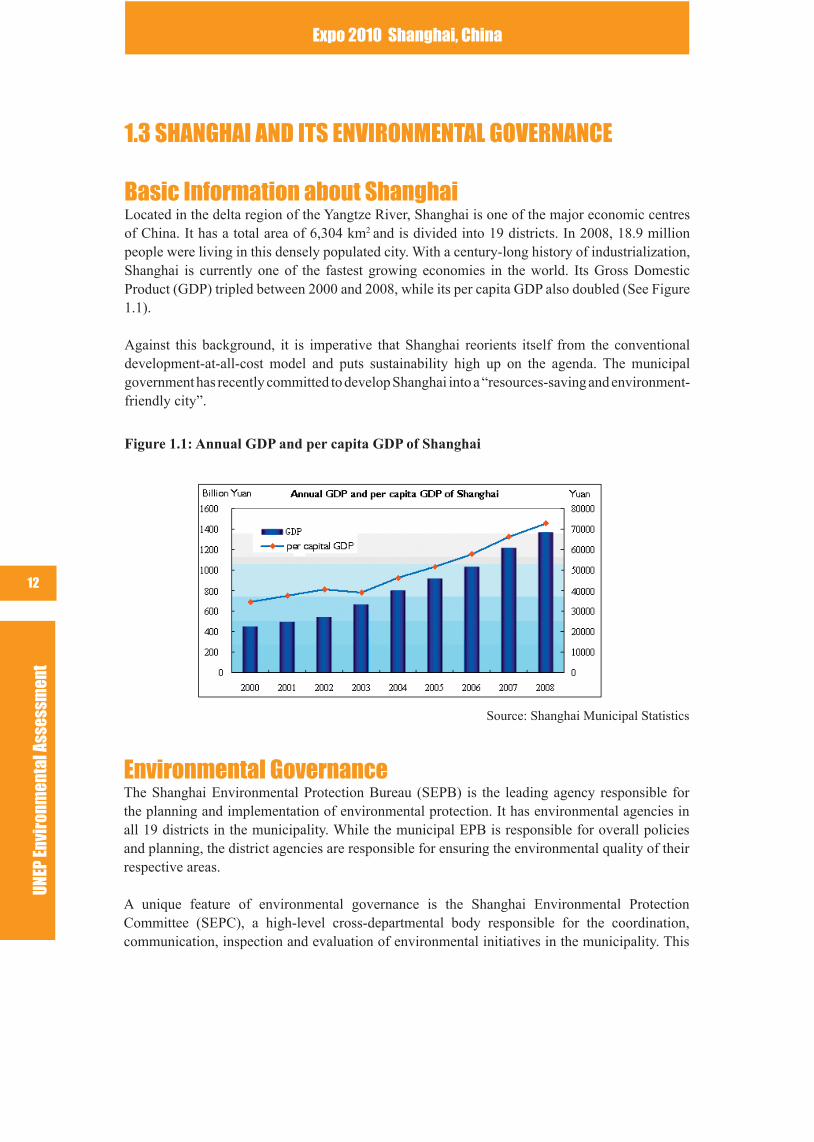
Basic Information about ShanghaiLocated in the delta region of the Yangtze River, Shanghai is one of the major economic centres of China. It has a total area of 6,304 km2 and is divided into 19 districts. In 2008, 18.9 million people were living in this densely populated city. With a century-long history of industrialization, Shanghai is currently one of the fastest growing economies in the world. Its Gross Domestic Product (GDP) tripled between 2000 and 2008, while its per capita GDP also doubled (See Figure 1.1).
Against this background, it is imperative that Shanghai reorients itself from the conventional development-at-all-cost model and puts sustainability high up on the agenda. The municipal government has recently committed to develop Shanghai into a “resources-saving and environment-friendly city”.
Figure 1.1: Annual GDP and per capita GDP of Shanghai
Source: Shanghai Municipal Statistics
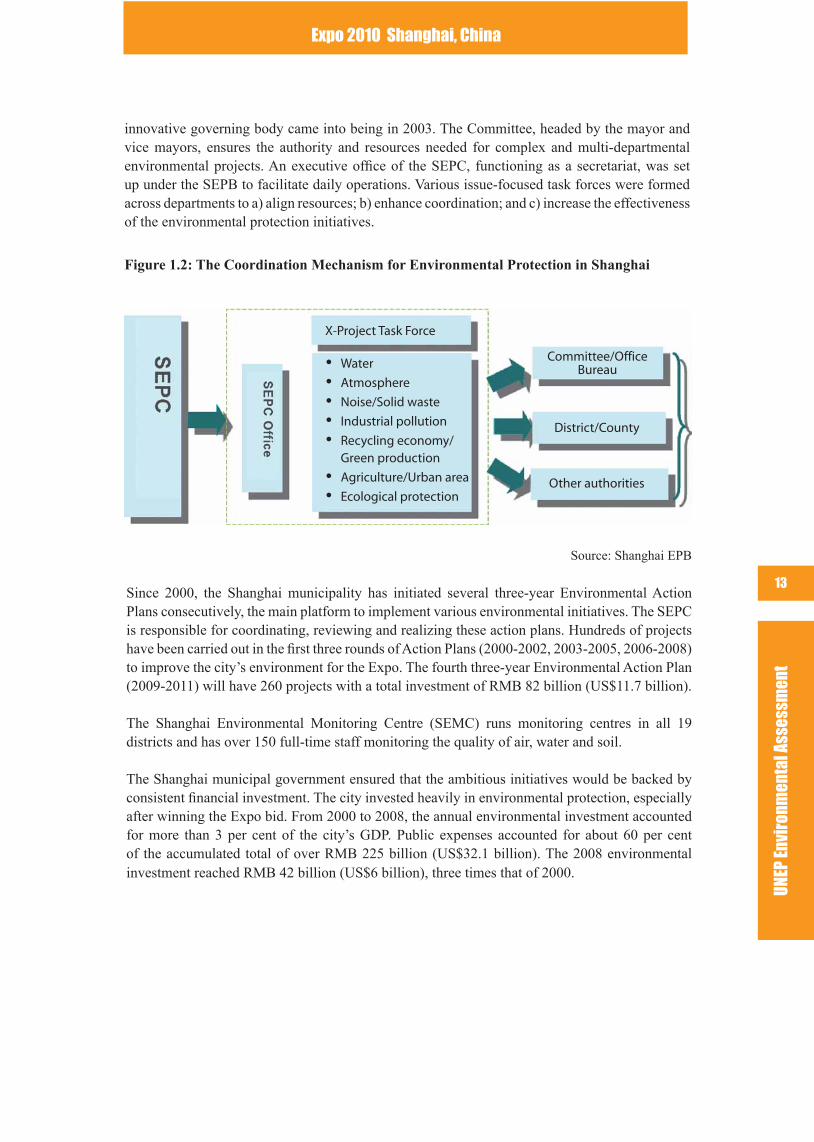
Environmental GovernanceThe Shanghai Environmental Protection Bureau (SEPB) is the leading agency responsible for the planning and implementation of environmental protection. It has environmental agencies in all 19 districts in the municipality. While the municipal EPB is responsible for overall policies and planning, the district agencies are responsible for ensuring the environmental quality of their respective areas.
A unique feature of environmental governance is the Shanghai Environmental Protection Committee (SEPC), a high-level cross-departmental body responsible for the coordination, communication, inspection and evaluation of environmental initiatives in the municipality. This
UNEP
Env
iron
men
tal A
sses
smen
t
Expo 2010 Shanghai, China
13
X-Project Task Force
Water
Atmosphere
Noise/Solid waste
Industrial pollution
Recycling economy/ Green production
Agriculture/Urban area
Ecological protectionOther authorities
Committee/OfficeBureau
District/County
innovative governing body came into being in 2003. The Committee, headed by the mayor and vice mayors, ensures the authority and resources needed for complex and multi-departmental environmental projects. An executive ofce of the SEPC, functioning as a secretariat, was set up under the SEPB to facilitate daily operations. Various issue-focused task forces were formed across departments to a) align resources; b) enhance coordination; and c) increase the effectiveness of the environmental protection initiatives.
Figure 1.2: The Coordination Mechanism for Environmental Protection in Shanghai
Source: Shanghai EPB
Since 2000, the Shanghai municipality has initiated several three-year Environmental Action Plans consecutively, the main platform to implement various environmental initiatives. The SEPC is responsible for coordinating, reviewing and realizing these action plans. Hundreds of projects have been carried out in the rst three rounds of Action Plans (2000-2002, 2003-2005, 2006-2008) to improve the city’s environment for the Expo. The fourth three-year Environmental Action Plan (2009-2011) will have 260 projects with a total investment of RMB 82 billion (US$11.7 billion).
The Shanghai Environmental Monitoring Centre (SEMC) runs monitoring centres in all 19 districts and has over 150 full-time staff monitoring the quality of air, water and soil.
The Shanghai municipal government ensured that the ambitious initiatives would be backed by consistent nancial investment. The city invested heavily in environmental protection, especially after winning the Expo bid. From 2000 to 2008, the annual environmental investment accounted for more than 3 per cent of the city’s GDP. Public expenses accounted for about 60 per cent of the accumulated total of over RMB 225 billion (US$32.1 billion). The 2008 environmental investment reached RMB 42 billion (US$6 billion), three times that of 2000.
UNEP
Env
iron
men
tal A
sses
smen
tExpo 2010 Shanghai, China
14
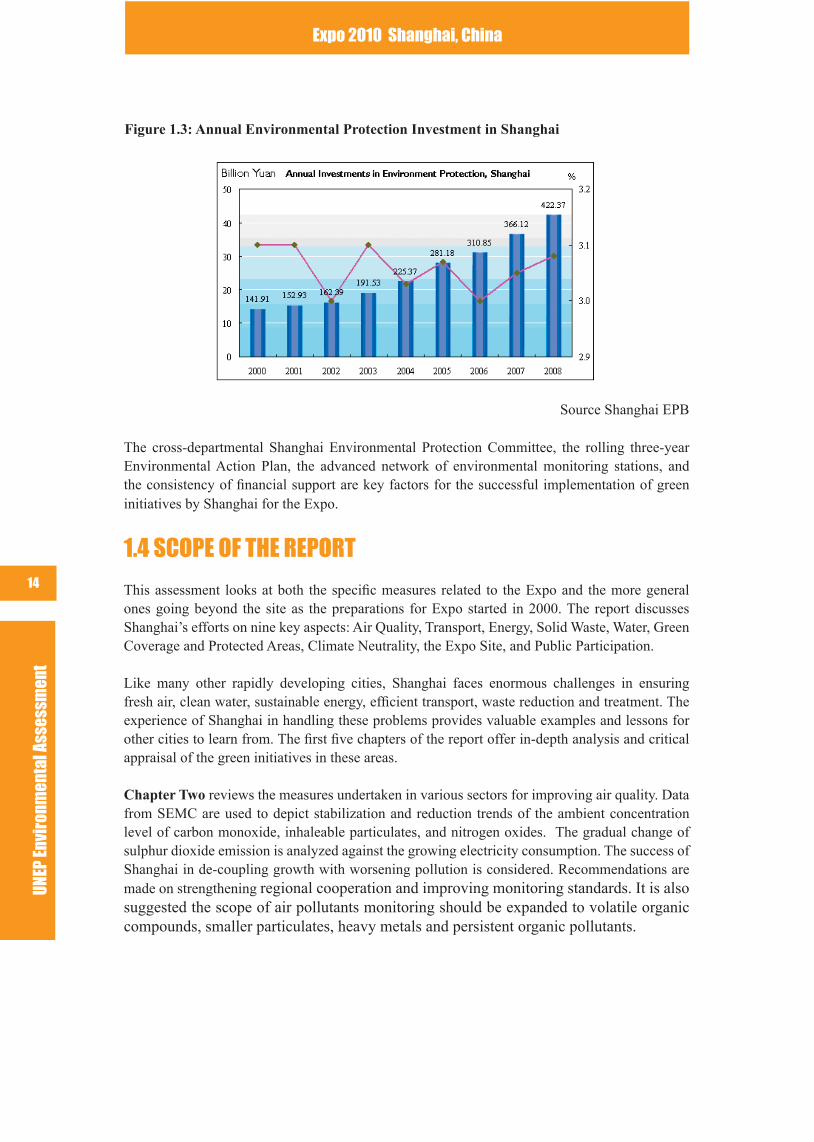
Figure 1.3: Annual Environmental Protection Investment in Shanghai
Source Shanghai EPB
The cross-departmental Shanghai Environmental Protection Committee, the rolling three-year Environmental Action Plan, the advanced network of environmental monitoring stations, and the consistency of nancial support are key factors for the successful implementation of green initiatives by Shanghai for the Expo.
1.4 SCOPE OF THE REPORT
This assessment looks at both the specic measures related to the Expo and the more general ones going beyond the site as the preparations for Expo started in 2000. The report discusses Shanghai’s efforts on nine key aspects: Air Quality, Transport, Energy, Solid Waste, Water, Green Coverage and Protected Areas, Climate Neutrality, the Expo Site, and Public Participation.
Like many other rapidly developing cities, Shanghai faces enormous challenges in ensuring fresh air, clean water, sustainable energy, efcient transport, waste reduction and treatment. The experience of Shanghai in handling these problems provides valuable examples and lessons for other cities to learn from. The rst ve chapters of the report offer in-depth analysis and critical appraisal of the green initiatives in these areas.
Chapter Two reviews the measures undertaken in various sectors for improving air quality. Data from SEMC are used to depict stabilization and reduction trends of the ambient concentration level of carbon monoxide, inhaleable particulates, and nitrogen oxides. The gradual change of sulphur dioxide emission is analyzed against the growing electricity consumption. The success of Shanghai in de-coupling growth with worsening pollution is considered. Recommendations are made on strengthening regional cooperation and improving monitoring standards. It is also suggested the scope of air pollutants monitoring should be expanded to volatile organic compounds, smaller particulates, heavy metals and persistent organic pollutants.
UNEP
Env
iron
men
tal A
sses
smen
t
Expo 2010 Shanghai, China
15
Chapter Three discusses the public transportation prioritization strategy of Shanghai. It examines a) the development of rapid transit systems, b) the strengthening of public bus networks and the experiments of new energy vehicles, c) the innovative vehicle license auctioning mechanism, and d) tightening of vehicle emissions. The construction of a world-class rapid transit network of over 400 kilometres of tracks in twenty years and the diversication strategy of experimenting new energy vehicles are highlighted as remarkable accomplishments. UNEP applauds the green transport vision of Shanghai, suggests further improvements, and recommends its wider promotion across China and beyond.
Chapter Four looks at energy consumption and its subsequent environmental impacts in Shanghai. It discusses and afrms the improvements made in energy structure, in increasing energy efciency and promoting renewable energies. The dependency on coal for electricity is highlighted and recommendations are made to address the challenges. The review encourages Shanghai to keep scaling up renewable energies as demonstrated in its pioneering MW-level solar-PV power plant and offshore wind farms in China, further improving energy efciency and enhancing demand-side management.
Chapter Five examines the overall waste strategy and treatment facilities including landlls, incinerators and mechanical-biological treatment plants. The handling of hazardous waste is also discussed. It points out that although “Reduction, Utilization, and Safe Disposal” are at the core of Shanghai’s waste strategy, municipal efforts were weakened by an imbalanced focus on safe disposal. Recommendations are made to develop a comprehensive waste reduction strategy, address environmental impacts resulting from under-capacity, and motivate the public as part of the solution.
Chapter Six studies water quality and the measures to reduce pollution in water bodies. Shanghai’s efforts in ensuring drinking water safety, improving water quality, increasing the sewage treatment rate, and cleaning up polluted rivers are reviewed. While acknowledging the scale, intention and positive impacts of these measures, it points out the need to tackle the nitrication of the river systems. Recommendations are made to reduce organic pollution from upstream, especially from the overuse of chemical fertilizers in agriculture.
Shanghai’s greening efforts are discussed in Chapter Seven. It talks about a) the impressive increase in per capita urban green spaces, b) the ambitious tree-planting pledge of the city; and c) the protection of environmentally-sensitive and high conservation value areas. Recommendations are made to consolidate the environmental gains of these efforts.
Chapter Eight reviews how sustainability and environmental concerns are taken into account at the Expo site and its venues. It documents the green concepts and technologies extensively used in the newly built landmarks, the national pavilions and the Urban Best Practice Areas.
Chapter Nine discusses the issue of climate neutrality and recommends that the organizer looks seriously at achieving a low-carbon Expo.
The nal chapter, Chapter Ten, examines public participation to date. It advises the organizer to develop a pro-active communication plan on the greening of the Expo, on encouraging NGO participation and promoting green citizenship.
UNEP
Env
iron
men
tal A
sses
smen
tExpo 2010 Shanghai, China
16
1.5 RESEARCH METHODOLOGY
This study was conducted between March and July 2009. The analysis includes data and information collected in Shanghai. The report focuses on the projects and measures developed by the Shanghai municipal government for Expo 2010. Acknowledging that environmental issues are inter-connected with social and economic issues, this report focuses strictly on the environmental impacts and consequences of the initiatives examined.
The author made four visits to Shanghai for a total stay of about two months between March and July 2009. The Shanghai Environmental Protection Bureau (SEPB) and the Shanghai Academy of Environmental Sciences (SAES) provided generous support and assistance during these visits.
The report writing was primarily based on information publicly released as well as that provided by relevant government agencies on request. Media reports, academic papers and internet research were used to compare and contrast with ofcial data for cross analysis. Dozens of interviews with government ofcials, experts, engineers, journalists, environmental volunteers and NGOs were conducted.
The author made eld visits to waste treatment facilities, sewage plants and constructed wetlands, coal power stations and wind farms, industrial parks, environmental monitoring stations, urban green spaces and nature reserves, subway stations and new energy vehicles, the Expo Site and pavilions under construction.
The Shanghai Environmental Protection Committee (SEPC) was the main contact point during the visits. Staff at SECP and SAES facilitated meetings with other parties, assisted in information collection and organized eld trips. With their help the author met with representatives from the:
Shanghai Environmental Protection CommitteeShanghai Environmental Protection BureauShanghai Environment Monitoring CenterShanghai Academy of Environmental SciencesBureau of Shanghai World Expo CoordinationShanghai Development and Reform CommissionShanghai Construction and Communications CommissionShanghai Environment and Energy ExchangeShanghai Bailonggang Sewage Treatment Co. Ltd.Shanghai Laogang Disposal Co. Ltd.Shanghai Wujing Power Generation Co. Ltd.Shanghai Waigaoqiao No 3. Power Generation Co. Ltd.Shanghai Chemcial Industry Park Administration CommissionShanghai Green Environmental Protection Energy Co. Ltd.Shanghai World Expo Lang Holding Co. Ltd.TES-AMM Corporation (China) Ltd.Trade Association of Shanghai Communications and Transportation Shanghai Research Institute of Building SciencesChinese Academy of EngineeringMinistry of Science and Technology
UNEP
Env
iron
men
tal A
sses
smen
t
Expo 2010 Shanghai, China
17
NGOs in Shanghai and Beijing contributed to the writing of this report by sharing their perspectives with the author on the sustainability issues of China in general, and the environmental initiatives in Shanghai in particular. These NGOs included: Greenpeace China; WWF China; Environmental Defense Fund China Program; Friends of Nature; Alax Society of Entrepreneurs and Ecology; Shanghai Oasis Ecological Conservation Center; and Non-Prot Incubator.
UNEP staff in various departments reviewed draft chapters and contributed to the development of comments and recommendations. In the spirit of transparency, a draft of the report was shared with Shanghai EPB and SAES. It is important to note that at no time did any institution or individual attempt to inuence this review beyond pointing out factual errors.
UNEP is condent that the review has been carried out with the most accurate, impartial and scientic approach possible, and that this report is an objective and independent assessment of Shanghai’s initiatives in making the city a more sustainable one for organising a Green Expo.
UNEP
Env
iron
men
tal A
sses
smen
tExpo 2010 Shanghai, China
18
2. AIR QUALITY The Shanghai municipal government has identied air quality as a major component their environmental initiatives. Just as air pollution became the most controversial issue before and during the Beijing 2008 Olympics, it is expected that visitors coming to Expo 2010 will be on the lookout for clear “blue sky” days.
In the last decade, the ambient air quality of the city improved as a result of comprehensive actions by the municipal government. Located on the Yangtze river delta, Shanghai enjoys comparatively better geographic conditions than Beijing, enabling easier dispersion of air pollutants. However, Shanghai has a much longer history of industrial development and a wide range of factories. Its neighbouring provinces Zhejiang and Jiangsu are also rapidly industrializing and are highly urbanized, posing further challenges to the air quality of Shanghai.

UNEP
Env
iron
men
tal A
sses
smen
t
Expo 2010 Shanghai, China
19
2.1 CHINA’S AIR QUALITY STANDARDS
China adopted the National Ambient Air Quality Standards (GB 3095- 1996) in 1996. It sets limits for sulphur dioxide (SO
2), carbon monoxide (CO), particulate matter with a diametre of 10
microns or smaller (PM10
) and nitrogen dioxide (NO2), amongst others. The four pollutants listed
above are the most commonly monitored in Chinese cities.
Chinese air quality standards set separate limits for different locations: Class I applies to special protected areas such as natural conservation areas, scenic spots, and historical sites; Class II applies to residential areas, mixed commercial/ residential areas, cultural, industrial, and rural areas; and Class III applies to special industrial areas.
The standards are the strictest for Class I. Shanghai is designated a Class II area. The Chinese Class II air quality standards are summarized in Table 2.1. The WHO 2000 guidelines, as well as the 2005 Global Update WHO Air Quality Guidelines, are also presented.
Table 2.1: China’s Class II national air quality standard
Pollutant Mean LevelChina’s Upper Limit of Class Ⅱ
WHO EU 2000 Air Quality Guidelines
WHO 2005 Air Quality Guidelines
SO2
Annual Mean 24-hour Mean Hour Mean
60150500
501255001
None205001
PM10
Annual Mean24-hour Mecan
100150
~~
2050
NO2
Annual Mean 24-hour Mean Hour Mean
80120240
401202
200
40None200
CO24-hour Mean Hour Mean
4,00010,000
10,0002
30,00010,0002
30,000
Quantities in μg/m3
1ten minute mean2eight hour mean
~ not set in the WHO EU 2000 Guidelines
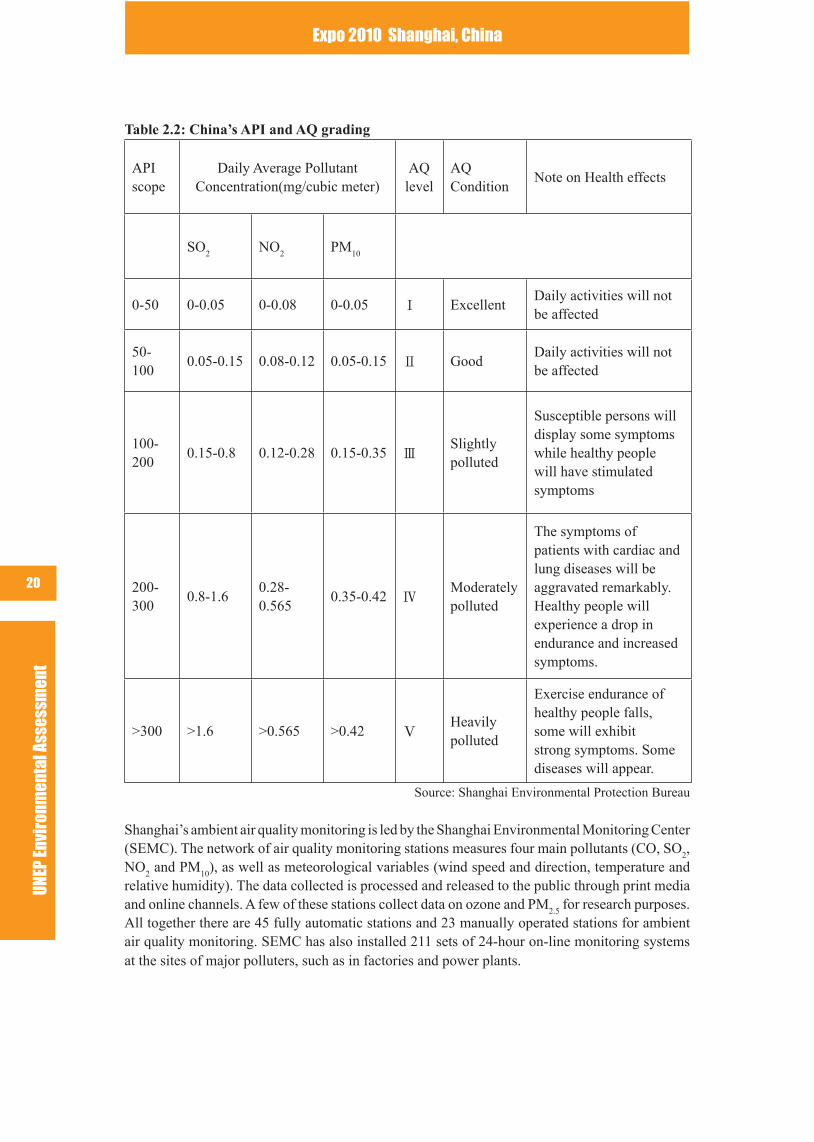
Air quality is also measured against an air pollution index (API). The API is an index for reporting each day’s air quality to the general public. Shanghai uses the term “Good-air Quality Day” to describe days with an API value of 100 or less (i.e. Air Quality Level within classes I and II). The higher the API value, the higher the level of air pollution and the greater the health risk. The relationship between the Chinese API and the ambient pollution levels are shown in Table 2.2. While China has an air quality standard for ozone, ozone is not included in the API.
UNEP
Env
iron
men
tal A
sses
smen
tExpo 2010 Shanghai, China
20
Table 2.2: China’s API and AQ grading
API scope
Daily Average Pollutant Concentration(mg/cubic meter)
AQ level
AQ Condition
Note on Health effects
SO2
NO2
PM10
0-50 0-0.05 0-0.08 0-0.05 Ⅰ ExcellentDaily activities will not be affected
50-100
0.05-0.15 0.08-0.12 0.05-0.15 Ⅱ GoodDaily activities will not be affected
100-200
0.15-0.8 0.12-0.28 0.15-0.35 ⅢSlightly polluted
Susceptible persons will display some symptoms while healthy people will have stimulated symptoms
200-300
0.8-1.60.28-0.565
0.35-0.42 ⅣModerately polluted
The symptoms of patients with cardiac and lung diseases will be aggravated remarkably. Healthy people will experience a drop in endurance and increased symptoms.
>300 >1.6 >0.565 >0.42 ⅤHeavily polluted
Exercise endurance of healthy people falls, some will exhibit strong symptoms. Some diseases will appear.
Source: Shanghai Environmental Protection Bureau
Shanghai’s ambient air quality monitoring is led by the Shanghai Environmental Monitoring Center (SEMC). The network of air quality monitoring stations measures four main pollutants (CO, SO
2,
NO2 and PM
10), as well as meteorological variables (wind speed and direction, temperature and
relative humidity). The data collected is processed and released to the public through print media and online channels. A few of these stations collect data on ozone and PM
2.5 for research purposes.
All together there are 45 fully automatic stations and 23 manually operated stations for ambient air quality monitoring. SEMC has also installed 211 sets of 24-hour on-line monitoring systems at the sites of major polluters, such as in factories and power plants.
UNEP
Env
iron
men
tal A
sses
smen
t
Expo 2010 Shanghai, China
21
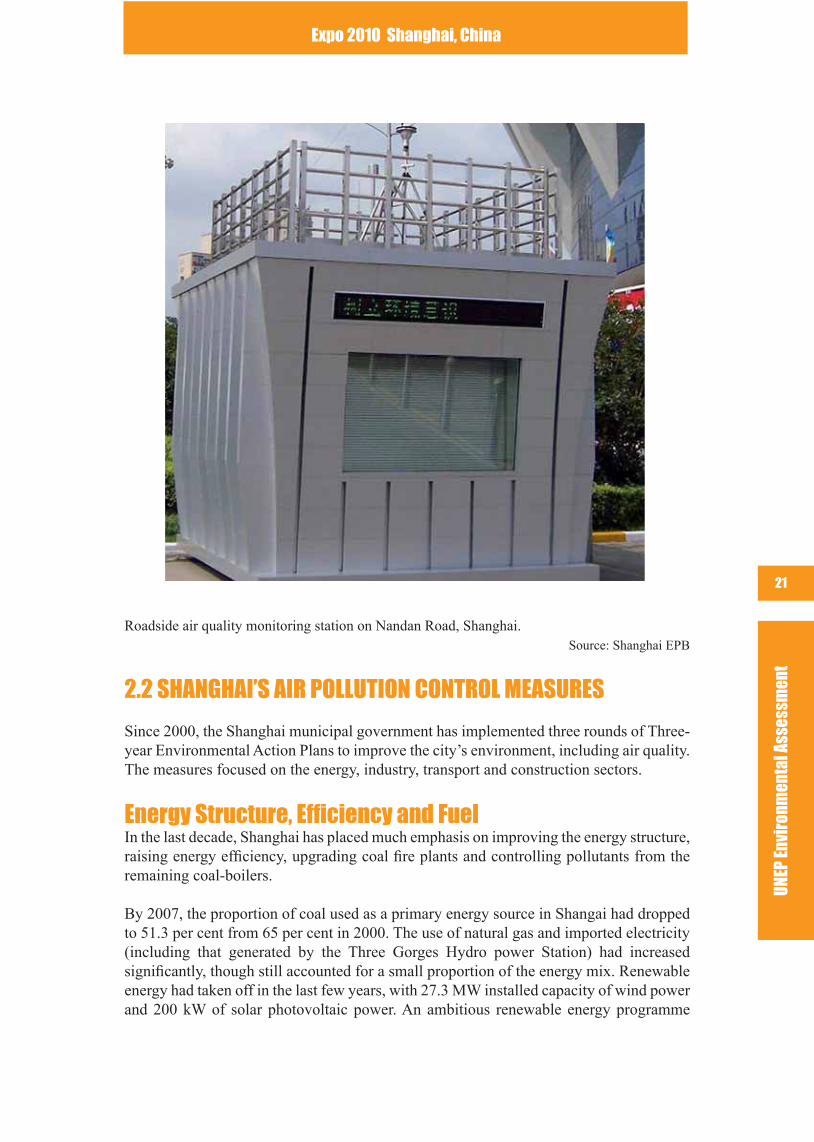
Roadside air quality monitoring station on Nandan Road, Shanghai.Source: Shanghai EPB
2.2 SHANGHAI’S AIR POLLUTION CONTROL MEASURES
Since 2000, the Shanghai municipal government has implemented three rounds of Three-year Environmental Action Plans to improve the city’s environment, including air quality. The measures focused on the energy, industry, transport and construction sectors.
Energy Structure, Efficiency and FuelIn the last decade, Shanghai has placed much emphasis on improving the energy structure, raising energy efciency, upgrading coal re plants and controlling pollutants from the remaining coal-boilers.
By 2007, the proportion of coal used as a primary energy source in Shangai had dropped to 51.3 per cent from 65 per cent in 2000. The use of natural gas and imported electricity (including that generated by the Three Gorges Hydro power Station) had increased signicantly, though still accounted for a small proportion of the energy mix. Renewable energy had taken off in the last few years, with 27.3 MW installed capacity of wind power and 200 kW of solar photovoltaic power. An ambitious renewable energy programme
UNEP
Env
iron
men
tal A
sses
smen
tExpo 2010 Shanghai, China
22
had been carried out, the outcome of which would be more visible by 2010. (See the chapter on Energy for more details).
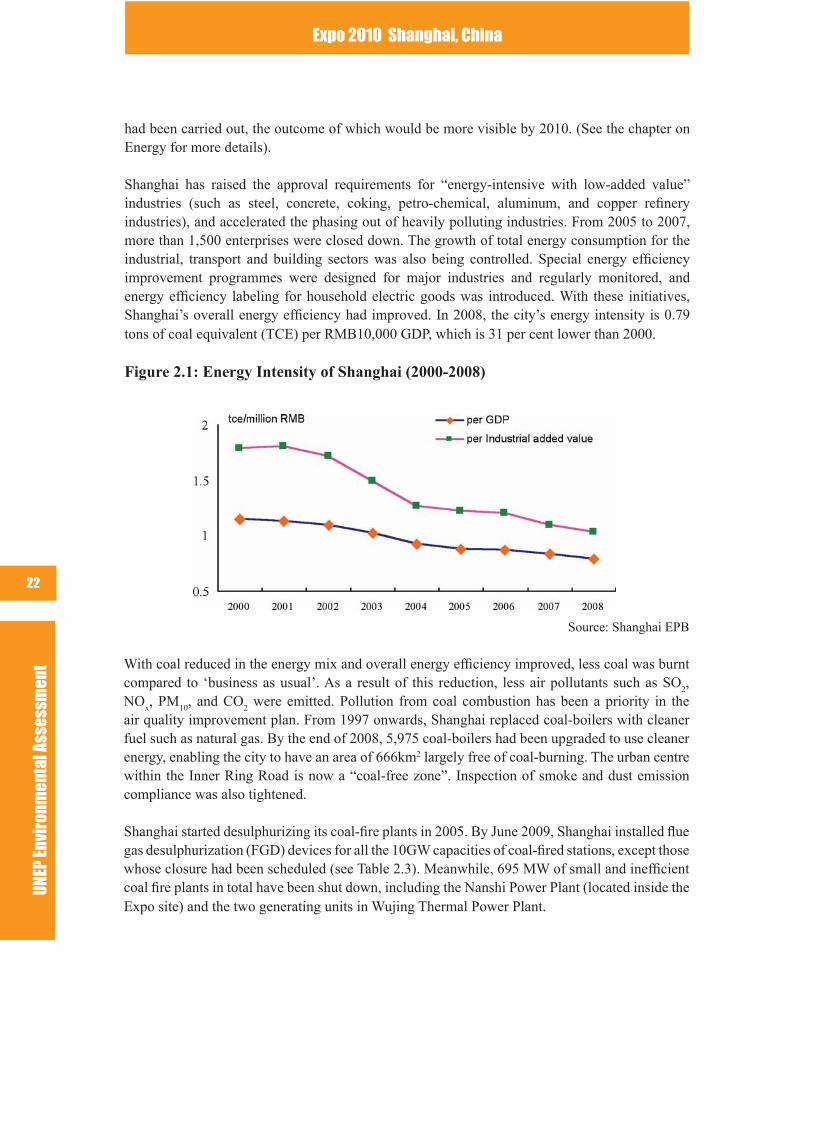
Shanghai has raised the approval requirements for “energy-intensive with low-added value” industries (such as steel, concrete, coking, petro-chemical, aluminum, and copper renery industries), and accelerated the phasing out of heavily polluting industries. From 2005 to 2007, more than 1,500 enterprises were closed down. The growth of total energy consumption for the industrial, transport and building sectors was also being controlled. Special energy efciency improvement programmes were designed for major industries and regularly monitored, and energy efciency labeling for household electric goods was introduced. With these initiatives, Shanghai’s overall energy efciency had improved. In 2008, the city’s energy intensity is 0.79 tons of coal equivalent (TCE) per RMB10,000 GDP, which is 31 per cent lower than 2000.
Figure 2.1: Energy Intensity of Shanghai (2000-2008)
Source: Shanghai EPB
With coal reduced in the energy mix and overall energy efciency improved, less coal was burnt compared to ‘business as usual’. As a result of this reduction, less air pollutants such as SO
2,
NOx, PM
10, and CO
2 were emitted. Pollution from coal combustion has been a priority in the
air quality improvement plan. From 1997 onwards, Shanghai replaced coal-boilers with cleaner fuel such as natural gas. By the end of 2008, 5,975 coal-boilers had been upgraded to use cleaner energy, enabling the city to have an area of 666km2 largely free of coal-burning. The urban centre within the Inner Ring Road is now a “coal-free zone”. Inspection of smoke and dust emission compliance was also tightened.
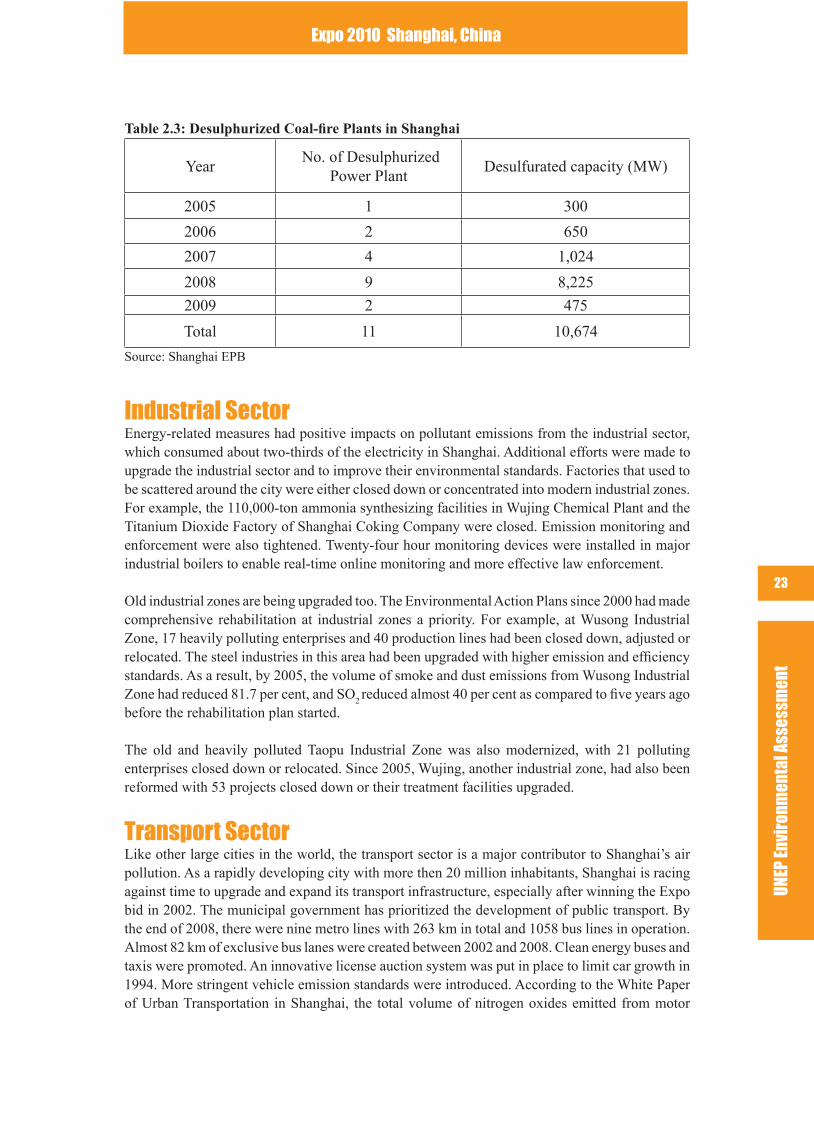
Shanghai started desulphurizing its coal-re plants in 2005. By June 2009, Shanghai installed ue gas desulphurization (FGD) devices for all the 10GW capacities of coal-red stations, except those whose closure had been scheduled (see Table 2.3). Meanwhile, 695 MW of small and inefcient coal re plants in total have been shut down, including the Nanshi Power Plant (located inside the Expo site) and the two generating units in Wujing Thermal Power Plant.
UNEP
Env
iron
men
tal A
sses
smen
t
Expo 2010 Shanghai, China
23
Table 2.3: Desulphurized Coal-re Plants in Shanghai
Year No. of Desulphurized
Power PlantDesulfurated capacity (MW)
2005 1 300
2006 2 650
2007 4 1,024
2008 9 8,225
2009 2 475
Total 11 10,674
Source: Shanghai EPB
Industrial SectorEnergy-related measures had positive impacts on pollutant emissions from the industrial sector, which consumed about two-thirds of the electricity in Shanghai. Additional efforts were made to upgrade the industrial sector and to improve their environmental standards. Factories that used to be scattered around the city were either closed down or concentrated into modern industrial zones. For example, the 110,000-ton ammonia synthesizing facilities in Wujing Chemical Plant and the Titanium Dioxide Factory of Shanghai Coking Company were closed. Emission monitoring and enforcement were also tightened. Twenty-four hour monitoring devices were installed in major industrial boilers to enable real-time online monitoring and more effective law enforcement.
Old industrial zones are being upgraded too. The Environmental Action Plans since 2000 had made comprehensive rehabilitation at industrial zones a priority. For example, at Wusong Industrial Zone, 17 heavily polluting enterprises and 40 production lines had been closed down, adjusted or relocated. The steel industries in this area had been upgraded with higher emission and efciency standards. As a result, by 2005, the volume of smoke and dust emissions from Wusong Industrial Zone had reduced 81.7 per cent, and SO
2 reduced almost 40 per cent as compared to ve years ago
before the rehabilitation plan started.
The old and heavily polluted Taopu Industrial Zone was also modernized, with 21 polluting enterprises closed down or relocated. Since 2005, Wujing, another industrial zone, had also been reformed with 53 projects closed down or their treatment facilities upgraded.
Transport SectorLike other large cities in the world, the transport sector is a major contributor to Shanghai’s air pollution. As a rapidly developing city with more then 20 million inhabitants, Shanghai is racing against time to upgrade and expand its transport infrastructure, especially after winning the Expo bid in 2002. The municipal government has prioritized the development of public transport. By the end of 2008, there were nine metro lines with 263 km in total and 1058 bus lines in operation. Almost 82 km of exclusive bus lanes were created between 2002 and 2008. Clean energy buses and taxis were promoted. An innovative license auction system was put in place to limit car growth in 1994. More stringent vehicle emission standards were introduced. According to the White Paper of Urban Transportation in Shanghai, the total volume of nitrogen oxides emitted from motor
UNEP
Env
iron
men
tal A
sses
smen
tExpo 2010 Shanghai, China
24
vehicles in 2005 reduced by 40 per cent compared to 2000 levels. Inspection and maintenance of in-use vehicles has been strengthened. These and other measures will be discussed in more detail in the chapter on Transport.
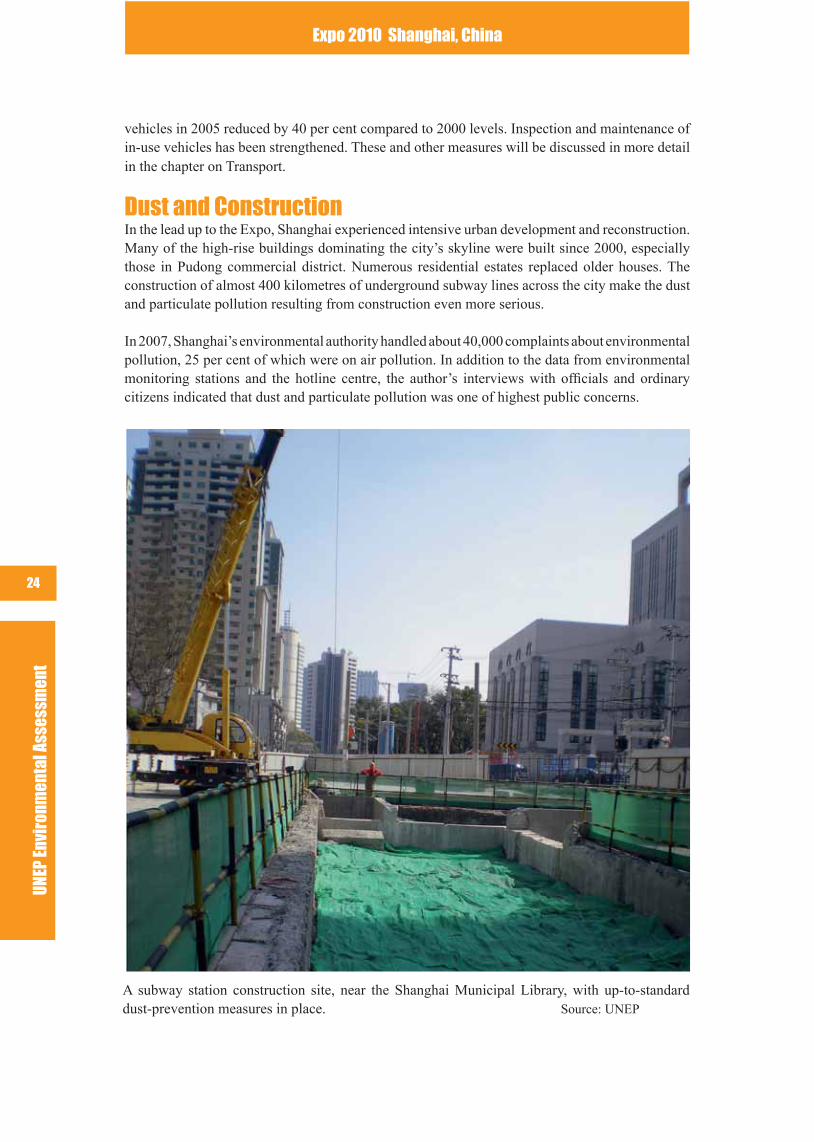
Dust and ConstructionIn the lead up to the Expo, Shanghai experienced intensive urban development and reconstruction. Many of the high-rise buildings dominating the city’s skyline were built since 2000, especially those in Pudong commercial district. Numerous residential estates replaced older houses. The construction of almost 400 kilometres of underground subway lines across the city make the dust and particulate pollution resulting from construction even more serious.
In 2007, Shanghai’s environmental authority handled about 40,000 complaints about environmental pollution, 25 per cent of which were on air pollution. In addition to the data from environmental monitoring stations and the hotline centre, the author’s interviews with ofcials and ordinary citizens indicated that dust and particulate pollution was one of highest public concerns.
A subway station construction site, near the Shanghai Municipal Library, with up-to-standard dust-prevention measures in place. Source: UNEP
UNEP
Env
iron
men
tal A
sses
smen
t
Expo 2010 Shanghai, China
25
The municipality implemented various measures to reduce construction and roadside dust pollution. Better management and supervision of construction sites had been introduced, including requirements on the covering or containment of idle soil, cement, and construction waste. Yet, while large-scale or key construction sites had a better record of compliance, those smaller or remote ones continued to be a concern. The author had seen quite a few sites failing to follow the strict requirements during the construction rush before the Expo.
2.3 ANNUAL TRENDS IN AIR QUALITY
In order to assess the impact of these measures, an analysis of the ambient air quality monitoring data provided by SEMC was undertaken for this report. The analysis looked at the four main pollutants (PM
10, SO
2, NO
2 and CO) commonly monitored and evaluated in China. Additional
attention was paid to the historical data of smoke-and-dust, industrial dust and total suspended particulates (TSP).
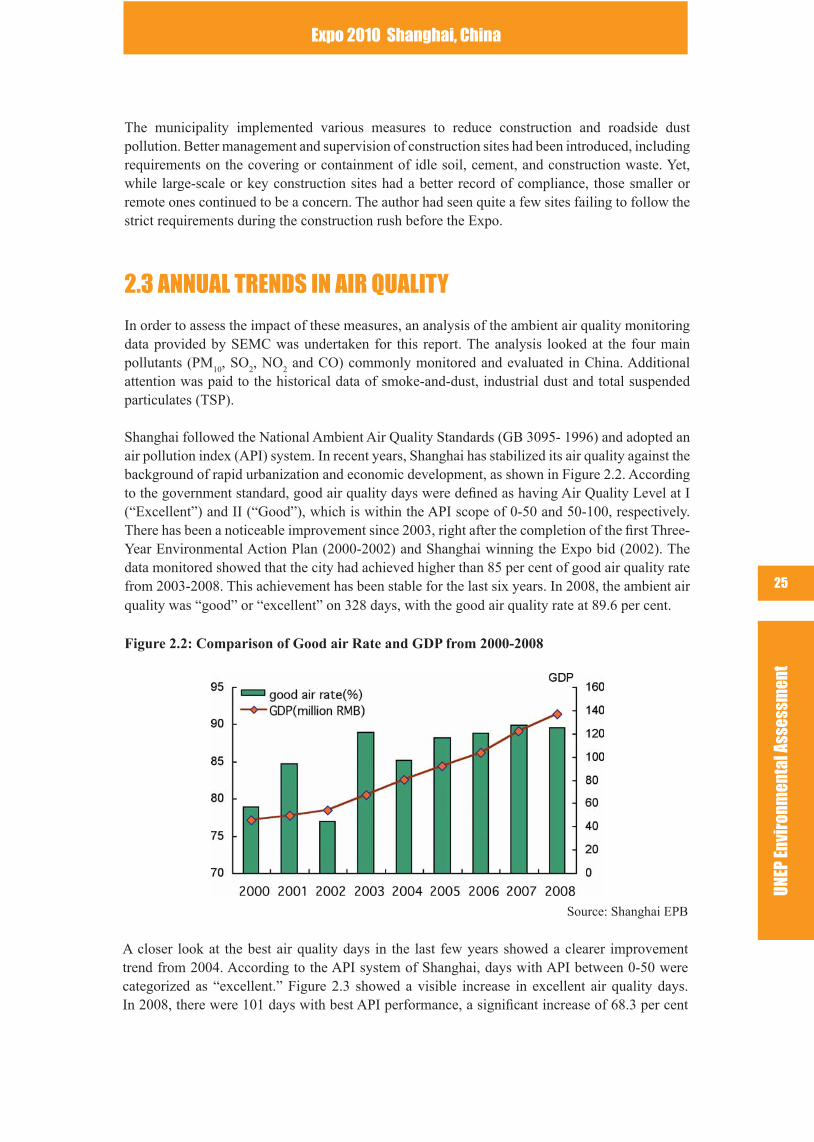
Shanghai followed the National Ambient Air Quality Standards (GB 3095- 1996) and adopted an air pollution index (API) system. In recent years, Shanghai has stabilized its air quality against the background of rapid urbanization and economic development, as shown in Figure 2.2. According to the government standard, good air quality days were dened as having Air Quality Level at I (“Excellent”) and II (“Good”), which is within the API scope of 0-50 and 50-100, respectively. There has been a noticeable improvement since 2003, right after the completion of the rst Three-Year Environmental Action Plan (2000-2002) and Shanghai winning the Expo bid (2002). The data monitored showed that the city had achieved higher than 85 per cent of good air quality rate from 2003-2008. This achievement has been stable for the last six years. In 2008, the ambient air quality was “good” or “excellent” on 328 days, with the good air quality rate at 89.6 per cent.
Figure 2.2: Comparison of Good air Rate and GDP from 2000-2008
Source: Shanghai EPB
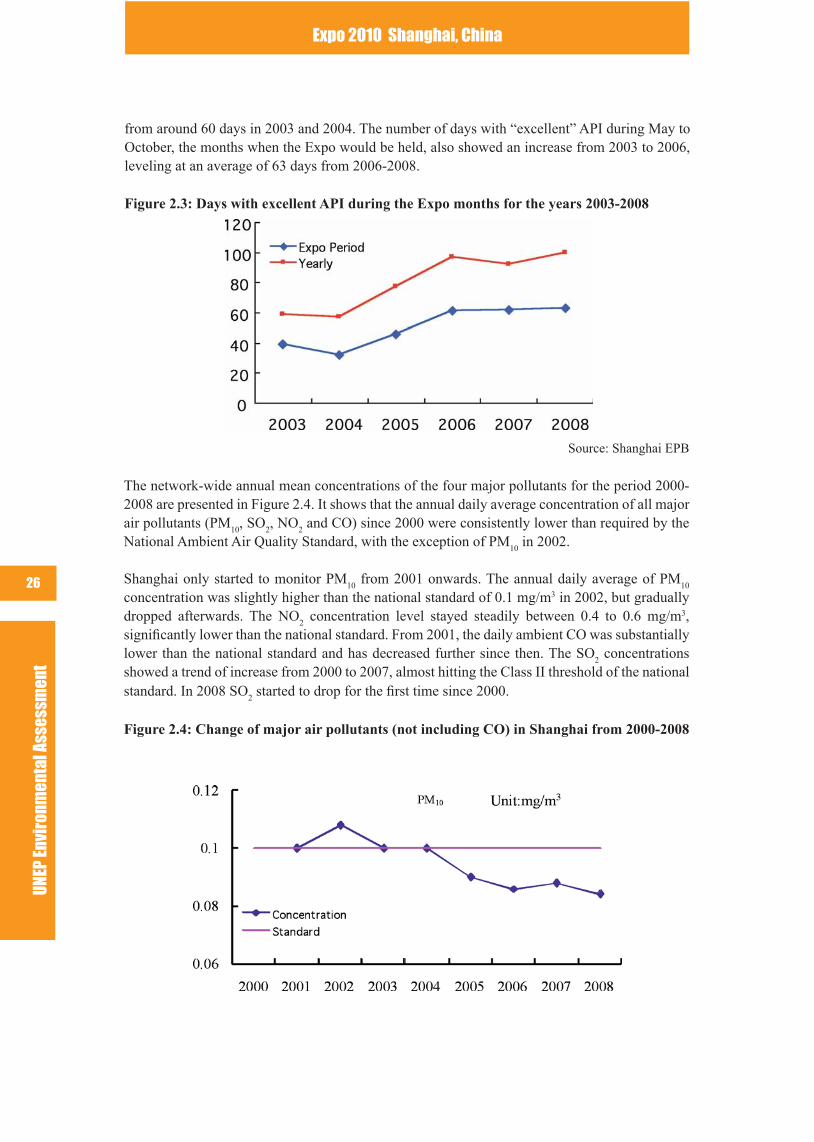
A closer look at the best air quality days in the last few years showed a clearer improvement trend from 2004. According to the API system of Shanghai, days with API between 0-50 were categorized as “excellent.” Figure 2.3 showed a visible increase in excellent air quality days. In 2008, there were 101 days with best API performance, a signicant increase of 68.3 per cent
UNEP
Env
iron
men
tal A
sses
smen
tExpo 2010 Shanghai, China
26
from around 60 days in 2003 and 2004. The number of days with “excellent” API during May to October, the months when the Expo would be held, also showed an increase from 2003 to 2006, leveling at an average of 63 days from 2006-2008.
Figure 2.3: Days with excellent API during the Expo months for the years 2003-2008
Source: Shanghai EPB
The network-wide annual mean concentrations of the four major pollutants for the period 2000-2008 are presented in Figure 2.4. It shows that the annual daily average concentration of all major air pollutants (PM
10, SO
2, NO
2 and CO) since 2000 were consistently lower than required by the
National Ambient Air Quality Standard, with the exception of PM10
in 2002.
Shanghai only started to monitor PM10
from 2001 onwards. The annual daily average of PM10
concentration was slightly higher than the national standard of 0.1 mg/m3 in 2002, but gradually dropped afterwards. The NO
2 concentration level stayed steadily between 0.4 to 0.6 mg/m3,
signicantly lower than the national standard. From 2001, the daily ambient CO was substantially lower than the national standard and has decreased further since then. The SO
2 concentrations
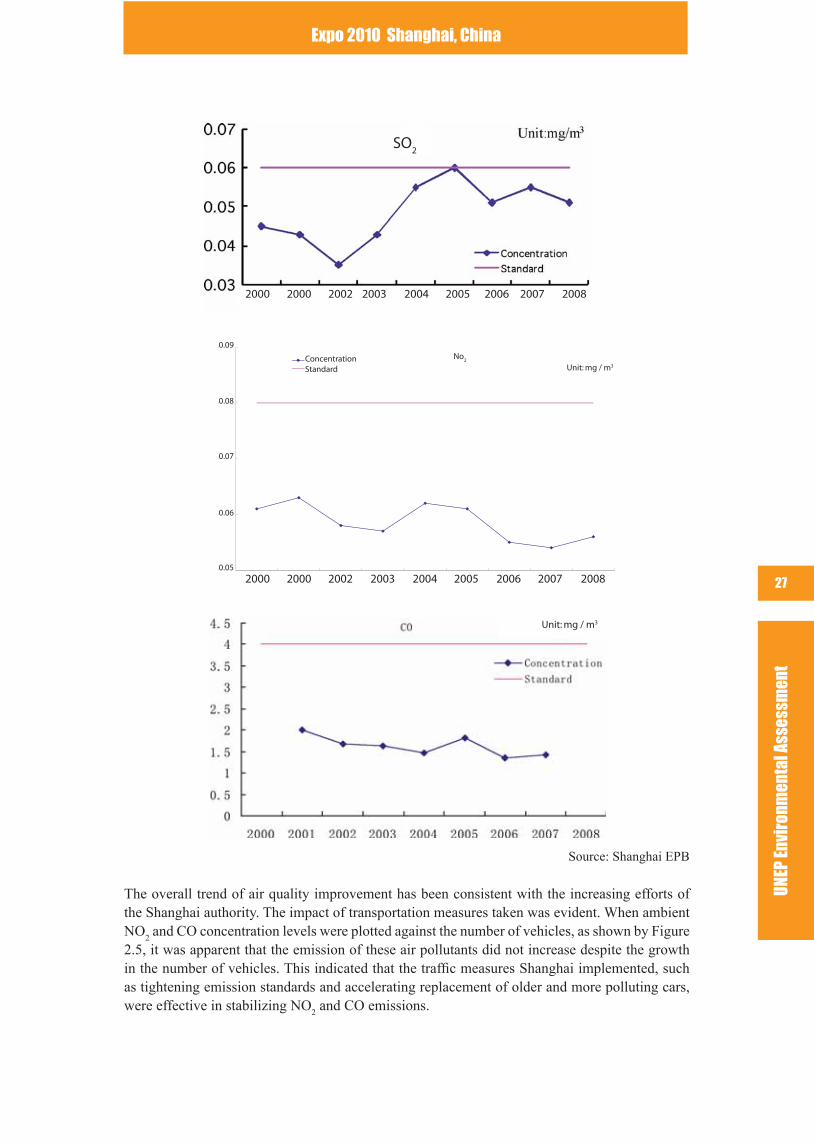
showed a trend of increase from 2000 to 2007, almost hitting the Class II threshold of the national standard. In 2008 SO
2 started to drop for the rst time since 2000.
Figure 2.4: Change of major air pollutants (not including CO) in Shanghai from 2000-2008
UNEP
Env
iron
men
tal A
sses
smen
t
Expo 2010 Shanghai, China
27
NO2
0.05
0.06
0.07
0.08
0.09
2000 2001 2002 2003 2004 2005 2006 2007 2008
Unit:mg/m3ConcentrationStandard
Source: Shanghai EPB
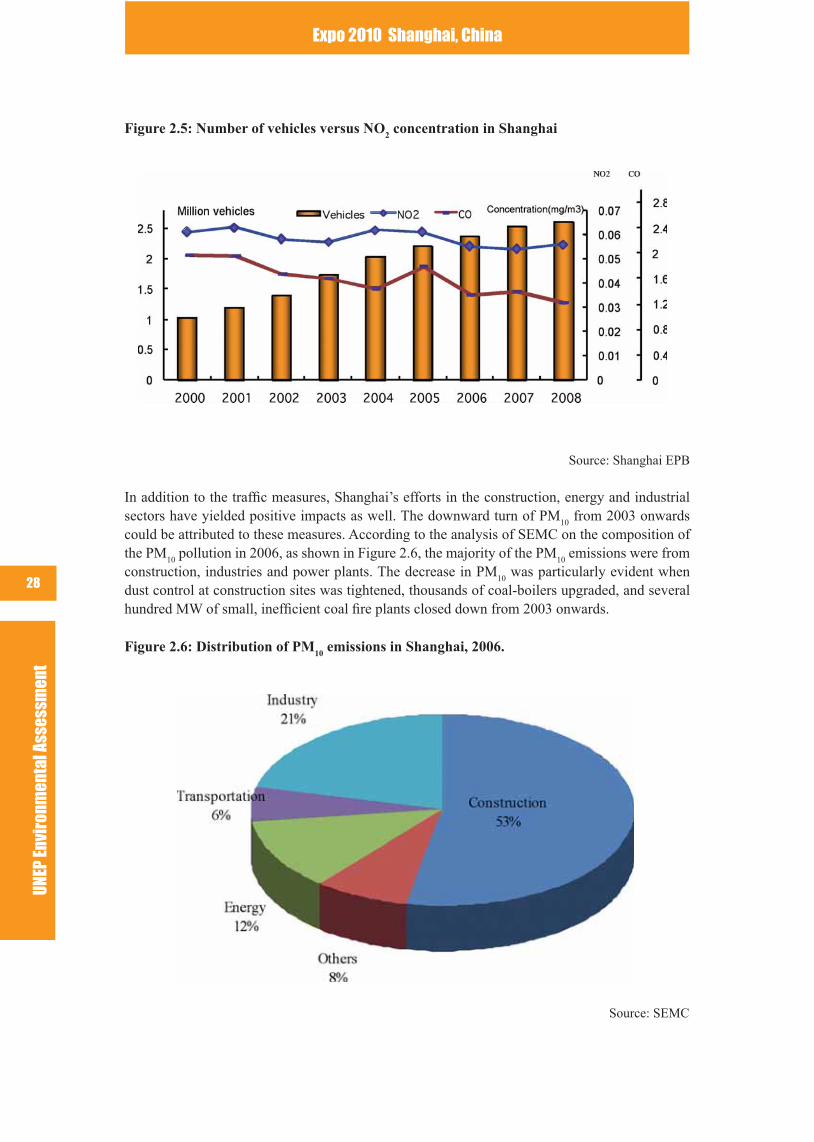
The overall trend of air quality improvement has been consistent with the increasing efforts of the Shanghai authority. The impact of transportation measures taken was evident. When ambient NO
2 and CO concentration levels were plotted against the number of vehicles, as shown by Figure
2.5, it was apparent that the emission of these air pollutants did not increase despite the growth in the number of vehicles. This indicated that the trafc measures Shanghai implemented, such as tightening emission standards and accelerating replacement of older and more polluting cars, were effective in stabilizing NO
2 and CO emissions.
SO2
2000
2000
0.05
0.06
0.07
0.08
0.09No
2
Unit: mg / m3
Unit: mg / m3
ConcentrationStandard
2000
2000
2002
2002
2003
2003
2004
2004
2005
2005
2006
2006
2007
2007
2008
2008
UNEP
Env
iron
men
tal A
sses
smen
tExpo 2010 Shanghai, China
28
Figure 2.5: Number of vehicles versus NO2 concentration in Shanghai
Source: Shanghai EPB
In addition to the trafc measures, Shanghai’s efforts in the construction, energy and industrial sectors have yielded positive impacts as well. The downward turn of PM
10 from 2003 onwards
could be attributed to these measures. According to the analysis of SEMC on the composition of the PM
10 pollution in 2006, as shown in Figure 2.6, the majority of the PM
10 emissions were from
construction, industries and power plants. The decrease in PM10
was particularly evident when dust control at construction sites was tightened, thousands of coal-boilers upgraded, and several hundred MW of small, inefcient coal re plants closed down from 2003 onwards.
Figure 2.6: Distribution of PM10
emissions in Shanghai, 2006.
Source: SEMC
UNEP
Env
iron
men
tal A
sses
smen
t
Expo 2010 Shanghai, China
29
sq m
g/m
3
1986
1987
1988
1989
1990
1991
1992
1993
1994
1995
1996
1997
1998
1999
2000
2001
2002
2003
2004
2005
2006
2007
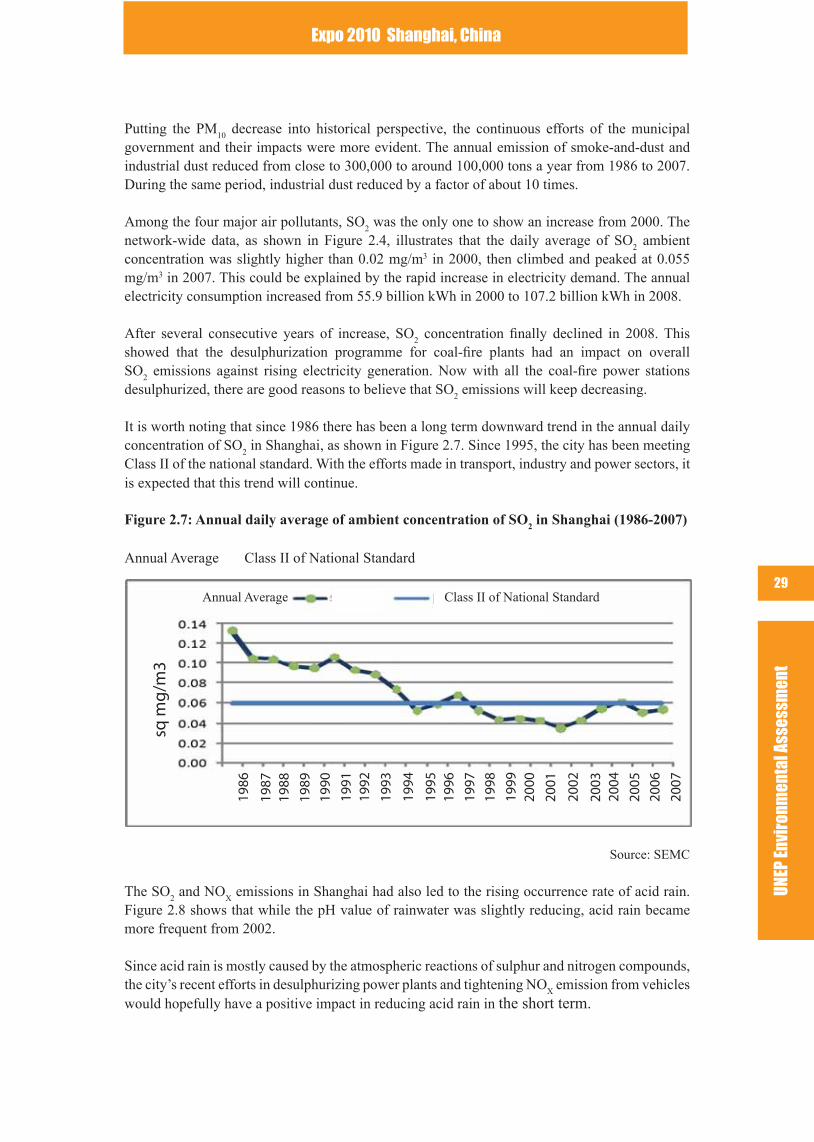
Putting the PM10
decrease into historical perspective, the continuous efforts of the municipal government and their impacts were more evident. The annual emission of smoke-and-dust and industrial dust reduced from close to 300,000 to around 100,000 tons a year from 1986 to 2007. During the same period, industrial dust reduced by a factor of about 10 times.
Among the four major air pollutants, SO2 was the only one to show an increase from 2000. The
network-wide data, as shown in Figure 2.4, illustrates that the daily average of SO2 ambient
concentration was slightly higher than 0.02 mg/m3 in 2000, then climbed and peaked at 0.055 mg/m3 in 2007. This could be explained by the rapid increase in electricity demand. The annual electricity consumption increased from 55.9 billion kWh in 2000 to 107.2 billion kWh in 2008.
After several consecutive years of increase, SO2 concentration nally declined in 2008. This
showed that the desulphurization programme for coal-re plants had an impact on overall SO
2 emissions against rising electricity generation. Now with all the coal-re power stations
desulphurized, there are good reasons to believe that SO2 emissions will keep decreasing.
It is worth noting that since 1986 there has been a long term downward trend in the annual daily concentration of SO
2 in Shanghai, as shown in Figure 2.7. Since 1995, the city has been meeting
Class II of the national standard. With the efforts made in transport, industry and power sectors, it is expected that this trend will continue.
Figure 2.7: Annual daily average of ambient concentration of SO2 in Shanghai (1986-2007)
Annual Average Class II of National Standard
Source: SEMC
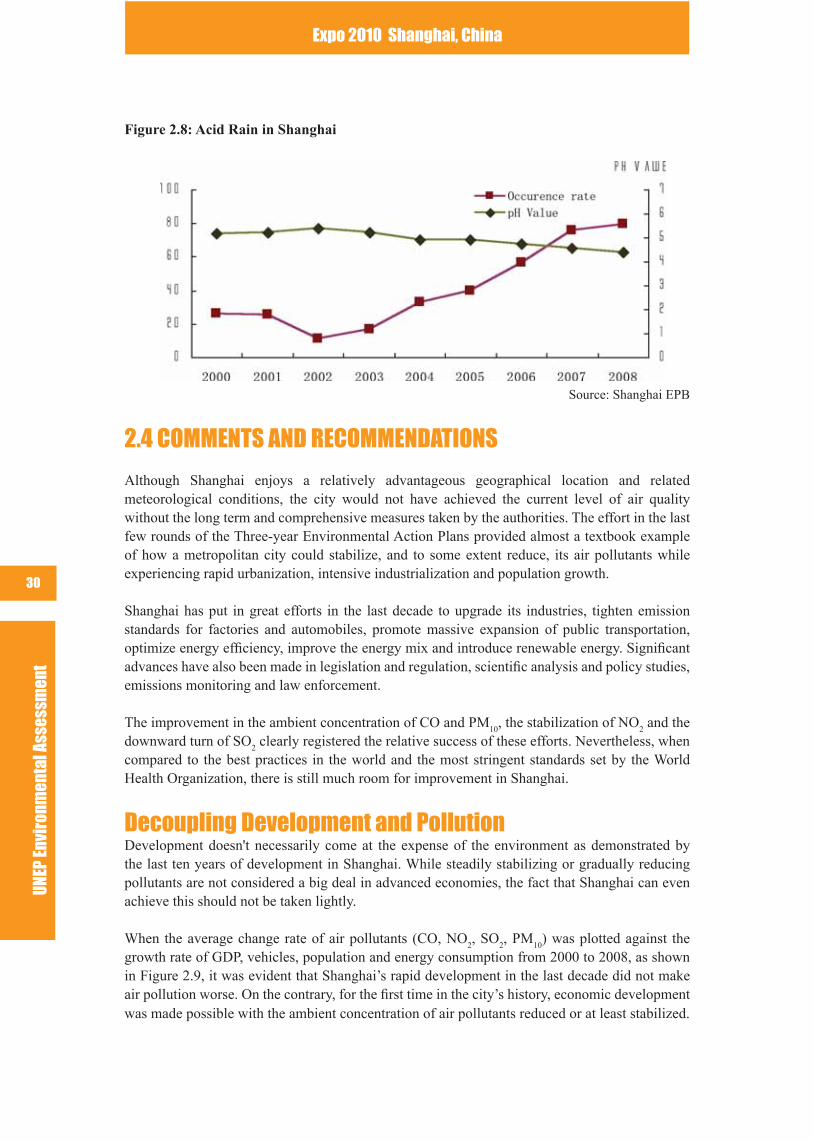
The SO2 and NO
X emissions in Shanghai had also led to the rising occurrence rate of acid rain.
Figure 2.8 shows that while the pH value of rainwater was slightly reducing, acid rain became more frequent from 2002.
Since acid rain is mostly caused by the atmospheric reactions of sulphur and nitrogen compounds, the city’s recent efforts in desulphurizing power plants and tightening NO
X emission from vehicles
would hopefully have a positive impact in reducing acid rain in the short term.
Annual Average Class II of National Standard
UNEP
Env
iron
men
tal A
sses
smen
tExpo 2010 Shanghai, China
30
Figure 2.8: Acid Rain in Shanghai
Source: Shanghai EPB
2.4 COMMENTS AND RECOMMENDATIONS
Although Shanghai enjoys a relatively advantageous geographical location and related meteorological conditions, the city would not have achieved the current level of air quality without the long term and comprehensive measures taken by the authorities. The effort in the last few rounds of the Three-year Environmental Action Plans provided almost a textbook example of how a metropolitan city could stabilize, and to some extent reduce, its air pollutants while experiencing rapid urbanization, intensive industrialization and population growth.
Shanghai has put in great efforts in the last decade to upgrade its industries, tighten emission standards for factories and automobiles, promote massive expansion of public transportation, optimize energy efciency, improve the energy mix and introduce renewable energy. Signicant advances have also been made in legislation and regulation, scientic analysis and policy studies, emissions monitoring and law enforcement.
The improvement in the ambient concentration of CO and PM10
, the stabilization of NO2 and the
downward turn of SO2 clearly registered the relative success of these efforts. Nevertheless, when
compared to the best practices in the world and the most stringent standards set by the World Health Organization, there is still much room for improvement in Shanghai.
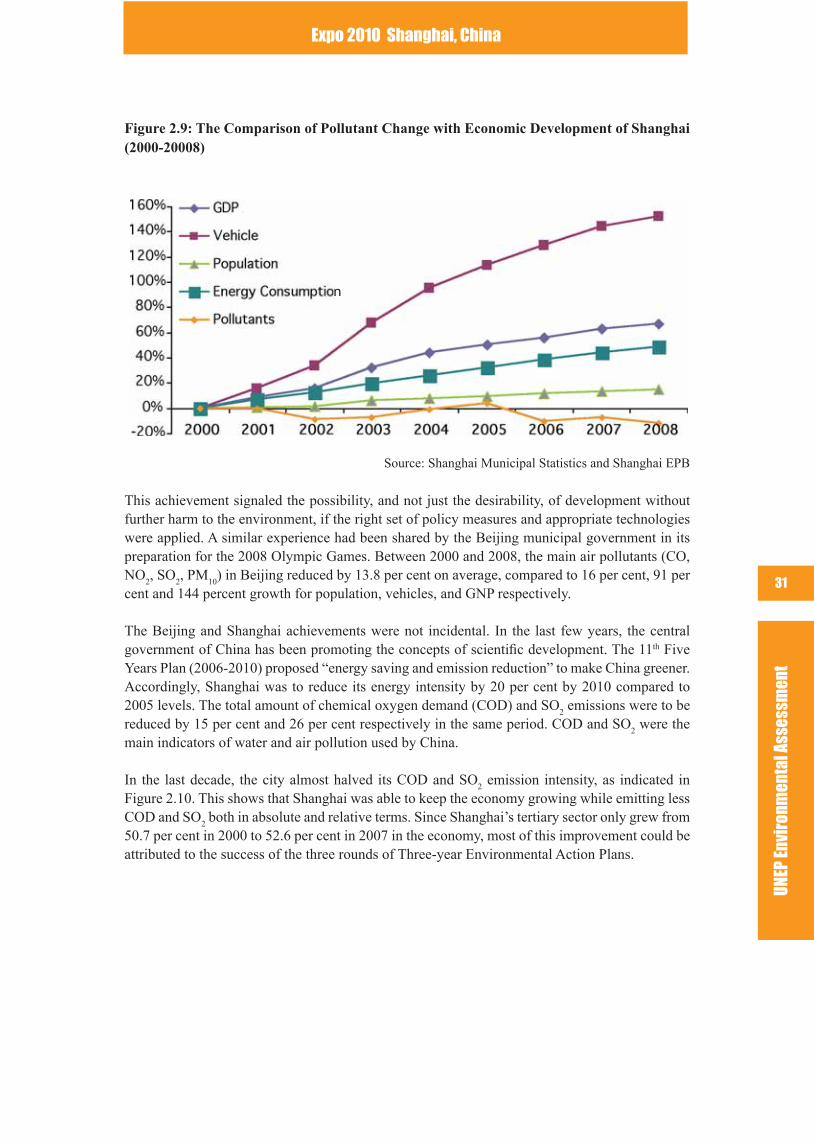
Decoupling Development and PollutionDevelopment doesn't necessarily come at the expense of the environment as demonstrated by the last ten years of development in Shanghai. While steadily stabilizing or gradually reducing pollutants are not considered a big deal in advanced economies, the fact that Shanghai can even achieve this should not be taken lightly.
When the average change rate of air pollutants (CO, NO2, SO
2, PM
10) was plotted against the
growth rate of GDP, vehicles, population and energy consumption from 2000 to 2008, as shown in Figure 2.9, it was evident that Shanghai’s rapid development in the last decade did not make air pollution worse. On the contrary, for the rst time in the city’s history, economic development was made possible with the ambient concentration of air pollutants reduced or at least stabilized.
UNEP
Env
iron
men
tal A
sses
smen
t
Expo 2010 Shanghai, China
31
Figure 2.9: The Comparison of Pollutant Change with Economic Development of Shanghai (2000-20008)
Source: Shanghai Municipal Statistics and Shanghai EPB
This achievement signaled the possibility, and not just the desirability, of development without further harm to the environment, if the right set of policy measures and appropriate technologies were applied. A similar experience had been shared by the Beijing municipal government in its preparation for the 2008 Olympic Games. Between 2000 and 2008, the main air pollutants (CO, NO
2, SO
2, PM
10) in Beijing reduced by 13.8 per cent on average, compared to 16 per cent, 91 per
cent and 144 percent growth for population, vehicles, and GNP respectively.
The Beijing and Shanghai achievements were not incidental. In the last few years, the central government of China has been promoting the concepts of scientic development. The 11th Five Years Plan (2006-2010) proposed “energy saving and emission reduction” to make China greener. Accordingly, Shanghai was to reduce its energy intensity by 20 per cent by 2010 compared to 2005 levels. The total amount of chemical oxygen demand (COD) and SO
2 emissions were to be
reduced by 15 per cent and 26 per cent respectively in the same period. COD and SO2 were the
main indicators of water and air pollution used by China.
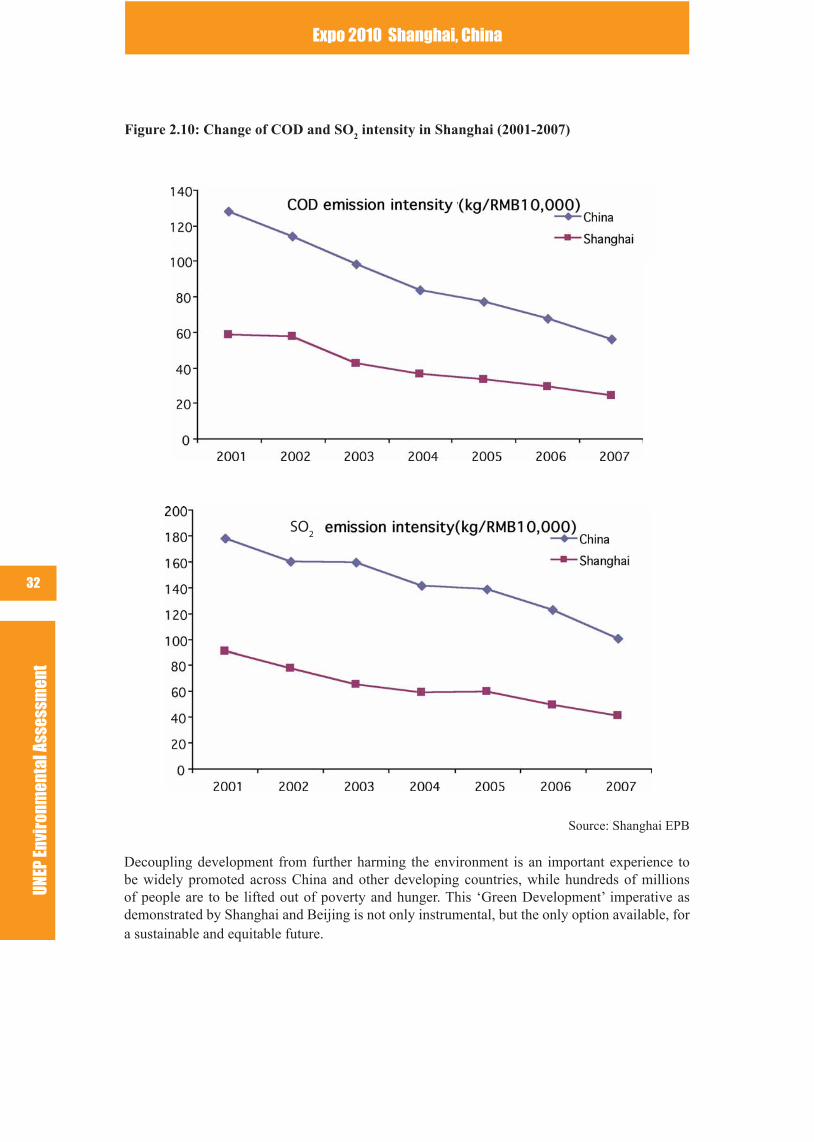
In the last decade, the city almost halved its COD and SO2 emission intensity, as indicated in
Figure 2.10. This shows that Shanghai was able to keep the economy growing while emitting less COD and SO
2 both in absolute and relative terms. Since Shanghai’s tertiary sector only grew from
50.7 per cent in 2000 to 52.6 per cent in 2007 in the economy, most of this improvement could be attributed to the success of the three rounds of Three-year Environmental Action Plans.
n
UNEP
Env
iron
men
tal A
sses
smen
tExpo 2010 Shanghai, China
32
Figure 2.10: Change of COD and SO2 intensity in Shanghai (2001-2007)
Source: Shanghai EPB
Decoupling development from further harming the environment is an important experience to be widely promoted across China and other developing countries, while hundreds of millions of people are to be lifted out of poverty and hunger. This ‘Green Development’ imperative as demonstrated by Shanghai and Beijing is not only instrumental, but the only option available, for a sustainable and equitable future.
SO2
UNEP
Env
iron
men
tal A
sses
smen
t
Expo 2010 Shanghai, China
33
Expo as a Catalyst The 2010 Expo accelerated Shanghai’s long term efforts in improving air quality and provided additional momentum to strengthen various environmental initiatives. Shanghai started to tackle its pollution problem in the 1980s. But it was not until 2000, and especially after the Expo bid was won, that the Government demonstrated unprecedented political determination, matched with impressive nancial investment and backed up by scientic and technological capacity.
Examples of political leadership include a) the persistence in enforcing the car- license auctioning mechanism which effectively controlled the growth of vehicles, b) the ambitious construction of one of the world’s most modern subway systems in less than a decade, which required extensive urban renewal, c) the swift upgrading of automobile emission standards to Euro IV (see the chapter on Transport for details), as well as the 100 per cent desulphurization of the city’s coal-re capacities in a matter of just three years.
The cutting edge 100MW offshore wind farm and the various solar PV power plants would also not have been possible without the visionary policy and nancial support of the government. The removal of all coal boilers in the urban centre, the city-wide upgrading of factories, the rehabilitation of the old industrial zones and the promotion of circular economy and clean production all requires leadership, money and technological support. It was clear that Expo 2010 provided an opportunity for Shanghai to speed up and scale up its environmental initiatives.
Regional CollaborationShanghai has done a lot to curb air pollutants from its smoke stacks and exhaust pipes. However, pollutants from stationary sources in nearby areas also affect Shanghai under certain meteorological conditions, not to mention the large volume of incoming motor vehicles from neighbouring provinces every day. Clearly, it is insufcient to just tackle the problem from within Shanghai.
The Yangtze River Delta region includes Shanghai and its neighbouring provinces Zhejiang and Jiangsu. The region, an area of 99,600 km2 and with a population of 80 million, is one of the world’s most urbanized, with dozens of cities, including fast growing ones, such as Nanjiang, Hangzhou, Suzhou, and Wuxi. It is also one of the main powerhouses of China’s economic spectacle, contributing to about one fth of the country’s GDP.
Shanghai currently has higher emission standards for factories, power plants, and cars than Zhejiang and Jiangsu. Better regional cooperation would be needed in order to close these gaps. In December 2008, the three local governments signed the Agreement on Environmental Protection Cooperation of the Yangtze River Delta (2009-2010), which outlined regional measures such as raising the environmental threshold for industry start-ups, standardizing emission standards, and strengthening region-wide air pollution control.
This rst comprehensive cooperation plan for the region would require all existing coal-re plants to be desulphurized by 2010. No additional coal-re plants would be approved. The Euro III emission standard for cars would also be promoted across the region.
Although regional cooperation could have started earlier, the Shanghai municipal government now appears to fully recognize the importance of bringing its neighbours onboard for tighter pollution control. The effectiveness of this plan and how successful Shanghai will be as the environmental trend-setter in the region remains to be seen.
UNEP
Env
iron
men
tal A
sses
smen
tExpo 2010 Shanghai, China
34
More specically, for Shanghai to ensure good air quality during the few months of the Expo, it is important for the city to speed up its collaboration with Zhejiang and Jiangsu to map pollution sources. This study has to cover not just the four main pollutants (SO
2, PM
10, CO and NO
2), but
also others such as volatile organic compounds (VOC) and PM2.5
, as well as their interactions and the resulting secondary pollution such as ground level ozone. A regional action plan based on the study should also be developed and ready for implementation.
The regional haze in eastern China, which may affect the Expo, should also be studied. Regional haze, formed by air pollutants under certain meteorological conditions, impairs visibility over a large area, and is known to travel a distance. Visual clarity is not only good for the tens of millions of visitors Shanghai is expecting for the Expo, the corresponding good air quality is vital to the health and quality of life for the 80 million people living in the region.
Beijing’s experience in the preparation of the Olympics provided useful insights for Shanghai. Beijing started in early 2000 to work with its neighbours to develop a modeling study on regional air pollution. Region-wide, multi-stage and long term pollution control strategies and short term emergency plans were developed based on this study. Shanghai could benet from this experience and develop a similar action plan in time for the Expo.
Ongoing Improvement of Monitoring Standards and ScopeAir pollution is an ongoing problem which requires ongoing improvement of standards and targets, as well as an expansion of scope.
Currently the Chinese air quality monitoring system only sets standards for CO, NO2, PM
10 and
SO2. It is important for Shanghai and other Chinese cities to start monitoring and controlling the
emissions of other air pollutants such as Ozone (O3), VOCs and PM
2.5. This has been recommended
by the assessment reports on the environmental efforts of Beijing for the 2008 Olympics by both UNEP and the NGO Greenpeace.
While Shanghai has demonstrated impressive progress in reducing the primary pollutant of concern, more complicated air pollutants such as heavy metals and persistent organic pollutants (POPs) should not be ignored.
Further improvements on SO2 and PM
10
Shanghai could seek to be a leading Chinese city by strengthening its long term air pollution control strategies. Comparing the latest WHO guideline in 2005, there is still room for improvement for reducing the ambient concentrations of both SO
2 and PM
10 in Shanghai.
OzoneOzone is a health threat causing respiratory problems and the primary constituent of photochemical smog. During the summer months, which is when the Expo will be held, ozone as a secondary pollutant is more of a problem resulting from the interaction between sunlight, nitrogen oxide (NO
x) and VOCs in the atmosphere.
Currently, ozone is not monitored as an air pollutant in China. Recognizing that ozone is increasingly a problem, especially with the growing number of motor vehicles, SEMC started pilot studies in developing monitoring capacity and evaluation methods for ozone. Some of the stations have been collecting data on a regular basis.
UNEP
Env
iron
men
tal A
sses
smen
t
Expo 2010 Shanghai, China
35
However, in order to enable cities like Shanghai to include ozone in their daily monitoring system, the central government has to overcome technical hurdles for quality assurance of monitoring, set evaluation criteria and targets, develop technical standards for ozone monitoring, and issue guidelines for location selection of stations.
Since VOCs are a major determining factor for ozone, it is recommended that Shanghai takes proactive measures to control their emission. It is encouraging to see that Shanghai has started to tackle VOCs from gas stations and utilize methane (CH
4), one of the VOCs, from landlls for
electricity generation.
As analyzed earlier, Shanghai’s air pollution measures on trafc has already yielded positive results especially on reducing NO
2. The Government could further reduce NOx emission by
requesting de-nitrication to be installed in power plants to remove the pollutant from ue gas. These measures would also help to reduce acid rain.
PM2.5
Another air pollutant arousing increasing public health concern is PM2.5
, particulate matter with a diametre smaller than 2.5 micrometre. A WHO report in 2005, calls regulators to pay attention to the health hazards including heart disease, altered lung function and lung cancer resulting from over exposure to PM
2.5.
China currently has not set any environment quality standard for PM2.5,
and does not require cities to monitor it. After the Olympics, Beijing planed to monitor PM
2.5, acting on the recommendations
from the UNEP and Greenpeace reports. The scientic capacity for PM2.5
, monitoring in Shanghai is still at an early stage according to SMEC. Considering the adverse health impact of PM
2.5, it is
recommended that the city speeds up monitoring and design reduction plans.
PM2.5
, is produced from vehicle emissions and combustion of fossil fuel in factories and power PM
2.5, However, without on-going monitoring and evaluation of the pollutant, it is not possible to
assess whether and how much progress has been made.
Heavy Metals and POPsHeavy metals such as mercury are serious environmental and health threats. Burning coal for electricity will inevitably emit mercury in the air. At present, Shanghai does not have ofcial gures on atmospheric mercury emission. None of the engineers responsible for air pollutant monitoring in the power plants the author talked to were aware of this problem.
Given Shanghai’s heavy reliance on coal, it is recommended that the city conducts a comprehensive study of mercury emissions resulting from coal and its impact on the environment and human health. Pollution sources should be identied and reduction strategies put in place. The Shanghai EPB recently started to study the feasibility of these measures. In the long term, Shanghai should gradually and progressively reduce its reliance on coal.
Persistent organic pollutants (POPs) are persistent and bio-accumulative toxins which are carcinogenic and hormone-disruptive. The Stockholm Convention on Persistent Organic Pollutants, to which China is a signatory country, acknowledged the severe health and environment hazards of this group of chemicals, and asked governments to regulate and develop phasing out plans.
UNEP
Env
iron
men
tal A
sses
smen
tExpo 2010 Shanghai, China
36
Dioxin is amongst the most toxic POPs. It is produced when chlorinated compounds are burnt at a sub-standard temperature (i.e. below 800 degrees Celsius). Waste incinerators, which are used in Shanghai, are common sources of dioxin. According to the Shanghai EPB, regular inspections were carried out to ensure compliance with the emission standard. Given the bio-accumulative nature of these toxins, Shanghai is advised to enforce strict measures on emission prevention. Comprehensive waste reduction strategies should be developed for sustainable waste management. (See the chapter on Solid Waste for more discussion).
It is noted that monitoring and evaluating these “advanced” pollutants requires higher level of technological capacity and thus more nancial investment. Given the ambition of Shanghai to be a leading environment-friendly city in China, there is no reason why it should not take the lead in addressing the challenge of heavy metals and POPs.
Promoting the Monitoring ExperienceIt is especially worthwhile to point out that in the process of addressing outstanding water and air pollution, Shanghai has reacted progressively by developing technological, scientic and administrative capacities. The city is now a model in the country on 24-hour real-time on-line monitoring of pollution sources. This in turn enables more effective law enforcement and corporate compliance. The experience of Shanghai in this regard should be widely promoted across China.
UNEP
Env
iron
men
tal A
sses
smen
t
Expo 2010 Shanghai, China
37
3. TRANSPORTATIONShanghai is a sprawling metropolitan city. By the end of 2008, the city had a population of 19 million, more than 25 times the population of Amsterdam. Yet it is only 4 times bigger than Greater London, occupying 6, 340.5 km2 of land, including the large but sparsely populated Chongming Island. Highly urbanized and industrialized, Shanghai is also a major aerial transportation hub and one of the busiest ports in Asia. Like many other metropolitan cities in the world, transportation has been, and still is, one of the biggest challenges for the municipal government.
It is projected that 70 million visitors will visit Expo 2010. During the six month period, Shanghai will be expecting an average of 400,000 visitors a day, with 700,000 on peak days. This cannot be achieved without an efcient and convenient system of public transport.
UNEP
Env
iron
men
tal A
sses
smen
tExpo 2010 Shanghai, China
38
In order to meet the long term transport demand of its citizens, Shanghai used Expo 2010 as an opportunity to fundamentally transform its transport infrastructure and to curb emissions from its motor vehicles. The transport measures taken include:
Prioritize the development of environment-friendly public transportationDevelop an extensive network of rapid transitStrengthen public bus servicesPromote clean energy vehicles and ensure that all public transportation inside the Expo 2010 site will be with zero emissionControl the growth in the number of motor vehiclesTighten emission standards and improve their enforcement for motor vehiclesSpeed up the phasing out of obsolete vehicles
3.1 PUBLIC TRANSPORT
The structure of transportation in a city not only affects the degree of accessibility and connectedness of its citizens, but also has profound climate and environmental implications. A city with a heavy reliance on motor vehicles, which constantly pump out air pollutants and greenhouse gases, will have a much larger impact on the environment than one with cleaner public transportation networks.
In the course of urban development, the choice of the government on transportation and related infrastructure fundamentally determines the environmental footprint of the city and its citizens.
Shanghai once had more than 10 million bicycles, before the trafc automation trends took off in the early 1990s. Despite the massive investment and large-scale construction of roads, highways, tunnels and yovers in the decade, trafc jams and inconvenient transport access affect the daily lives of the citizens adversely. Like many other cities which adopted the car-growth strategy, Shanghai’s citizens experience severe trafc congestion, waste more time travelling and suffer from worsening air quality.
The concept of “prioritizing public transportation” was introduced in government documents in the 1990s. But it was only in the last few years that clear political determination and substantial policy support were guaranteed. The city authority learnt a hard lesson from the failure of the car-growth strategy and quickly reprioritized the development of the public transport system. The experience of Shanghai in shifting its policy towards providing efcient, comfortable, affordable, and sustainable transport for all of its citizens has showcased a success story for other rapidly developing cities.
Prioritization of Public TransportThe Shanghai authority invested massively from mid 1990s onwards in public transportation. The trend was accelerated for the preparation of Expo 2010. In August 2007, Shanghai ofcially launched “The Three-year Action Plan on Prioritizing the Development of Urban Public Transport in Shanghai, 2007-2009.”
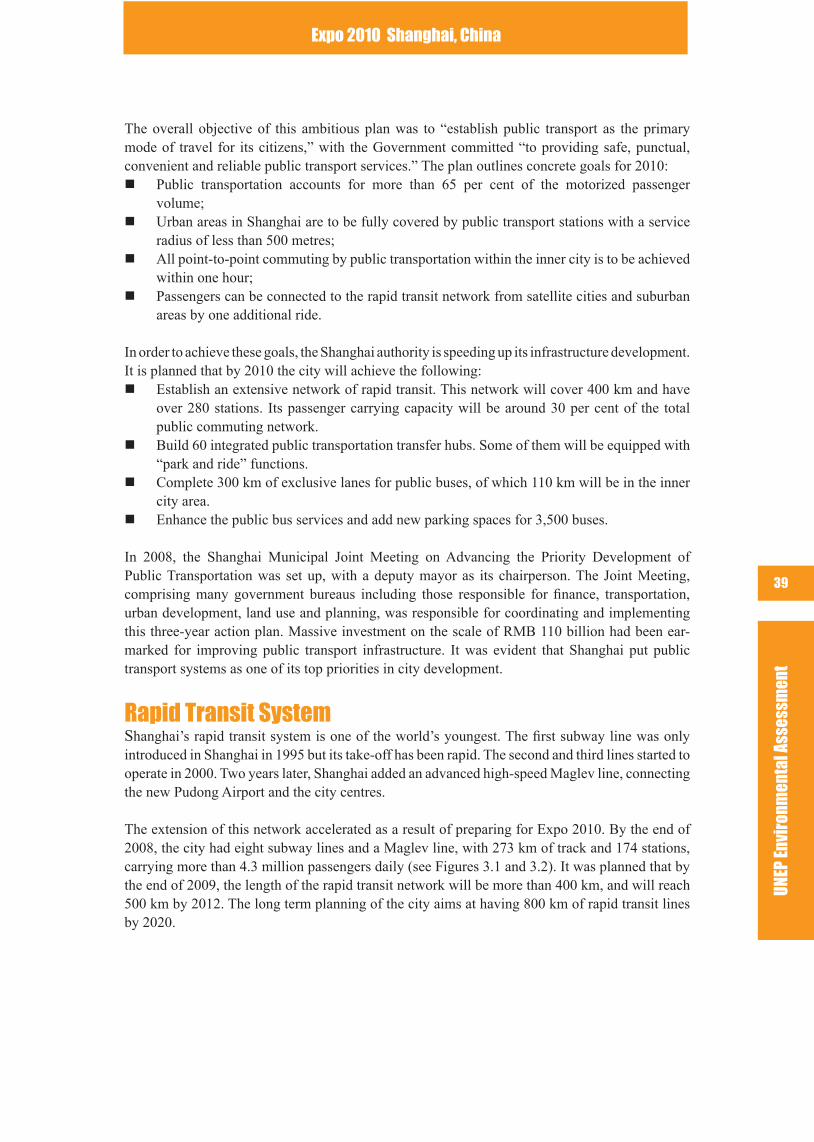
UNEP
Env
iron
men
tal A
sses
smen
t
Expo 2010 Shanghai, China
39
The overall objective of this ambitious plan was to “establish public transport as the primary mode of travel for its citizens,” with the Government committed “to providing safe, punctual, convenient and reliable public transport services.” The plan outlines concrete goals for 2010:
Public transportation accounts for more than 65 per cent of the motorized passenger volume;Urban areas in Shanghai are to be fully covered by public transport stations with a service radius of less than 500 metres;All point-to-point commuting by public transportation within the inner city is to be achieved within one hour; Passengers can be connected to the rapid transit network from satellite cities and suburban areas by one additional ride.
In order to achieve these goals, the Shanghai authority is speeding up its infrastructure development. It is planned that by 2010 the city will achieve the following:
Establish an extensive network of rapid transit. This network will cover 400 km and have over 280 stations. Its passenger carrying capacity will be around 30 per cent of the total public commuting network. Build 60 integrated public transportation transfer hubs. Some of them will be equipped with “park and ride” functions.Complete 300 km of exclusive lanes for public buses, of which 110 km will be in the inner city area. Enhance the public bus services and add new parking spaces for 3,500 buses.
In 2008, the Shanghai Municipal Joint Meeting on Advancing the Priority Development of Public Transportation was set up, with a deputy mayor as its chairperson. The Joint Meeting, comprising many government bureaus including those responsible for nance, transportation, urban development, land use and planning, was responsible for coordinating and implementing this three-year action plan. Massive investment on the scale of RMB 110 billion had been ear-marked for improving public transport infrastructure. It was evident that Shanghai put public transport systems as one of its top priorities in city development.
Rapid Transit SystemShanghai’s rapid transit system is one of the world’s youngest. The rst subway line was only introduced in Shanghai in 1995 but its take-off has been rapid. The second and third lines started to operate in 2000. Two years later, Shanghai added an advanced high-speed Maglev line, connecting the new Pudong Airport and the city centres.
The extension of this network accelerated as a result of preparing for Expo 2010. By the end of 2008, the city had eight subway lines and a Maglev line, with 273 km of track and 174 stations, carrying more than 4.3 million passengers daily (see Figures 3.1 and 3.2). It was planned that by the end of 2009, the length of the rapid transit network will be more than 400 km, and will reach 500 km by 2012. The long term planning of the city aims at having 800 km of rapid transit lines by 2020.
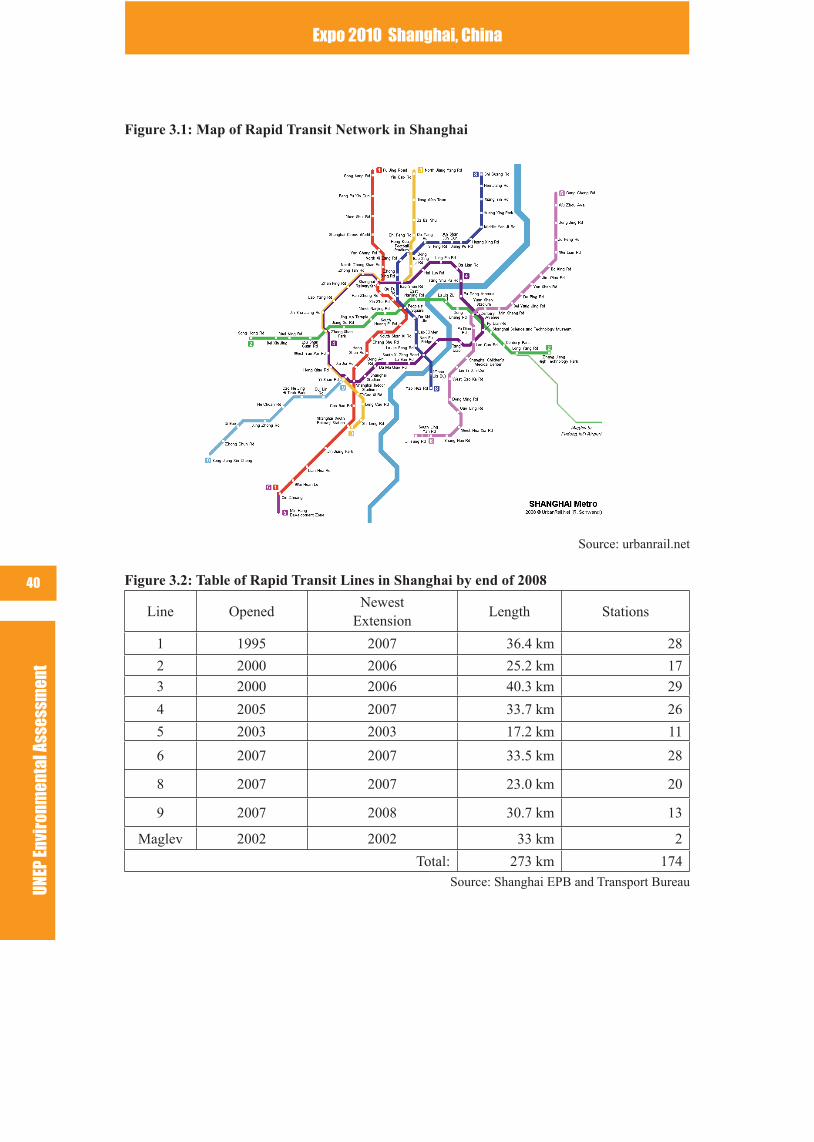
UNEP
Env
iron
men
tal A
sses
smen
tExpo 2010 Shanghai, China
40
Figure 3.1: Map of Rapid Transit Network in Shanghai
Source: urbanrail.net
Figure 3.2: Table of Rapid Transit Lines in Shanghai by end of 2008
Line OpenedNewest
ExtensionLength Stations
1 1995 2007 36.4 km 28
2 2000 2006 25.2 km 17
3 2000 2006 40.3 km 29
4 2005 2007 33.7 km 26
5 2003 2003 17.2 km 11
6 2007 2007 33.5 km 28
8 2007 2007 23.0 km 20
9 2007 2008 30.7 km 13
Maglev 2002 2002 33 km 2
Total: 273 km 174Source: Shanghai EPB and Transport Bureau
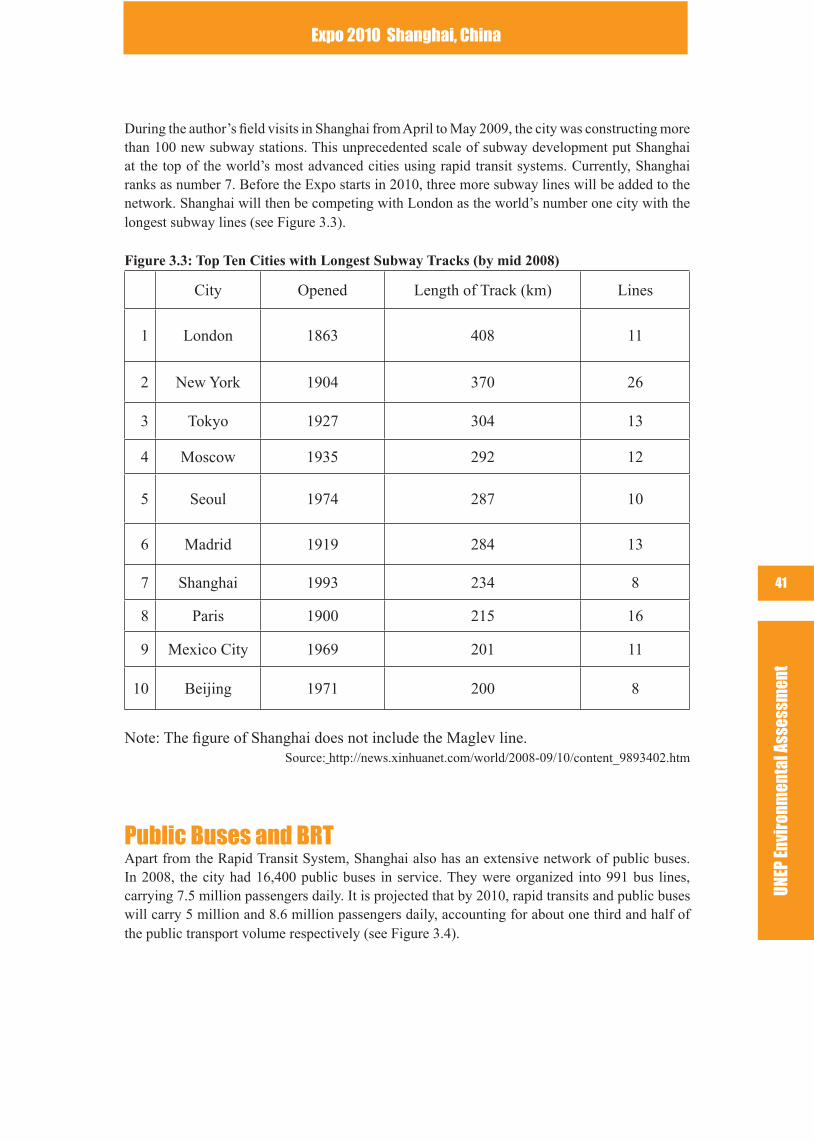
UNEP
Env
iron
men
tal A
sses
smen
t
Expo 2010 Shanghai, China
41
During the author’s eld visits in Shanghai from April to May 2009, the city was constructing more than 100 new subway stations. This unprecedented scale of subway development put Shanghai at the top of the world’s most advanced cities using rapid transit systems. Currently, Shanghai ranks as number 7. Before the Expo starts in 2010, three more subway lines will be added to the network. Shanghai will then be competing with London as the world’s number one city with the longest subway lines (see Figure 3.3).
Figure 3.3: Top Ten Cities with Longest Subway Tracks (by mid 2008)
City Opened Length of Track (km) Lines
1 London 1863 408 11
2 New York 1904 370 26
3 Tokyo 1927 304 13
4 Moscow 1935 292 12
5 Seoul 1974 287 10
6 Madrid 1919 284 13
7 Shanghai 1993 234 8
8 Paris 1900 215 16
9 Mexico City 1969 201 11
10 Beijing 1971 200 8
Note: The gure of Shanghai does not include the Maglev line. Source: http://news.xinhuanet.com/world/2008-09/10/content_9893402.htm
Public Buses and BRTApart from the Rapid Transit System, Shanghai also has an extensive network of public buses. In 2008, the city had 16,400 public buses in service. They were organized into 991 bus lines, carrying 7.5 million passengers daily. It is projected that by 2010, rapid transits and public buses will carry 5 million and 8.6 million passengers daily, accounting for about one third and half of the public transport volume respectively (see Figure 3.4).
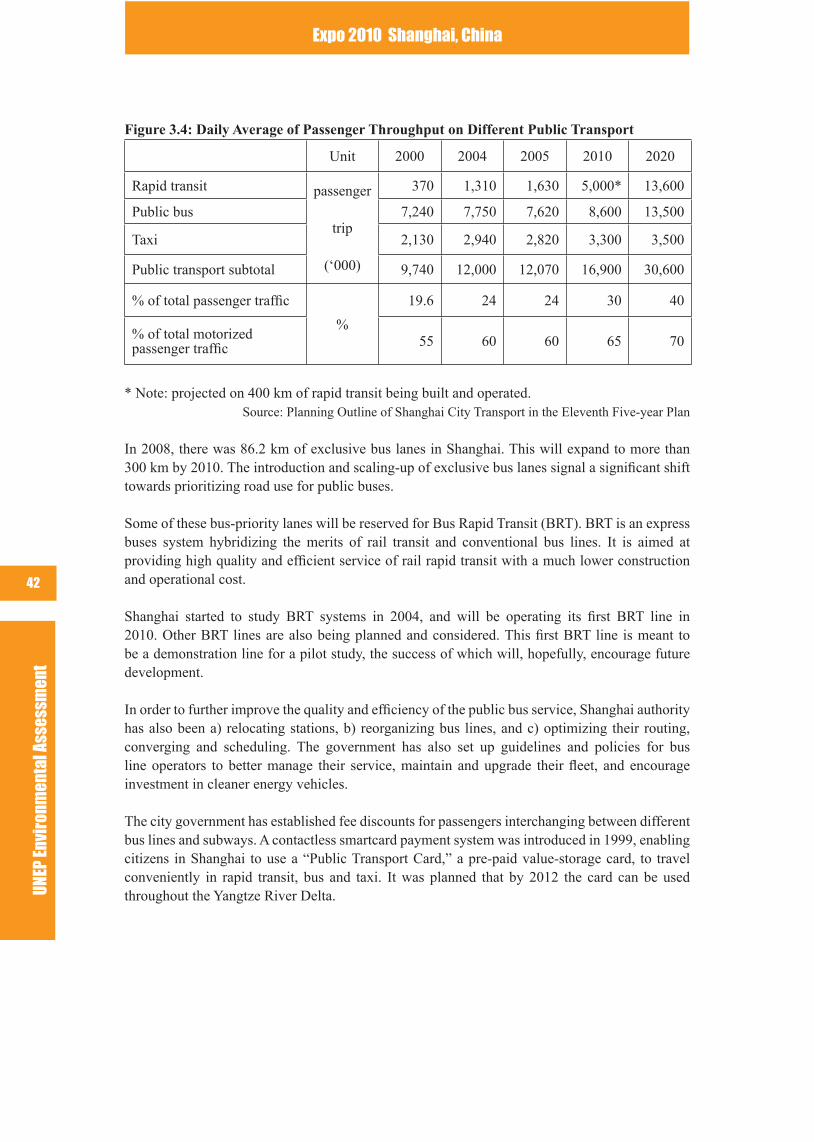
UNEP
Env
iron
men
tal A
sses
smen
tExpo 2010 Shanghai, China
42
Figure 3.4: Daily Average of Passenger Throughput on Different Public Transport
Unit 2000 2004 2005 2010 2020
Rapid transit passenger
trip
(‘000)
370 1,310 1,630 5,000* 13,600
Public bus 7,240 7,750 7,620 8,600 13,500
Taxi 2,130 2,940 2,820 3,300 3,500
Public transport subtotal 9,740 12,000 12,070 16,900 30,600
% of total passenger trafc
%
19.6 24 24 30 40
% of total motorized passenger trafc 55 60 60 65 70
* Note: projected on 400 km of rapid transit being built and operated.Source: Planning Outline of Shanghai City Transport in the Eleventh Five-year Plan
In 2008, there was 86.2 km of exclusive bus lanes in Shanghai. This will expand to more than 300 km by 2010. The introduction and scaling-up of exclusive bus lanes signal a signicant shift towards prioritizing road use for public buses.
Some of these bus-priority lanes will be reserved for Bus Rapid Transit (BRT). BRT is an express buses system hybridizing the merits of rail transit and conventional bus lines. It is aimed at providing high quality and efcient service of rail rapid transit with a much lower construction and operational cost.
Shanghai started to study BRT systems in 2004, and will be operating its rst BRT line in 2010. Other BRT lines are also being planned and considered. This rst BRT line is meant to be a demonstration line for a pilot study, the success of which will, hopefully, encourage future development.
In order to further improve the quality and efciency of the public bus service, Shanghai authority has also been a) relocating stations, b) reorganizing bus lines, and c) optimizing their routing, converging and scheduling. The government has also set up guidelines and policies for bus line operators to better manage their service, maintain and upgrade their eet, and encourage investment in cleaner energy vehicles.
The city government has established fee discounts for passengers interchanging between different bus lines and subways. A contactless smartcard payment system was introduced in 1999, enabling citizens in Shanghai to use a “Public Transport Card,” a pre-paid value-storage card, to travel conveniently in rapid transit, bus and taxi. It was planned that by 2012 the card can be used throughout the Yangtze River Delta.
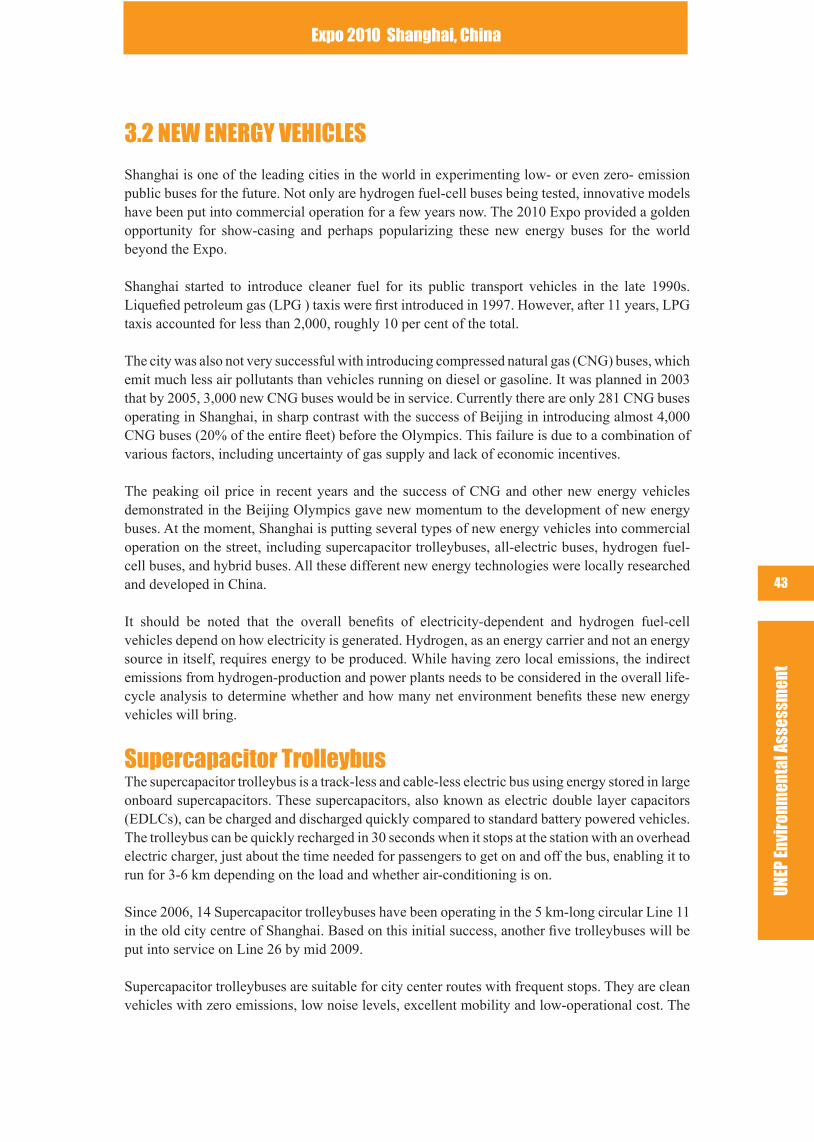
UNEP
Env
iron
men
tal A
sses
smen
t
Expo 2010 Shanghai, China
43
3.2 NEW ENERGY VEHICLES
Shanghai is one of the leading cities in the world in experimenting low- or even zero- emission public buses for the future. Not only are hydrogen fuel-cell buses being tested, innovative models have been put into commercial operation for a few years now. The 2010 Expo provided a golden opportunity for show-casing and perhaps popularizing these new energy buses for the world beyond the Expo.
Shanghai started to introduce cleaner fuel for its public transport vehicles in the late 1990s. Liqueed petroleum gas (LPG ) taxis were rst introduced in 1997. However, after 11 years, LPG taxis accounted for less than 2,000, roughly 10 per cent of the total.
The city was also not very successful with introducing compressed natural gas (CNG) buses, which emit much less air pollutants than vehicles running on diesel or gasoline. It was planned in 2003 that by 2005, 3,000 new CNG buses would be in service. Currently there are only 281 CNG buses operating in Shanghai, in sharp contrast with the success of Beijing in introducing almost 4,000 CNG buses (20% of the entire eet) before the Olympics. This failure is due to a combination of various factors, including uncertainty of gas supply and lack of economic incentives.
The peaking oil price in recent years and the success of CNG and other new energy vehicles demonstrated in the Beijing Olympics gave new momentum to the development of new energy buses. At the moment, Shanghai is putting several types of new energy vehicles into commercial operation on the street, including supercapacitor trolleybuses, all-electric buses, hydrogen fuel-cell buses, and hybrid buses. All these different new energy technologies were locally researched and developed in China.
It should be noted that the overall benets of electricity-dependent and hydrogen fuel-cell vehicles depend on how electricity is generated. Hydrogen, as an energy carrier and not an energy source in itself, requires energy to be produced. While having zero local emissions, the indirect emissions from hydrogen-production and power plants needs to be considered in the overall life-cycle analysis to determine whether and how many net environment benets these new energy vehicles will bring.
Supercapacitor TrolleybusThe supercapacitor trolleybus is a track-less and cable-less electric bus using energy stored in large onboard supercapacitors. These supercapacitors, also known as electric double layer capacitors (EDLCs), can be charged and discharged quickly compared to standard battery powered vehicles. The trolleybus can be quickly recharged in 30 seconds when it stops at the station with an overhead electric charger, just about the time needed for passengers to get on and off the bus, enabling it to run for 3-6 km depending on the load and whether air-conditioning is on.
Since 2006, 14 Supercapacitor trolleybuses have been operating in the 5 km-long circular Line 11 in the old city centre of Shanghai. Based on this initial success, another ve trolleybuses will be put into service on Line 26 by mid 2009.
Supercapacitor trolleybuses are suitable for city center routes with frequent stops. They are clean vehicles with zero emissions, low noise levels, excellent mobility and low-operational cost. The
UNEP
Env
iron
men
tal A
sses
smen
tExpo 2010 Shanghai, China
44
Line 11 bus drivers the author talked to said that the frequency of faults was only slightly higher than with conventional buses. Otherwise, the trolleybus is quite advanced and ready for further rollout.
The conductor of the supercapacitor trolleybus rises to the overhead charger in the terminal station on Line 11.
Source: UNEP
Battery-Supercapacitor Electric BusShanghai is also testing a locally invented model of an all-electric bus, combining conventional battery and supercapacitor elements for energy and utilizing the merits of both technologies. When it is charged at night for four hours, it can run in the daytime for about 150 km when air conditioning is on and 250 km if off.
Battery-supercapacitor buses were rst put into service on Line 852 in August 2007. From 2008 on, four more lines (Line 20, 88, 604 and 980) joined in, making a total of 80 all-electric buses on the road in Shanghai. The government plans to replace all the 114 vehicles on these ve lines with electric buses soon.
This electric bus emits no air pollutants. Although the life-cycle of the battery has been improved to about eight years, the weight and size of the battery remains a technical hurdle. The higher unit cost also deters its immediate popularization. The overall environmental benets need to be further assessed as the vehicles rely on electricity which is mostly generated from coal-red stations.
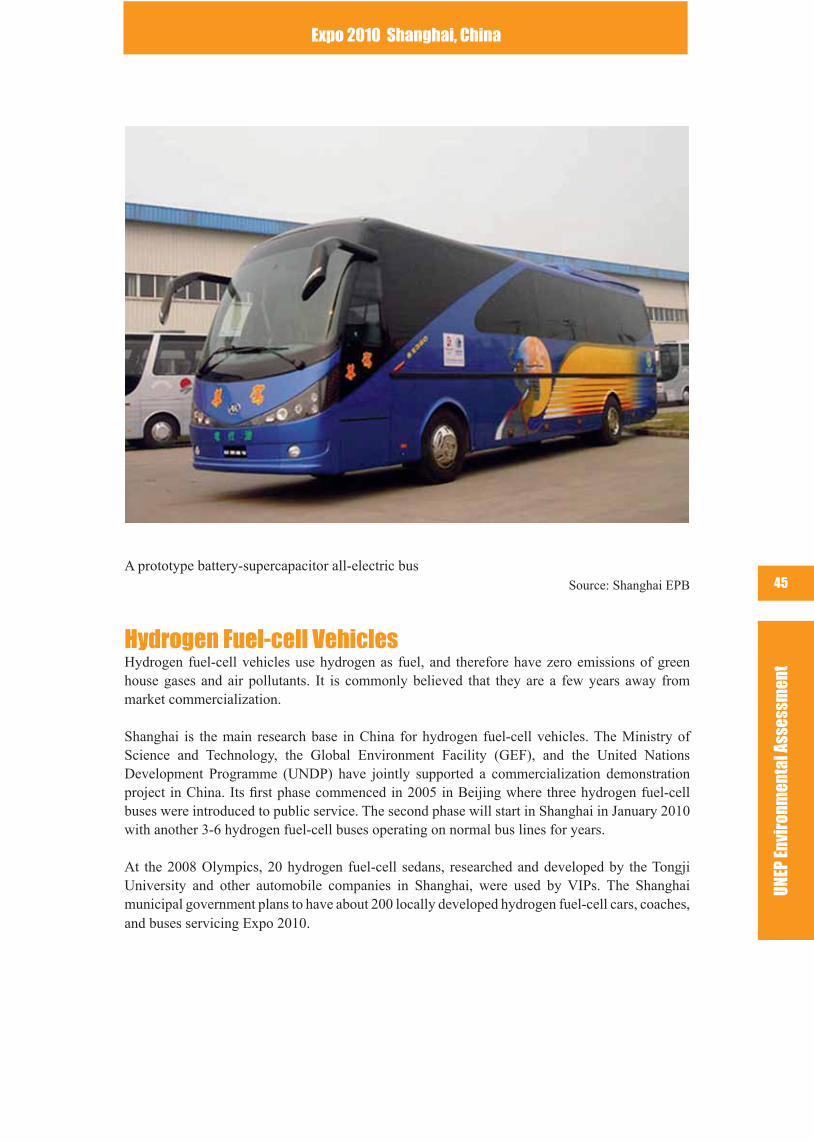
UNEP
Env
iron
men
tal A
sses
smen
t
Expo 2010 Shanghai, China
45A prototype battery-supercapacitor all-electric bus
Source: Shanghai EPB
Hydrogen Fuel-cell VehiclesHydrogen fuel-cell vehicles use hydrogen as fuel, and therefore have zero emissions of green house gases and air pollutants. It is commonly believed that they are a few years away from market commercialization.
Shanghai is the main research base in China for hydrogen fuel-cell vehicles. The Ministry of Science and Technology, the Global Environment Facility (GEF), and the United Nations Development Programme (UNDP) have jointly supported a commercialization demonstration project in China. Its rst phase commenced in 2005 in Beijing where three hydrogen fuel-cell buses were introduced to public service. The second phase will start in Shanghai in January 2010 with another 3-6 hydrogen fuel-cell buses operating on normal bus lines for years.
At the 2008 Olympics, 20 hydrogen fuel-cell sedans, researched and developed by the Tongji University and other automobile companies in Shanghai, were used by VIPs. The Shanghai municipal government plans to have about 200 locally developed hydrogen fuel-cell cars, coaches, and buses servicing Expo 2010.
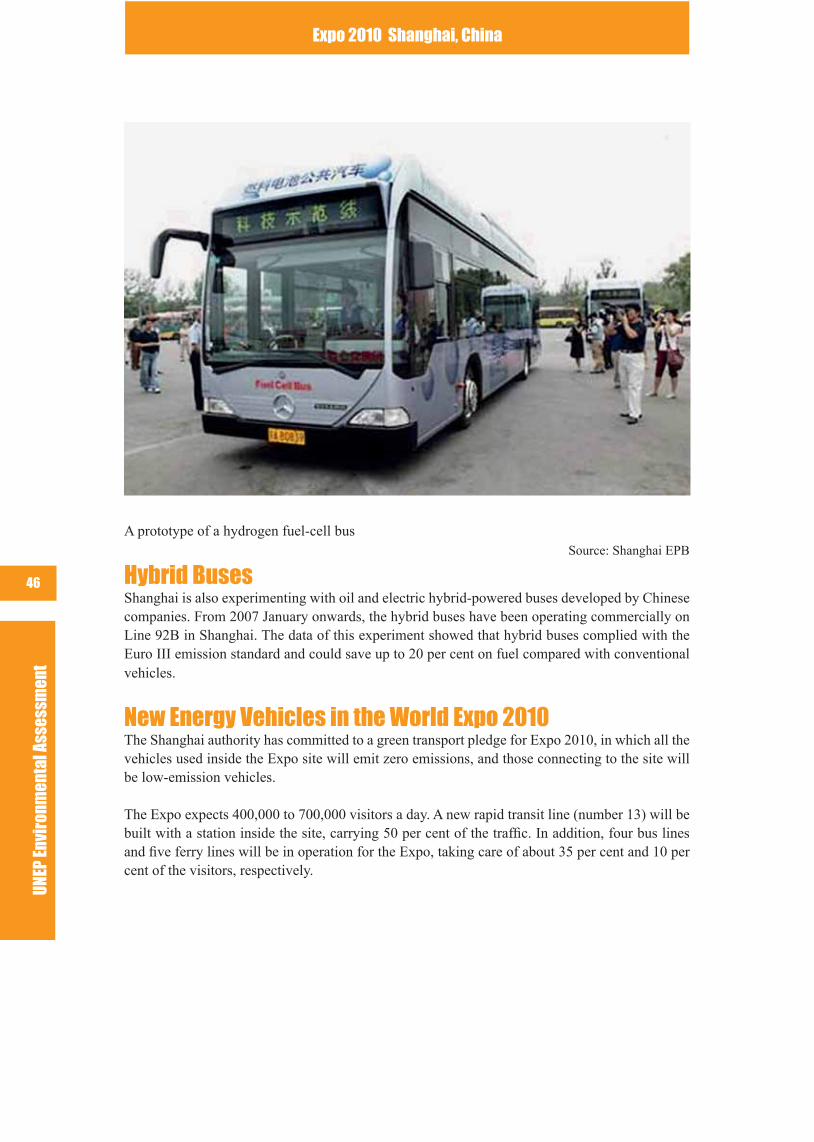
UNEP
Env
iron
men
tal A
sses
smen
tExpo 2010 Shanghai, China
46
A prototype of a hydrogen fuel-cell busSource: Shanghai EPB
Hybrid BusesShanghai is also experimenting with oil and electric hybrid-powered buses developed by Chinese companies. From 2007 January onwards, the hybrid buses have been operating commercially on Line 92B in Shanghai. The data of this experiment showed that hybrid buses complied with the Euro III emission standard and could save up to 20 per cent on fuel compared with conventional vehicles.
New Energy Vehicles in the World Expo 2010The Shanghai authority has committed to a green transport pledge for Expo 2010, in which all the vehicles used inside the Expo site will emit zero emissions, and those connecting to the site will be low-emission vehicles.
The Expo expects 400,000 to 700,000 visitors a day. A new rapid transit line (number 13) will be built with a station inside the site, carrying 50 per cent of the trafc. In addition, four bus lines and ve ferry lines will be in operation for the Expo, taking care of about 35 per cent and 10 per cent of the visitors, respectively.
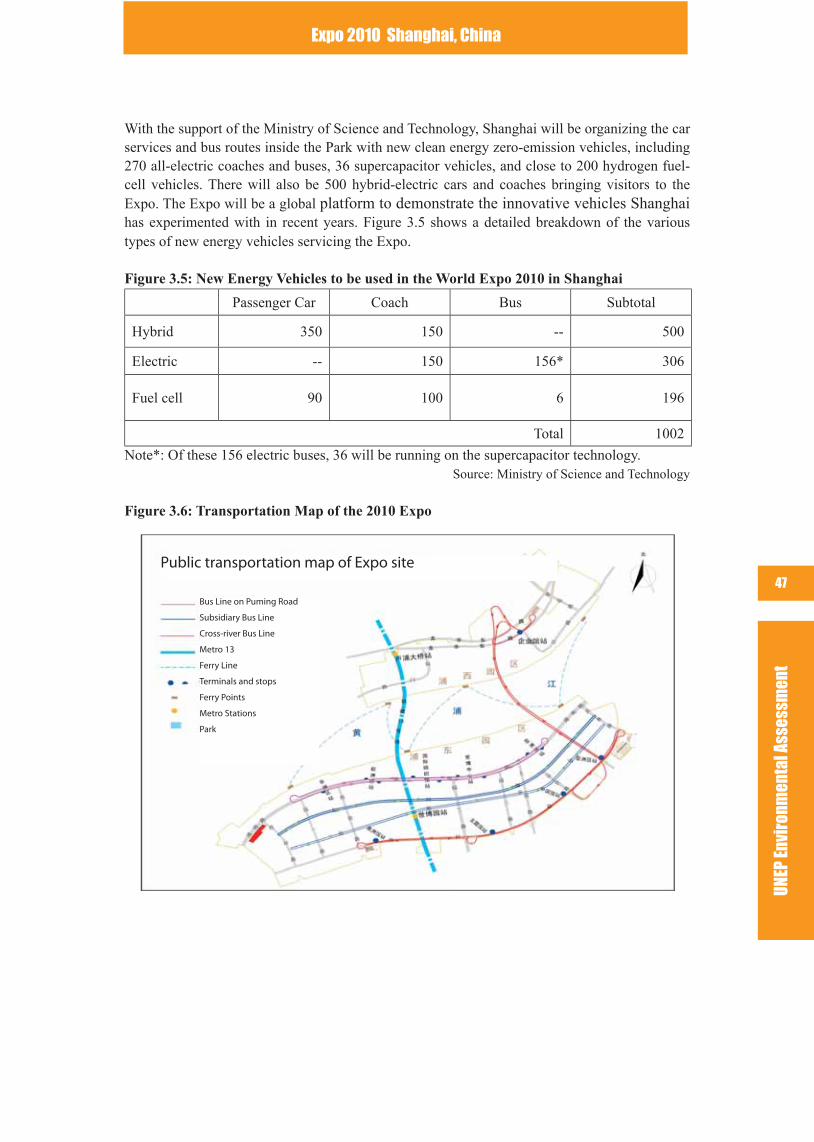
UNEP
Env
iron
men
tal A
sses
smen
t
Expo 2010 Shanghai, China
47
With the support of the Ministry of Science and Technology, Shanghai will be organizing the car services and bus routes inside the Park with new clean energy zero-emission vehicles, including 270 all-electric coaches and buses, 36 supercapacitor vehicles, and close to 200 hydrogen fuel-cell vehicles. There will also be 500 hybrid-electric cars and coaches bringing visitors to the Expo. The Expo will be a global platform to demonstrate the innovative vehicles Shanghai has experimented with in recent years. Figure 3.5 shows a detailed breakdown of the various types of new energy vehicles servicing the Expo.
Figure 3.5: New Energy Vehicles to be used in the World Expo 2010 in Shanghai
Passenger Car Coach Bus Subtotal
Hybrid 350 150 -- 500
Electric -- 150 156* 306
Fuel cell 90 100 6 196
Total 1002
Note*: Of these 156 electric buses, 36 will be running on the supercapacitor technology. Source: Ministry of Science and Technology
Figure 3.6: Transportation Map of the 2010 Expo
Bus Line on Puming Road
Subsidiary Bus Line
Cross-river Bus Line
Metro 13
Ferry Line
Terminals and stops
Ferry Points
Metro Stations
Park
Public transportation map of Expo site
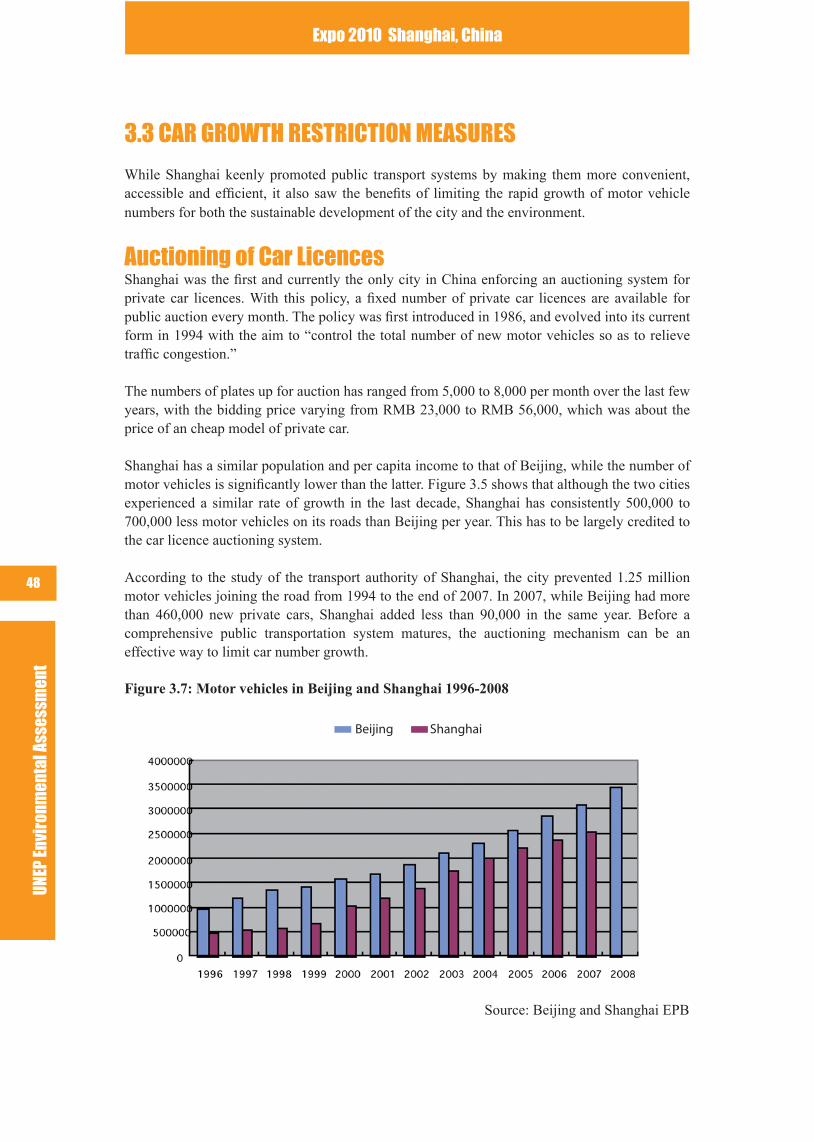
UNEP
Env
iron
men
tal A
sses
smen
tExpo 2010 Shanghai, China
48
3.3 CAR GROWTH RESTRICTION MEASURES
While Shanghai keenly promoted public transport systems by making them more convenient, accessible and efcient, it also saw the benets of limiting the rapid growth of motor vehicle numbers for both the sustainable development of the city and the environment.
Auctioning of Car Licences Shanghai was the rst and currently the only city in China enforcing an auctioning system for private car licences. With this policy, a xed number of private car licences are available for public auction every month. The policy was rst introduced in 1986, and evolved into its current form in 1994 with the aim to “control the total number of new motor vehicles so as to relieve trafc congestion.”
The numbers of plates up for auction has ranged from 5,000 to 8,000 per month over the last few years, with the bidding price varying from RMB 23,000 to RMB 56,000, which was about the price of an cheap model of private car.
Shanghai has a similar population and per capita income to that of Beijing, while the number of motor vehicles is signicantly lower than the latter. Figure 3.5 shows that although the two cities experienced a similar rate of growth in the last decade, Shanghai has consistently 500,000 to 700,000 less motor vehicles on its roads than Beijing per year. This has to be largely credited to the car licence auctioning system.
According to the study of the transport authority of Shanghai, the city prevented 1.25 million motor vehicles joining the road from 1994 to the end of 2007. In 2007, while Beijing had more than 460,000 new private cars, Shanghai added less than 90,000 in the same year. Before a comprehensive public transportation system matures, the auctioning mechanism can be an effective way to limit car number growth.
Figure 3.7: Motor vehicles in Beijing and Shanghai 1996-2008
Source: Beijing and Shanghai EPB
Beijing Shanghai
UNEP
Env
iron
men
tal A
sses
smen
t
Expo 2010 Shanghai, China
49
Car-free DayThe Shanghai authority also recognized the importance of educating the public about the merits of having less trafc on the roads. In 2007, supported by the Ministry of Housing and Urban-Rural Development of China, Shanghai and 107 other Chinese cities launched a car-free day on September 22nd, and designated the preceding week as “Public Transport Week” to encourage the public to drive less and use public transport systems. The car-free day was initiated in Paris in 1998 and quickly evolved into a world-wide public awareness-raising campaign in hundreds of cities.
From November 2008, the Shanghai authority requested that all government bureaus and ofces to reduce car use by 20 per cent by having government-owned sedans driving one day less per week.
Although these measures might not fundamentally reduce car use, they sent a strong signal to the public that the government favoured public transportation over private cars.
3.4 VEHICLE EMISSION CONTROLS
Apart from developing public transportation and limiting car growth, Shanghai also attempted to reduce emissions from motor vehicles by a) tightening emission standards, b) phasing out obsolete vehicles, c) limiting access to polluting vehicles, and d) strengthening inspection and maintenance.
Vehicle Emission StandardsExhausted gases from motor vehicles are major contributors to urban air pollution. The main pollutants from vehicles are carbon monoxide (CO), nitrogen oxides (NO
X), sulphur dioxide (SO
2)
and particulate matter (PM). Tightening emission standards is an important strategy to reduce the overall emission of pollutants.
Shanghai introduced new vehicle emissions standards, gradually catching up with the best practice set by the European Union. From 1999 to 2009, the city raised its standard from Euro I to Euro IV equivalent.
In 1999, the Shanghai authority implemented the National First Phase Emission Standards, equivalent to Euro I. In 2003, Shanghai enforced the National Second Phase Emission Standards, equivalent to Euro II, for new vehicles. By 2005 all 42,000 taxis and 5,400 buses in the inner city area complied with this new standard. The Euro III – equivalent to the third phase of the national standard was rst introduced for taxis and buses in 2006, and was enforced comprehensively in 2008.
From November 2009 onwards, all new light vehicles, buses and public service vehicles have to be compliant with the National Fourth Phase Emission Standards (equivalent to Euro IV). Beijing enforced Euro IV standard from January 2008 onwards in its preparation for the Olympics. Shanghai was 23 months behind. Still, the gap between Shanghai and the EU on the latest emission requirements for new cars was narrowed from 7 years to 5 years (2ee Figure 3.8).
In order to meet the new emission standard, Shanghai has also improved the quality of fuel supply in the city, meeting the relevant requirements of Euro IV standards.
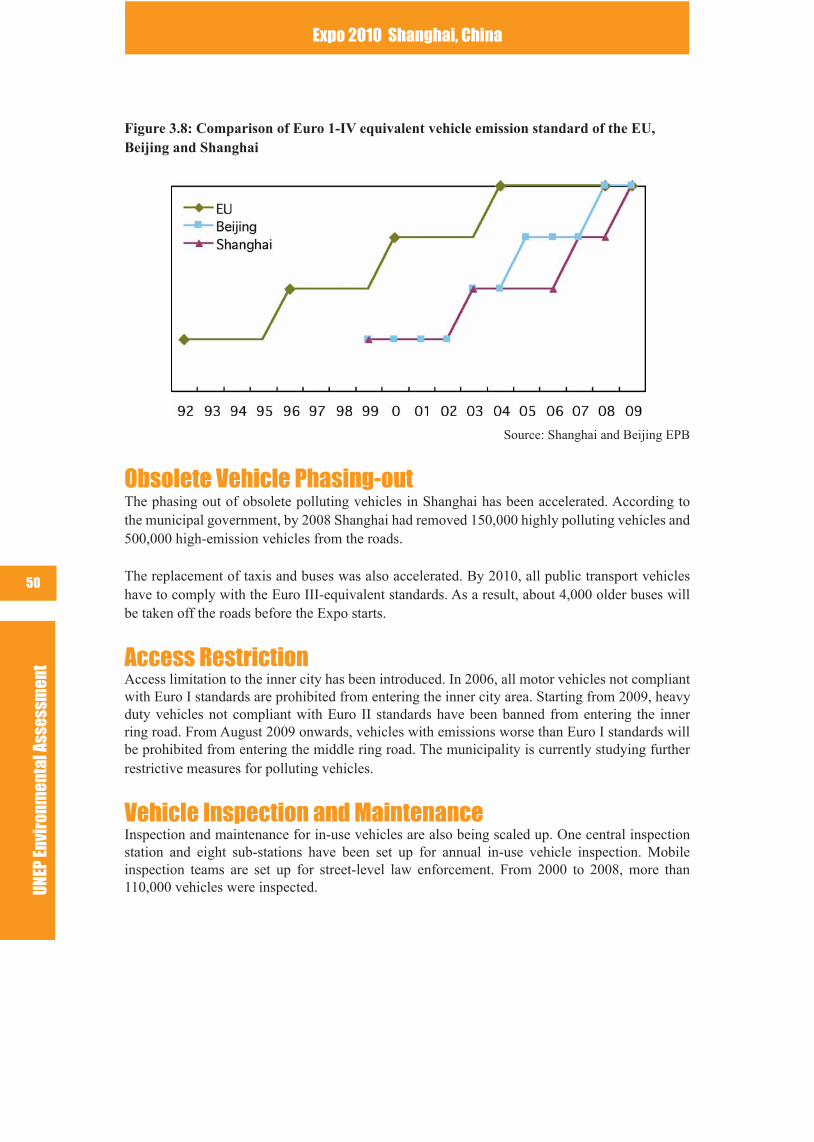
UNEP
Env
iron
men
tal A
sses
smen
tExpo 2010 Shanghai, China
50
Figure 3.8: Comparison of Euro 1-IV equivalent vehicle emission standard of the EU, Beijing and Shanghai
Source: Shanghai and Beijing EPB
Obsolete Vehicle Phasing-outThe phasing out of obsolete polluting vehicles in Shanghai has been accelerated. According to the municipal government, by 2008 Shanghai had removed 150,000 highly polluting vehicles and 500,000 high-emission vehicles from the roads.
The replacement of taxis and buses was also accelerated. By 2010, all public transport vehicles have to comply with the Euro III-equivalent standards. As a result, about 4,000 older buses will be taken off the roads before the Expo starts.
Access RestrictionAccess limitation to the inner city has been introduced. In 2006, all motor vehicles not compliant with Euro I standards are prohibited from entering the inner city area. Starting from 2009, heavy duty vehicles not compliant with Euro II standards have been banned from entering the inner ring road. From August 2009 onwards, vehicles with emissions worse than Euro I standards will be prohibited from entering the middle ring road. The municipality is currently studying further restrictive measures for polluting vehicles.
Vehicle Inspection and Maintenance Inspection and maintenance for in-use vehicles are also being scaled up. One central inspection station and eight sub-stations have been set up for annual in-use vehicle inspection. Mobile inspection teams are set up for street-level law enforcement. From 2000 to 2008, more than 110,000 vehicles were inspected.
UNEP
Env
iron
men
tal A
sses
smen
t
Expo 2010 Shanghai, China
51
3.5 COMMENTS AND RECOMMENDATIONS
Green Transport VisionThe World Expo presents a challenge as well as an opportunity for Shanghai to turn around its transportation policy of the last decade. The timing of Shanghai winning the Expo bid coincides with a turning point in the city’s transport vision. After a decade long automobile-led urban development and trafc strategy of the 1990s, the government started to realize that the growth rate of automobiles far exceeded that of roads. As some Chinese media has pointed out, expressways, bridges and yovers only become little more than car-parks soon after building.
Shanghai entered into the new millennium with a progressive vision of urban planning and citizen mobility centering on modern public transportation systems. The Expo was catalytic in accelerating the comprehensive modernization of public transport. As a result, a network of rapid transit gradually came into shape. By 2010, the city will have a network of over 10 lines of subways, light rails and a Maglev, with a total of 400 kms of track and over 280 stations.
Considering Shanghai only acquired its rst subway line in 1995, it is almost a miracle for the city to have built such an extensive network of subways in such a short time. The political will of the municipal government and the related nancial investment and policy support were critical to this success.
When the Expo starts in mid 2010, Shanghai citizens and visitors will travel efciently and comfortably in the transport web comprised of extensive subway lines and less polluting buses and taxis. UNEP recommends that Shanghai considers measures such as special Expo pass, fee discounts, or even complimentary rides for Expo ticket holders to encourage “green commuting” by public transport. Practical travel information together with Shanghai’s green transport vision shall be made available for Expo visitors.
Recommendations for Further ImprovementsShanghai has a bold vision to prioritize public transport over automobiles. The municipal government could galvanize its initial success by keeping and expanding its public and environment-friendly transport measures.
The city government is urged to maintain the prioritization of rapid transit and public buses in the trafc strategy. The followings should be considered:
Continue the investment in the public transport system, especially subwaysEnsure early planning of subway lines, locations of stations and the design of interchanging hubs to minimize building costs and maximize the convenience for passengersBalance the market-based management of the rapid transit system with the public service dimension of the network to secure its long term nancing and the cost-effectiveness of investmentsOptimize the network compatibility of subways and busesStrengthen the role of BRTs and express busesKeep modernizing the bus eet with low-emission and even zero-emission vehicles with policy support and nancial incentives
UNEP
Env
iron
men
tal A
sses
smen
tExpo 2010 Shanghai, China
52
Shanghai should also continue to prioritize road-use for public transport and take measures to keep the car number growth under control. The following measures can be considered:
Speed up the establishment of bus-priority and exclusive lanesLimit private cars from entering the inner city districts by introducing congestion surcharge or other access-restriction measures based on time or number of passengers being carriedContinue the private car licence plate auctioning system and enhance it by closing off any loop-holes, especially the leakage resulting from car owners acquiring non-Shanghai licensesLink up the revenue generated by licence auctioning to a green transportation fund to nance public transport infrastructure
In addition, the government can also enhance its emission control for ground transport by:Expanding Euro IV standard to all new vehicles including trucks and other heavy duty onesSpeeding up the replacement of old and more polluting vehicles with cleaner and more efcient ones through nancial incentives and regulatory policy.Imposing heavier taxation on buying cars with lower fuel efciency and owning additional carsGiving incentives to encourage the purchase of cars running on hydrogen, hybrid-electric engine or other cleaner fuels, and develop measures to promote wider use of electric vehicles
Non-motorized transport such as bicycles and walking needs to be encouraged as well. Shanghai is encouraged to keep its traditional pedestrian sidewalks and bike lanes. The municipal government recent experiments in designing rapid transit stations with bicycle parking space should be further promoted. More park spaces for bicycles could also be introduced in the city centre. In addition, some sections of city centre could be made pedestrian only zones (either temporarily during Sundays or permanently).
Beyond ShanghaiIn preparation for the Expo, Shanghai has demonstrated that with vision, political determination, the right policy support and nancial incentives, a rapidly developing city can fundamentally alter the car-oriented trafc strategy which has dominated the imagination of decision-makers for so many years. Cities from the rest of China and other developing countries can benet much from heeding Shanghai’s green transport vision.
Shanghai’s massive rapid transit expansion is symbolic of what many Chinese cities are heading towards. According to the Ministry of Housing and Urban-Rural Development, at the moment there are 36 subway lines under construction in 12 Chinese cities. By 2010, there will be 23 cities in China having metro systems.
In the Yangtze River Delta area alone, four more cities are following Shanghai in their subway rush. Nanjing has one subway line operating with eight more in the pipeline. There are eight lines in Hangzhou, four lines in Suzhou and ve lines in Wuxi under construction and being planned. They can benet from the Shanghai experience in integrating better with overall urban planning, as well as with earlier and more strategic design of the network to minimize resettlement and construction costs.
UNEP
Env
iron
men
tal A
sses
smen
t
Expo 2010 Shanghai, China
53
Many other Chinese cities are also establishing BRT systems. BRTs can be put in place at much cheaper costs and shorter construction periods. It costs only 5-10% of what subways cost per kilometre. It is more suitable for other less-populated and lower-income cities in China and other developing countries with similar needs.
In addition to the prioritization of subways, BRTs and buses, car-growth control strategies such as the license auctioning should be promoted nationally. Private car numbers are growing by 20 per cent per year in China. Applying stringent standards of emission and fuel efciency across the country can also help China to cut air pollution and carbon emissions from the transport sector.
Shanghai leads in the development and commercialization of new energy vehicles. The Ministry of Science and Technology (MOST) has launched an ambitious initiative to subsidize ten cities to introduce a total of 10,000 new energy buses. The plan aims at helping to expand the annual production capacity for energy-saving vehicles to one million, which is 10 per cent of the total, by 2012.
Against this background, the successful introduction of supercapacitor trolleybuses and all-electric buses in Shanghai provides valuable experience and should be further promoted. The zero-emission and low-emission transport commitment and the demonstration of the 1, 002 new energy vehicles in the Expo could help direct the car industry in a new green direction, both in China and for the world.
With the re-orientation of its transport policy towards green and public transport, Shanghai exemplied how citizens in a metropolitan city could enjoy comfortable and efcient mobility while minimizing their negative impact on the environment. This green transport vision ts very well with the theme of the 2010 Expo: “Better City, Better Life.”
UNEP
Env
iron
men
tal A
sses
smen
tExpo 2010 Shanghai, China
54
4. ENERGY Energy has been a key area for Shanghai to modernize in its preparations for the Expo. When the city won the bid for the Expo in 2002, Shanghai was predominately dependent on coal for generating electricity for its growing population and booming industrialization.
Since then, the city has put in place a comprehensive programme for improving the energy structure, reducing its reliance on coal, improving energy efciency and introducing renewable energy. Although many of these measures were formulated with the objective of saving energy, reducing emissions and improving air quality, they also contributed to reducing greenhouse gas emission thus helping to mitigate climate change.
An over-arching objective of Shanghai’s energy strategy was to accomplish the “energy conservation and emission reduction” target laid down in the outline of the national Eleventh Five-Year Plan of National Economy and Social Development (2006-2010). By 2010, Shanghai will reduce energy intensity per GDP unit by 20 per cent compared to 2005 levels, and its energy supply and consumption system should become “diverse, safe, clean and highly efcient”.
As a rapidly developing city, Shanghai experienced a high growth demand for energy, especially electricity. In 2007, the city consumed 98 million tons of coal equivalent (TCE), almost double that of 1996 and represented an annual growth rate of more than 8 per cent. Total electricity consumed shot up to 107.2 billion kWh, with an average annual growth rate of almost 10 per cent since 2000. With this trend of soaring energy demands, it is a huge challenge for Shanghai to reduce emissions and improve energy efciency.
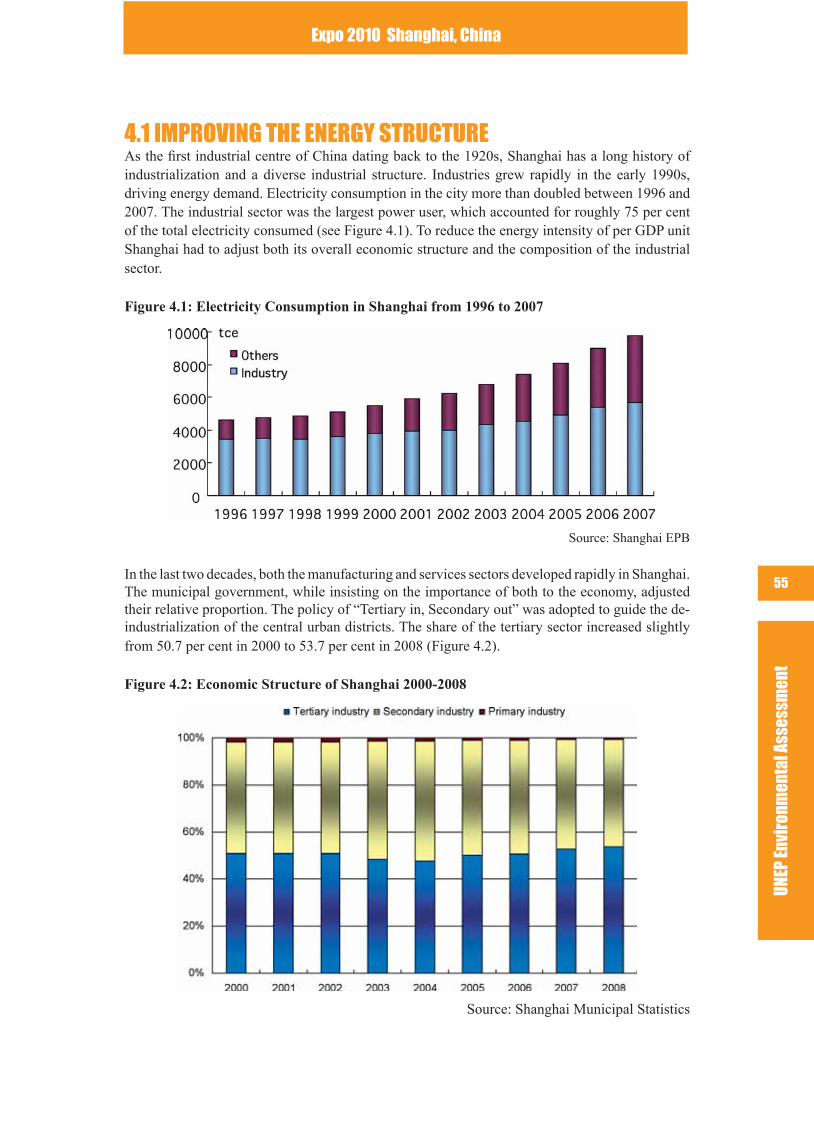
UNEP
Env
iron
men
tal A
sses
smen
t
Expo 2010 Shanghai, China
55
4.1 IMPROVING THE ENERGY STRUCTUREAs the rst industrial centre of China dating back to the 1920s, Shanghai has a long history of industrialization and a diverse industrial structure. Industries grew rapidly in the early 1990s, driving energy demand. Electricity consumption in the city more than doubled between 1996 and 2007. The industrial sector was the largest power user, which accounted for roughly 75 per cent of the total electricity consumed (see Figure 4.1). To reduce the energy intensity of per GDP unit Shanghai had to adjust both its overall economic structure and the composition of the industrial sector.
Figure 4.1: Electricity Consumption in Shanghai from 1996 to 2007
Source: Shanghai EPB
In the last two decades, both the manufacturing and services sectors developed rapidly in Shanghai. The municipal government, while insisting on the importance of both to the economy, adjusted their relative proportion. The policy of “Tertiary in, Secondary out” was adopted to guide the de-industrialization of the central urban districts. The share of the tertiary sector increased slightly from 50.7 per cent in 2000 to 53.7 per cent in 2008 (Figure 4.2).
Figure 4.2: Economic Structure of Shanghai 2000-2008
Source: Shanghai Municipal Statistics
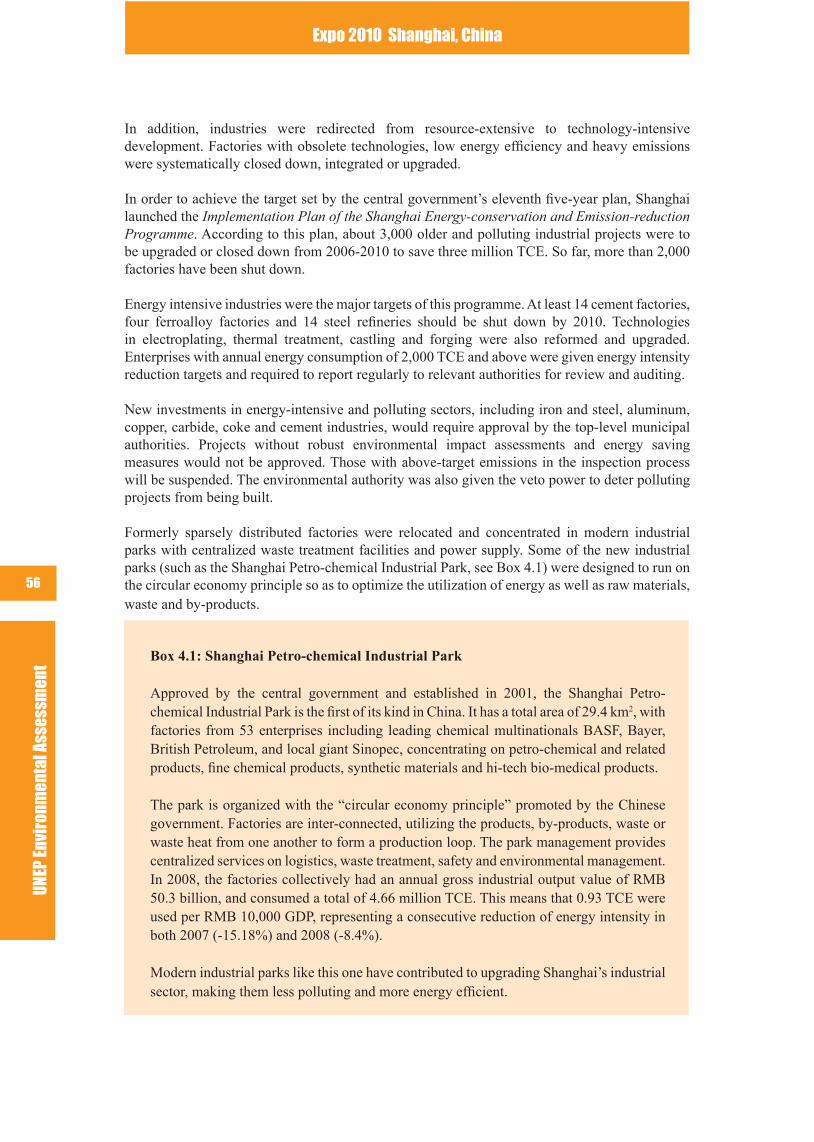
UNEP
Env
iron
men
tal A
sses
smen
tExpo 2010 Shanghai, China
56
In addition, industries were redirected from resource-extensive to technology-intensive development. Factories with obsolete technologies, low energy efciency and heavy emissions were systematically closed down, integrated or upgraded.
In order to achieve the target set by the central government’s eleventh ve-year plan, Shanghai launched the Implementation Plan of the Shanghai Energy-conservation and Emission-reduction Programme. According to this plan, about 3,000 older and polluting industrial projects were to be upgraded or closed down from 2006-2010 to save three million TCE. So far, more than 2,000 factories have been shut down.
Energy intensive industries were the major targets of this programme. At least 14 cement factories, four ferroalloy factories and 14 steel reneries should be shut down by 2010. Technologies in electroplating, thermal treatment, castling and forging were also reformed and upgraded. Enterprises with annual energy consumption of 2,000 TCE and above were given energy intensity reduction targets and required to report regularly to relevant authorities for review and auditing.
New investments in energy-intensive and polluting sectors, including iron and steel, aluminum, copper, carbide, coke and cement industries, would require approval by the top-level municipal authorities. Projects without robust environmental impact assessments and energy saving measures would not be approved. Those with above-target emissions in the inspection process will be suspended. The environmental authority was also given the veto power to deter polluting projects from being built.
Formerly sparsely distributed factories were relocated and concentrated in modern industrial parks with centralized waste treatment facilities and power supply. Some of the new industrial parks (such as the Shanghai Petro-chemical Industrial Park, see Box 4.1) were designed to run on the circular economy principle so as to optimize the utilization of energy as well as raw materials, waste and by-products.
Box 4.1: Shanghai Petro-chemical Industrial Park
Approved by the central government and established in 2001, the Shanghai Petro-chemical Industrial Park is the rst of its kind in China. It has a total area of 29.4 km2, with factories from 53 enterprises including leading chemical multinationals BASF, Bayer, British Petroleum, and local giant Sinopec, concentrating on petro-chemical and related products, ne chemical products, synthetic materials and hi-tech bio-medical products.
The park is organized with the “circular economy principle” promoted by the Chinese government. Factories are inter-connected, utilizing the products, by-products, waste or waste heat from one another to form a production loop. The park management provides centralized services on logistics, waste treatment, safety and environmental management. In 2008, the factories collectively had an annual gross industrial output value of RMB 50.3 billion, and consumed a total of 4.66 million TCE. This means that 0.93 TCE were used per RMB 10,000 GDP, representing a consecutive reduction of energy intensity in both 2007 (-15.18%) and 2008 (-8.4%).
Modern industrial parks like this one have contributed to upgrading Shanghai’s industrial sector, making them less polluting and more energy efcient.
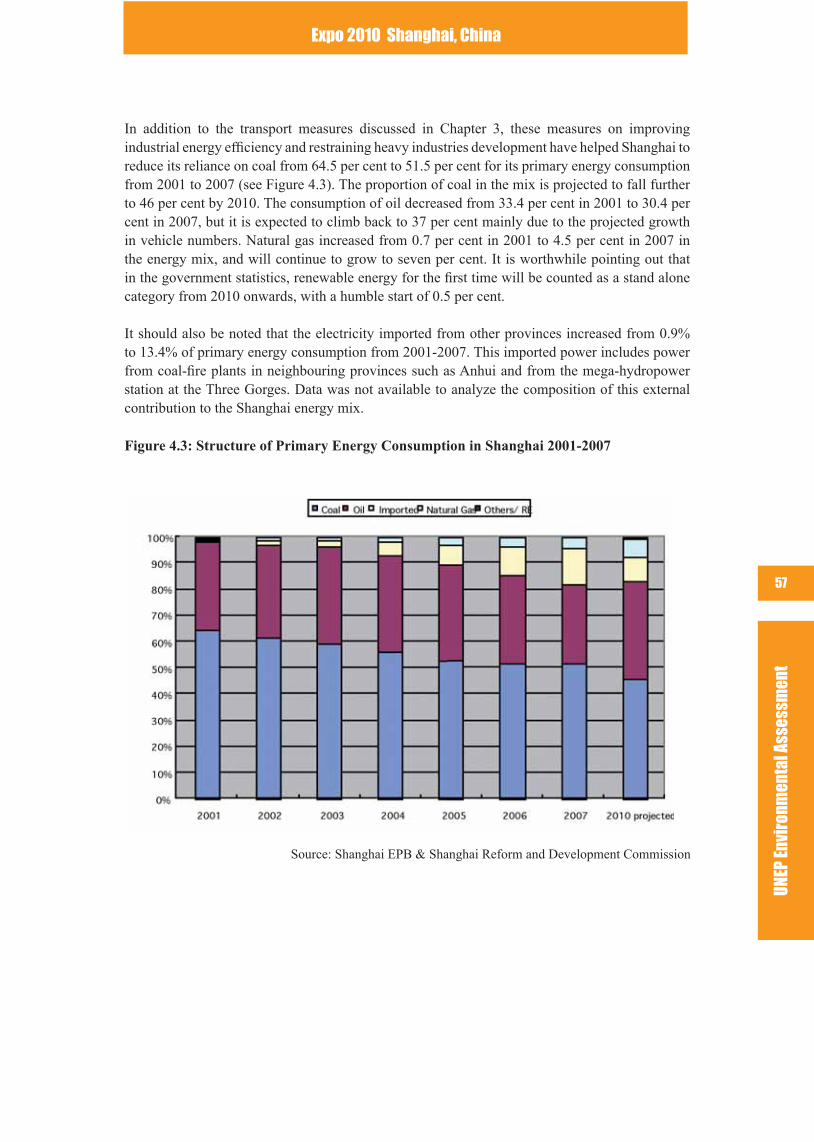
UNEP
Env
iron
men
tal A
sses
smen
t
Expo 2010 Shanghai, China
57
In addition to the transport measures discussed in Chapter 3, these measures on improving industrial energy efciency and restraining heavy industries development have helped Shanghai to reduce its reliance on coal from 64.5 per cent to 51.5 per cent for its primary energy consumption from 2001 to 2007 (see Figure 4.3). The proportion of coal in the mix is projected to fall further to 46 per cent by 2010. The consumption of oil decreased from 33.4 per cent in 2001 to 30.4 per cent in 2007, but it is expected to climb back to 37 per cent mainly due to the projected growth in vehicle numbers. Natural gas increased from 0.7 per cent in 2001 to 4.5 per cent in 2007 in the energy mix, and will continue to grow to seven per cent. It is worthwhile pointing out that in the government statistics, renewable energy for the rst time will be counted as a stand alone category from 2010 onwards, with a humble start of 0.5 per cent.
It should also be noted that the electricity imported from other provinces increased from 0.9% to 13.4% of primary energy consumption from 2001-2007. This imported power includes power from coal-re plants in neighbouring provinces such as Anhui and from the mega-hydropower station at the Three Gorges. Data was not available to analyze the composition of this external contribution to the Shanghai energy mix.
Figure 4.3: Structure of Primary Energy Consumption in Shanghai 2001-2007
Source: Shanghai EPB & Shanghai Reform and Development Commission
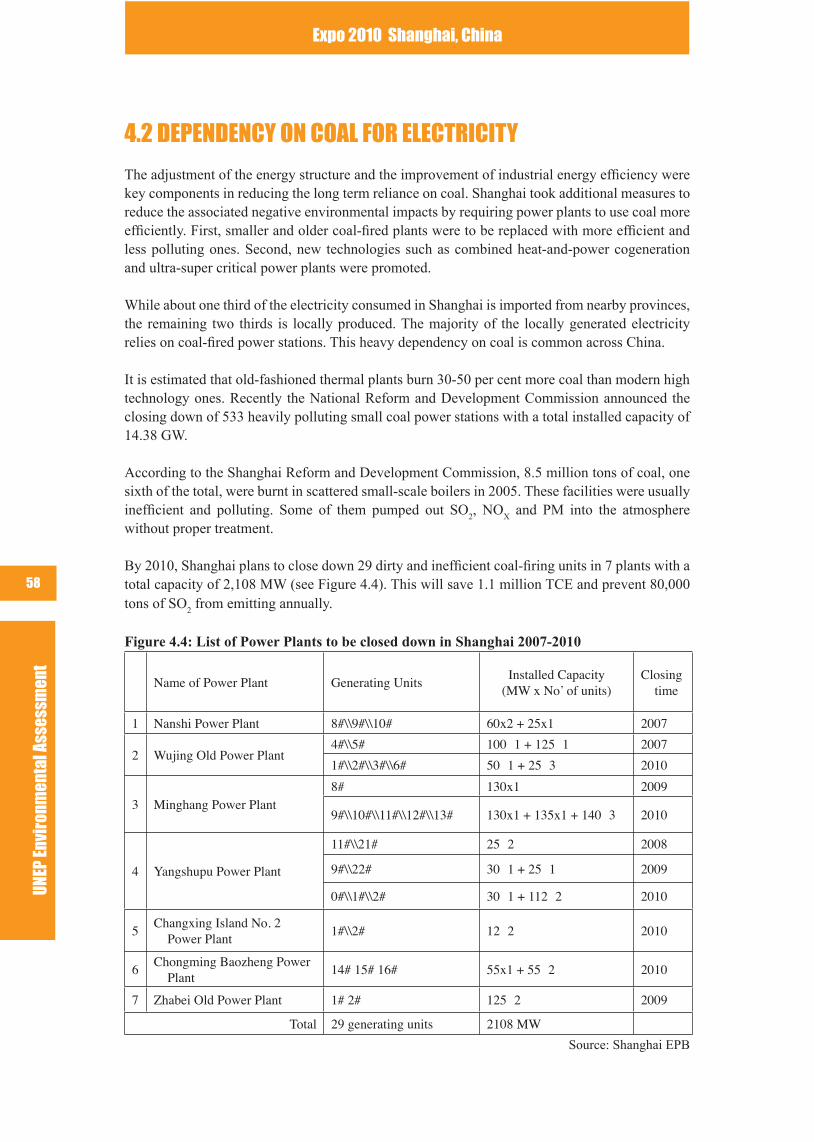
UNEP
Env
iron
men
tal A
sses
smen
tExpo 2010 Shanghai, China
58
4.2 DEPENDENCY ON COAL FOR ELECTRICITY
The adjustment of the energy structure and the improvement of industrial energy efciency were key components in reducing the long term reliance on coal. Shanghai took additional measures to reduce the associated negative environmental impacts by requiring power plants to use coal more efciently. First, smaller and older coal-red plants were to be replaced with more efcient and less polluting ones. Second, new technologies such as combined heat-and-power cogeneration and ultra-super critical power plants were promoted.
While about one third of the electricity consumed in Shanghai is imported from nearby provinces, the remaining two thirds is locally produced. The majority of the locally generated electricity relies on coal-red power stations. This heavy dependency on coal is common across China.
It is estimated that old-fashioned thermal plants burn 30-50 per cent more coal than modern high technology ones. Recently the National Reform and Development Commission announced the closing down of 533 heavily polluting small coal power stations with a total installed capacity of 14.38 GW.
According to the Shanghai Reform and Development Commission, 8.5 million tons of coal, one sixth of the total, were burnt in scattered small-scale boilers in 2005. These facilities were usually inefcient and polluting. Some of them pumped out SO
2, NO
X and PM into the atmosphere
without proper treatment.
By 2010, Shanghai plans to close down 29 dirty and inefcient coal-ring units in 7 plants with a total capacity of 2,108 MW (see Figure 4.4). This will save 1.1 million TCE and prevent 80,000 tons of SO
2 from emitting annually.
Figure 4.4: List of Power Plants to be closed down in Shanghai 2007-2010
Name of Power Plant Generating UnitsInstalled Capacity
(MW x No’ of units)Closing
time
1 Nanshi Power Plant 8#\\9#\\10# 60x2 + 25x1 2007
2 Wujing Old Power Plant4#\\5# 100�1 + 125�1 2007
1#\\2#\\3#\\6# 50�1 + 25�3 2010
3 Minghang Power Plant8# 130x1 2009
9#\\10#\\11#\\12#\\13# 130x1 + 135x1 + 140�3 2010
4 Yangshupu Power Plant
11#\\21# 25�2 2008
9#\\22# 30�1 + 25�1 2009
0#\\1#\\2# 30�1 + 112�2 2010
5Changxing Island No. 2
Power Plant 1#\\2# 12�2 2010
6Chongming Baozheng Power
Plant14# 15# 16# 55x1 + 55�2 2010
7 Zhabei Old Power Plant 1# 2# 125�2 2009
Total 29 generating units 2108 MW
Source: Shanghai EPB
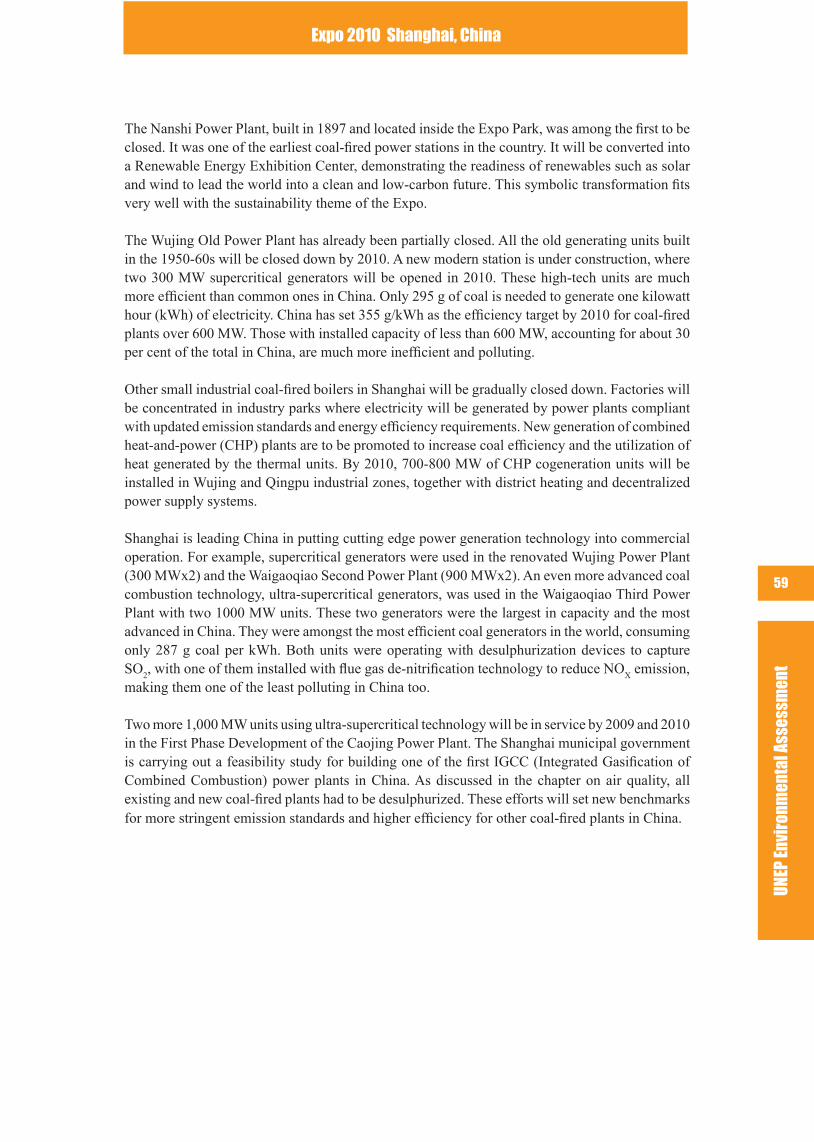
UNEP
Env
iron
men
tal A
sses
smen
t
Expo 2010 Shanghai, China
59
The Nanshi Power Plant, built in 1897 and located inside the Expo Park, was among the rst to be closed. It was one of the earliest coal-red power stations in the country. It will be converted into a Renewable Energy Exhibition Center, demonstrating the readiness of renewables such as solar and wind to lead the world into a clean and low-carbon future. This symbolic transformation ts very well with the sustainability theme of the Expo.
The Wujing Old Power Plant has already been partially closed. All the old generating units built in the 1950-60s will be closed down by 2010. A new modern station is under construction, where two 300 MW supercritical generators will be opened in 2010. These high-tech units are much more efcient than common ones in China. Only 295 g of coal is needed to generate one kilowatt hour (kWh) of electricity. China has set 355 g/kWh as the efciency target by 2010 for coal-red plants over 600 MW. Those with installed capacity of less than 600 MW, accounting for about 30 per cent of the total in China, are much more inefcient and polluting.
Other small industrial coal-red boilers in Shanghai will be gradually closed down. Factories will be concentrated in industry parks where electricity will be generated by power plants compliant with updated emission standards and energy efciency requirements. New generation of combined heat-and-power (CHP) plants are to be promoted to increase coal efciency and the utilization of heat generated by the thermal units. By 2010, 700-800 MW of CHP cogeneration units will be installed in Wujing and Qingpu industrial zones, together with district heating and decentralized power supply systems.
Shanghai is leading China in putting cutting edge power generation technology into commercial operation. For example, supercritical generators were used in the renovated Wujing Power Plant (300 MWx2) and the Waigaoqiao Second Power Plant (900 MWx2). An even more advanced coal combustion technology, ultra-supercritical generators, was used in the Waigaoqiao Third Power Plant with two 1000 MW units. These two generators were the largest in capacity and the most advanced in China. They were amongst the most efcient coal generators in the world, consuming only 287 g coal per kWh. Both units were operating with desulphurization devices to capture SO2
, with one of them installed with ue gas de-nitrication technology to reduce NOX emission,
making them one of the least polluting in China too.
Two more 1,000 MW units using ultra-supercritical technology will be in service by 2009 and 2010 in the First Phase Development of the Caojing Power Plant. The Shanghai municipal government is carrying out a feasibility study for building one of the rst IGCC (Integrated Gasication of Combined Combustion) power plants in China. As discussed in the chapter on air quality, all existing and new coal-red plants had to be desulphurized. These efforts will set new benchmarks for more stringent emission standards and higher efciency for other coal-red plants in China.
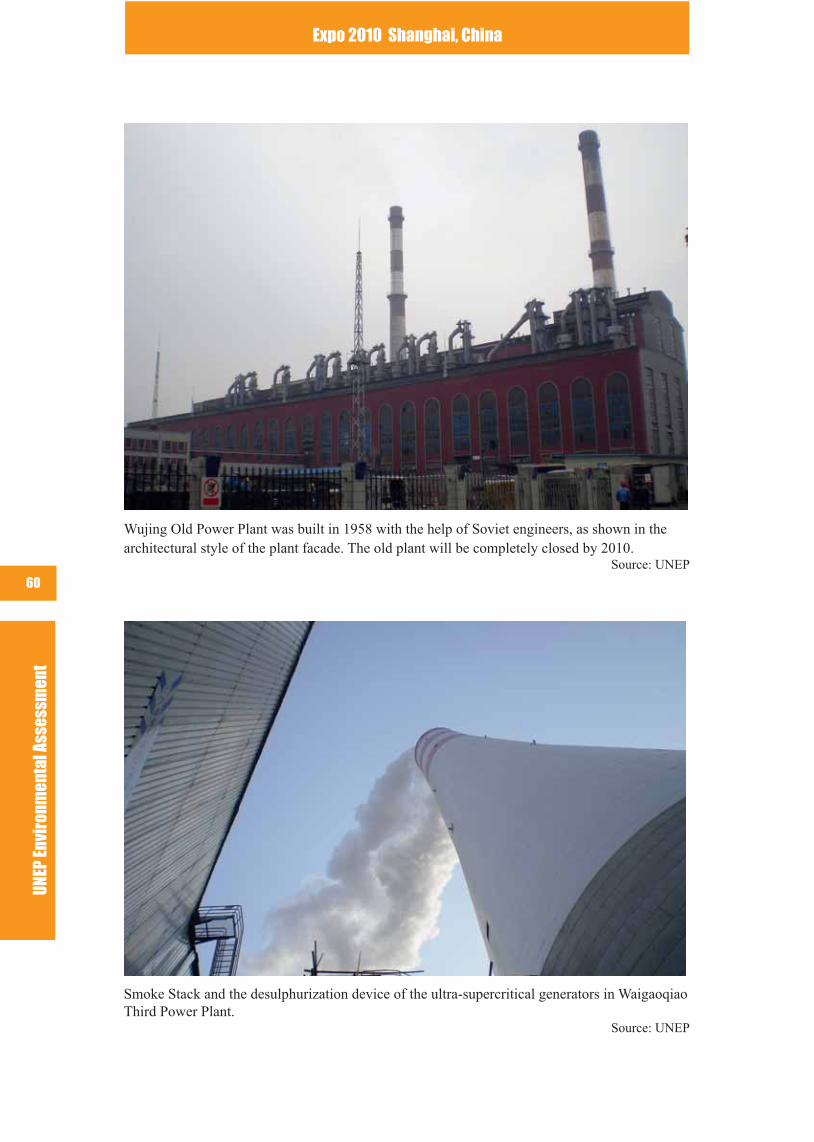
UNEP
Env
iron
men
tal A
sses
smen
tExpo 2010 Shanghai, China
60
Wujing Old Power Plant was built in 1958 with the help of Soviet engineers, as shown in the architectural style of the plant facade. The old plant will be completely closed by 2010.
Source: UNEP
Smoke Stack and the desulphurization device of the ultra-supercritical generators in Waigaoqiao Third Power Plant.
Source: UNEP
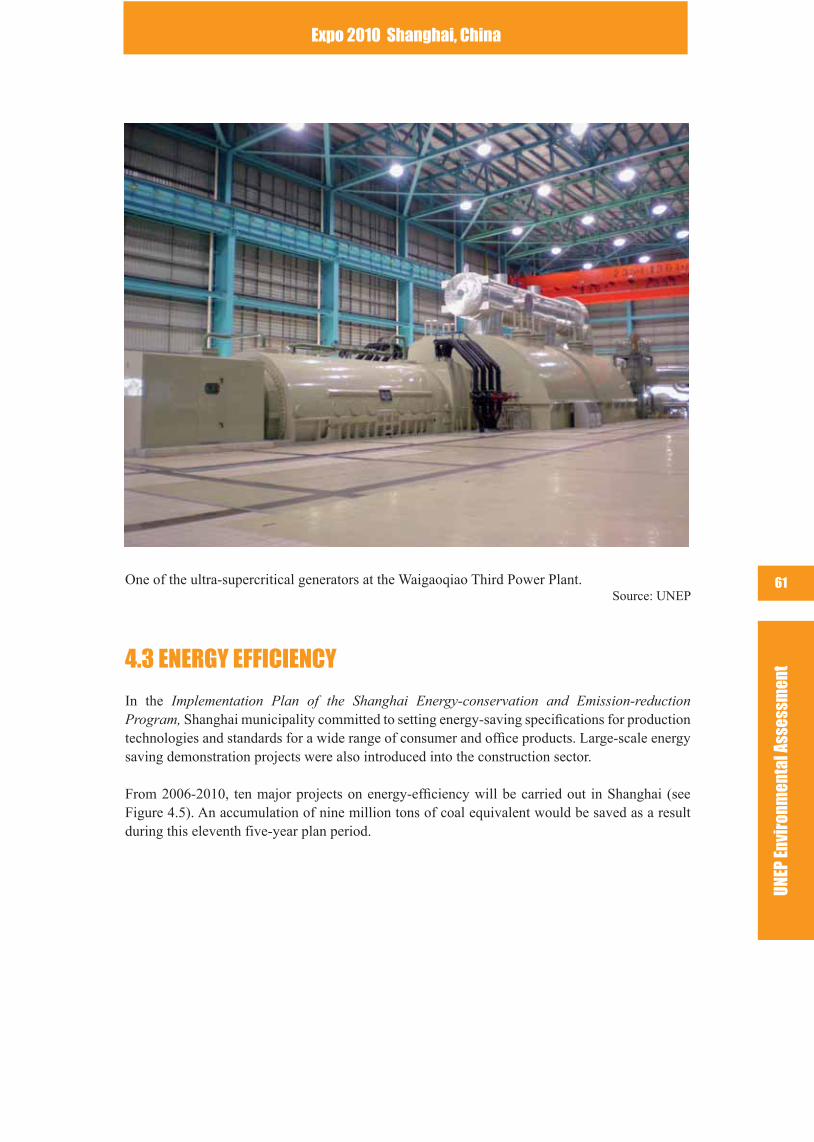
UNEP
Env
iron
men
tal A
sses
smen
t
Expo 2010 Shanghai, China
61One of the ultra-supercritical generators at the Waigaoqiao Third Power Plant. Source: UNEP
4.3 ENERGY EFFICIENCY
In the Implementation Plan of the Shanghai Energy-conservation and Emission-reduction Program, Shanghai municipality committed to setting energy-saving specications for production technologies and standards for a wide range of consumer and ofce products. Large-scale energy saving demonstration projects were also introduced into the construction sector.
From 2006-2010, ten major projects on energy-efciency will be carried out in Shanghai (see Figure 4.5). An accumulation of nine million tons of coal equivalent would be saved as a result during this eleventh five-year plan period.
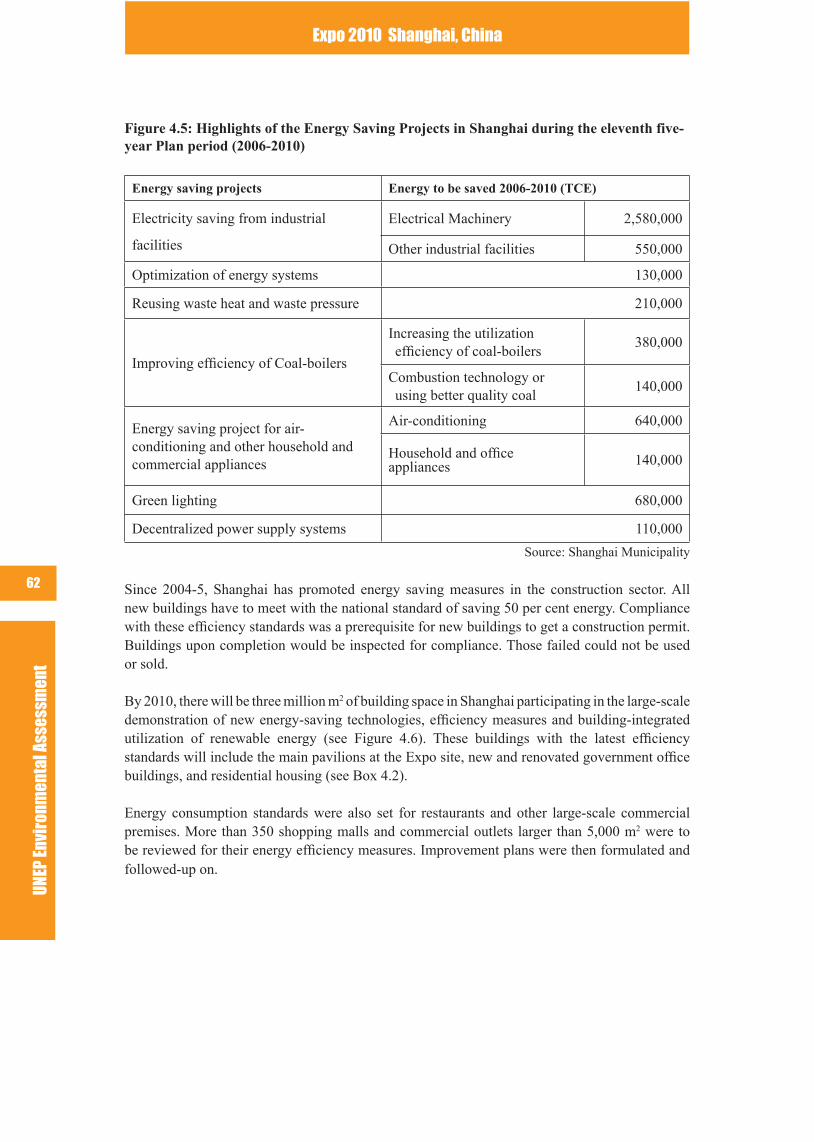
UNEP
Env
iron
men
tal A
sses
smen
tExpo 2010 Shanghai, China
62
Figure 4.5: Highlights of the Energy Saving Projects in Shanghai during the eleventh five-year Plan period (2006-2010)
Energy saving projects Energy to be saved 2006-2010 (TCE)
Electricity saving from industrial
facilities
Electrical Machinery 2,580,000
Other industrial facilities 550,000
Optimization of energy systems 130,000
Reusing waste heat and waste pressure 210,000
Improving efciency of Coal-boilers
Increasing the utilization efciency of coal-boilers
380,000
Combustion technology or using better quality coal
140,000
Energy saving project for air-conditioning and other household and commercial appliances
Air-conditioning 640,000
Household and ofce appliances 140,000
Green lighting 680,000
Decentralized power supply systems 110,000
Source: Shanghai Municipality
Since 2004-5, Shanghai has promoted energy saving measures in the construction sector. All new buildings have to meet with the national standard of saving 50 per cent energy. Compliance with these efciency standards was a prerequisite for new buildings to get a construction permit. Buildings upon completion would be inspected for compliance. Those failed could not be used or sold.
By 2010, there will be three million m2 of building space in Shanghai participating in the large-scale demonstration of new energy-saving technologies, efciency measures and building-integrated utilization of renewable energy (see Figure 4.6). These buildings with the latest efciency standards will include the main pavilions at the Expo site, new and renovated government ofce buildings, and residential housing (see Box 4.2).
Energy consumption standards were also set for restaurants and other large-scale commercial premises. More than 350 shopping malls and commercial outlets larger than 5,000 m2 were to be reviewed for their energy efciency measures. Improvement plans were then formulated and followed-up on.
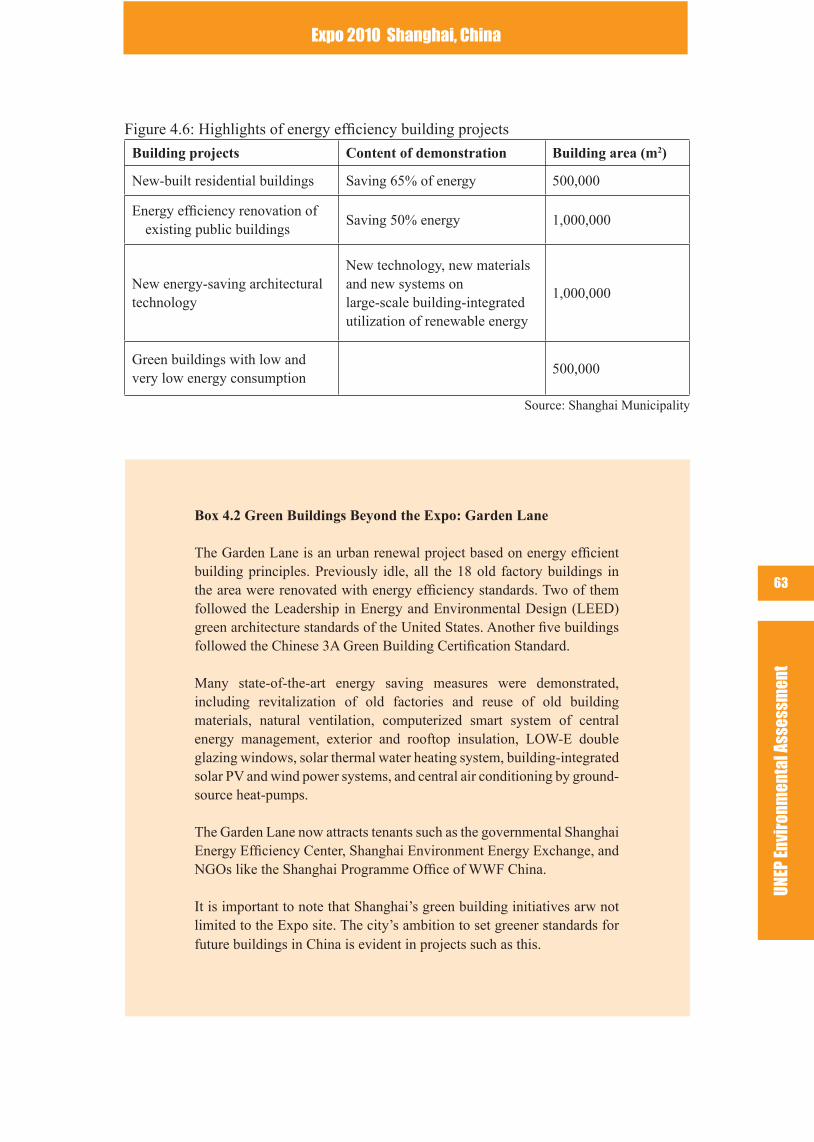
UNEP
Env
iron
men
tal A
sses
smen
t
Expo 2010 Shanghai, China
63
Figure 4.6: Highlights of energy efciency building projects
Building projects Content of demonstration Building area (m2)
New-built residential buildings Saving 65% of energy 500,000
Energy efciency renovation of existing public buildings
Saving 50% energy 1,000,000
New energy-saving architectural technology
New technology, new materials and new systems onlarge-scale building-integrated utilization of renewable energy
1,000,000
Green buildings with low and very low energy consumption
500,000
Source: Shanghai Municipality
Box 4.2 Green Buildings Beyond the Expo: Garden Lane
The Garden Lane is an urban renewal project based on energy efcient building principles. Previously idle, all the 18 old factory buildings in the area were renovated with energy efciency standards. Two of them followed the Leadership in Energy and Environmental Design (LEED) green architecture standards of the United States. Another ve buildings followed the Chinese 3A Green Building Certication Standard.
Many state-of-the-art energy saving measures were demonstrated, including revitalization of old factories and reuse of old building materials, natural ventilation, computerized smart system of central energy management, exterior and rooftop insulation, LOW-E double glazing windows, solar thermal water heating system, building-integrated solar PV and wind power systems, and central air conditioning by ground-source heat-pumps.
The Garden Lane now attracts tenants such as the governmental Shanghai Energy Efciency Center, Shanghai Environment Energy Exchange, and NGOs like the Shanghai Programme Ofce of WWF China.
It is important to note that Shanghai’s green building initiatives arw not limited to the Expo site. The city’s ambition to set greener standards for future buildings in China is evident in projects such as this.
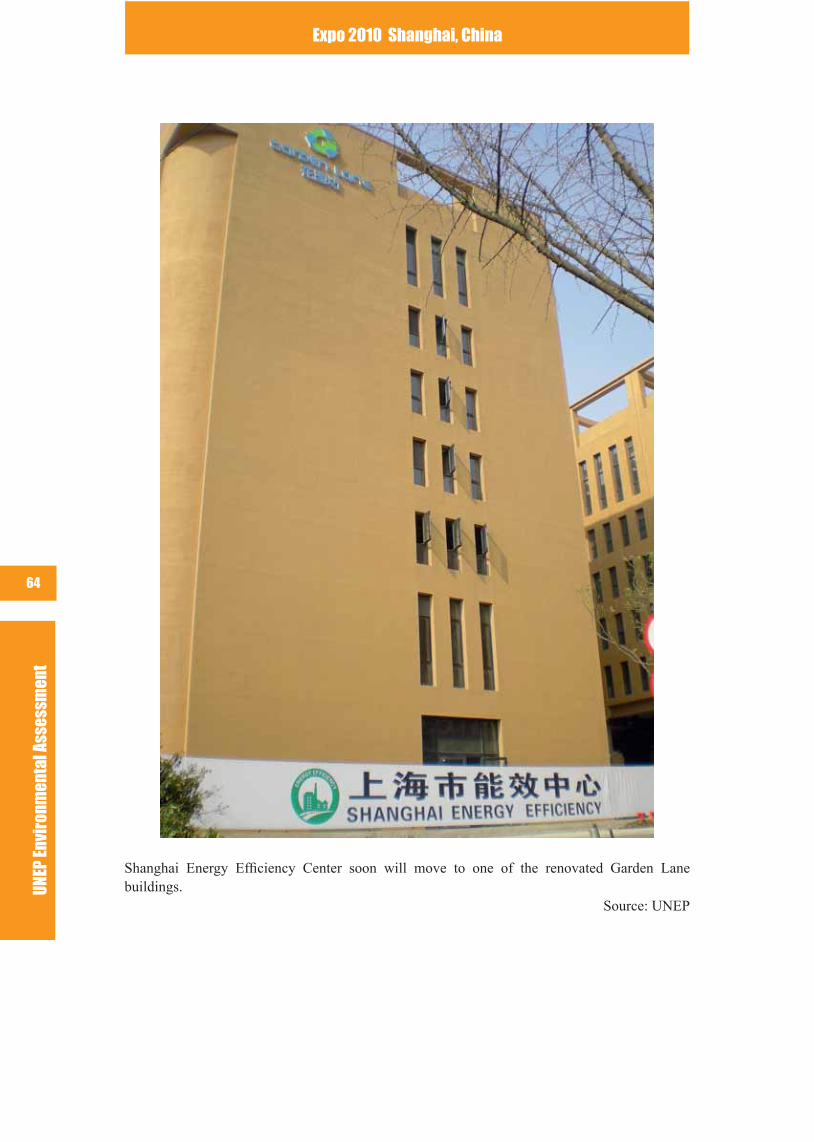
UNEP
Env
iron
men
tal A
sses
smen
tExpo 2010 Shanghai, China
64
Shanghai Energy Efciency Center soon will move to one of the renovated Garden Lane buildings.
Source: UNEP
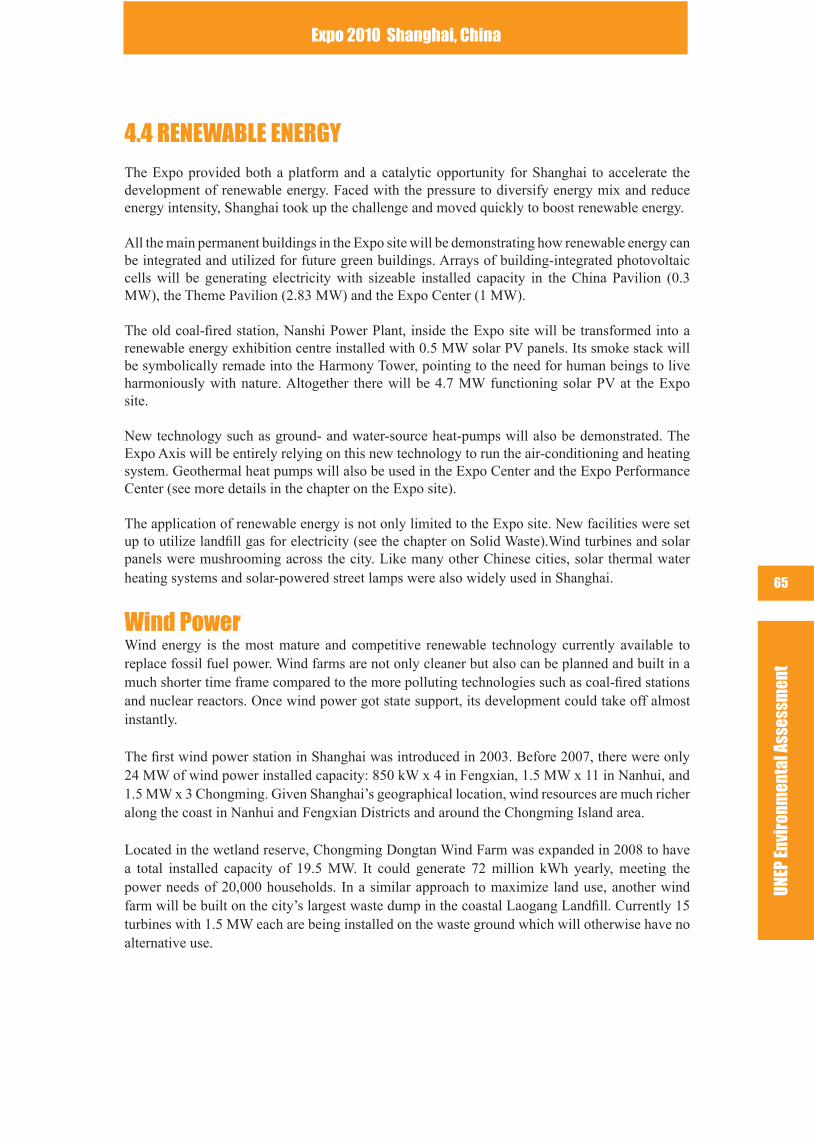
UNEP
Env
iron
men
tal A
sses
smen
t
Expo 2010 Shanghai, China
65
4.4 RENEWABLE ENERGY
The Expo provided both a platform and a catalytic opportunity for Shanghai to accelerate the development of renewable energy. Faced with the pressure to diversify energy mix and reduce energy intensity, Shanghai took up the challenge and moved quickly to boost renewable energy.
All the main permanent buildings in the Expo site will be demonstrating how renewable energy can be integrated and utilized for future green buildings. Arrays of building-integrated photovoltaic cells will be generating electricity with sizeable installed capacity in the China Pavilion (0.3 MW), the Theme Pavilion (2.83 MW) and the Expo Center (1 MW).
The old coal-red station, Nanshi Power Plant, inside the Expo site will be transformed into a renewable energy exhibition centre installed with 0.5 MW solar PV panels. Its smoke stack will be symbolically remade into the Harmony Tower, pointing to the need for human beings to live harmoniously with nature. Altogether there will be 4.7 MW functioning solar PV at the Expo site.
New technology such as ground- and water-source heat-pumps will also be demonstrated. The Expo Axis will be entirely relying on this new technology to run the air-conditioning and heating system. Geothermal heat pumps will also be used in the Expo Center and the Expo Performance Center (see more details in the chapter on the Expo site).
The application of renewable energy is not only limited to the Expo site. New facilities were set up to utilize landll gas for electricity (see the chapter on Solid Waste).Wind turbines and solar panels were mushrooming across the city. Like many other Chinese cities, solar thermal water heating systems and solar-powered street lamps were also widely used in Shanghai.
Wind PowerWind energy is the most mature and competitive renewable technology currently available to replace fossil fuel power. Wind farms are not only cleaner but also can be planned and built in a much shorter time frame compared to the more polluting technologies such as coal-red stations and nuclear reactors. Once wind power got state support, its development could take off almost instantly.
The rst wind power station in Shanghai was introduced in 2003. Before 2007, there were only 24 MW of wind power installed capacity: 850 kW x 4 in Fengxian, 1.5 MW x 11 in Nanhui, and 1.5 MW x 3 Chongming. Given Shanghai’s geographical location, wind resources are much richer along the coast in Nanhui and Fengxian Districts and around the Chongming Island area.
Located in the wetland reserve, Chongming Dongtan Wind Farm was expanded in 2008 to have a total installed capacity of 19.5 MW. It could generate 72 million kWh yearly, meeting the power needs of 20,000 households. In a similar approach to maximize land use, another wind farm will be built on the city’s largest waste dump in the coastal Laogang Landll. Currently 15 turbines with 1.5 MW each are being installed on the waste ground which will otherwise have no alternative use.
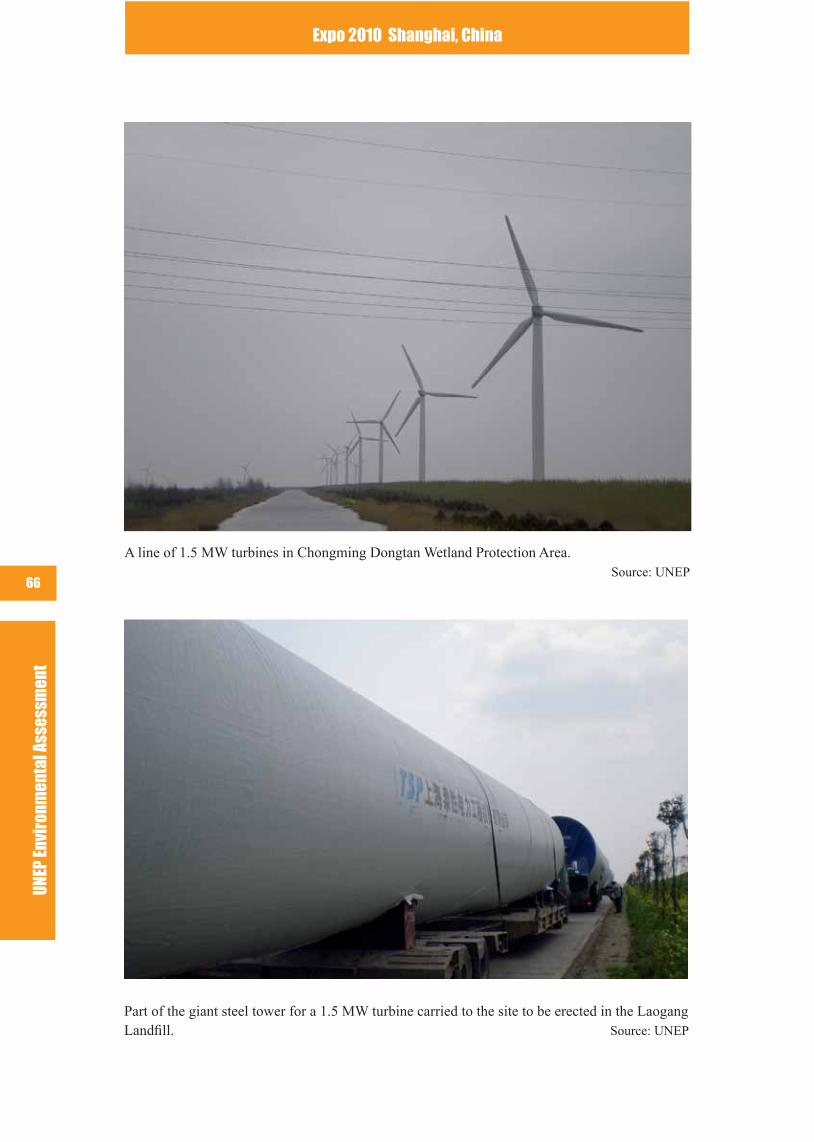
UNEP
Env
iron
men
tal A
sses
smen
tExpo 2010 Shanghai, China
66
A line of 1.5 MW turbines in Chongming Dongtan Wetland Protection Area. Source: UNEP
Part of the giant steel tower for a 1.5 MW turbine carried to the site to be erected in the Laogang Landll. Source: UNEP
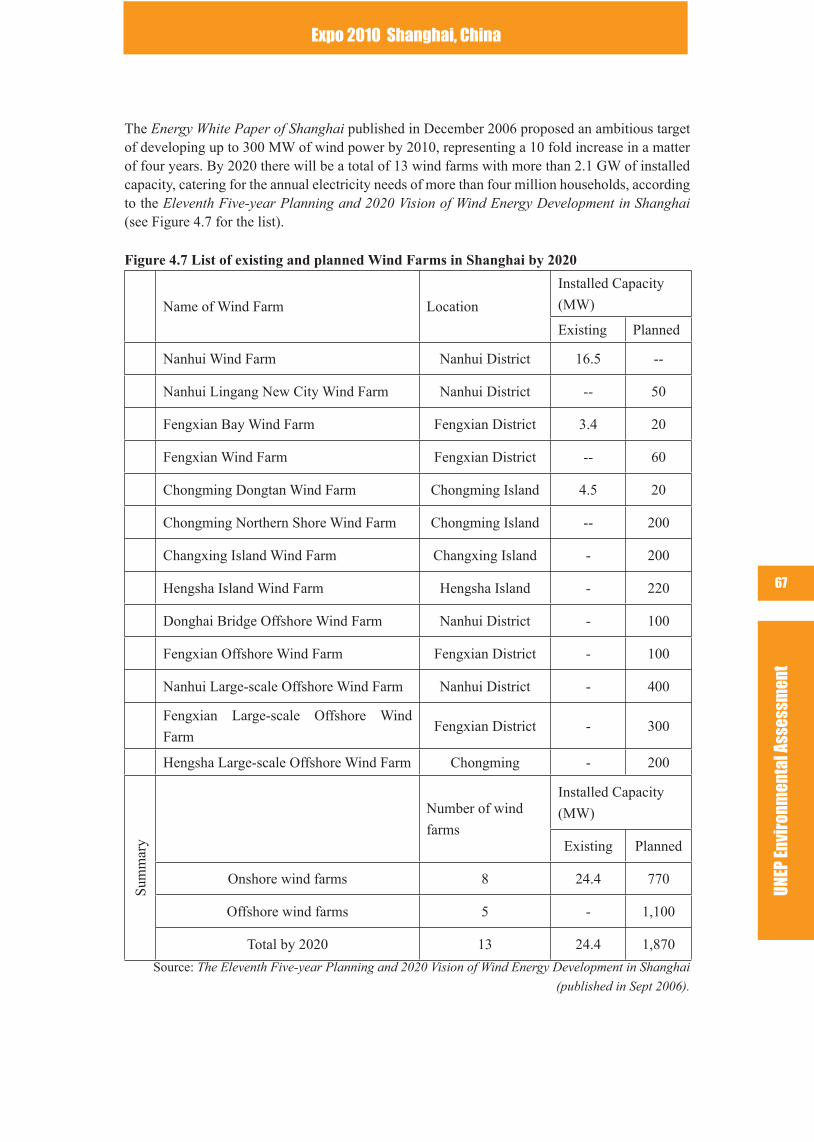
UNEP
Env
iron
men
tal A
sses
smen
t
Expo 2010 Shanghai, China
67
The Energy White Paper of Shanghai published in December 2006 proposed an ambitious target of developing up to 300 MW of wind power by 2010, representing a 10 fold increase in a matter of four years. By 2020 there will be a total of 13 wind farms with more than 2.1 GW of installed capacity, catering for the annual electricity needs of more than four million households, according to the Eleventh Five-year Planning and 2020 Vision of Wind Energy Development in Shanghai (see Figure 4.7 for the list).
Figure 4.7 List of existing and planned Wind Farms in Shanghai by 2020
Name of Wind Farm Location
Installed Capacity
(MW)
Existing Planned
Nanhui Wind Farm Nanhui District 16.5 --
Nanhui Lingang New City Wind Farm Nanhui District -- 50
Fengxian Bay Wind Farm Fengxian District 3.4 20
Fengxian Wind Farm Fengxian District -- 60
Chongming Dongtan Wind Farm Chongming Island 4.5 20
Chongming Northern Shore Wind Farm Chongming Island -- 200
Changxing Island Wind Farm Changxing Island - 200
Hengsha Island Wind Farm Hengsha Island - 220
Donghai Bridge Offshore Wind Farm Nanhui District - 100
Fengxian Offshore Wind Farm Fengxian District - 100
Nanhui Large-scale Offshore Wind Farm Nanhui District - 400
Fengxian Large-scale Offshore Wind
FarmFengxian District - 300
Hengsha Large-scale Offshore Wind Farm Chongming - 200
Sum
mar
y
Number of wind
farms
Installed Capacity
(MW)
Existing Planned
Onshore wind farms 8 24.4 770
Offshore wind farms 5 - 1,100
Total by 2020 13 24.4 1,870
Source: The Eleventh Five-year Planning and 2020 Vision of Wind Energy Development in Shanghai
(published in Sept 2006).
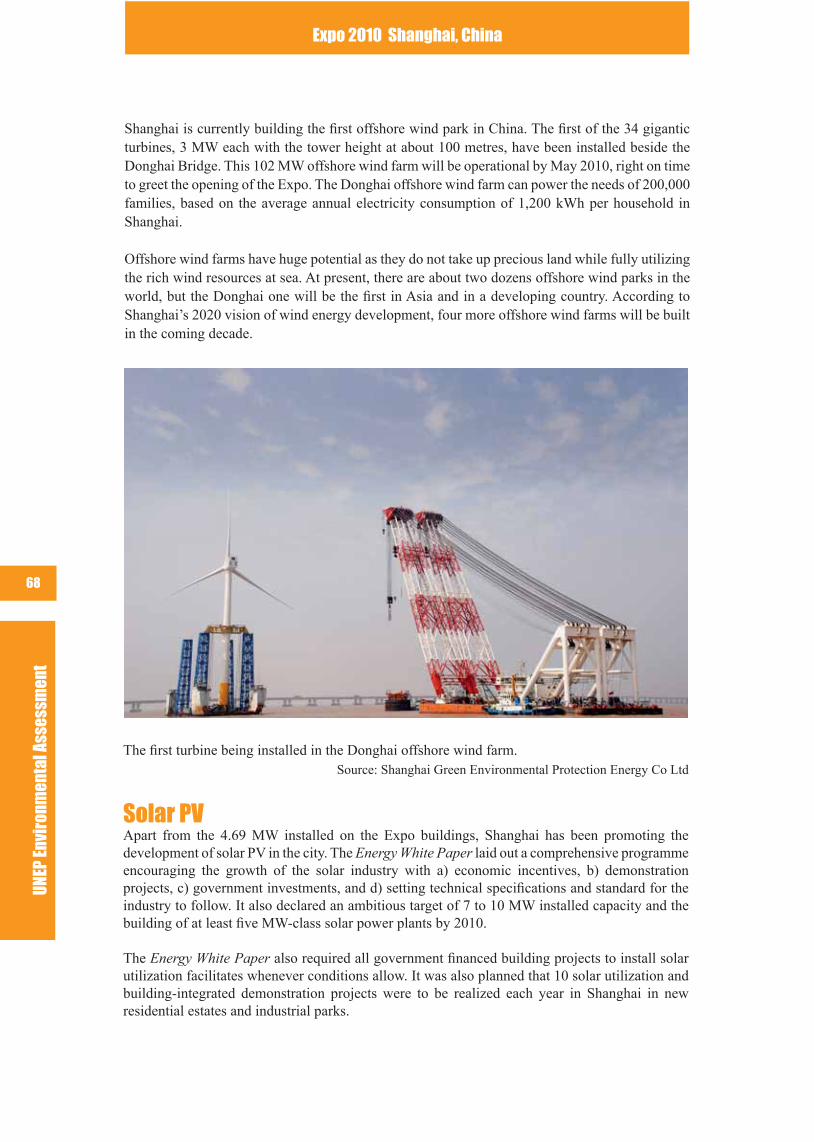
UNEP
Env
iron
men
tal A
sses
smen
tExpo 2010 Shanghai, China
68
Shanghai is currently building the rst offshore wind park in China. The rst of the 34 gigantic turbines, 3 MW each with the tower height at about 100 metres, have been installed beside the Donghai Bridge. This 102 MW offshore wind farm will be operational by May 2010, right on time to greet the opening of the Expo. The Donghai offshore wind farm can power the needs of 200,000 families, based on the average annual electricity consumption of 1,200 kWh per household in Shanghai.
Offshore wind farms have huge potential as they do not take up precious land while fully utilizing the rich wind resources at sea. At present, there are about two dozens offshore wind parks in the world, but the Donghai one will be the rst in Asia and in a developing country. According to Shanghai’s 2020 vision of wind energy development, four more offshore wind farms will be built in the coming decade.
The rst turbine being installed in the Donghai offshore wind farm. Source: Shanghai Green Environmental Protection Energy Co Ltd
Solar PVApart from the 4.69 MW installed on the Expo buildings, Shanghai has been promoting the development of solar PV in the city. The Energy White Paper laid out a comprehensive programme encouraging the growth of the solar industry with a) economic incentives, b) demonstration projects, c) government investments, and d) setting technical specications and standard for the industry to follow. It also declared an ambitious target of 7 to 10 MW installed capacity and the building of at least ve MW-class solar power plants by 2010.
The Energy White Paper also required all government nanced building projects to install solar utilization facilitates whenever conditions allow. It was also planned that 10 solar utilization and building-integrated demonstration projects were to be realized each year in Shanghai in new residential estates and industrial parks.
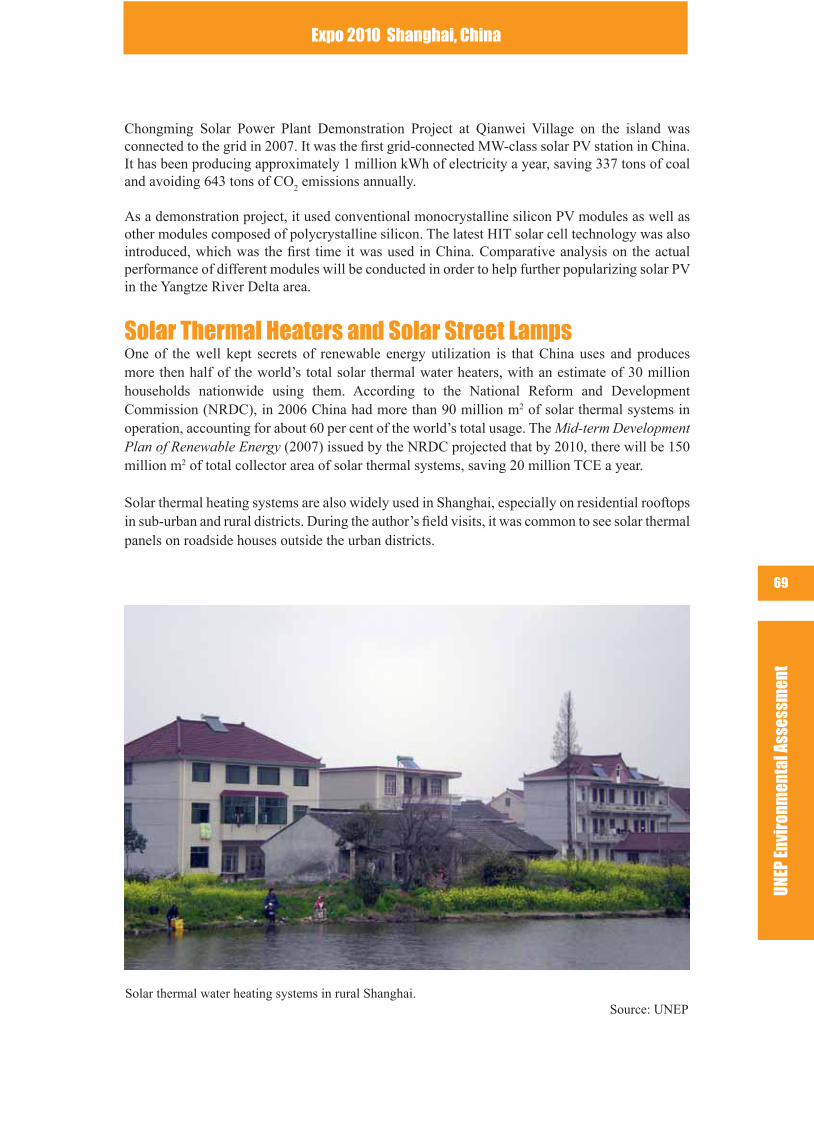
UNEP
Env
iron
men
tal A
sses
smen
t
Expo 2010 Shanghai, China
69
Chongming Solar Power Plant Demonstration Project at Qianwei Village on the island was connected to the grid in 2007. It was the rst grid-connected MW-class solar PV station in China. It has been producing approximately 1 million kWh of electricity a year, saving 337 tons of coal and avoiding 643 tons of CO
2 emissions annually.
As a demonstration project, it used conventional monocrystalline silicon PV modules as well as other modules composed of polycrystalline silicon. The latest HIT solar cell technology was also introduced, which was the rst time it was used in China. Comparative analysis on the actual performance of different modules will be conducted in order to help further popularizing solar PV in the Yangtze River Delta area.
Solar Thermal Heaters and Solar Street LampsOne of the well kept secrets of renewable energy utilization is that China uses and produces more then half of the world’s total solar thermal water heaters, with an estimate of 30 million households nationwide using them. According to the National Reform and Development Commission (NRDC), in 2006 China had more than 90 million m2 of solar thermal systems in operation, accounting for about 60 per cent of the world’s total usage. The Mid-term Development Plan of Renewable Energy (2007) issued by the NRDC projected that by 2010, there will be 150 million m2 of total collector area of solar thermal systems, saving 20 million TCE a year.
Solar thermal heating systems are also widely used in Shanghai, especially on residential rooftops in sub-urban and rural districts. During the author’s eld visits, it was common to see solar thermal panels on roadside houses outside the urban districts.
Solar thermal water heating systems in rural Shanghai. Source: UNEP
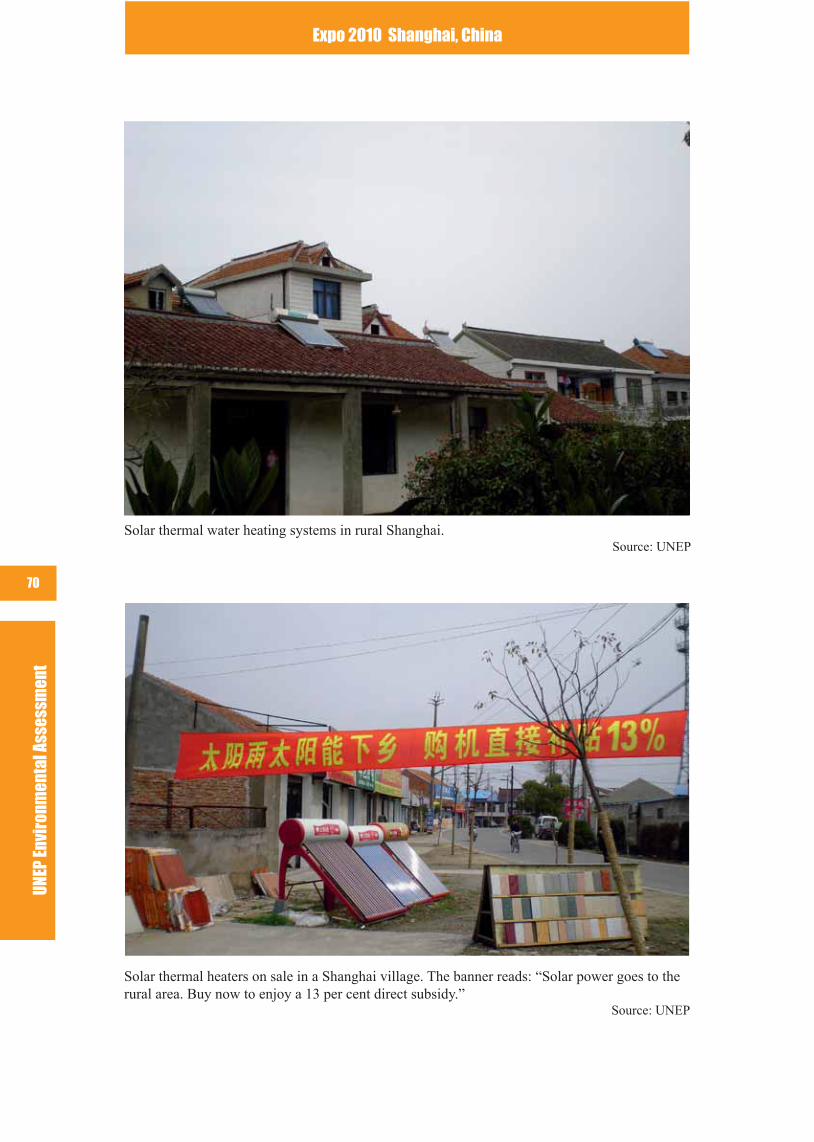
UNEP
Env
iron
men
tal A
sses
smen
tExpo 2010 Shanghai, China
70
Solar thermal heaters on sale in a Shanghai village. The banner reads: “Solar power goes to the rural area. Buy now to enjoy a 13 per cent direct subsidy.”
Source: UNEP
Solar thermal water heating systems in rural Shanghai. Source: UNEP
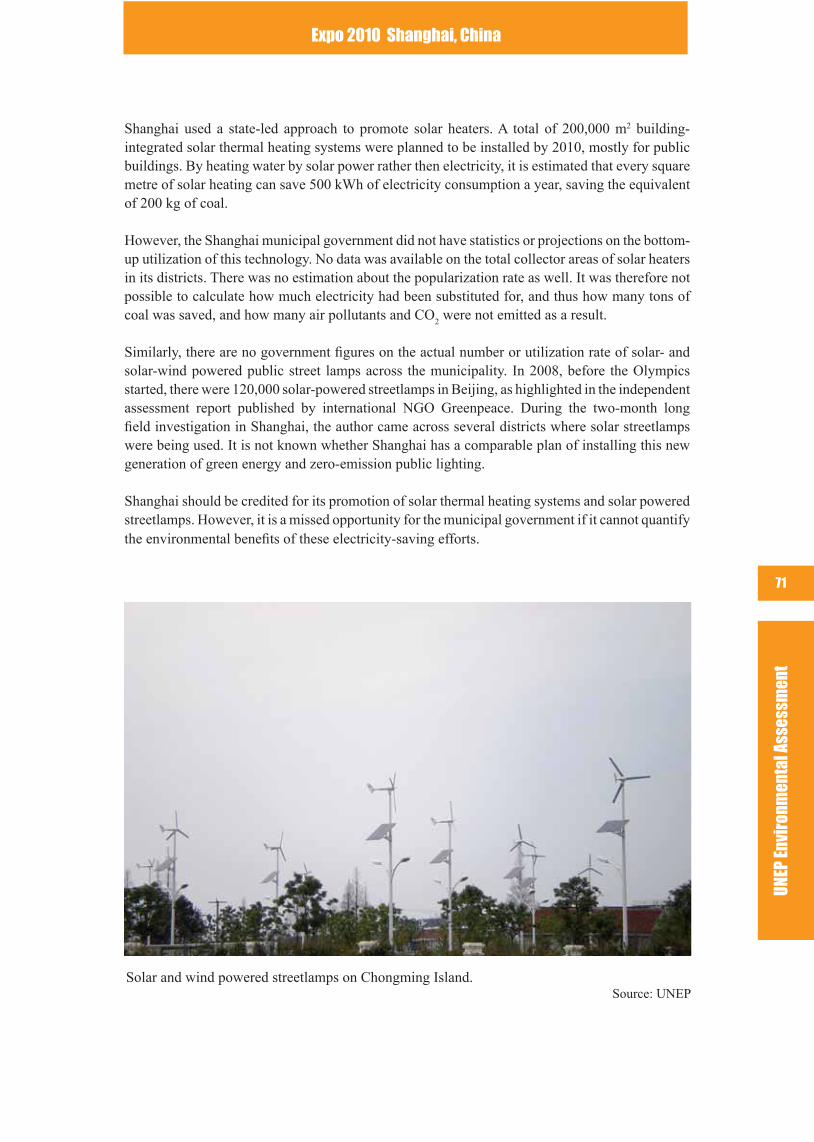
UNEP
Env
iron
men
tal A
sses
smen
t
Expo 2010 Shanghai, China
71
Shanghai used a state-led approach to promote solar heaters. A total of 200,000 m2 building-integrated solar thermal heating systems were planned to be installed by 2010, mostly for public buildings. By heating water by solar power rather then electricity, it is estimated that every square metre of solar heating can save 500 kWh of electricity consumption a year, saving the equivalent of 200 kg of coal.
However, the Shanghai municipal government did not have statistics or projections on the bottom-up utilization of this technology. No data was available on the total collector areas of solar heaters in its districts. There was no estimation about the popularization rate as well. It was therefore not possible to calculate how much electricity had been substituted for, and thus how many tons of coal was saved, and how many air pollutants and CO
2 were not emitted as a result.
Similarly, there are no government gures on the actual number or utilization rate of solar- and solar-wind powered public street lamps across the municipality. In 2008, before the Olympics started, there were 120,000 solar-powered streetlamps in Beijing, as highlighted in the independent assessment report published by international NGO Greenpeace. During the two-month long eld investigation in Shanghai, the author came across several districts where solar streetlamps were being used. It is not known whether Shanghai has a comparable plan of installing this new generation of green energy and zero-emission public lighting.
Shanghai should be credited for its promotion of solar thermal heating systems and solar powered streetlamps. However, it is a missed opportunity for the municipal government if it cannot quantify the environmental benets of these electricity-saving efforts.
Solar and wind powered streetlamps on Chongming Island. Source: UNEP
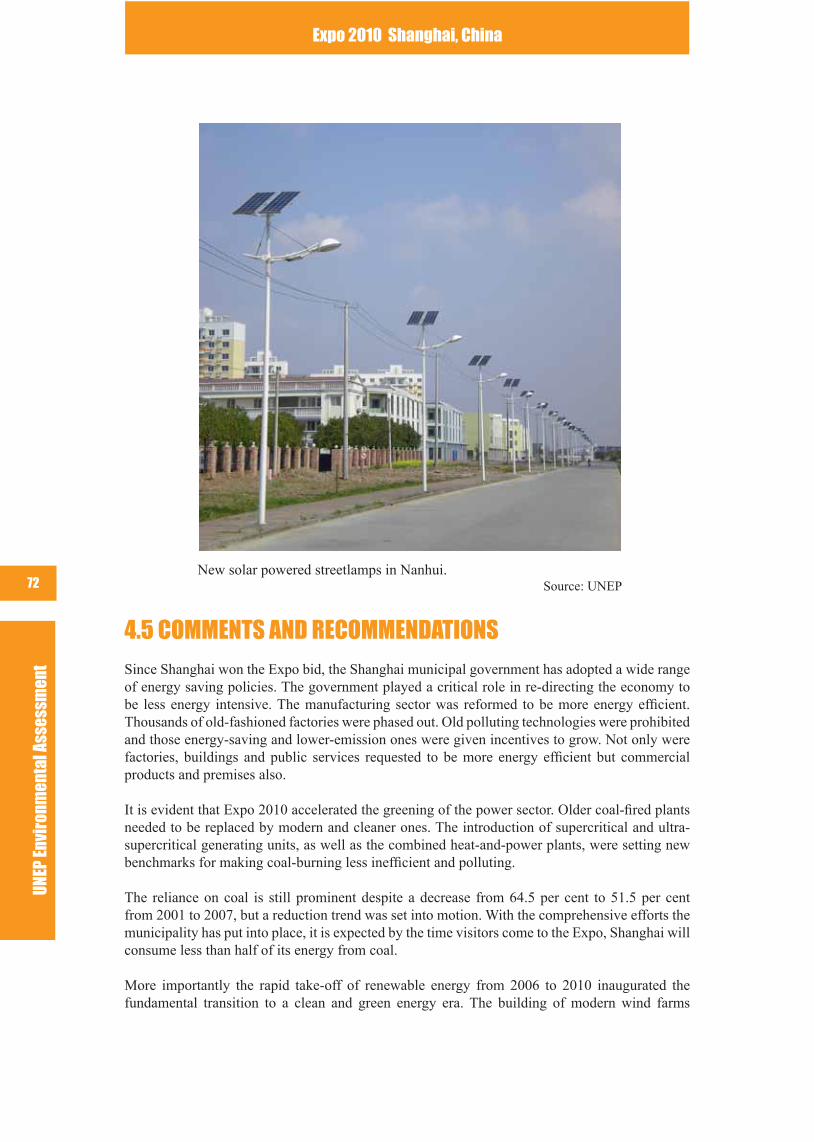
UNEP
Env
iron
men
tal A
sses
smen
tExpo 2010 Shanghai, China
72 New solar powered streetlamps in Nanhui. Source: UNEP
4.5 COMMENTS AND RECOMMENDATIONS
Since Shanghai won the Expo bid, the Shanghai municipal government has adopted a wide range of energy saving policies. The government played a critical role in re-directing the economy to be less energy intensive. The manufacturing sector was reformed to be more energy efcient. Thousands of old-fashioned factories were phased out. Old polluting technologies were prohibited and those energy-saving and lower-emission ones were given incentives to grow. Not only were factories, buildings and public services requested to be more energy efcient but commercial products and premises also.
It is evident that Expo 2010 accelerated the greening of the power sector. Older coal-red plants needed to be replaced by modern and cleaner ones. The introduction of supercritical and ultra-supercritical generating units, as well as the combined heat-and-power plants, were setting new benchmarks for making coal-burning less inefcient and polluting.
The reliance on coal is still prominent despite a decrease from 64.5 per cent to 51.5 per cent from 2001 to 2007, but a reduction trend was set into motion. With the comprehensive efforts the municipality has put into place, it is expected by the time visitors come to the Expo, Shanghai will consume less than half of its energy from coal.
More importantly the rapid take-off of renewable energy from 2006 to 2010 inaugurated the fundamental transition to a clean and green energy era. The building of modern wind farms

UNEP
Env
iron
men
tal A
sses
smen
t
Expo 2010 Shanghai, China
73
presents renewable energy as a new component in the energy mix. The 200-300 MW wind power added in this period will account for about one per cent of the grid capacity by 2010. The 102 MW Donghai offshore wind farm was the most iconic symbol of this clean energy advancement. The demonstration of solar PV plants, the utilization of solar thermal heating systems, and the gradual installation of solar powered public street lighting are all clear signals of how new green energy was embraced and promoted in Shanghai.
The demonstration of green technologies such as solar PV and geothermal heat-pumps as well as the introduction of green buildings and related energy efciency technologies in the Expo Park appropriately honour the theme of the 2010 World Expo: “Better City, Better Life.”
These technologies and measures on energy efciency in general and the power sector in particular, together with those on transport discussed, were evident in making impressive results for a greener Shanghai. The energy intensity of the municipality was 0.79 TCE per RMB 10,000 GDP in 2008, a 31 per cent drop from 2000. Since the economic share of the tertiary sector increased only by 3 per cent during the same period, this impressive improvements could largely be attributed to the greening efforts.
With these integrated measures in multiple sectors, it is hoped that Shanghai will meet its over-arching target of a 20 per cent reduction in energy intensity by 2010, compared to 2005 level. UNEP believes that without the leadership and vision of the Shanghai municipal government, it would be impossible to make this impressive progress.
Figure 4.8 Changes of Energy Intensity in Shanghai (2000-2008)
Source: Shanghai EPB
Demand-side managementUNEP thinks that Shanghai should be applauded for its impressive achievement in improving energy intensity against a background of rapid economic development. However, the city’s dependency on coal is still relatively high. The demand for more energy in absolute terms and the increase of per capita energy consumption is still on the rise. As shown in Figure 4.9, Shanghai has higher per capita energy consumption than Beijing in recent years. In 2007, it was more than double the national average.
Shanghai should consider promoting stronger demand-side management strategies, not only to government ofces, factories and commercial entities, but also to the general public. The public
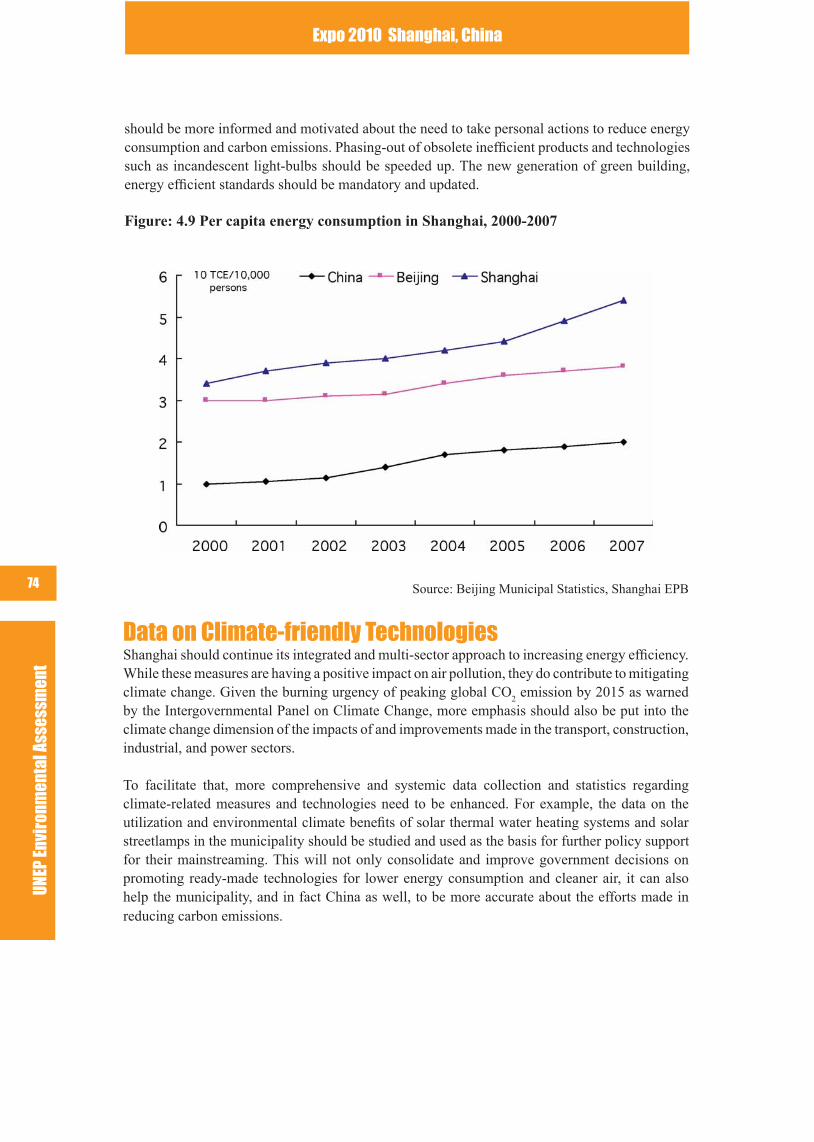
UNEP
Env
iron
men
tal A
sses
smen
tExpo 2010 Shanghai, China
74
should be more informed and motivated about the need to take personal actions to reduce energy consumption and carbon emissions. Phasing-out of obsolete inefcient products and technologies such as incandescent light-bulbs should be speeded up. The new generation of green building, energy efcient standards should be mandatory and updated.
Figure: 4.9 Per capita energy consumption in Shanghai, 2000-2007
Source: Beijing Municipal Statistics, Shanghai EPB
Data on Climate-friendly TechnologiesShanghai should continue its integrated and multi-sector approach to increasing energy efciency. While these measures are having a positive impact on air pollution, they do contribute to mitigating climate change. Given the burning urgency of peaking global CO
2 emission by 2015 as warned
by the Intergovernmental Panel on Climate Change, more emphasis should also be put into the climate change dimension of the impacts of and improvements made in the transport, construction, industrial, and power sectors.
To facilitate that, more comprehensive and systemic data collection and statistics regarding climate-related measures and technologies need to be enhanced. For example, the data on the utilization and environmental climate benets of solar thermal water heating systems and solar streetlamps in the municipality should be studied and used as the basis for further policy support for their mainstreaming. This will not only consolidate and improve government decisions on promoting ready-made technologies for lower energy consumption and cleaner air, it can also help the municipality, and in fact China as well, to be more accurate about the efforts made in reducing carbon emissions.
UNEP
Env
iron
men
tal A
sses
smen
t
Expo 2010 Shanghai, China
75
Higher Renewable Energy AmbitionWith the successful initiation of renewable energy into the grid, the Shanghai municipal government should be more condent and ambitious in promoting massive take-up of wind and solar power. Pricing reform, nancial incentives, de-subsidization of coal in its social and environmental entities, environment or carbon tax, and other economic measures should be considered to further prioritize the development of genuinely green and sustainable renewable technologies.
In recent years, wind energy on a commercial scale has taken off, with a government-mandated target of 30 GW by 2020. According to the China Wind Power Report 2007 published by the Chinese Renewable Energy Industries Association (CREIA), Greenpeace and Global Wind Energy Council (GWEC), installed wind power capacity could reach 122 GW by 2020, equivalent to the capacity of ve Three Gorges Dams, producing about 10 per cent of the country’s electricity needs.
Recently, the Chinese government tripled its target for wind power capacity to 100 GW by 2020. In light of this newly elevated condence in wind power, Shanghai should consider if the current plan of 2.1 GW by 2020, which is only 5 per cent of the national total, is not too conservative. Shanghai could look into further utilization of offshore wind resources, based on its successful Donghai project.
Shanghai can go further to support the booming Chinese solar industry. China is one of the three largest manufacturers of solar PV cells, producing one quarter of the total. However, more than 90 per cent of them are for export. With its rich experience in introducing new technologies and its political determination matched with nancial strength, Shanghai can help to gradually expand the domestic market for solar panels and unleash the full potential of these green technologies.
UNEP
Env
iron
men
tal A
sses
smen
tExpo 2010 Shanghai, China
76
5. SOLID WASTEOne of the most difcult challenges cities around the world are facing is the ever-increasing amount of municipal solid waste. Shanghai as a densely populated and rapidly growing city in China and is no exception.
It is particularly pertinent that the organizer of the Expo given that the theme is “Better City, Better Life” to be well-equipped to handle the waste generated by its citizens in a sound and sustainable way.
As Shanghai had a rather underdeveloped infrastructure in the late 1990s when it prepared its bid for the Expo, it has not been an easy task for the municipality to cope with growing domestic solid waste and other hazardous waste in such a short period. It is even more challenging for Shanghai to transform its waste strategy from one focusing on expanding treatment facilities to that of reducing waste at source and eventually moving towards a visionary zero-waste society.
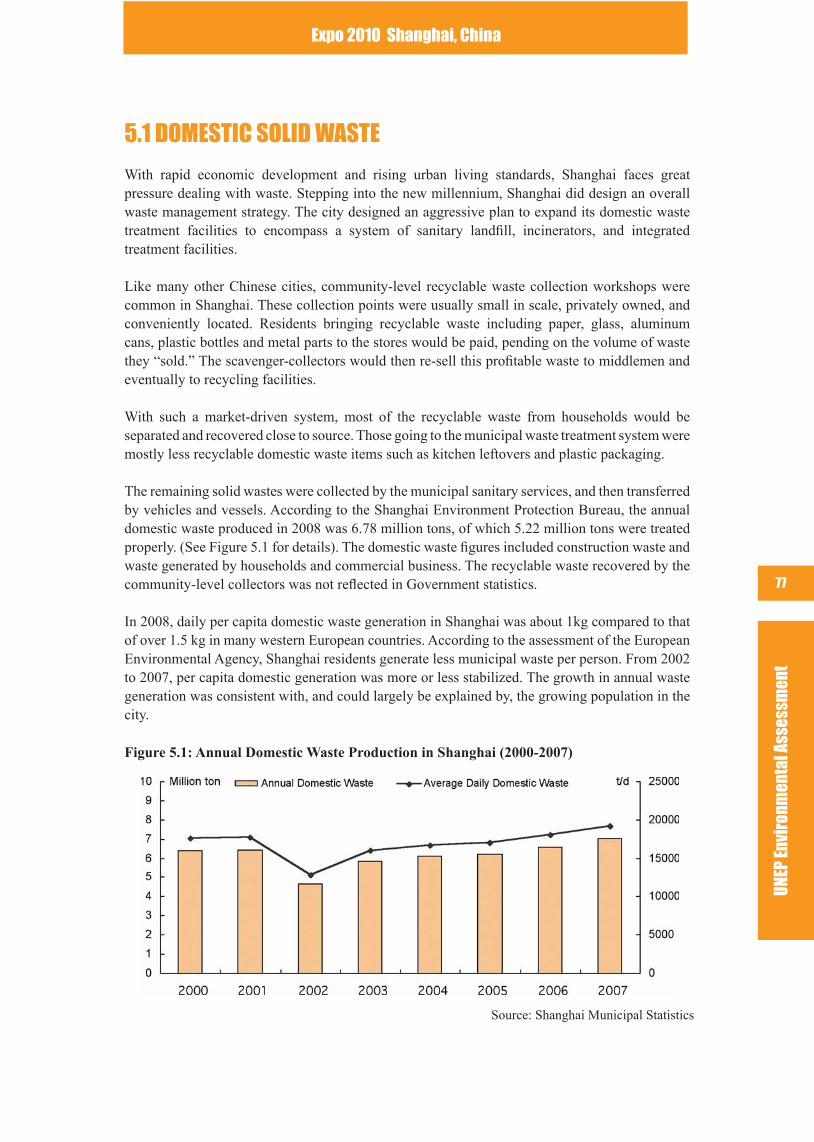
UNEP
Env
iron
men
tal A
sses
smen
t
Expo 2010 Shanghai, China
77
5.1 DOMESTIC SOLID WASTE
With rapid economic development and rising urban living standards, Shanghai faces great pressure dealing with waste. Stepping into the new millennium, Shanghai did design an overall waste management strategy. The city designed an aggressive plan to expand its domestic waste treatment facilities to encompass a system of sanitary landll, incinerators, and integrated treatment facilities.
Like many other Chinese cities, community-level recyclable waste collection workshops were common in Shanghai. These collection points were usually small in scale, privately owned, and conveniently located. Residents bringing recyclable waste including paper, glass, aluminum cans, plastic bottles and metal parts to the stores would be paid, pending on the volume of waste they “sold.” The scavenger-collectors would then re-sell this protable waste to middlemen and eventually to recycling facilities.
With such a market-driven system, most of the recyclable waste from households would be separated and recovered close to source. Those going to the municipal waste treatment system were mostly less recyclable domestic waste items such as kitchen leftovers and plastic packaging.
The remaining solid wastes were collected by the municipal sanitary services, and then transferred by vehicles and vessels. According to the Shanghai Environment Protection Bureau, the annual domestic waste produced in 2008 was 6.78 million tons, of which 5.22 million tons were treated properly. (See Figure 5.1 for details). The domestic waste gures included construction waste and waste generated by households and commercial business. The recyclable waste recovered by the community-level collectors was not reected in Government statistics.
In 2008, daily per capita domestic waste generation in Shanghai was about 1kg compared to that of over 1.5 kg in many western European countries. According to the assessment of the European Environmental Agency, Shanghai residents generate less municipal waste per person. From 2002 to 2007, per capita domestic generation was more or less stabilized. The growth in annual waste generation was consistent with, and could largely be explained by, the growing population in the city.
Figure 5.1: Annual Domestic Waste Production in Shanghai (2000-2007)
Source: Shanghai Municipal Statistics
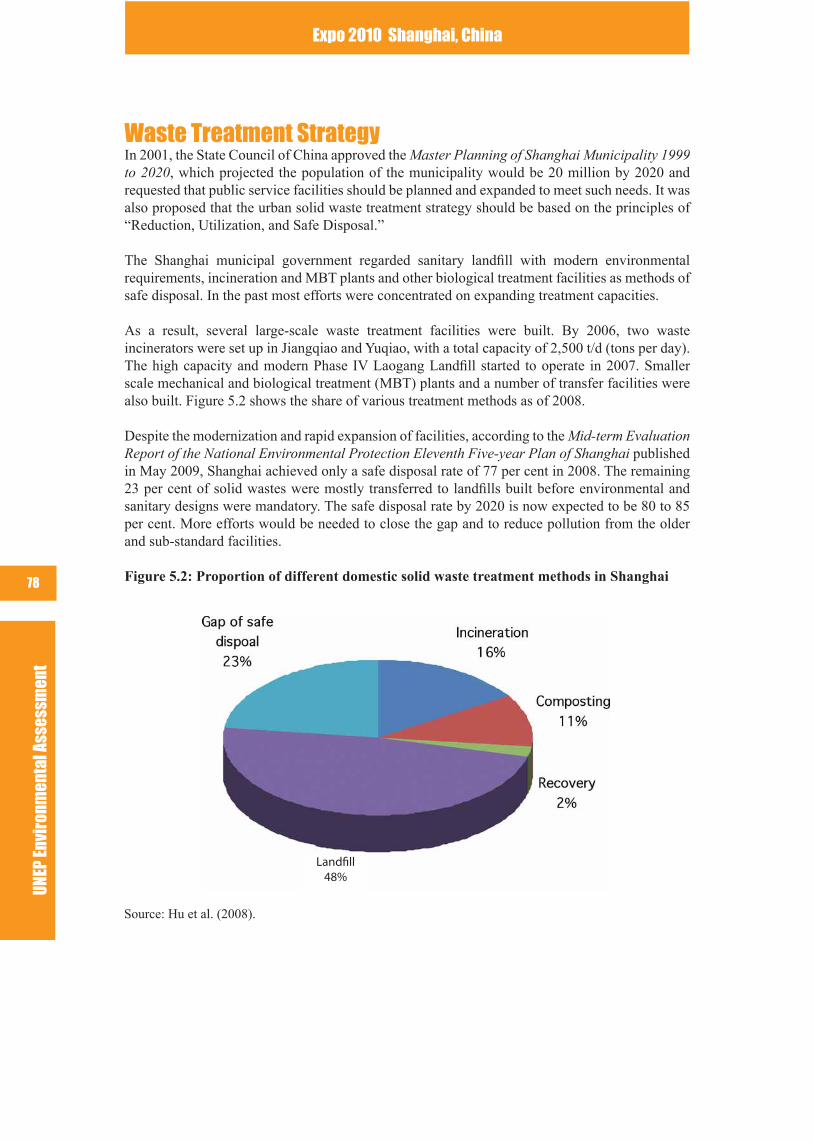
UNEP
Env
iron
men
tal A
sses
smen
tExpo 2010 Shanghai, China
78
Waste Treatment StrategyIn 2001, the State Council of China approved the Master Planning of Shanghai Municipality 1999 to 2020, which projected the population of the municipality would be 20 million by 2020 and requested that public service facilities should be planned and expanded to meet such needs. It was also proposed that the urban solid waste treatment strategy should be based on the principles of “Reduction, Utilization, and Safe Disposal.”
The Shanghai municipal government regarded sanitary landll with modern environmental requirements, incineration and MBT plants and other biological treatment facilities as methods of safe disposal. In the past most efforts were concentrated on expanding treatment capacities.
As a result, several large-scale waste treatment facilities were built. By 2006, two waste incinerators were set up in Jiangqiao and Yuqiao, with a total capacity of 2,500 t/d (tons per day). The high capacity and modern Phase IV Laogang Landll started to operate in 2007. Smaller scale mechanical and biological treatment (MBT) plants and a number of transfer facilities were also built. Figure 5.2 shows the share of various treatment methods as of 2008.
Despite the modernization and rapid expansion of facilities, according to the Mid-term Evaluation Report of the National Environmental Protection Eleventh Five-year Plan of Shanghai published in May 2009, Shanghai achieved only a safe disposal rate of 77 per cent in 2008. The remaining 23 per cent of solid wastes were mostly transferred to landlls built before environmental and sanitary designs were mandatory. The safe disposal rate by 2020 is now expected to be 80 to 85 per cent. More efforts would be needed to close the gap and to reduce pollution from the older and sub-standard facilities.
Figure 5.2: Proportion of different domestic solid waste treatment methods in Shanghai
Source: Hu et al. (2008).
Landfill48%
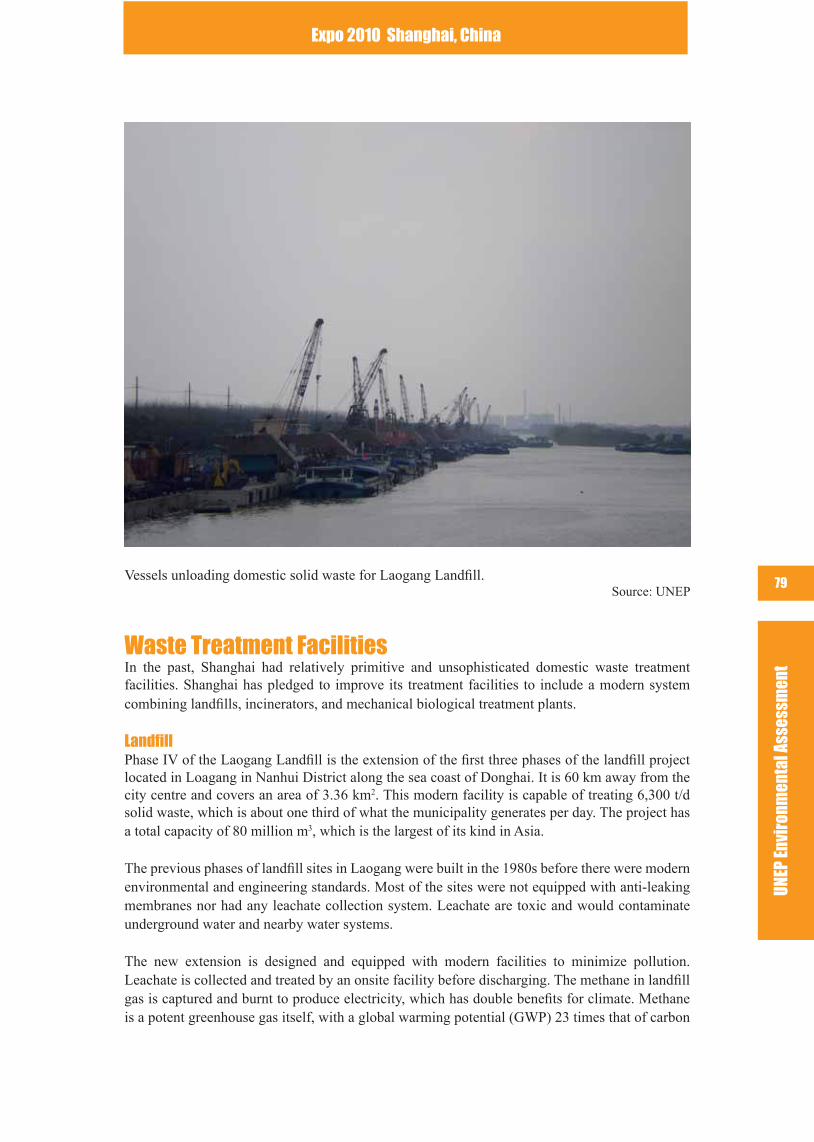
UNEP
Env
iron
men
tal A
sses
smen
t
Expo 2010 Shanghai, China
79Vessels unloading domestic solid waste for Laogang Landll.
Source: UNEP
Waste Treatment FacilitiesIn the past, Shanghai had relatively primitive and unsophisticated domestic waste treatment facilities. Shanghai has pledged to improve its treatment facilities to include a modern system combining landlls, incinerators, and mechanical biological treatment plants.
LandfillPhase IV of the Laogang Landll is the extension of the rst three phases of the landll project located in Loagang in Nanhui District along the sea coast of Donghai. It is 60 km away from the city centre and covers an area of 3.36 km2. This modern facility is capable of treating 6,300 t/d solid waste, which is about one third of what the municipality generates per day. The project has a total capacity of 80 million m3, which is the largest of its kind in Asia.
The previous phases of landll sites in Laogang were built in the 1980s before there were modern environmental and engineering standards. Most of the sites were not equipped with anti-leaking membranes nor had any leachate collection system. Leachate are toxic and would contaminate underground water and nearby water systems.
The new extension is designed and equipped with modern facilities to minimize pollution. Leachate is collected and treated by an onsite facility before discharging. The methane in landll gas is captured and burnt to produce electricity, which has double benets for climate. Methane is a potent greenhouse gas itself, with a global warming potential (GWP) 23 times that of carbon
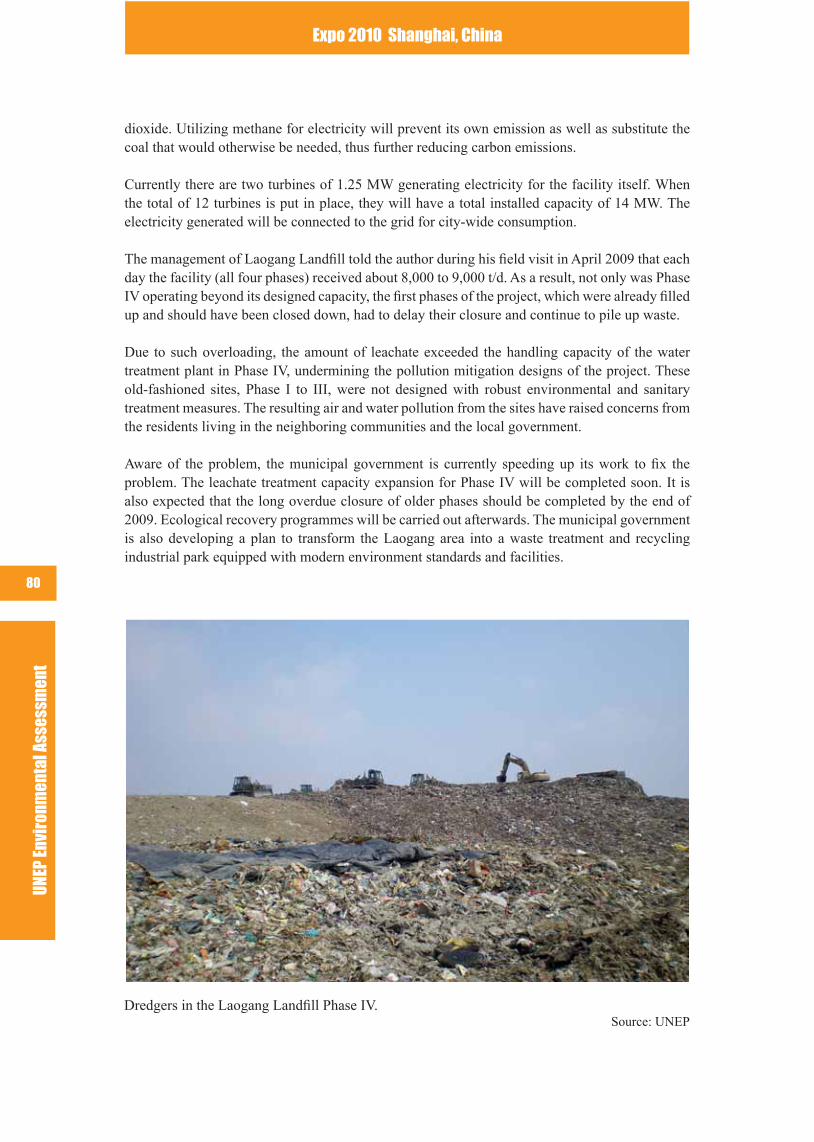
UNEP
Env
iron
men
tal A
sses
smen
tExpo 2010 Shanghai, China
80
dioxide. Utilizing methane for electricity will prevent its own emission as well as substitute the coal that would otherwise be needed, thus further reducing carbon emissions.
Currently there are two turbines of 1.25 MW generating electricity for the facility itself. When the total of 12 turbines is put in place, they will have a total installed capacity of 14 MW. The electricity generated will be connected to the grid for city-wide consumption.
The management of Laogang Landll told the author during his eld visit in April 2009 that each day the facility (all four phases) received about 8,000 to 9,000 t/d. As a result, not only was Phase IV operating beyond its designed capacity, the rst phases of the project, which were already lled up and should have been closed down, had to delay their closure and continue to pile up waste.
Due to such overloading, the amount of leachate exceeded the handling capacity of the water treatment plant in Phase IV, undermining the pollution mitigation designs of the project. These old-fashioned sites, Phase I to III, were not designed with robust environmental and sanitary treatment measures. The resulting air and water pollution from the sites have raised concerns from the residents living in the neighboring communities and the local government.
Aware of the problem, the municipal government is currently speeding up its work to x the problem. The leachate treatment capacity expansion for Phase IV will be completed soon. It is also expected that the long overdue closure of older phases should be completed by the end of 2009. Ecological recovery programmes will be carried out afterwards. The municipal government is also developing a plan to transform the Laogang area into a waste treatment and recycling industrial park equipped with modern environment standards and facilities.
Dredgers in the Laogang Landll Phase IV. Source: UNEP
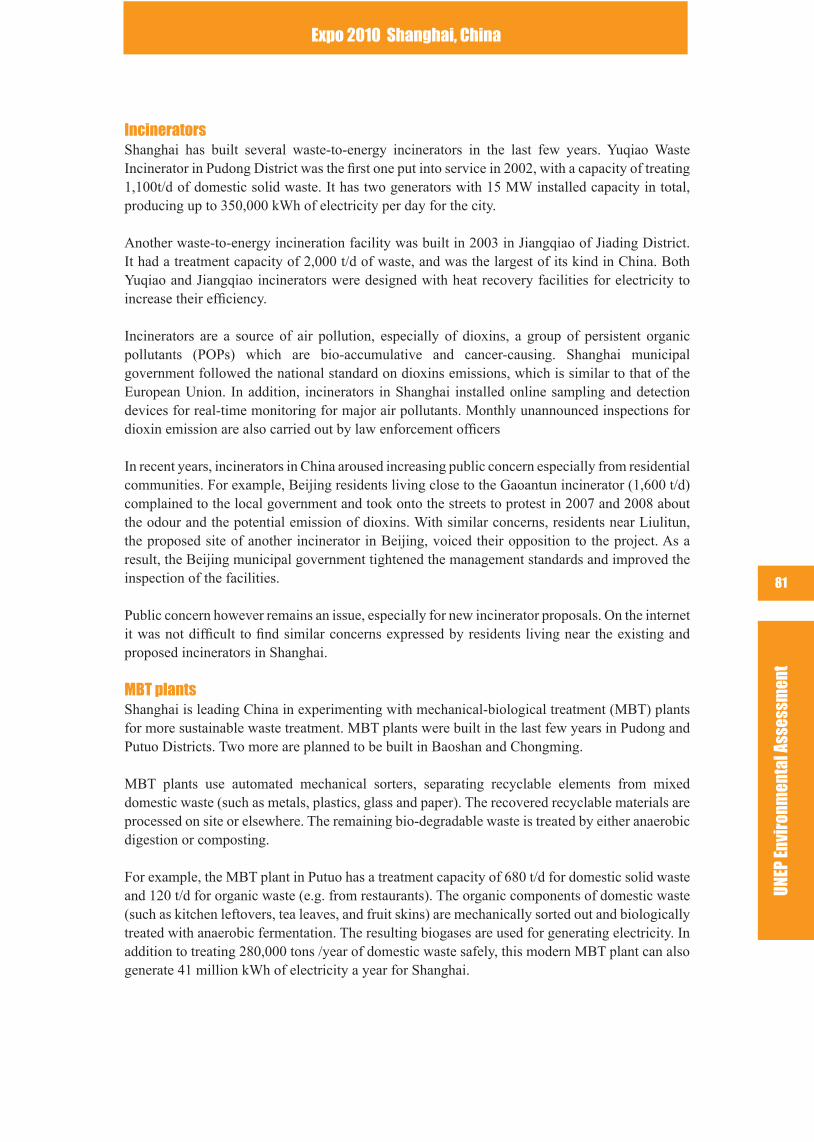
UNEP
Env
iron
men
tal A
sses
smen
t
Expo 2010 Shanghai, China
81
IncineratorsShanghai has built several waste-to-energy incinerators in the last few years. Yuqiao Waste Incinerator in Pudong District was the rst one put into service in 2002, with a capacity of treating 1,100t/d of domestic solid waste. It has two generators with 15 MW installed capacity in total, producing up to 350,000 kWh of electricity per day for the city.
Another waste-to-energy incineration facility was built in 2003 in Jiangqiao of Jiading District. It had a treatment capacity of 2,000 t/d of waste, and was the largest of its kind in China. Both Yuqiao and Jiangqiao incinerators were designed with heat recovery facilities for electricity to increase their efciency.
Incinerators are a source of air pollution, especially of dioxins, a group of persistent organic pollutants (POPs) which are bio-accumulative and cancer-causing. Shanghai municipal government followed the national standard on dioxins emissions, which is similar to that of the European Union. In addition, incinerators in Shanghai installed online sampling and detection devices for real-time monitoring for major air pollutants. Monthly unannounced inspections for dioxin emission are also carried out by law enforcement ofcers
In recent years, incinerators in China aroused increasing public concern especially from residential communities. For example, Beijing residents living close to the Gaoantun incinerator (1,600 t/d) complained to the local government and took onto the streets to protest in 2007 and 2008 about the odour and the potential emission of dioxins. With similar concerns, residents near Liulitun, the proposed site of another incinerator in Beijing, voiced their opposition to the project. As a result, the Beijing municipal government tightened the management standards and improved the inspection of the facilities.
Public concern however remains an issue, especially for new incinerator proposals. On the internet it was not difcult to nd similar concerns expressed by residents living near the existing and proposed incinerators in Shanghai.
MBT plantsShanghai is leading China in experimenting with mechanical-biological treatment (MBT) plants for more sustainable waste treatment. MBT plants were built in the last few years in Pudong and Putuo Districts. Two more are planned to be built in Baoshan and Chongming.
MBT plants use automated mechanical sorters, separating recyclable elements from mixed domestic waste (such as metals, plastics, glass and paper). The recovered recyclable materials are processed on site or elsewhere. The remaining bio-degradable waste is treated by either anaerobic digestion or composting.
For example, the MBT plant in Putuo has a treatment capacity of 680 t/d for domestic solid waste and 120 t/d for organic waste (e.g. from restaurants). The organic components of domestic waste (such as kitchen leftovers, tea leaves, and fruit skins) are mechanically sorted out and biologically treated with anaerobic fermentation. The resulting biogases are used for generating electricity. In addition to treating 280,000 tons /year of domestic waste safely, this modern MBT plant can also generate 41 million kWh of electricity a year for Shanghai.

UNEP
Env
iron
men
tal A
sses
smen
tExpo 2010 Shanghai, China
82
MBT plants are more advanced in maximizing the recovery and recycling of useful resources which have ended up in the domestic waste system. Biogases can be utilized for electricity generation. Separately collected biowaste from restaurants and hotels could be treated and used as organic fertilizer. Compared to large-scale centralized facilities such as landlls and incinerators, decentralized MBT plants have the additional benets of reducing energy consumption and pollution from waste transfer.
5.2 HAZARDOUS WASTE
Shanghai expanded and modernized its capacity to handle hazardous waste in the last decade. Since 1998, a business permit system has been established to encourage more investment, customer-based services, and marketized operation. By the end of 2008, the municipality had a network of certied facilities on safe disposal, recycling and reuse, and incineration, covering 32 kinds of hazardous materials. They can safely store and treat 420,000 tons of industrial hazardous waste. A medical waste incinerator was also built in 2006 with an annual capacity of 25,000 tons, servicing all the hospitals in the city.
Given the growing problem of electronic waste, especially in cities experiencing a rapid growth in information technology, it is worth noting that Shanghai has encouraged and supported the development of world-class treatment facilities specializing in electronic wastes. Shanghai and its nearby cities comprise one of the world’s largest metropolises, as well as act as a high-tech production centre for global consumers. Demands to safely treat consumer and industrial electronic waste, such as computers, TVs, household appliances, integrated circuit boards, and catalytic converters, are on the rise.
The TES-AMM facility, started in 2005 and located in the Jiading Industrial Park of Shanghai, was the rst and largest electronic waste treatment plant in China with an annual capacity of handling 10,000 tons of electronic waste per year. It received not only waste from industrial and governmental bodies, but also from communities including waste collected in “green boxes” in 130 schools in Shanghai. At the end of the treatment cycle, useful materials including precious metals such as platinum group metals, gold and silver can be recovered for reuse.
5.3 WASTE IN THE EXPO VENUES
Shanghai is committed to achieving a 100 per cent collection rate for construction and domestic solid waste generated inside the Expo Park. It has also promised 50 per cent reuse rate of the waste. Wastes are to be sorted, classied, and then transferred to the municipal network of treatment facilities for utilization or safe disposal.
An advanced enclosed aero-dynamic waste collection and transfer system will also be constructed underground in the Expo Park. It is not clear what emergency plan has been formulated in case of system failure or blockage, which did happen in similar systems elsewhere.
The Shanghai organizer is developing measures on waste reduction and management for Expo 2010. No detailed plan regarding waste avoidance and reduction in the Expo Site was available while this report was being written.
UNEP
Env
iron
men
tal A
sses
smen
t
Expo 2010 Shanghai, China
83
5.4 COMMENTS AND RECOMMENDATIONS
Shanghai should be credited for speeding up to modernize its waste management system in the last decade. Safe waste disposal facilities have been massively scaled up, with an increasing utilization rate for waste-to-energy and reuse. The recent trend of introducing MBT plants for comprehensive treatment which includes recovering useful and recyclable materials and biochemical treatment of organic waste for compost or energy represents a greener waste approach.
Without a doubt, the waste sorting, classication, transfer and disposal systems have been signicantly improved in the last ten years in Shanghai. The city’s expansion in its capacity in handling hazardous waste, especially the forward-looking attitude in supporting the establishment of an electronic waste treatment facility should also be congratulated.
Despite these improvements in infrastructure, the issue of domestic solid waste continues to haunt Shanghai. Although “Reduction, Utilization, and Safe Disposal” have been repeated as the three pillars of the overall waste strategy, the focus of the government seems to be an imbalanced reverse of the sequence. Most of the effort has been centered on safe disposal, as translated into the massive expansion of facilities. In recent years, with the adding of waste-to-energy incinerators and MBT plants, the utilization track has geared up. However, not much attention has been given to the reduction track, which is probably the most fundamental aspect of a sustainable waste strategy. The decade-long experience showed that the growth of waste generation outpaced the expansion of waste treatment capacity in the municipality. This is certainly not a problem unique to Shanghai. Rather, many other rapidly developing cities are facing similar challenges of reducing and handling waste sustainably. It is therefore particularly important for Shanghai, as one of the leading metropolises and the rst host of the Expo in the developing world, to further strengthen its efforts towards a visionary waste management system for the future.
Developing a Zero-waste SocietyIt should be clear that it is not possible for Shanghai, and indeed any city in the world, to build endless treatment capacity for ever-growing municipal waste. The only sustainable solution is avoidance and reduction at source. It is also important to have separate waste collection for better recycling. While it is important to build and operate safe treatment facilities, it is perhaps equally important, if not more important, to progressively avoid and reduce waste generation.
UNEP recommends that Shanghai develops a comprehensive waste-reduction programme and considers developing a long term programme towards zero-waste vision and related policies. This is in line with the ecological and circular economy concepts the central government of China has recently been promoting.
With this ultimate goal, the municipality can start to set limits and targets to gradually reduce the total volume and per capita waste generated in the city. While treatment facilities should be further developed and upgraded based on utilization principles (such as the MBT plans), more emphasis should be put on waste reduction. The aim is to avoid and reduce waste at source, and to have all unavoidable refuse reused, utilized, or recycled.
UNEP
Env
iron
men
tal A
sses
smen
tExpo 2010 Shanghai, China
84
Extended producer responsibility (EPR) and polluter pays principles should be established in the overall waste reduction programme so as to encourage producers to reduce packaging materials, design-out harmful and un-recyclable materials in products, take full responsibility of the product’s life-cycle, and eventually develop more durable and sustainable consumer products. Economic measures, such as progressively differentiated pricing system of garbage fees based on weight, could be utilized to provide incentives and disincentives to guide actions. A comprehensive programme of public education and awareness raising should also be developed.
The plastic bag ban announced by the Chinese government in 2008 was a small but very concrete step towards this zero-waste vision. With this regulation, retail outlet chains such as supermarkets and drugstores were not allowed to hand out free plastic bags. Shanghai EPB estimated that about 60 per cent of the consumers were thus motivated to bring their own bags. This smartly designed intervention had not only sharply reduced plastic bag usage and disposal, but also had a ripple effect on the environmental awareness of consumers. UNEP believes that with vision and determination, Shanghai can move towards a zero-waste society.
Creative Public Engagement It should be emphasized that urban waste is not just the responsibility of government planners and environmental regulators. Every citizen contributes to it and is affected by it. Citizens should be encouraged and motivated to share this responsibility by minimizing their individual waste generation by consuming less, in a smarter and greener way.
The traditional government-led top-down mode of education in China may not be the most effective way of engaging the public. Emerging NGOs, social groups, as well as online social networks, should be encouraged and supported to initiate creative and motivating campaigns to engage citizens.
For example, the “Bring your own chopsticks” campaign organized by Greenpeace China in 2007/2008 before the Beijing Olympics successfully persuaded hundreds of restaurants in the capital to stop providing disposable chopsticks. Volunteers organized online and lobbied restaurant managers and instead brought their own chopsticks. Similar ideas could be promoted in Shanghai especially on phasing out disposable products.
Shanghai has committed to ensure that the water within the Expo Park is drinkable. With the increasing popularization of bottled water in China, the Shanghai authorities should consider prohibiting the selling of such products and encourage visitors to bring their own bottles. If all visitors are encouraged and join this campaign, at least 70 million non-biodegradable plastic bottles could be saved during the Expo. It will also provide an excellent opportunity to the organizers to promote public awareness on both the water and waste issue in China.
UNEP
Env
iron
men
tal A
sses
smen
t
Expo 2010 Shanghai, China
85
Public campaigns which are voluntary in nature, creative by design, and participatory in process are effective ways to raise public awareness. Starting from simple individual actions such as refusing to use plastic bags, disposable chopsticks and plastic bottles, citizens can be motivated to reduce waste at source. They are indispensable partners if the government is to achieve a zero-waste vision.
Expo 2010 and a Waste Reduction StrategyUNEP recommends that Shanghai uses Expo 2010 to showcase how cities can strive towards a zero-waste goal. Currently the waste measures for the Expo are mostly oriented towards waste separation and safe treatment. An environment friendly waste management concept should focus not only on disposal, but more importantly on avoidance and reduction at source.
Waste is one of the most important issues when it comes to major events because the visitors can directly participate in the greening programme. Expo 2010 would be an opportunity to develop an example of good practice for the whole city.
Addressing the Under-capacity IssueFrom 2000 to 2008, Shanghai signicantly expanded its safe treatment facilities. It should be noted that it is not an easy task to expand treatment capacity on a massive scale in such a short time. However, Shanghai still had a capacity gap of 23 per cent in 2008, with 156 million tons of domestic waste not properly handled in the year. It is recommended that the city should work towards addressing this situation. The sub-standard situation of the Laogang phases I-III should be addressed. Their closure is long overdue and their implementation should be accelerated. Additional treatment measures should be engineered and applied so as to minimize the on-going and long term environmental impacts of the site. The Shanghai municipal government is currently preparing to implement remedial measures and the ecological recovery of the wasteland will start soon.
Laogang Phase IV should not operate beyond its designed capacity. Hopefully, the expansion of the leachate treatment facility can be completed in the near future to increase its handling capacity. With an increased daily capacity, however, the designed life-span of the facilities will necessarily be shortened. Without a doubt, these short term xes cannot replace a more long term, comprehensive programme for waste reduction.
UNEP
Env
iron
men
tal A
sses
smen
tExpo 2010 Shanghai, China
86
6. WATERHosting Expo 2010 presents an opportunity as well as a challenge for Shanghai to improve its water planning and management.
The water systems in the Yangtze delta area have been under great environmental stress in recent years. This densely populated region is rapidly urbanizing and industrializing. While the local governments of the region have been making great efforts to regulate industrial and municipal waste water, non-point source pollution from agriculture and aquaculture remains a persistent problem.
In recent years, the lakes and rivers in the Yangtze delta region have been suffering from increased eutrophication. The large-scale outbreak of algae bloom in Tai Lake in 2007, which led to a week-long termination of water supply, affecting over two million people in Wuxi, was not an isolated event, but symptomatic of the increasing eutrophication of water systems in a region in which Shanghai is located downstream.
The challenge for ensuring a clean and stable water supply for Shanghai, involves improving infrastructure and implementing policies with a goal to reduce and treat industrial, municipal and agricultural discharges, as well as regional cooperation with neighbouring provinces.
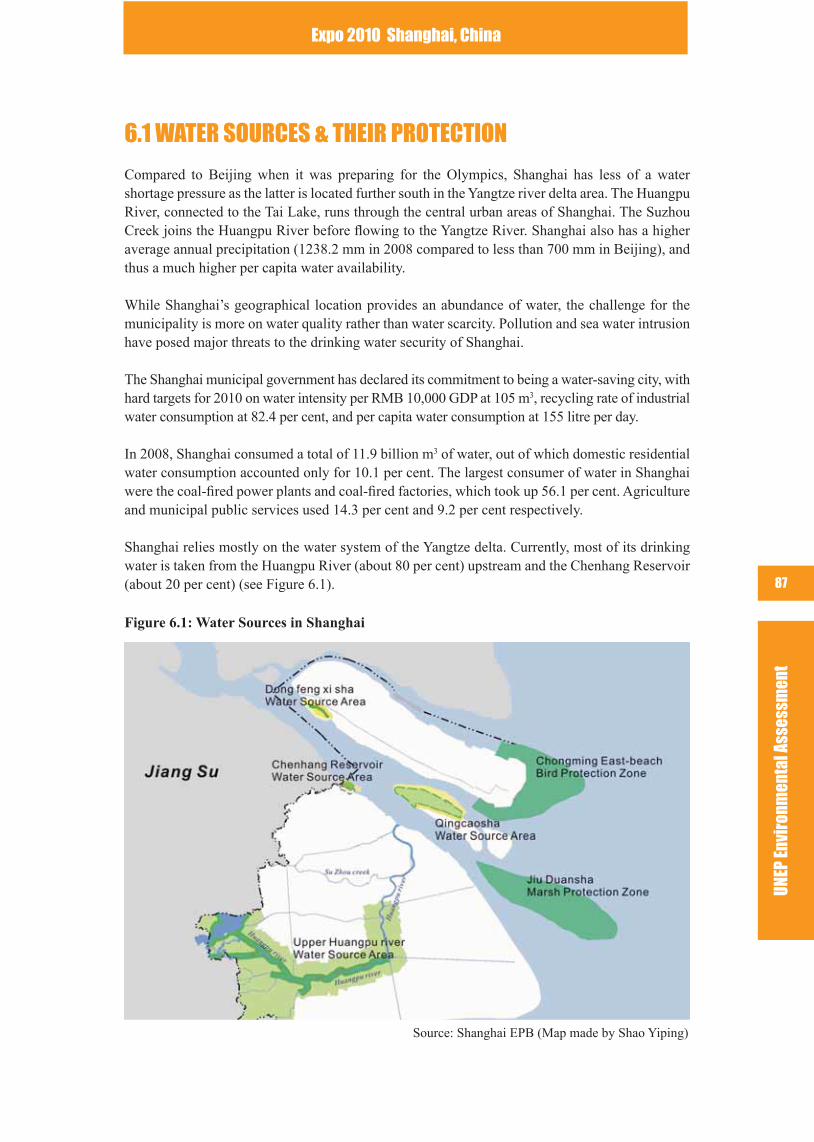
UNEP
Env
iron
men
tal A
sses
smen
t
Expo 2010 Shanghai, China
87
6.1 WATER SOURCES & THEIR PROTECTION
Compared to Beijing when it was preparing for the Olympics, Shanghai has less of a water shortage pressure as the latter is located further south in the Yangtze river delta area. The Huangpu River, connected to the Tai Lake, runs through the central urban areas of Shanghai. The Suzhou Creek joins the Huangpu River before owing to the Yangtze River. Shanghai also has a higher average annual precipitation (1238.2 mm in 2008 compared to less than 700 mm in Beijing), and thus a much higher per capita water availability.
While Shanghai’s geographical location provides an abundance of water, the challenge for the municipality is more on water quality rather than water scarcity. Pollution and sea water intrusion have posed major threats to the drinking water security of Shanghai.
The Shanghai municipal government has declared its commitment to being a water-saving city, with hard targets for 2010 on water intensity per RMB 10,000 GDP at 105 m3, recycling rate of industrial water consumption at 82.4 per cent, and per capita water consumption at 155 litre per day.
In 2008, Shanghai consumed a total of 11.9 billion m3 of water, out of which domestic residential water consumption accounted only for 10.1 per cent. The largest consumer of water in Shanghai were the coal-red power plants and coal-red factories, which took up 56.1 per cent. Agriculture and municipal public services used 14.3 per cent and 9.2 per cent respectively.
Shanghai relies mostly on the water system of the Yangtze delta. Currently, most of its drinking water is taken from the Huangpu River (about 80 per cent) upstream and the Chenhang Reservoir (about 20 per cent) (see Figure 6.1).
Figure 6.1: Water Sources in Shanghai
Source: Shanghai EPB (Map made by Shao Yiping)
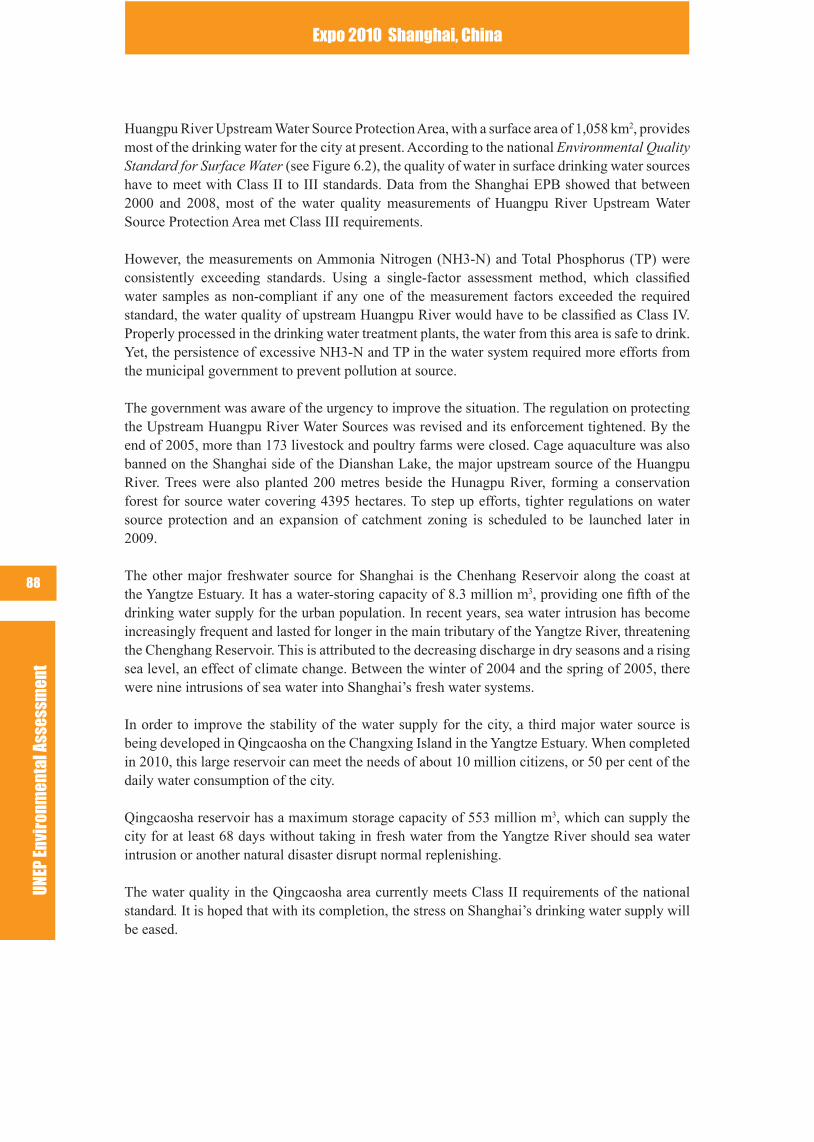
UNEP
Env
iron
men
tal A
sses
smen
tExpo 2010 Shanghai, China
88
Huangpu River Upstream Water Source Protection Area, with a surface area of 1,058 km2, provides most of the drinking water for the city at present. According to the national Environmental Quality Standard for Surface Water (see Figure 6.2), the quality of water in surface drinking water sources have to meet with Class II to III standards. Data from the Shanghai EPB showed that between 2000 and 2008, most of the water quality measurements of Huangpu River Upstream Water Source Protection Area met Class III requirements.
However, the measurements on Ammonia Nitrogen (NH3-N) and Total Phosphorus (TP) were consistently exceeding standards. Using a single-factor assessment method, which classied water samples as non-compliant if any one of the measurement factors exceeded the required standard, the water quality of upstream Huangpu River would have to be classied as Class IV. Properly processed in the drinking water treatment plants, the water from this area is safe to drink. Yet, the persistence of excessive NH3-N and TP in the water system required more efforts from the municipal government to prevent pollution at source.
The government was aware of the urgency to improve the situation. The regulation on protecting the Upstream Huangpu River Water Sources was revised and its enforcement tightened. By the end of 2005, more than 173 livestock and poultry farms were closed. Cage aquaculture was also banned on the Shanghai side of the Dianshan Lake, the major upstream source of the Huangpu River. Trees were also planted 200 metres beside the Hunagpu River, forming a conservation forest for source water covering 4395 hectares. To step up efforts, tighter regulations on water source protection and an expansion of catchment zoning is scheduled to be launched later in 2009.
The other major freshwater source for Shanghai is the Chenhang Reservoir along the coast at the Yangtze Estuary. It has a water-storing capacity of 8.3 million m3, providing one fth of the drinking water supply for the urban population. In recent years, sea water intrusion has become increasingly frequent and lasted for longer in the main tributary of the Yangtze River, threatening the Chenghang Reservoir. This is attributed to the decreasing discharge in dry seasons and a rising sea level, an effect of climate change. Between the winter of 2004 and the spring of 2005, there were nine intrusions of sea water into Shanghai’s fresh water systems.
In order to improve the stability of the water supply for the city, a third major water source is being developed in Qingcaosha on the Changxing Island in the Yangtze Estuary. When completed in 2010, this large reservoir can meet the needs of about 10 million citizens, or 50 per cent of the daily water consumption of the city.
Qingcaosha reservoir has a maximum storage capacity of 553 million m3, which can supply the city for at least 68 days without taking in fresh water from the Yangtze River should sea water intrusion or another natural disaster disrupt normal replenishing.
The water quality in the Qingcaosha area currently meets Class II requirements of the national standard. It is hoped that with its completion, the stress on Shanghai’s drinking water supply will be eased.
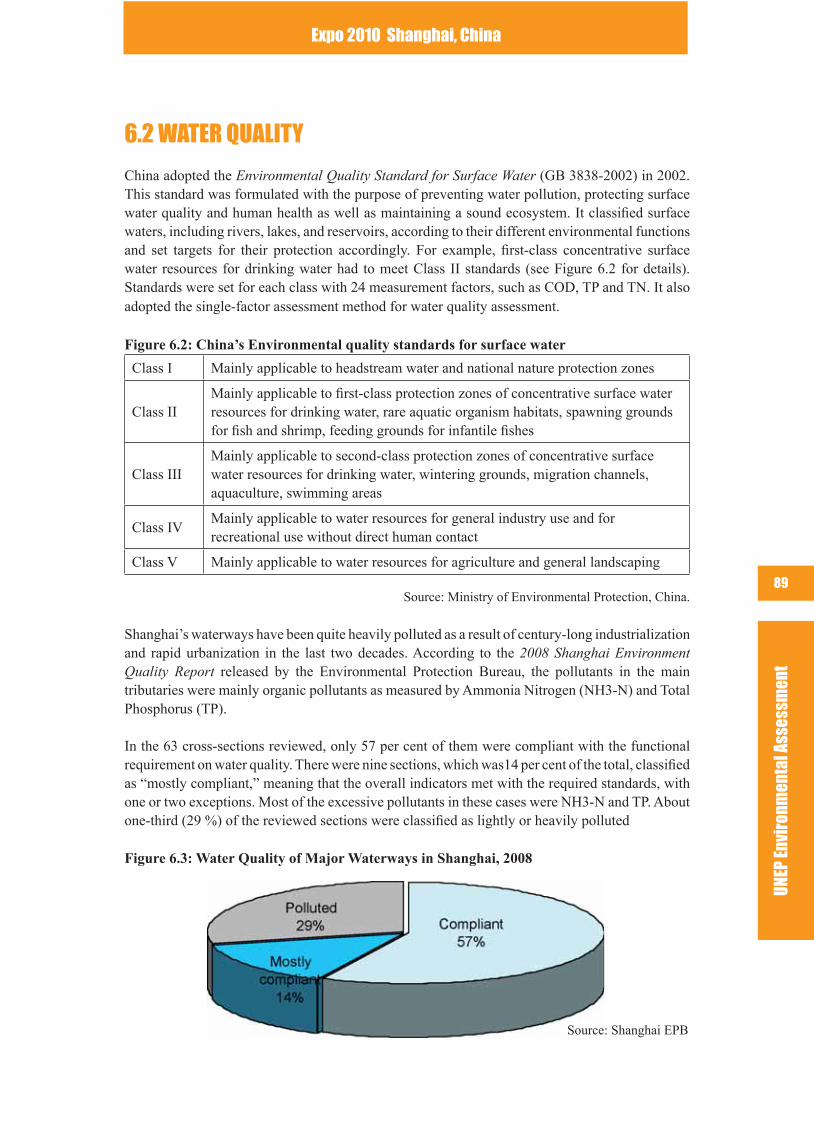
UNEP
Env
iron
men
tal A
sses
smen
t
Expo 2010 Shanghai, China
89
6.2 WATER QUALITY
China adopted the Environmental Quality Standard for Surface Water (GB 3838-2002) in 2002. This standard was formulated with the purpose of preventing water pollution, protecting surface water quality and human health as well as maintaining a sound ecosystem. It classied surface waters, including rivers, lakes, and reservoirs, according to their different environmental functions and set targets for their protection accordingly. For example, rst-class concentrative surface water resources for drinking water had to meet Class II standards (see Figure 6.2 for details). Standards were set for each class with 24 measurement factors, such as COD, TP and TN. It also adopted the single-factor assessment method for water quality assessment.
Figure 6.2: China’s Environmental quality standards for surface water
Class I Mainly applicable to headstream water and national nature protection zones
Class IIMainly applicable to rst-class protection zones of concentrative surface water resources for drinking water, rare aquatic organism habitats, spawning grounds for sh and shrimp, feeding grounds for infantile shes
Class IIIMainly applicable to second-class protection zones of concentrative surface water resources for drinking water, wintering grounds, migration channels, aquaculture, swimming areas
Class IVMainly applicable to water resources for general industry use and for recreational use without direct human contact
Class V Mainly applicable to water resources for agriculture and general landscaping
Source: Ministry of Environmental Protection, China.
Shanghai’s waterways have been quite heavily polluted as a result of century-long industrialization and rapid urbanization in the last two decades. According to the 2008 Shanghai Environment Quality Report released by the Environmental Protection Bureau, the pollutants in the main tributaries were mainly organic pollutants as measured by Ammonia Nitrogen (NH3-N) and Total Phosphorus (TP).
In the 63 cross-sections reviewed, only 57 per cent of them were compliant with the functional requirement on water quality. There were nine sections, which was14 per cent of the total, classied as “mostly compliant,” meaning that the overall indicators met with the required standards, with one or two exceptions. Most of the excessive pollutants in these cases were NH3-N and TP. About one-third (29 %) of the reviewed sections were classied as lightly or heavily polluted
Figure 6.3: Water Quality of Major Waterways in Shanghai, 2008
Source: Shanghai EPB

UNEP
Env
iron
men
tal A
sses
smen
tExpo 2010 Shanghai, China
90
It is clear that Shanghai faces serious challenges in addressing water pollution. The municipal government put water pollution as one of the priorities in the consecutive Three-year Environmental Action Plans. Apart from the measures mentioned about ensuring drinking water supply in the source water area, the government has also invested heavily in cleaning up waterways and treating waste water across the city.
6.3 SEWAGE TREATMENT
In 2000, Shanghai’s treatment plants only treated 55 per cent of the city’s sewage. Since then, the municipality has been improving its sewage treatment infrastructure. The municipal sewer systems across the city were upgraded and extended. Several large-scale sewage treatment facilities were also added, including:
Shidongkou Sewage Treatment Plant (0.4 million t/d); Zhuyuan Sewage Treatment Plant Phase I and II (2.2 million t/d in combination); Bailonggang Sewage Treatment Plant (2 million t/d).
For the rural areas, many smaller scale sewerage treatment plants and constructed wetland systems have been built.
By the end of 2008, Shanghai had constructed 50 sewerage treatment plants, with a total treatment capacity of 6.72 million m3/d. This capacity enables the municipality to treat 75.5 per cent of its sewage (see Figure 6.4). For urban areas the treatment rate is 85.8 per cent, while that of the rural areas is 52.8 per cent.
A signicant amount of the remaining sewage was treated by large industrial consumers themselves, such as Bao Steel Corporation, according to government standards. The untreated sewage was mostly from decentralized and remote rural areas. Shanghai plans to continue improving the treatment rate, with a target of 80 per cent by 2010 and 90 per cent by 2020.
Figure 6.4: Sewage treatment rate in Shanghai, 2000-2008
Source: Shanghai EPB
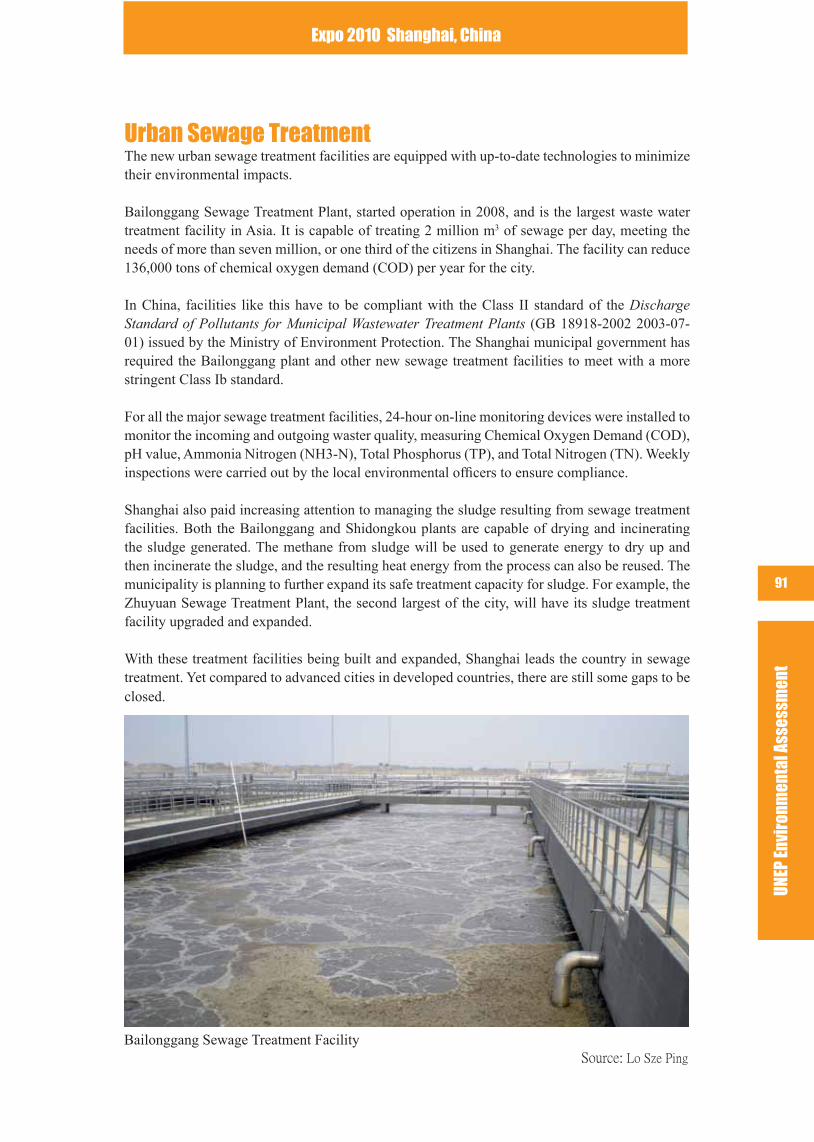
UNEP
Env
iron
men
tal A
sses
smen
t
Expo 2010 Shanghai, China
91
Urban Sewage TreatmentThe new urban sewage treatment facilities are equipped with up-to-date technologies to minimize their environmental impacts.
Bailonggang Sewage Treatment Plant, started operation in 2008, and is the largest waste water treatment facility in Asia. It is capable of treating 2 million m3 of sewage per day, meeting the needs of more than seven million, or one third of the citizens in Shanghai. The facility can reduce 136,000 tons of chemical oxygen demand (COD) per year for the city.
In China, facilities like this have to be compliant with the Class II standard of the Discharge Standard of Pollutants for Municipal Wastewater Treatment Plants (GB 18918-2002 2003-07-01) issued by the Ministry of Environment Protection. The Shanghai municipal government has required the Bailonggang plant and other new sewage treatment facilities to meet with a more stringent Class Ib standard.
For all the major sewage treatment facilities, 24-hour on-line monitoring devices were installed to monitor the incoming and outgoing waster quality, measuring Chemical Oxygen Demand (COD), pH value, Ammonia Nitrogen (NH3-N), Total Phosphorus (TP), and Total Nitrogen (TN). Weekly inspections were carried out by the local environmental ofcers to ensure compliance.
Shanghai also paid increasing attention to managing the sludge resulting from sewage treatment facilities. Both the Bailonggang and Shidongkou plants are capable of drying and incinerating the sludge generated. The methane from sludge will be used to generate energy to dry up and then incinerate the sludge, and the resulting heat energy from the process can also be reused. The municipality is planning to further expand its safe treatment capacity for sludge. For example, the Zhuyuan Sewage Treatment Plant, the second largest of the city, will have its sludge treatment facility upgraded and expanded.
With these treatment facilities being built and expanded, Shanghai leads the country in sewage treatment. Yet compared to advanced cities in developed countries, there are still some gaps to be closed.
Bailonggang Sewage Treatment Facility Source: Lo Sze Ping
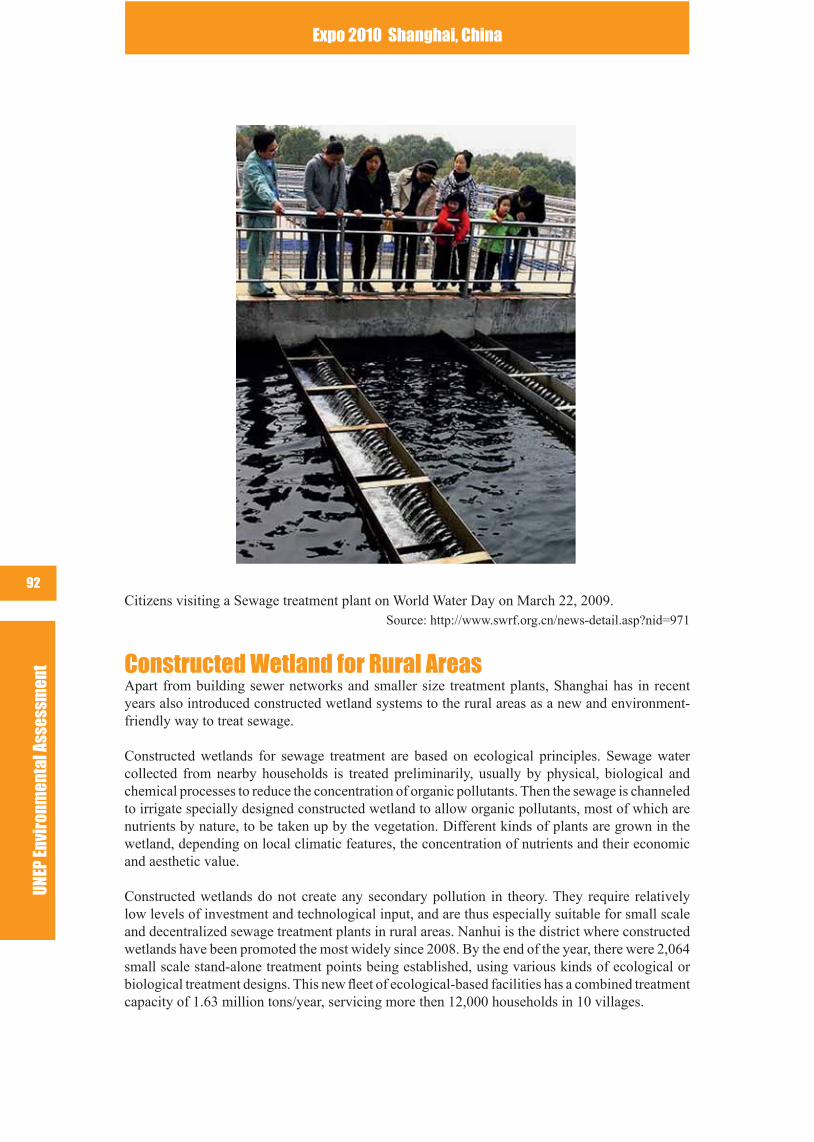
UNEP
Env
iron
men
tal A
sses
smen
tExpo 2010 Shanghai, China
92 Citizens visiting a Sewage treatment plant on World Water Day on March 22, 2009.
Source: http://www.swrf.org.cn/news-detail.asp?nid=971
Constructed Wetland for Rural AreasApart from building sewer networks and smaller size treatment plants, Shanghai has in recent years also introduced constructed wetland systems to the rural areas as a new and environment-friendly way to treat sewage.
Constructed wetlands for sewage treatment are based on ecological principles. Sewage water collected from nearby households is treated preliminarily, usually by physical, biological and chemical processes to reduce the concentration of organic pollutants. Then the sewage is channeled to irrigate specially designed constructed wetland to allow organic pollutants, most of which are nutrients by nature, to be taken up by the vegetation. Different kinds of plants are grown in the wetland, depending on local climatic features, the concentration of nutrients and their economic and aesthetic value.
Constructed wetlands do not create any secondary pollution in theory. They require relatively low levels of investment and technological input, and are thus especially suitable for small scale and decentralized sewage treatment plants in rural areas. Nanhui is the district where constructed wetlands have been promoted the most widely since 2008. By the end of the year, there were 2,064 small scale stand-alone treatment points being established, using various kinds of ecological or biological treatment designs. This new eet of ecological-based facilities has a combined treatment capacity of 1.63 million tons/year, servicing more then 12,000 households in 10 villages.
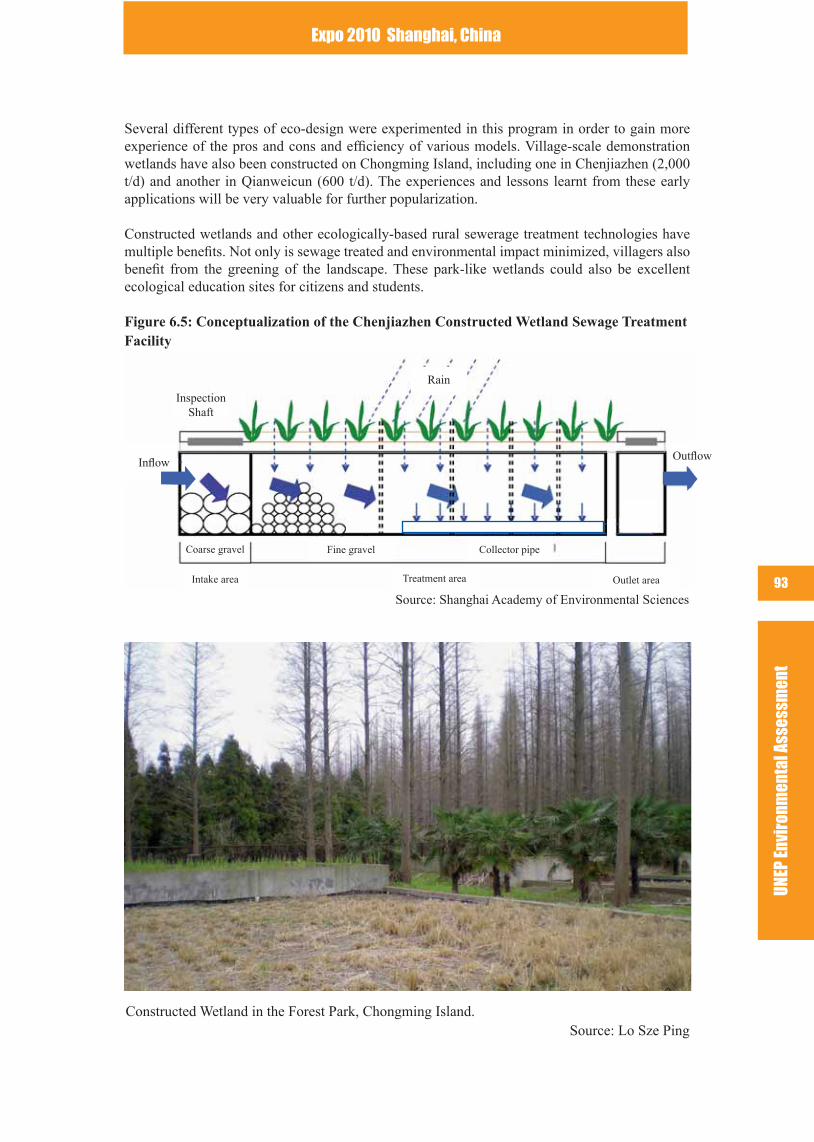
UNEP
Env
iron
men
tal A
sses
smen
t
Expo 2010 Shanghai, China
93
Several different types of eco-design were experimented in this program in order to gain more experience of the pros and cons and efciency of various models. Village-scale demonstration wetlands have also been constructed on Chongming Island, including one in Chenjiazhen (2,000 t/d) and another in Qianweicun (600 t/d). The experiences and lessons learnt from these early applications will be very valuable for further popularization.
Constructed wetlands and other ecologically-based rural sewerage treatment technologies have multiple benets. Not only is sewage treated and environmental impact minimized, villagers also benet from the greening of the landscape. These park-like wetlands could also be excellent ecological education sites for citizens and students.
Figure 6.5: Conceptualization of the Chenjiazhen Constructed Wetland Sewage Treatment Facility
6.4 RIVER CLEAN UP Source: Shanghai Academy of Environmental Sciences
Constructed Wetland in the Forest Park, Chongming Island. Source: Lo Sze Ping
InspectionShaft
Rain
Coarse gravel
Intake area Treatment area Outlet area
Fine gravel Collector pipe
InowOutow
Inow
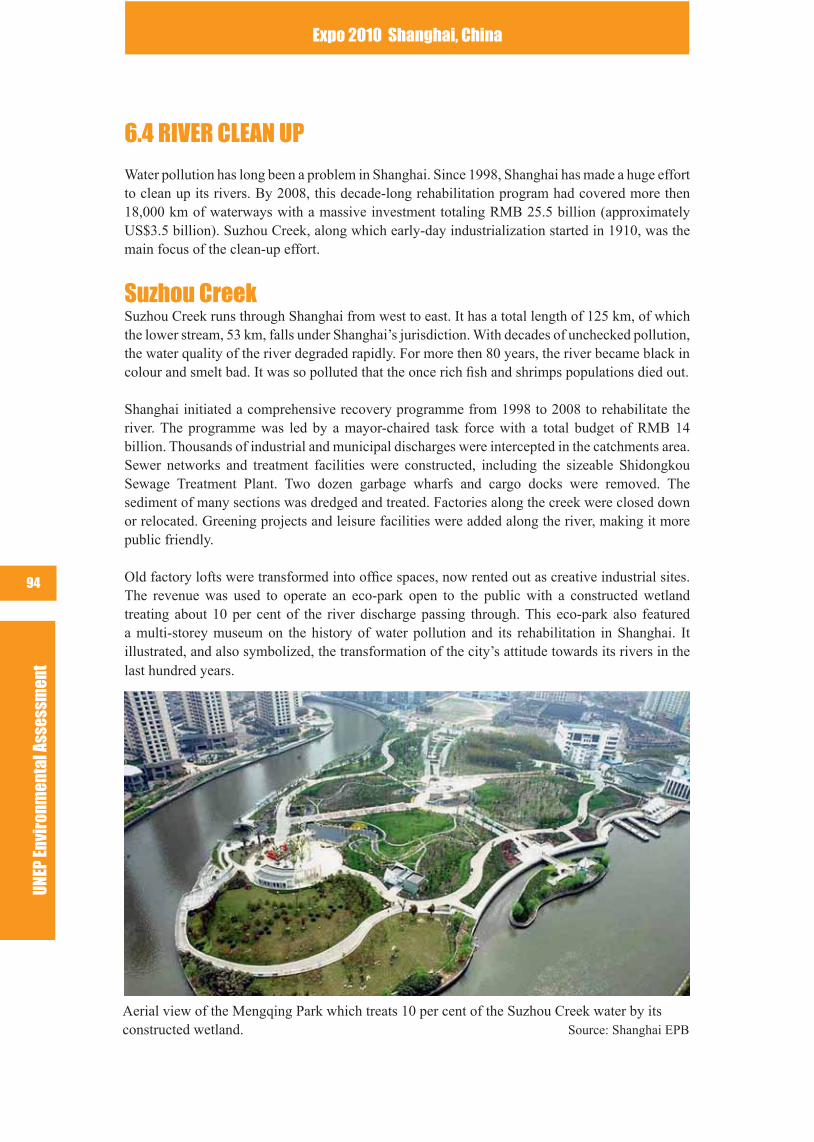
UNEP
Env
iron
men
tal A
sses
smen
tExpo 2010 Shanghai, China
94
6.4 RIVER CLEAN UP
Water pollution has long been a problem in Shanghai. Since 1998, Shanghai has made a huge effort to clean up its rivers. By 2008, this decade-long rehabilitation program had covered more then 18,000 km of waterways with a massive investment totaling RMB 25.5 billion (approximately US$3.5 billion). Suzhou Creek, along which early-day industrialization started in 1910, was the main focus of the clean-up effort.
Suzhou CreekSuzhou Creek runs through Shanghai from west to east. It has a total length of 125 km, of which the lower stream, 53 km, falls under Shanghai’s jurisdiction. With decades of unchecked pollution, the water quality of the river degraded rapidly. For more then 80 years, the river became black in colour and smelt bad. It was so polluted that the once rich sh and shrimps populations died out.
Shanghai initiated a comprehensive recovery programme from 1998 to 2008 to rehabilitate the river. The programme was led by a mayor-chaired task force with a total budget of RMB 14 billion. Thousands of industrial and municipal discharges were intercepted in the catchments area. Sewer networks and treatment facilities were constructed, including the sizeable Shidongkou Sewage Treatment Plant. Two dozen garbage wharfs and cargo docks were removed. The sediment of many sections was dredged and treated. Factories along the creek were closed down or relocated. Greening projects and leisure facilities were added along the river, making it more public friendly. Old factory lofts were transformed into ofce spaces, now rented out as creative industrial sites. The revenue was used to operate an eco-park open to the public with a constructed wetland treating about 10 per cent of the river discharge passing through. This eco-park also featured a multi-storey museum on the history of water pollution and its rehabilitation in Shanghai. It illustrated, and also symbolized, the transformation of the city’s attitude towards its rivers in the last hundred years.
Aerial view of the Mengqing Park which treats 10 per cent of the Suzhou Creek water by its constructed wetland. Source: Shanghai EPB
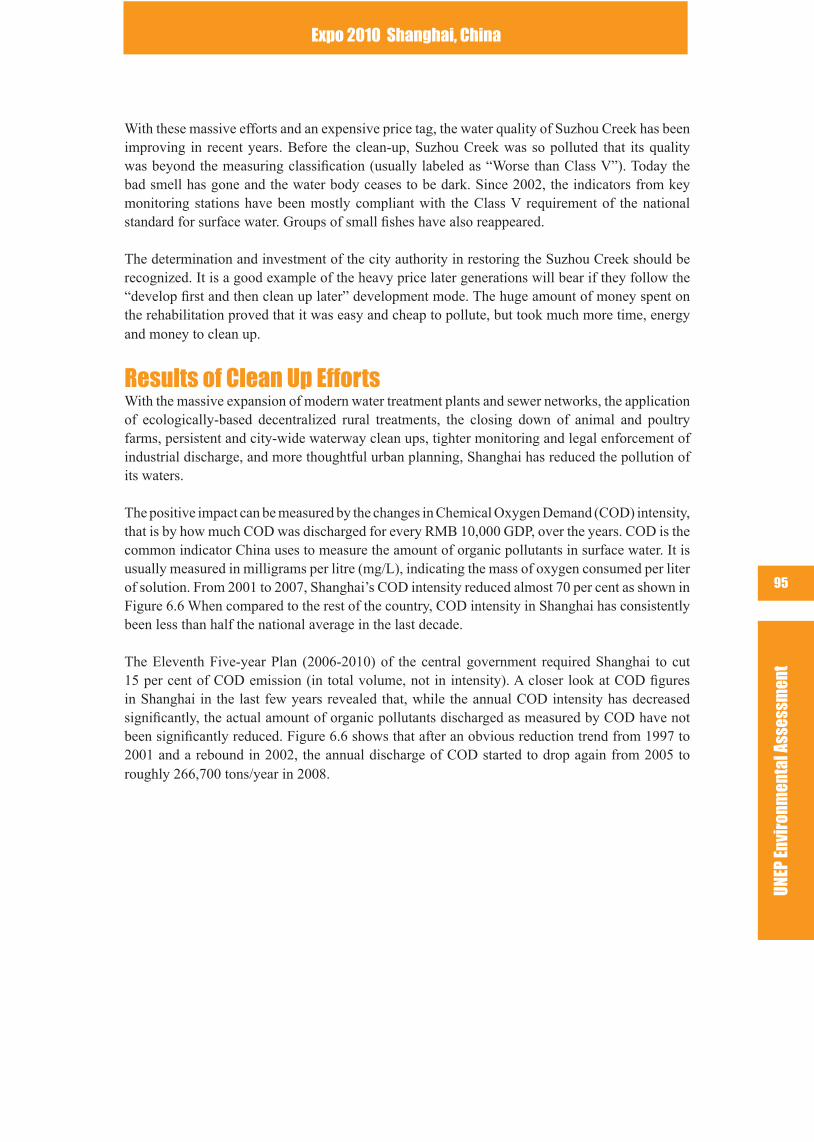
UNEP
Env
iron
men
tal A
sses
smen
t
Expo 2010 Shanghai, China
95
With these massive efforts and an expensive price tag, the water quality of Suzhou Creek has been improving in recent years. Before the clean-up, Suzhou Creek was so polluted that its quality was beyond the measuring classication (usually labeled as “Worse than Class V”). Today the bad smell has gone and the water body ceases to be dark. Since 2002, the indicators from key monitoring stations have been mostly compliant with the Class V requirement of the national standard for surface water. Groups of small shes have also reappeared.
The determination and investment of the city authority in restoring the Suzhou Creek should be recognized. It is a good example of the heavy price later generations will bear if they follow the “develop rst and then clean up later” development mode. The huge amount of money spent on the rehabilitation proved that it was easy and cheap to pollute, but took much more time, energy and money to clean up.
Results of Clean Up EffortsWith the massive expansion of modern water treatment plants and sewer networks, the application of ecologically-based decentralized rural treatments, the closing down of animal and poultry farms, persistent and city-wide waterway clean ups, tighter monitoring and legal enforcement of industrial discharge, and more thoughtful urban planning, Shanghai has reduced the pollution of its waters.
The positive impact can be measured by the changes in Chemical Oxygen Demand (COD) intensity, that is by how much COD was discharged for every RMB 10,000 GDP, over the years. COD is the common indicator China uses to measure the amount of organic pollutants in surface water. It is usually measured in milligrams per litre (mg/L), indicating the mass of oxygen consumed per liter of solution. From 2001 to 2007, Shanghai’s COD intensity reduced almost 70 per cent as shown in Figure 6.6 When compared to the rest of the country, COD intensity in Shanghai has consistently been less than half the national average in the last decade.
The Eleventh Five-year Plan (2006-2010) of the central government required Shanghai to cut 15 per cent of COD emission (in total volume, not in intensity). A closer look at COD gures in Shanghai in the last few years revealed that, while the annual COD intensity has decreased signicantly, the actual amount of organic pollutants discharged as measured by COD have not been signicantly reduced. Figure 6.6 shows that after an obvious reduction trend from 1997 to 2001 and a rebound in 2002, the annual discharge of COD started to drop again from 2005 to roughly 266,700 tons/year in 2008.
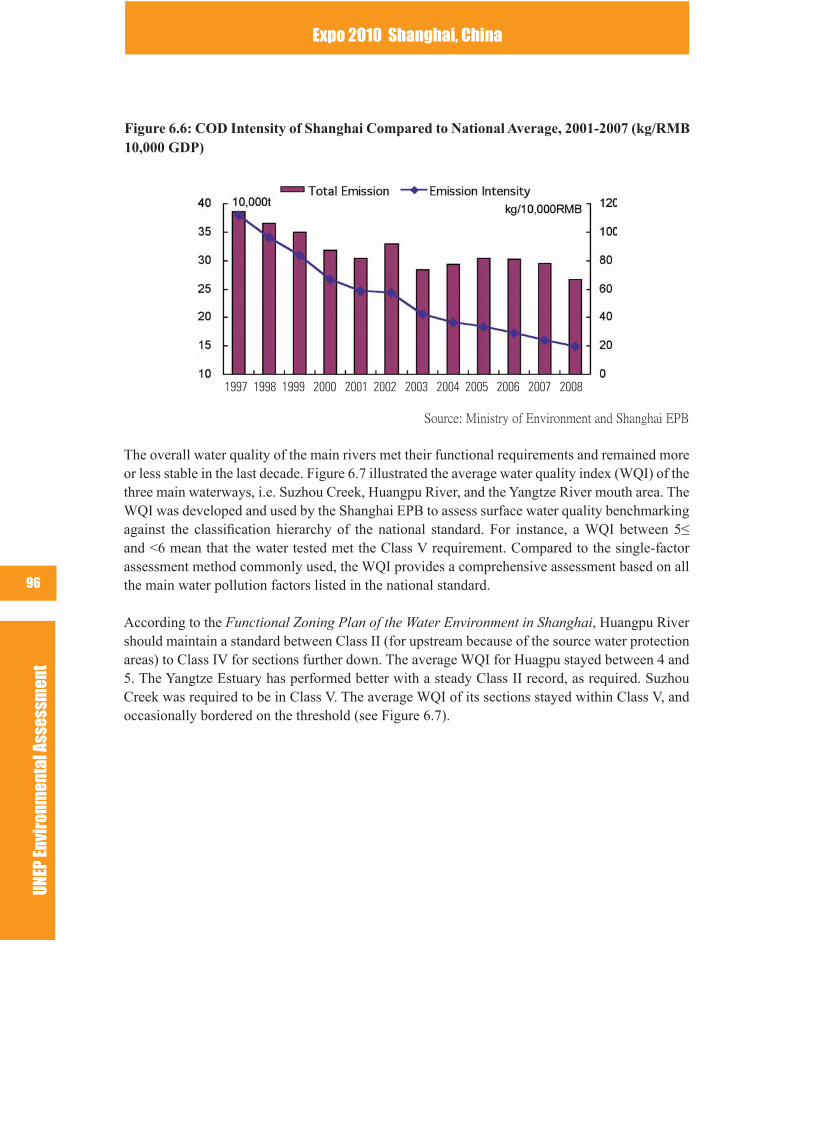
UNEP
Env
iron
men
tal A
sses
smen
tExpo 2010 Shanghai, China
96
Figure 6.6: COD Intensity of Shanghai Compared to National Average, 2001-2007 (kg/RMB 10,000 GDP)
1997 1998 1999 2000 2001 2002 2003 2004 2005 2006 2007 2008
Source: Ministry of Environment and Shanghai EPB
The overall water quality of the main rivers met their functional requirements and remained more or less stable in the last decade. Figure 6.7 illustrated the average water quality index (WQI) of the three main waterways, i.e. Suzhou Creek, Huangpu River, and the Yangtze River mouth area. The WQI was developed and used by the Shanghai EPB to assess surface water quality benchmarking against the classication hierarchy of the national standard. For instance, a WQI between 5≤ and <6 mean that the water tested met the Class V requirement. Compared to the single-factor assessment method commonly used, the WQI provides a comprehensive assessment based on all the main water pollution factors listed in the national standard.
According to the Functional Zoning Plan of the Water Environment in Shanghai, Huangpu River should maintain a standard between Class II (for upstream because of the source water protection areas) to Class IV for sections further down. The average WQI for Huagpu stayed between 4 and 5. The Yangtze Estuary has performed better with a steady Class II record, as required. Suzhou Creek was required to be in Class V. The average WQI of its sections stayed within Class V, and occasionally bordered on the threshold (see Figure 6.7).
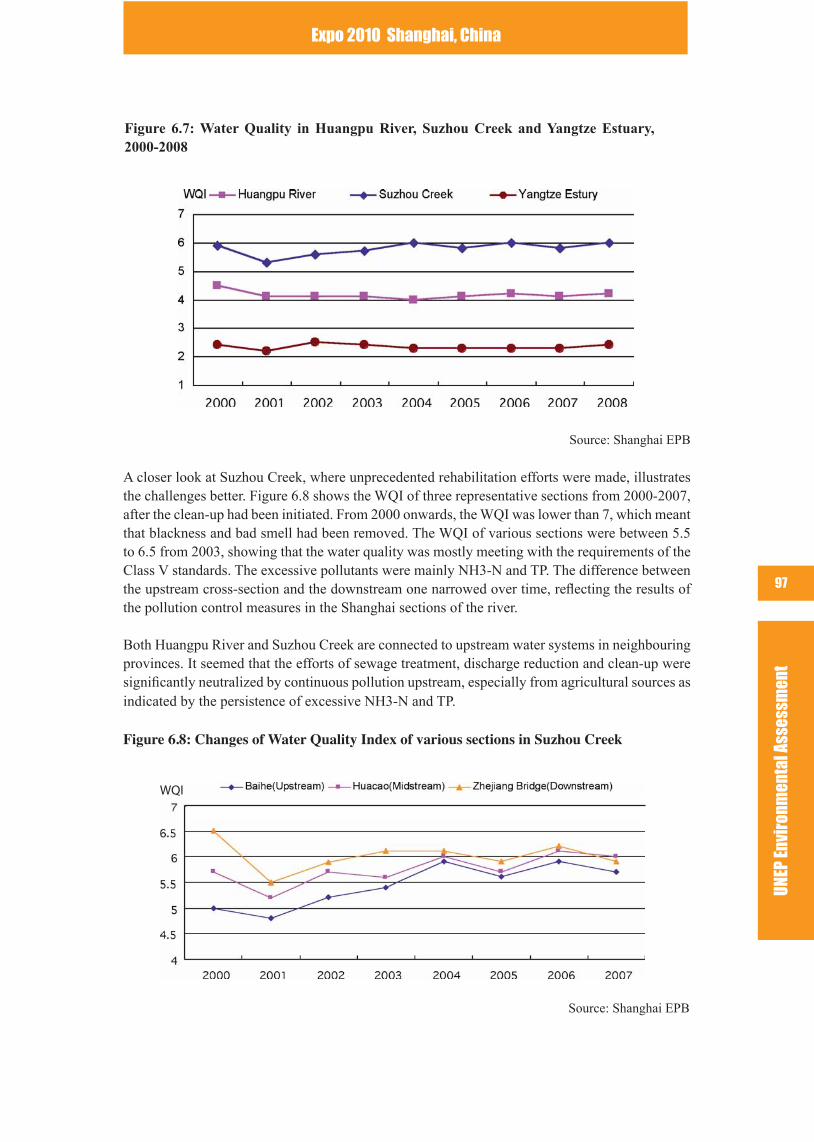
UNEP
Env
iron
men
tal A
sses
smen
t
Expo 2010 Shanghai, China
97
Figure 6.7: Water Quality in Huangpu River, Suzhou Creek and Yangtze Estuary, 2000-2008
Source: Shanghai EPB
A closer look at Suzhou Creek, where unprecedented rehabilitation efforts were made, illustrates the challenges better. Figure 6.8 shows the WQI of three representative sections from 2000-2007, after the clean-up had been initiated. From 2000 onwards, the WQI was lower than 7, which meant that blackness and bad smell had been removed. The WQI of various sections were between 5.5 to 6.5 from 2003, showing that the water quality was mostly meeting with the requirements of the Class V standards. The excessive pollutants were mainly NH3-N and TP. The difference between the upstream cross-section and the downstream one narrowed over time, reecting the results of the pollution control measures in the Shanghai sections of the river.
Both Huangpu River and Suzhou Creek are connected to upstream water systems in neighbouring provinces. It seemed that the efforts of sewage treatment, discharge reduction and clean-up were signicantly neutralized by continuous pollution upstream, especially from agricultural sources as indicated by the persistence of excessive NH3-N and TP.
Figure 6.8: Changes of Water Quality Index of various sections in Suzhou Creek
Source: Shanghai EPB
WQI
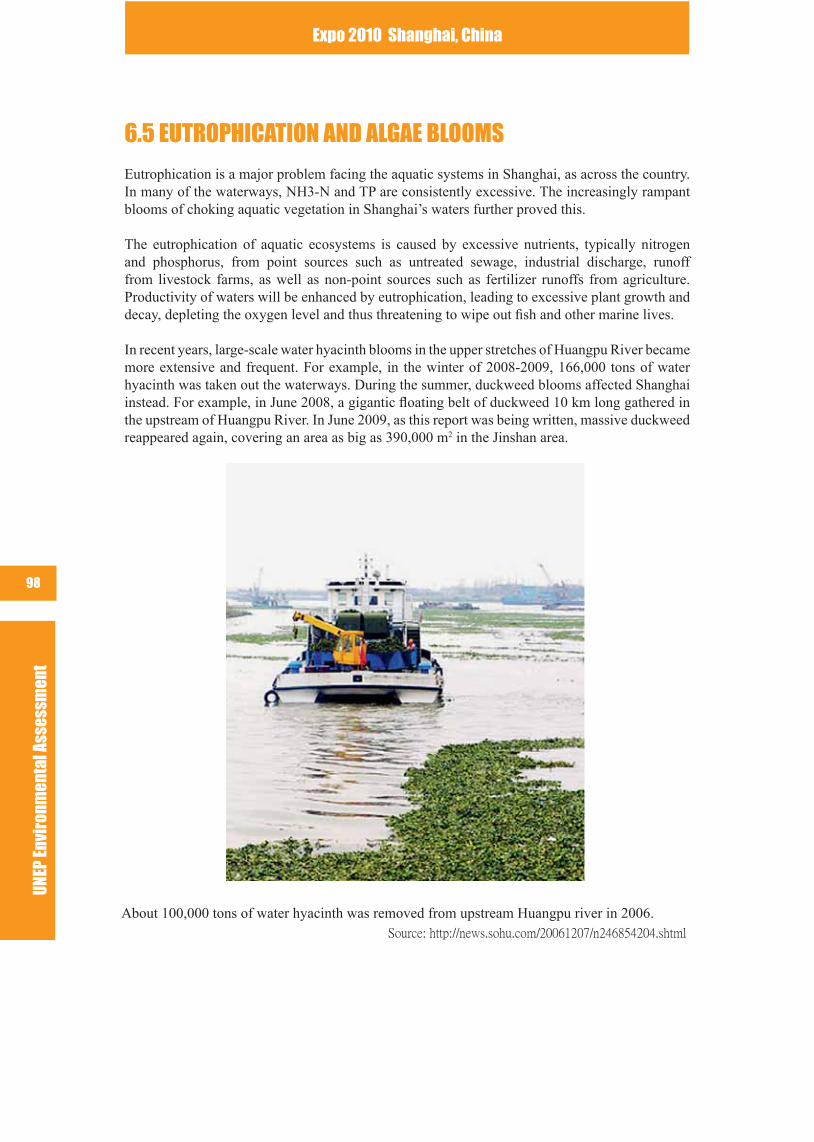
UNEP
Env
iron
men
tal A
sses
smen
tExpo 2010 Shanghai, China
98
6.5 EUTROPHICATION AND ALGAE BLOOMS
Eutrophication is a major problem facing the aquatic systems in Shanghai, as across the country. In many of the waterways, NH3-N and TP are consistently excessive. The increasingly rampant blooms of choking aquatic vegetation in Shanghai’s waters further proved this. The eutrophication of aquatic ecosystems is caused by excessive nutrients, typically nitrogen and phosphorus, from point sources such as untreated sewage, industrial discharge, runoff from livestock farms, as well as non-point sources such as fertilizer runoffs from agriculture. Productivity of waters will be enhanced by eutrophication, leading to excessive plant growth and decay, depleting the oxygen level and thus threatening to wipe out sh and other marine lives.
In recent years, large-scale water hyacinth blooms in the upper stretches of Huangpu River became more extensive and frequent. For example, in the winter of 2008-2009, 166,000 tons of water hyacinth was taken out the waterways. During the summer, duckweed blooms affected Shanghai instead. For example, in June 2008, a gigantic oating belt of duckweed 10 km long gathered in the upstream of Huangpu River. In June 2009, as this report was being written, massive duckweed reappeared again, covering an area as big as 390,000 m2 in the Jinshan area.
About 100,000 tons of water hyacinth was removed from upstream Huangpu river in 2006.Source: http://news.sohu.com/20061207/n246854204.shtml
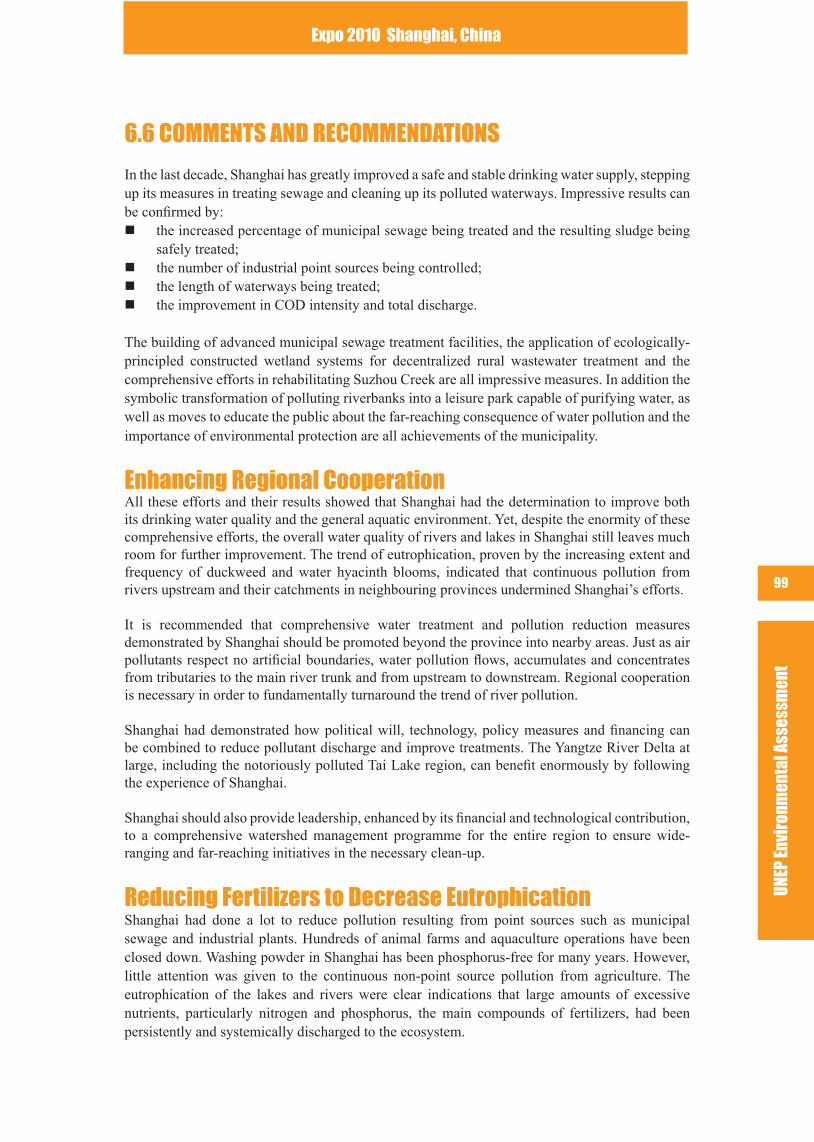
UNEP
Env
iron
men
tal A
sses
smen
t
Expo 2010 Shanghai, China
99
6.6 COMMENTS AND RECOMMENDATIONS
In the last decade, Shanghai has greatly improved a safe and stable drinking water supply, stepping up its measures in treating sewage and cleaning up its polluted waterways. Impressive results can be conrmed by:
the increased percentage of municipal sewage being treated and the resulting sludge being safely treated; the number of industrial point sources being controlled;the length of waterways being treated;the improvement in COD intensity and total discharge.
The building of advanced municipal sewage treatment facilities, the application of ecologically-principled constructed wetland systems for decentralized rural wastewater treatment and the comprehensive efforts in rehabilitating Suzhou Creek are all impressive measures. In addition the symbolic transformation of polluting riverbanks into a leisure park capable of purifying water, as well as moves to educate the public about the far-reaching consequence of water pollution and the importance of environmental protection are all achievements of the municipality.
Enhancing Regional CooperationAll these efforts and their results showed that Shanghai had the determination to improve both its drinking water quality and the general aquatic environment. Yet, despite the enormity of these comprehensive efforts, the overall water quality of rivers and lakes in Shanghai still leaves much room for further improvement. The trend of eutrophication, proven by the increasing extent and frequency of duckweed and water hyacinth blooms, indicated that continuous pollution from rivers upstream and their catchments in neighbouring provinces undermined Shanghai’s efforts.
It is recommended that comprehensive water treatment and pollution reduction measures demonstrated by Shanghai should be promoted beyond the province into nearby areas. Just as air pollutants respect no articial boundaries, water pollution ows, accumulates and concentrates from tributaries to the main river trunk and from upstream to downstream. Regional cooperation is necessary in order to fundamentally turnaround the trend of river pollution.
Shanghai had demonstrated how political will, technology, policy measures and nancing can be combined to reduce pollutant discharge and improve treatments. The Yangtze River Delta at large, including the notoriously polluted Tai Lake region, can benet enormously by following the experience of Shanghai.
Shanghai should also provide leadership, enhanced by its nancial and technological contribution, to a comprehensive watershed management programme for the entire region to ensure wide-ranging and far-reaching initiatives in the necessary clean-up.
Reducing Fertilizers to Decrease EutrophicationShanghai had done a lot to reduce pollution resulting from point sources such as municipal sewage and industrial plants. Hundreds of animal farms and aquaculture operations have been closed down. Washing powder in Shanghai has been phosphorus-free for many years. However, little attention was given to the continuous non-point source pollution from agriculture. The eutrophication of the lakes and rivers were clear indications that large amounts of excessive nutrients, particularly nitrogen and phosphorus, the main compounds of fertilizers, had been persistently and systemically discharged to the ecosystem.
UNEP
Env
iron
men
tal A
sses
smen
tExpo 2010 Shanghai, China
100
As recent studies from Chinese scientists (Liu and Qiu, 2007; Qin et al., 2007; Tang et al., 2006) and NGOs such as Greenpeace (2008; 2009) showed, the excessive use of synthetic fertilizers and their running-off to aquatic systems in China had been seriously neglected. According to the Food and Agriculture Organisation of the United Nations (FAO) statistics, from 1996 to 2006 the use of nitrogen fertilizer and phosphorus fertilizer on Chinese farms had increased by 40 per cent and 60 per cent respectively. It has been argued that there is a clear link between the rising use of synthetic fertilizers and the worsening eutrophication of rivers and lakes in China, especially in the Yangtze River Delta.
While algae blooms are natural in their occurrence, the increase in their intensity and frequency are clearly human-induced. Preventing excessive nutrients being concentrated in aquatic systems is not only essential to preventing further worsening of water quality; it is also the critical factor in restoring and improving their ecological balance. Given the persistence of euthrophication in Shanghai and its nearby water systems, a comprehensive programme is urgently needed to reduce the reliance on synthetic fertilizers.
Ecological agriculture, especially organic agriculture, which does not use and rely on synthetic fertilizers, should be promoted with more government support in Shanghai and the East China region. Subsidies and policy support for producing synthetic fertilizers especially urea fertilizer should be reduced and transferred to promote modern ecological farming methods that put emphasis on a system approach to improve soil fertility and organic matter in soil, take advantage of crop rotation measures that ensure natural nitrogen xation, nutrient recycling and the efcient use of organic fertilizers.
Citizens in Shanghai, with higher incomes than those in neighbouring areas, should be educated and encouraged to buy organic food in order to reduce the synthetic fertilizers applied to farms, which end up polluting their rivers. The government should also develop progressive programmes to reduce and gradually phase out the use of chemical fertilizers and pesticides, assisting farmers to shift to ecological agriculture.
Furthering Current EffortsUNEP encourages Shanghai to strengthen its ongoing efforts. The Government should consider raising the current wastewater treatment target of 90 per cent by 2010. More attention should be given to removing phosphorus and nitrogen in sewage treatment facilities. Both domestic and industrial wastewater recycling and reuse should further be promoted and facilitated.
Factories should be required to evolve towards clean production in order to avoid the use and production of toxic chemicals during the product life-cycle, from product design, raw material sourcing, manufacturing and processing, consumer use and disposal. More emphasis should be put into avoidance-at-source rather than end-of-pipe treatment of pollutants.
The availability of water and its quality affects everyone. Citizens should be encouraged to take up their responsibilities in reducing water consumption and improving water quality. Individual actions such as saving water on a daily basis, recycling and reusing kitchen and bathtub waters, changing to water-efcient toilet systems, buying local and organic vegetables, avoiding chemical products and using phosphorus-free detergents might be trivial but are most effective when taken together. A more active citizenry, concerned about the environment and willing to report illegal discharges, will also help the regulators to monitor the polluting factories more effectively.
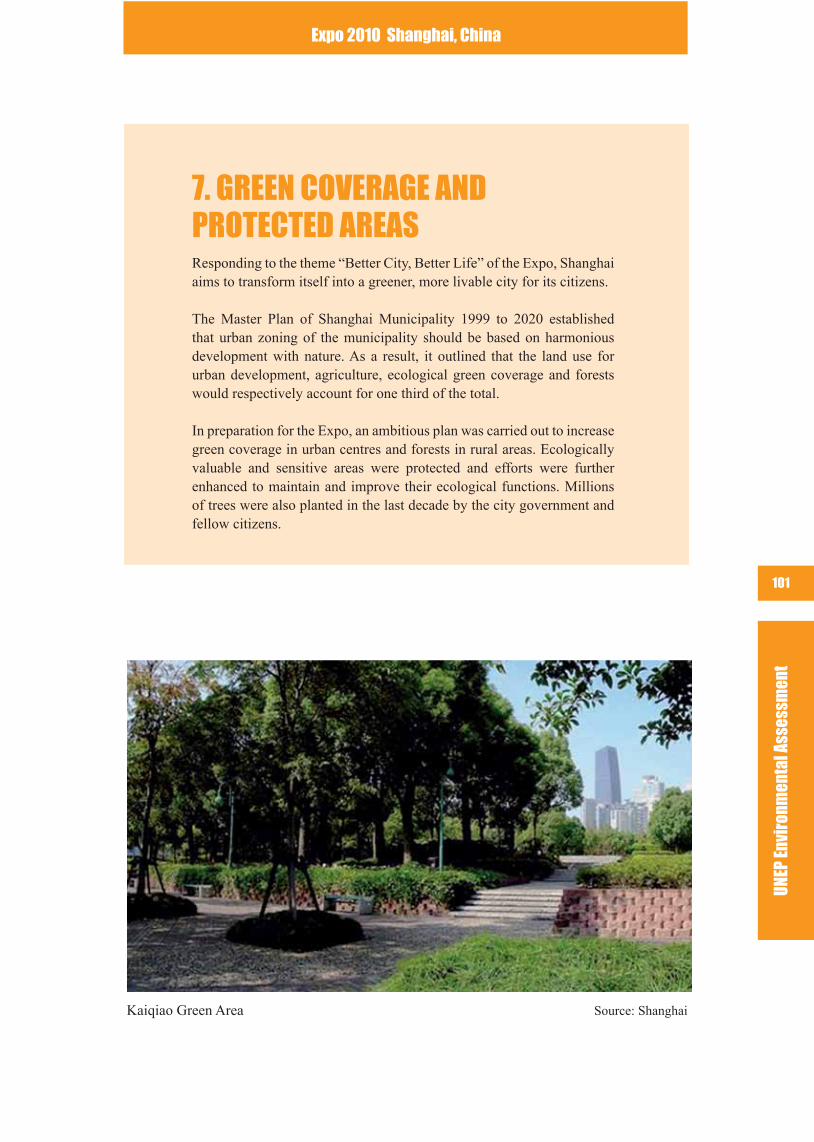
UNEP
Env
iron
men
tal A
sses
smen
t
Expo 2010 Shanghai, China
101
7. GREEN COVERAGE AND PROTECTED AREASResponding to the theme “Better City, Better Life” of the Expo, Shanghai aims to transform itself into a greener, more livable city for its citizens.
The Master Plan of Shanghai Municipality 1999 to 2020 established that urban zoning of the municipality should be based on harmonious development with nature. As a result, it outlined that the land use for urban development, agriculture, ecological green coverage and forests would respectively account for one third of the total.
In preparation for the Expo, an ambitious plan was carried out to increase green coverage in urban centres and forests in rural areas. Ecologically valuable and sensitive areas were protected and efforts were further enhanced to maintain and improve their ecological functions. Millions of trees were also planted in the last decade by the city government and fellow citizens.
Kaiqiao Green Area Source: Shanghai
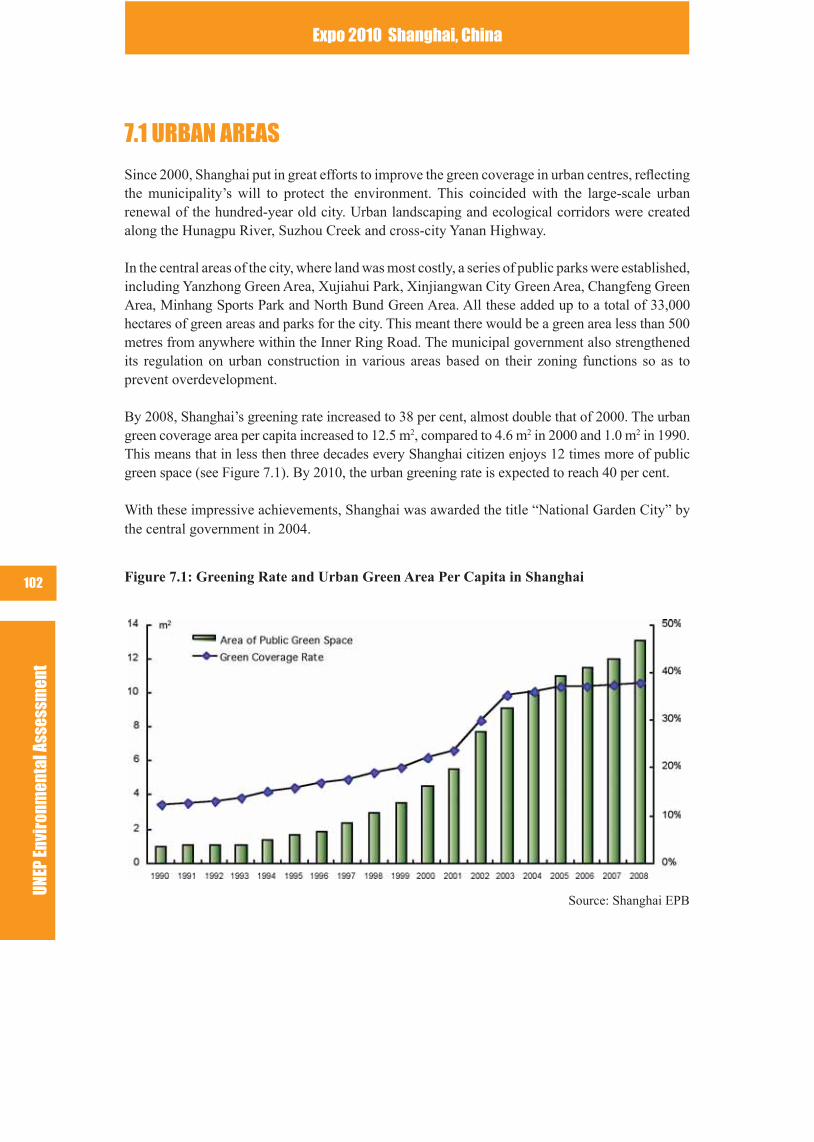
UNEP
Env
iron
men
tal A
sses
smen
tExpo 2010 Shanghai, China
102
7.1 URBAN AREAS
Since 2000, Shanghai put in great efforts to improve the green coverage in urban centres, reecting the municipality’s will to protect the environment. This coincided with the large-scale urban renewal of the hundred-year old city. Urban landscaping and ecological corridors were created along the Hunagpu River, Suzhou Creek and cross-city Yanan Highway.
In the central areas of the city, where land was most costly, a series of public parks were established, including Yanzhong Green Area, Xujiahui Park, Xinjiangwan City Green Area, Changfeng Green Area, Minhang Sports Park and North Bund Green Area. All these added up to a total of 33,000 hectares of green areas and parks for the city. This meant there would be a green area less than 500 metres from anywhere within the Inner Ring Road. The municipal government also strengthened its regulation on urban construction in various areas based on their zoning functions so as to prevent overdevelopment.
By 2008, Shanghai’s greening rate increased to 38 per cent, almost double that of 2000. The urban green coverage area per capita increased to 12.5 m2, compared to 4.6 m2 in 2000 and 1.0 m2 in 1990. This means that in less then three decades every Shanghai citizen enjoys 12 times more of public green space (see Figure 7.1). By 2010, the urban greening rate is expected to reach 40 per cent.
With these impressive achievements, Shanghai was awarded the title “National Garden City” by the central government in 2004.
Figure 7.1: Greening Rate and Urban Green Area Per Capita in Shanghai
Source: Shanghai EPB
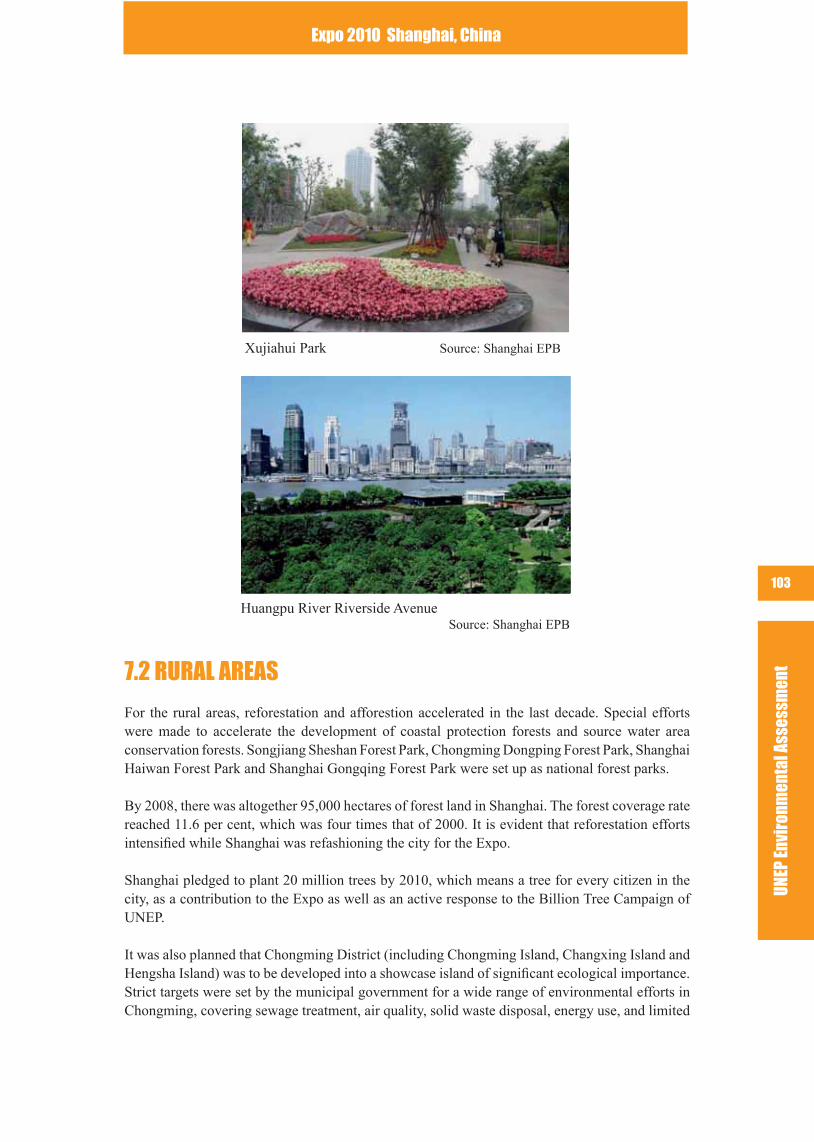
UNEP
Env
iron
men
tal A
sses
smen
t
Expo 2010 Shanghai, China
103
7.2 RURAL AREAS
For the rural areas, reforestation and afforestion accelerated in the last decade. Special efforts were made to accelerate the development of coastal protection forests and source water area conservation forests. Songjiang Sheshan Forest Park, Chongming Dongping Forest Park, Shanghai Haiwan Forest Park and Shanghai Gongqing Forest Park were set up as national forest parks.
By 2008, there was altogether 95,000 hectares of forest land in Shanghai. The forest coverage rate reached 11.6 per cent, which was four times that of 2000. It is evident that reforestation efforts intensied while Shanghai was refashioning the city for the Expo.
Shanghai pledged to plant 20 million trees by 2010, which means a tree for every citizen in the city, as a contribution to the Expo as well as an active response to the Billion Tree Campaign of UNEP.
It was also planned that Chongming District (including Chongming Island, Changxing Island and Hengsha Island) was to be developed into a showcase island of signicant ecological importance. Strict targets were set by the municipal government for a wide range of environmental efforts in Chongming, covering sewage treatment, air quality, solid waste disposal, energy use, and limited
Huangpu River Riverside Avenue Source: Shanghai EPB
Xujiahui Park Source: Shanghai EPB
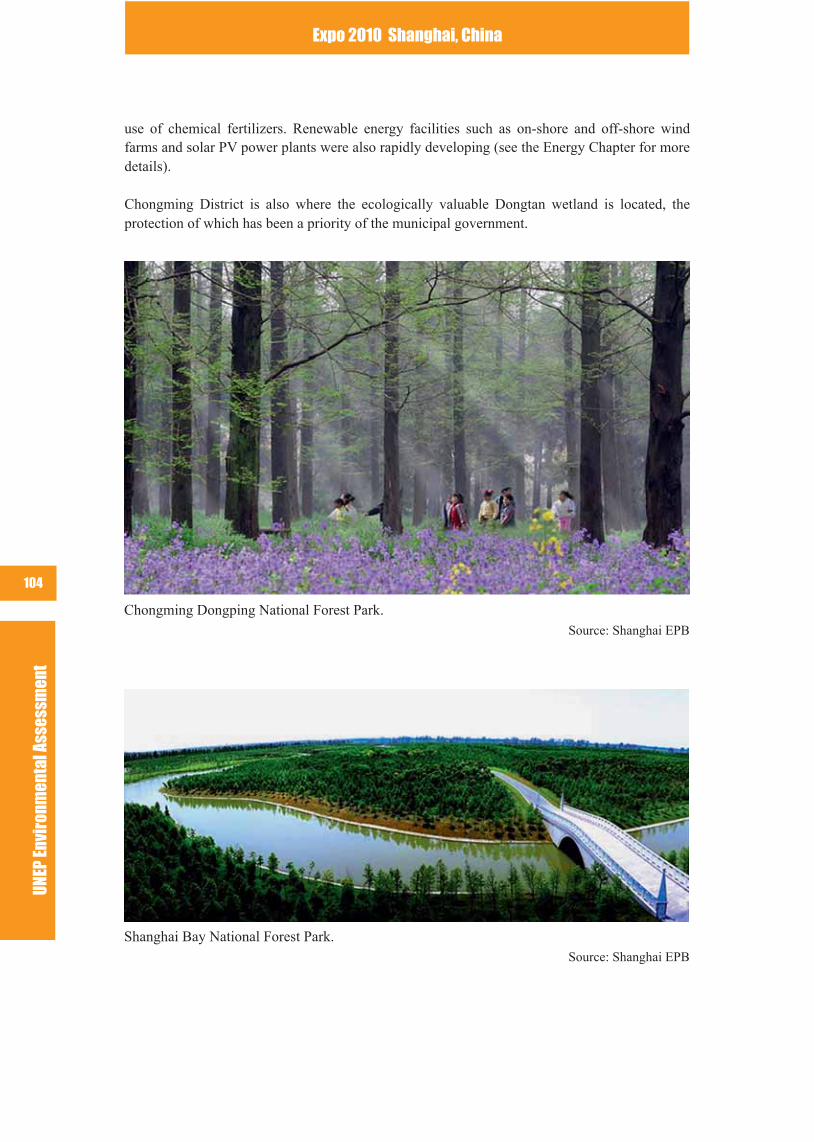
UNEP
Env
iron
men
tal A
sses
smen
tExpo 2010 Shanghai, China
104
use of chemical fertilizers. Renewable energy facilities such as on-shore and off-shore wind farms and solar PV power plants were also rapidly developing (see the Energy Chapter for more details).
Chongming District is also where the ecologically valuable Dongtan wetland is located, the protection of which has been a priority of the municipal government.
Chongming Dongping National Forest Park. Source: Shanghai EPB
Shanghai Bay National Forest Park. Source: Shanghai EPB
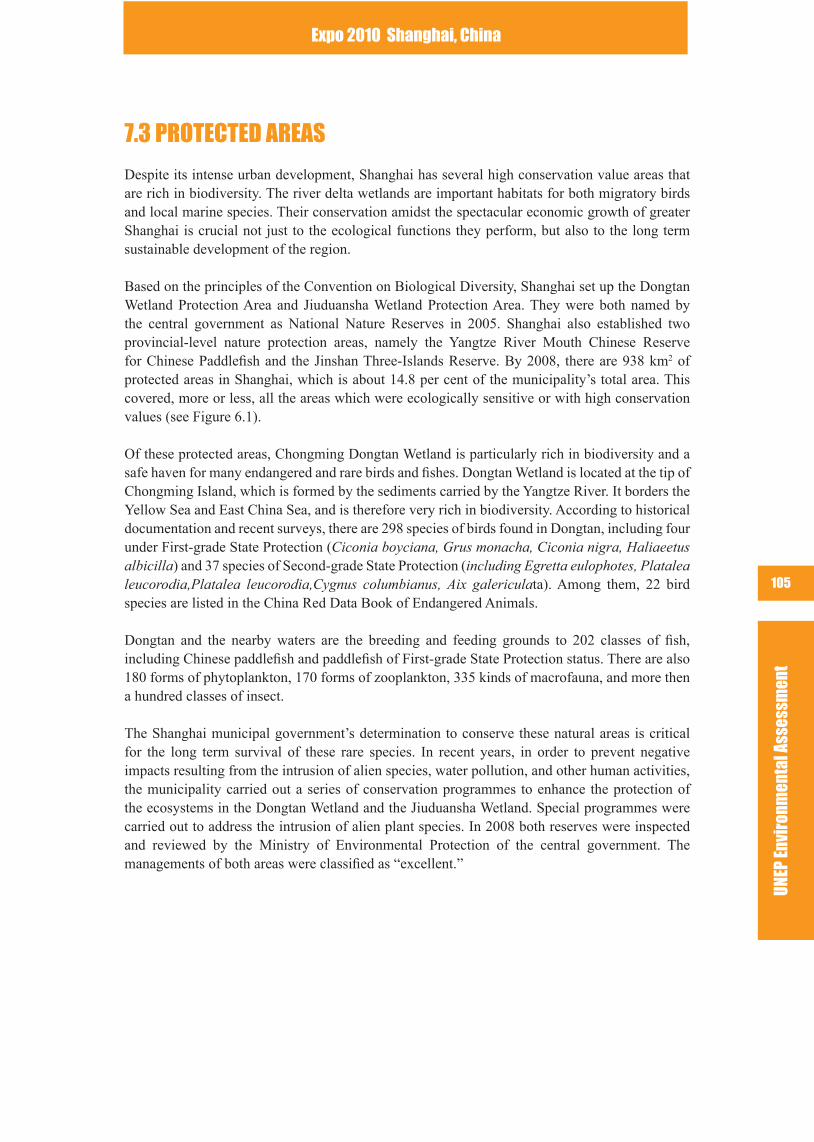
UNEP
Env
iron
men
tal A
sses
smen
t
Expo 2010 Shanghai, China
105
7.3 PROTECTED AREAS
Despite its intense urban development, Shanghai has several high conservation value areas that are rich in biodiversity. The river delta wetlands are important habitats for both migratory birds and local marine species. Their conservation amidst the spectacular economic growth of greater Shanghai is crucial not just to the ecological functions they perform, but also to the long term sustainable development of the region.
Based on the principles of the Convention on Biological Diversity, Shanghai set up the Dongtan Wetland Protection Area and Jiuduansha Wetland Protection Area. They were both named by the central government as National Nature Reserves in 2005. Shanghai also established two provincial-level nature protection areas, namely the Yangtze River Mouth Chinese Reserve for Chinese Paddlesh and the Jinshan Three-Islands Reserve. By 2008, there are 938 km2 of protected areas in Shanghai, which is about 14.8 per cent of the municipality’s total area. This covered, more or less, all the areas which were ecologically sensitive or with high conservation values (see Figure 6.1).
Of these protected areas, Chongming Dongtan Wetland is particularly rich in biodiversity and a safe haven for many endangered and rare birds and shes. Dongtan Wetland is located at the tip of Chongming Island, which is formed by the sediments carried by the Yangtze River. It borders the Yellow Sea and East China Sea, and is therefore very rich in biodiversity. According to historical documentation and recent surveys, there are 298 species of birds found in Dongtan, including four under First-grade State Protection (Ciconia boyciana, Grus monacha, Ciconia nigra, Haliaeetus albicilla) and 37 species of Second-grade State Protection (including Egretta eulophotes, Platalea leucorodia,Platalea leucorodia,Cygnus columbianus, Aix galericulata). Among them, 22 bird species are listed in the China Red Data Book of Endangered Animals.
Dongtan and the nearby waters are the breeding and feeding grounds to 202 classes of sh, including Chinese paddlesh and paddlesh of First-grade State Protection status. There are also 180 forms of phytoplankton, 170 forms of zooplankton, 335 kinds of macrofauna, and more then a hundred classes of insect.
The Shanghai municipal government’s determination to conserve these natural areas is critical for the long term survival of these rare species. In recent years, in order to prevent negative impacts resulting from the intrusion of alien species, water pollution, and other human activities, the municipality carried out a series of conservation programmes to enhance the protection of the ecosystems in the Dongtan Wetland and the Jiuduansha Wetland. Special programmes were carried out to address the intrusion of alien plant species. In 2008 both reserves were inspected and reviewed by the Ministry of Environmental Protection of the central government. The managements of both areas were classied as “excellent.”

UNEP
Env
iron
men
tal A
sses
smen
tExpo 2010 Shanghai, China
106
Great Knot (Calidris tenuirostris)
Far Eastern Curlew (Numenius madagascariensis)
Whimbrel (Numenius phaeopus)
Kentish Plover (Charadrius alexandrinus)
Lesser Sandplover (Charadrius mongolus)
Little Ringed Plover (Charadrius dubius)
UNEP
Env
iron
men
tal A
sses
smen
t
Expo 2010 Shanghai, China
107
7.4 COMMENTS AND RECOMMENDATIONS
Shanghai municipality’s continuous efforts to provide more urban green areas for its citizens, increasing forest coverage and conserving ecologically sensitive and highly valuable natural areas should be applauded. Between 2000 and 2008, in less than a decade, the city enjoyed three times more urban green areas per capita and four times more total forest coverage. These were not easy achievements given the concurrent economic development of the city.
As a result of these efforts after 2000, citizens of Shanghai and visitors coming for the Expo will be able to benet from a greener city with more parks in the urban districts and more forest coverage in the countryside. Within half a day of travel, they can also experience and learn from some of the world’s richest biodiversity hotspots. The experience of Shanghai in raising the living standards of its people while also improving the ecological robustness is of great value to other rapidly developing cities around the world. It is also a simple message and complements the Expo: A better city has to step up its conservation efforts in order to provide better lives for its citizens and other living organisms.
Some concerns and challenges remain for the future. Shanghai and other cities need to look into the water and fertilizer consumption of the urban greening projects in order to gain a net positive environmental balance. Collected rain water and recycled water should be utilized as much as possible. Synthetic fertilizers should be avoided, given the serious challenges Shanghai has been facing with water pollution.
Given that domestic waste challenges Shanghai faced, community composting based in residential estates and schools could provide a clean and sustainable way of waste utilization and an opportunity of participatory environmental education. By ensuring citizens take responsibility and are more environmentally aware Shanghai achieved more in its overall greening campaign.
All tree-planting and landscape planning should pay close attention to the selection of species, irrigation requirements, use of pesticides and fertilizers and the impact these choices would have on the environment over time. It is also recommended that indigenous species, especially those rare and engendered, should be prioritized in both urban and rural greening efforts. Genetically modied varieties of trees and owers should be avoided due to the lack of long term bio-safety assessments and their potential risks to biodiversity. Attention should also be given to ensure biodiversity in reforestation projects and monoculture plantations should be avoided.
It is also recommended that the impacts on carbon dioxide levels by these greening efforts, especially those tree-planting projects, be studied and reviewed in the future to determine their benets over time. This is crucial in helping experts and governments to determine scientically and accurately their contribution to the overall net carbon balance (between emissions and offsetting).
UNEP
Env
iron
men
tal A
sses
smen
tExpo 2010 Shanghai, China
108
8. THE EXPO SITEShanghai, as discussed in previous chapters, has taken the opportunity of preparing Expo 2010 to improve its municipal infrastructure, tighten pollution controls and advance its environmental initiatives. Extending the municipality’s efforts in environmental protection, the organizer committed to organizing an environment-friendly Expo.
Environmental protection has been a prominent feature in the entire event cycle, from the selection and planning of the Site, the eco-designs and green technologies used for the new buildings, to the actual management and exhibition contents during the Expo. Different pavilions will be showcasing new concepts and latest technologies for sustainable urban development through exhibitions and by the architecture itself.
The theme “Better City, Better Life” will be scrutinised by cities and countries around of the world. They will be sharing various experiences and best practices on improving the quality of urban living while lowering their environmental impacts in the Expo’s Urban Best Practice Area as well as in national pavilions.
Providing a platform for demonstrating and exchanging green ideas, the event and the pavilions themselves were designed to inspire visions of a low carbon future.
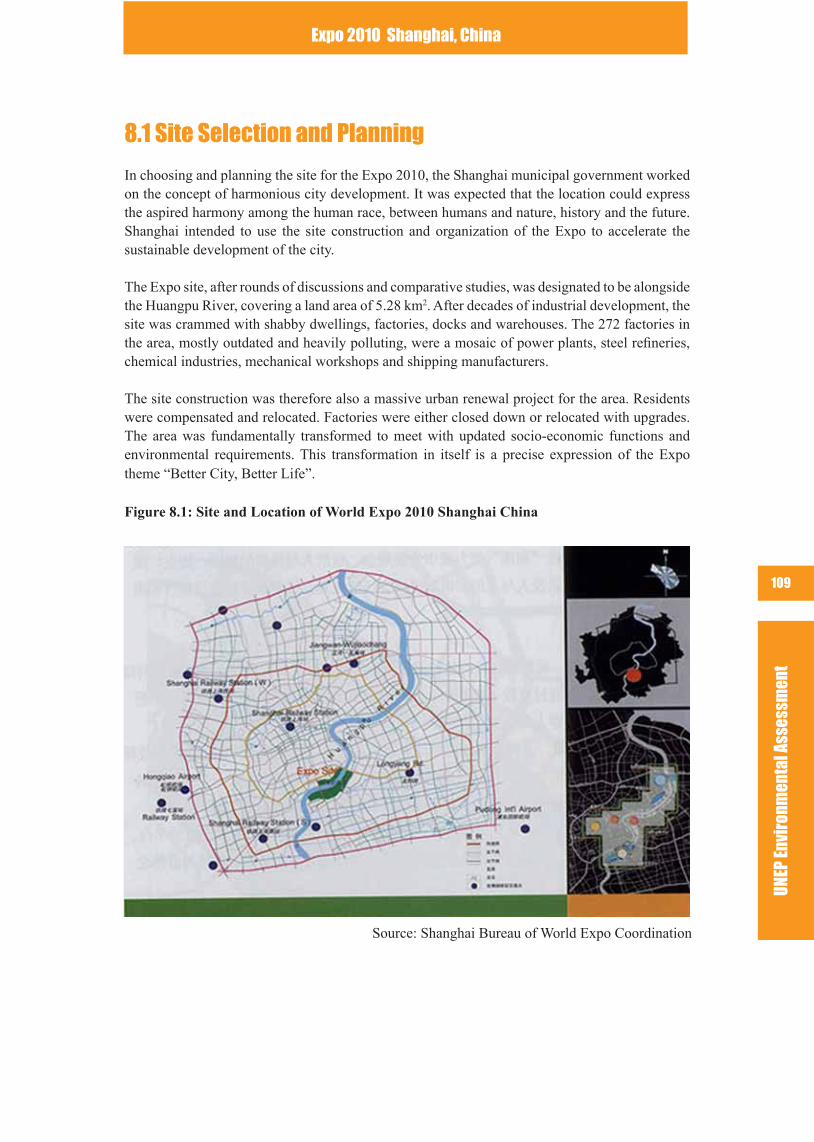
UNEP
Env
iron
men
tal A
sses
smen
t
Expo 2010 Shanghai, China
109
8.1 Site Selection and Planning
In choosing and planning the site for the Expo 2010, the Shanghai municipal government worked on the concept of harmonious city development. It was expected that the location could express the aspired harmony among the human race, between humans and nature, history and the future. Shanghai intended to use the site construction and organization of the Expo to accelerate the sustainable development of the city.
The Expo site, after rounds of discussions and comparative studies, was designated to be alongside the Huangpu River, covering a land area of 5.28 km2. After decades of industrial development, the site was crammed with shabby dwellings, factories, docks and warehouses. The 272 factories in the area, mostly outdated and heavily polluting, were a mosaic of power plants, steel reneries, chemical industries, mechanical workshops and shipping manufacturers.
The site construction was therefore also a massive urban renewal project for the area. Residents were compensated and relocated. Factories were either closed down or relocated with upgrades. The area was fundamentally transformed to meet with updated socio-economic functions and environmental requirements. This transformation in itself is a precise expression of the Expo theme “Better City, Better Life”.
Figure 8.1: Site and Location of World Expo 2010 Shanghai China
Source: Shanghai Bureau of World Expo Coordination
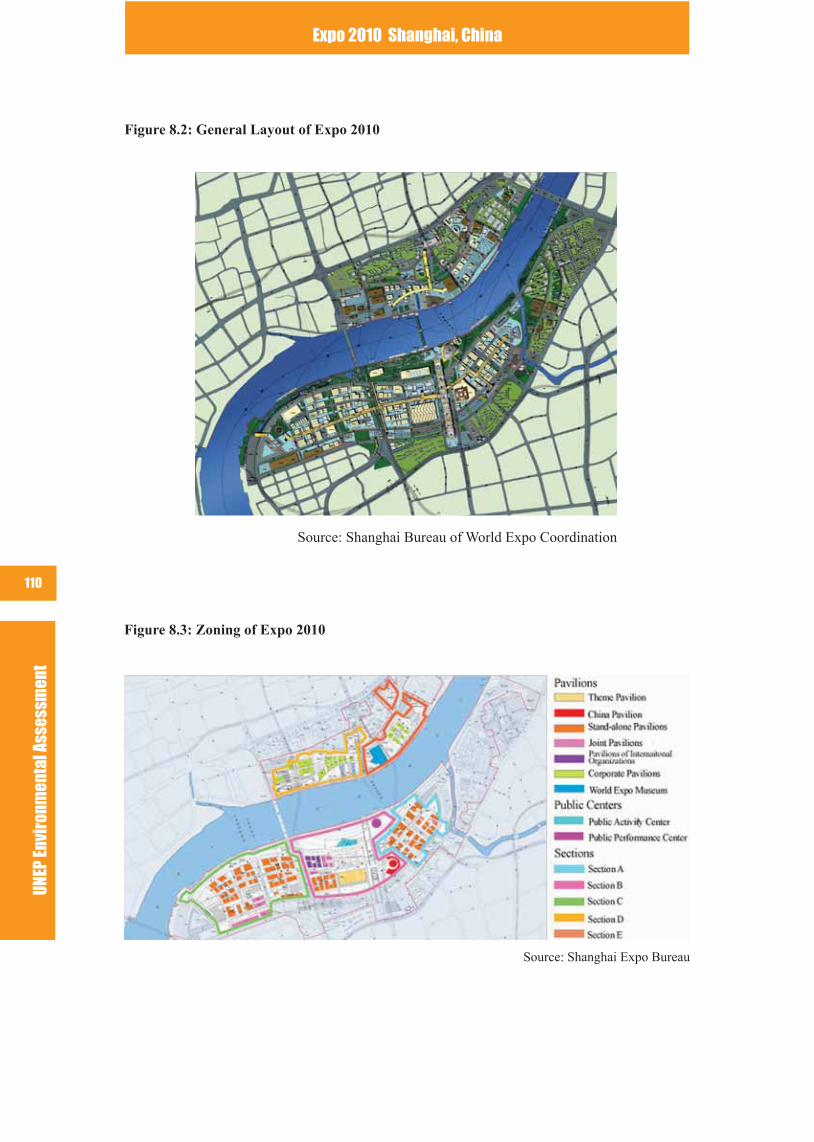
UNEP
Env
iron
men
tal A
sses
smen
tExpo 2010 Shanghai, China
110
Figure 8.2: General Layout of Expo 2010
Figure 8.3: Zoning of Expo 2010
Source: Shanghai Expo Bureau
Source: Shanghai Bureau of World Expo Coordination
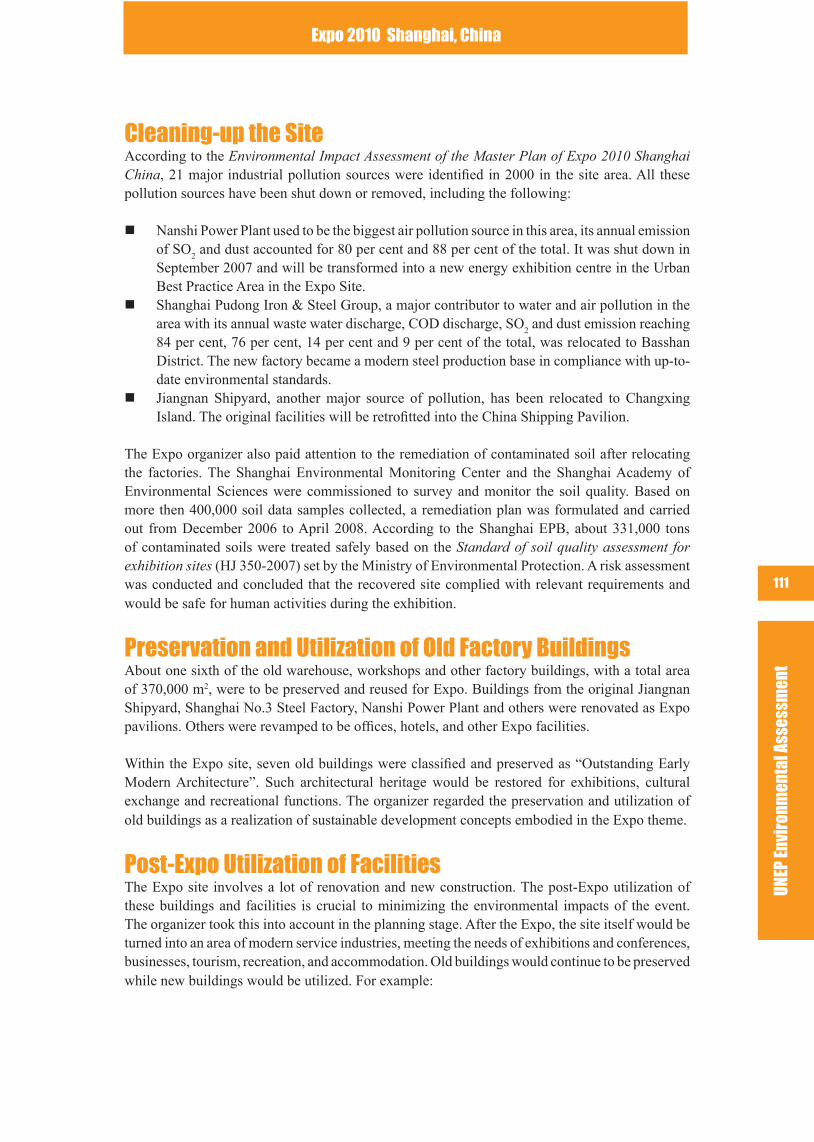
UNEP
Env
iron
men
tal A
sses
smen
t
Expo 2010 Shanghai, China
111
Cleaning-up the SiteAccording to the Environmental Impact Assessment of the Master Plan of Expo 2010 Shanghai China, 21 major industrial pollution sources were identied in 2000 in the site area. All these pollution sources have been shut down or removed, including the following:
Nanshi Power Plant used to be the biggest air pollution source in this area, its annual emission of SO
2 and dust accounted for 80 per cent and 88 per cent of the total. It was shut down in
September 2007 and will be transformed into a new energy exhibition centre in the Urban Best Practice Area in the Expo Site.Shanghai Pudong Iron & Steel Group, a major contributor to water and air pollution in the area with its annual waste water discharge, COD discharge, SO
2 and dust emission reaching
84 per cent, 76 per cent, 14 per cent and 9 per cent of the total, was relocated to Basshan District. The new factory became a modern steel production base in compliance with up-to-date environmental standards.Jiangnan Shipyard, another major source of pollution, has been relocated to Changxing Island. The original facilities will be retrotted into the China Shipping Pavilion.
The Expo organizer also paid attention to the remediation of contaminated soil after relocating the factories. The Shanghai Environmental Monitoring Center and the Shanghai Academy of Environmental Sciences were commissioned to survey and monitor the soil quality. Based on more then 400,000 soil data samples collected, a remediation plan was formulated and carried out from December 2006 to April 2008. According to the Shanghai EPB, about 331,000 tons of contaminated soils were treated safely based on the Standard of soil quality assessment for exhibition sites (HJ 350-2007) set by the Ministry of Environmental Protection. A risk assessment was conducted and concluded that the recovered site complied with relevant requirements and would be safe for human activities during the exhibition.
Preservation and Utilization of Old Factory BuildingsAbout one sixth of the old warehouse, workshops and other factory buildings, with a total area of 370,000 m2, were to be preserved and reused for Expo. Buildings from the original Jiangnan Shipyard, Shanghai No.3 Steel Factory, Nanshi Power Plant and others were renovated as Expo pavilions. Others were revamped to be ofces, hotels, and other Expo facilities.
Within the Expo site, seven old buildings were classied and preserved as “Outstanding Early Modern Architecture”. Such architectural heritage would be restored for exhibitions, cultural exchange and recreational functions. The organizer regarded the preservation and utilization of old buildings as a realization of sustainable development concepts embodied in the Expo theme.
Post-Expo Utilization of FacilitiesThe Expo site involves a lot of renovation and new construction. The post-Expo utilization of these buildings and facilities is crucial to minimizing the environmental impacts of the event. The organizer took this into account in the planning stage. After the Expo, the site itself would be turned into an area of modern service industries, meeting the needs of exhibitions and conferences, businesses, tourism, recreation, and accommodation. Old buildings would continue to be preserved while new buildings would be utilized. For example:
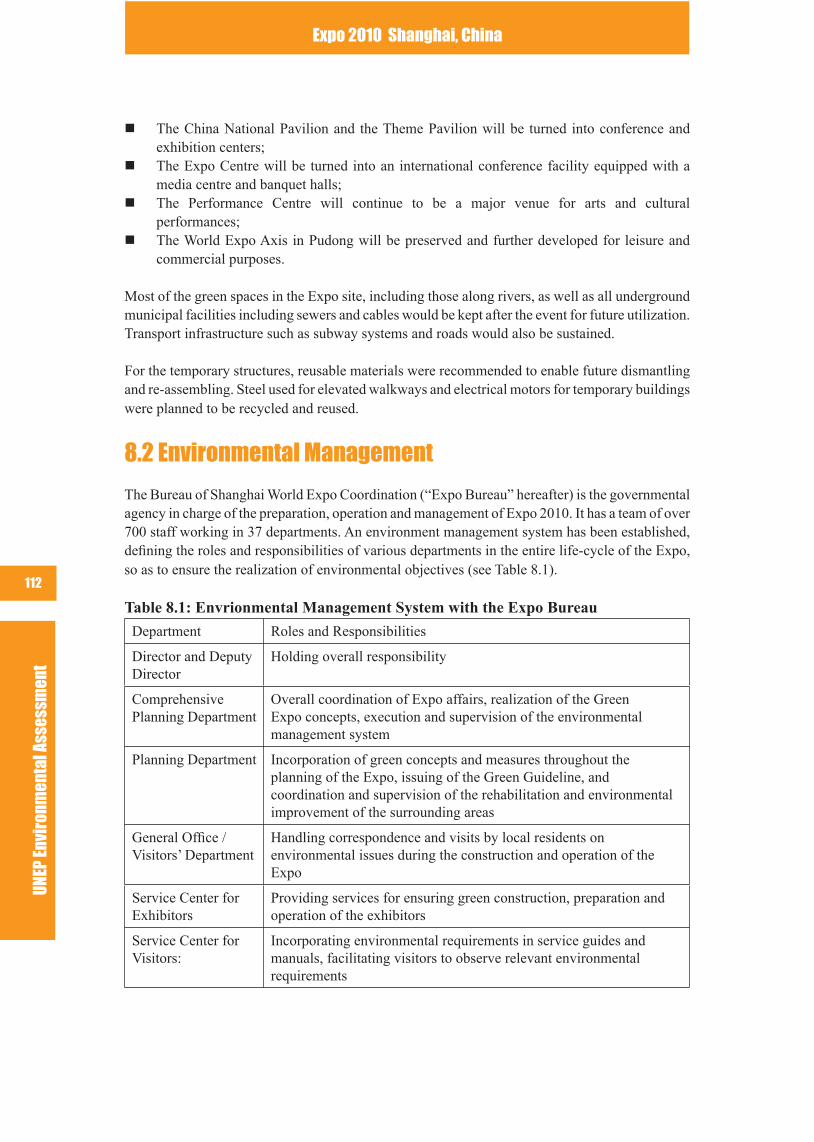
UNEP
Env
iron
men
tal A
sses
smen
tExpo 2010 Shanghai, China
112
The China National Pavilion and the Theme Pavilion will be turned into conference and exhibition centers;The Expo Centre will be turned into an international conference facility equipped with a media centre and banquet halls;The Performance Centre will continue to be a major venue for arts and cultural performances;The World Expo Axis in Pudong will be preserved and further developed for leisure and commercial purposes.
Most of the green spaces in the Expo site, including those along rivers, as well as all underground municipal facilities including sewers and cables would be kept after the event for future utilization. Transport infrastructure such as subway systems and roads would also be sustained.
For the temporary structures, reusable materials were recommended to enable future dismantling and re-assembling. Steel used for elevated walkways and electrical motors for temporary buildings were planned to be recycled and reused.
8.2 Environmental Management
The Bureau of Shanghai World Expo Coordination (“Expo Bureau” hereafter) is the governmental agency in charge of the preparation, operation and management of Expo 2010. It has a team of over 700 staff working in 37 departments. An environment management system has been established, dening the roles and responsibilities of various departments in the entire life-cycle of the Expo, so as to ensure the realization of environmental objectives (see Table 8.1).
Table 8.1: Envrionmental Management System with the Expo Bureau
Department Roles and Responsibilities
Director and Deputy Director
Holding overall responsibility
Comprehensive Planning Department
Overall coordination of Expo affairs, realization of the Green Expo concepts, execution and supervision of the environmental management system
Planning Department Incorporation of green concepts and measures throughout the planning of the Expo, issuing of the Green Guideline, and coordination and supervision of the rehabilitation and environmental improvement of the surrounding areas
General Ofce / Visitors’ Department
Handling correspondence and visits by local residents on environmental issues during the construction and operation of the Expo
Service Center for Exhibitors
Providing services for ensuring green construction, preparation and operation of the exhibitors
Service Center for Visitors:
Incorporating environmental requirements in service guides and manuals, facilitating visitors to observe relevant environmental requirements
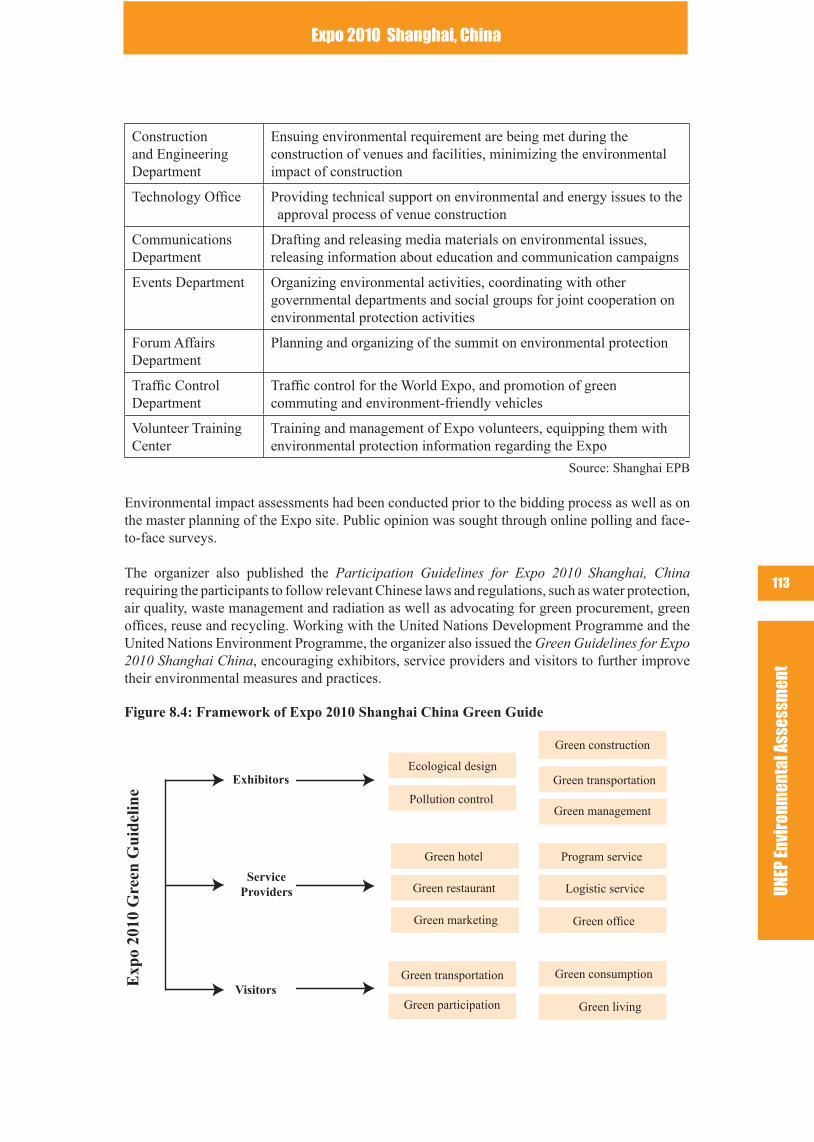
UNEP
Env
iron
men
tal A
sses
smen
t
Expo 2010 Shanghai, China
113
Construction and Engineering Department
Ensuing environmental requirement are being met during the construction of venues and facilities, minimizing the environmental impact of construction
Technology Ofce Providing technical support on environmental and energy issues to the approval process of venue construction
Communications Department
Drafting and releasing media materials on environmental issues, releasing information about education and communication campaigns
Events Department Organizing environmental activities, coordinating with other governmental departments and social groups for joint cooperation on environmental protection activities
Forum Affairs Department
Planning and organizing of the summit on environmental protection
Trafc Control Department
Trafc control for the World Expo, and promotion of green commuting and environment-friendly vehicles
Volunteer Training Center
Training and management of Expo volunteers, equipping them with environmental protection information regarding the Expo
Source: Shanghai EPB
Environmental impact assessments had been conducted prior to the bidding process as well as on the master planning of the Expo site. Public opinion was sought through online polling and face-to-face surveys.
The organizer also published the Participation Guidelines for Expo 2010 Shanghai, China requiring the participants to follow relevant Chinese laws and regulations, such as water protection, air quality, waste management and radiation as well as advocating for green procurement, green ofces, reuse and recycling. Working with the United Nations Development Programme and the United Nations Environment Programme, the organizer also issued the Green Guidelines for Expo 2010 Shanghai China, encouraging exhibitors, service providers and visitors to further improve their environmental measures and practices.
Figure 8.4: Framework of Expo 2010 Shanghai China Green Guide
Exhibitors
ServiceProviders
Visitors
Green construction
Green transportation
Green transportation
Green management
Program service
Logistic service
Green ofce
Green consumption
Green living Green participation
Green marketing
Green hotel
Green restaurant
Pollution control
Ecological design
Exp
o 20
10 G
reen
Gui
delin
e
UNEP
Env
iron
men
tal A
sses
smen
tExpo 2010 Shanghai, China
114
A series of environmental quality assurance measures were also carried out:Soil remediation had been completed and risk assessment concluded based on strict standards similar to that of US and the EU. Yangtze Delta-wide regional modeling and scenarios have been studied for ensuring air quality during the Expo. An action plan will be drafted and ready for enforcement. Research was conducted on minimizing water pollution resulting from surface runoff during heavy rains. Improvements to rainwater sewers and pump stations were studied to reduce urban non-point source pollution to water systems. Plans were developed to collect, sort, transfer, and treat the waste generated during the Expo. Modern municipal sanitary technologies were to be applied, including an underground aero-dynamic waste transfer system. Emergency responses, environmental monitoring systems and routine supervision of pollution sources are to be strengthened with capacity building and technical support.
The organizer also developed the "Online World Expo” site to enable virtual participation in the Expo through Internet, reducing the energy consumed and pollutants emitted from visits. The Website will also have information about the environmental initiative of the Expo as well as public transportation information to help visitors plan their trips.
8.3 Green Technologies and Measures at the Expo Site
EnergyThe organizer of Expo 2010 responded proactively to the urgent challenges of reducing energy consumption to mitigate climate change. The large-scale demonstration of cutting edge renewable energy and energy saving applications in the venues could help cities to re-orient their energy strategies toward a low-carbon future. The technologies listed below were discussed as they were designed. Their actual performance against common practices needs to be further assessed after the Expo 2010 nished.
Solar energy is extensively used throughout the Expo site. A total of 4.68 MW of solar photovol-taic panels will be installed on the roofs and glass walls of the Theme Pavilion, the China National Pavilion, the Expo Center and at the Nanshi power plant (see Table 8.2), as well as in some of the participating countries’ pavilions. The Theme Pavilion will be the typical architectural style of China with the largest building-integrated solar PV system. Solar-powered street lamps, lawn lamps, and other lighting as well as solar thermal heating systems will also be widely used in the Expo site.
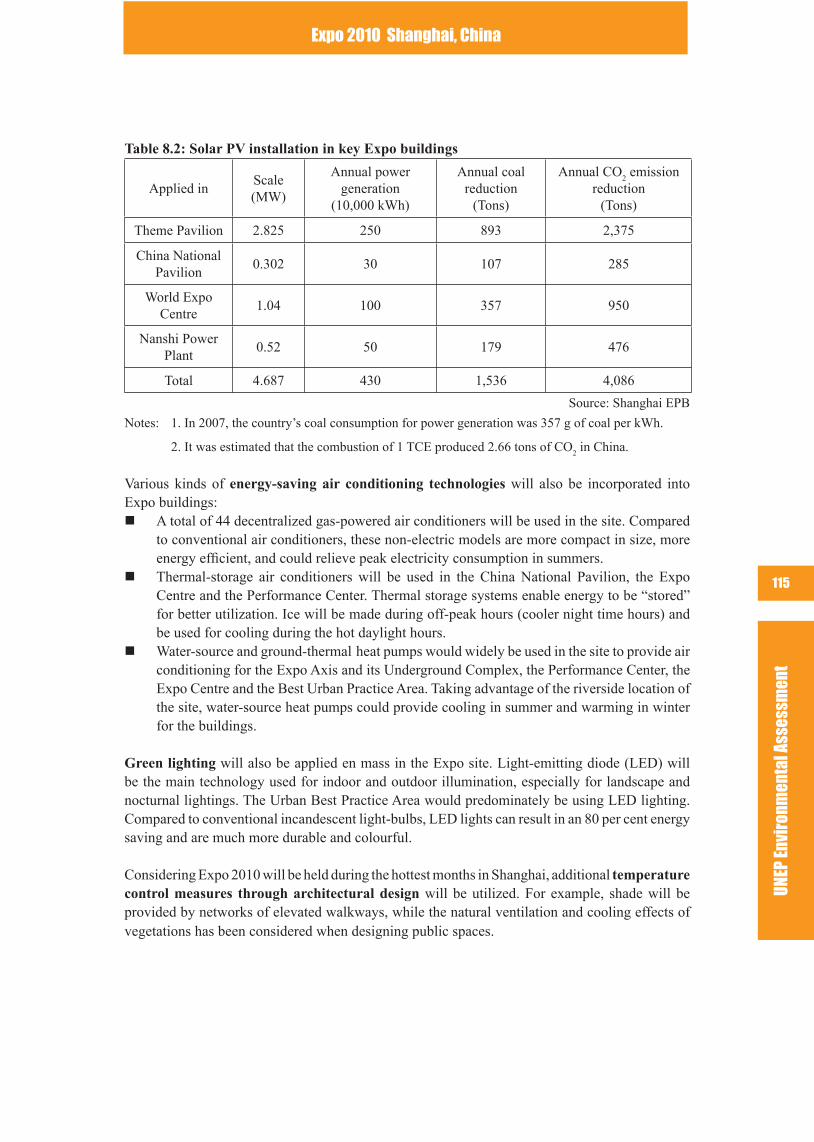
UNEP
Env
iron
men
tal A
sses
smen
t
Expo 2010 Shanghai, China
115
Table 8.2: Solar PV installation in key Expo buildings
Applied inScale(MW)
Annual power generation
(10,000 kWh)
Annual coal reduction
(Tons)
Annual CO2 emission
reduction(Tons)
Theme Pavilion 2.825 250 893 2,375
China National Pavilion
0.302 30 107 285
World Expo Centre
1.04 100 357 950
Nanshi Power Plant
0.52 50 179 476
Total 4.687 430 1,536 4,086
Source: Shanghai EPB
Notes: 1. In 2007, the country’s coal consumption for power generation was 357 g of coal per kWh.
2. It was estimated that the combustion of 1 TCE produced 2.66 tons of CO2 in China.
Various kinds of energy-saving air conditioning technologies will also be incorporated into Expo buildings:
A total of 44 decentralized gas-powered air conditioners will be used in the site. Compared to conventional air conditioners, these non-electric models are more compact in size, more energy efcient, and could relieve peak electricity consumption in summers. Thermal-storage air conditioners will be used in the China National Pavilion, the Expo Centre and the Performance Center. Thermal storage systems enable energy to be “stored” for better utilization. Ice will be made during off-peak hours (cooler night time hours) and be used for cooling during the hot daylight hours. Water-source and ground-thermal heat pumps would widely be used in the site to provide air conditioning for the Expo Axis and its Underground Complex, the Performance Center, the Expo Centre and the Best Urban Practice Area. Taking advantage of the riverside location of the site, water-source heat pumps could provide cooling in summer and warming in winter for the buildings.
Green lighting will also be applied en mass in the Expo site. Light-emitting diode (LED) will be the main technology used for indoor and outdoor illumination, especially for landscape and nocturnal lightings. The Urban Best Practice Area would predominately be using LED lighting. Compared to conventional incandescent light-bulbs, LED lights can result in an 80 per cent energy saving and are much more durable and colourful.
Considering Expo 2010 will be held during the hottest months in Shanghai, additional temperature control measures through architectural design will be utilized. For example, shade will be provided by networks of elevated walkways, while the natural ventilation and cooling effects of vegetations has been considered when designing public spaces.
UNEP
Env
iron
men
tal A
sses
smen
tExpo 2010 Shanghai, China
116
WaterWith the abundance of and proximity to water resources in Shanghai, the organizer nevertheless saw the need to promote water conservation and utilization:
Water-saving facilities have been widely applied throughout the Expo site, especially those for sanitary and irrigation purposes. Permeable materials were used extensively for pavements to prevent stormwater runoff and their resulting pollution.All the major permanent new buildings in the site, including the Expo Center, the Performance Centre, the Theme Pavilions, the China National Pavilion and the Expo Axis were equipped with building-integrated rainwater collection and reuse systems. Processed rainwater would be used in the site for general domestic use, saving approximately one million cubic metres of water.
TransportThe Shanghai municipal government has put in great effort in prioritizing and improving public transport systems, so as to upgrade urban mobility, reduce pollution and mitigate climate change. An extensive network of rapid transits and the introduction of new energy vehicles were amongst some of the impressive achievements. The organizer also planned to use zero local emission vehicles within the Expo site and low emission ones for site connections.
Green ArchitectureThe Expo site involved large scale construction and re-construction. The designs of all the permanent buildings followed state-of-the-art green architecture standards, incorporating best practices for energy efciency, water conservation and environment-friendly building materials. For example, The Expo Center was one of the rst buildings in the country awarded with the premier “Three-star Green Building Certicate” in China, and has applied for the gold standard in the American LEED system.
Various kinds of newly developed eco-friendly building material were made used of. Timber use was restricted with procurement standards set by the organizer. As there will be a number of temporary pavilions for exhibitions, the organizer encouraged the utilization of recyclable building materials over cement and bricks. Most of the building material for temporary structures can be disassembled, collected, and reused.
The organizer also explored how future eco-friendly buildings will look like in the Urban Best Practices Area. Visionary and innovative green architecture ideas and practices from around the world will be demonstrated, including the locally designed “Shanghai Ecological Home” which outlines the green buildings in the city for 2030. These ecological prototypes will hopefully set the trends of future eco-architecture.
Green CoverageThe Expo site will have a total of 1 million square metres of green coverage, reaching a greening rate of 50 per cent. Three parks, namely the Houtan Park (14 hectares), the Expo Garden (23 hectares) and the Bailianjing Park (12 hectares), and other smaller green spaces and corridors were planed for the Site. Equipped with eco-friendly designs and new greening technologies, they will be providing recreational, landscaping and ecological functions for the Expo and the city at large.
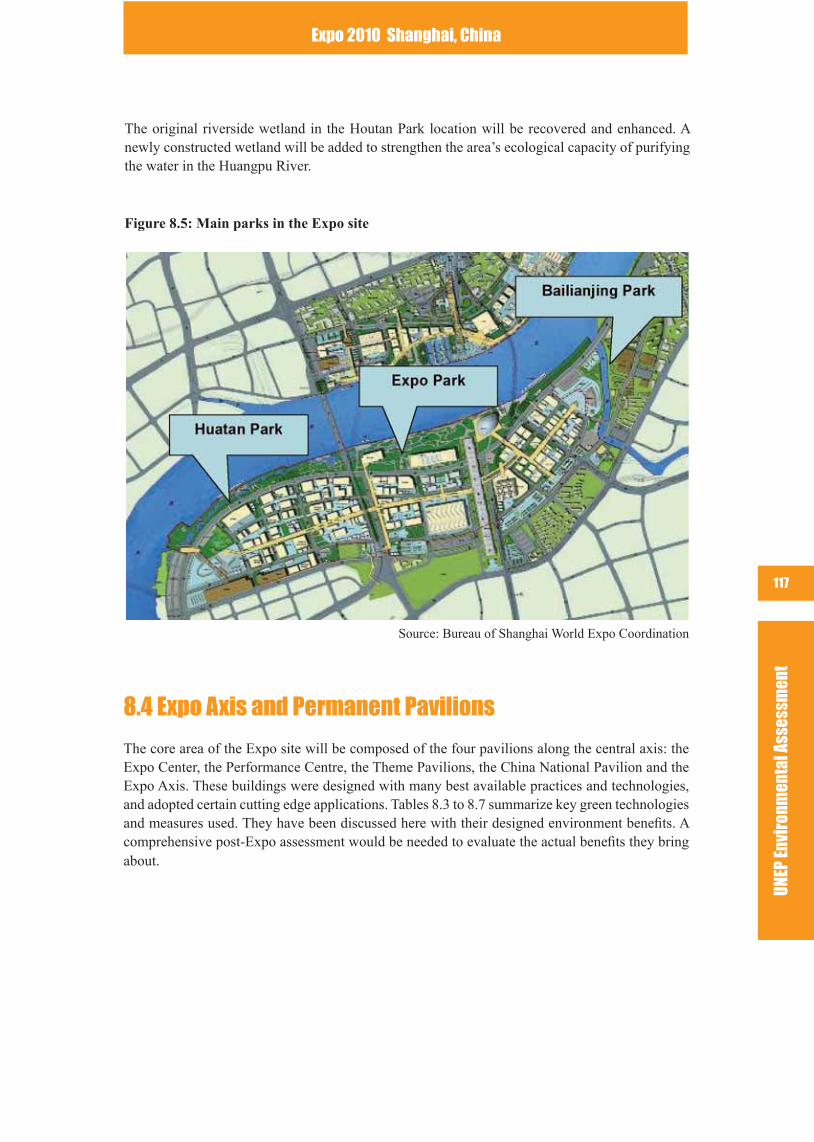
UNEP
Env
iron
men
tal A
sses
smen
t
Expo 2010 Shanghai, China
117
The original riverside wetland in the Houtan Park location will be recovered and enhanced. A newly constructed wetland will be added to strengthen the area’s ecological capacity of purifying the water in the Huangpu River.
Figure 8.5: Main parks in the Expo site
Source: Bureau of Shanghai World Expo Coordination
8.4 Expo Axis and Permanent Pavilions
The core area of the Expo site will be composed of the four pavilions along the central axis: the Expo Center, the Performance Centre, the Theme Pavilions, the China National Pavilion and the Expo Axis. These buildings were designed with many best available practices and technologies, and adopted certain cutting edge applications. Tables 8.3 to 8.7 summarize key green technologies and measures used. They have been discussed here with their designed environment benets. A comprehensive post-Expo assessment would be needed to evaluate the actual benets they bring about.
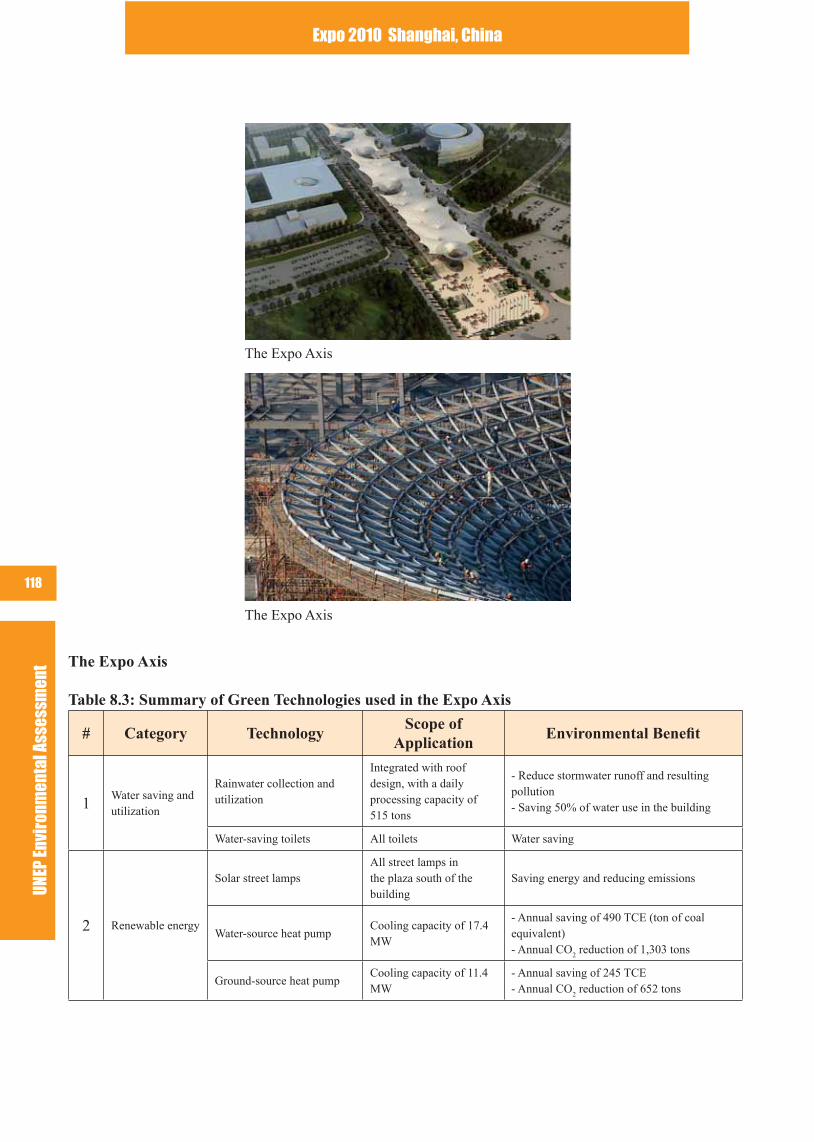
UNEP
Env
iron
men
tal A
sses
smen
tExpo 2010 Shanghai, China
118
The Expo Axis
Table 8.3: Summary of Green Technologies used in the Expo Axis
# Category TechnologyScope of
ApplicationEnvironmental Benet
1Water saving and utilization
Rainwater collection and utilization
Integrated with roof design, with a daily processing capacity of 515 tons
- Reduce stormwater runoff and resulting pollution- Saving 50% of water use in the building
Water-saving toilets All toilets Water saving
2 Renewable energy
Solar street lampsAll street lamps in the plaza south of the building
Saving energy and reducing emissions
Water-source heat pumpCooling capacity of 17.4 MW
- Annual saving of 490 TCE (ton of coal equivalent)- Annual CO
2 reduction of 1,303 tons
Ground-source heat pumpCooling capacity of 11.4 MW
- Annual saving of 245 TCE- Annual CO
2 reduction of 652 tons
The Expo Axis
The Expo Axis
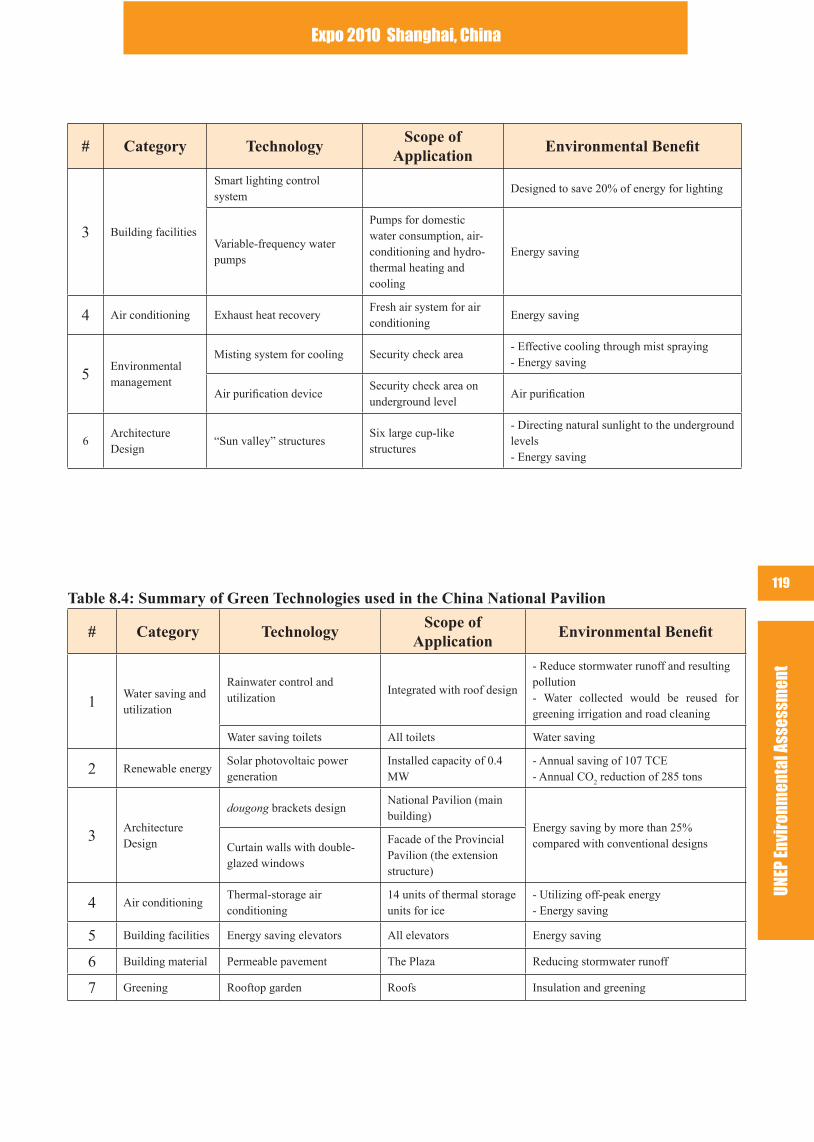
UNEP
Env
iron
men
tal A
sses
smen
t
Expo 2010 Shanghai, China
119
# Category TechnologyScope of
ApplicationEnvironmental Benet
3 Building facilities
Smart lighting control system
Designed to save 20% of energy for lighting
Variable-frequency water pumps
Pumps for domestic water consumption, air-conditioning and hydro-thermal heating and cooling
Energy saving
4 Air conditioning Exhaust heat recoveryFresh air system for air conditioning
Energy saving
5Environmental management
Misting system for cooling Security check area - Effective cooling through mist spraying- Energy saving
Air purication deviceSecurity check area on underground level
Air purication
6Architecture Design
“Sun valley” structures Six large cup-like structures
- Directing natural sunlight to the underground levels- Energy saving
Table 8.4: Summary of Green Technologies used in the China National Pavilion
# Category TechnologyScope of
ApplicationEnvironmental Benet
1Water saving and utilization
Rainwater control and utilization
Integrated with roof design
- Reduce stormwater runoff and resulting pollution- Water collected would be reused for greening irrigation and road cleaning
Water saving toilets All toilets Water saving
2 Renewable energy Solar photovoltaic power generation
Installed capacity of 0.4 MW
- Annual saving of 107 TCE- Annual CO
2 reduction of 285 tons
3Architecture Design
dougong brackets designNational Pavilion (main building)
Energy saving by more than 25% compared with conventional designsCurtain walls with double-
glazed windows
Facade of the Provincial Pavilion (the extension structure)
4 Air conditioningThermal-storage air conditioning
14 units of thermal storage units for ice
- Utilizing off-peak energy- Energy saving
5 Building facilities Energy saving elevators All elevators Energy saving
6 Building material Permeable pavement The Plaza Reducing stormwater runoff
7 Greening Rooftop garden Roofs Insulation and greening
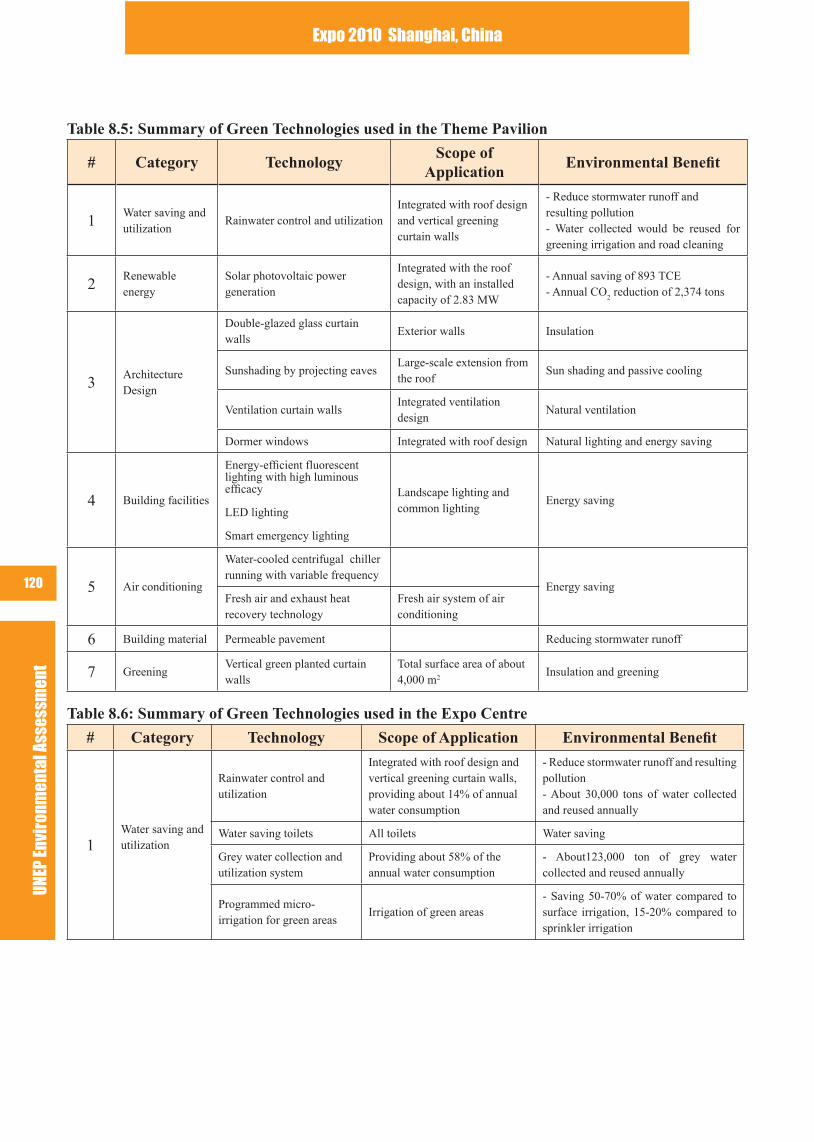
UNEP
Env
iron
men
tal A
sses
smen
tExpo 2010 Shanghai, China
120
Table 8.5: Summary of Green Technologies used in the Theme Pavilion
# Category TechnologyScope of
ApplicationEnvironmental Benet
1Water saving and utilization
Rainwater control and utilization Integrated with roof design and vertical greening curtain walls
- Reduce stormwater runoff and resulting pollution- Water collected would be reused for greening irrigation and road cleaning
2Renewable energy
Solar photovoltaic power generation
Integrated with the roof design, with an installed capacity of 2.83 MW
- Annual saving of 893 TCE- Annual CO
2 reduction of 2,374 tons
3Architecture Design
Double-glazed glass curtain walls
Exterior walls Insulation
Sunshading by projecting eaves Large-scale extension from the roof
Sun shading and passive cooling
Ventilation curtain wallsIntegrated ventilation design
Natural ventilation
Dormer windows Integrated with roof design Natural lighting and energy saving
4 Building facilities
Energy-efcient fluorescent lighting with high luminous efcacy Landscape lighting and
common lightingEnergy saving
LED lighting
Smart emergency lighting
5 Air conditioning
Water-cooled centrifugal chiller running with variable frequency
Energy savingFresh air and exhaust heat recovery technology
Fresh air system of air conditioning
6 Building material Permeable pavement Reducing stormwater runoff
7 GreeningVertical green planted curtain walls
Total surface area of about 4,000 m2
Insulation and greening
Table 8.6: Summary of Green Technologies used in the Expo Centre
# Category Technology Scope of Application Environmental Benet
1Water saving and utilization
Rainwater control and utilization
Integrated with roof design and vertical greening curtain walls, providing about 14% of annual water consumption
- Reduce stormwater runoff and resulting pollution- About 30,000 tons of water collected and reused annually
Water saving toilets All toilets Water saving
Grey water collection and utilization system
Providing about 58% of the annual water consumption
- About123,000 ton of grey water collected and reused annually
Programmed micro-irrigation for green areas
Irrigation of green areas- Saving 50-70% of water compared to surface irrigation, 15-20% compared to sprinkler irrigation
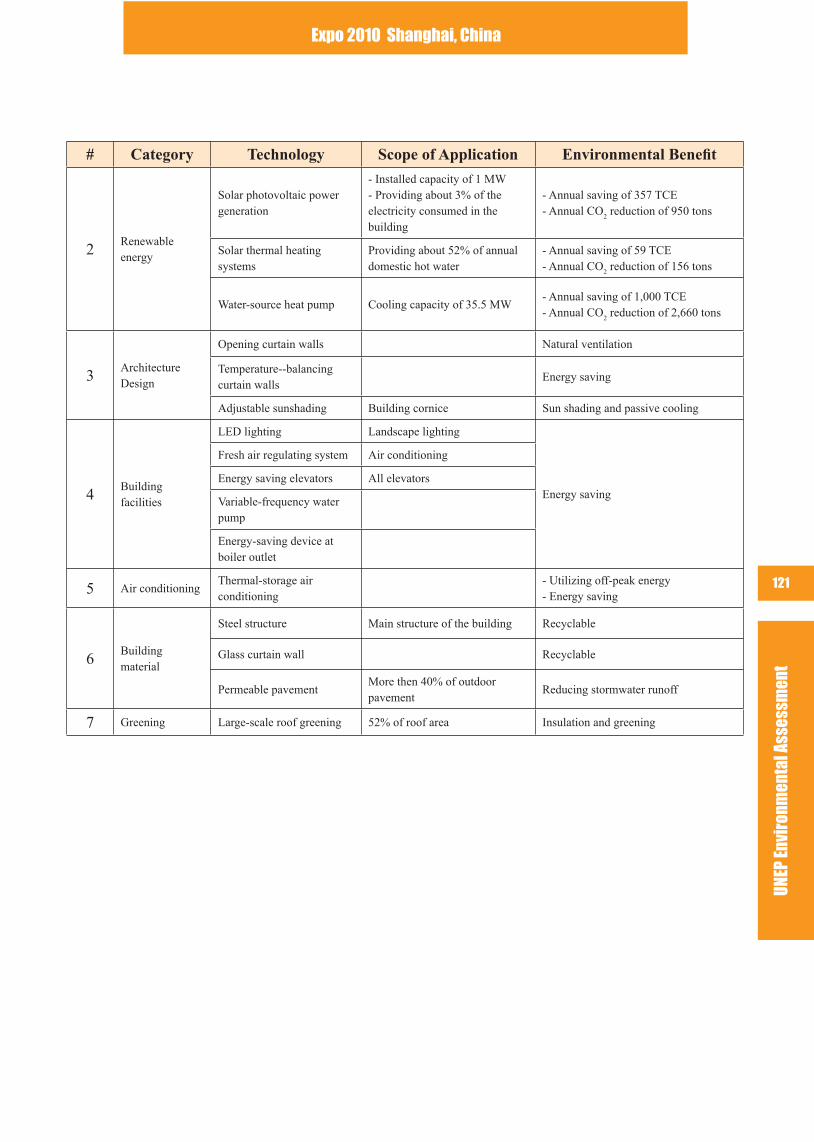
UNEP
Env
iron
men
tal A
sses
smen
t
Expo 2010 Shanghai, China
121
# Category Technology Scope of Application Environmental Benet
2Renewable energy
Solar photovoltaic power generation
- Installed capacity of 1 MW- Providing about 3% of the electricity consumed in the building
- Annual saving of 357 TCE- Annual CO
2 reduction of 950 tons
Solar thermal heating systems
Providing about 52% of annual domestic hot water
- Annual saving of 59 TCE- Annual CO
2 reduction of 156 tons
Water-source heat pump Cooling capacity of 35.5 MW- Annual saving of 1,000 TCE- Annual CO
2 reduction of 2,660 tons
3Architecture Design
Opening curtain walls Natural ventilation
Temperature--balancing curtain walls
Energy saving
Adjustable sunshading Building cornice Sun shading and passive cooling
4Building facilities
LED lighting Landscape lighting
Energy saving
Fresh air regulating system Air conditioning
Energy saving elevators All elevators
Variable-frequency water pump
Energy-saving device at boiler outlet
5 Air conditioningThermal-storage air conditioning
- Utilizing off-peak energy- Energy saving
6Building material
Steel structure Main structure of the building Recyclable
Glass curtain wall Recyclable
Permeable pavementMore then 40% of outdoor pavement
Reducing stormwater runoff
7 Greening Large-scale roof greening 52% of roof area Insulation and greening
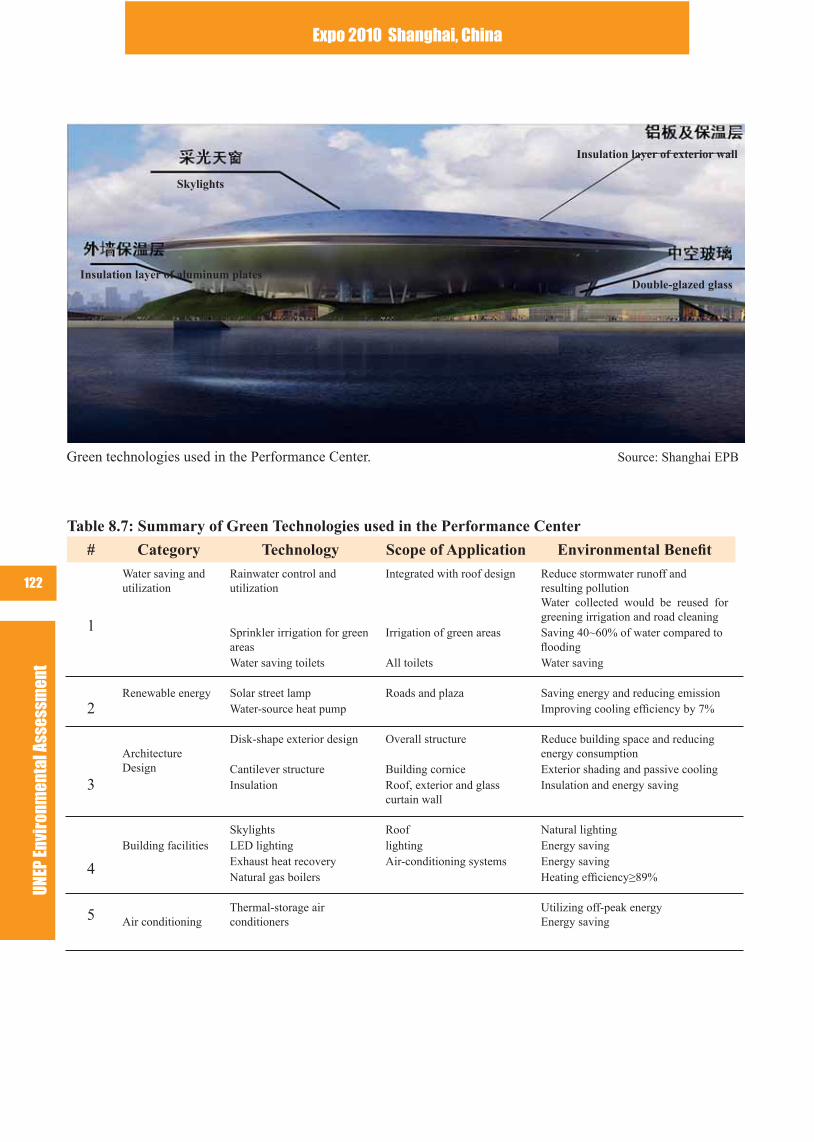
UNEP
Env
iron
men
tal A
sses
smen
tExpo 2010 Shanghai, China
122
Table 8.7: Summary of Green Technologies used in the Performance Center
# Category Technology Scope of Application Environmental Benet
1
Water saving and utilization
Rainwater control and utilization
Integrated with roof design Reduce stormwater runoff and resulting pollutionWater collected would be reused for greening irrigation and road cleaning
Sprinkler irrigation for green areas
Irrigation of green areas Saving 40~60% of water compared to ooding
Water saving toilets All toilets Water saving
2Renewable energy Solar street lamp Roads and plaza Saving energy and reducing emission
Water-source heat pump Improving cooling efciency by 7%
3
Architecture Design
Disk-shape exterior design Overall structure Reduce building space and reducing energy consumption
Cantilever structure Building cornice Exterior shading and passive coolingInsulation Roof, exterior and glass
curtain wallInsulation and energy saving
Skylights Roof Natural lighting
4
Building facilities LED lighting lighting Energy savingExhaust heat recovery Air-conditioning systems Energy savingNatural gas boilers Heating efciency≥89%
5 Air conditioningThermal-storage air conditioners
Utilizing off-peak energyEnergy saving
Insulation layer of aluminum plates
Skylights
Insulation layer of exterior wall
Double-glazed glass
Green technologies used in the Performance Center. Source: Shanghai EPB

UNEP
Env
iron
men
tal A
sses
smen
t
Expo 2010 Shanghai, China
123
8.5 Urban Best Practices AreaThe Expo organizer set up the Urban Best Practices Area (UBPA) to collect and showcase successful attempts at making cities more livable and sustainable. The UBPA enables cities around the world to take part in the Expo for the rst time in history. The area will not only present those commonly acknowledged, original and valuable programmes and practices designed to improve the quality of urban life by cities, but also act as a platform for these cities to share and exchange experiences in urban construction and development. The UBPA will be divided into four exhibition elds, namely Livable Cities, Sustainable Urbanization, Protection and Utilization of Historical Heritage Sites and Technological Innovation in the Built Environment.
The UBPA mainly presents various on-going practices, along with some experimental examples which have huge application potential. A total of 59 exhibition cases, covering 28 countries and 54 cities from all over the world, were selected for the exhibition. A lot of the projects will be demonstrating cutting edge eco-designs and green building technologies. Table 8.8 shows a few selected projects with their green designs and measures highlighted.
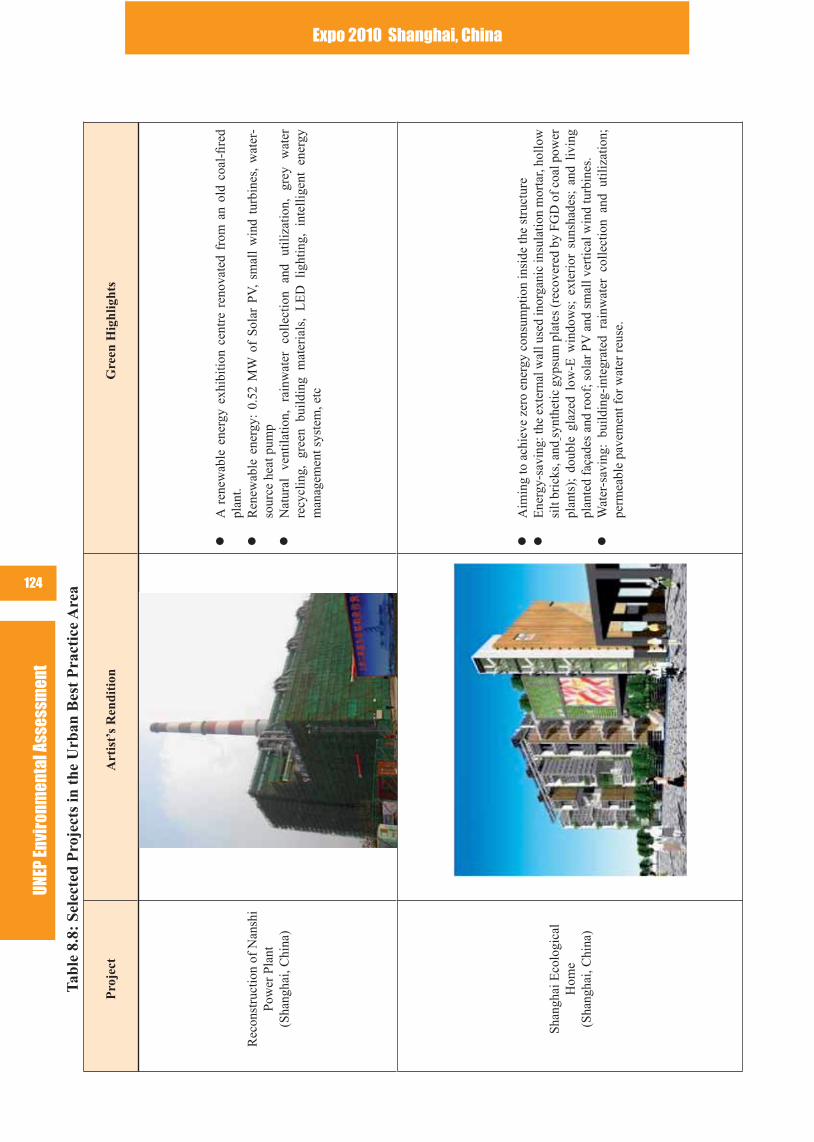
UNEP
Env
iron
men
tal A
sses
smen
tExpo 2010 Shanghai, China
124
Tab
le 8
.8:
Sele
cted
Pro
ject
s in
the
Urb
an B
est
Pra
ctic
e A
rea
Pro
ject
Art
ist’
s R
endi
tion
Gre
en H
ighl
ight
s
Rec
onst
ruct
ion
of N
ansh
i Po
wer
Pla
nt(S
hang
hai,
Chi
na)
A r
enew
able
ene
rgy
exhi
bitio
n ce
ntre
ren
ovat
ed f
rom
an
old
coal
-re
d pl
ant.
Ren
ewab
le e
nerg
y: 0
.52
MW
of
Sola
r PV
, sm
all
win
d tu
rbin
es,
wat
er-
sour
ce h
eat p
ump
Nat
ural
ve
ntila
tion,
ra
inw
ater
co
llect
ion
and
utili
zatio
n,
grey
w
ater
re
cycl
ing,
gre
en b
uild
ing
mat
eria
ls,
LE
D l
ight
ing,
int
ellig
ent
ener
gy
man
agem
ent s
yste
m, e
tc
Shan
ghai
Eco
logi
cal
Hom
e (S
hang
hai,
Chi
na)
Aim
ing
to a
chie
ve z
ero
ener
gy c
onsu
mpt
ion
insi
de th
e st
ruct
ure
Ene
rgy-
savi
ng: t
he e
xter
nal w
all u
sed
inor
gani
c in
sula
tion
mor
tar,
hollo
w
silt
bric
ks, a
nd s
ynth
etic
gyp
sum
pla
tes
(rec
over
ed b
y FG
D o
f coa
l pow
er
plan
ts);
dou
ble
glaz
ed l
ow-E
win
dow
s; e
xter
ior
suns
hade
s; a
nd l
ivin
g pl
ante
d fa
çade
s an
d ro
of; s
olar
PV
and
sm
all v
ertic
al w
ind
turb
ines
. W
ater
-sav
ing:
bui
ldin
g-in
tegr
ated
rai
nwat
er c
olle
ctio
n an
d ut
iliza
tion;
pe
rmea
ble
pave
men
t for
wat
er r
euse
.
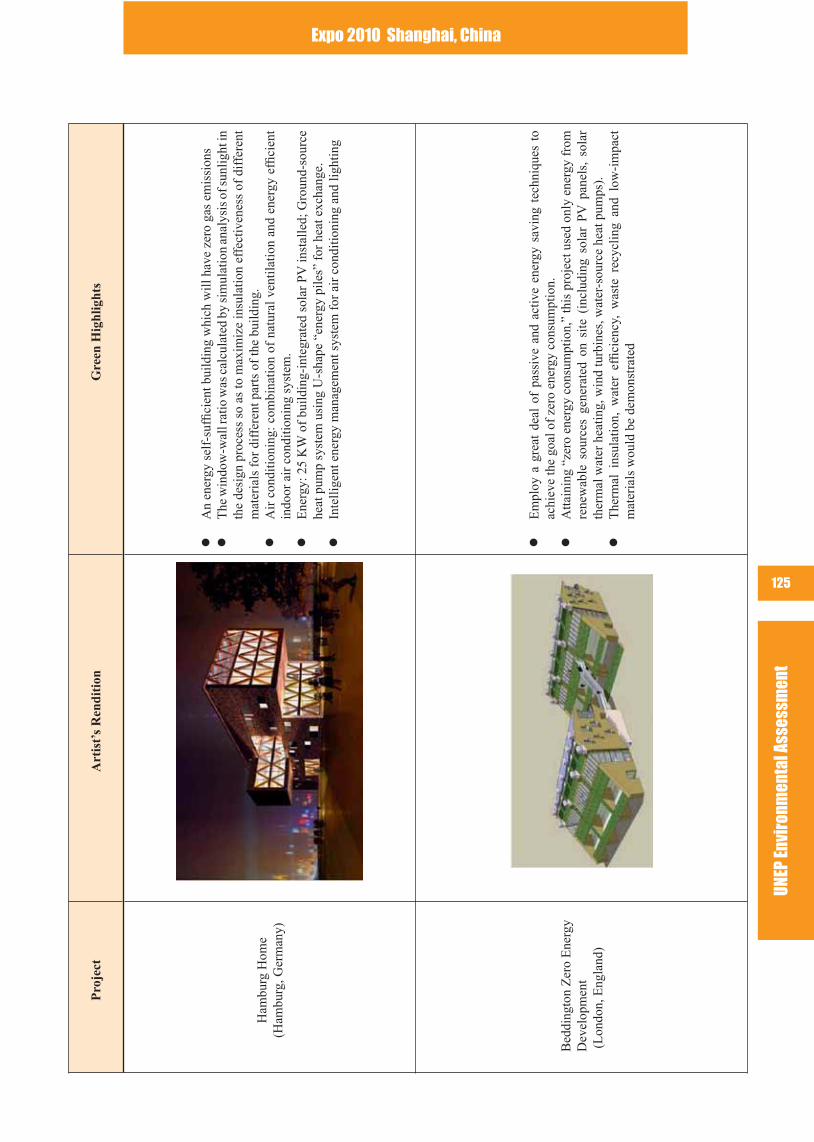
UNEP
Env
iron
men
tal A
sses
smen
t
Expo 2010 Shanghai, China
125
Pro
ject
Art
ist’
s R
endi
tion
Gre
en H
ighl
ight
s
Ham
burg
Hom
e (H
ambu
rg, G
erm
any)
An
ener
gy s
elf-
suf
cien
t bui
ldin
g w
hich
will
hav
e ze
ro g
as e
mis
sion
sT
he w
indo
w-w
all r
atio
was
cal
cula
ted
by si
mul
atio
n an
alys
is o
f sun
light
in
the
desi
gn p
roce
ss s
o as
to m
axim
ize
insu
latio
n ef
fect
iven
ess
of d
iffe
rent
m
ater
ials
for
dif
fere
nt p
arts
of
the
build
ing.
A
ir c
ondi
tioni
ng: c
ombi
natio
n of
nat
ural
ven
tilat
ion
and
ener
gy e
fci
ent
indo
or a
ir c
ondi
tioni
ng s
yste
m.
Ene
rgy:
25
KW
of
build
ing-
inte
grat
ed s
olar
PV
inst
alle
d; G
roun
d-so
urce
he
at p
ump
syst
em u
sing
U-s
hape
“en
ergy
pile
s” f
or h
eat e
xcha
nge.
Inte
llige
nt e
nerg
y m
anag
emen
t sys
tem
for
air
con
ditio
ning
and
ligh
ting
Bed
ding
ton
Zer
o E
nerg
y D
evel
opm
ent
(L
ondo
n, E
ngla
nd)
Em
ploy
a g
reat
dea
l of
pas
sive
and
act
ive
ener
gy s
avin
g te
chni
ques
to
achi
eve
the
goal
of
zero
ene
rgy
cons
umpt
ion.
Atta
inin
g “z
ero
ener
gy c
onsu
mpt
ion,
” th
is p
roje
ct u
sed
only
ene
rgy
from
re
new
able
sou
rces
gen
erat
ed o
n si
te (
incl
udin
g so
lar
PV p
anel
s, s
olar
th
erm
al w
ater
hea
ting,
win
d tu
rbin
es, w
ater
-sou
rce
heat
pum
ps).
T
herm
al i
nsul
atio
n, w
ater
ef
cien
cy,
was
te r
ecyc
ling
and
low
-im
pact
m
ater
ials
wou
ld b
e de
mon
stra
ted
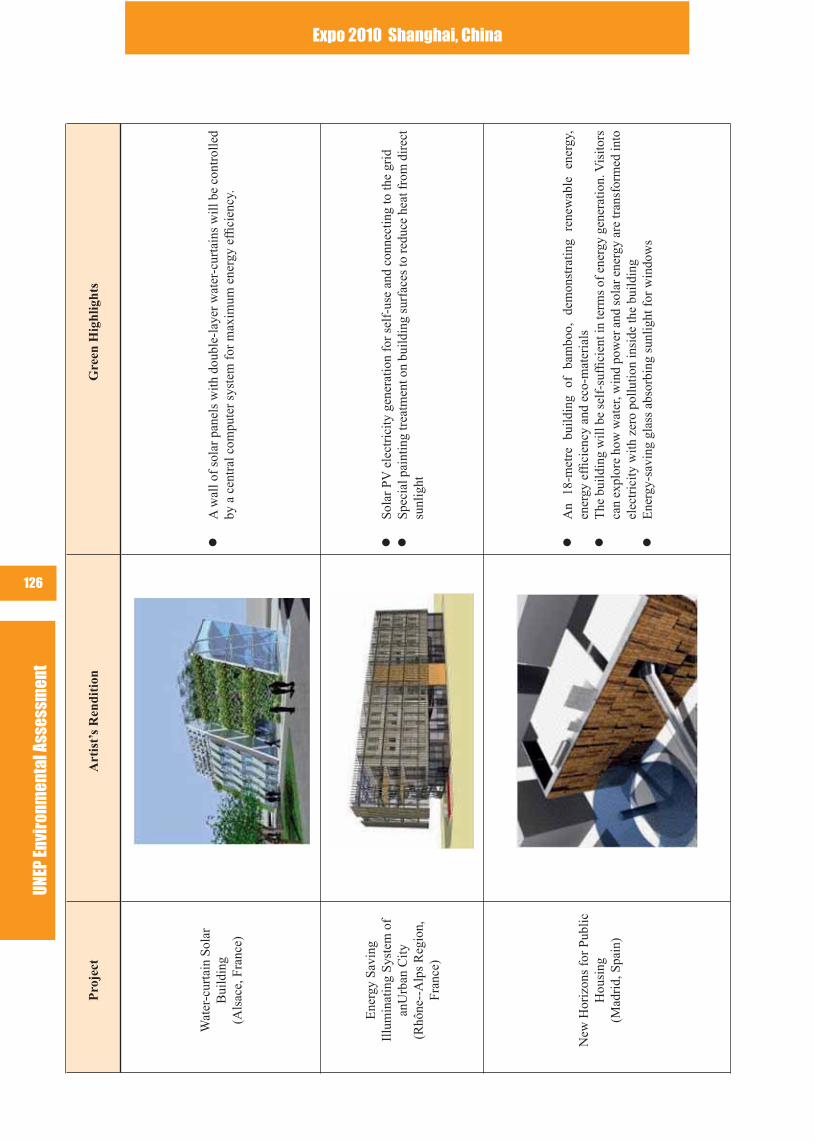
UNEP
Env
iron
men
tal A
sses
smen
tExpo 2010 Shanghai, China
126
Pro
ject
Art
ist’
s R
endi
tion
Gre
en H
ighl
ight
s
Wat
er-c
urta
in S
olar
B
uild
ing
(Als
ace,
Fra
nce)
A w
all o
f so
lar
pane
ls w
ith d
oubl
e-la
yer
wat
er-c
urta
ins
will
be
cont
rolle
d by
a c
entr
al c
ompu
ter
syst
em f
or m
axim
um e
nerg
y efc
ienc
y.
Ene
rgy
Savi
ng
Illu
min
atin
g Sy
stem
of
anU
rban
City
(Rhô
ne--
Alp
s R
egio
n,
Fran
ce)
Sola
r PV
ele
ctri
city
gen
erat
ion
for
self
-use
and
con
nect
ing
to th
e gr
idSp
ecia
l pai
ntin
g tr
eatm
ent o
n bu
ildin
g su
rfac
es to
redu
ce h
eat f
rom
dir
ect
sunl
ight
New
Hor
izon
s fo
r Pu
blic
H
ousi
ng(M
adri
d, S
pain
)
An
18-m
etre
bu
ildin
g of
ba
mbo
o,
dem
onst
ratin
g re
new
able
en
ergy
, en
ergy
ef
cien
cy a
nd e
co-m
ater
ials
The
bui
ldin
g w
ill b
e se
lf-s
ufc
ient
in te
rms
of e
nerg
y ge
nera
tion.
Vis
itors
ca
n ex
plor
e ho
w w
ater
, win
d po
wer
and
sol
ar e
nerg
y ar
e tr
ansf
orm
ed in
to
elec
tric
ity w
ith z
ero
pollu
tion
insi
de th
e bu
ildin
gE
nerg
y-sa
ving
gla
ss a
bsor
bing
sun
light
for
win
dow
s
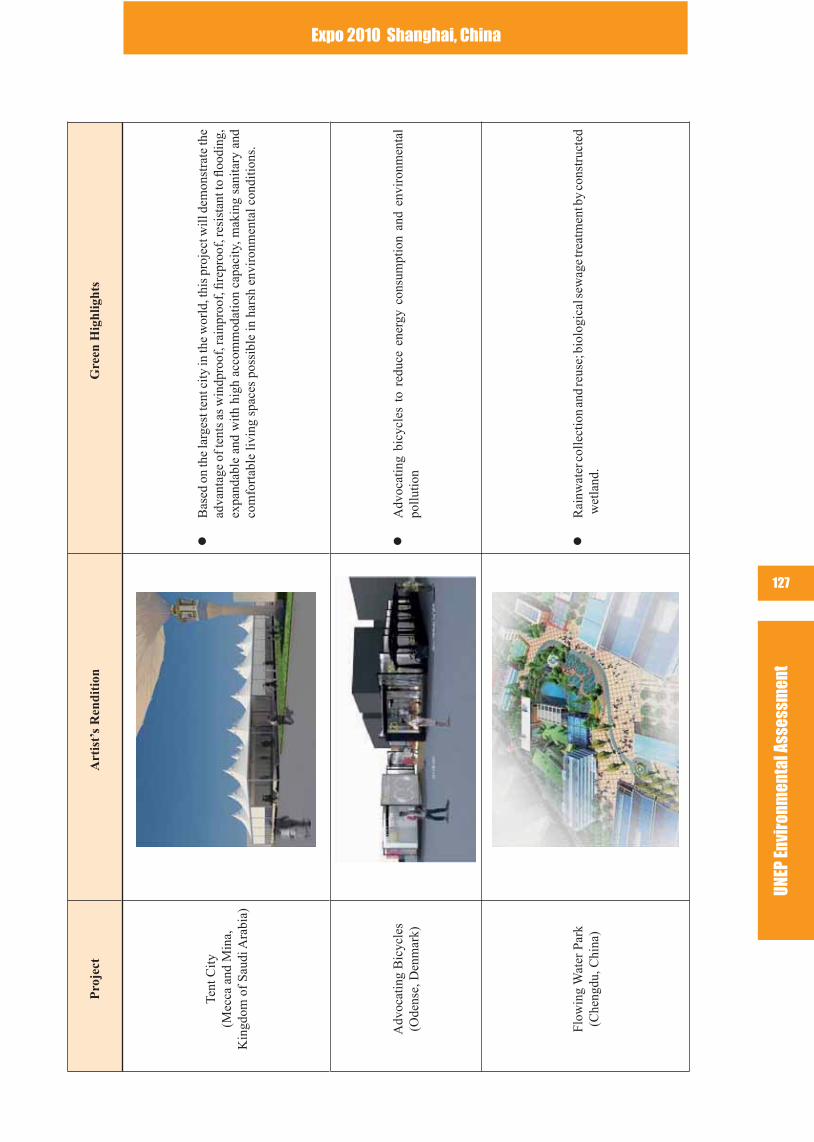
UNEP
Env
iron
men
tal A
sses
smen
t
Expo 2010 Shanghai, China
127
Pro
ject
Art
ist’
s R
endi
tion
Gre
en H
ighl
ight
s
Tent
City
(Mec
ca a
nd M
ina,
K
ingd
om o
f Sa
udi A
rabi
a)
Bas
ed o
n th
e la
rges
t ten
t city
in th
e w
orld
, thi
s pr
ojec
t will
dem
onst
rate
the
adva
ntag
e of
tent
s as
win
dpro
of, r
ainp
roof
, re
proo
f, re
sist
ant t
o o
odin
g,
expa
ndab
le a
nd w
ith h
igh
acco
mm
odat
ion
capa
city
, mak
ing
sani
tary
and
co
mfo
rtab
le li
ving
spa
ces
poss
ible
in h
arsh
env
iron
men
tal c
ondi
tions
.
Adv
ocat
ing
Bic
ycle
s (O
dens
e, D
enm
ark)
Adv
ocat
ing
bicy
cles
to
redu
ce e
nerg
y co
nsum
ptio
n an
d en
viro
nmen
tal
pollu
tion
Flow
ing
Wat
er P
ark
(Che
ngdu
, Chi
na)
Rai
nwat
er c
olle
ctio
n an
d re
use;
bio
logi
cal s
ewag
e tr
eatm
ent b
y co
nstr
ucte
d w
etla
nd.
UNEP
Env
iron
men
tal A
sses
smen
tExpo 2010 Shanghai, China
128
8.6 Green Visions in Participants’ Pavilions
By mid 2009, 191 countries and 48 international organizations had conrmed their participation in Expo 2010. Most of the county participants designed and build their own pavilions to interpret the theme “Better City, Better Lives” from their unique experience. These national exhibition halls were meant to be temporary structures according to the tradition and practice of the Expo. Many countries have nevertheless invested in pavilions with eco-designs and green technologies. Figure 8.9 shows a selection of national pavilions highlighting the green concepts behind the buildings.
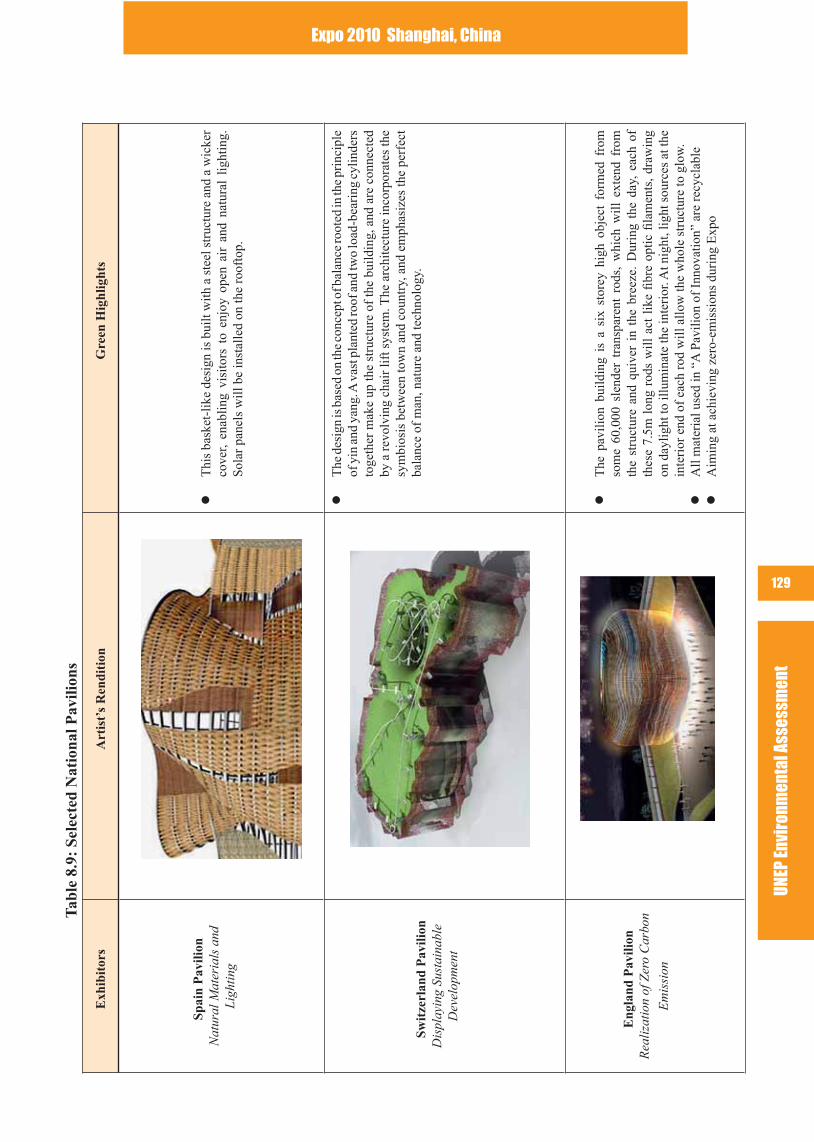
UNEP
Env
iron
men
tal A
sses
smen
t
Expo 2010 Shanghai, China
129
Tab
le 8
.9:
Sele
cted
Nat
iona
l Pav
ilion
s
Exh
ibit
ors
Art
ist’
s R
endi
tion
Gre
en H
ighl
ight
s
Spai
n P
avili
onN
atur
al M
ater
ials
and
Li
ghtin
g
Thi
s ba
sket
-lik
e de
sign
is b
uilt
with
a s
teel
str
uctu
re a
nd a
wic
ker
cove
r, en
ablin
g vi
sito
rs t
o en
joy
open
air
and
nat
ural
lig
htin
g.
Sola
r pa
nels
will
be
inst
alle
d on
the
roof
top.
Swit
zerl
and
Pav
ilion
Dis
play
ing
Sust
aina
ble
Dev
elop
men
t
The
des
ign
is b
ased
on
the
conc
ept o
f bal
ance
root
ed in
the
prin
cipl
e of
yin
and
yan
g. A
vas
t pla
nted
roof
and
two
load
-bea
ring
cyl
inde
rs
toge
ther
mak
e up
the
stru
ctur
e of
the
build
ing,
and
are
con
nect
ed
by a
rev
olvi
ng c
hair
lift
sys
tem
. The
arc
hite
ctur
e in
corp
orat
es th
e sy
mbi
osis
bet
wee
n to
wn
and
coun
try,
and
em
phas
izes
the
perf
ect
bala
nce
of m
an, n
atur
e an
d te
chno
logy
.
Eng
land
Pav
ilion
Rea
lizat
ion
of Z
ero
Car
bon
Em
issi
on
The
pav
ilion
bui
ldin
g is
a s
ix s
tore
y hi
gh o
bjec
t fo
rmed
fro
m
som
e 60
,000
sle
nder
tra
nspa
rent
rod
s, w
hich
will
ext
end
from
th
e st
ruct
ure
and
quiv
er i
n th
e br
eeze
. D
urin
g th
e da
y, e
ach
of
thes
e 7.
5m l
ong
rods
will
act
lik
e b
re o
ptic
la
men
ts,
draw
ing
on d
aylig
ht to
illu
min
ate
the
inte
rior
. At n
ight
, lig
ht s
ourc
es a
t the
in
teri
or e
nd o
f ea
ch r
od w
ill a
llow
the
who
le s
truc
ture
to g
low
. A
ll m
ater
ial u
sed
in “
A P
avili
on o
f In
nova
tion”
are
rec
ycla
ble
Aim
ing
at a
chie
ving
zer
o-em
issi
ons
duri
ng E
xpo
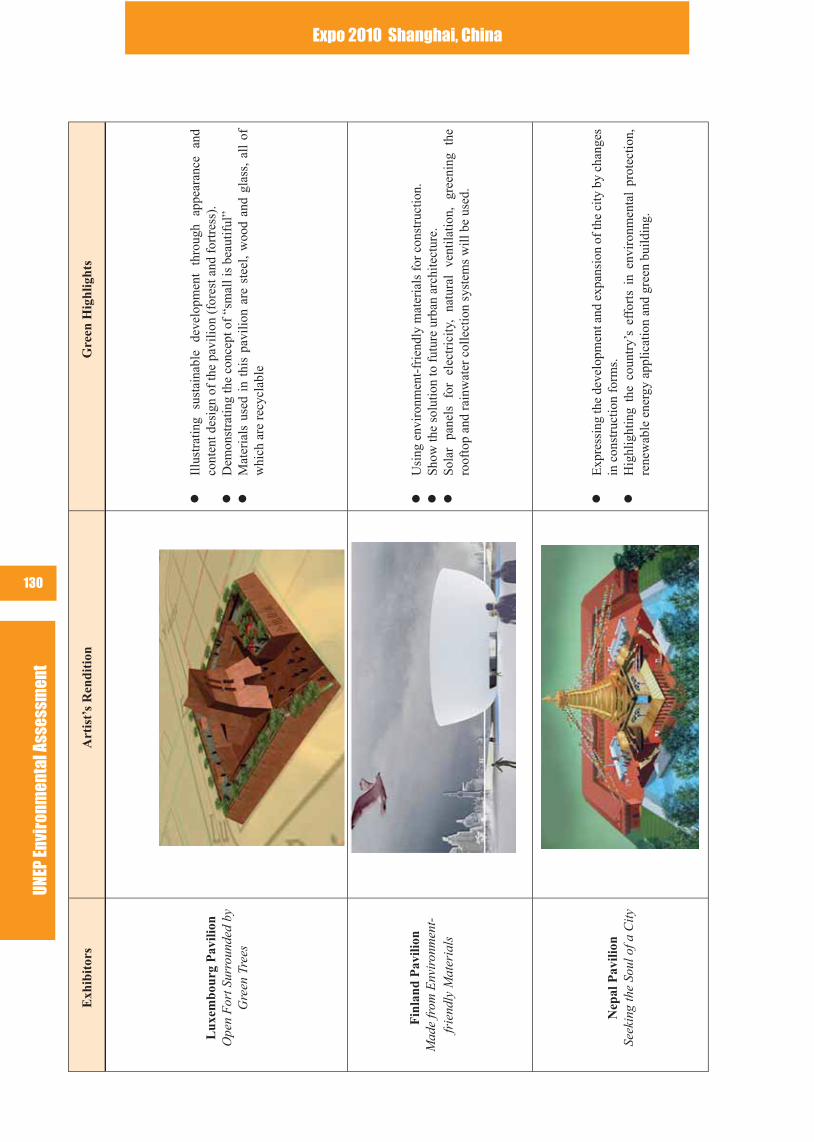
UNEP
Env
iron
men
tal A
sses
smen
tExpo 2010 Shanghai, China
130
Exh
ibit
ors
Art
ist’
s R
endi
tion
Gre
en H
ighl
ight
s
Lux
embo
urg
Pav
ilion
Ope
n F
ort S
urro
unde
d by
G
reen
Tre
es
Illu
stra
ting
sust
aina
ble
deve
lopm
ent
thro
ugh
appe
aran
ce
and
cont
ent d
esig
n of
the
pavi
lion
(for
est a
nd f
ortr
ess)
. D
emon
stra
ting
the
conc
ept o
f “s
mal
l is
beau
tiful
”M
ater
ials
use
d in
thi
s pa
vilio
n ar
e st
eel,
woo
d an
d gl
ass,
all
of
whi
ch a
re r
ecyc
labl
e
Fin
land
Pav
ilion
Mad
e fr
om E
nvir
onm
ent-
frie
ndly
Mat
eria
ls
Usi
ng e
nvir
onm
ent-
frie
ndly
mat
eria
ls f
or c
onst
ruct
ion.
Show
the
solu
tion
to f
utur
e ur
ban
arch
itect
ure.
Sola
r pa
nels
fo
r el
ectr
icity
, na
tura
l ve
ntila
tion,
gr
eeni
ng
the
roof
top
and
rain
wat
er c
olle
ctio
n sy
stem
s w
ill b
e us
ed.
Nep
al P
avili
onSe
ekin
g th
e So
ul o
f a C
ity
Exp
ress
ing
the
deve
lopm
ent a
nd e
xpan
sion
of t
he c
ity b
y ch
ange
s in
con
stru
ctio
n fo
rms.
Hig
hlig
htin
g th
e co
untr
y’s
effo
rts
in e
nvir
onm
enta
l pr
otec
tion,
re
new
able
ene
rgy
appl
icat
ion
and
gree
n bu
ildin
g.
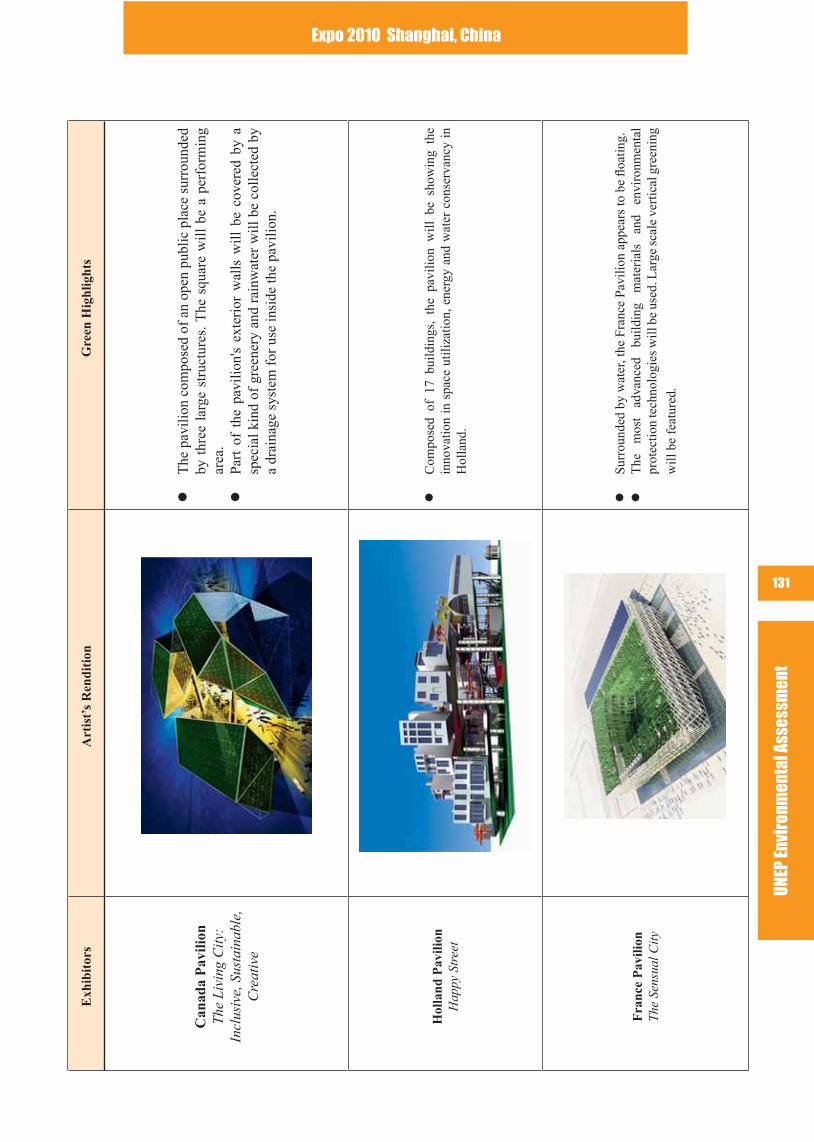
UNEP
Env
iron
men
tal A
sses
smen
t
Expo 2010 Shanghai, China
131
Exh
ibit
ors
Art
ist’
s R
endi
tion
Gre
en H
ighl
ight
s
Can
ada
Pav
ilion
The
Livi
ng C
ity:
Incl
usiv
e, S
usta
inab
le,
Cre
ativ
e
The
pav
ilion
com
pose
d of
an
open
pub
lic p
lace
sur
roun
ded
by t
hree
lar
ge s
truc
ture
s. T
he s
quar
e w
ill b
e a
perf
orm
ing
area
. Pa
rt o
f th
e pa
vilio
n's
exte
rior
wal
ls w
ill b
e co
vere
d by
a
spec
ial k
ind
of g
reen
ery
and
rain
wat
er w
ill b
e co
llect
ed b
y a
drai
nage
sys
tem
for
use
insi
de th
e pa
vilio
n.
Hol
land
Pav
ilion
Hap
py S
tree
t
Com
pose
d of
17
build
ings
, th
e pa
vilio
n w
ill b
e sh
owin
g th
e in
nova
tion
in s
pace
util
izat
ion,
ene
rgy
and
wat
er c
onse
rvan
cy i
n H
olla
nd.
Fra
nce
Pav
ilion
The
Sens
ual C
ity
Surr
ound
ed b
y w
ater
, the
Fra
nce
Pavi
lion
appe
ars
to b
e o
atin
g.
The
m
ost
adva
nced
bu
ildin
g m
ater
ials
an
d en
viro
nmen
tal
prot
ectio
n te
chno
logi
es w
ill b
e us
ed. L
arge
sca
le v
ertic
al g
reen
ing
will
be
feat
ured
.
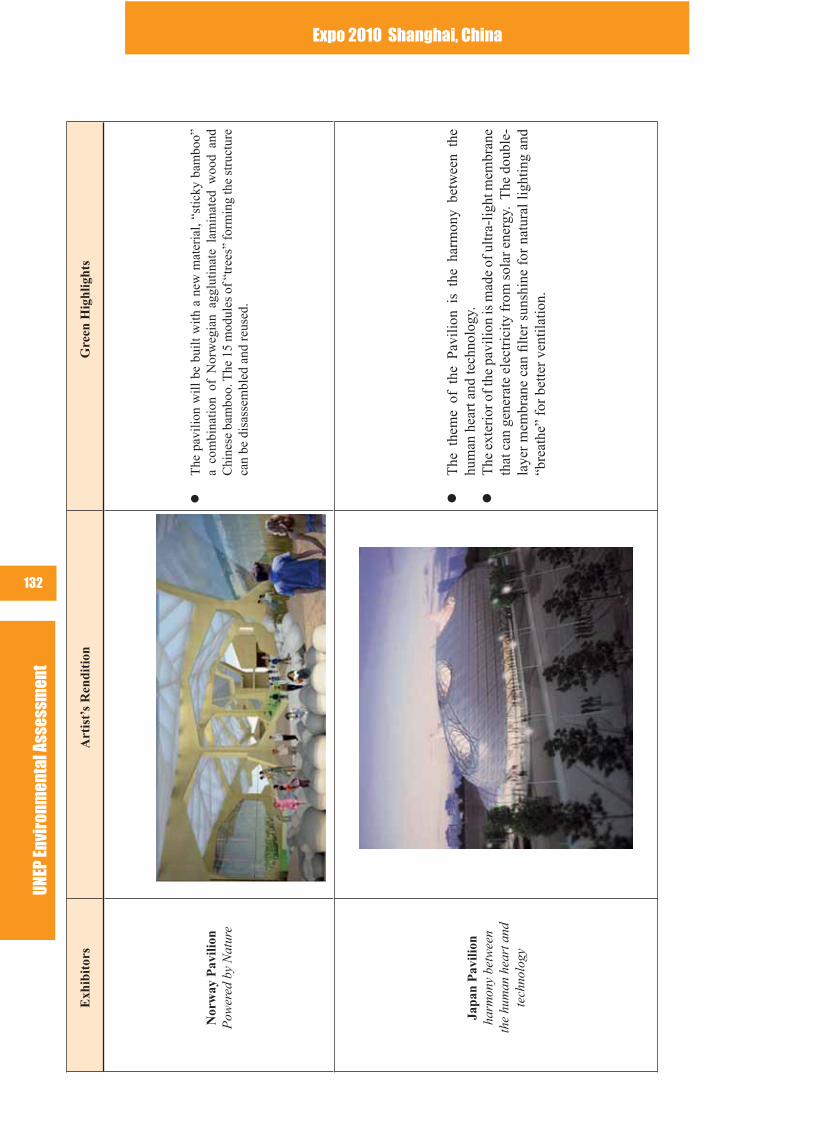
UNEP
Env
iron
men
tal A
sses
smen
tExpo 2010 Shanghai, China
132
Exh
ibit
ors
Art
ist’
s R
endi
tion
Gre
en H
ighl
ight
s
Nor
way
Pav
ilion
Pow
ered
by
Nat
ure
The
pav
ilion
will
be
built
with
a n
ew m
ater
ial,
“stic
ky b
ambo
o”
a co
mbi
natio
n of
Nor
weg
ian
aggl
utin
ate
lam
inat
ed w
ood
and
Chi
nese
bam
boo.
The
15
mod
ules
of “
tree
s” fo
rmin
g th
e st
ruct
ure
can
be d
isas
sem
bled
and
reu
sed.
Japa
n P
avili
onha
rmon
y be
twee
n th
e hu
man
hea
rt a
nd
tech
nolo
gy
The
the
me
of t
he P
avili
on i
s th
e ha
rmon
y be
twee
n th
e hu
man
hea
rt a
nd te
chno
logy
.T
he e
xter
ior o
f the
pav
ilion
is m
ade
of u
ltra-
light
mem
bran
e th
at c
an g
ener
ate
elec
tric
ity fr
om s
olar
ene
rgy.
The
dou
ble-
laye
r m
embr
ane
can l
ter
suns
hine
for
nat
ural
ligh
ting
and
“bre
athe
” fo
r be
tter
vent
ilatio
n.
UNEP
Env
iron
men
tal A
sses
smen
t
Expo 2010 Shanghai, China
133
8.7 COMMENTS AND RECOMMENDATIONS
UNEP acknowledges the enormous efforts the organizer put into ensuring environmental considerations were taken into serious consideration during the earlier planning and design phases of Expo 2010. The selection of the site and its transformation, as well as the addition of new green design buildings and the preservation and renovation of old ones, was carried out with a clearly articulated sustainability vision.
The vast amount of green ideas and technologies that will be extensively demonstrated in and by the pavilions in the core area (Expo Axis, Theme Pavilion, Expo Center, Performance Center and China National Pavilion), the Urban Best Practices Area and those of the participating countries will help to set new agendas for green architecture and urban environmental strategies.
Due to the limitation of the Expo rules, many pavilions were built as provisional structures. It is recommended that these temporary pavilions should be either preserved and reused on-site, or reassembled elsewhere to maximize the demonstration impacts of their eco-designs and to minimize waste generation. The Expo will not qualify as a green project if all the temporary structures become waste after a few months.
In order to maximize the experiences learnt from the different green ideas and technologies showcased during the preparation and exhibition period of Expo 2010, UNEP recommends that the Shanghai organizer considers commissioning a comparative study to identify opportunities and improvements needed for their large-scale application and mainstreaming in the future. The share of renewable energy in total energy consumption, the effectiveness of the energy and water saving measures, etc. are questions which need to be answered in a scientic and transparent way. This study will be a highly valuable legacy of Expo 2010 contribution to the continuous efforts to make cities greener and more sustainable.
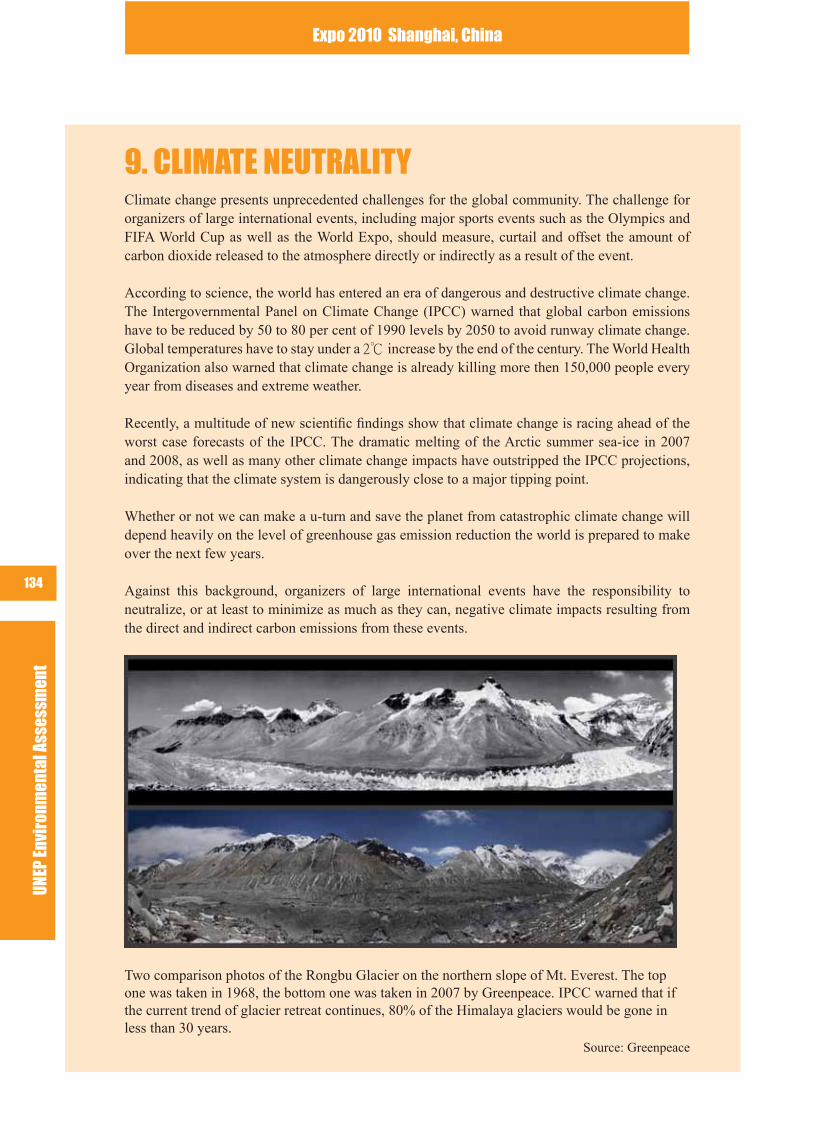
UNEP
Env
iron
men
tal A
sses
smen
tExpo 2010 Shanghai, China
134
9. CLIMATE NEUTRALITYClimate change presents unprecedented challenges for the global community. The challenge for organizers of large international events, including major sports events such as the Olympics and FIFA World Cup as well as the World Expo, should measure, curtail and offset the amount of carbon dioxide released to the atmosphere directly or indirectly as a result of the event.
According to science, the world has entered an era of dangerous and destructive climate change. The Intergovernmental Panel on Climate Change (IPCC) warned that global carbon emissions have to be reduced by 50 to 80 per cent of 1990 levels by 2050 to avoid runway climate change. Global temperatures have to stay under a 2℃ increase by the end of the century. The World Health Organization also warned that climate change is already killing more then 150,000 people every year from diseases and extreme weather.
Recently, a multitude of new scientic ndings show that climate change is racing ahead of the worst case forecasts of the IPCC. The dramatic melting of the Arctic summer sea-ice in 2007 and 2008, as well as many other climate change impacts have outstripped the IPCC projections, indicating that the climate system is dangerously close to a major tipping point.
Whether or not we can make a u-turn and save the planet from catastrophic climate change will depend heavily on the level of greenhouse gas emission reduction the world is prepared to make over the next few years.
Against this background, organizers of large international events have the responsibility to neutralize, or at least to minimize as much as they can, negative climate impacts resulting from the direct and indirect carbon emissions from these events.
Two comparison photos of the Rongbu Glacier on the northern slope of Mt. Everest. The top one was taken in 1968, the bottom one was taken in 2007 by Greenpeace. IPCC warned that if the current trend of glacier retreat continues, 80% of the Himalaya glaciers would be gone in less than 30 years.
Source: Greenpeace
UNEP
Env
iron
men
tal A
sses
smen
t
Expo 2010 Shanghai, China
135
9.1 CLIMATE NEUTRALITY AND MAJOR EVENTS
UNEP believes that any measurement of the climate impact of major events should include both direct and indirect emissions. Direct emissions include activities undertaken at all stages, from the planning phase, the construction and renovation of venues, to the actual fair. Indirect emissions are those by all other actors and would include especially international ights of ofcials, visitors and the media, amongst others.
A comprehensive strategy to address climate neutrality at the Expo should include actions to:Measure the carbon footprint of the Expo at all stagesReduce energy demandIncrease energy efciencyScale up the utilization of renewable energy, andCompensate or offset the remaining unavoidable emissions after the abovementioned efforts.
The priority of such a strategy should be avoiding and reducing carbon emissions at the source. Offsetting is only a second best option to ensure the net balance of emissions. Carbon offsetting in theory refers to initiatives aiming at balancing out the green house gases emissions in one place by reducing them in another. A wide range of activities can provide carbon offsets, such as projects on energy saving and development of renewable energy. Projects such as landll gases for electricity, modern biomass facilities and community-based solar PV or the installation of solar heaters could be considered.
The avoided emissions of carbon offset projects have to be quantiable and veriable. Binding and transparent procedures need to be laid down for all projects to ensure that greenhouse gases are in fact saved. Annual third party examination is necessary before such savings are taken into account in the climate balance. Additionality of the projects need to be proved and double counting prevented.
If the Expo 2010 organizer wants to develop offsets for its carbon emissions, best practice should be adopted. The experience of the Gold Standard for carbon credits and the Clean Development Mechanism under the Kyoto Protocol should be favoured.
9.2 EXPERIENCE OF THE BEIJING OLYMPICS
Prior to the 2008 Olympics, UNEP advised the Beijing Organizing Committee of the Games (BOCOG) to develop strategies to achieve climate neutrality for the event. Following UNEP’s recommendation, a study was commissioned by BOCOG, with the aim to:
assess carbon emissions directly resulting from the 2008 Olympics; estimate the positive effects of the environmental measures taken on the climate; andcalculate whether the net balance was positive or negative.
The BOCOG-commissioned study showed that the carbon footprint of the Games would be 1,181,900 tons of greenhouse gases, while the various emission reduction measures would save 1,182,500 tons of greenhouse gas. Based on this calculation, it concluded that the 2008 Beijing Olympics were carbon neutral.
UNEP
Env
iron
men
tal A
sses
smen
tExpo 2010 Shanghai, China
136
UNEP in its Independent Environment Assessment of the Beijing 2008 Olympics Games raised a few concerns on the methodology used and data verication in the study. However, UNEP did acknowledge Beijing’s methodological breakthrough in including the international travel of athletes and spectators in the overall calculation, which was the rst time such a concern had been measured for a large international event.
9.3 SHANGHAI WORLD EXPO 2010 AND CARBON NEUTRALITY
The Shanghai municipality is keen to minimize the carbon emissions of the event. They have been studying the experience of Beijing as well as other major international events attempting to achieve carbon neutrality.
As the Expo will last six months and is expecting 70 million visitors, it would generate considerable carbon emissions if no environmental measures were to be developed to tackle it. In order to reduce greenhouse gas emissions, Shanghai has developed the following measures:
As part of the city-wide industrial restructuring and phasing-out of obsolete factories, those factories located inside the Expo site with old-fashioned polluting technologies and lower energy efciency have been closed down. Some were relocated and their technologies upgraded to improve resources- and energy-efciency.
The Expo applied many new energy technologies. Solar panels, ground- and water-source heat-pumps and LED lighting in the Expo buildings. Low-emission and zero-local-emission vehicles will be used at the Expo site and the vicinity. Buildings are required to meet higher energy efciency standards and encouraged to apply for LEED certication. All these measures aim to reduce carbon emissions and energy consumption.
The Expo organizer promoted carbon offset projects to balance out some of the carbon emissions, including urban greening and the protection of standing forest, as well as introduced a citizens’ green commuting campaign. Studies are under way to explore the feasibility of encouraging visitors to purchase carbon credits to neutralize their carbon emissions from travelling.
UNEP understands that Shanghai has commissioned a study to look at the carbon footprint of the Expo, the emission reductions of the environmental measures and the net balance. The results will be useful in the future for Shanghai to design its carbon neutrality strategies.
UNEP
Env
iron
men
tal A
sses
smen
t
Expo 2010 Shanghai, China
137
9.4 COMMENTS AND RECOMMENDATIONS
UNEP welcomes the Shanghai organizer’s efforts to pay serious attention to the importance of minimizing the event’s negative climate impact. UNEP believes that the integrated, multi-sector measures in energy-saving and emission-reduction the government set for the municipality at large and the Expo in particular have provided a solid basis for Shanghai to approach a low-carbon, or even carbon-neutral, World Expo.
It is acknowledged that efforts to mitigate and offset emissions should be a collective responsibility of the organizers, suppliers, sponsors, visitors, countries and international organizations participating in the Expo. Shanghai is encouraged to nd effective and creative ways to engage these stakeholders to minimize their climate impact. The Beijing experience on carbon neutrality provides a very valuable example for future major events organizers, Shanghai Expo included. Attention should be paid both in the prioritization of strategies (reduction before offsetting), the scope of calculation (direct and indirect emissions of the event), as well as the transparency of methodology and data-sharing.
UNEP would like to see Shanghai’s success in achieving carbon neutrality for the Expo. The municipality is advised to take note of the experience and lessons learned from Beijing and other international events. An early completion of a study would also provide a platform to identify where improvements can be made on the mitigation and offsetting strategies for approaching a carbon neutral Expo.
UNEP
Env
iron
men
tal A
sses
smen
tExpo 2010 Shanghai, China
138
10. PUBLIC PARTICIPATION
In recent years, the Shanghai authorities began a wide range of communication and educational activities to promote the “Green Expo” concept and to raise environmental awareness amongst its citizens. Different partners, including various local government organs, corporations, social organizations, schools, neighbourhood committees, volunteers, and environmental NGOs, were engaged in promoting the vision of a “Green Expo” which entails a fundamental transformation of the city’s infrastructure and the lifestyles of its citizens for a greener future.
“Better City, Better Life” is the theme of the 2010 World Expo, underlying the importance of cities and their citizens for a sustainable future. In the last few years, the Shanghai authorities have done a lot to improve the city’s infrastructure as discussed above. This chapter will look at what communication and education programmes the government has carried out to promote green awareness, as well as the level of NGO and public participation in the process.
UNEP
Env
iron
men
tal A
sses
smen
t
Expo 2010 Shanghai, China
139
10.1 COMMUNICATIONS AND CAMPAIGNS
The Shanghai authority, like other local governments in China, has a wide range of governmental, state-owned and state-managed organs, and government-initiated NGOs (GoNGOs) to mobilize its communication and education programmes. Media, schools, state-owned companies, and neighbourhood level organizations in Shanghai were mobilized top-down to promote “Green Expo” and environmental awareness. As a result a wide network of communication channels work together to broadcast green messages.
The municipality has organized many activities on the theme of a “Green Expo” and general environmental issues through a web of government-led platforms. These include:
World Environment Day: Communications and educational activities were organized on World Environment Day, following the themes set by UNEP and the central government. In recent years, the concept of a “Green Expo” has been integrated into World Environment Day activities in Shanghai.
Car Free Day: Shanghai participated in the world-wide Car Free Day on 22 September. Activities promoting public transportation were organized, including the mayor and other high-ranking ofcials taking buses and subways to work on that day.
Media Campaigns: A city-wide media campaign was kicked off to convey the initiatives and results of the Environmental Three-year Action Plans. Special focus was put on energy saving and emission reduction. The theme for 2008 was “Be a national environmental model city to welcome the Expo”.
Green Ofce: Putting the Green Expo Guidelines into effect, staff of the Expo were encouraged to set an example by working as a green ofce.
Green Neighbourhoods and Green Schools Campaign: This project aims at raising environmental awareness within the community and at school level. Neighbourhoods and schools with a certain level of environmental facilities and performance would be named as “Green Neighbourhood” or “Green School.” By the end of 2008, 68 neighborhoods and more then 600 schools in the municipality were awarded.
Neighbourhood Level Programmes: Shanghai EPB has partnered with many neighborhood organizations to promote environmental awareness at the community level with the theme “Welcoming Expo and Everyday-life Environmental Protection.” It is expected that over a million people will participate in this programme by 2010 before the start of the Expo.
Campus Activities: Students in tertiary institutions are a key target audience of the environmental communication and education programme of the Shanghai municipal government. About 80,000 students were believed to be involved in this campaign.
Corporate Cooperation: The Shanghai municipal government has worked with many commercial companies, such as China Mobile, Bayer, and Tetra Pak, to promote environmental awareness through education and promotion events.
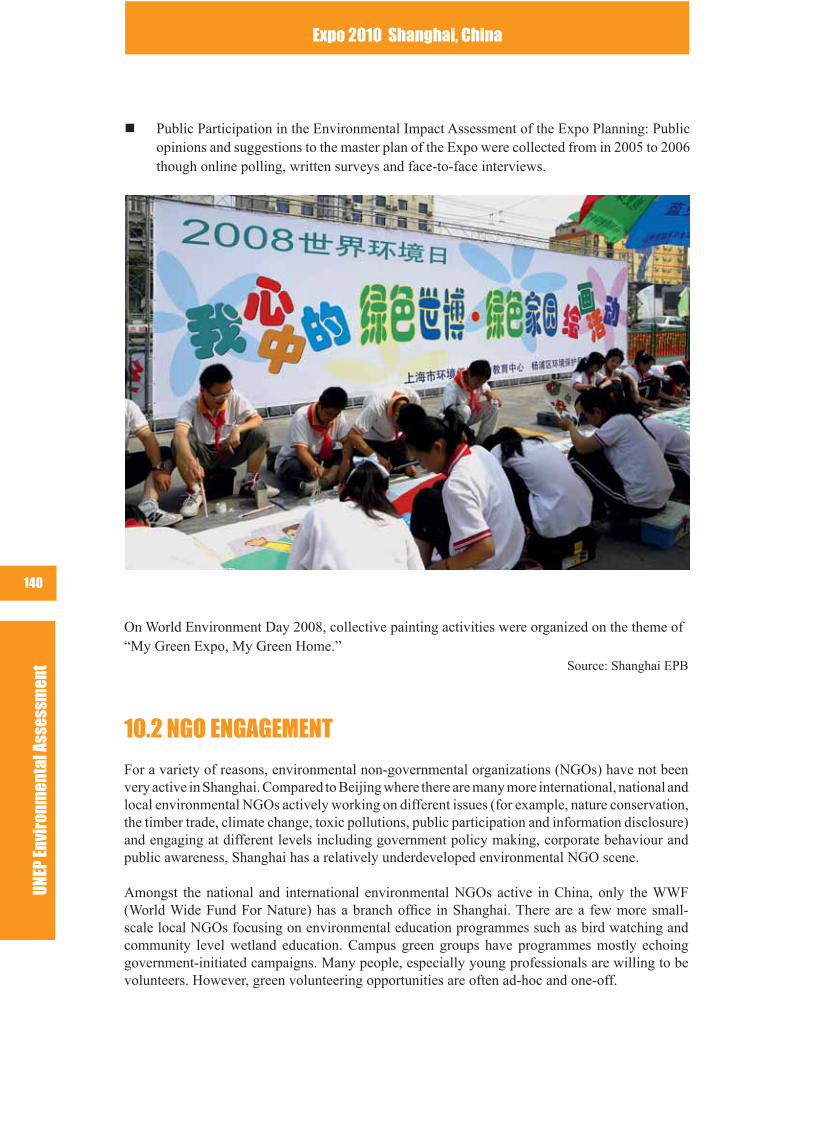
UNEP
Env
iron
men
tal A
sses
smen
tExpo 2010 Shanghai, China
140
Public Participation in the Environmental Impact Assessment of the Expo Planning: Public opinions and suggestions to the master plan of the Expo were collected from in 2005 to 2006 though online polling, written surveys and face-to-face interviews.
On World Environment Day 2008, collective painting activities were organized on the theme of “My Green Expo, My Green Home.”
Source: Shanghai EPB
10.2 NGO ENGAGEMENT
For a variety of reasons, environmental non-governmental organizations (NGOs) have not been very active in Shanghai. Compared to Beijing where there are many more international, national and local environmental NGOs actively working on different issues (for example, nature conservation, the timber trade, climate change, toxic pollutions, public participation and information disclosure) and engaging at different levels including government policy making, corporate behaviour and public awareness, Shanghai has a relatively underdeveloped environmental NGO scene.
Amongst the national and international environmental NGOs active in China, only the WWF (World Wide Fund For Nature) has a branch ofce in Shanghai. There are a few more small-scale local NGOs focusing on environmental education programmes such as bird watching and community level wetland education. Campus green groups have programmes mostly echoing government-initiated campaigns. Many people, especially young professionals are willing to be volunteers. However, green volunteering opportunities are often ad-hoc and one-off.
UNEP
Env
iron
men
tal A
sses
smen
t
Expo 2010 Shanghai, China
141
Increasingly, the Shanghai municipal government, especially the Environmental Protection Bureau, has been opening up to working with NGOs to promote public awareness. The recent successful partnership between WWF China and the Shanghai Municipality represented a signicant breakthrough in the NGO-government relationship.
On 28 March 2009, WWF called on cities of the world to participate in the Earth Hour campaign to promote awareness on climate change. Invited by WWF, Shanghai municipality ofcially endorsed the activity, switched off the exterior lighting of the municipal government bulding in the city centre during the said hour, and requested all municipality- and district-level government buildings to follow suit.
This successful NGO-government collaboration attained an encouraging result by getting 163 commercial buildings (including the three tallest skyscrapers in Shanghai), 15 universities, 32 schools, 71 neighbourhoods, and more then 100 corporations joining the campaign. The activity attracted widespread TV, radio and print media coverage and headlines. For the rst time an NGO initiated environmental campaign received this level of support in the city. The municipality saw its participation as a suitable response to the global concerns on climate change as well as a chance for an advocacy for a greener city echoing the theme of the Expo.
In 2009, the Shanghai Expo authority also responded positively to the green commuting proposal of the China Programme Ofce of the US-based NGO Environmental Defense Fund (EDF). EDF had worked successfully with the Beijing Olympics organizer on a joint project promoting green commuting in Beijing before and during the games.
On 5 May 2009, the programme kicked off with Shanghai ofcials and EDF staff planting trees in a city park. The trees were provided by the EDF-managed Green Commuting Fund, which was generated by the carbon offsetting of Beijing citizens choosing public transport and bicycling over private cars during the Olympics. A year-long series of activities will be organized by the Shanghai Expo Bureau, Shanghai Environmental Protection Bureau and EDF to jointly promote green commuting in the city for the Expo.
10.3 COMMENTS AND RECOMMENDATIONS
Citizens are the most important stakeholders of a city’s sustainability. The environmental footprints of citizens, depending on their lifestyles and level of awareness, are a decisive factor for the environment impacts of a city. Citizens are part of the problem as much as the solution. Activating citizens to be change agents for the environment is thus crucial to the success of making better cities for better lives.
The uniqueness of the Chinese political system provided channels for large-scale and top-down mobilization for the government-led environmental campaigns. The green schools and green neighbourhood campaigns were good examples of how the government can play a pivotal role in improving environmental facilities and the performance of grassroots units through benchmarking. Shanghai should keep raising the bar, expanding the programme and enhancing the resulting gains.
UNEP
Env
iron
men
tal A
sses
smen
tExpo 2010 Shanghai, China
142
The green ofce initiative of the Expo Bureau, the reduction in the use of ofcial sedans, the endorsement of the car-free day and the Earth Hour lights-off campaign were also wise tactics in leading by example for wider social impact. The Shanghai authority is encouraged to broaden the green ofce initiative to other government agencies and the commercial sector by enhancing the green guidelines.
While Shanghai should maintain its advantage in mobilizing media and other channels to communicate its programmes, it is recommended that wider and more participatory partnerships with student and youth groups, NGOs, and corporations be developed.
According to the government, many more activities were planned and would be carried out in the run up to the 2010 Expo. At this moment, it is too early to evaluate the effectiveness and impacts of these Expo-oriented activities. A more comprehensive assessment is recommended after the Expo to gauge the experiences and lesson learnt.
Comprehensive Communications Strategy While Shanghai has implemented a wide-range of activities to promote environmental awareness and adopted the Green Expo concept, it seems that a comprehensive communication strategy maximizing the links between the Expo and the environment has not yet been initiated.
Learning from the lesson of the 2008 Beijing Olympics which lacked a pro-active media strategy for its environmental initiatives (as pointed out in the UNEP assessment report after the games) Shanghai is advised to develop such a plan early on to effectively communicate its greening programmes for the global audience.
Given the challenge of meeting the information needs of a worldwide audience with limited resources, it is recommended that the Expo organizer enrich and update the environmental information contained in the ofcial website, including not only green measures in the Expo Park, but also the initiatives in recent years to retrot the city to a greener one.
A special feature website focusing on the Expo and the environment might be useful for visitors, would-be-visitors and concerned citizens. Practical information and guidelines on public transportation, waste avoidance, carbon reduction and offsetting during the Expo, as well as tips for eco-tourism in and around Shanghai could also be provided on-line.
It is also recommended that formal research to be conducted to measure public awareness and attitudes towards the various measures implemented for a green Expo. Comparing data before and after the event would provide useful insights on the gains and gaps of the greening efforts, which could be used to help design more targeted future actions both for and beyond Shanghai.
Activating NGOs Participation The lights-off activity initiated by WWF and the Green Commuting project proposed by EDF were very good examples of effective government-NGO partnership. Given the relative underdevelopment of environmental NGOs in Shanghai, it is recommended that more NGO initiatives be encouraged and supported.

UNEP
Env
iron
men
tal A
sses
smen
t
Expo 2010 Shanghai, China
143
Environmental NGOs in Shanghai, as well as some of the international and national NGOs based in Beijing, have been keen to support and contribute to the Expo. With the absence of an engagement strategy from the Government, their enthusiasm has not yet been harnessed. NGOs with specialized knowledge and expertise, social marketing skills and creativity, as well as volunteer organizing experience could be valuable partners for the organizer to enhance public participation. On the other hand, NGOs in Shanghai and elsewhere are encouraged to analyze the needs of the organizer and design creative and results-oriented projects accordingly. It is recommended that regular and bilateral communications with NGO representatives should be organized by the Expo organizer. A roundtable on identifying the needs and aspirations of both sides could be a concrete rst step to fostering stronger government-NGO cooperation. The Shanghai authority could also consider inviting NGO representatives to join the environmental advisory committee.
NGOs are an important vehicle of expression for public participation. The Expo itself could be a catalyst for nurturing the healthy development of environmental NGOs and citizen organizations which are instrumental in activating a more environmentally conscious citizenry.
Promoting Green Citizenship The Shanghai Expo provides an excellent opportunity to activate an environmentally responsible citizenry. A holistic programme on promoting a new green citizenship for Shanghai residents should be developed for the Expo, focusing not only on top-down communication and education, but also bottom-up participation. Government-led initiatives could be complimented with NGO- and citizen-initiated activities. More emphasis could be placed on the environmental rights and responsibilities of citizens in a city striving to be sustainable.
Guidelines for green citizens could be promoted through governmental and NGO activities. Shanghai residents should be encouraged and facilitated to take individual responsibility by acting to minimize their environmental footprint, such as reducing energy consumption, travelling by public transport, avoiding and recycling domestic waste, and saving water. Creative and participatory campaigns such as installing energy efcient light bulbs at home, green commuting and voluntary carbon offsetting, or “bringing-your-own-water” could be organized as part of this integrated programme. NGOs can play a constructive and vital role in fostering this green citizenship.
Environmental information disclosure measures the Shanghai authorities have been introducing in the last years are to be commended and should be further enhanced and expanded, in order to enable more effective public participation in environmental affairs.
An active, responsible, and participatory citizenry which takes care of its environmental footprint and contributes to the greening of the city would be an appropriate and sustained long-term legacy of the 2010 Expo.
UNEP
Env
iron
men
tal A
sses
smen
tExpo 2010 Shanghai, China
144
BIBLIOGRAPHY
Discharge Standard of Pollutants for Municipal Wastewater Treatment Plant (GB 18918-2002 2003-07-01) MEP
EDF et al. 2008 Beijing Report: Green Commuting. Environmental Defense Fund.Environmental Impact Assessment of the Master Planning of Expo 2010 Shanghai China.
Greenpeace International (April 2009), Racing Over the Edge: New science on the climate crisis, brieng paper.
Han Changlai (2004), Characteristics of water environment in water source place at the up stream of Huangpu River and Protection Strategy. China water & waste water, 20.
Hu Dongwen, Tang Qinghe, and Jiang Jiahua (2008). A Comparison Study on Two Schematic Modes for Municipal Solid Waste Disposal in Shanghai. Shanghai Environmental Science, 3:124-128.
Huang Renhua, Chen Shanpin (2007), Discussion of the Sustainable Development Plan on Laogang Landll Site, Suzhou Environmental Sanitation, 119.Hydrobiologia, 568: 245-253.
Liu, W. and Qiu, R. L (2007), Water Eutrophication in China and the Combating Strategies. Journal of Chemical Technology and Biotechnology, 82: 781-786. Qin, B.,
NRDC 2007 .The Mid-term Development Plan of Renewable Energy
Shanghai Daily News (2006), Salt Tide Hit The East China Sea.
Shanghai Development and Reform Commission (2006), Energy White Paper of Shanghai
Shanghai Environmental Protection Bureau, Mid-term Evaluation Report of the National Environmental Protection Eleventh Five-year Plan of Shanghai,
Shanghai Municipal Government (2007), the Application Program of Energy Saving and Pollution Reduction in Shanghai
UNEP
Env
iron
men
tal A
sses
smen
t
Expo 2010 Shanghai, China
145
Shanghai Municipal Government, Eleventh Five-year Planning and 2020 Vision of Wind Energy Development in Shanghai
Shanghai Municipal Government, Master Planning of Shanghai Municipality 1999 to 2020
Shanghai Municipal People’s Government (2007), Notice of Shanghai Municipal People’s Government on Printing and Distributing the “Implementation Plan of Shanghai Municipality for Energy-saving and Emission-reduction Work”. Shanghai: SMPG
Shanghai Statistical Bureau, Shanghai Statistical yearbook (2000-2008)
Shanghai Water Bureau. Shanghai Water (Environmental) Function Zoning. 2004, 12.
Shanghai Water Resources Report (2008).
Southern Weekly (2009), The Fighting for Environmental Protection in Gao’antun. 2009 (308).
Standard of soil quality assessment for exhibition sites (HJ 350-2007). 2007,8.
State Council (2007), White Paper on Energy. Beijing: State Council.
Tang, D., Di, B., Wei, G., Ni, I. H., Oh, I. and Wang, S (2006), Spatial, Seasonal and Species Variations of Harmful Algal Blooms in the South Yellow sea and East China Sea, Summary of the Development Plant on Solid Waste Treatment in Shanghai,
The Basal Action Network and Silicon Valley Toxics Coalition 2002, Exporting Harm: The High-tech Trashing of Asia.
The Chinese Renewable Energy Industries Association (CREIA), Greenpeace and Global Wind Energy Council (GWEC), Chinese People’s Political Consultative Conference Shanghai Nanhui District committee, China Wind Power Report 2007.
Xu, P., Wu, Q., Luo, L. and Zhang, Y (2007). Environmental Issues of Lake Taihu, China. Hydrobiologia, 581: 3.
YU Shaopeng, WANG Haixia, and WAN Zhongjuan eds (2004), Treatment Technology of Wastewater Using Constructed Wetland and Its Present Status and Future Prospects in China . Progress in Geography, 1.
UNEP
Env
iron
men
tal A
sses
smen
tExpo 2010 Shanghai, China
146
Internet SourcesAnalysis of Agricultural Chemical Pollution in Taihu Lake and Chemical Fertilizer in China. http://sh.eastday.com/eastday/node439/node3827/index.html
China Climate Change Info-net: http://www.ccchina.gov.cn/
China Environmental Law: http://www.chinaenvironmentallaw.com/2009/03/23/shanghais-car-cap/
Electronic waste treatment company http://www.tes-amm.com/
Electronic waste. http://www.greenpeace.org/china/en/campaigns/toxics/e-waste
Hangzhou Metro Online: http://www.hzmetro.com/Login.aspxhttp://www.shanghaiwater.gov.cn/web/bmxx/default.jsp?num=td_tab18http://www.shanghaiwater.gov.cn/web/homepage/index.html
Nanjing Metro Online: http://www.nj-dt.com/
Ofcial Website of Shanghai Municipal Government: http://www.shanghai.gov.cn/
Reason Analysis of Agricultural Chemical Pollution and Algal Bloom. Green Peace, 2008.http://www.greenpeace.org/china/zh/press/reports/algae-blue-report
Shanghai Environment Energy Exchange: http://www.cneex.com/eng_index.html
Shanghai Environmental Online: http://www.envir.gov.cn/info/2006/2006913239.htm
Shanghai Expo Ofcial Website: http://www.expo2010.cn/
Shanghai Metro Online: http://www.shmetro.com/
Shanghai Public Transport Online: http://www.shanghaibus.net/
UNEP
Env
iron
men
tal A
sses
smen
t
Expo 2010 Shanghai, China
147
Shanghai Water Resources Protection Foundation. http://www.swrf.org.cn/main.asp
Shanghai: Overall Decline in Water Environmental Quality of This Year.2006, 6. http://www.sh.xinhuanet.com
Strengthen the Environmental Management of Laogang Garbage Disposal Site: http://zx.nanhui.gov.cn/nhzx//showinfo/showinfo.aspx?infoid=26988e92-f1e2-4d46-9316-89210cbfc412&siteid=1&categoryNum=2102
Suzhou Metro Online: http://www.szgdjt.com/
Website of Center for Eco-economy and Sustainable Development: http://www.cesd-sass.org/environment/ShowArticle.asp?ArticleID=2078
Website of Changjiang Water Resources. http://www.cjw.gov.cn/
Website of Environmental Technology: http://www.cnjlc.com/
Website of Ministry of Housing and Urban-Rural Development of the People’s Republic of China: http://www.cin.gov.cn/ztbd/2008car/
Website of Shanghai Urban Construction & Communications: http://www.shucm.sh.cn/gb/shucm/index.html
Website of SNEC 4th International Photovoltaic Power Generation Conference & Exhibition: http://www.snec.org.cn/Read.asp?ID=1279
Wuxi Metro Online: http://www.wxmetro.net/index.asp#2

UNEP promotes
environmentally sound practices
globally and in its own activities.
This publication is printed using 60% sugarcane fibre.
Recycled content is 15% pre-consumer waste
with 25% FSC certified mixed source fibre,
the inks are vegetable based. Our distribution policy
aims to reduce UNEP's carbon footprint.


![Canadian Guide to Shanghai [Expo Edition] 2.0](https://img.pdfslide.us/doc/110x75/568bf0521a28ab89338f3fba/canadian-guide-to-shanghai-expo-edition-20.jpg)


![DHL Expo Shanghai Brochure[1]](https://img.pdfslide.us/doc/110x75/551fcb474a795979108b4ef5/dhl-expo-shanghai-brochure1.jpg)