Embed Size (px)
Citation preview

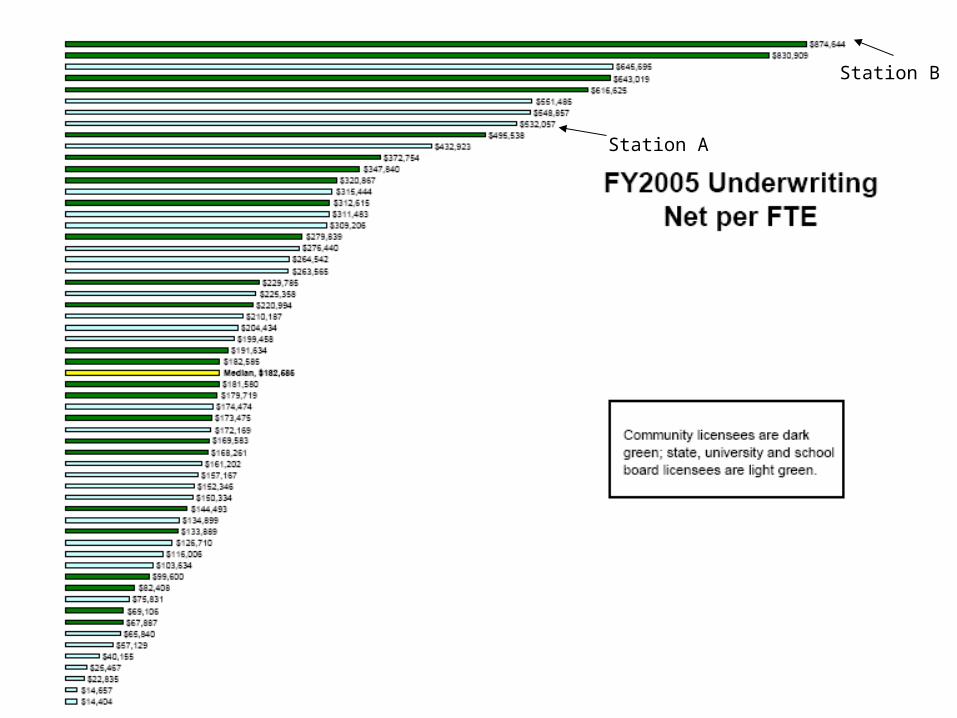
Underwriting Performance Indicators
Presented by: Jim TaszarekKirk Nelson

What We will Cover
• Break down net underwriting revenue per listener hour (NURPLH)
• Give you a tool for annual planning
• Key performance indicators to manage during the year

Hedgehog Concept
• What can we be best in the world at
• What you are deeply passionate about
• What drives your economic engine

How to Use NURPLH
• Compare to industry– Highest– Median
• Compare to self
Note: highly rated stations
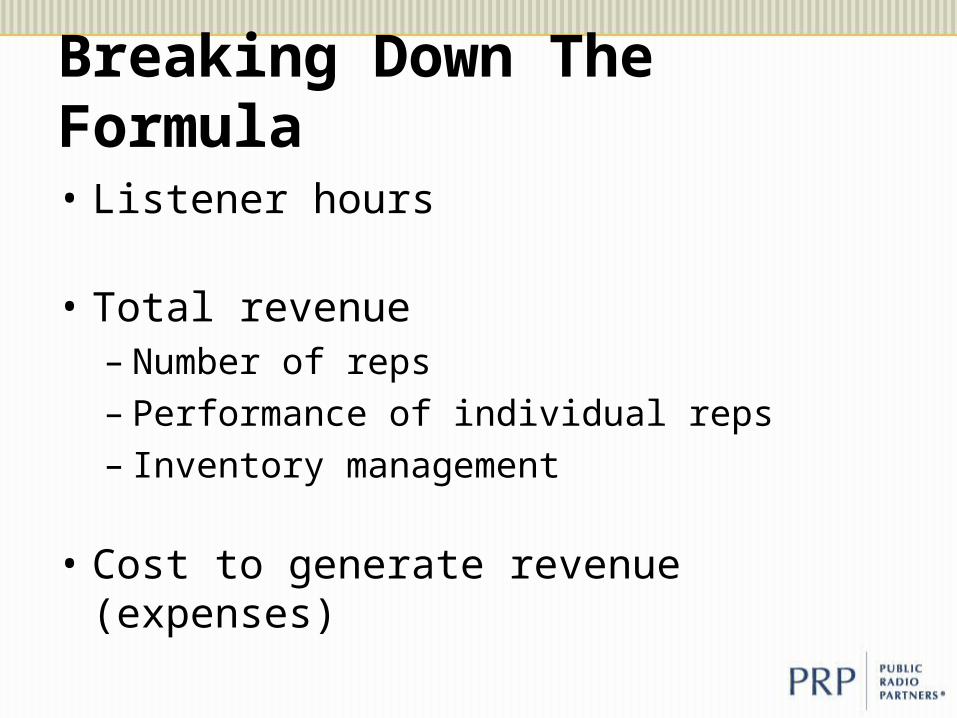
Breaking Down The Formula• Listener hours
• Total revenue– Number of reps– Performance of individual reps– Inventory management
• Cost to generate revenue (expenses)

Planning Spreadsheet
• Calculate prior year NURPLH
• Compare to industry benchmarks– Median– High
• Run scenarios for upcoming year– Hold listener hours constant

What Drives Underwriting• Ratings – not within our control
• People
• Inventory
Create performance systems aroundthese levers and monitor performance

Monitor What Drives Performance

People Systems
• Staff assessment• Ongoing recruitment process• Selection process - hire right people• Set goals and monitor performance

Staff Assessment ProcessStaff Assessment (annually, quarterly)• Right people to achieve next year’s goal• Evaluate each person’s situation• Have hard conversations about non-
performers• If you have high turnover find out why• Talk through options if someone leaves• Include “bench strength”• Brutally honest so no surprises

People
• Annual growth benchmarks:– Year 1: Average of new hires– Year 2: 50 – 100% – Year 3: 20 – 30%– Year 4: 15 – 20%
• Monthly performance evaluation against:– Goal, LY

Historical Billing
• Annually– Billing not collections– Planning Tool– Growth trends/Projections– Seasonal factors
• Monthly– Compare pacing to historical growth
trends

3-Month Billing Projections• Monthly
– Pacing benchmarks:– 6 weeks prior to start of month: 70 –
75%– 2 weeks prior to start of month: 85 –
89%– Start of month: 90 – 95%– 2 weeks into month – 99 – 101%

?? Questions ??
Presented by: Jim TaszarekKirk Nelson

Station A
Station B
Station A
Station B

Station B
Station A