Embed Size (px)
Citation preview
TWI/Thesis/CEng/Hammerhead wet-spot welding/10.2007 Re-issued for publication 6.2017
0
Underwater Wet Welding Made Simple
Benefits of Hammerhead wet-spot welding process
By
David. J. Keats Dip.Eng.,L.Eng.,MInstNDT, EngTechWeldI
Int’l Welding Technologist & Senior Welding Inspector
Former Managing Director
of
This report was submitted in partial fulfilment of the requirements for professional membership of The Welding Institute (TWI) and CEng registration via the individual route.
TWI/Thesis/CEng/Hammerhead wet-spot welding/10.2007 Re-issued for publication 6.2017
1
Index 1-3
Abstract 4
1. Introduction 5
2. Literature Review 6
3. Experimentation and Results 11
3.1. Design of Apparatus 11
3.2. Control Functions 11
3.3. Weld Samples 13
3.4. Equipment, Facilities and Environment 14
3.5. Electrodes 15
3.6. Welders and Operators 16
3.7. Welding Procedures 16
3.8. Spot Welds 17
4. Results 19
4.1. Visual Appearance 19
4.2. Transverse Tension Shear Tests 20
4.3. Hardness Surveys 21
4.4. Macro/Microscopic Survey 22
5. Discussion 23
6. Conclusions & further work 25
7. Tables 30-31
8. Figures 32-61
9. References 62-63
10. Acknowledgments 64
Appendix 1A & 1B 65-66
Appendix 2 - Corus Report 67
TWI/Thesis/CEng/Hammerhead wet-spot welding/10.2007 Re-issued for publication 6.2017
2
7: List of Tables
Table 1 Composition of steel plates.
Table 2 Carbon equivalent value of steel.
Table 3 Composition of Hammerhead electrodes.
Table 4 & 5 Tensile test results for wet and dry spot welds.
Table 6 & 7 Hardness surveys for wet and dry spot welds.
8: List of Figures
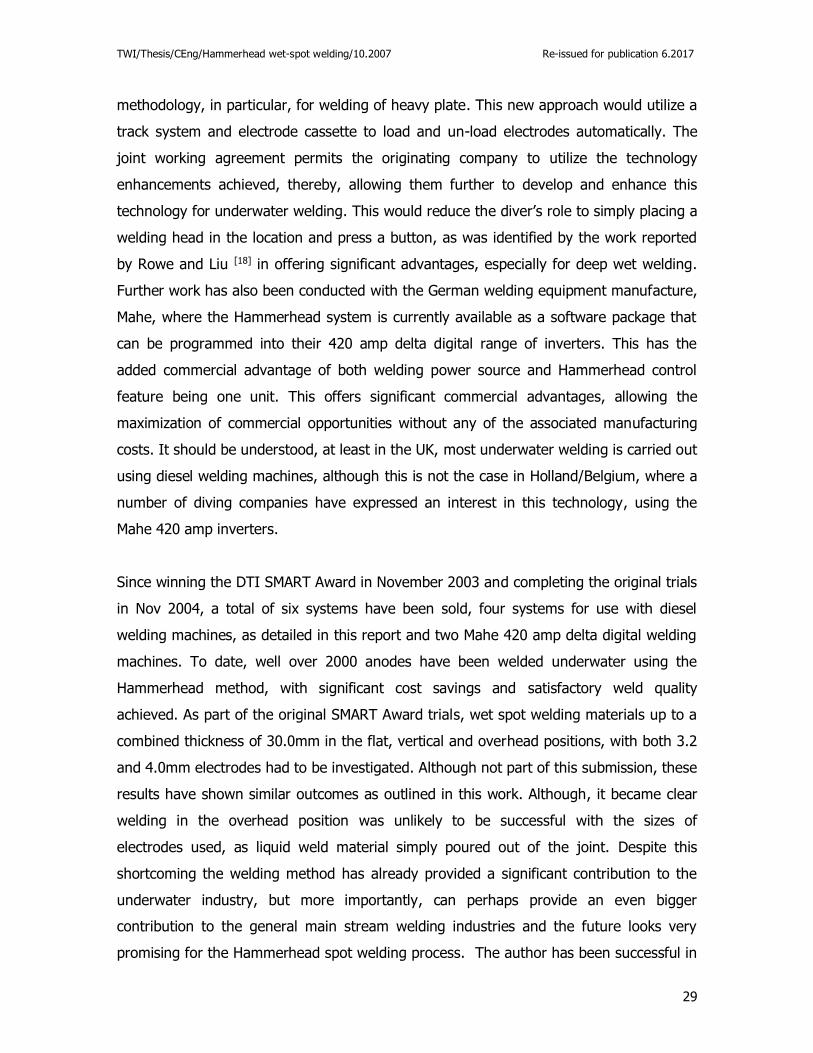
Fig 1 Control device with the remote and 110v power leads connected.
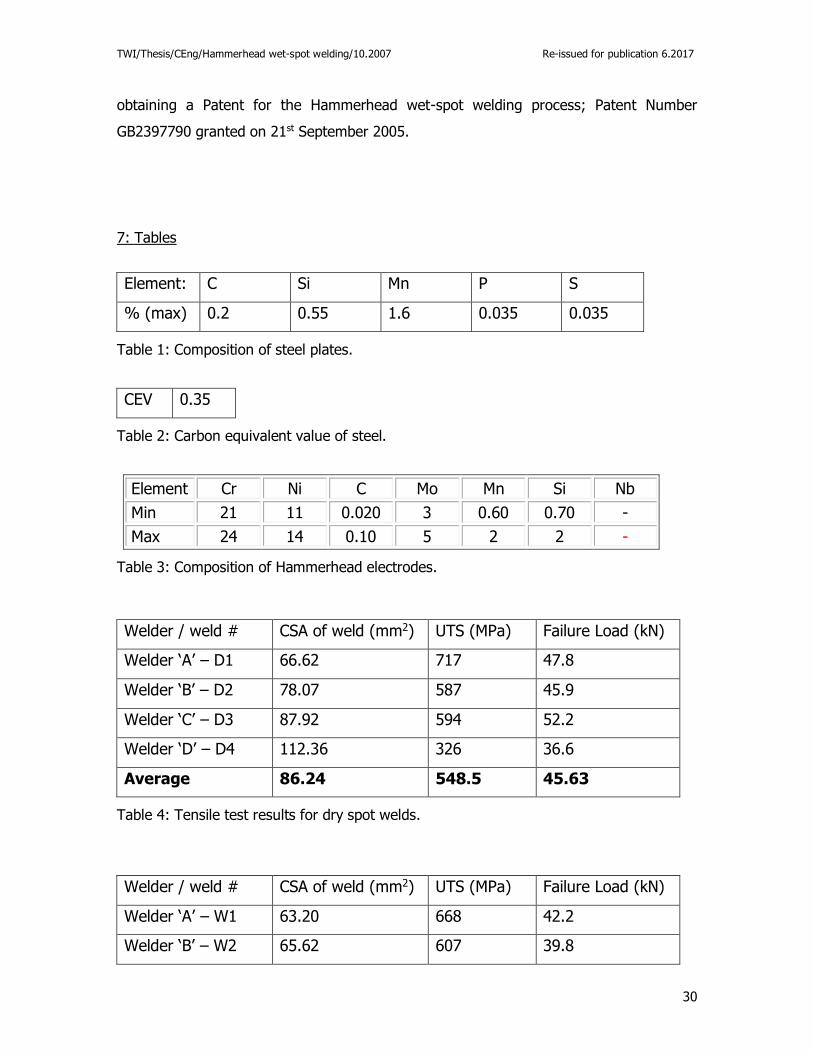
Fig 2 Control panel, with isolation switch, amp/volt meters and the Hammerhead device.
Fig 3 Detailed sketch of the Hammerhead control device.
Fig 4 Operator ready to strike the arc.
Fig 5 Typical lap joint/plate set-up for all spot welds.
Fig 6 Diver entering the test tank.
Fig 7 Dilution line plotted on Shaeffler diagram.
Fig 8 & 9 Graphs of wet and dry spot weld results.
Fig 10 Completed dry spot weld and heat blister (D1) for welder ‘A’.
Fig 11 Completed wet spot weld and heat blister (W1) for welder ‘A’.
Fig 12 Completed dry spot weld and heat blister (D2) for welder ‘B’.
Fig 13 Completed wet spot weld and heat blister (W2) for welder ‘B’.
Fig 14 Completed dry spot weld and heat blister (D3) for welder ‘C’.
Fig 15 Completed wet spot weld and heat blister (W3) or welder ‘C’.
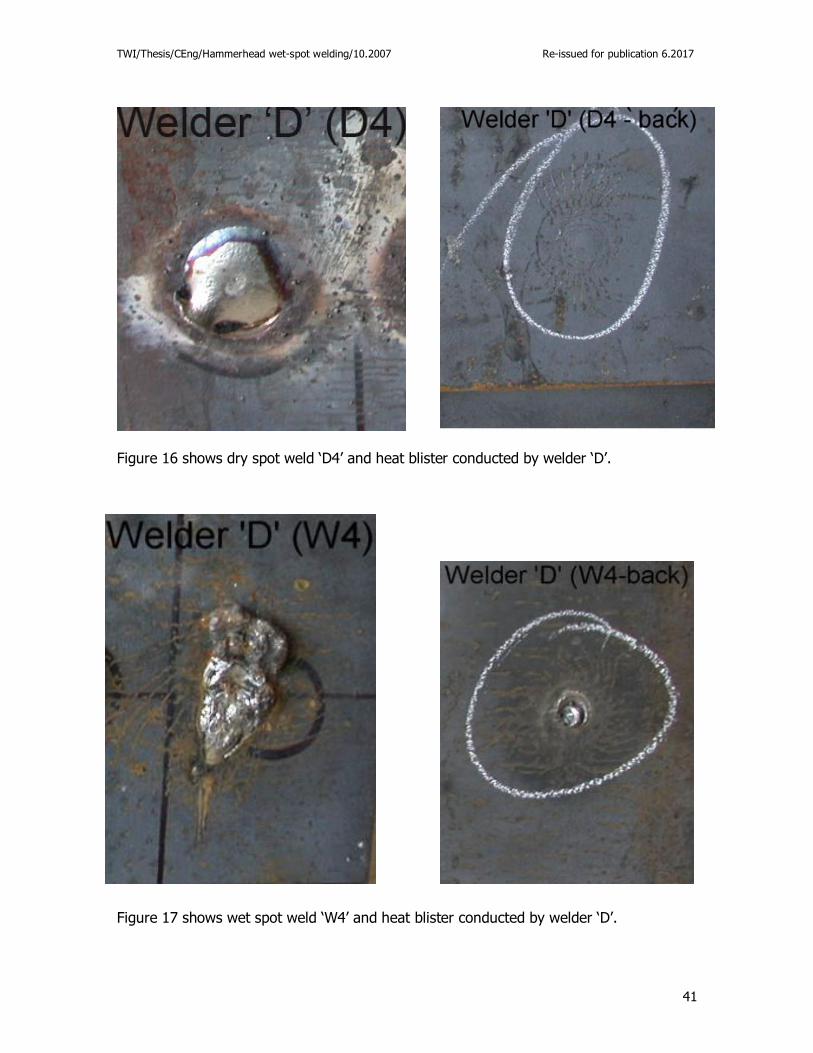
Fig 16 Completed dry spot weld and heat blister (D4) for welder ‘D’.
Fig 17 Completed wet spot weld and heat blister (W4) for welder ‘D’.
Fig 18 Macrophotograph for welds D1 and W1 for welder ‘A’.
Fig 19 Macrophotograph for welds D2 and W2 for welder ‘B’.
Fig 20 Macrophotograph for welds D3 and W3 for welder ‘C’.
Fig 21 Macrophotograph for welds D4 and W4 for welder ‘D’.
Fig 22 Hardness survey for dry weld (D2) conducted by welder ‘B’.
Fig 23 Hardness survey for wet weld (W3) conducted by welder ‘C’.
Fig 24 Quantitative map plotted for Cr in weld D2.
Fig 25 Quantitative map plotted for Ni in weld D2.
TWI/Thesis/CEng/Hammerhead wet-spot welding/10.2007 Re-issued for publication 6.2017
3
Fig 26 Quantitative map plotted for Mo in weld D2.
Fig 27a Macrophotograph of weld ‘D2’ (dry weld), conducted by welder ‘B’
Fig 27b Microphotograph of parent material
Fig 27c-d Microphotographs of area ‘A’
Fig 27e-f Microphotographs of area ‘B’
Fig 27g-h Microphotographs of area ‘C’
Fig 27i-j Microphotographs of area ‘D’
Fig 27k-l Microphotographs of area ‘E’
Fig 27m-n Microphotographs of area ‘F’
Fig 27o-p Microphotographs of area ‘G’
Fig 28a Macrophotograph of weld ‘W3’ (wet weld), conducted by welder ‘C’
Fig 28b Microphotograph of parent material
Fig 28c-d Microphotographs of area ‘A’
Fig 28e-f Microphotographs of area ‘B’
Fig 28g-h Microphotographs of area ‘C’
Fig 28i-j Microphotographs of area ‘D’
Fig 28k-l Microphotographs of area ‘E’
TWI/Thesis/CEng/Hammerhead wet-spot welding/10.2007 Re-issued for publication 6.2017
4
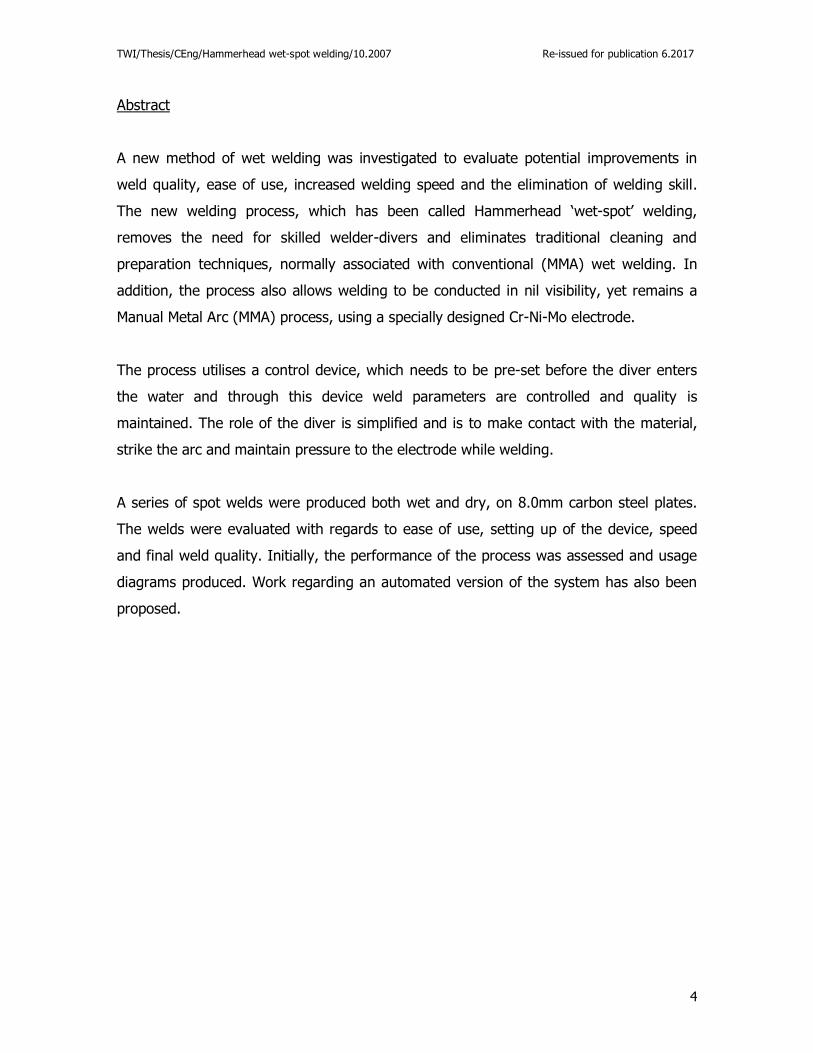
Abstract
A new method of wet welding was investigated to evaluate potential improvements in
weld quality, ease of use, increased welding speed and the elimination of welding skill.
The new welding process, which has been called Hammerhead ‘wet-spot’ welding,
removes the need for skilled welder-divers and eliminates traditional cleaning and
preparation techniques, normally associated with conventional (MMA) wet welding. In
addition, the process also allows welding to be conducted in nil visibility, yet remains a
Manual Metal Arc (MMA) process, using a specially designed Cr-Ni-Mo electrode.
The process utilises a control device, which needs to be pre-set before the diver enters
the water and through this device weld parameters are controlled and quality is
maintained. The role of the diver is simplified and is to make contact with the material,
strike the arc and maintain pressure to the electrode while welding.
A series of spot welds were produced both wet and dry, on 8.0mm carbon steel plates.
The welds were evaluated with regards to ease of use, setting up of the device, speed
and final weld quality. Initially, the performance of the process was assessed and usage
diagrams produced. Work regarding an automated version of the system has also been
proposed.
TWI/Thesis/CEng/Hammerhead wet-spot welding/10.2007 Re-issued for publication 6.2017
5
1: Introduction
Underwater wet welding has been employed for many years now, but has commercially
been restricted to conventional Manual Metal Arc Welding (MMA) techniques. [1-5] The
typical problems associated with MMA welding underwater fall into two categories; those
associated with mechanical/metallurgical quality and those associated with skill and
ability. It is with both these issues in mind, a new methodology of MMA welding was
devised.
Underwater wet welding, although accepted as a low cost, practical alternative to dry or
hyperbaric welding, can suffer from quality issues, mainly due to the rapid cooling. [1,4,7-12]
It is also well appreciated that the skills and abilities necessary to execute high quality,
conventional MMA wet welds are extremely high, therefore labour and training costs are
significant factors.[1-5,10,16] This new welding methodology, which has been developed by
the reporter, provides a solution to both of these issues. The process is called
Hammerhead wet-spot welding.
The process provides an alternative approach to welding, one in which the role of the
operator is minimised and therefore, no longer required to use hand-eye co-ordination
skills. Rather, this is a method in which two materials are joined together by a spot or
plug weld by means of a programmable control device. In this way, the operator simply
becomes a means of making contact with the material and providing momentum to
‘push’ the electrode into the material once the arc is struck. The Process also eliminates
the need for traditional cleaning, joint preparations, and chipping/cleaning of weld slag.
The process utilises one electrode to produce each weld and this weld being localized
within the through thickness dimensions of the material. The author has shown that the
final mechanical weld qualities have been significantly improved, as has the overall speed
of joining when compared to any conventional wet fillet MMA welding techniques. Unlike
conventional MMA welding, the process provides a method of controlling the welding
current necessary to produce a weld, without requiring the operator to have any welding
skills or knowledge, because the current is automatically regulated and controlled by the
device on each weld cycle. Thus, the roll of the diver is reduced to that simply of an
operator.
TWI/Thesis/CEng/Hammerhead wet-spot welding/10.2007 Re-issued for publication 6.2017
6
2: Literature Review
According to Keats [1] the skills necessary to produce welds underwater are considerable,
with training of diver-welders taking a considerable time to perfect. It is also understood
that in poor visibility conditions, many of these hard learnt skills can be wasted when
hand eye co-ordination cannot occur for the production of quality MMA fillet welds. [1]
However, the actual deposition skills necessary to deposit a good weld is not the end of
the problem. Equally important must be the joint preparation, gap tolerance and overall
cleanliness of the joint to be welded. Given the typical conditions which exist in harbours
and ports around the UK, it is not surprising that the quality of wet welding falls below
that of above water welding. [1] Wet welding can have defects such as solidification and
hydrogen cracking, porosity, slag inclusions and lack of fusion (side wall and inter-run)
defects being quite common. [1]
Safety issues concerning underwater wet welding were also considered during the
development of this process and reference was made to the Association of Offshore
Diving Contractors (now IMCA) code of practice 035 – Safe Use of Electricity Underwater.
[2] This code recommends that all underwater wet welding be conducted using DC
negative polarity (-Ve) power sources only. In this way, the diver holds the cathode
whilst the earth/return becomes the anode. This current flow direction minimises the
affects of electrolysis to the diver. [2] These affects exist due to the flow of electrons/ions
between the anode and cathode and could result in discomfort or even electric shock for
the diver, should a leakage field exist that encapsulates the diver’s body. It is agreed by
industry that the maximum safe body DC current, should not exceed 40mA and this lead
was adhered to in the development of this system. [1-2]
The first examples of commercial underwater welding were to salvage vessels after the
First World War, although it was not until 1983 that the first welding specification was
published, by The American Welding Society (AWS D3.6). [3] Although, Sir Humphrey
Davey first demonstrated an arc could be maintained underwater in 1802, it was not until
the early 1930’s that any notable experiments took place. One such experiment
conducted at Lehigh University in America, quickly established that a DC current was
required to strike and maintain an arc underwater. [4] All of these early experiments
TWI/Thesis/CEng/Hammerhead wet-spot welding/10.2007 Re-issued for publication 6.2017
7
were conducted in a small glass tank, with the operator standing in air, with only his
hands submerged.
The American Welding Society describes the wet-welding process as one in which the
diver and the welding arc are exposed to water, with no physical barrier between them.
This particular standard was prepared in response to the needs for a specification that
would allow users conveniently to specify and produce welds to a predictable
performance level. However, this specification covers only MMA welding using
conventional welding techniques. A more recent welding specification is BSEN ISO
15618-1, first published in 2002 and also covers underwater wet welding. [5] Once more,
this is restricted to conventional wet welding methodology for fillet and butt welds and
covers procedures and qualification testing requirements. Neither of these specifications
has been able to provide clarification to the possible quality or suitability for a wet-spot
welding methodology. In addition, neither AWS nor BSEN ISO specifications take water
type into consideration, both stating this to be a ‘non-essential’ variable. However, Kralj
et al [6] demonstrated the influence of water type on wet welding parameters showing
that they do have a significant influence. In particular, seawater contains up to 40ppt of
primarily sodium and magnesium chloride and thus has a higher electrical conductivity
than freshwater. Current discharge (dissipation) will therefore occur at various leakage
points, (the arc, electrode/holder connection, earth clamp, etc) with the result being that
welding in freshwater may require an increase in current by a much as 15%. Due to arc
constriction in wet welding the current density can reach a value of 11,200-14,280 amps
per square meter (A/m2), which is some 5-10 times higher than in air. In spite of these
specific conditions the physical processes taking place in the arc, according to
Yushchenko et al, are in a high degree similar to ones in air and data has shown arc
voltage increases on average by 1.5 – 2.0 volts with every 10M water depth. [7]
According to Kralj, Gooch and Masubuchi the gas bubble produced while welding is
composed of ~62-92% hydrogen, ~11-24% carbon monoxide, ~4-6% carbon dioxide,
oxygen, nitrogen and traces of gaseous metals. [6,10-11] It was also reported that hydrogen
content reduces by some 5-15% with an increase in water salinity. Other considerations
which must be included for wet welds include cooling rates, (which are increased to an
average of 2-3 times higher than in air and are in the order of 200-300oC/s). Problems
TWI/Thesis/CEng/Hammerhead wet-spot welding/10.2007 Re-issued for publication 6.2017
8
resulting from incomplete insulation of the welding circuit can also include reduced weld
penetration and an increased occurrence of defects. Disassociation of water in the arc
atmosphere elevates the risk of hydrogen cracking when using ferritic electrodes,
particularly ones having a basic or cellulosic coating. [6,7,11]
Bailey [8] demonstrated nickel-based electrodes having a rutile or oxidizing coating
offered the best results in wet welding. Nevertheless, minor cracking (~0.5mm) was
observed at the fusion boundary when welding carbon steel (of grade 50D to BS4360).
Nickel based electrodes were also susceptible to solidification cracking, where dilution
was high, especially in the root runs. Hydrogen cracking was best avoided by using
austenitic stainless steel electrodes, provided dilution was minimised (Sadowski and
Gooch).[9-10] Nevertheless, it was observed that bead placement was absolutely critical to
prevent martensite formation and cold cracking, in both the weld-metal and fusion
boundary for both ferritic and stainless electrodes. The tensile data for fillet weld lap
joints resulted, although they failed through the weld throat at relatively low stresses,
with slag inclusions and lack of fusion being visible on the fracture face, with some
solidification cracking evident also. From these works shear strength values averaged at
214N/mm2, for austenitic electrodes. In respect to hydrogen cracking and parent material
composition, hardenability, expressed in carbon equivalent terms, was considered crucial.
It was shown, however, that CEV levels appropriate to structural steels were less
important in underwater welding than in air. The average hardness values recorded wet
were 258 HV2.5 for filling weld passes and 390 HV2.5 for the diluted HAZ, with severe
hydrogen cracking observed in some high dilution austenitic welds. [10-11] Increasing
water depth also increases hydrostatic pressure, which increases the gas solubility and
thus, underwater wet welds may be expected to contain more hydrogen and oxygen with
increasing water depth of welding and generally result in harder, more brittle, less ductile
welds. [1,6,8-12]
The Hammerhead wet spot welding process utilises a Cr-Ni-Mo electrode, which has
increased tolerances for hydrogen and carbon over ferritic electrodes, when welding
ferritic steels. [8-10] Underwater wet welds not only pick up large quantities of hydrogen
produced by the decomposition of water, but also, the rapid quenching of the weld
ensures higher hardness levels, in comparison to surface welding, for the same material
TWI/Thesis/CEng/Hammerhead wet-spot welding/10.2007 Re-issued for publication 6.2017
9
type. The use of this type of austenitic electrode provides for very high solubility of
hydrogen, due to the lower mobility of hydrogen and the FCC lattice, whose larger
interstitial spaces, accommodate large amounts of hydrogen and carbon. An austenitic
structure can hold up to 2% carbon in solution (1150oC), due to large interstitial space in
the closely packed atomic structure. This electrode should also provide for increased
toughness and yet isn’t embrittled at low temperatures, when compared to ferritic BCC
structures. [1,8-12]
Abson and Cooper [12] showed that attempts to produce conventional wet fillet welds
using austenitic stainless steel electrodes produced such extensive cracking that the
welds were unable to be used for any useful mechanical testing. The handleability of this
austenitic electrode was also recorded by the divers to be difficult and weld appearance
was poor. It was further found that the acceptable optimum current setting was +/-5
amps, with the susceptibility to solidification cracking closely linked to travel speed. Even
welds produced with a number of ferritic electrodes showed fine-scale cracking in the as-
deposited and re-heated regions, and the HAZ; these all being identified as hydrogen
cracks. For butt welds deposited using austenitic electrodes the microstructure differed
from one bead to another, reflecting differences in dilution. For the passes in early
contact with the parent (ferritic) steel, the microstructure was commonly non-uniform
with up to 100% martensite. Present however, elsewhere in the early beads, visual
estimates of the proportions of the various microstructural constituents were ~80%
martensite, ~5-10% ferrite and ~10-15% austenite. These structures not only reflected
high dilution for the early passes but welding conditions, including rapid solidification,
allowed incomplete mixing to occur. In the second layer, the proportion of ferrite
increased to ~10-25% and 60% in the capping runs. The proportion of martensite
changed abruptly in bands within the first bead on each side. The microstructure in the
bands composed either an estimated 5% ferrite and 95% martensite or ~10-15% ferrite
with the remainder austenite. The microstructure for later passes was generally more
uniform, with proportion of martensite being ~80% in the second pass, falling to ~50-
60% in the last pass. The weld metal hardness ranged from 246 HV10 in the weld cap, to
238 HV10 in the center, to 370 HV10 in the root.
West et al [13] also identified that austenitic electrodes produced both root pass and hot-
TWI/Thesis/CEng/Hammerhead wet-spot welding/10.2007 Re-issued for publication 6.2017
10
pass cracks, and hard martensitic deposits with hydrogen cracking, or fully austenitic
deposits with solidification cracks.
Van der Brink and Boltje [14] demonstrated increasing moisture content of the flux
increased the occurrence of hydrogen cracking just as it does in surface welding.
Szelagowski [15] demonstrated that the type of waterproof coating used to seal the
electrode could have a significant affect on the chemical composition of the weld deposit
and the coating was more prone to moisture pick-up the deeper the welding depth. The
Hammerhead electrode was protected from moisture pick-up while underwater by
coating the electrode in a specially formulated vinyl lacquer. Nevertheless, according to
Grubbs [16] successful welds have been produced in accordance with AWS D3.6 class ‘B’
welds, using ferritic electrodes, down to depths of 60M.
Corus [17] demonstrated that the Hammerhead process was a valid MMA welding
methodology for welding above water also. The welding method was evaluated by them
to produce satisfactory welds in a range of material thickness, from 1.6-15.0mm, using
2.0 - 3.25mm diameter electrodes. Electrodes used by them were not limited solely to
Hammerhead, but a number of similar grades of electrodes from other manufactures
were also used. Their results showed the device to be user friendly, portable and capable
of producing welds in air with good fusion and visual appeal, without cracking and
without requiring any particular welding skills. Peel tests were performed on the thinner
sheet steel sections, the results showed high mechanical integrity with weld nuggets
being pulled out from the parent metal and significant plastic deformation occurred. That
study suggested that a useful enhancement would be to make the process ‘closed’ arc.
This would involve using a safety feature to prevent operation without the covering
shroud being in place. Further work was also recommended to make the system a fully
automatic welding process. This approach is currently being pursued by joint work
between the author and Corus.
According to Rowe and Liu [18] the development of alternative wet welding processes,
suitable for use with automated equipment, is necessary if underwater wet welding is to
be used in more hostile environments at greater and greater depths.
TWI/Thesis/CEng/Hammerhead wet-spot welding/10.2007 Re-issued for publication 6.2017
11
3: Experimentation and Results:
3.1. Design of Apparatus
The Hammerhead MMA wet-spot welding method utilises an electronic control device
which provides the facility to control a number of key welding functions, in order to
produce a spot weld underwater.
The functions and features are listed below.
Main on/off switch
1st Peak (high) current control
2nd Background (low) current control
Timer (up to 20 seconds)
High, low and auto current selector
Amp and volt meter
400 amp duel pole isolation switch
110v power supply and remote control function cables.
3.2 Control Functions
The control device, which is housed within a utility case, consists of an on/off switch to
power the unit, high/low/auto current control potentiometers, a timer and amp and volt
meters. (see figures 1-2) To ensure a suitable safe current is available the device is fitted
with a transformer to transform 110 volt supply down to a more suitable, safe 9 volts,
which is then rectified to DC. A reed switch is fitted to trigger a relay, which starts a
timer when the arc is first struck. Two current control potentiometers (pots),
independently control high and low current settings. Once these have been set the
device can be switched into ‘auto’ mode. These potentiometers are adjusted to deliver
the appropriate current, in order to penetrate and fill the materials and thus, produce the
spot weld. Once the timer has been triggered, (following arc initiation), the high current
potentiometer delivers the preset current for the set time period. Expiration of this
control then triggers the low current potentiometer to act, thereby, initiating the required
TWI/Thesis/CEng/Hammerhead wet-spot welding/10.2007 Re-issued for publication 6.2017
12
low level current automatically. This low current function continues until the arc is
broken, after which the device automatically resets ready to make the next spot weld,
although a five second delay prevents the system resetting, should the diver accidentally
break the arc. LED’s light up against each function so the operator can monitor the
process at any given moment. All welding parameters are set prior to the diver entering
the water and involve the device being connected to the welding machine, via remote
control and 110 volt power supply cables. Once connected, complete manipulation of the
welding machine is provided and current is controlled from the device. Amp and volt
meters are fitted to provide a visual display of the welding current/voltage, as is a 400
amp safety switch to isolate the current to the diver (as required under HSE regulations).
This control system is fitted into a utility case, for ease of transportation, together with
the remote control and 110v leads. The actual Hammerhead control features can be seen
in more detail in Figure 3. The set-up of the welding process is quite straightforward.
Prior to entering the water the diver selects a suitable ‘high’ current (selected by eye) to
allow for adequate penetration of the two materials to be joined, on the surface. This
high current time is recorded in seconds and penetration is again measured by eye. This
is ascertained by examining the back of the material for a heat mark, or blister. Providing
this is visible on the outside surface of the back-face, penetration is adequate and the
timer control and high current function are programmed in and set. The operator now
programmes the ‘low’ current control. The low current function does not require the use
of the timer and is set simply to provide a suitable current to consume the electrode and
complete the weld. After this operation, the device is set into automatic mode. At this
point the device is now fully programmed to produce welds automatically. The diver may
now enter the water and request for any small adjustments as might be necessary, for
the given water type and working depth. After which, the device may be relied upon to
give consistent and reproducible welding parameters, as programmed, for each and
every weld. Figure 4 shows the operator ready to commence welding. The device may
also be set to ‘manual’ mode. In this way, the diver can request either ‘high’ or ‘low’ only
current values to be selected, thus, allowing suitable parameters to invoke a repair weld.
Underwater it is essential that the operator does not over penetrate the base materials.
Should this occur, weld properties would be compromised by the affects of water back-
TWI/Thesis/CEng/Hammerhead wet-spot welding/10.2007 Re-issued for publication 6.2017
13
pressure, extinguishing the arc and causing slag entrapment, lack of fusion and/or
cracks. As the only opportunity for burst-through is while the ‘high’ current cycle is in
operation, the timer controls this critical high current time. Excessive penetration is a
combined function of both high current and arc time. By accurately controlling both
functions, penetration control is accurately achieved. It is not possible for the diver to
burst through the material while the ‘low’ current cycle is functioning, as the current is
too low. This device thus reduces the role of the diver to that of simply ‘pushing’ the
electrode into the materials and to ensuring that contact is maintained. In operation, this
requires no more than 5-10kgf and provided the operator consistently maintains this
force, nil visibility conditions will in no way affect the outcome or the quality of the weld
produced. The applied force was estimated, based on experimentation and became a
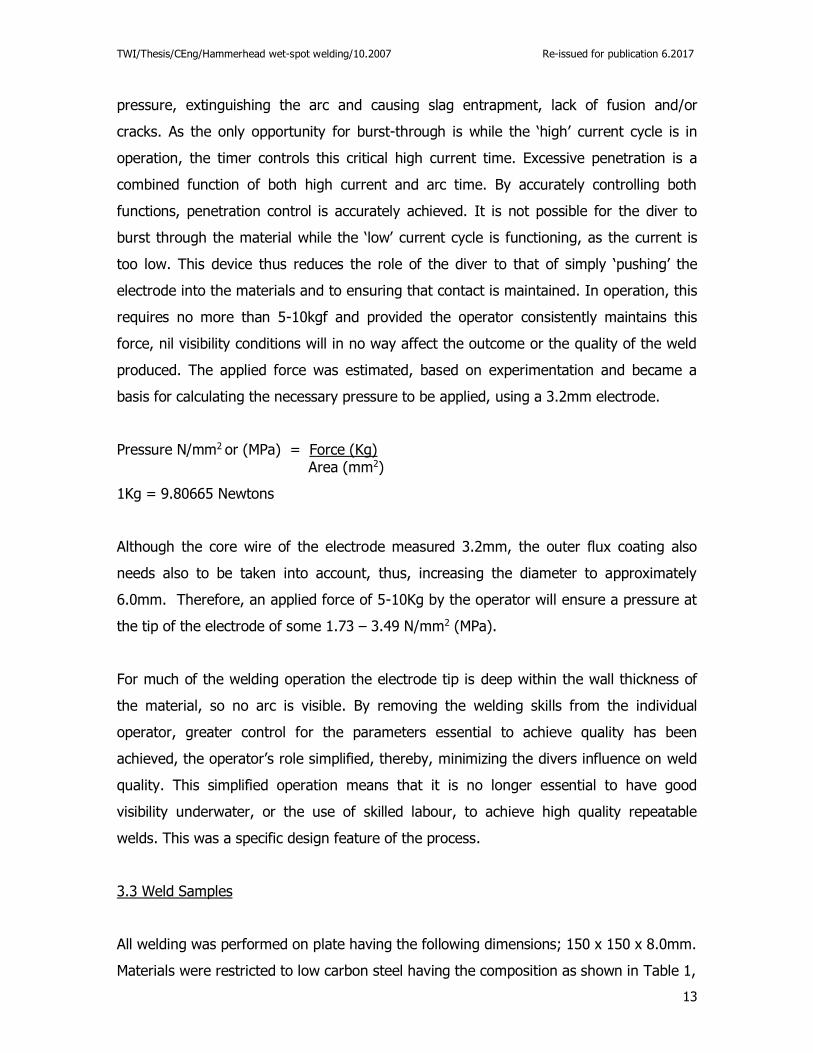
basis for calculating the necessary pressure to be applied, using a 3.2mm electrode.
Pressure N/mm2 or (MPa) = Force (Kg) Area (mm2)
1Kg = 9.80665 Newtons
Although the core wire of the electrode measured 3.2mm, the outer flux coating also
needs also to be taken into account, thus, increasing the diameter to approximately
6.0mm. Therefore, an applied force of 5-10Kg by the operator will ensure a pressure at
the tip of the electrode of some 1.73 – 3.49 N/mm2 (MPa).
For much of the welding operation the electrode tip is deep within the wall thickness of
the material, so no arc is visible. By removing the welding skills from the individual
operator, greater control for the parameters essential to achieve quality has been
achieved, the operator’s role simplified, thereby, minimizing the divers influence on weld
quality. This simplified operation means that it is no longer essential to have good
visibility underwater, or the use of skilled labour, to achieve high quality repeatable
welds. This was a specific design feature of the process.
3.3 Weld Samples
All welding was performed on plate having the following dimensions; 150 x 150 x 8.0mm.
Materials were restricted to low carbon steel having the composition as shown in Table 1,
TWI/Thesis/CEng/Hammerhead wet-spot welding/10.2007 Re-issued for publication 6.2017
14
with CEV (IIW) shown in Table 2.
CEV formula calculated as C + Mn + (Cr + Mo + V) + (Ni + Cu)
6 5 15
The following weld ID’s were assigned for each test plate;
DRY SOPT WELDS WET SPOT WELDS
D-1 W-1
D-2 W-2
D-3 W-3
D-4 W-4
All spot welds were conducted on simple lap joints, with one plate overlapping the other
by ~50%, as shown in Figure 5.
3.4 Equipment, Facilities and Environment
All welding was conducted on-site, in open air conditions, utilizing the following
equipment and facilities.
A 400 amp Gen-Set diesel welding generator
Piranha welding monitor/safety switch, fitted with the Hammerhead control system.
Underwater welding stinger
Welding leads (50mm2 copper) double insulated
Brass parallel closing earth clamp
Welding was conducted at Northern Divers facilities in Hull. All diving equipment used
was standard commercial surface demand i.e. the diver being fed with an air supply
through an umbilical, rather than a SCUBA bottle, as used in sports diving. Full radio
communications were also in place throughout, enabling welding data to be supplied
and recorded. All personnel engaged were HSE approved commercial divers and all
welding was carried out using best working practice. [1-2] Welding was restricted to a
freshwater dive tank, at 3M depth. AWS D3.6M-99 and BSEN ISO 15618-1 takes no
TWI/Thesis/CEng/Hammerhead wet-spot welding/10.2007 Re-issued for publication 6.2017
15
account of water type, and the qualification of a welding procedure or operator is given
a +10M extent of approval, thereby, allowing for a maximum welding depth of 13M
and still remaining within specification. (Figure 6 shows dive tank). The environmental
conditions recorded during welding were as follows;
Air; -3o C (+/-1 o)
Water; 0o C (+/- 1 o)
The applied force the diver used in order to ensure the correct pressure was achieved
and maintained, whilst welding, was clearly onerous, and was ‘a best estimate’ made by
each individual, during the experiments but was based on the calculation described
earlier.
3.5 Electrodes
The electrodes used for the experiments were 3.2mm having the chemical composition
shown in Table 3. The electrode used for wet spot welding was specifically designed to
allow for high dilutions, while being capable of maintaining an arc under short-arc
conditions underwater. These electrodes have the potential to allow for dilutions up to a
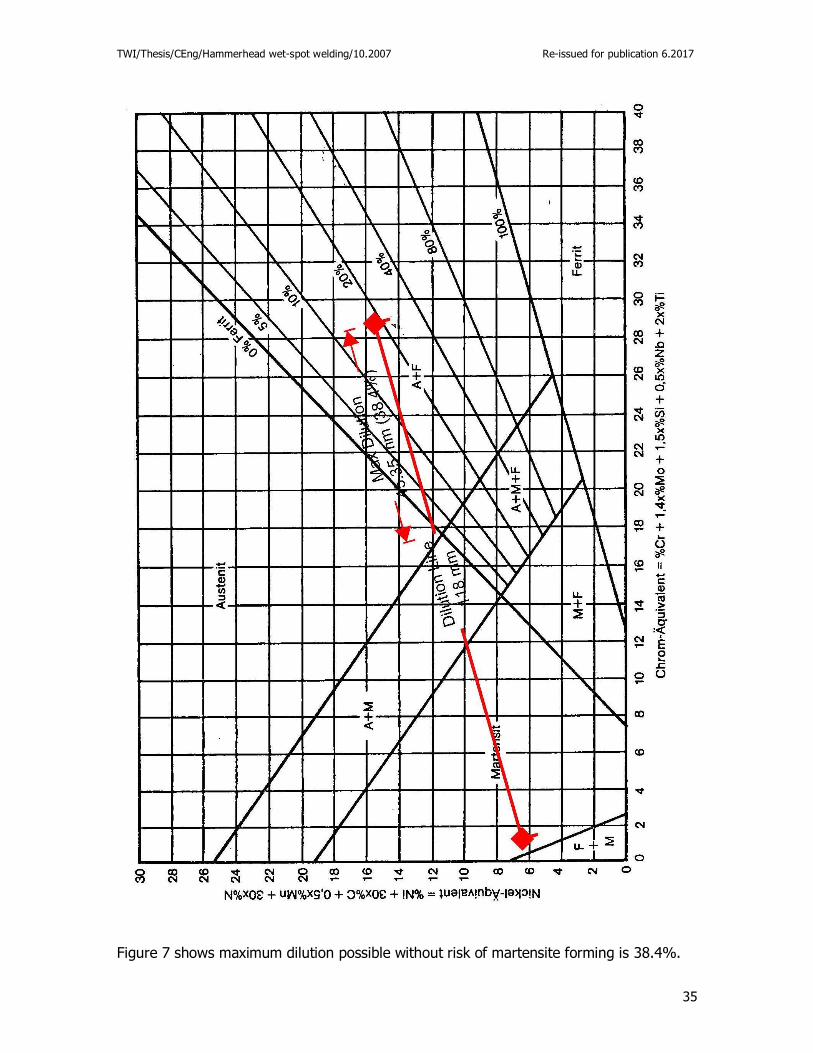
maximum of 38% without the risk of martensite formation. In order to evaluate fully this
potential, the Shaeffler diagram was used (as shown in Figure 7) to plot a dilution line
based on the mean values as shown below. The Hammerhead electrode provides for the
following Cr and Ni equivalents, based on the following formula.
CrEq = %Cr + Mo + (1.5 x Si) + (0.5 x Nb)
NiEq = %Ni + (30 x C) + (0.5 x Mn)
CrEq = 22.5 %Cr + (3.6) + (1.5 x 1.1) + (0.5 x Nb) = 27.75
NiEq = 12.7 %Ni + (30 x 0.045) + (0.5 x 0.8) = 14.45
As the Shaeffler diagram shows, the use of this electrode provides for a maximum
dilution of 38.4%, without risking the formation of martensite. It is excepted when using
MMA welding a dilution of around 25% can be expected. Underwater this is normally
TWI/Thesis/CEng/Hammerhead wet-spot welding/10.2007 Re-issued for publication 6.2017
16
slightly reduced, due to ambient temperature and rapid cooling, to approximately 20%.
[1,10-12]
3.6 Welders and Operators
Four individuals were engaged to carry out welding and were identified as follows;
Welder ‘A’ – skilled welder - conducted welds D1 and W1
Welder ‘B’ - non-welder - conducted welds D2 and W2
Welder ‘C’ – Skilled welder – conducted welds D3 and W3
Welder ‘D’ – non-welder – conducted welds D4 and W4
Each diver was asked to produce one weld dry and one weld wet each.
3.7 Welding Procedures
To ensure accurate data collection of welding parameters, all welding operations were
recorded throughout.
Applied arc energy was calculated by use of the standard formula;
Arc Energy = I x V (total power in watts)
ROL (mm)/time in seconds
I = current
V = volts
ROL = run out length of the electrode
At present, no specification exists for wet-spot welding using any MMA welding process.
Any attempt therefore, to evaluate and determine how many welds may be required to
bare a given load was based on use of the following formula. To do this, the size of any
given weld and therefore the number of welds required, is based on the required shear
stress exerted on the component. Thus, each single spot weld can offer the following
theoretical strength properties.
TWI/Thesis/CEng/Hammerhead wet-spot welding/10.2007 Re-issued for publication 6.2017
17
Max load = d 2 x shear strength. (Neglecting any bending moment).
4
In calculating the shear strength for plain carbon steel it is common industrial practice to
assume this to be 4/5, or ~80% of the ultimate tensile strength. The Hammerhead
electrode offers a tensile strength of 650MPa (all-weld ‘dry’ test) and thus, based on this
assumption, shear strength becomes 520MPa.
Thus, load carrying area (mm2) is d 2 where ‘d’ is the spot diameter (mm).
4
Thus, for a 10.0mm spot weld, the area is .100 = 78.54mm2.
4
Max design shear stress for a 10.0mm spot weld is therefore 40840.8 MPa or 40.84kN.
Number of 10mm dia welds required (N) is total shear load (kN)
40.84
Alternatively, the shear stress can be calculated per mm2 of weld. This would produce the
total spot weld area required and thus, lead to a selection of spot welds.
Shear Stress ‘X’ kN mm2 = 40.84 (kN) Thus, shear stress = 0.52 kN/mm2 (520 N/mm2).
78.54 (mm2)
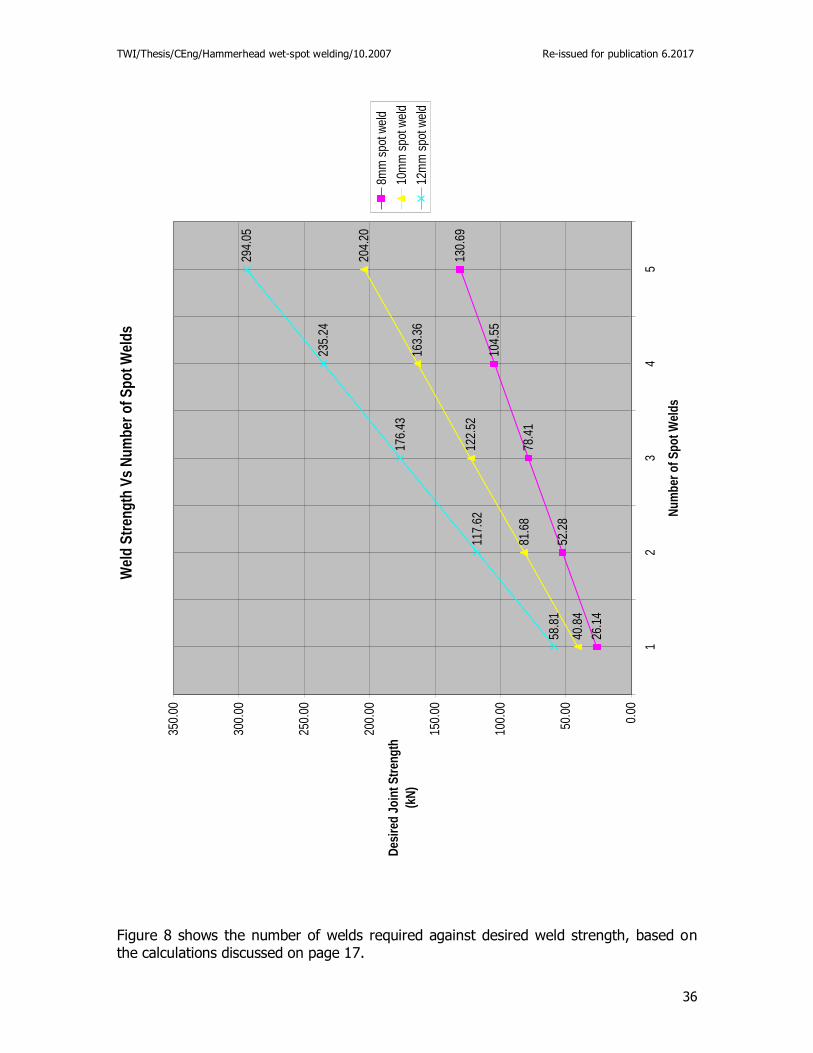
Therefore, the total spot weld area required for a load of 45kN is 86.54mm2. In order to
show desired joint strength against a specific number and/or size of individual spot weld,
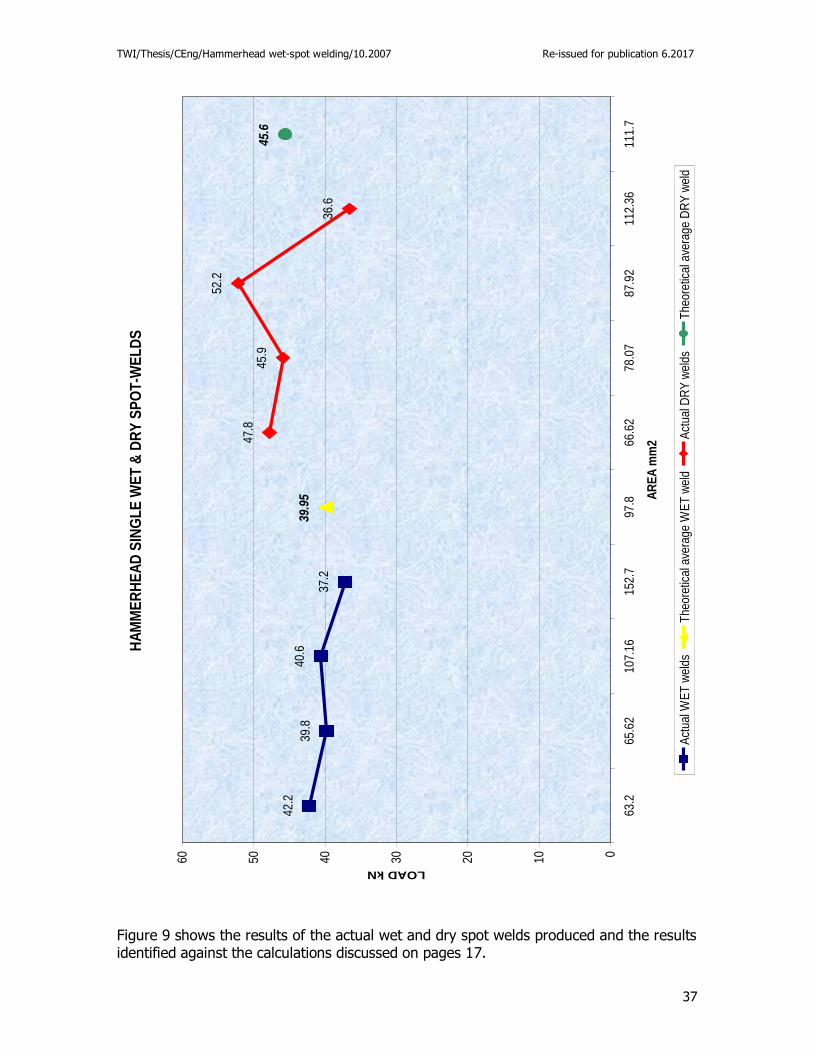
the results shown in Figure 8, based on the above calculations, and detailed in appendix
1A and 1B, may be utilized. The actual results obtained for all wet and dry spot welds are
shown in Figure 9.
3.8 Spot Welds
The welding parameters and techniques for all welds were preset and recorded as
follows;
TWI/Thesis/CEng/Hammerhead wet-spot welding/10.2007 Re-issued for publication 6.2017
18
Amps: Primary (1st) value 250-260 Secondary (2nd) value 150-160
Timer: 5-6 seconds for peak (1st) current value
Volts: 25-35
Polarity: DC-Ve electrode
Electrode Angle: 90o +/-10o
Pressure Applied: Constant 5-10kgf
Material thicknesses: 2 x 8.0mm plates
Electrode: 3.2mm Hammerhead
Position: Flat
Weld Time: 25-27 seconds
The welding operation itself is somewhat unusual, as little sight of the arc is visible after
arc initiation. This is a deliberate design feature of the process, removing from the welder
any necessity to interpret the arc condition and thus, removing the skill requirement to
produce a weld. Prior to welding, plates were simply clamped together to prevent
relative movement between them. No cleaning or other joint preparations were used for
any of the welds. Welding was conducted on plates in the as delivered condition,
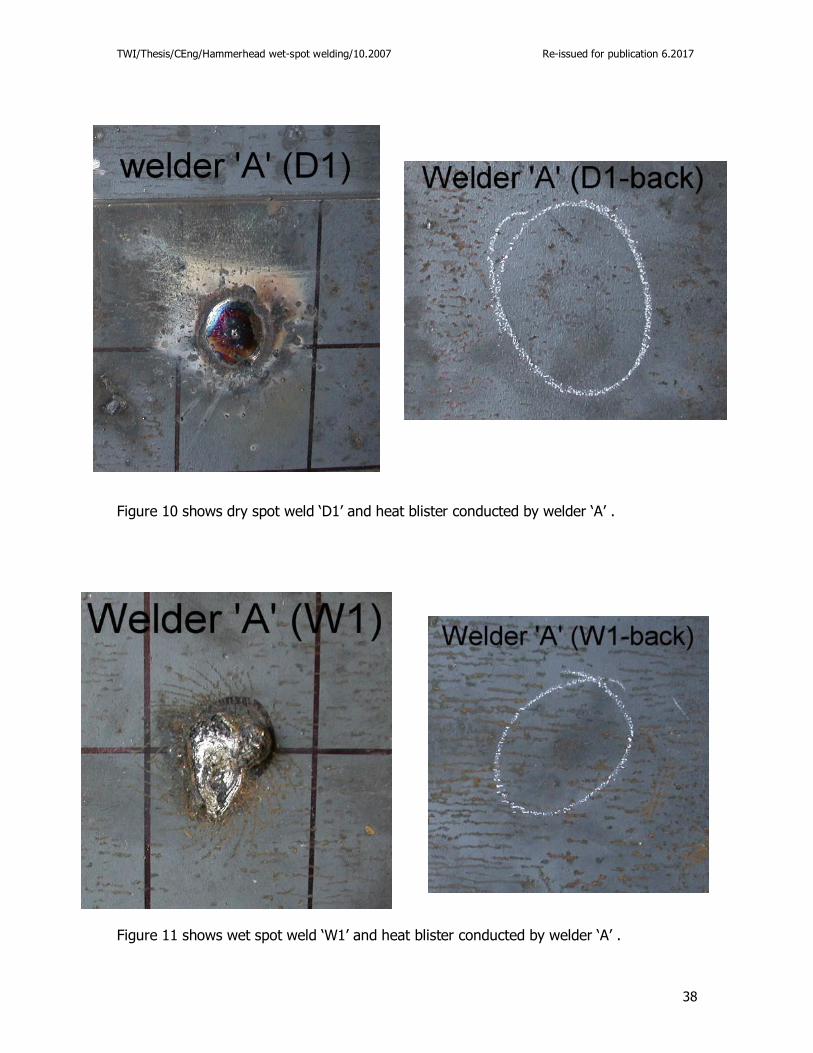
although the material was rust free for welder ‘A’ plates. Welder ‘A’ produced both wet
and dry spot welds, at the time of welding underwater, visibility was moderate at
approximately 30-45cm (see Figures 10 & 11).
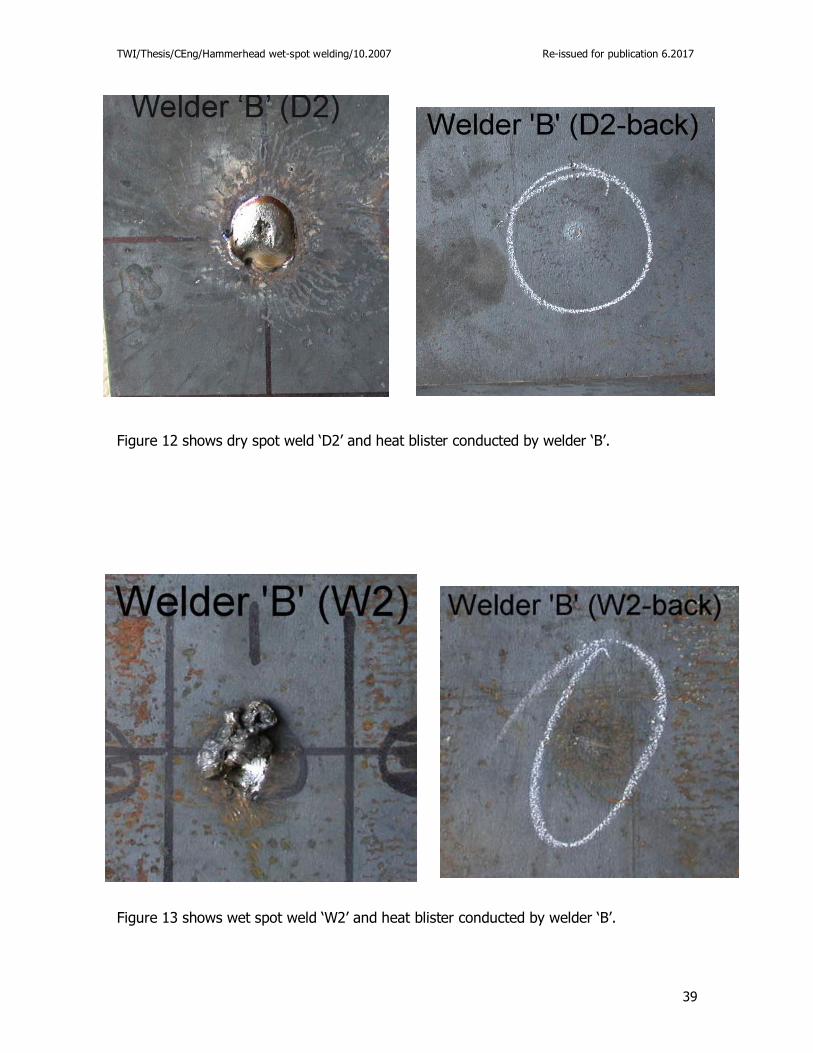
Welder ‘B’ produced both wet and dry spot welds. He was permitted a short practice
period, to allow for a period of familiarisation. Welder ‘B’s underwater plates had not
been cleaned, and were covered with a light surface rust. The welding parameters &
techniques for welder ‘B’ were exactly the same as for welder ‘A’. At the time of
underwater welding, visibility was very poor <25cm (see Figures 12 & 13).
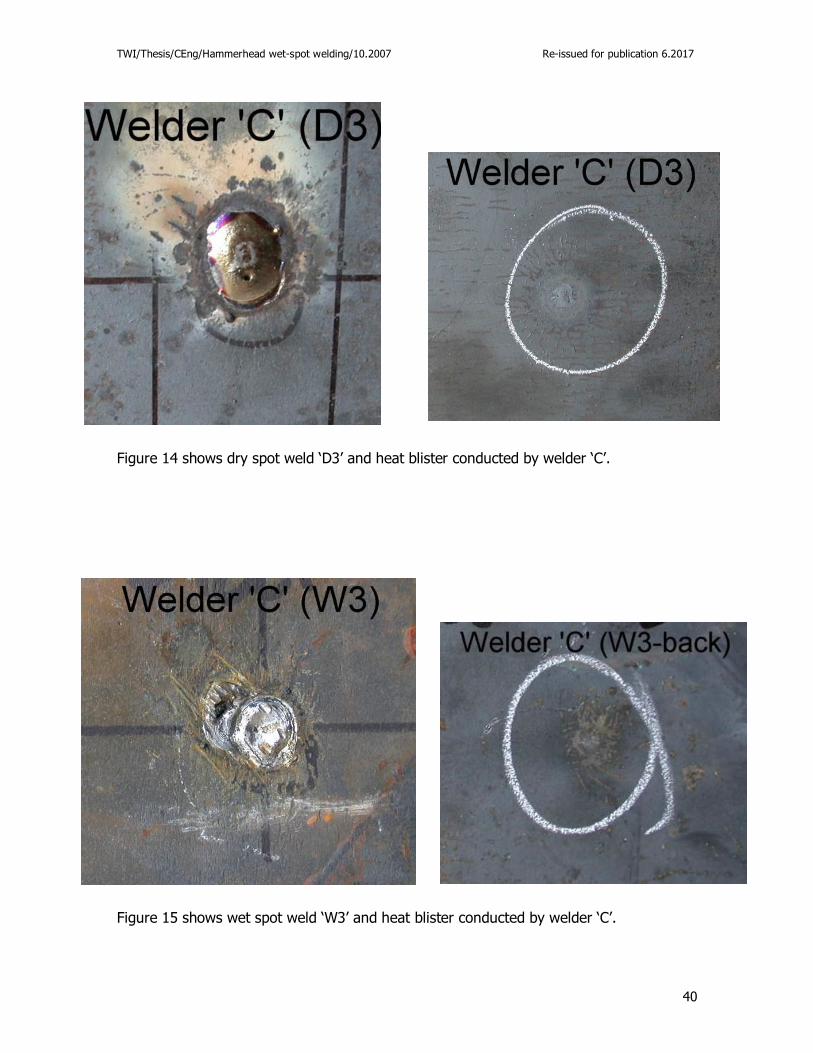
Welder ‘C’ also produced both wet and dry spot welds and was asked to produce his
welds after a brief introduction of the technique. Welder ‘C’s underwater plates had once
again not been cleaned, and were covered with a light surface rust. At the time of
underwater welding, visibility was very poor <25cm (see Figures 14 & 15).
TWI/Thesis/CEng/Hammerhead wet-spot welding/10.2007 Re-issued for publication 6.2017
19
Welder ‘D’ also produced both wet and dry welds but was asked to produce his welds
completely unaided, without any opportunity to practice, in a bid to demonstrate the
feasibility of a no-skill process. Welder ‘D’s underwater plates had not been cleaned, and
were covered with a light surface rust. At the time of welding underwater visibility was
completely nil and all welding was carried out by touch (see Figures 16 & 17).
4: Results
4.1 Visual Appearance
The overall quality of welds produced for both wet and dry spot welds was surprisingly
similar, especially when one considers the visibility under which wet welds were made.
Equally, there appears to be no substantial difference between welds made by the skilled
welders over non welders (see Figures 10-17). All welds showed adequate fusion
between base materials and weld metal. Although not completely defect free, some wet
spot welds did show evidence of minor gas voids/slag inclusions in the weld body.
However, none of the recorded defects appeared to make a significant impact on the
overall average strengths of welds made wet, as compared to welds made dry. No
appreciable defects were observed, by the naked eye, for any dry spot welds.
Welds generally had an overall convex circular appearance, but a clear difference existed
between wet and dry. Wet spot welds had a somewhat untidy appearance and didn’t
blend in well with the top plate surface, unlike dry welds. This appearance was due to
the existence of a more restricted weld puddle. Also, as the operator was discouraged
from manipulating the electrode, having only to apply pressure, this reduced any effect
of electrode manipulation and weld puddle control which had an influence on the final
weld appearance. For dry spot welding it was possible to manipulate the electrode during
the final stages of welding, which assisted in working/wetting out the weld puddle. This
manipulation produced a smoother, more blended appearance and as a result, dry welds
did not show excess ‘flash’ material, (which was evident in all wet spot welds). This flash
was due to excess material being ejected from within the molten nugget. It appeared
that excess flash metal resulted from additional weld metal from the electrode, causing
some still, molten-metal, to be ejected as a result of continued pressure applied to the
TWI/Thesis/CEng/Hammerhead wet-spot welding/10.2007 Re-issued for publication 6.2017
20
electrode. Although untidy in appearance, this flash material was easily removed later by
a simple hammer blow.
One common feature for both wet and dry spot welds was the heat mark, or blister,
formed on the back face of the base material. This provided a very useful indicator as to
the success of penetration. Although not accurate in terms of measurement or depth, it
did provide an excellent method of visually establishing whether penetration had
occurred. Where no heat mark/blister was present then the depth of penetration into the
back material was limited.
The overall diameter of the welds produced in air, (measured across the top outside
diameter of the weld), was somewhat larger than welds produced wet, with the average
diameter for a dry weld being 21.48mm against an average diameter for the wet weld of
14.39mm. Wet welds on average were thus nearly 50% smaller in diameter (49.27%)
compared to dry welds made under similar current/voltage conditions. However, this
increase in diameter appeared mainly due to operator manipulation of the electrode,
(despite being requested not to) just prior to completing the weld. This can be seen from
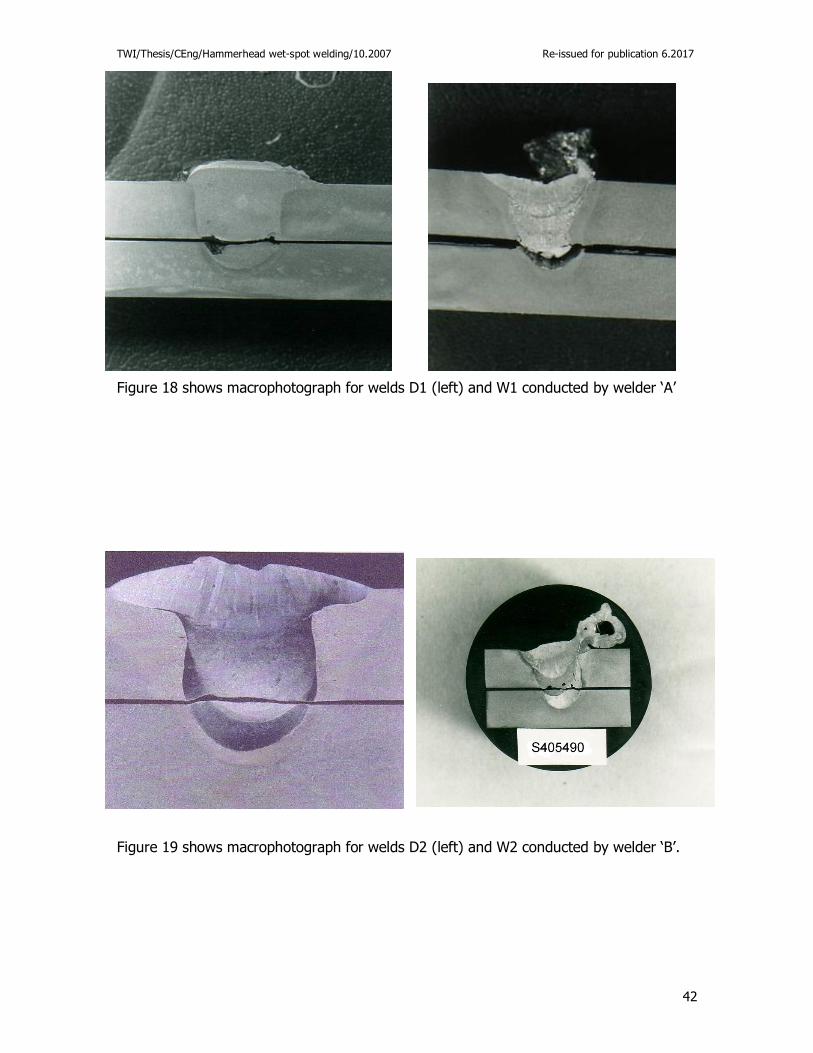
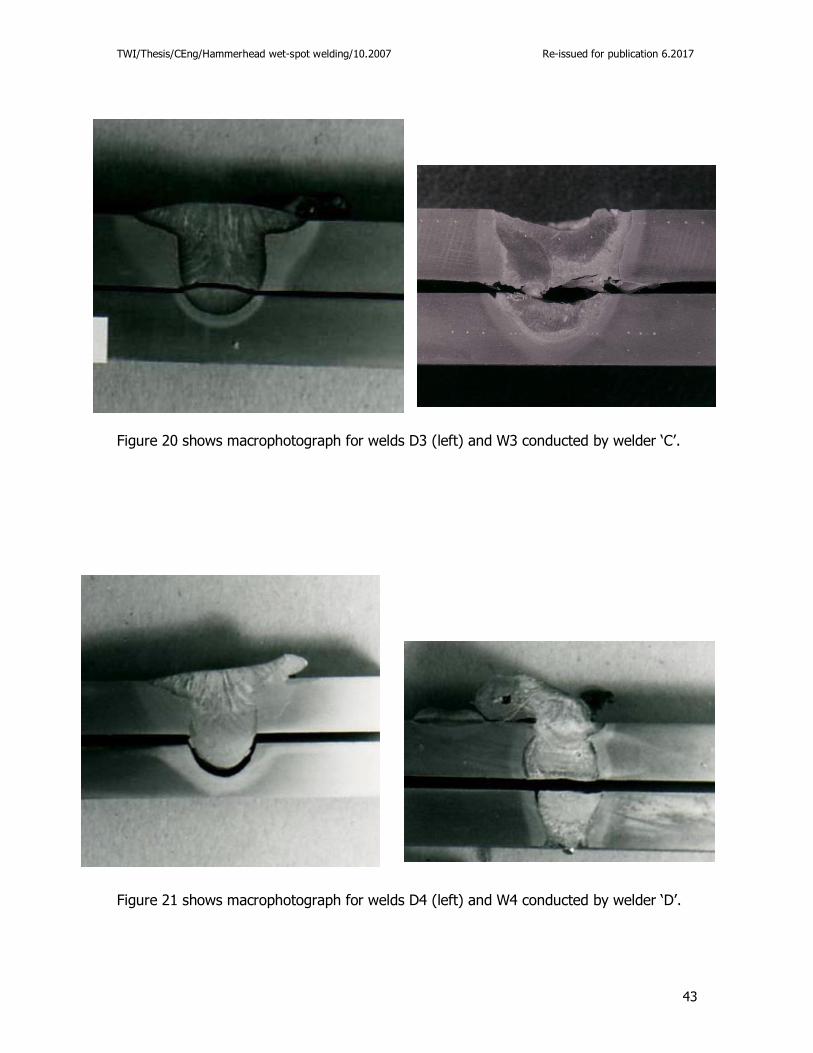
studying the weld shapes more closely in the macrophotographs, shown in Figures 18-21.
4.2 Transverse Tension Shear Tests
In order to establish the load required to failure, both wet and dry spot welds were
subjected to transverse shear tensile tests. Tables 4 and 5 show individual test results for
each wet and dry spot weld. The average failure load of each weld type was;
Dry spot welds – 45.63kN
Wet spot welds – 39.95kN
A difference of 5.68kN between wet and dry was found. Thus, the average dry spot weld
offered a 14.2% strength improvement over underwater welds produced. The average
CSA of the weld nugget size for all welds was;
Dry spot welds – 86.24mm2
TWI/Thesis/CEng/Hammerhead wet-spot welding/10.2007 Re-issued for publication 6.2017
21
Wet spot welds – 97.17mm2
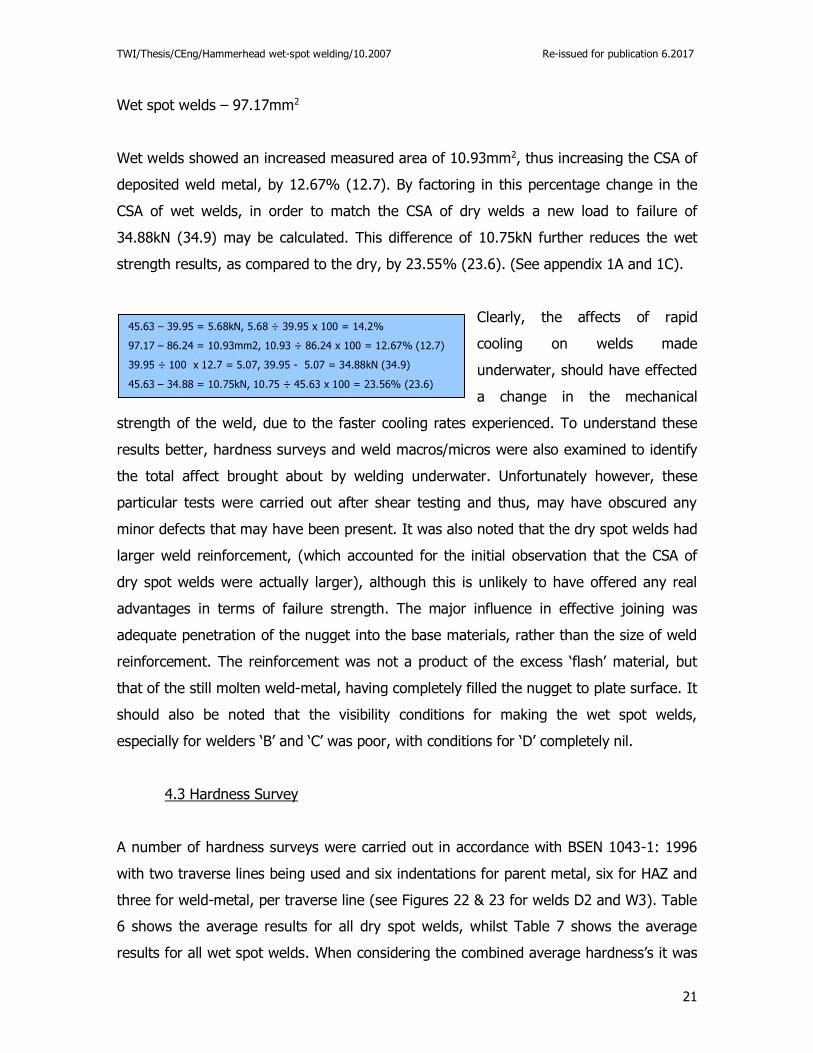
Wet welds showed an increased measured area of 10.93mm2, thus increasing the CSA of
deposited weld metal, by 12.67% (12.7). By factoring in this percentage change in the
CSA of wet welds, in order to match the CSA of dry welds a new load to failure of
34.88kN (34.9) may be calculated. This difference of 10.75kN further reduces the wet
strength results, as compared to the dry, by 23.55% (23.6). (See appendix 1A and 1C).
Clearly, the affects of rapid
cooling on welds made
underwater, should have effected
a change in the mechanical
strength of the weld, due to the faster cooling rates experienced. To understand these
results better, hardness surveys and weld macros/micros were also examined to identify
the total affect brought about by welding underwater. Unfortunately however, these
particular tests were carried out after shear testing and thus, may have obscured any
minor defects that may have been present. It was also noted that the dry spot welds had
larger weld reinforcement, (which accounted for the initial observation that the CSA of
dry spot welds were actually larger), although this is unlikely to have offered any real
advantages in terms of failure strength. The major influence in effective joining was
adequate penetration of the nugget into the base materials, rather than the size of weld
reinforcement. The reinforcement was not a product of the excess ‘flash’ material, but
that of the still molten weld-metal, having completely filled the nugget to plate surface. It
should also be noted that the visibility conditions for making the wet spot welds,
especially for welders ‘B’ and ‘C’ was poor, with conditions for ‘D’ completely nil.
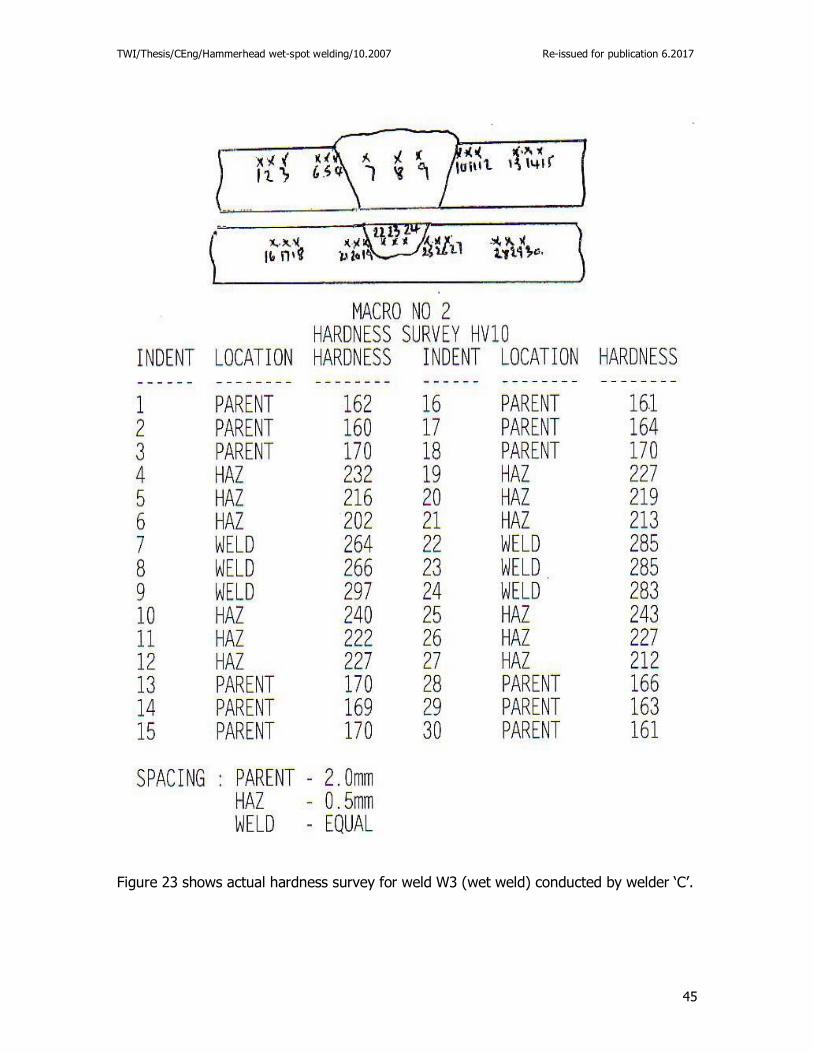
4.3 Hardness Survey
A number of hardness surveys were carried out in accordance with BSEN 1043-1: 1996
with two traverse lines being used and six indentations for parent metal, six for HAZ and
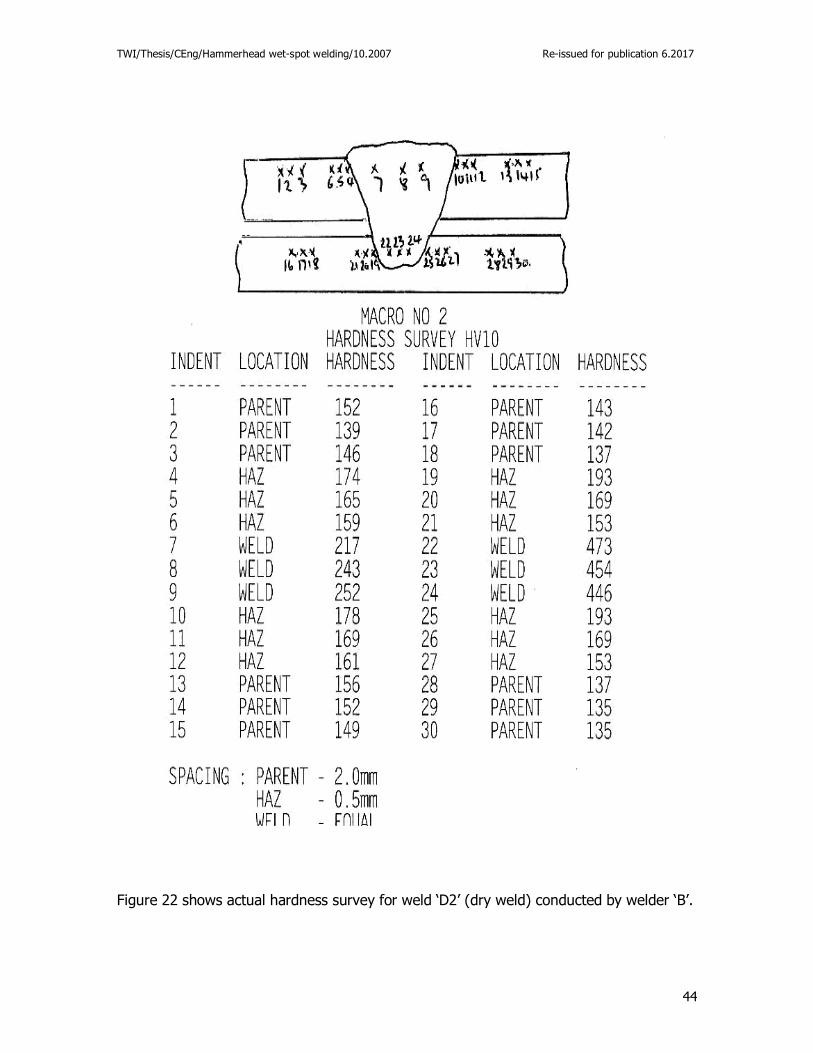
three for weld-metal, per traverse line (see Figures 22 & 23 for welds D2 and W3). Table
6 shows the average results for all dry spot welds, whilst Table 7 shows the average
results for all wet spot welds. When considering the combined average hardness’s it was
45.63 – 39.95 = 5.68kN, 5.68 ÷ 39.95 x 100 = 14.2%
97.17 – 86.24 = 10.93mm2, 10.93 ÷ 86.24 x 100 = 12.67% (12.7)
39.95 ÷ 100 x 12.7 = 5.07, 39.95 - 5.07 = 34.88kN (34.9)
45.63 – 34.88 = 10.75kN, 10.75 ÷ 45.63 x 100 = 23.56% (23.6)
TWI/Thesis/CEng/Hammerhead wet-spot welding/10.2007 Re-issued for publication 6.2017
22
seen that the wet results were similar to the dry welds. Somewhat surprisingly, however,
was the actual wet welds produced lower hardness’s than the dry welds. This is contrary
to what might be expected, with conventional underwater welds cooling more rapidly,
thus resulting in harder weld and HAZ metals. [1,7,10-13] In the case of dry spot welds this
appeared due to two anomalously high reading in traverse ‘2’, on welds ‘D2’ and ‘D4’ and
was assumed to be the result of increased dilution, whilst operating on the ‘high’ current
setting. This situation produced a hotter, more fluid puddle, thereby, diluting more
carbon from the plate into the weld pool. This combined with the switch over from ‘high’
to ‘low’ current, effectively limited any further alloying, which together with the affects of
plate cooling caused the formation of martensite. As far as HAZ results were concerned,
although wet welds were harder than dry ones, their values were still acceptable under
BSEN ISO 15614-1 and AWS D3.6 and showed some improvements over conventional
wet MMA fillet welds. [1,3-11-13]
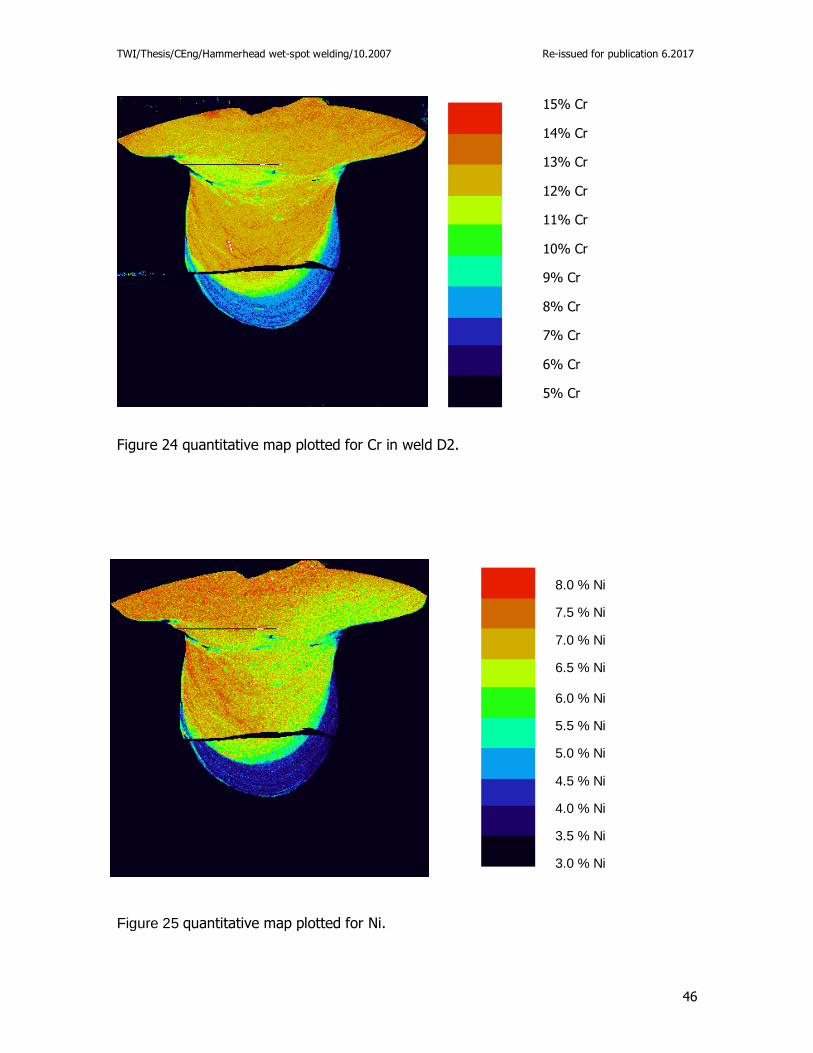
4.4 Macro/Microscopic Survey
To understand better what has actually happened to weld ‘D2’ (highest hardness dry
weld) and also wet weld ‘W3’, a series of microphotographs were taken to study the
microstructures present. Weld ‘D2’ was also subjected to a Cameca SX50 EPMA electron
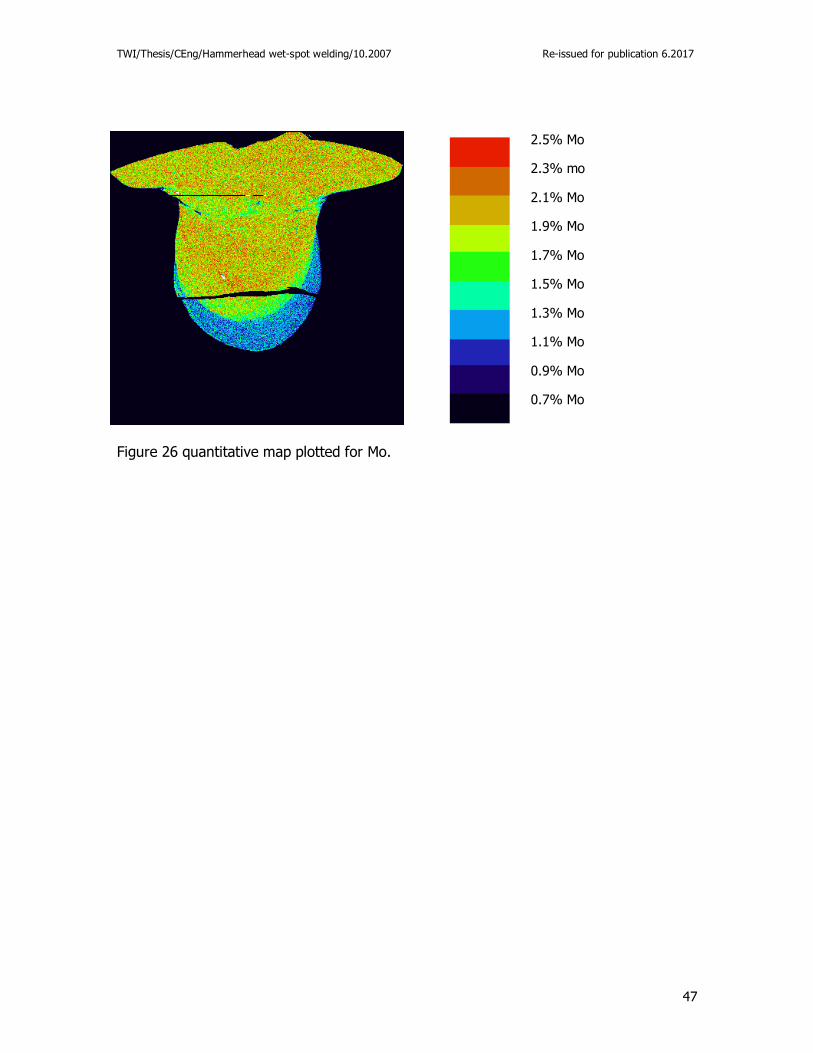
microscope to map the weld area (see Figures 24-26). The results for weld ‘D2’ showed
reduced Cr, Ni and Mo levels present in the root area of the weld, located just at the
point where the switch-over from high current to low current took place. This
demonstrates that higher dilution occurred in the root area, resulting in higher carbon
levels. This factor may account for the observed elevated hardness readings, despite a
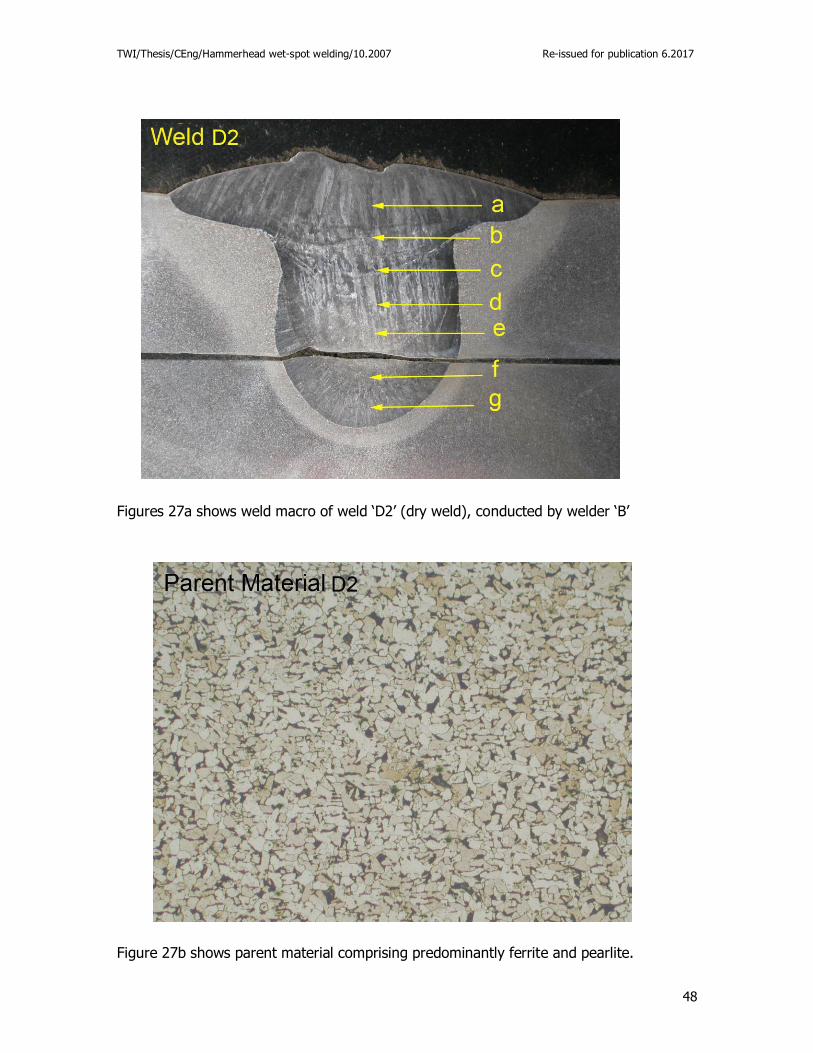
slower cooling rate having been experienced than weld ‘W3’. Microphotographs for weld
‘D2’, apparently confirmed this effect and shows that higher carbon martensite existed,
as did also numerous spherical carbide particles (see Figures 27c-p). Martensite and
carbides were evident to some degree throughout the whole weld body, as was the
occasional isolated globular oxide (see Figure 27c-m). Both welds, wet and dry, showed
a microstructural similarity, with the existence of delta ferrite in an austenitic matrix,
together with isolated globular oxides being present. The underwater weld ‘W3’ showed
evidence of a small crack in the root area, which may have been the result of the shear
testing, as no other significant metallurgical factors were observed in the weld that may
TWI/Thesis/CEng/Hammerhead wet-spot welding/10.2007 Re-issued for publication 6.2017
23
have brought about such a crack. This may be explained by the pronounced loss of
material that occurred from the weld nugget, which appeared to show a ductile break
(see Figure 28a). In addition, it was also clear that the material for weld ‘D2’ and weld
‘W3’ were not the same, despite the material specification, as shown in table 1. Weld ‘D2’
clearly had a higher carbon content, as shown by the ferrite and pearlite content, which
may in fact, be as high as 0.25% (see Figure 27b). Whereas, weld ‘W3’ showed a
considerably lower percentage of pearlite (smaller and less carbide platelet formation).
This may more accurately reflect a material composition closer to 0.15% carbon (see
Figure 28b).
5: Discussion
In considering the weld strength vs. weld size and therefore, the number of welds
required for any given load carrying capacity, the following principle to calculate overall
stress can be employed:-
Force (load)
Stress = ---------------
(UTS) Area
The dry results as shown in Table 4 and Figure 9 show the average CSA for dry spot
welds was 86.24mm2, with the average load to failure being calculated at 45.63kN, whilst
the average UTS was 548.5N/mm2. Whereas the wet tensile results shown in Table 5
and Figure 9, show the average CSA for wet spot welds was 97.17mm2, with the average
load to failure being calculated at 39.95kN, whilst the average UTS was 474.50N/mm2.
Thus, the average dry spot weld CSA was, by comparison, some 10.93mm2 smaller than
the average wet spot weld, but offered an increase in shear strength of some 5.68kN.
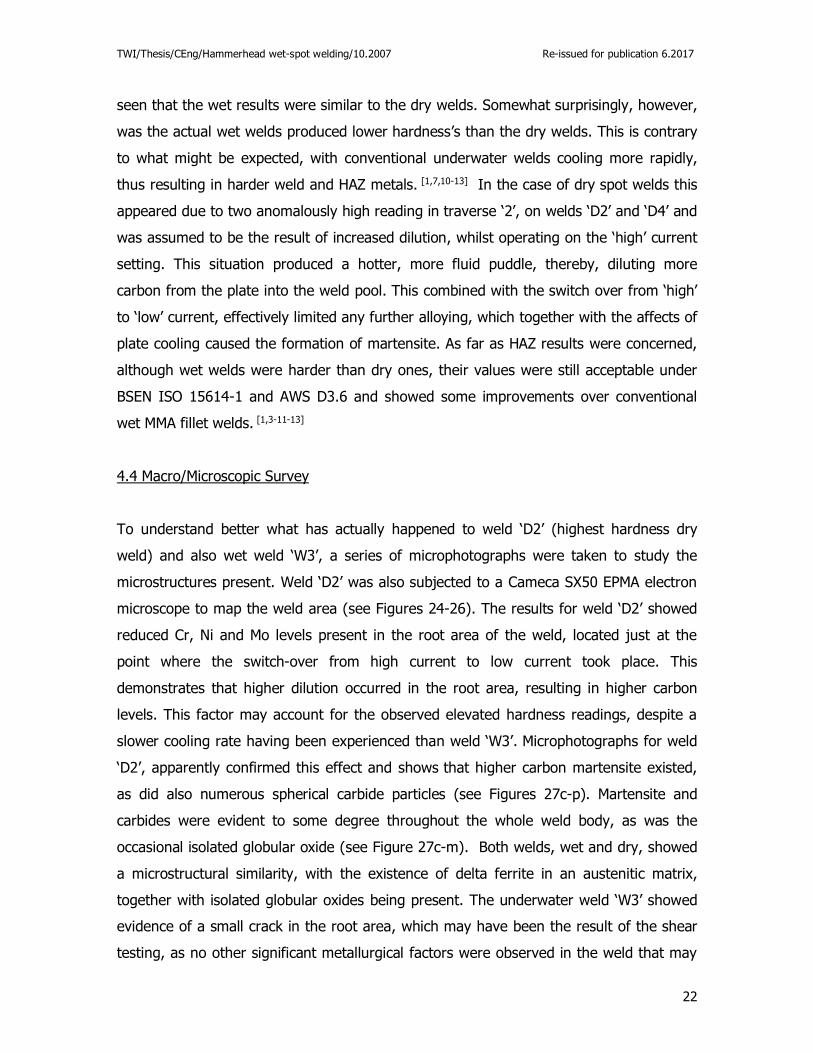
By comparing the wet shear test results to the theoretical based value (10.0mm diameter
nugget) which produced a load to failure of 40.8kN, with UTS of 408N/mm2 (as shown in
Figure 9). The actual weld deposited offered a slight reduction of 0.85kN or 2.1%.
However, by calculating the reduction in CSA (which equated to 2.83mm2) the strength
reduction becomes 2.9%. The design principle that predicts a given number of spot
TWI/Thesis/CEng/Hammerhead wet-spot welding/10.2007 Re-issued for publication 6.2017
24
welds for a given load would appear therefore, to over value actual wet weld strengths
by approximately 3%. Nevertheless, this approach demonstrates the principle that simple
calculation would provide a reliable base method for determining the number of spot
welds necessary to carry a given load. (See appendix 1A and 1B).
The overall appearance of the wet welds
was somewhat more untidy when
compared to dry welds, with the more restricted weld puddle in evidence. Although, the
weld profile (cap) did not appear to significantly affect the results of mechanical testing.
The average hardness values for wet and dry spot welds were acceptable showing no
particular hardness concerns. (see Table 6/7) In fact, considering the average values
between wet and dry (excluding D2 and D4) the differences was so minimal as to be
irrelevant. It should be appreciated differences in material carbon content for welds ‘D2’
and ‘W3’ could be sufficient to show a difference in the hardness readings obtained.
Hardness testing was conducted using national standards, although it is
accepted that in order to fully evaluate this type of weld and better
understand the affects of cooling, further additional hardness testing may
need to be conducted.
The weld macros showed deposit weld quality was similar between wet and dry, although
not defect free, no greater incidence of defects were produced wet, as compared to dry.
It should also be noted that all welds, both wet and dry, had been mechanically tested
prior to macro/micro examination and hardness surveys. This may therefore, have had
some affect on the results obtained. Nevertheless, the quality of wet spot welds
produced showed that this method of welding can be relied upon to produce underwater
welds, at the very least, every bit as affective as has been shown for the conventional
wet fillet welds described in the referenced literature, [8-13] although it is accepted that
Martensite is likely exist in the root area of any welds produced, thus limiting
this process to low carbon steels only.
No weld cleaning or joint preparation was necessary to execute any weld, unlike that of
conventional wet fillet welding and therefore welding efficiency was significantly
increased, with a completed weld being produced within 27 seconds. The control device,
40.8 – 39.95 = 0.85, 0.85 ÷ 40.8 x 100 = 2.08% (2.1%)
100 – 97.17 = 2.83, 2.83 ÷ 97.17 x 100 = 2.9% (3.0%)
TWI/Thesis/CEng/Hammerhead wet-spot welding/10.2007 Re-issued for publication 6.2017
25
specifically designed for this method, provided a suitable means to control the essential
welding parameters and demonstrated the means to reduce the role of the diver, even
under nil visibility conditions. It must be accepted however, that the role of the diver is
still essential in the production of a satisfactory weld, due to the need to apply adequate
pressure. Nevertheless, this welding method has demonstrated a successful means of
joining carbon steels together that eliminates the need for skilled welders, as well as all
conventional cleaning/preparation methods. Furthermore, successful wet welds were
produced, even under conditions of nil visibility, an approach which offers significant cost
savings over conventional wet MMA fillet welding methods.
6: Conclusions & Further Work
The experiments conducted demonstrated that the wet spot welding method tested was
capable of making an affective mechanical fixing for structural steels underwater. At
the same time, the technique provided commercial benefits in the way of speed, quality
and repeatability over conventional wet MMA fillet welding, without using skilled welders
and working in poor/nil visibility conditions.
To demonstrate the commercial advantages of this process, the experiments
concentrated on the following conditions;
1: Producing spot welds in nil visibility, while still providing for an effective weld
2: Elimination of preparation/cleaning of materials and increased welding speeds
3: Elimination of welding skills
4: Repeatability and consistent weld quality
To facilitate this, spot welds were produced under different conditions for evaluation.
These consisted of both dry and wet spot welds. Dry welds were produced as a baseline
comparison against which to compare weld quality and thus, highlight any differences in
mechanical and metallurgical qualities. This work was limited to welding low carbon
structural steel plate (8.0mm) in freshwater, at a depth of 3M, using the processes
specially designed control device. The experiment had not taken into account the affects
welding in seawater may bring, nor did it consider other welding positions. [1,3-6,8]
Welding was restricted to the use of a single type of Cr-Ni-Mo stainless electrode, of
TWI/Thesis/CEng/Hammerhead wet-spot welding/10.2007 Re-issued for publication 6.2017
26
3.2mm diameter, with all welding being conducted in the flat position. Further work
would be required to evaluate this welding methodology more fully. Other materials,
electrode sizes, positions and changes in water type/depth, together with different
grades of structural steels need also to be tested. All underwater welding was conducted
in poor and/or absolute nil visibility conditions with both skilled and non-skilled welder-
divers being employed. Although only a few welds in total were produced, insufficient to
provide for a comprehensive outcome, the evidence showed that divers with little or no
welding skills/knowledge were able to produce acceptable spot-welds as easily as skilled
welders. It was also shown that visibility had no affect on performance, or weld quality.
Neither did the lack of weld preparation or cleaning appear to substantially affect final
weld quality. Although not a fully automatic welding method, the control device proved
suitable to control the welding parameters essential to produce welds repeatedly. It was
axiomatic that each individual diver must ensure a suitable pressure be applied to the
electrode to ensure an acceptable weld was produced. The wet spot welds provided
suitable weld quality in terms of strength, with properties closely matching those of dry
spot welds. Although it is accepted, due to the metallurgy, the process is likely
to be limited, underwater, to welding non-load bearing joints, eg anodes. It
became evident that the spot welding method provided for a considerably faster joining
method than conventional wet MMA fillet welding, as the process did not require any
time spent on joint preparation or cleaning of the material/weld and spot welds (wet and
dry) were produced in a matter of seconds.
The Hammerhead welding process clearly remains a manual operation, despite the
control device, whereas Sadowski’s [9] work involved automatic fixed welding heads,
working in hand deep test tanks only. In contrast, the hammerhead process was used by
a diver, being fully submerged underwater in a 3M dive tank. The welding process was
designed as a one-shot, one-spot process, i.e. one electrode produced one spot weld and
eliminated the need to make a second weld over the first, thus eliminating inter-run
cleaning and the difficulties encountered in attempting accurate weld placement. [12] The
Hammerhead welding method appears to lend itself to automation and this may well
prove of great interest, as presently there remains a level of control required by the
diver, during welding, to apply pressure to the electrode.
TWI/Thesis/CEng/Hammerhead wet-spot welding/10.2007 Re-issued for publication 6.2017
27
It was reported by Gooch, [10] Masubuchi, [11] and West et al, [13] that the use of austenitic
electrodes to produce conventional fillet and butt welds underwater often produced
cracking in the weld root and hot pass zone. Abson and Cooper [12] also found extensive
cracking when using this type of electrode, thus, preventing any useful mechanical
testing. As can be seen from the microphotographs throughout Figures 28 for the wet
spot weld (W3), with the exception of a small micro-crack (≤ 0.3mm) in zone ‘E’ as
shown in Figure 28k, no other cracking was observed in the weld or the HAZ. Although
this crack may be metallurgical in nature, it may have just as easily come about as a
result of the shear testing, as evidence exists that the weld underwent significant stress,
with large sections of weld material missing from the fracture face. The microstructures
reported by Abson and Cooper [12] also stated that martensite was severe, particularly in
the root area, where contact with the parent material meant high dilutions had taken
place. Nevertheless, martensite was observed throughout the whole weld body in these
samples. The reported hardness values also show significant increase over those
produced by the Hammerhead process. The evidence, as shown in Figures 28g-l, clearly
shows martensite present, although apparently less significant than those
reported by Abson and Cooper.[12] The hardness values, as shown in Figure 23, are
also considerably lower and clearly suggest evidence of an improved welding process,
when compared to conventional wet welding techniques. The average shear strength
values as reported by Gooch [10] suggest that the Hammerhead process provides equally
effective mechanical strength properties.
Van der Brink and Boltje [14] demonstrated that the moisture content of the electrode flux
covering was critical, just as in surface welding, to avoid hydrogen cracking. The
experiments detailed herein were conducted on a specially developed electrode,
manufactured in such a way as to minimise moisture pick-up. Furthermore, the number
of electrodes taken into the water at any one time was limited to no more than six to
minimise moisture pick-up and thus, help prevent hydrogen cracking. Szelagowski [15]
reported that the type of waterproof coating could also have a significant affect on
chemical composition of the weld deposit, although no evidence was observed on the
welds produced in this work, although further work in this regard may be beneficial. The
waterproof coating used for the Hammerhead electrode was a specially formulated vinyl
lacquer.
TWI/Thesis/CEng/Hammerhead wet-spot welding/10.2007 Re-issued for publication 6.2017
28
According to Grubbs, [16] conventional wet fillet welds, using ferritic electrodes, can be
successfully made in accordance with AWS D3.6 class ‘B’, at depths down to 60M. The
opportunity to test the Hammerhead process at these depths was not available during
these experiments, although it is accepted that deep welding trials would be necessary to
fully evaluate this process/electrode and investigate any differences in weld quality from
the shallow water tests undertaken. However, from the results obtained for the
Hammerhead process, evidence exists that further additional alloying of the electrode
may be necessary to help reduce martensite in the weld body, although it is accepted
that is cannot be achieved in the root area. Since commencing this work, a number
of further advancements have been made. The control device now has a specifically
designed PCB board and the reed switch control feature, which triggered the timer, has
been replaced completely. This feature is now controlled through the shunt, which offers
an all together more reliable method of initiating the timer, after the arc is struck.
This work has also been further extended by working closely with Corus. [17] The work
undertaken by Corus demonstrated the welding methodology to be valid, even for above
water applications and was more than capable of joining an even wider range of material
thicknesses than had been investigated. The process offered a rapid method of joining
plates and sheet steel and was equally capable of joining both very thin and thick
materials (1.6-15.0mm) and the control of penetration, by means of the device, was
quite satisfactory. Welding was performed in both the flat and vertical orientation and no
significant weld defects were reported, although some voids were located and reported
on thicker materials. Nevertheless, all joints contained large fused regions providing
mechanically strong joints. The welding of thin galvanized steel sheet provided joints with
high mechanical integrity, with the weld nugget being pulled out from the parent
material, with significant plastic deformation. It was noted that further work was needed
to investigate the maximum gaps that might be able to be bridged, as no particular gap
was preset during the initial trials. This is recognised to be an area of extreme interest
and significance. Following this initial investigation, Corus wished to discuss the
possibility of joint work, with the intention of developing a fully automatic version of the
system; this has been agreed and work has commenced. Although nothing to do with
underwater, Corus immediately recognised the commercial benefits of this welding
TWI/Thesis/CEng/Hammerhead wet-spot welding/10.2007 Re-issued for publication 6.2017
29
methodology, in particular, for welding of heavy plate. This new approach would utilize a
track system and electrode cassette to load and un-load electrodes automatically. The
joint working agreement permits the originating company to utilize the technology
enhancements achieved, thereby, allowing them further to develop and enhance this
technology for underwater welding. This would reduce the diver’s role to simply placing a
welding head in the location and press a button, as was identified by the work reported
by Rowe and Liu [18] in offering significant advantages, especially for deep wet welding.
Further work has also been conducted with the German welding equipment manufacture,
Mahe, where the Hammerhead system is currently available as a software package that
can be programmed into their 420 amp delta digital range of inverters. This has the
added commercial advantage of both welding power source and Hammerhead control
feature being one unit. This offers significant commercial advantages, allowing the
maximization of commercial opportunities without any of the associated manufacturing
costs. It should be understood, at least in the UK, most underwater welding is carried out
using diesel welding machines, although this is not the case in Holland/Belgium, where a
number of diving companies have expressed an interest in this technology, using the
Mahe 420 amp inverters.
Since winning the DTI SMART Award in November 2003 and completing the original trials
in Nov 2004, a total of six systems have been sold, four systems for use with diesel
welding machines, as detailed in this report and two Mahe 420 amp delta digital welding
machines. To date, well over 2000 anodes have been welded underwater using the
Hammerhead method, with significant cost savings and satisfactory weld quality
achieved. As part of the original SMART Award trials, wet spot welding materials up to a
combined thickness of 30.0mm in the flat, vertical and overhead positions, with both 3.2
and 4.0mm electrodes had to be investigated. Although not part of this submission, these
results have shown similar outcomes as outlined in this work. Although, it became clear
welding in the overhead position was unlikely to be successful with the sizes of
electrodes used, as liquid weld material simply poured out of the joint. Despite this
shortcoming the welding method has already provided a significant contribution to the
underwater industry, but more importantly, can perhaps provide an even bigger
contribution to the general main stream welding industries and the future looks very
promising for the Hammerhead spot welding process. The author has been successful in
TWI/Thesis/CEng/Hammerhead wet-spot welding/10.2007 Re-issued for publication 6.2017
30
obtaining a Patent for the Hammerhead wet-spot welding process; Patent Number
GB2397790 granted on 21st September 2005.
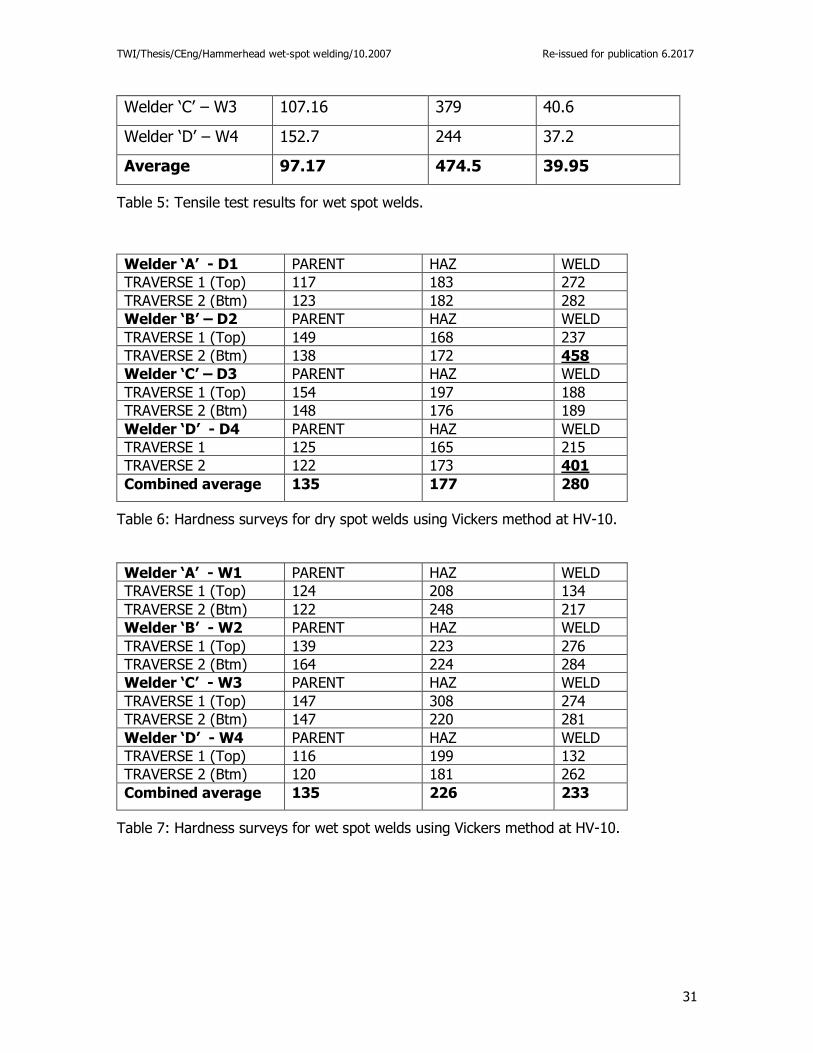
7: Tables
Element: C Si Mn P S
% (max) 0.2 0.55 1.6 0.035 0.035
Table 1: Composition of steel plates.
CEV 0.35
Table 2: Carbon equivalent value of steel.
Element Cr Ni C Mo Mn Si Nb
Min 21 11 0.020 3 0.60 0.70 -
Max 24 14 0.10 5 2 2 -
Table 3: Composition of Hammerhead electrodes.
Welder / weld # CSA of weld (mm2) UTS (MPa) Failure Load (kN)
Welder ‘A’ – D1 66.62 717 47.8
Welder ‘B’ – D2 78.07 587 45.9
Welder ‘C’ – D3 87.92 594 52.2
Welder ‘D’ – D4 112.36 326 36.6
Average 86.24 548.5 45.63
Table 4: Tensile test results for dry spot welds.
Welder / weld # CSA of weld (mm2) UTS (MPa) Failure Load (kN)
Welder ‘A’ – W1 63.20 668 42.2
Welder ‘B’ – W2 65.62 607 39.8
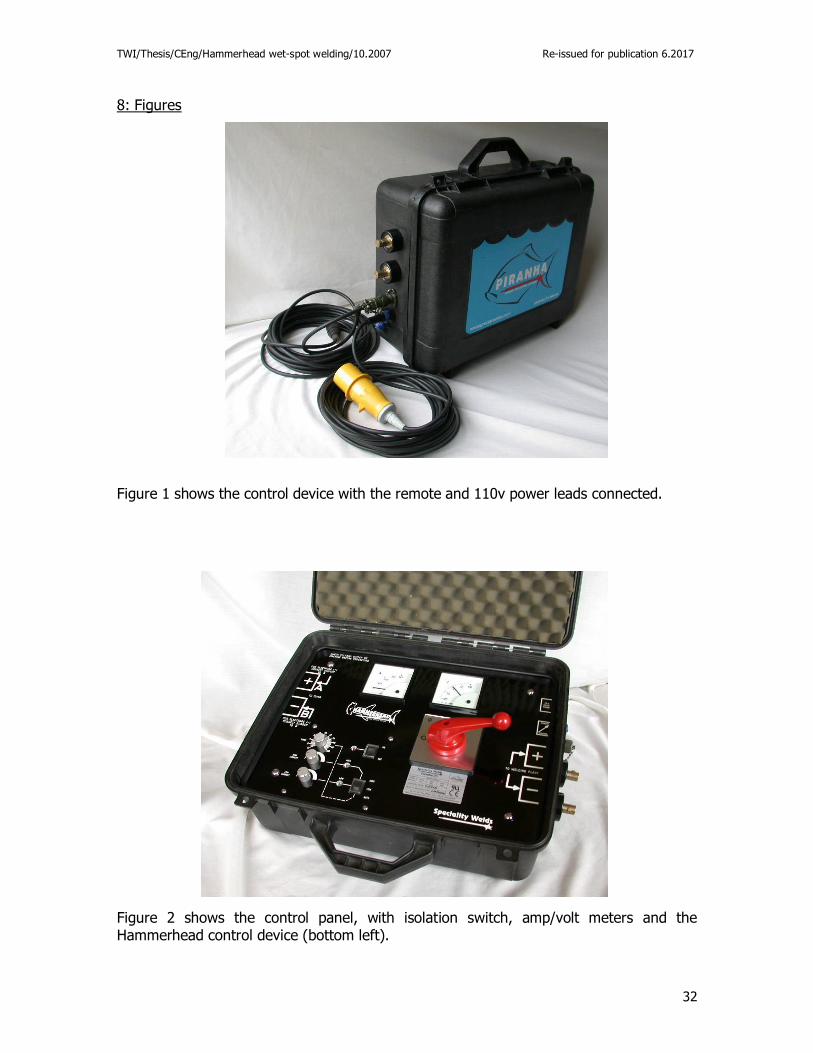
TWI/Thesis/CEng/Hammerhead wet-spot welding/10.2007 Re-issued for publication 6.2017
31
Welder ‘C’ – W3 107.16 379 40.6
Welder ‘D’ – W4 152.7 244 37.2
Average 97.17 474.5 39.95
Table 5: Tensile test results for wet spot welds.
Welder ‘A’ - D1 PARENT HAZ WELD
TRAVERSE 1 (Top) 117 183 272
TRAVERSE 2 (Btm) 123 182 282
Welder ‘B’ – D2 PARENT HAZ WELD
TRAVERSE 1 (Top) 149 168 237
TRAVERSE 2 (Btm) 138 172 458
Welder ‘C’ – D3 PARENT HAZ WELD
TRAVERSE 1 (Top) 154 197 188
TRAVERSE 2 (Btm) 148 176 189
Welder ‘D’ - D4 PARENT HAZ WELD
TRAVERSE 1 125 165 215
TRAVERSE 2 122 173 401
Combined average 135 177 280
Table 6: Hardness surveys for dry spot welds using Vickers method at HV-10.
Welder ‘A’ - W1 PARENT HAZ WELD
TRAVERSE 1 (Top) 124 208 134
TRAVERSE 2 (Btm) 122 248 217
Welder ‘B’ - W2 PARENT HAZ WELD
TRAVERSE 1 (Top) 139 223 276
TRAVERSE 2 (Btm) 164 224 284
Welder ‘C’ - W3 PARENT HAZ WELD
TRAVERSE 1 (Top) 147 308 274
TRAVERSE 2 (Btm) 147 220 281
Welder ‘D’ - W4 PARENT HAZ WELD
TRAVERSE 1 (Top) 116 199 132
TRAVERSE 2 (Btm) 120 181 262
Combined average 135 226 233
Table 7: Hardness surveys for wet spot welds using Vickers method at HV-10.
TWI/Thesis/CEng/Hammerhead wet-spot welding/10.2007 Re-issued for publication 6.2017
32
8: Figures
Figure 1 shows the control device with the remote and 110v power leads connected.
Figure 2 shows the control panel, with isolation switch, amp/volt meters and the Hammerhead control device (bottom left).
TWI/Thesis/CEng/Hammerhead wet-spot welding/10.2007 Re-issued for publication 6.2017
33
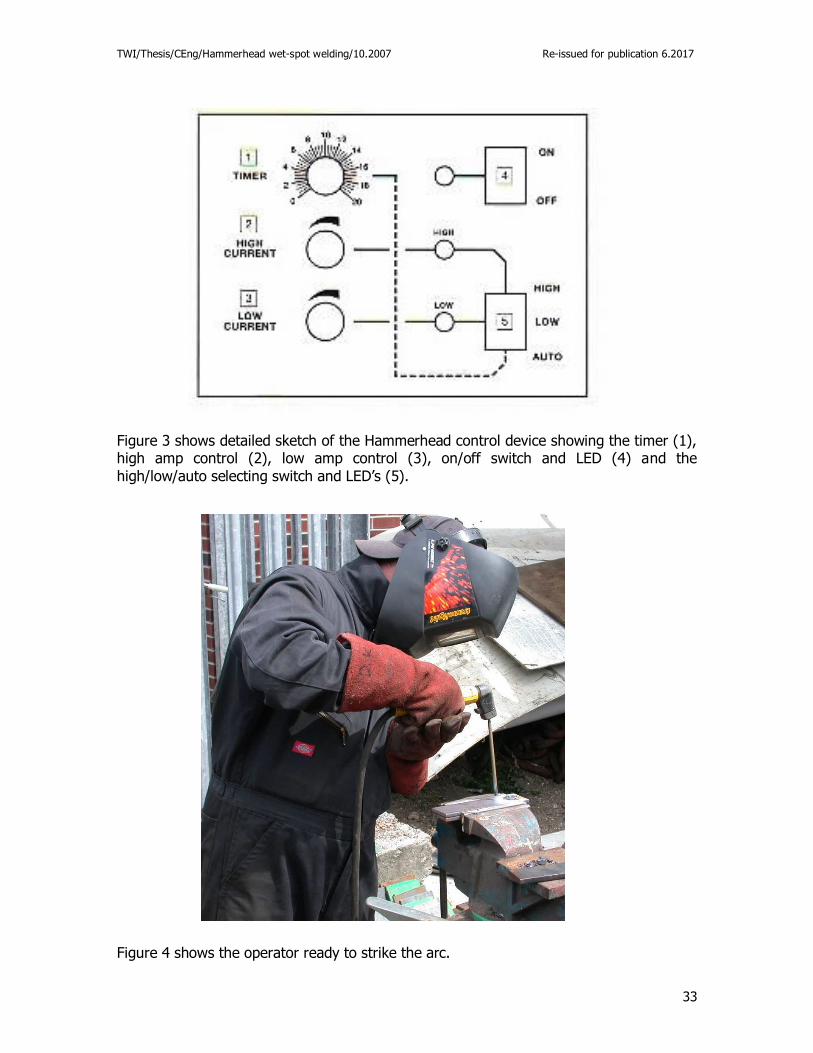
Figure 3 shows detailed sketch of the Hammerhead control device showing the timer (1), high amp control (2), low amp control (3), on/off switch and LED (4) and the
high/low/auto selecting switch and LED’s (5).
Figure 4 shows the operator ready to strike the arc.
TWI/Thesis/CEng/Hammerhead wet-spot welding/10.2007 Re-issued for publication 6.2017
34
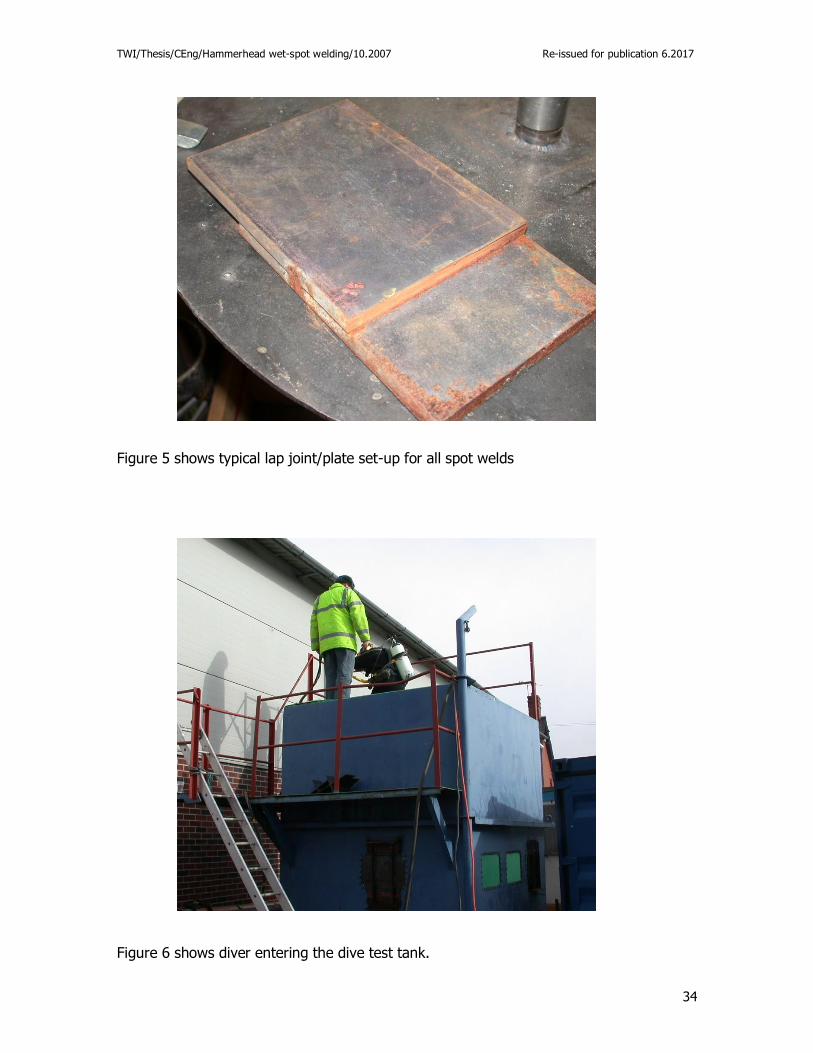
Figure 5 shows typical lap joint/plate set-up for all spot welds
Figure 6 shows diver entering the dive test tank.
TWI/Thesis/CEng/Hammerhead wet-spot welding/10.2007 Re-issued for publication 6.2017
35
Figure 7 shows maximum dilution possible without risk of martensite forming is 38.4%.
TWI/Thesis/CEng/Hammerhead wet-spot welding/10.2007 Re-issued for publication 6.2017
36
Wel
d S
tren
gth
Vs
Nu
mb
er o
f S
po
t W
eld
s
26.1
4
52.2
8
78.4
1
104.
55
130.
69
40.8
4
81.6
8
122.
52
163.
36
204.
20
58.8
1
117.
62
176.
43
235.
24
294.
05
0.00
50.0
0
100.
00
150.
00
200.
00
250.
00
300.
00
350.
00
12
34
5
Nu
mb
er o
f S
po
t W
eld
s
Des
ired
Jo
int
Str
eng
th
(kN
)
8mm
spo
t wel
d
10m
m s
pot w
eld
12m
m s
pot w
eld
Figure 8 shows the number of welds required against desired weld strength, based on the calculations discussed on page 17.
TWI/Thesis/CEng/Hammerhead wet-spot welding/10.2007 Re-issued for publication 6.2017
37
HA
MM
ER
HE
AD
SIN
GL
E W
ET
& D
RY
SP
OT
-WE
LD
S
42.2
39.8
40.6
37.2
39.9
5
47.8
45.9
52.2
36.6
45.6
0102030405060
63.2
65.6
210
7.16
152.
797
.866
.62
78.0
787
.92
112.
3611
1.7
AR
EA
mm
2
LOAD kN
Act
ual W
ET
wel
dsT
heor
etic
al a
vera
ge W
ET
wel
dA
ctua
l DR
Y w
elds
The
oret
ical
ave
rage
DR
Y w
eld
Figure 9 shows the results of the actual wet and dry spot welds produced and the results identified against the calculations discussed on pages 17.
TWI/Thesis/CEng/Hammerhead wet-spot welding/10.2007 Re-issued for publication 6.2017
38
Figure 10 shows dry spot weld ‘D1’ and heat blister conducted by welder ‘A’ .
Figure 11 shows wet spot weld ‘W1’ and heat blister conducted by welder ‘A’ .
TWI/Thesis/CEng/Hammerhead wet-spot welding/10.2007 Re-issued for publication 6.2017
39
Figure 12 shows dry spot weld ‘D2’ and heat blister conducted by welder ‘B’.
Figure 13 shows wet spot weld ‘W2’ and heat blister conducted by welder ‘B’.
TWI/Thesis/CEng/Hammerhead wet-spot welding/10.2007 Re-issued for publication 6.2017
40
Figure 14 shows dry spot weld ‘D3’ and heat blister conducted by welder ‘C’.
Figure 15 shows wet spot weld ‘W3’ and heat blister conducted by welder ‘C’.
TWI/Thesis/CEng/Hammerhead wet-spot welding/10.2007 Re-issued for publication 6.2017
41
Figure 16 shows dry spot weld ‘D4’ and heat blister conducted by welder ‘D’.
Figure 17 shows wet spot weld ‘W4’ and heat blister conducted by welder ‘D’.
TWI/Thesis/CEng/Hammerhead wet-spot welding/10.2007 Re-issued for publication 6.2017
42
Figure 18 shows macrophotograph for welds D1 (left) and W1 conducted by welder ‘A’
Figure 19 shows macrophotograph for welds D2 (left) and W2 conducted by welder ‘B’.
TWI/Thesis/CEng/Hammerhead wet-spot welding/10.2007 Re-issued for publication 6.2017
43
Figure 20 shows macrophotograph for welds D3 (left) and W3 conducted by welder ‘C’.
Figure 21 shows macrophotograph for welds D4 (left) and W4 conducted by welder ‘D’.
TWI/Thesis/CEng/Hammerhead wet-spot welding/10.2007 Re-issued for publication 6.2017
44
Figure 22 shows actual hardness survey for weld ‘D2’ (dry weld) conducted by welder ‘B’.
TWI/Thesis/CEng/Hammerhead wet-spot welding/10.2007 Re-issued for publication 6.2017
45
Figure 23 shows actual hardness survey for weld W3 (wet weld) conducted by welder ‘C’.
TWI/Thesis/CEng/Hammerhead wet-spot welding/10.2007 Re-issued for publication 6.2017
46
15% Cr
14% Cr
13% Cr
12% Cr
11% Cr
10% Cr
9% Cr
8% Cr
7% Cr
6% Cr
5% Cr
Figure 24 quantitative map plotted for Cr in weld D2.
Figure 25 quantitative map plotted for Ni.
8.0 % Ni
7.5 % Ni
7.0 % Ni
6.5 % Ni 6.0 % Ni
5.5 % Ni
5.0 % Ni
4.5 % Ni
4.0 % Ni
3.5 % Ni
3.0 % Ni
TWI/Thesis/CEng/Hammerhead wet-spot welding/10.2007 Re-issued for publication 6.2017
47
2.5% Mo
2.3% mo
2.1% Mo
1.9% Mo
1.7% Mo
1.5% Mo
1.3% Mo
1.1% Mo
0.9% Mo
0.7% Mo
Figure 26 quantitative map plotted for Mo.
TWI/Thesis/CEng/Hammerhead wet-spot welding/10.2007 Re-issued for publication 6.2017
48
Figures 27a shows weld macro of weld ‘D2’ (dry weld), conducted by welder ‘B’
Figure 27b shows parent material comprising predominantly ferrite and pearlite.
TWI/Thesis/CEng/Hammerhead wet-spot welding/10.2007 Re-issued for publication 6.2017
49
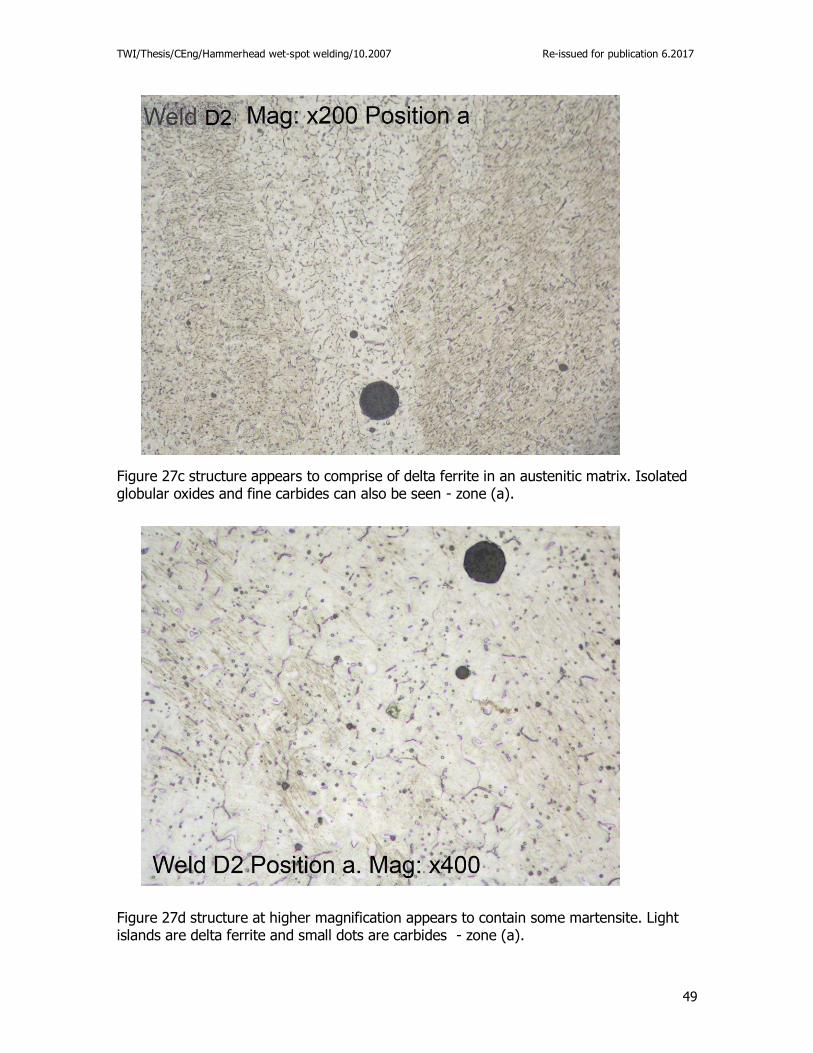
Figure 27c structure appears to comprise of delta ferrite in an austenitic matrix. Isolated globular oxides and fine carbides can also be seen - zone (a).
Figure 27d structure at higher magnification appears to contain some martensite. Light islands are delta ferrite and small dots are carbides - zone (a).
TWI/Thesis/CEng/Hammerhead wet-spot welding/10.2007 Re-issued for publication 6.2017
50
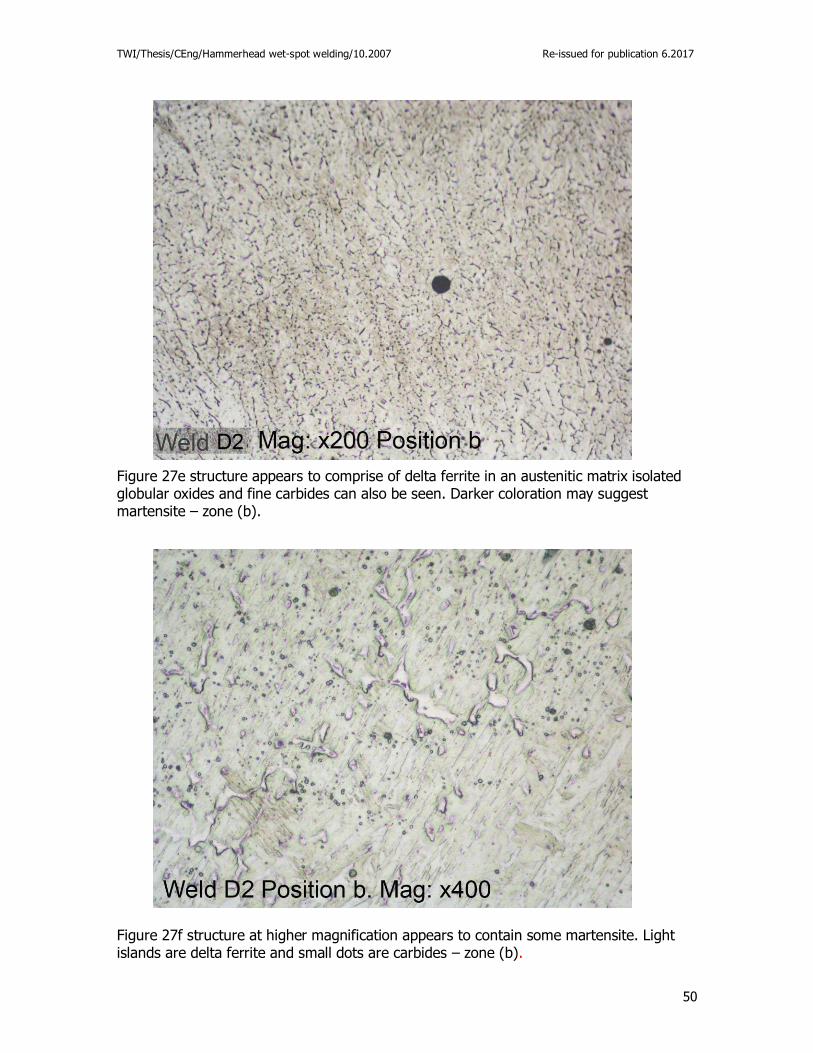
Figure 27e structure appears to comprise of delta ferrite in an austenitic matrix isolated globular oxides and fine carbides can also be seen. Darker coloration may suggest martensite – zone (b).
Figure 27f structure at higher magnification appears to contain some martensite. Light islands are delta ferrite and small dots are carbides – zone (b).
TWI/Thesis/CEng/Hammerhead wet-spot welding/10.2007 Re-issued for publication 6.2017
51
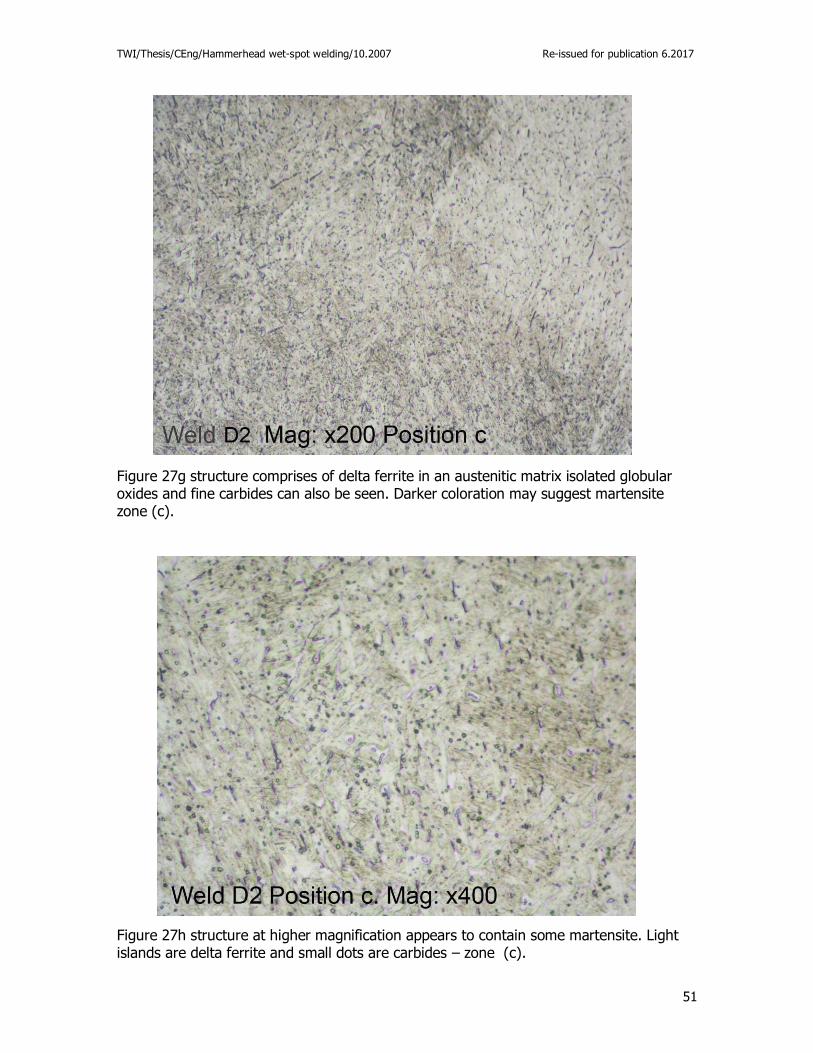
Figure 27g structure comprises of delta ferrite in an austenitic matrix isolated globular oxides and fine carbides can also be seen. Darker coloration may suggest martensite zone (c).
Figure 27h structure at higher magnification appears to contain some martensite. Light islands are delta ferrite and small dots are carbides – zone (c).
TWI/Thesis/CEng/Hammerhead wet-spot welding/10.2007 Re-issued for publication 6.2017
52
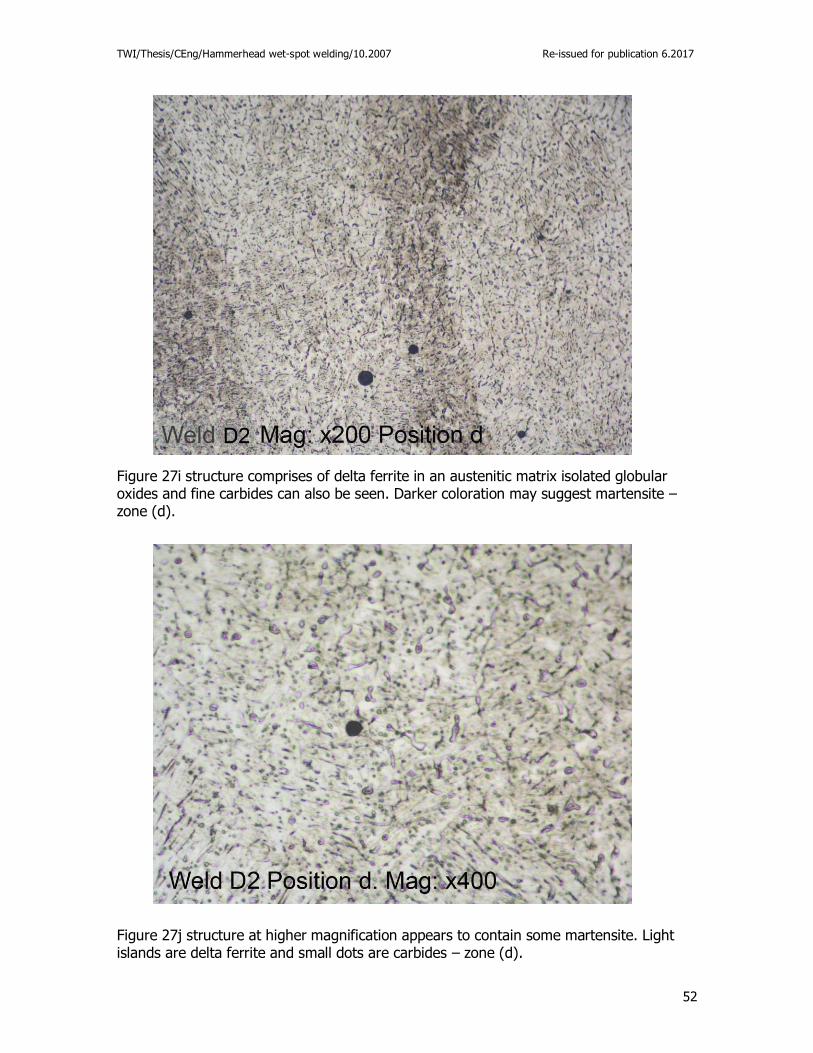
Figure 27i structure comprises of delta ferrite in an austenitic matrix isolated globular oxides and fine carbides can also be seen. Darker coloration may suggest martensite – zone (d).
Figure 27j structure at higher magnification appears to contain some martensite. Light islands are delta ferrite and small dots are carbides – zone (d).
TWI/Thesis/CEng/Hammerhead wet-spot welding/10.2007 Re-issued for publication 6.2017
53
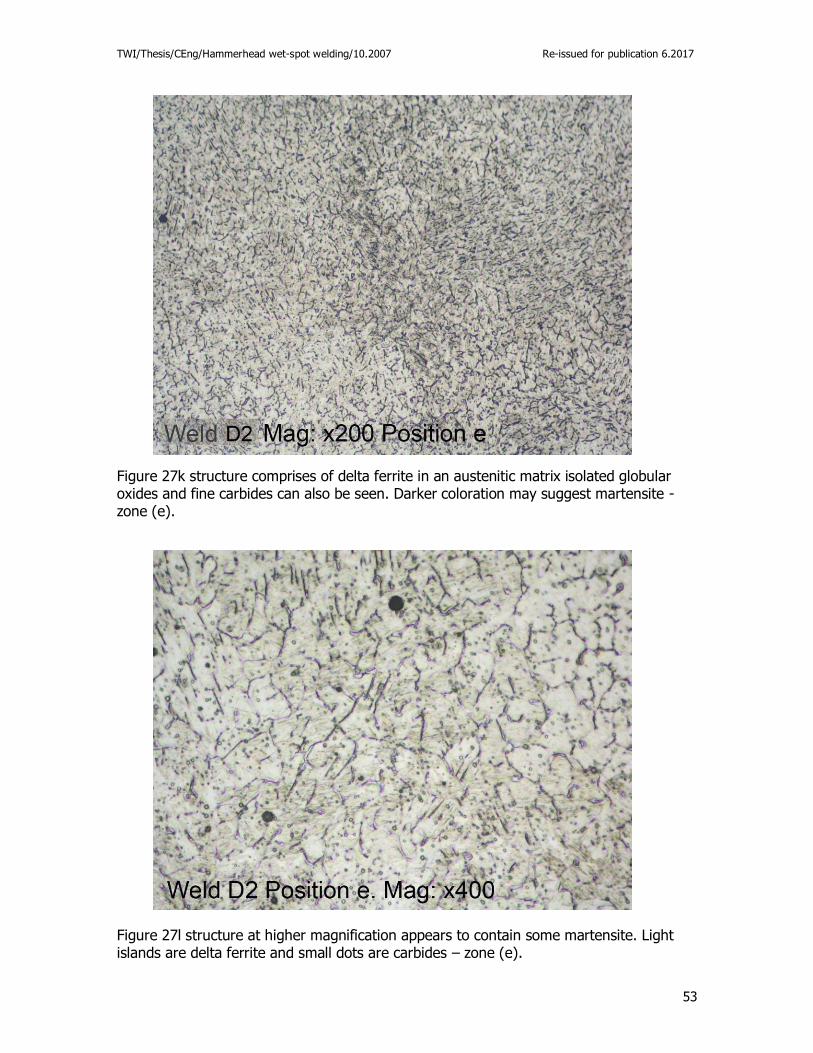
Figure 27k structure comprises of delta ferrite in an austenitic matrix isolated globular oxides and fine carbides can also be seen. Darker coloration may suggest martensite - zone (e).
Figure 27l structure at higher magnification appears to contain some martensite. Light islands are delta ferrite and small dots are carbides – zone (e).
TWI/Thesis/CEng/Hammerhead wet-spot welding/10.2007 Re-issued for publication 6.2017
54
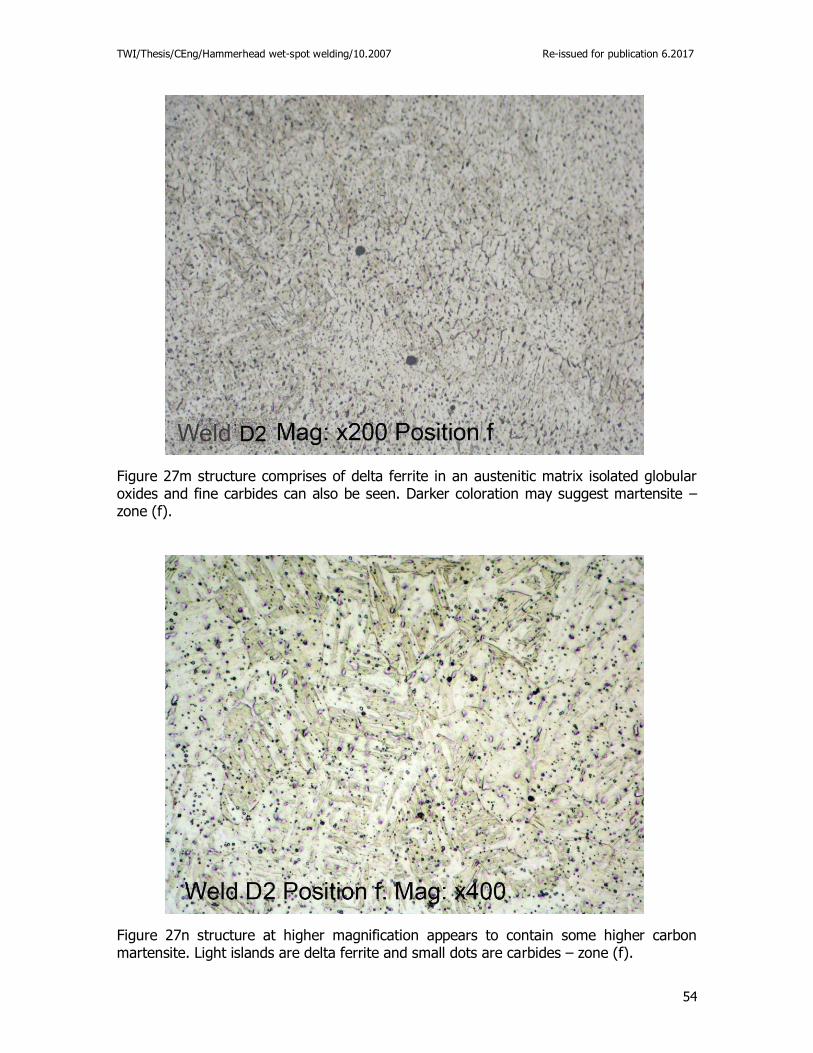
Figure 27m structure comprises of delta ferrite in an austenitic matrix isolated globular oxides and fine carbides can also be seen. Darker coloration may suggest martensite – zone (f).
Figure 27n structure at higher magnification appears to contain some higher carbon martensite. Light islands are delta ferrite and small dots are carbides – zone (f).
TWI/Thesis/CEng/Hammerhead wet-spot welding/10.2007 Re-issued for publication 6.2017
55
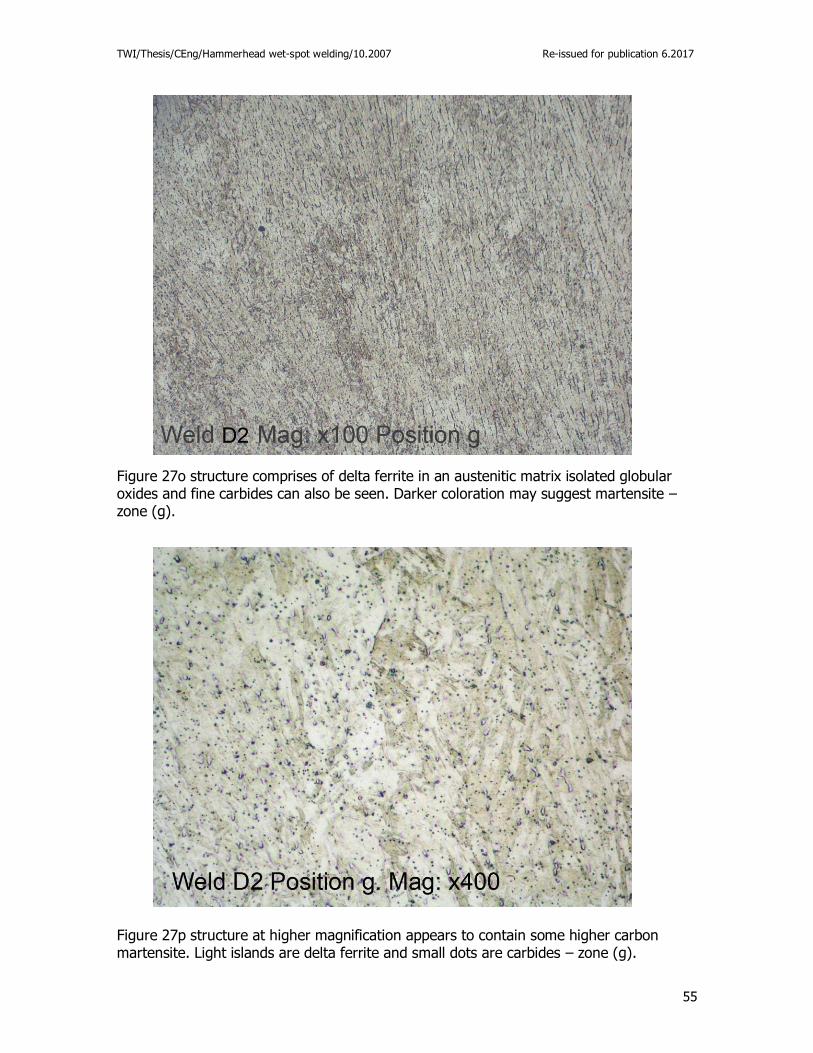
Figure 27o structure comprises of delta ferrite in an austenitic matrix isolated globular oxides and fine carbides can also be seen. Darker coloration may suggest martensite – zone (g).
Figure 27p structure at higher magnification appears to contain some higher carbon martensite. Light islands are delta ferrite and small dots are carbides – zone (g).
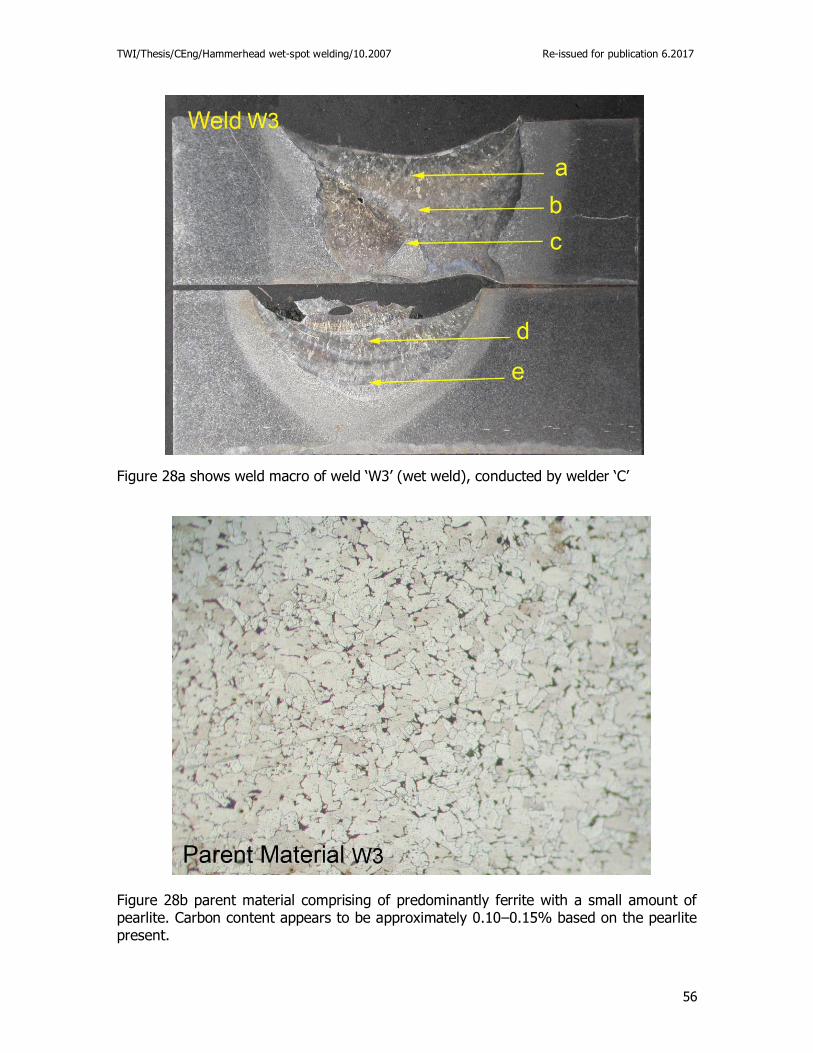
TWI/Thesis/CEng/Hammerhead wet-spot welding/10.2007 Re-issued for publication 6.2017
56
Figure 28a shows weld macro of weld ‘W3’ (wet weld), conducted by welder ‘C’
Figure 28b parent material comprising of predominantly ferrite with a small amount of pearlite. Carbon content appears to be approximately 0.10–0.15% based on the pearlite present.
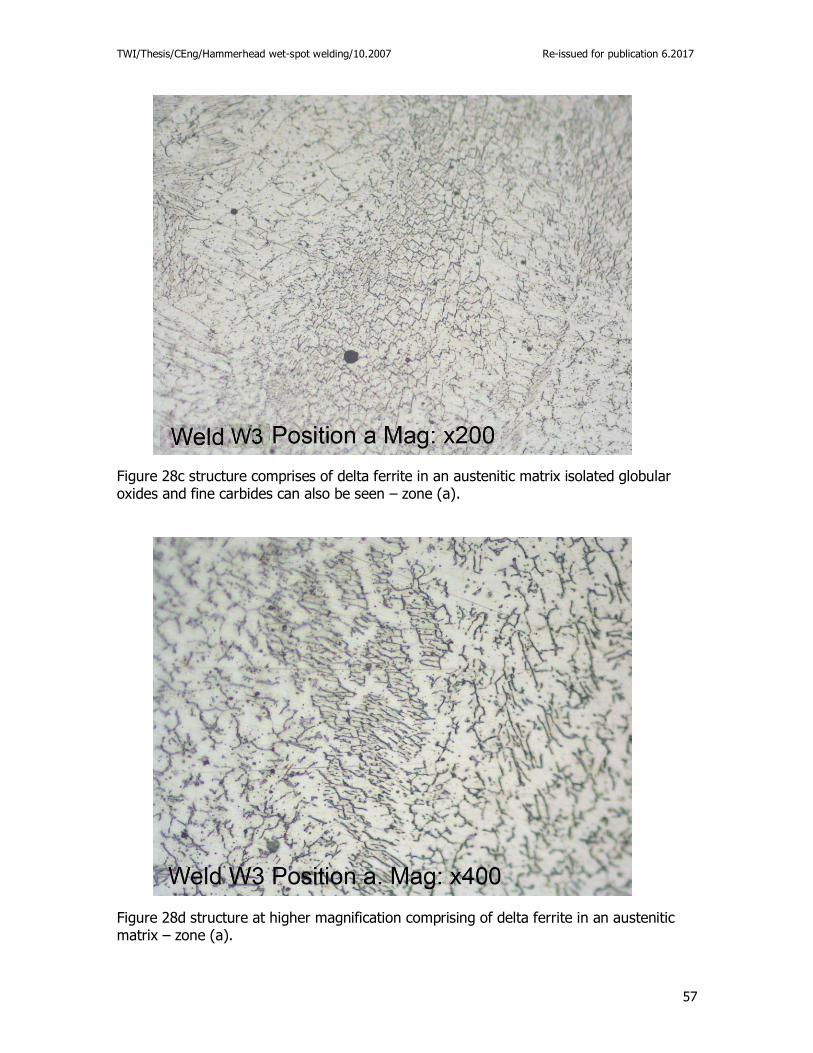
TWI/Thesis/CEng/Hammerhead wet-spot welding/10.2007 Re-issued for publication 6.2017
57
Figure 28c structure comprises of delta ferrite in an austenitic matrix isolated globular oxides and fine carbides can also be seen – zone (a).
Figure 28d structure at higher magnification comprising of delta ferrite in an austenitic matrix – zone (a).
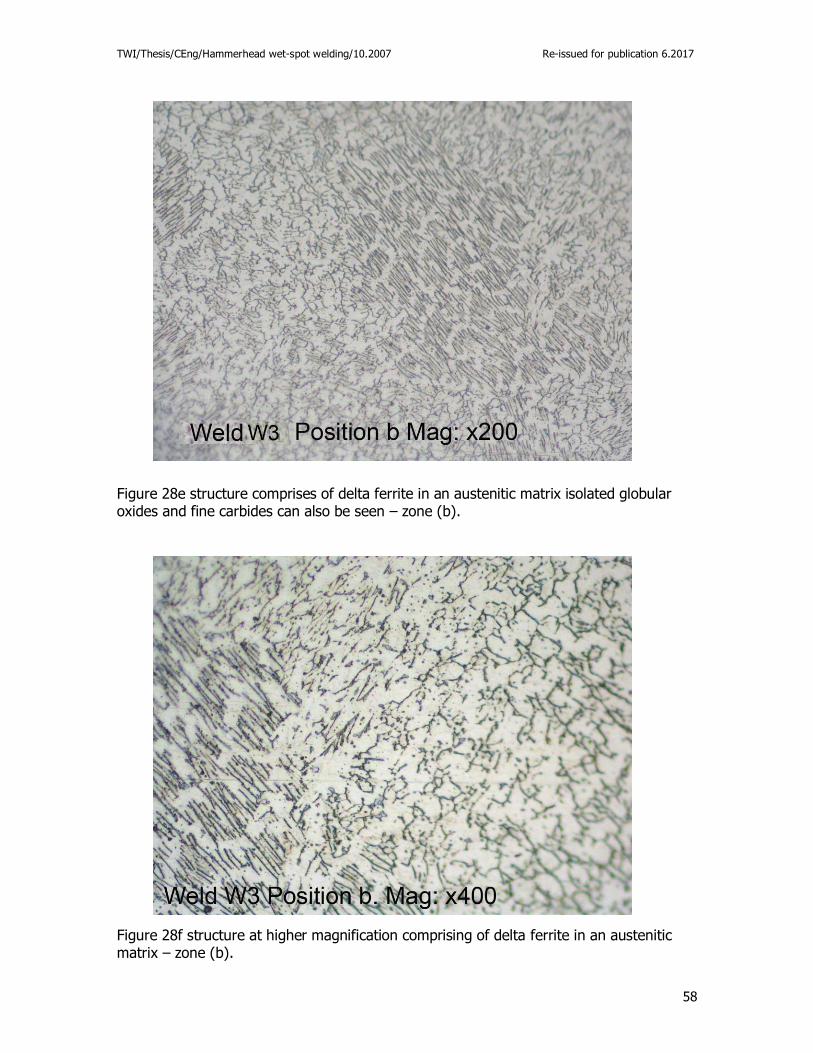
TWI/Thesis/CEng/Hammerhead wet-spot welding/10.2007 Re-issued for publication 6.2017
58
Figure 28e structure comprises of delta ferrite in an austenitic matrix isolated globular oxides and fine carbides can also be seen – zone (b).
Figure 28f structure at higher magnification comprising of delta ferrite in an austenitic matrix – zone (b).
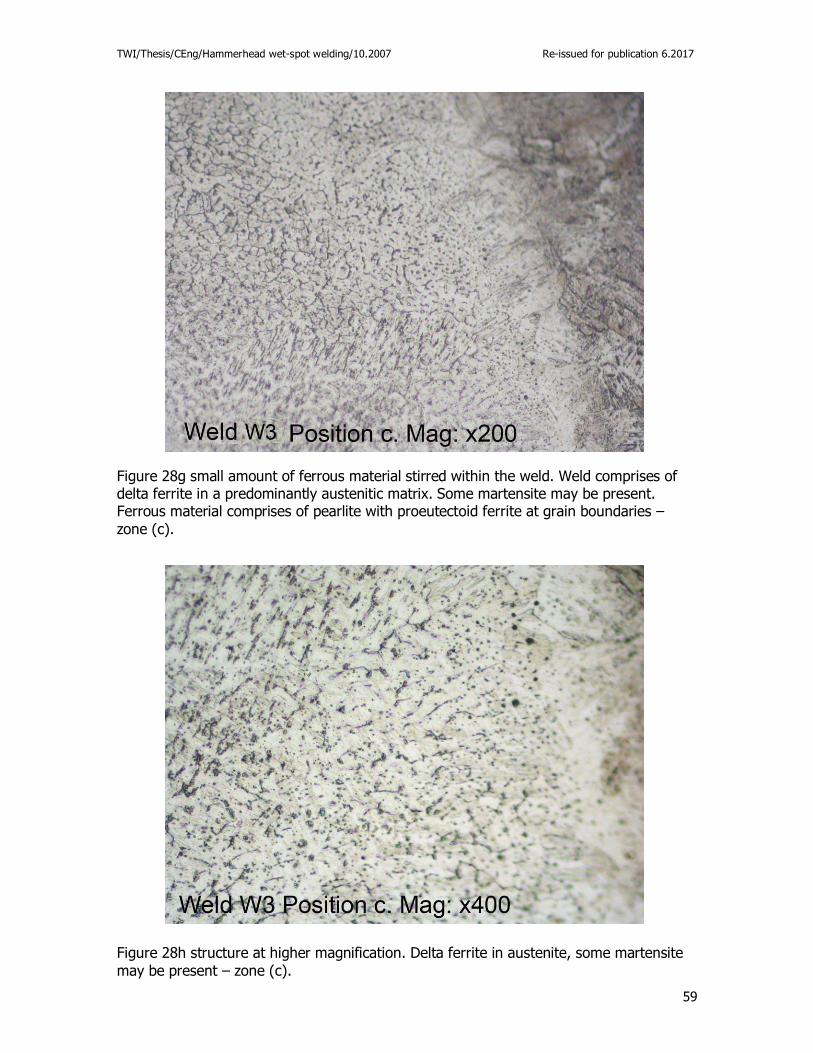
TWI/Thesis/CEng/Hammerhead wet-spot welding/10.2007 Re-issued for publication 6.2017
59
Figure 28g small amount of ferrous material stirred within the weld. Weld comprises of delta ferrite in a predominantly austenitic matrix. Some martensite may be present. Ferrous material comprises of pearlite with proeutectoid ferrite at grain boundaries –
zone (c).
Figure 28h structure at higher magnification. Delta ferrite in austenite, some martensite
may be present – zone (c).
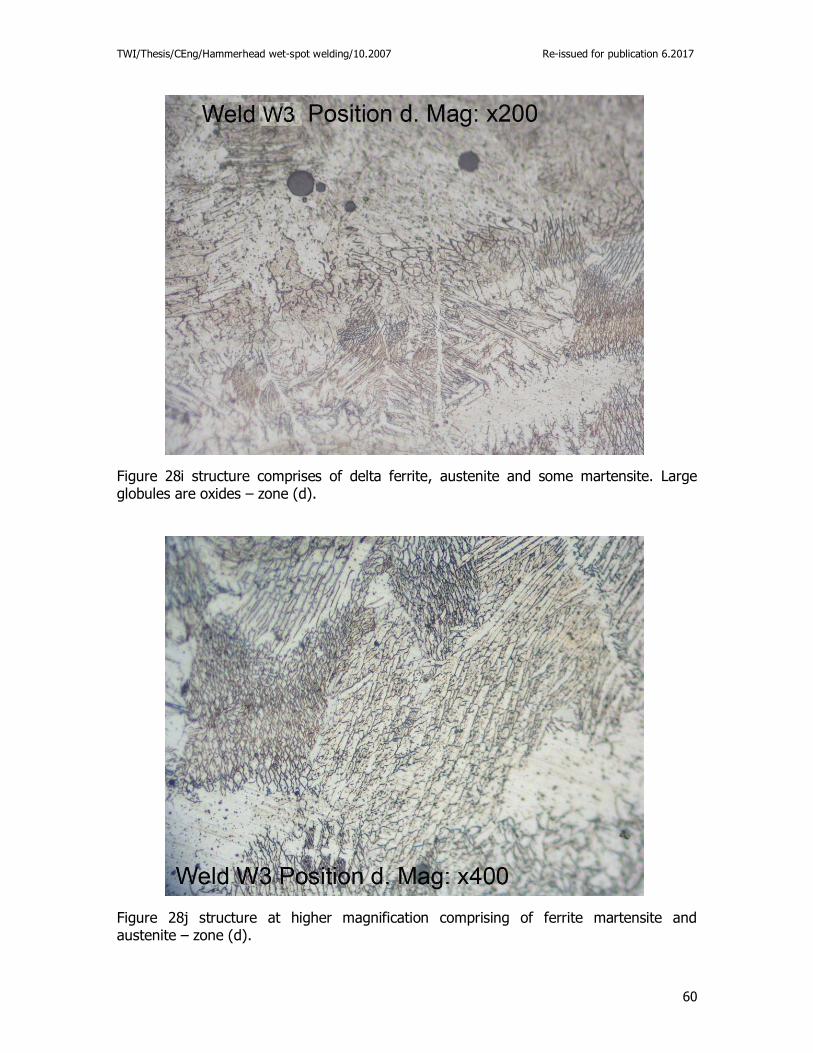
TWI/Thesis/CEng/Hammerhead wet-spot welding/10.2007 Re-issued for publication 6.2017
60
Figure 28i structure comprises of delta ferrite, austenite and some martensite. Large globules are oxides – zone (d).
Figure 28j structure at higher magnification comprising of ferrite martensite and austenite – zone (d).
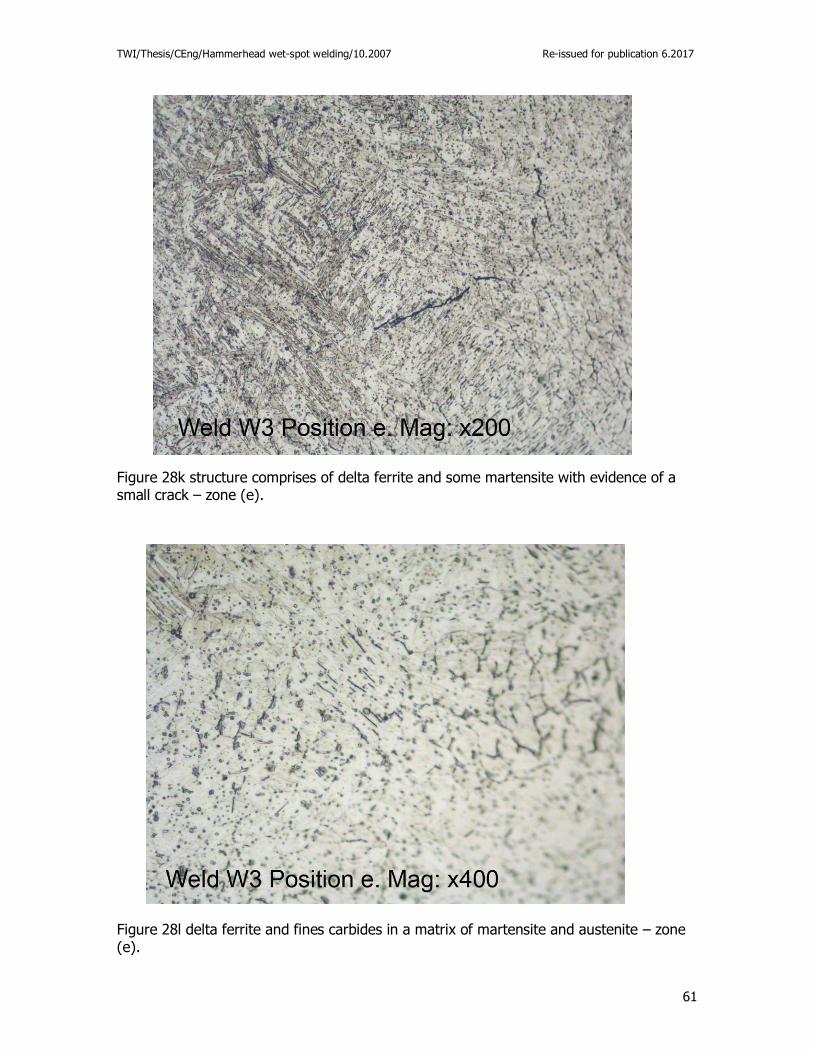
TWI/Thesis/CEng/Hammerhead wet-spot welding/10.2007 Re-issued for publication 6.2017
61
Figure 28k structure comprises of delta ferrite and some martensite with evidence of a small crack – zone (e).
Figure 28l delta ferrite and fines carbides in a matrix of martensite and austenite – zone (e).
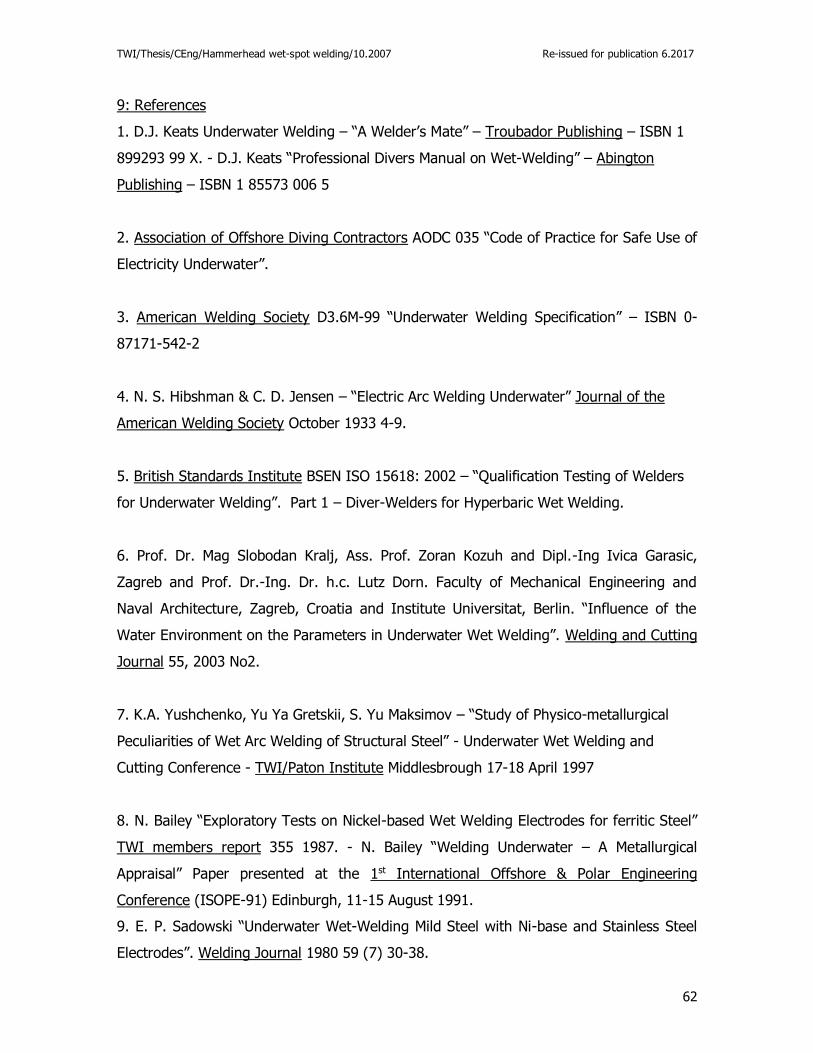
TWI/Thesis/CEng/Hammerhead wet-spot welding/10.2007 Re-issued for publication 6.2017
62
9: References
1. D.J. Keats Underwater Welding – “A Welder’s Mate” – Troubador Publishing – ISBN 1
899293 99 X. - D.J. Keats “Professional Divers Manual on Wet-Welding” – Abington
Publishing – ISBN 1 85573 006 5
2. Association of Offshore Diving Contractors AODC 035 “Code of Practice for Safe Use of
Electricity Underwater”.
3. American Welding Society D3.6M-99 “Underwater Welding Specification” – ISBN 0-
87171-542-2
4. N. S. Hibshman & C. D. Jensen – “Electric Arc Welding Underwater” Journal of the
American Welding Society October 1933 4-9.
5. British Standards Institute BSEN ISO 15618: 2002 – “Qualification Testing of Welders
for Underwater Welding”. Part 1 – Diver-Welders for Hyperbaric Wet Welding.
6. Prof. Dr. Mag Slobodan Kralj, Ass. Prof. Zoran Kozuh and Dipl.-Ing Ivica Garasic,
Zagreb and Prof. Dr.-Ing. Dr. h.c. Lutz Dorn. Faculty of Mechanical Engineering and
Naval Architecture, Zagreb, Croatia and Institute Universitat, Berlin. “Influence of the
Water Environment on the Parameters in Underwater Wet Welding”. Welding and Cutting
Journal 55, 2003 No2.
7. K.A. Yushchenko, Yu Ya Gretskii, S. Yu Maksimov – “Study of Physico-metallurgical
Peculiarities of Wet Arc Welding of Structural Steel” - Underwater Wet Welding and
Cutting Conference - TWI/Paton Institute Middlesbrough 17-18 April 1997
8. N. Bailey “Exploratory Tests on Nickel-based Wet Welding Electrodes for ferritic Steel”
TWI members report 355 1987. - N. Bailey “Welding Underwater – A Metallurgical
Appraisal” Paper presented at the 1st International Offshore & Polar Engineering
Conference (ISOPE-91) Edinburgh, 11-15 August 1991.
9. E. P. Sadowski “Underwater Wet-Welding Mild Steel with Ni-base and Stainless Steel
Electrodes”. Welding Journal 1980 59 (7) 30-38.
TWI/Thesis/CEng/Hammerhead wet-spot welding/10.2007 Re-issued for publication 6.2017
63
10. T.G. Gooch “Properties of underwater welds” Metal Construction 1983 15 (3) 164-167
& (4) 206-215.
11. K. Masubuchi “Underwater Welding - Factors Affecting Welding Metallurgy”
Underwater Welding of Offshore Platforms and Pipelines 1981 (11) 81-98.
12. D J. Abson and M A. Cooper “Wet underwater welding trials with commercial MMA
electrodes” Proceedings, International Seminar and workshop 1998 Abington publishing
ISBN 1-85573-388-9 pp. 50-67.
13. T.C. West, G. Mitchell and E. Lindberg “Wet Welding Electrode Evaluation for Ship
Repair” Welding Journal 1990 69 (8) 46-56.
14. S. H. Van der Brink and G. W. Boltje Proceedings, Conference on “Underwater
Welding” 1983 Oxford, Pergamon Press.
15. P. Szelagowski “Underwater Welding” – Present State and development Trends
Welding and Cutting no 2, PP 7-11 1991 and Journal of Offshore Mechanics - Artic
Engineering. 1998 120 (8) 191-196.
16. C. E. Grubbs “Qualification of Underwater Wet Welding Procedures at Water depths
Down to 99M” Proceedings of the 16th Int’l Diving Symposium, Houstan Texas, Session 8,
Paper 1, 7pp 1986.
17. A.M. Thompson “Welding developments for Speciality Welds” Corus Research,
Development & Technology 2005 reference source no 115034
18. M. Rowe and S. Liu “Recent developments in Underwater Wet Welding” Science and
Technology of Welding Journal 2001 Vol 6 no 6 387-397
TWI/Thesis/CEng/Hammerhead wet-spot welding/10.2007 Re-issued for publication 6.2017
64
10: Acknowledgements
The author would like to express his gratitude and appreciation to the following
individuals and organizations for their assistance;
Northern Divers (Eng) Ltd for use of their diving facilities and personnel
Drew Maslin
John Sparrowe
Ian Macklam
Laspro - for their development of the Hammerhead electrode.
Corus - for use of their electron microscope to map welds as seen in this report and the
work presently being undertaken to further enhance this welding process.
Arc Electronics – design and development of PCB board
A special word of thanks to Dr. Bob Fenn for his kind assistance.
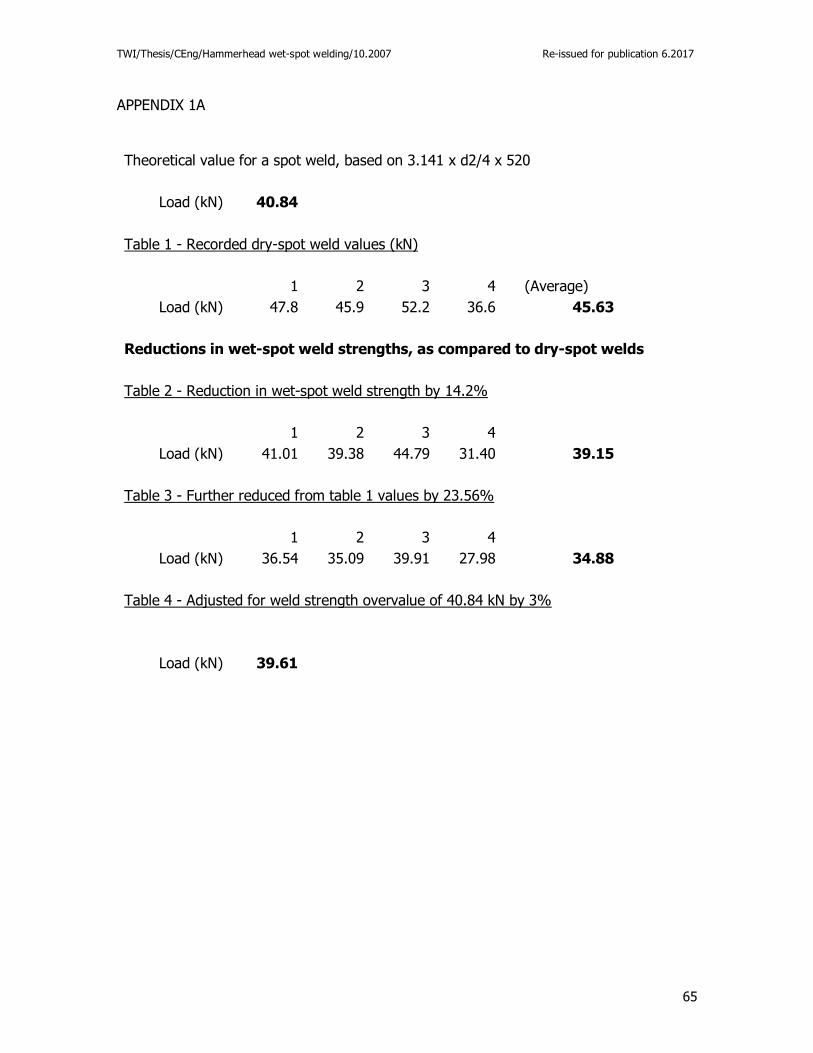
TWI/Thesis/CEng/Hammerhead wet-spot welding/10.2007 Re-issued for publication 6.2017
65
APPENDIX 1A
Theoretical value for a spot weld, based on 3.141 x d2/4 x 520
Load (kN) 40.84
Table 1 - Recorded dry-spot weld values (kN)
1 2 3 4
(Average) Load (kN) 47.8 45.9 52.2 36.6
45.63
Reductions in wet-spot weld strengths, as compared to dry-spot welds
Table 2 - Reduction in wet-spot weld strength by 14.2%
1 2 3 4
Load (kN) 41.01 39.38 44.79 31.40
39.15
Table 3 - Further reduced from table 1 values by 23.56%
1 2 3 4
Load (kN) 36.54 35.09 39.91 27.98
34.88
Table 4 - Adjusted for weld strength overvalue of 40.84 kN by 3%
Load (kN) 39.61
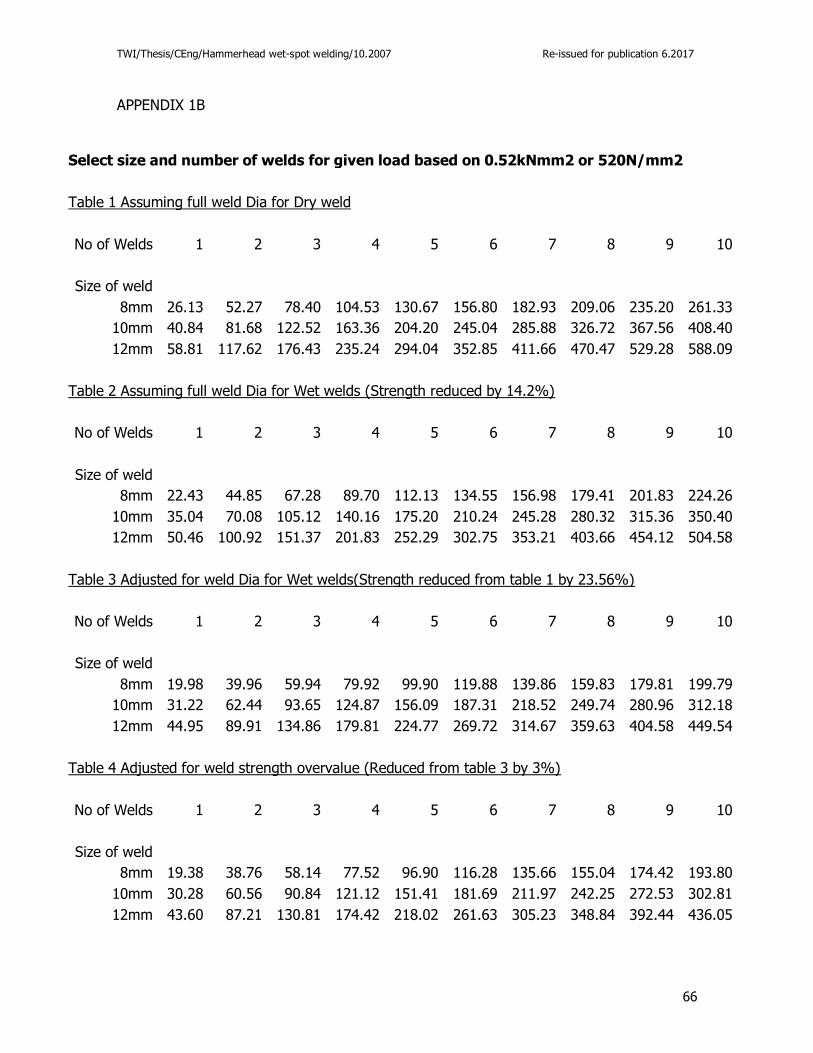
TWI/Thesis/CEng/Hammerhead wet-spot welding/10.2007 Re-issued for publication 6.2017
66
APPENDIX 1B
Select size and number of welds for given load based on 0.52kNmm2 or 520N/mm2
Table 1 Assuming full weld Dia for Dry weld
No of Welds 1 2 3 4 5 6 7 8 9 10
Size of weld 8mm 26.13 52.27 78.40 104.53 130.67 156.80 182.93 209.06 235.20 261.33
10mm 40.84 81.68 122.52 163.36 204.20 245.04 285.88 326.72 367.56 408.40
12mm 58.81 117.62 176.43 235.24 294.04 352.85 411.66 470.47 529.28 588.09
Table 2 Assuming full weld Dia for Wet welds (Strength reduced by 14.2%)
No of Welds 1 2 3 4 5 6 7 8 9 10
Size of weld 8mm 22.43 44.85 67.28 89.70 112.13 134.55 156.98 179.41 201.83 224.26
10mm 35.04 70.08 105.12 140.16 175.20 210.24 245.28 280.32 315.36 350.40
12mm 50.46 100.92 151.37 201.83 252.29 302.75 353.21 403.66 454.12 504.58
Table 3 Adjusted for weld Dia for Wet welds(Strength reduced from table 1 by 23.56%)
No of Welds 1 2 3 4 5 6 7 8 9 10
Size of weld 8mm 19.98 39.96 59.94 79.92 99.90 119.88 139.86 159.83 179.81 199.79
10mm 31.22 62.44 93.65 124.87 156.09 187.31 218.52 249.74 280.96 312.18
12mm 44.95 89.91 134.86 179.81 224.77 269.72 314.67 359.63 404.58 449.54
Table 4 Adjusted for weld strength overvalue (Reduced from table 3 by 3%)
No of Welds 1 2 3 4 5 6 7 8 9 10
Size of weld 8mm 19.38 38.76 58.14 77.52 96.90 116.28 135.66 155.04 174.42 193.80
10mm 30.28 60.56 90.84 121.12 151.41 181.69 211.97 242.25 272.53 302.81
12mm 43.60 87.21 130.81 174.42 218.02 261.63 305.23 348.84 392.44 436.05
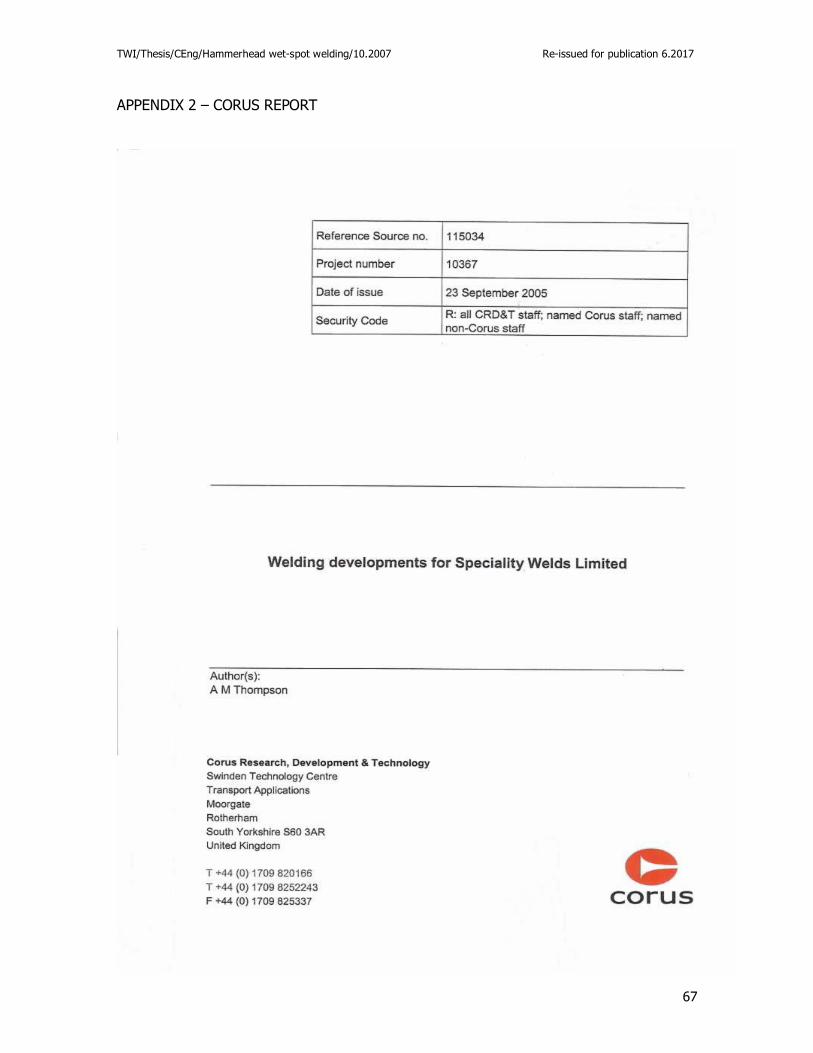
TWI/Thesis/CEng/Hammerhead wet-spot welding/10.2007 Re-issued for publication 6.2017
67
APPENDIX 2 – CORUS REPORT
TWI/Thesis/CEng/Hammerhead wet-spot welding/10.2007 Re-issued for publication 6.2017
68
TWI/Thesis/CEng/Hammerhead wet-spot welding/10.2007 Re-issued for publication 6.2017
69
TWI/Thesis/CEng/Hammerhead wet-spot welding/10.2007 Re-issued for publication 6.2017
70
TWI/Thesis/CEng/Hammerhead wet-spot welding/10.2007 Re-issued for publication 6.2017
71
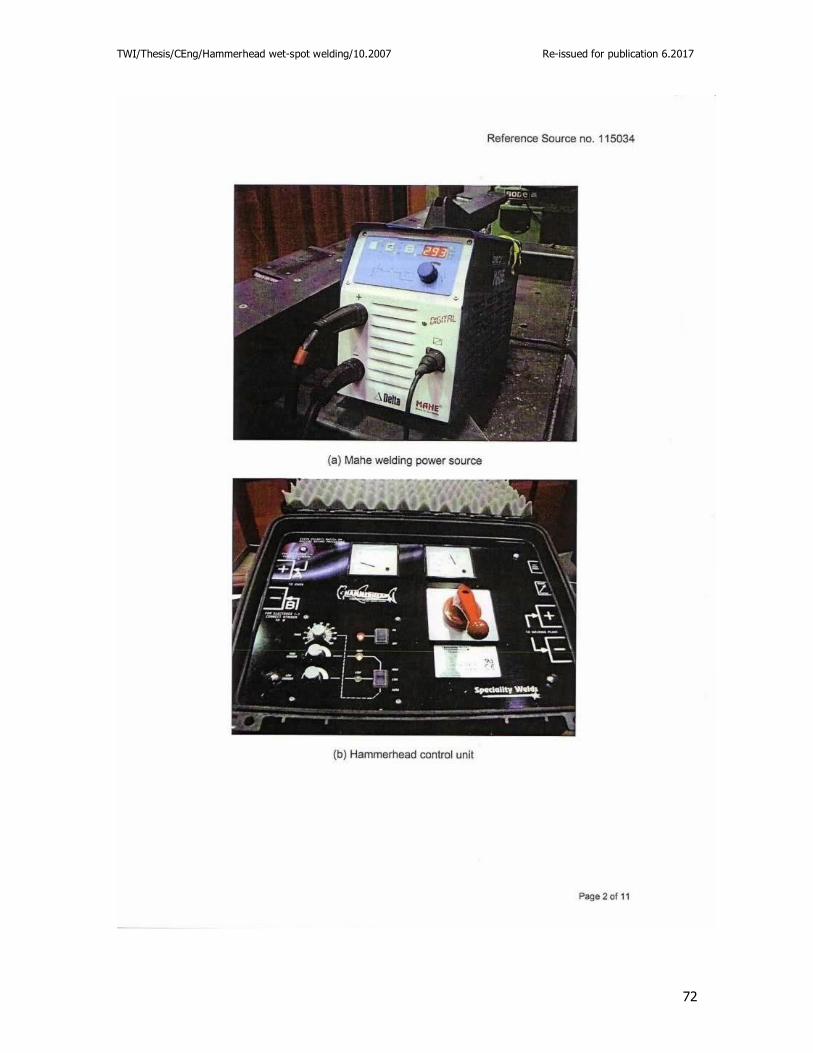
TWI/Thesis/CEng/Hammerhead wet-spot welding/10.2007 Re-issued for publication 6.2017
72
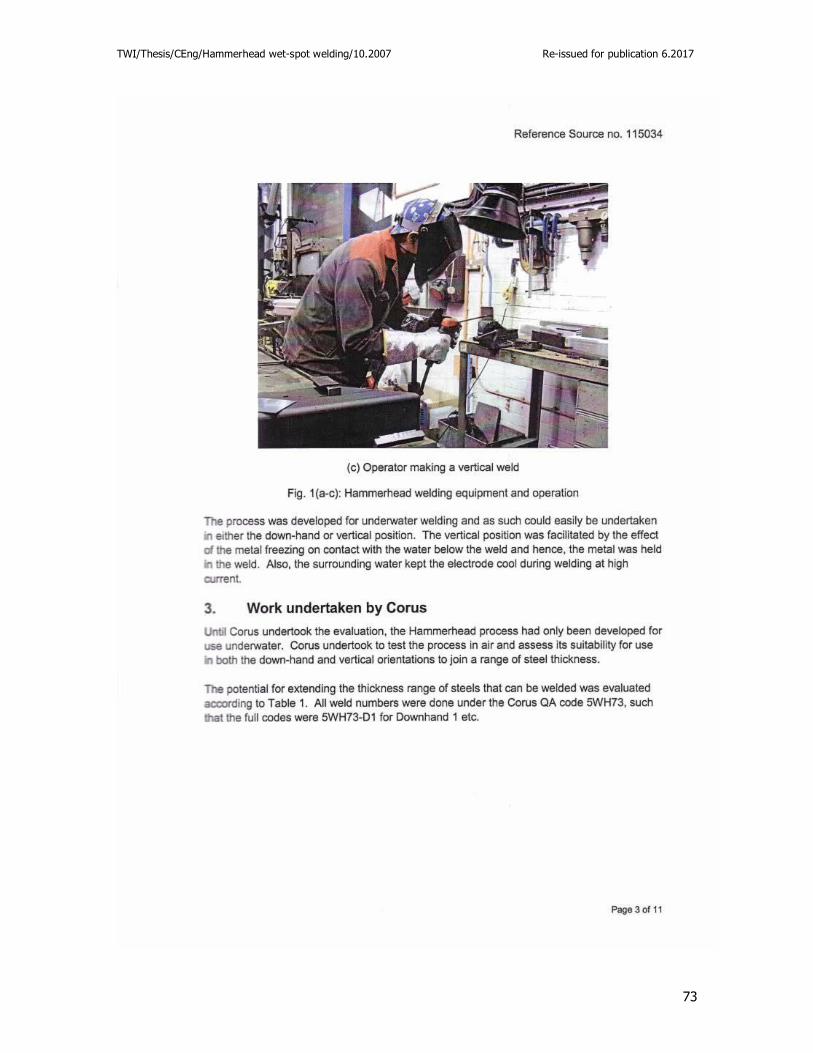
TWI/Thesis/CEng/Hammerhead wet-spot welding/10.2007 Re-issued for publication 6.2017
73
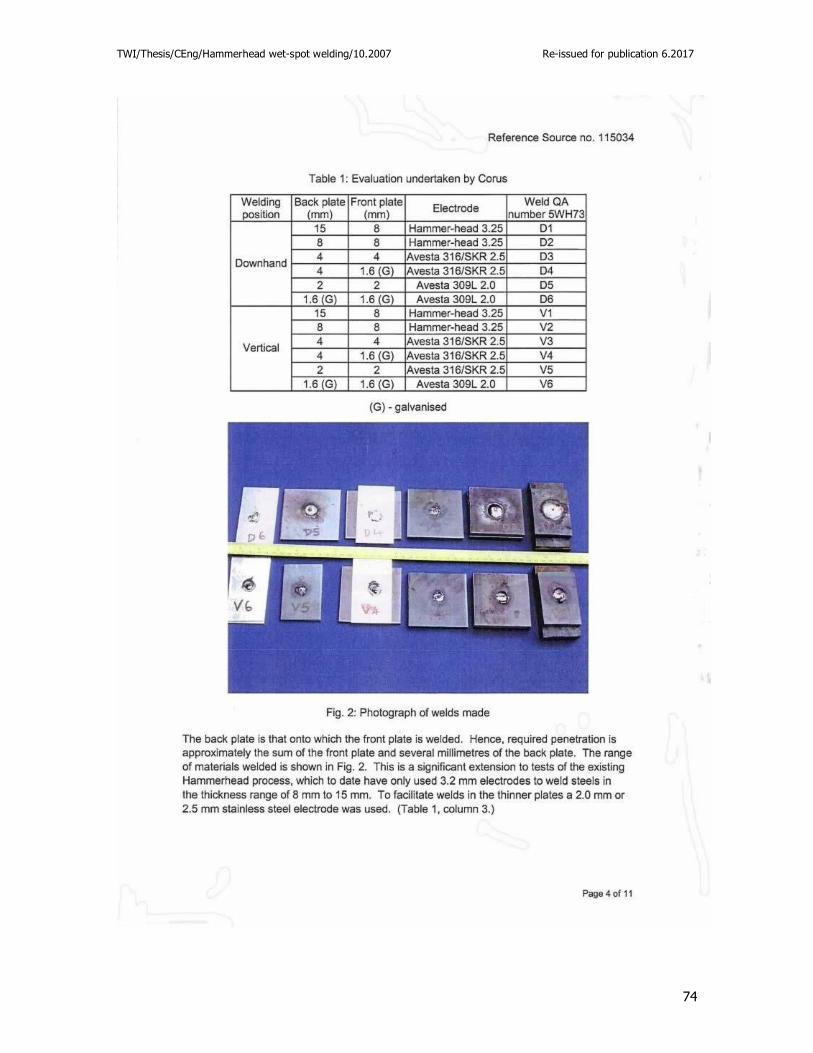
TWI/Thesis/CEng/Hammerhead wet-spot welding/10.2007 Re-issued for publication 6.2017
74
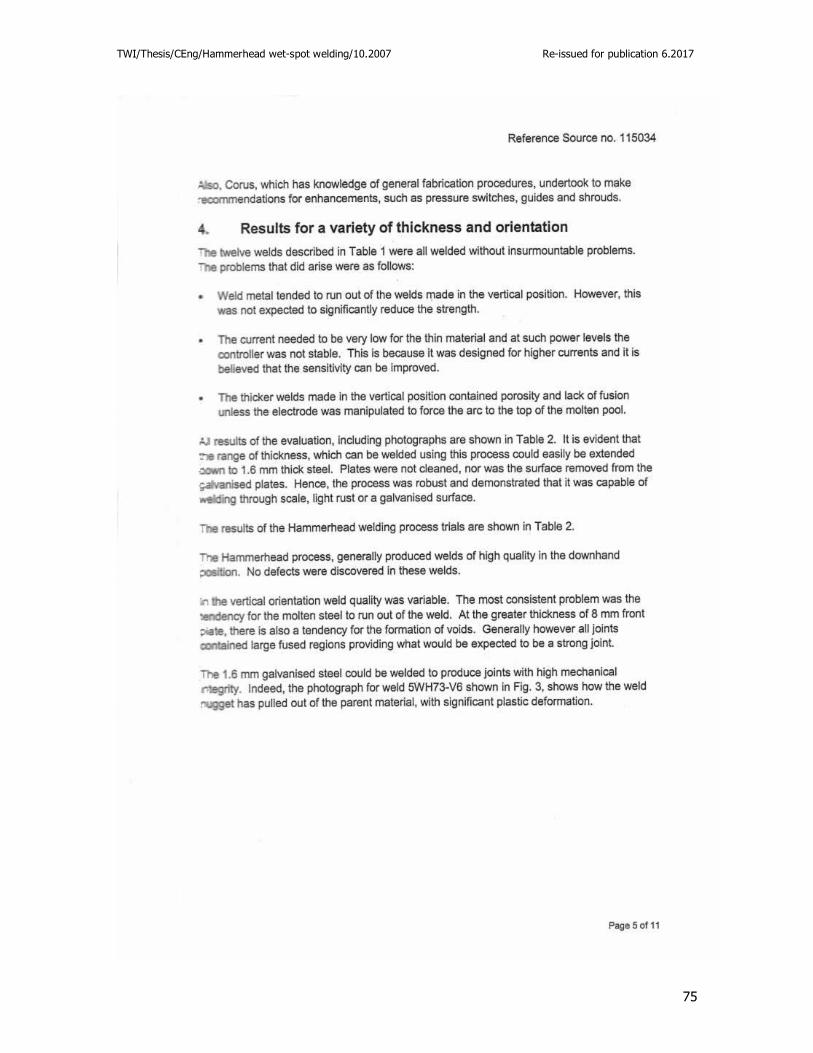
TWI/Thesis/CEng/Hammerhead wet-spot welding/10.2007 Re-issued for publication 6.2017
75
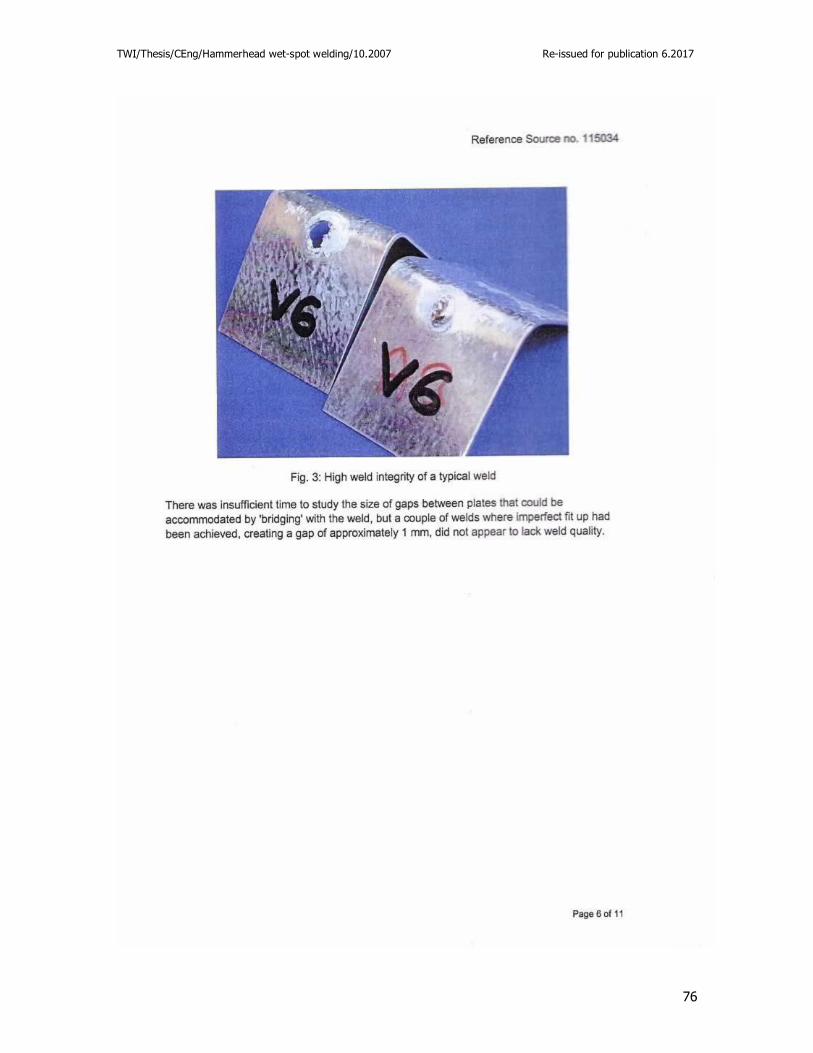
TWI/Thesis/CEng/Hammerhead wet-spot welding/10.2007 Re-issued for publication 6.2017
76
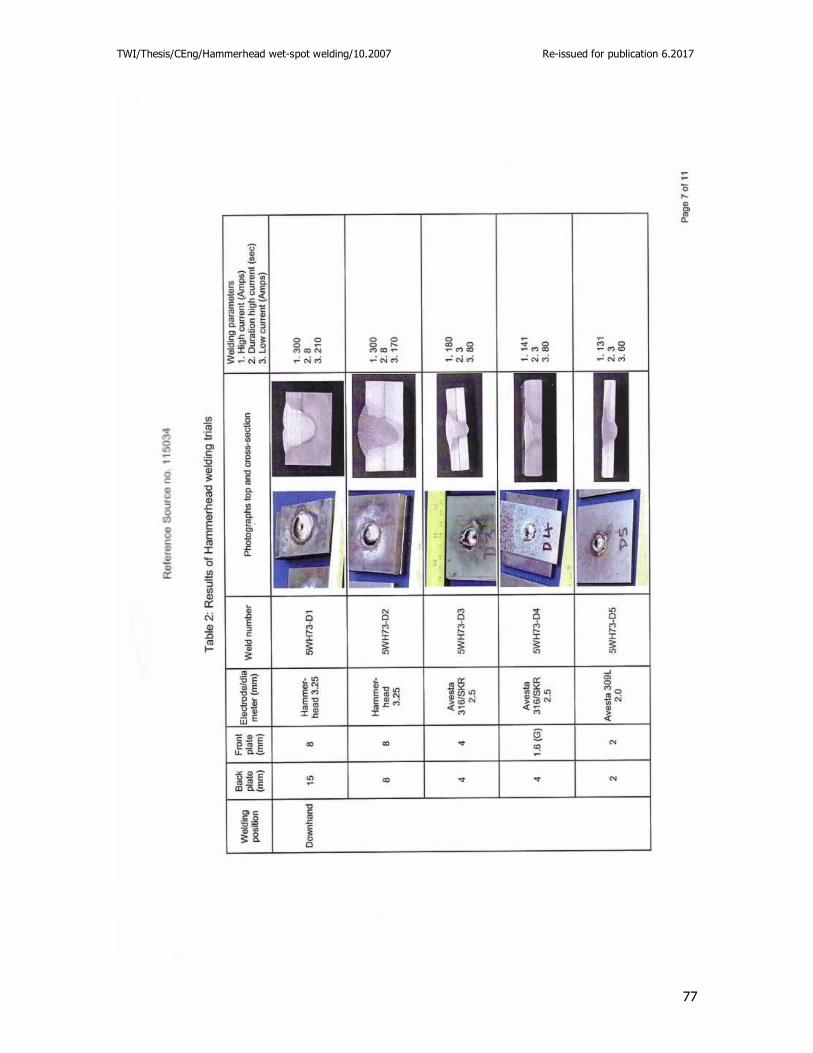
TWI/Thesis/CEng/Hammerhead wet-spot welding/10.2007 Re-issued for publication 6.2017
77
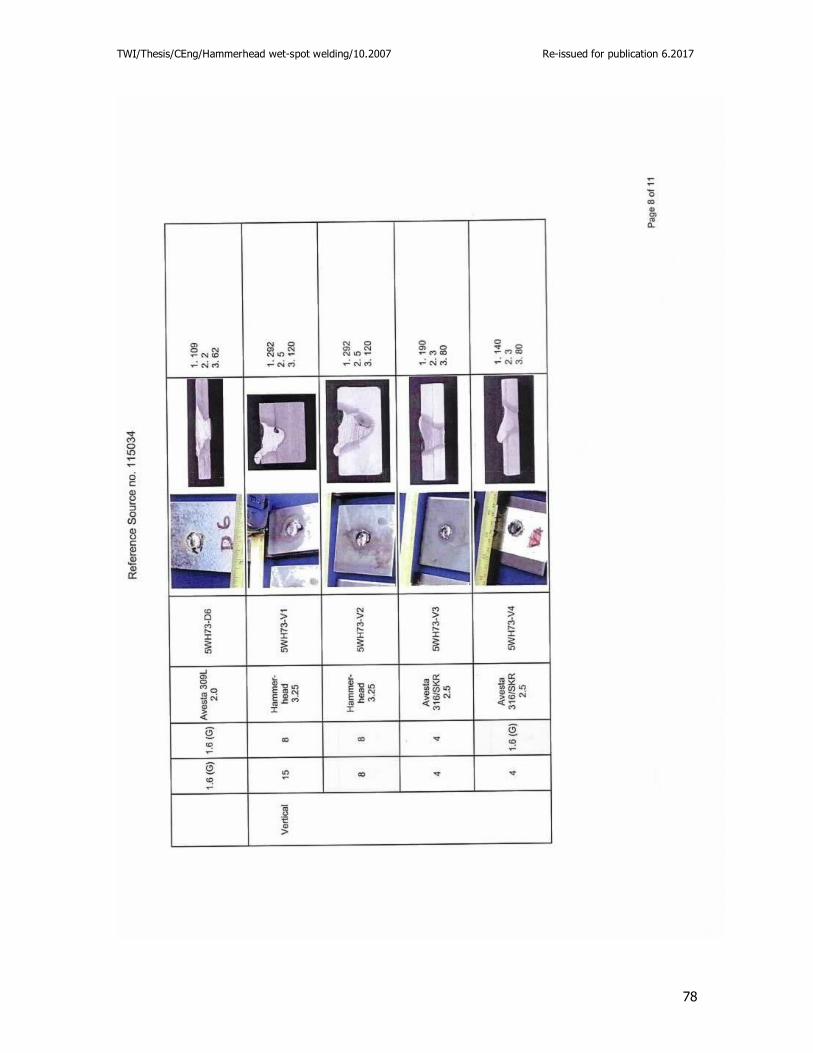
TWI/Thesis/CEng/Hammerhead wet-spot welding/10.2007 Re-issued for publication 6.2017
78
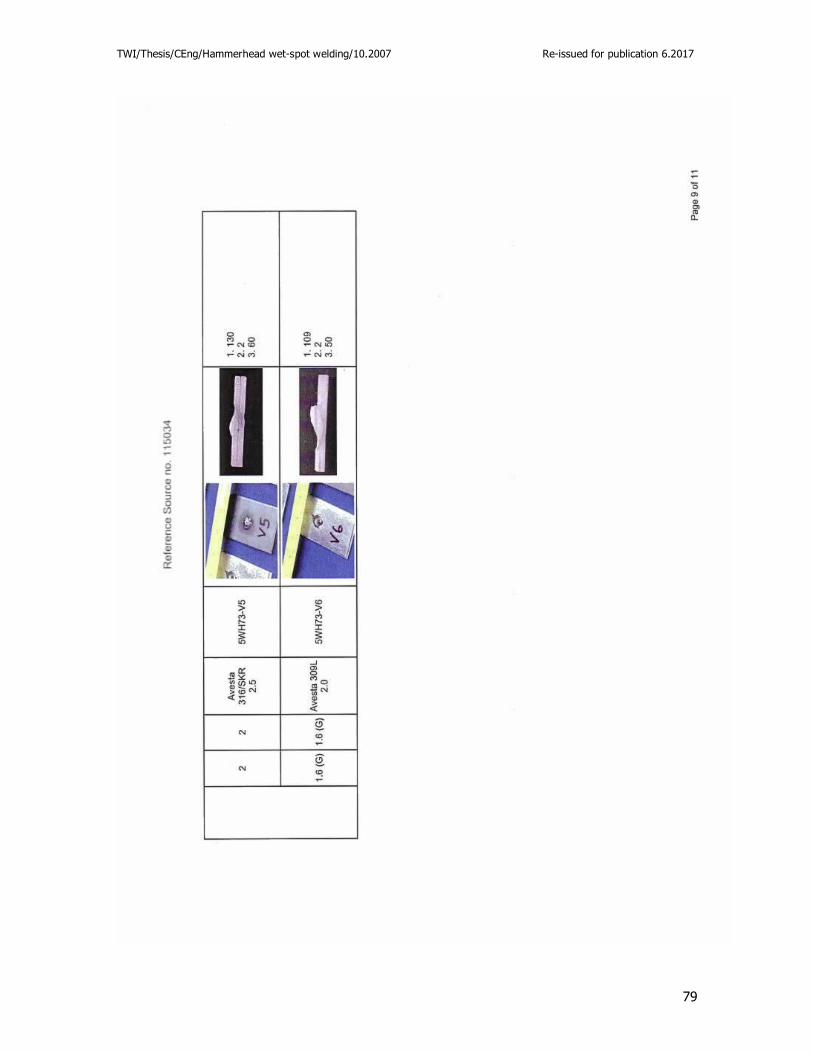
TWI/Thesis/CEng/Hammerhead wet-spot welding/10.2007 Re-issued for publication 6.2017
79
TWI/Thesis/CEng/Hammerhead wet-spot welding/10.2007 Re-issued for publication 6.2017
80
TWI/Thesis/CEng/Hammerhead wet-spot welding/10.2007 Re-issued for publication 6.2017
81