Embed Size (px)
Citation preview

In Support of Route 53/120:
Understanding the Transportation, Economic,
and Local Impacts of a Modern Roadway
Mary Craighead, AICP
April 20, 2017
i
EXECUTIVE SUMMARY The proposed Route 53/120 extension project will bring jobs to Lake County and improve overall transportation movements for residents by alleviating traffic congestion. These improvements will make Lake County more attractive to prospective businesses, which, combined with immediate construction jobs, will provide significant economic benefits. While the project has been surrounded by the controversy of dividing existing communities and imposing added costs onto Lake County residents, construction of the Route 53/120 extension will actually provide a net benefit to the local economy and improve the quality of life for Lake County residents. Planning Process The prospect of extending IL Route 53 into Lake County has been a part of transportation planning in the Chicago region since the 1960s. Route 53 currently stands as a six-mile controlled access highway extension of Interstate 290 between its termination and Lake Cook Road, just south of Lake County. The project is currently proposed as a 12.5-mile extension north to Route 120. In addition, the project will expand and potentially realign portions of Route 120 between Interstate 94 and U.S. Highway 12. Recent efforts have put the project into the hands of local communities. The development of the Blue Ribbon Advisory Council (BRAC) for Route 53/120 and corresponding Finance and Land Use Committees allowed local elected officials and stakeholders to voice their opinions and ultimately guide the project, from both the design and funding perspectives. This process ultimately dictated a less-intense design that favors slower speed limits, improved site lines for nearby residences, and environmental sensitivity – all of which aid in preserving the community character. Local communities spoke and helped guide the design. The successful planning process is exemplified by a February 2017 poll commissioned by the Illinois Economic Policy Institute (ILEPI), which found that 66 percent of Lake County voters support the project, compared to just 18 percent opposed. Understanding the Need Added stress to existing roadways will be evident following the expected population and employment growth by 2040. Furthermore, the following transportation measures indicate strong existing north-south travel movements:
Interstate 94 experienced daily traffic volumes over 120,000 vehicles in 2014 along the southern portion in Lake County;
Mean travel times to work in 2014 are highest among communities in west Lake County, reaching above 30 minutes; and
Over 51 percent of Lake County’s residents work in another county, with 34 percent working directly south in Cook County. Similarly, over 52 percent of Lake County’s employees are travelling from another county, with 26 percent commuting from Cook County.
Route 53/120 has the means to reduce traffic volumes on existing routes and improve travel times. Without some form of transportation improvements, congestion will grow and cause a decline in the quality of life for existing residents. Planning appropriate projects to address expected growth is necessary in any community; Route 53/120 is an apt project and can benefit Lake County residents. Economic and Transportation Impacts The construction of Route 53/120 will create jobs and provide extensive economic and transportation benefits to both Lake County and the Chicago region as a whole.
ii
New Development: The project will make new land available and more desirable for development; more than 20 million square feet of development is projected to occur along the corridor by 2040.
Construction Jobs: The construction of the project will add about 5,000 jobs per year over a four-year construction phase, 3,000 of which will have an average annual income of $73,000.
Regional Growth: Compared to all fiscally constrained projects identified in CMAP’s GO TO 2040 plan, Route 53/120 will contribute the most to long-term gross regional product at $1.20 billion by 2040.
Reduced Regional Congestion: Congested vehicle hours travelled (VHT) on the entire roadway network throughout the CMAP region will decrease by over 64,000 hours daily in the year 2040 due to the construction of the Route 53 extension.
Reduced Corridor Congestion: In a five-mile buffer surrounding the project location, congested VHT will decrease by about 40,000 hours daily in 2040.
Improved Travel Times: Travel times for typical trips near the project location will improve by 18-30 minutes, or 21-31 percent, due to the creation of a new route option in the year 2040.
Funding and the Local Impact The Finance Committee developed relevant funding measures to address the $2.35 billion to $2.65 billion (in 2020 dollars) cost of the project. Some of which will impact local residents, however the impact is appropriate and reasonable.
Motor Fuel Tax: An added motor fuel tax of $0.04 per gallon will be levied within Lake County, of which 50 percent will contribute to Route 53/120 and the remaining amount will support other Lake County transportation projects. An average driver will spend an additional $30 per year, or $2.50 a month, to cover the added fuel tax. This negligible cost is an appropriate contribution towards a project that will significantly improve mobility throughout Lake County; not only will those using Route 53/120 benefit from improved mobility, but congestion on nearby arterial roads is also expected to decrease by 10 percent.
Tolling: A standard toll rate of $0.20 per mile and a congestion rate of $0.29 per mile will be used on the Route 53/120 extension. A sample commuting route between Waukegan and Schaumburg was compared to understand the costs and benefits between using the best existing route and using Route 53/120. It was determined that although there will be an additional annual cost to those using the roadway, the considerable amount of time saved for the common commuter using this route will result in a net benefit of $2,387 annually. Additionally, it can be expected that most motorists will not travel a full 18 miles along Route 53/120, but will still experience travel time savings due to decreased congestion on nearby roadways.
Real Estate Tax Revenue Capture: Funding for a Sustainable Transportation Fund will be generated by 25 percent of the increase in adjacent, new non-residential land values within one mile of the corridor and two miles of interchanges. The development to support this fund only becomes attractive and viable following the construction of Route 53/120. Consequently, the construction of the project would supply Lake County with property tax revenue that was not previously feasible.
In conclusion, Route 53/120 can offer substantial transportation benefits at minimal costs to the general public. Following guidance from local participation, the project will address expected growth, improve mobility within Lake County and throughout the region, create middle-class construction jobs, offer the opportunity for new local development, positively impact the region’s economy, and increase the attractiveness of the Chicago region as a location to open or expand businesses.

iii
TABLE OF CONTENTS Executive Summary …………………………………………….…………………………………………………………………………..…… i
Table of Contents ………………………………………………….……………………………………………………………….…………… iii
About the Author ………………………………………………….…………………………………………………………………….……… iii
Introduction ………………………………………………………………………………………………………………………………………… 1
The Proposed Route 53/120 …….………………………………………………………………………………………………………… 2
Planning Process ……………….………………………………………………………………………………………….…………… 2
Moving Towards Implementation ….………………………………………………………………………………..………… 4
Understanding the Need……………………………………………………………………………………………………………..……… 4
Demographics …………………………………………………………………………………………………………………………… 4
Traffic Patterns …………………………………………………………………………………………………………………….…… 6
Project Design and Funding ……………………………………………….…………………………………………………………….… 9
Design Features ………………………………………………………………………………………………………………………… 9
Cost and Funding ……………………………………………………………………………………………………….………….… 10
Impact of Route 53/120 …………………………………………………………………………………………………….……………… 12
Transportation ……………………………………………………………………………………………………….……………..… 12
Environmental ………………………………………………………………………………………………………………………… 13
Corridor Development ………………………………………………………….…………………………………..………….… 13
Economic Impacts …………………………………………………………………………………………………………………………..… 14
Motor Fuel Tax …………………………………………………………………………………………………….………………..… 14
Tolls ……………………………………………………………………………………………………….……………………………….. 15
Regional Impact ……………………………………………………………………………….……………………………………… 17
Impact of Construction ……………………………………………………………………….…………………………………… 17
Concluding Observations …………………………………………………………………………….……………………………….…… 19
Appendix A ..……………………………………………………………………………………………….…………….……………………..… 21
Appendix B ………………………………………………………………………………………………….……………………………………… 23
References ……………………………………………………………………………………………………….………………………………… 25
ABOUT THE AUTHOR Mary Craighead, AICP is the Transportation Policy Analyst at the Illinois Economic Policy Institute. Prior to joining ILEPI, she served as the Coordinator for the Victoria, TX Metropolitan Planning Organization and Senior Transportation Planner for the City of Victoria, TX. She earned a Master of Urban Planning and Graduate Certificate in Transportation Planning from Texas A&M University and a Bachelor of Science in Mathematics and Economics from the University of Evansville.
1
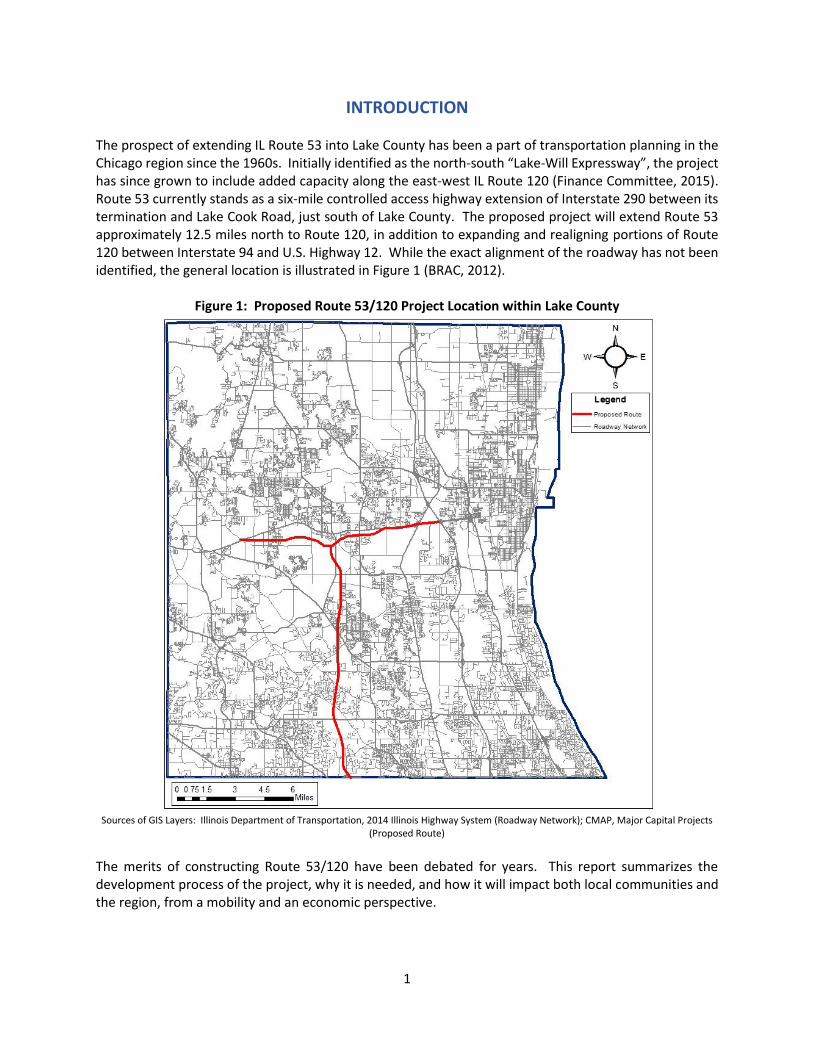
INTRODUCTION The prospect of extending IL Route 53 into Lake County has been a part of transportation planning in the Chicago region since the 1960s. Initially identified as the north-south “Lake-Will Expressway”, the project has since grown to include added capacity along the east-west IL Route 120 (Finance Committee, 2015). Route 53 currently stands as a six-mile controlled access highway extension of Interstate 290 between its termination and Lake Cook Road, just south of Lake County. The proposed project will extend Route 53 approximately 12.5 miles north to Route 120, in addition to expanding and realigning portions of Route 120 between Interstate 94 and U.S. Highway 12. While the exact alignment of the roadway has not been identified, the general location is illustrated in Figure 1 (BRAC, 2012).
Figure 1: Proposed Route 53/120 Project Location within Lake County
Sources of GIS Layers: Illinois Department of Transportation, 2014 Illinois Highway System (Roadway Network); CMAP, Major Capital Projects
(Proposed Route)
The merits of constructing Route 53/120 have been debated for years. This report summarizes the development process of the project, why it is needed, and how it will impact both local communities and the region, from a mobility and an economic perspective.
2
THE PROPOSED ROUTE 53/120
Planning Process Route 53 has undergone extensive consideration in the past, yet due to the lack of both funding and consensus, the project never gained traction. Over the years, environmental studies were considered, right-of-way was purchased, and planning committees were formed.
Past Environmental Studies Between 1970 and 1990 two environmental studies on the proposed extension of Route 53 were introduced, yet never completed. The Illinois Department of Transportation (IDOT) and the Illinois State Toll Highway Authority (ISTHA) jointly prepared a Draft Environmental Impact Statement in 2001 to assess the potential options to Lake County’s transportation system. Two projects, IL 83/US 45/US 12 and IL 53 extension, were identified. The results were presented at a public hearing in 2001, yet, due to a lack of consensus, neither project ever advanced (Finance Committee, 2015). Lake County Advisory Referendum In 2009, The Lake County Advisory Referendum allowed Lake County residents to vote on the Route 53 extension. Of the 21 percent of registered voters who cast ballots, almost 76 percent supported the proposed extension (Lake County Board, 2009). Chicago Metropolitan Agency for Planning After analyzing the benefits within the Chicago region, the Chicago Metropolitan Agency for Planning (CMAP) identified the proposed project as a priority in their 2010 long-range plan, the GO TO 2040 Comprehensive Regional Plan. GO TO 2040 was updated in 2014 and Route 53/120 was again recognized as a priority project that is anticipated to have the highest congestion reduction benefits compared to all other capital projects identified in the plan (CMAP, 2014). Blue Ribbon Advisory Council (BRAC) In 2011, as a response to the continual nonexistent consensus and the need to coordinate a variety of interests, ISTHA created the Route 53/120 Blue Ribbon Advisory Council (BRAC). The 30-person committee is comprised of public officials and representatives from business, labor, planning, and environmental groups. The Council was tasked with creating community consensus, determining the project location and design features, and developing a feasible financial plan. The Council met over the course of a year, considered multiple scenarios, and ultimately approved a final resolution summarizing the following recommendations:
1. Create a transportation system that preserves the environment and nearby communities
and enhances connectivity;
2. Design a context sensitive roadway;
3. Respect and preserve the land;
4. Use an innovative funding plan for an innovative road; and
5. Create a corridor plan and implementation strategy.
In accordance with these recommendations, the Council formed two sub-committees to further
research funding and a comprehensive land use plan.
3
Finance Committee The Finance Committee was led by ISTHA and comprised of elected officials and representatives from interested organizations. It evaluated the feasibility of Route 53/120 and developed plausible funding tools and a final financial plan. Ultimately, a final report and recommendations were voted on by the entire committee; their recommendations included four main funding sources, which are summarized in a subsequent section of this report (Finance Committee, 2015). Land Use Committee The Land Use Committee was organized to create guidance for future development along the corridor that integrates land use, transportation, economic development, and open space. The Committee met over the course of a year and a half, including public participation sessions, and ultimately voted on a final resolution and published a report on a corridor land use strategy. The underlying theme of their recommendations is a balanced land use plan that supports both growth and environmental preservation (Land Use Committee, 2015). Lake County Transportation Alliance Poll An October 2015 telephone poll of 923 Lake County residents found that 75.2 percent approved of extending Route 53 in Lake County, with 17.6 percent opposed (We Ask America, 2015). New Illinois Economic Policy Institute (ILEPI) Poll Most recently, ILEPI commissioned Anzalone Liszt Grove (ALG) Research to perform a telephone poll of 400 Lake County residents in February 2017. ALG’s survey of registered voters found that 66 percent approved of extending Route 53 in Lake County, with 18 percent opposed.
The planning process has spanned many years and transformed along the way. Most significantly, the project was put into the hands of local communities. The recent development of the Blue Ribbon Advisory Council, Finance Committee, and Land Use Committee allowed local elected officials and local stakeholders to voice their opinions and ultimately guide the project, from both the design and funding perspectives. It is the mark of a truly successful planning process when those who will be most impacted by a project help to shape its progress.
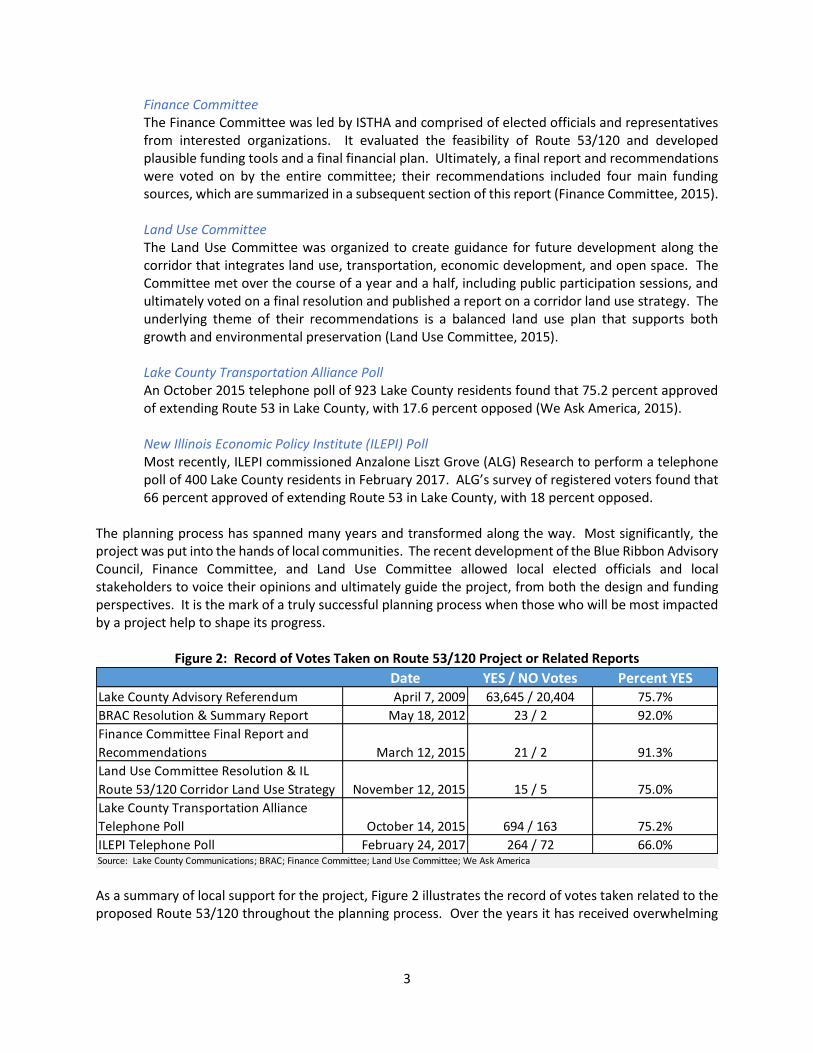
Figure 2: Record of Votes Taken on Route 53/120 Project or Related Reports
As a summary of local support for the project, Figure 2 illustrates the record of votes taken related to the proposed Route 53/120 throughout the planning process. Over the years it has received overwhelming
Date YES / NO Votes Percent YESLake County Advisory Referendum April 7, 2009 63,645 / 20,404 75.7%
BRAC Resolution & Summary Report May 18, 2012 23 / 2 92.0%
Finance Committee Final Report and
Recommendations March 12, 2015 21 / 2 91.3%
Land Use Committee Resolution & IL
Route 53/120 Corridor Land Use Strategy November 12, 2015 15 / 5 75.0%
Lake County Transportation Alliance
Telephone Poll October 14, 2015 694 / 163 75.2%
ILEPI Telephone Poll February 24, 2017 264 / 72 66.0%Source: Lake County Communications; BRAC; Finance Committee; Land Use Committee; We Ask America
4
support throughout the committee process from municipalities and other organizations, in addition to the consistent support of residents, further indicating a comprehensive, successful planning process. Moving Towards Implementation The planning process provided a comprehensive analysis and strategy on the best approach to implement the Route 53/120 project; however, it is ultimately dependent on ISHTA to follow the recommendations. In December 2015, the ISTHA board unanimously voted to move forward with an Environmental Impact Statement (EIS) on the proposed project. This process evaluates the need for the project, performs public participation, develops and evaluates possible alternatives, assesses potential environmental impacts, and identifies the impacts of the project and potential mitigation efforts to be considered. The EIS, entirely funded by ISTHA, will take approximately four years to complete and will be done in conjunction with IDOT and the Federal Highway Administration (FHWA) (Lake County Communications, 2015) It is imperative that ISHTA continues communication with the local communities throughout the EIS and every step following to ensure they are entirely aware of progress. Most importantly, coordination is necessary to facilitate effective land use development. While ISHTA will construct the roadway, local communities will ultimately decide how land is developed. The transportation network and land use are inherently connected, and continuing the comprehensive planning process throughout implementation will ensure an entirely successful corridor.
UNDERSTANDING THE NEED
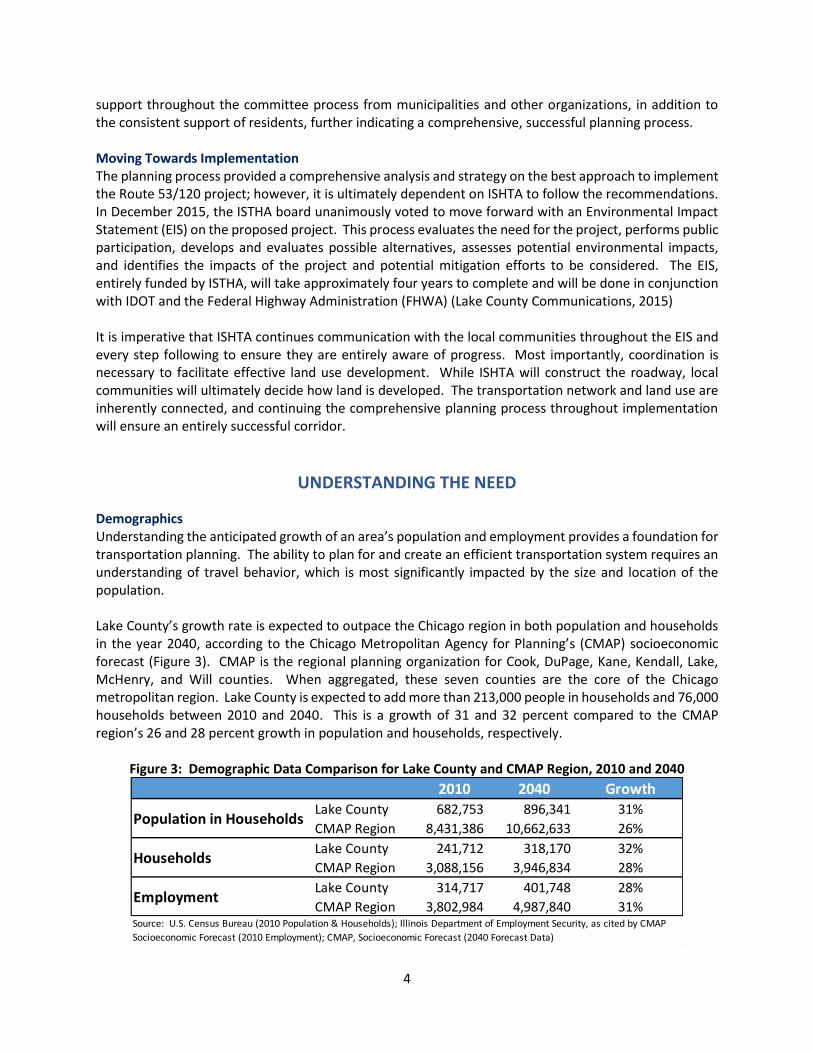
Demographics Understanding the anticipated growth of an area’s population and employment provides a foundation for transportation planning. The ability to plan for and create an efficient transportation system requires an understanding of travel behavior, which is most significantly impacted by the size and location of the population. Lake County’s growth rate is expected to outpace the Chicago region in both population and households in the year 2040, according to the Chicago Metropolitan Agency for Planning’s (CMAP) socioeconomic forecast (Figure 3). CMAP is the regional planning organization for Cook, DuPage, Kane, Kendall, Lake, McHenry, and Will counties. When aggregated, these seven counties are the core of the Chicago metropolitan region. Lake County is expected to add more than 213,000 people in households and 76,000 households between 2010 and 2040. This is a growth of 31 and 32 percent compared to the CMAP region’s 26 and 28 percent growth in population and households, respectively.
Figure 3: Demographic Data Comparison for Lake County and CMAP Region, 2010 and 2040
2010 2040 GrowthLake County 682,753 896,341 31%
CMAP Region 8,431,386 10,662,633 26%
Lake County 241,712 318,170 32%
CMAP Region 3,088,156 3,946,834 28%
Lake County 314,717 401,748 28%
CMAP Region 3,802,984 4,987,840 31%
Population in Households
Households
Employment
Source: U.S. Census Bureau (2010 Population & Households); Illinois Department of Employment Security, as cited by CMAP
Socioeconomic Forecast (2010 Employment); CMAP, Socioeconomic Forecast (2040 Forecast Data)

5
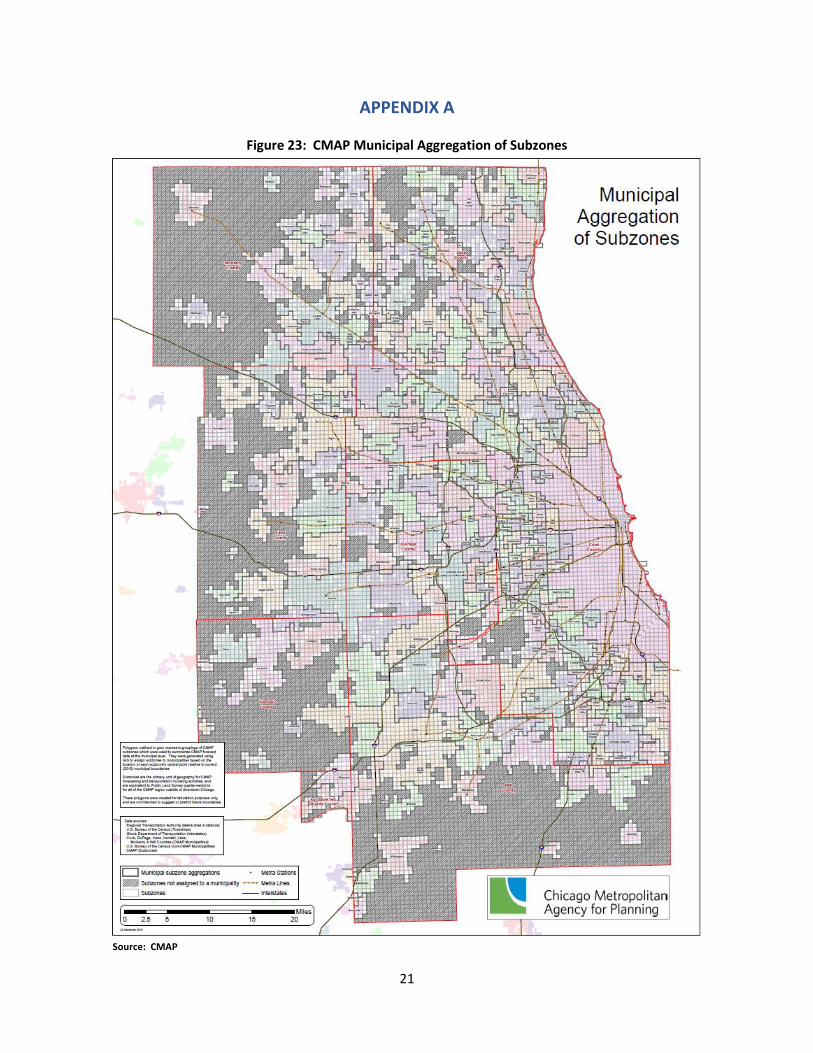
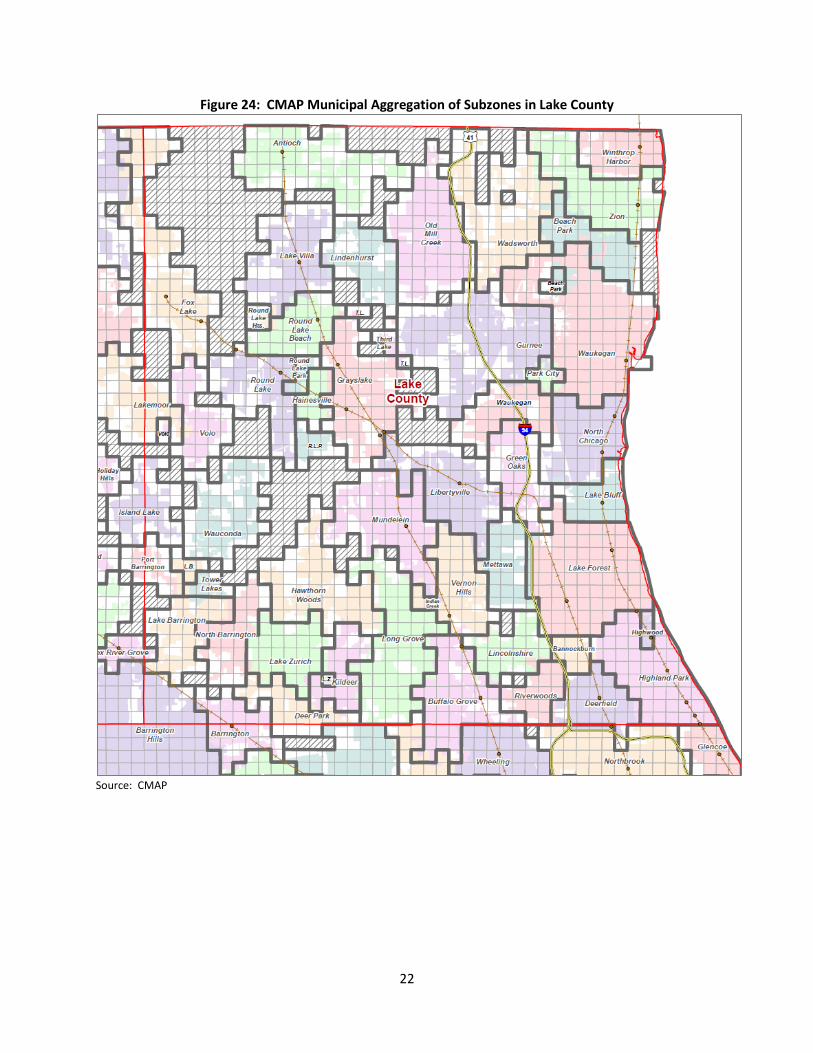
Population and employment growth can also be considered at a smaller geographic area; CMAP’s socioeconomic projections are reported at a “subzone” level, which is a grid of ½-mile squares superimposed over the entire geographic region (CMAP, 2014b). Each subzone is populated with extensive demographic data to support the travel demand modeling process employed by CMAP; this report takes use of population in households, households, and employment data for 2010 and 2040. Figures 4 and 5 illustrate the projected growth in household population and employment by municipality between 2010 and 2040 and the anticipated route of the proposed Route 53/120. The maps aggregate the subzones to the municipal level, boundaries which are only approximate representations based on each subzone’s proximity to the municipality boundary. While these are only approximate aggregations, they provide a general understanding of where growth can be expected. A map depicting how the subzones align with the municipal boundaries can be seen in Appendix A. While general growth is expected to occur throughout all of Lake County, heavier population growth is projected adjacent to the proposed route. Additionally, significant employment growth is expected near the intersection of the proposed Route 53 and the existing Route 120. Increased population and employment adds stress to existing roadways; the construction of Route 53/120 will offer an alternate route, particularly for the new residents and employees in proximity of the proposed project.
Figure 4: Lake County Household Population Growth by Municipality, 2010-2040
Sources of GIS Layers: CMAP, Socioeconomic Forecast (Population and Municipality Approximate Boundaries); CMAP, Major Capital Projects
(Proposed Route); CMAP, Conformity Analysis 2016 Q1 Analysis Year 2015 Daily Highway Network (Roadway Network)

6
Figure 5: Lake County Employment Growth, 2010-2040
Source of GIS Layers: CMAP, Socioeconomic Forecast (Employment and Municipality Approximate Boundaries); CMAP, Major Capital Projects
(Proposed Route); CMAP, Conformity Analysis 2016 Q1 Analysis Year 2015 Daily Highway Network (Roadway Network)
Traffic Patterns In addition to demographic data, it is imperative to understand current transportation trends. As shown in Figure 6, Lake County experienced significant daily traffic volumes on north-south routes in 2014. Interstate 94 experienced the highest traffic volumes, particularly along the southern stretch of the corridor, in addition to US 12 and US 41. These roadways are expected to carry higher traffic volumes because they have more travel lanes, and therefore have a higher capacity. It is worth noting, however, that the considerably higher volumes on north-south routes signifies common traffic patterns. The proposed Route 53 would provide an additional north-south corridor and an alternate route for those traveling on heavily-used Interstate 94.

7
Figure 6: Annual Average Daily Traffic (AADT) for Lake County, 2014
Sources of GIS Layers: Illinois Department of Transportation (Traffic Counts); CMAP, Major Capital Projects (Proposed Route); CMAP,
Conformity Analysis 2016 Q1 Analysis Year 2015 Daily Highway Network (Roadway Network)
Similar to traffic volumes, studying mean travel times to work by location adds an additional layer to recognize areas that may benefit from transportation improvements. While mean travel times to work do not indicate the specific route a person travels, they do provide an overall picture of travel habits. Figure 7 shows a noticeable trend of higher commute times in the western municipalities of Lake County, reaching between 30 and 40 minutes. The highest commute times – over 40 minutes – are experienced in Fox Lake, Volo, Port Barrington, and Tower Lakes. The construction of the Route 53 extension would provide an additional north-south route closer to these western communities, which could aid in improving their commute times.
8
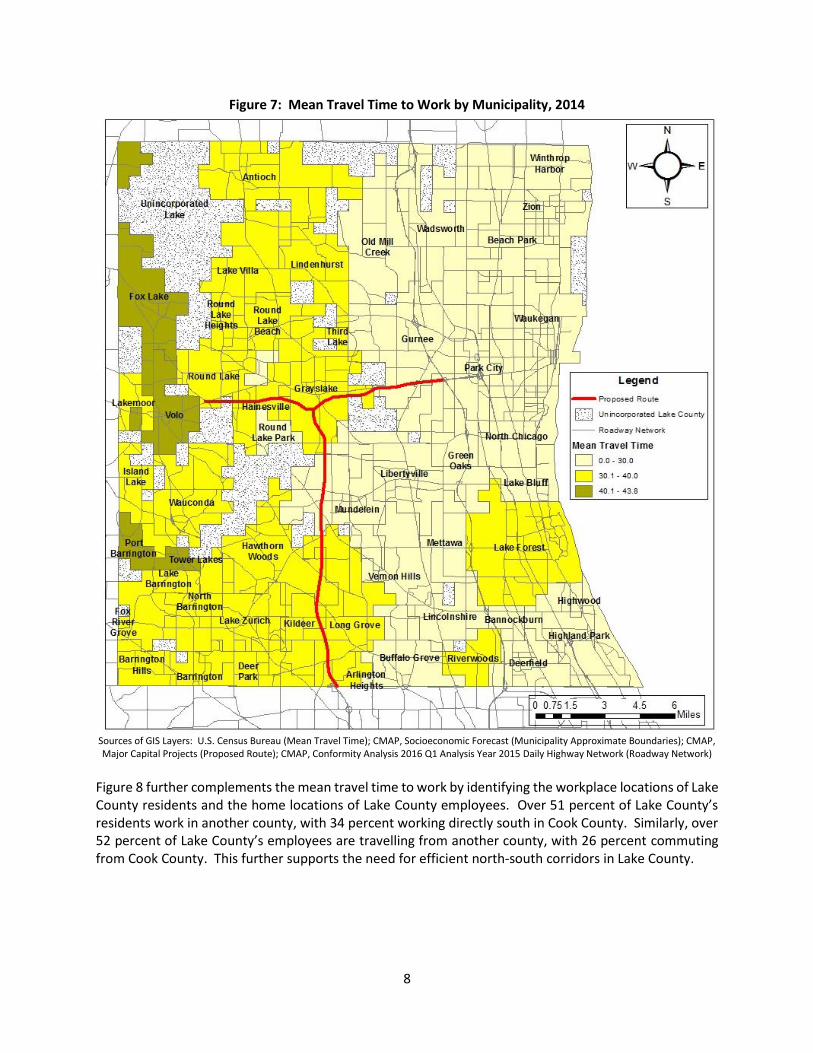
Figure 7: Mean Travel Time to Work by Municipality, 2014
Sources of GIS Layers: U.S. Census Bureau (Mean Travel Time); CMAP, Socioeconomic Forecast (Municipality Approximate Boundaries); CMAP, Major Capital Projects (Proposed Route); CMAP, Conformity Analysis 2016 Q1 Analysis Year 2015 Daily Highway Network (Roadway Network)
Figure 8 further complements the mean travel time to work by identifying the workplace locations of Lake County residents and the home locations of Lake County employees. Over 51 percent of Lake County’s residents work in another county, with 34 percent working directly south in Cook County. Similarly, over 52 percent of Lake County’s employees are travelling from another county, with 26 percent commuting from Cook County. This further supports the need for efficient north-south corridors in Lake County.

9
Figure 8: Work and Home Locations of Lake County Residents and Employees, 2014
These three transportation measures – traffic volumes, mean travel times to work, and home and work locations – offer a foundation to understand existing traffic patterns. There is a noticeable trend pointing to the need for efficient north-south routes in Lake County. The construction of Route 53/120 will provide an alternate north-south route for those who work or live in Cook County and travel to Lake County and potentially lower travel times for residents of the western municipalities. Overall, the Route 53/120 extension would alleviate the amount of traffic on existing high-volume corridors.
PROJECT DESIGN AND FUNDING As a result of a comprehensive planning process, Route 53/120 is recommended to be designed and constructed as a “modern, multi-modal, sustainable, and innovative” roadway (BRAC, 2012). It is meant to enhance mobility, while simultaneously maintaining the character of nearby communities and the environment. This is achievable through specific design features and funding mechanisms, both of which are explicated in this section. Design Features The design features developed by the BRAC overwhelmingly follow the concept of a context sensitive solution (CSS). A CSS complements the typical data-driven, technical transportation planning process and considers the greater interactions between a project and its environment (FHWA, 2014). Specifically, it ensures that a consistent design is not employed for the entire roadway and finds the appropriate features necessary for each section to balance both mobility and environmental goals (BRAC, 2012). The most significant design features are summarized below. Parkway Design
This design type will incorporate a wide median, preserving space for the natural environment, in addition to integrating space for public multi-use paths for pedestrians and bicycles (BRAC, 2012).
County Residents Percent County Employees Percent
Lake County, IL 153,538 48.7% Lake County, IL 153,538 47.7%
Cook County, IL 108,584 34.4% Cook County, IL 84,518 26.3%
McHenry County, IL 16,791 5.3% McHenry County, IL 20,543 6.4%
Kenosha County, WI 7,433 2.4% Kenosha County, WI 14,618 4.5%
DuPage County, IL 4,891 1.6% DuPage County, IL 11,247 3.5%
Kane County, IL 4,318 1.4% Kane County, IL 8,326 2.6%
Will County, IL 2,968 0.9% Will County, IL 5,314 1.7%
Racine County, WI 1,699 0.5% Racine County, WI 2,607 0.8%
Winnebago County, IL 1,364 0.4% Winnebago County, IL 1,838 0.6%
Kendall County, IL 1,169 0.4% Kendall County, IL 1,582 0.5%
All Other Locations 12,668 4.0% All Other Locations 17653 5.5%
315,423 321,784 Source: U.S. Census Bureau, OnTheMap Application
Workplace Locations of Lake County Residents Home Locations of Lake County Employees

10
Maximum Speed of 45 MPH A speed limit of 45 miles per hour (MPH) cannot be guaranteed just by setting the speed at 45 miles per hour (MPH); the roadway must also be designed in a way that makes the public most comfortable to travel at that speed. To achieve this, the design will incorporate curves and hills and apply a smaller footprint for pavement, which supports less noise and reduced emissions BRAC, 2012).
Depressed Roadway Where possible, the roadway will be depressed and berm and landscaping will be added. This will improve the views of nearby residents and support the preservation of community character (BRAC, 2012).
Stormwater Management A Stormwater Treatment Train, which is a four-step stormwater management system, will be used to guarantee good water quality and minimize peak stormwater flows. Stormwater draining off the built environment will flow first through open swales, followed by other grasslands and wetlands, which ensures appropriate filtration before entering water sources (BRAC, 2012).
By pursuing these design features, the project will provide needed mobility and congestion relief, while maintaining the existing environment. The selected features represent the wishes of the nearby communities as they were discussed and ultimately recommended by the BRAC. Cost and Funding The total project cost, including the recommended design features and environmental protection funds, is estimated between $2.35 billion and $2.65 billion (in 2020 dollars) (Finance Committee, 2015). The breakdown of the planning level estimates is presented in Figure 9.
Figure 9: Route 53/120 Total Project Cost (in millions, 2020 dollars)
The Finance Committee considered a variety of funding sources and ultimately agreed upon four major strategies ranging from local to ISHTA policies, which are outlined in Figure 10.
Low High
Roadway $631 $655
Structures $261 $362
Traffic Management and Tolling $51 $74
Drainage $148 $173
Environmental Mitigation $115 $131
Contingency (30%) $362 $418
Right-of-way $225 $227
Engineering $410 $463
Utility Relocations $66 $66
Environmental Restoration and Stewardship Fund $81 $81
$2,350 $2,650Source: Finance Committee, 2015
11
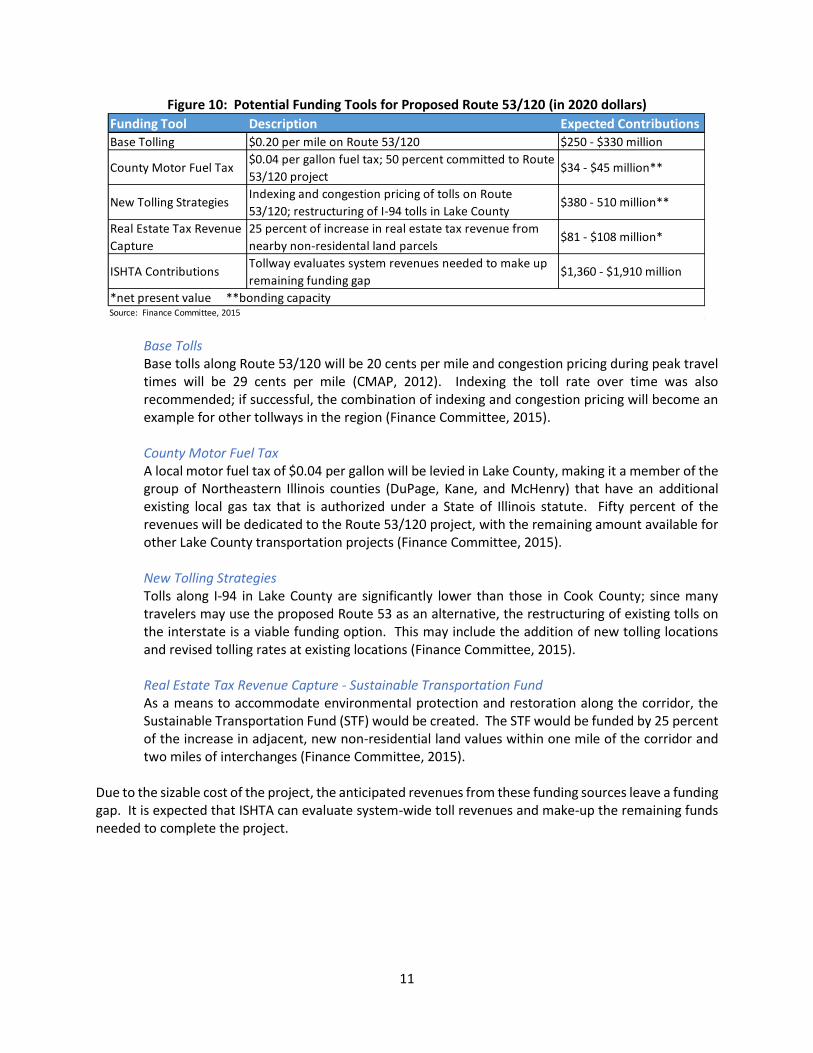
Figure 10: Potential Funding Tools for Proposed Route 53/120 (in 2020 dollars)
Base Tolls Base tolls along Route 53/120 will be 20 cents per mile and congestion pricing during peak travel times will be 29 cents per mile (CMAP, 2012). Indexing the toll rate over time was also recommended; if successful, the combination of indexing and congestion pricing will become an example for other tollways in the region (Finance Committee, 2015).
County Motor Fuel Tax
A local motor fuel tax of $0.04 per gallon will be levied in Lake County, making it a member of the group of Northeastern Illinois counties (DuPage, Kane, and McHenry) that have an additional existing local gas tax that is authorized under a State of Illinois statute. Fifty percent of the revenues will be dedicated to the Route 53/120 project, with the remaining amount available for other Lake County transportation projects (Finance Committee, 2015).
New Tolling Strategies
Tolls along I-94 in Lake County are significantly lower than those in Cook County; since many travelers may use the proposed Route 53 as an alternative, the restructuring of existing tolls on the interstate is a viable funding option. This may include the addition of new tolling locations and revised tolling rates at existing locations (Finance Committee, 2015).
Real Estate Tax Revenue Capture - Sustainable Transportation Fund
As a means to accommodate environmental protection and restoration along the corridor, the Sustainable Transportation Fund (STF) would be created. The STF would be funded by 25 percent of the increase in adjacent, new non-residential land values within one mile of the corridor and two miles of interchanges (Finance Committee, 2015).
Due to the sizable cost of the project, the anticipated revenues from these funding sources leave a funding gap. It is expected that ISHTA can evaluate system-wide toll revenues and make-up the remaining funds needed to complete the project.
Funding Tool Description Expected ContributionsBase Tolling $0.20 per mile on Route 53/120 $250 - $330 million
County Motor Fuel Tax$0.04 per gallon fuel tax; 50 percent committed to Route
53/120 project$34 - $45 million**
New Tolling StrategiesIndexing and congestion pricing of tolls on Route
53/120; restructuring of I-94 tolls in Lake County$380 - 510 million**
Real Estate Tax Revenue
Capture
25 percent of increase in real estate tax revenue from
nearby non-residental land parcels$81 - $108 million*
ISHTA ContributionsTollway evaluates system revenues needed to make up
remaining funding gap$1,360 - $1,910 million
*net present value **bonding capacitySource: Finance Committee, 2015
12
IMPACT OF ROUTE 53/120 The selection of any transportation project requires a detailed analysis of the benefits and disadvantages of constructing the project. While this is an ongoing process– particularly one that will be highlighted by the completion of the Environmental Impact Statement– assessments have been performed by CMAP, ISHTA, and their related committees dedicated to planning for the project. The following section recaps the results of these analyses and examines the transportation, environmental, and development benefits and costs of constructing Route 53/120.
Transportation The construction of Route 53/120 will provide significant benefits to the transportation network for both Lake County and the broader Chicago metropolitan region. The project was identified in CMAP’s long-range regional plan as the project that will most significantly reduce congestion for both automobile and freight traffic. In order to understand the impact of a project, CMAP uses a travel demand model (TDM) to predict traffic movements throughout the region based on socioeconomic and employment parameters. The model is analyzed in both existing and anticipated future conditions – in this case, the year 2040 – as a means to understand how a future project will influence the transportation network. Figure 11 summarizes the predicted benefits of constructing the Route 53/120 extension.
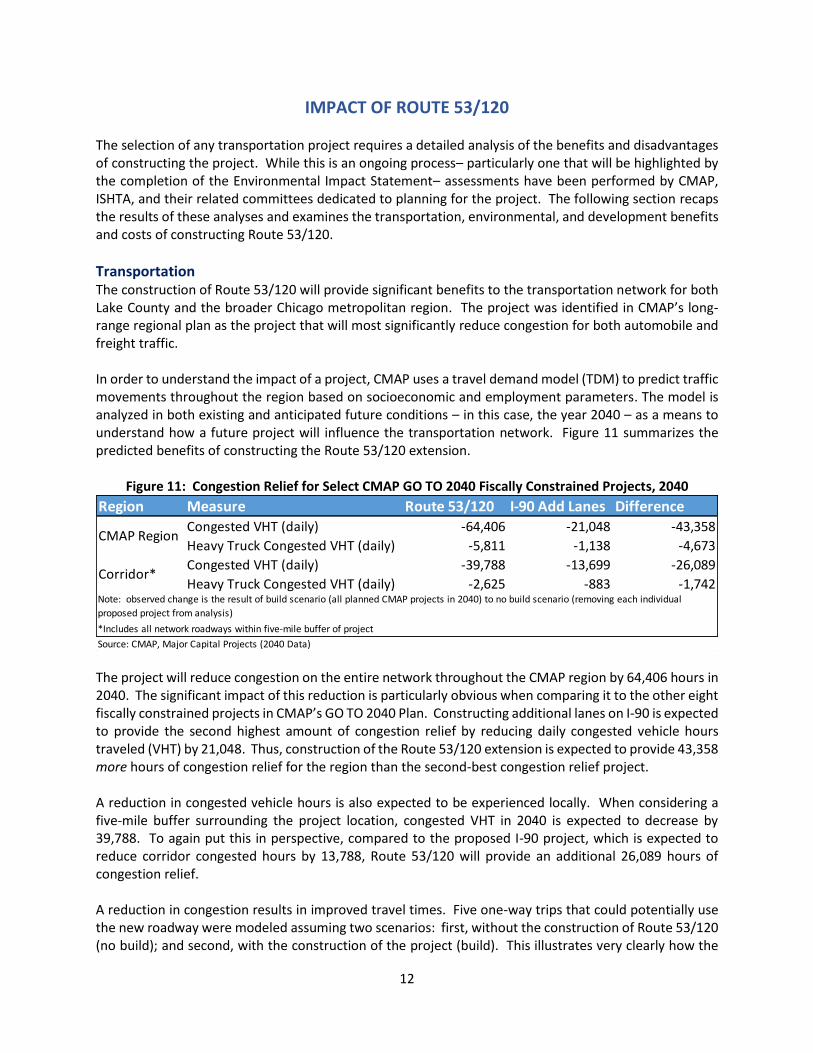
Figure 11: Congestion Relief for Select CMAP GO TO 2040 Fiscally Constrained Projects, 2040
The project will reduce congestion on the entire network throughout the CMAP region by 64,406 hours in 2040. The significant impact of this reduction is particularly obvious when comparing it to the other eight fiscally constrained projects in CMAP’s GO TO 2040 Plan. Constructing additional lanes on I-90 is expected to provide the second highest amount of congestion relief by reducing daily congested vehicle hours traveled (VHT) by 21,048. Thus, construction of the Route 53/120 extension is expected to provide 43,358 more hours of congestion relief for the region than the second-best congestion relief project. A reduction in congested vehicle hours is also expected to be experienced locally. When considering a five-mile buffer surrounding the project location, congested VHT in 2040 is expected to decrease by 39,788. To again put this in perspective, compared to the proposed I-90 project, which is expected to reduce corridor congested hours by 13,788, Route 53/120 will provide an additional 26,089 hours of congestion relief. A reduction in congestion results in improved travel times. Five one-way trips that could potentially use the new roadway were modeled assuming two scenarios: first, without the construction of Route 53/120 (no build); and second, with the construction of the project (build). This illustrates very clearly how the
Region Measure Route 53/120 I-90 Add Lanes Difference
Congested VHT (daily) -64,406 -21,048 -43,358
Heavy Truck Congested VHT (daily) -5,811 -1,138 -4,673
Congested VHT (daily) -39,788 -13,699 -26,089
Heavy Truck Congested VHT (daily) -2,625 -883 -1,742
CMAP Region
Corridor*
Note: observed change is the result of build scenario (all planned CMAP projects in 2040) to no build scenario (removing each individual
proposed project from analysis)
*Includes all network roadways within five-mile buffer of project
Source: CMAP, Major Capital Projects (2040 Data)
13
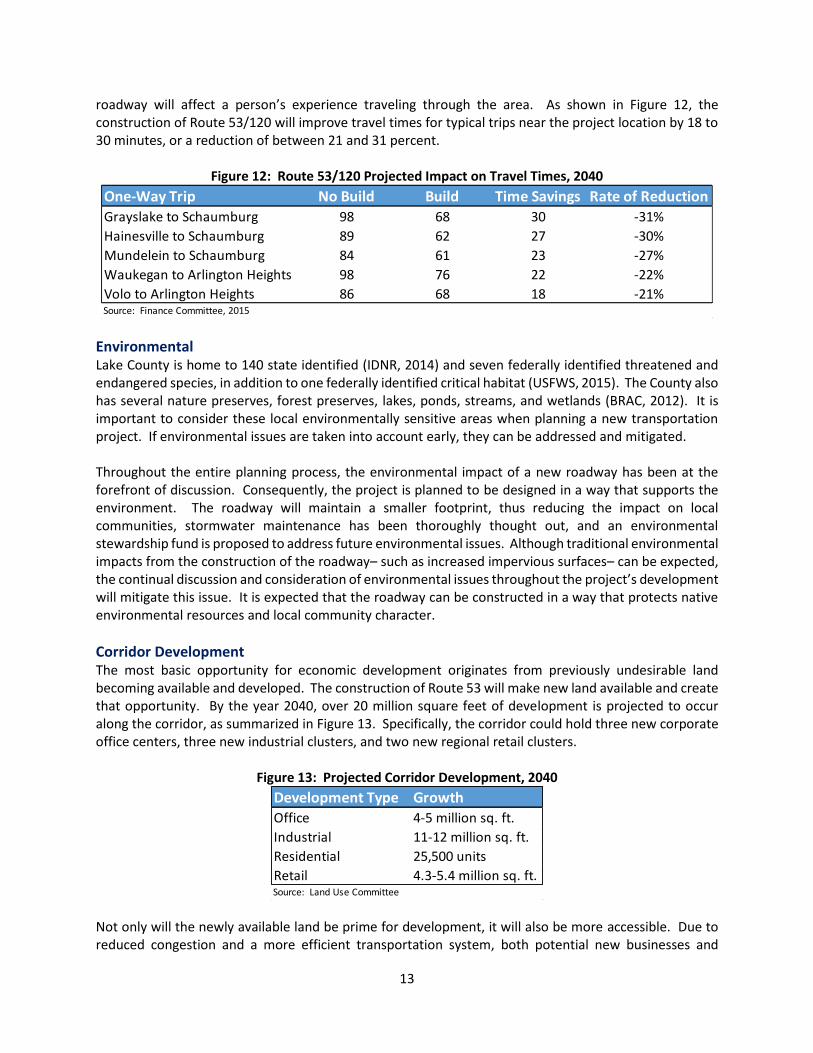
roadway will affect a person’s experience traveling through the area. As shown in Figure 12, the construction of Route 53/120 will improve travel times for typical trips near the project location by 18 to 30 minutes, or a reduction of between 21 and 31 percent.
Figure 12: Route 53/120 Projected Impact on Travel Times, 2040
Environmental Lake County is home to 140 state identified (IDNR, 2014) and seven federally identified threatened and endangered species, in addition to one federally identified critical habitat (USFWS, 2015). The County also has several nature preserves, forest preserves, lakes, ponds, streams, and wetlands (BRAC, 2012). It is important to consider these local environmentally sensitive areas when planning a new transportation project. If environmental issues are taken into account early, they can be addressed and mitigated. Throughout the entire planning process, the environmental impact of a new roadway has been at the forefront of discussion. Consequently, the project is planned to be designed in a way that supports the environment. The roadway will maintain a smaller footprint, thus reducing the impact on local communities, stormwater maintenance has been thoroughly thought out, and an environmental stewardship fund is proposed to address future environmental issues. Although traditional environmental impacts from the construction of the roadway– such as increased impervious surfaces– can be expected, the continual discussion and consideration of environmental issues throughout the project’s development will mitigate this issue. It is expected that the roadway can be constructed in a way that protects native environmental resources and local community character.
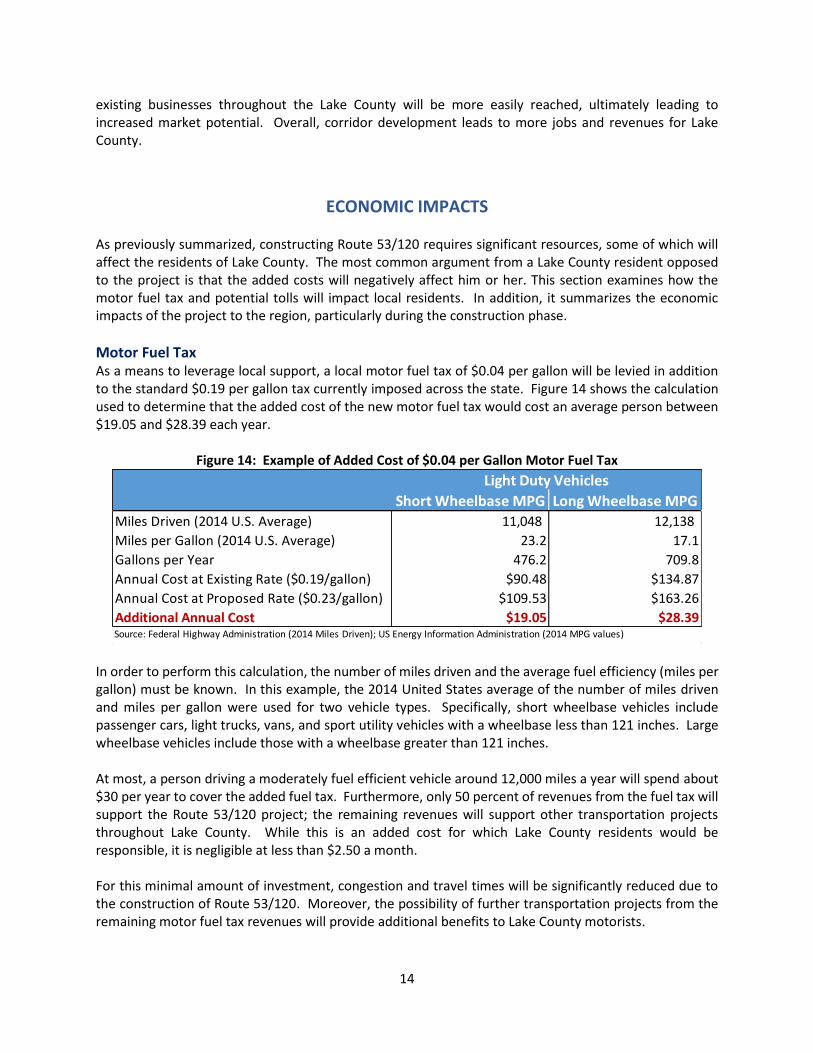
Corridor Development The most basic opportunity for economic development originates from previously undesirable land becoming available and developed. The construction of Route 53 will make new land available and create that opportunity. By the year 2040, over 20 million square feet of development is projected to occur along the corridor, as summarized in Figure 13. Specifically, the corridor could hold three new corporate office centers, three new industrial clusters, and two new regional retail clusters.
Figure 13: Projected Corridor Development, 2040
Not only will the newly available land be prime for development, it will also be more accessible. Due to reduced congestion and a more efficient transportation system, both potential new businesses and
One-Way Trip No Build Build Time Savings Rate of Reduction
Grayslake to Schaumburg 98 68 30 -31%
Hainesville to Schaumburg 89 62 27 -30%
Mundelein to Schaumburg 84 61 23 -27%
Waukegan to Arlington Heights 98 76 22 -22%
Volo to Arlington Heights 86 68 18 -21%Source: Finance Committee, 2015
Development Type GrowthOffice 4-5 million sq. ft.
Industrial 11-12 million sq. ft.
Residential 25,500 units
Retail 4.3-5.4 million sq. ft.Source: Land Use Committee
14
existing businesses throughout the Lake County will be more easily reached, ultimately leading to increased market potential. Overall, corridor development leads to more jobs and revenues for Lake County.
ECONOMIC IMPACTS
As previously summarized, constructing Route 53/120 requires significant resources, some of which will affect the residents of Lake County. The most common argument from a Lake County resident opposed to the project is that the added costs will negatively affect him or her. This section examines how the motor fuel tax and potential tolls will impact local residents. In addition, it summarizes the economic impacts of the project to the region, particularly during the construction phase.
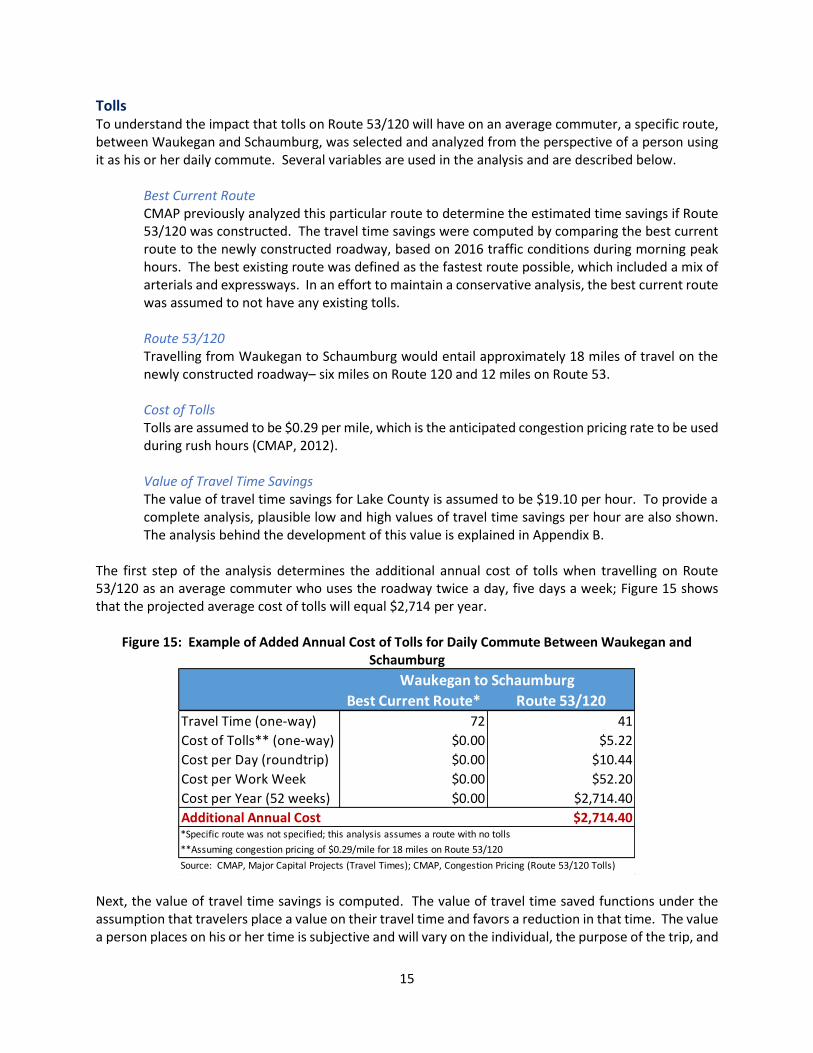
Motor Fuel Tax As a means to leverage local support, a local motor fuel tax of $0.04 per gallon will be levied in addition to the standard $0.19 per gallon tax currently imposed across the state. Figure 14 shows the calculation used to determine that the added cost of the new motor fuel tax would cost an average person between $19.05 and $28.39 each year.
Figure 14: Example of Added Cost of $0.04 per Gallon Motor Fuel Tax
In order to perform this calculation, the number of miles driven and the average fuel efficiency (miles per gallon) must be known. In this example, the 2014 United States average of the number of miles driven and miles per gallon were used for two vehicle types. Specifically, short wheelbase vehicles include passenger cars, light trucks, vans, and sport utility vehicles with a wheelbase less than 121 inches. Large wheelbase vehicles include those with a wheelbase greater than 121 inches. At most, a person driving a moderately fuel efficient vehicle around 12,000 miles a year will spend about $30 per year to cover the added fuel tax. Furthermore, only 50 percent of revenues from the fuel tax will support the Route 53/120 project; the remaining revenues will support other transportation projects throughout Lake County. While this is an added cost for which Lake County residents would be responsible, it is negligible at less than $2.50 a month. For this minimal amount of investment, congestion and travel times will be significantly reduced due to the construction of Route 53/120. Moreover, the possibility of further transportation projects from the remaining motor fuel tax revenues will provide additional benefits to Lake County motorists.
Short Wheelbase MPG Long Wheelbase MPGMiles Driven (2014 U.S. Average) 11,048 12,138
Miles per Gallon (2014 U.S. Average) 23.2 17.1
Gallons per Year 476.2 709.8
Annual Cost at Existing Rate ($0.19/gallon) $90.48 $134.87
Annual Cost at Proposed Rate ($0.23/gallon) $109.53 $163.26
Additional Annual Cost $19.05 $28.39
Light Duty Vehicles
Source: Federal Highway Administration (2014 Miles Driven); US Energy Information Administration (2014 MPG values)
15
Tolls To understand the impact that tolls on Route 53/120 will have on an average commuter, a specific route, between Waukegan and Schaumburg, was selected and analyzed from the perspective of a person using it as his or her daily commute. Several variables are used in the analysis and are described below.
Best Current Route CMAP previously analyzed this particular route to determine the estimated time savings if Route 53/120 was constructed. The travel time savings were computed by comparing the best current route to the newly constructed roadway, based on 2016 traffic conditions during morning peak hours. The best existing route was defined as the fastest route possible, which included a mix of arterials and expressways. In an effort to maintain a conservative analysis, the best current route was assumed to not have any existing tolls. Route 53/120 Travelling from Waukegan to Schaumburg would entail approximately 18 miles of travel on the newly constructed roadway– six miles on Route 120 and 12 miles on Route 53. Cost of Tolls Tolls are assumed to be $0.29 per mile, which is the anticipated congestion pricing rate to be used during rush hours (CMAP, 2012). Value of Travel Time Savings The value of travel time savings for Lake County is assumed to be $19.10 per hour. To provide a complete analysis, plausible low and high values of travel time savings per hour are also shown. The analysis behind the development of this value is explained in Appendix B.
The first step of the analysis determines the additional annual cost of tolls when travelling on Route 53/120 as an average commuter who uses the roadway twice a day, five days a week; Figure 15 shows that the projected average cost of tolls will equal $2,714 per year.
Figure 15: Example of Added Annual Cost of Tolls for Daily Commute Between Waukegan and Schaumburg
Next, the value of travel time savings is computed. The value of travel time saved functions under the assumption that travelers place a value on their travel time and favors a reduction in that time. The value a person places on his or her time is subjective and will vary on the individual, the purpose of the trip, and
Best Current Route* Route 53/120Travel Time (one-way) 72 41
Cost of Tolls** (one-way) $0.00 $5.22
Cost per Day (roundtrip) $0.00 $10.44
Cost per Work Week $0.00 $52.20
Cost per Year (52 weeks) $0.00 $2,714.40
Additional Annual Cost $2,714.40
Source: CMAP, Major Capital Projects (Travel Times); CMAP, Congestion Pricing (Route 53/120 Tolls)
**Assuming congestion pricing of $0.29/mile for 18 miles on Route 53/120
Waukegan to Schaumburg
*Specific route was not specified; this analysis assumes a route with no tolls
16
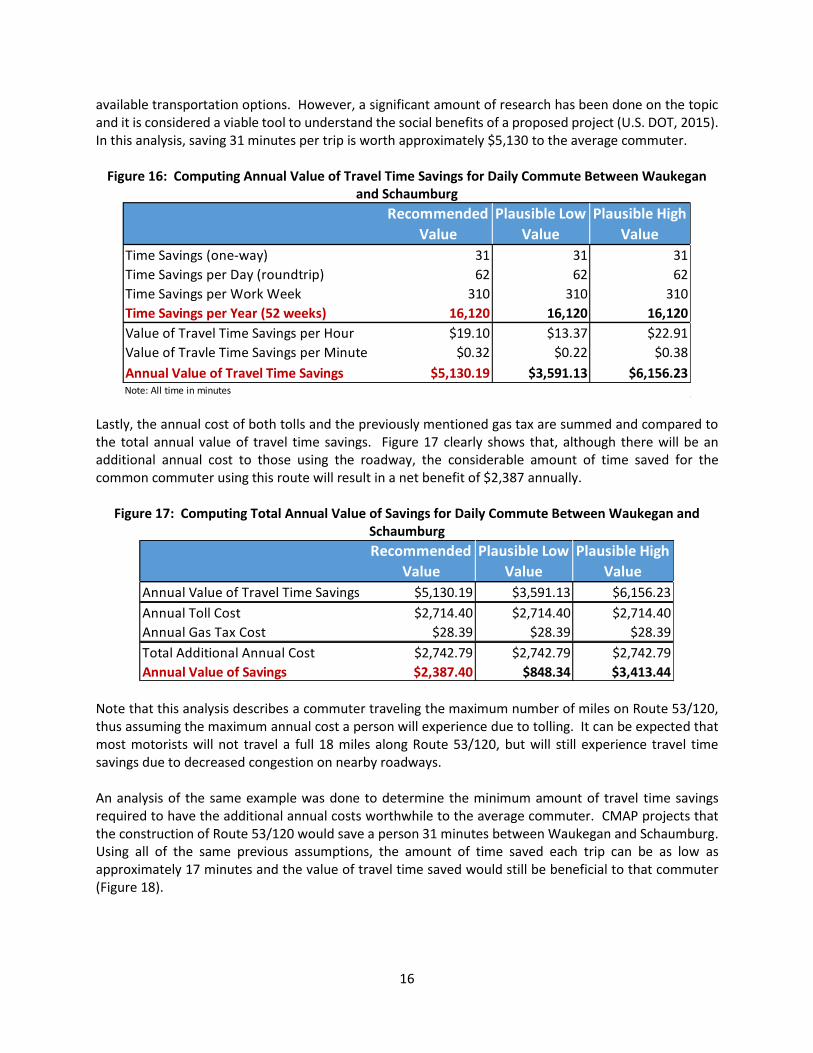
available transportation options. However, a significant amount of research has been done on the topic and it is considered a viable tool to understand the social benefits of a proposed project (U.S. DOT, 2015). In this analysis, saving 31 minutes per trip is worth approximately $5,130 to the average commuter.
Figure 16: Computing Annual Value of Travel Time Savings for Daily Commute Between Waukegan and Schaumburg
Lastly, the annual cost of both tolls and the previously mentioned gas tax are summed and compared to the total annual value of travel time savings. Figure 17 clearly shows that, although there will be an additional annual cost to those using the roadway, the considerable amount of time saved for the common commuter using this route will result in a net benefit of $2,387 annually.
Figure 17: Computing Total Annual Value of Savings for Daily Commute Between Waukegan and Schaumburg
Note that this analysis describes a commuter traveling the maximum number of miles on Route 53/120, thus assuming the maximum annual cost a person will experience due to tolling. It can be expected that most motorists will not travel a full 18 miles along Route 53/120, but will still experience travel time savings due to decreased congestion on nearby roadways. An analysis of the same example was done to determine the minimum amount of travel time savings required to have the additional annual costs worthwhile to the average commuter. CMAP projects that the construction of Route 53/120 would save a person 31 minutes between Waukegan and Schaumburg. Using all of the same previous assumptions, the amount of time saved each trip can be as low as approximately 17 minutes and the value of travel time saved would still be beneficial to that commuter (Figure 18).
Recommended
Value
Plausible Low
Value
Plausible High
Value
Time Savings (one-way) 31 31 31
Time Savings per Day (roundtrip) 62 62 62
Time Savings per Work Week 310 310 310
Time Savings per Year (52 weeks) 16,120 16,120 16,120
Value of Travel Time Savings per Hour $19.10 $13.37 $22.91
Value of Travle Time Savings per Minute $0.32 $0.22 $0.38
Annual Value of Travel Time Savings $5,130.19 $3,591.13 $6,156.23Note: All time in minutes
Recommended
Value
Plausible Low
Value
Plausible High
Value
Annual Value of Travel Time Savings $5,130.19 $3,591.13 $6,156.23
Annual Toll Cost $2,714.40 $2,714.40 $2,714.40
Annual Gas Tax Cost $28.39 $28.39 $28.39
Total Additional Annual Cost $2,742.79 $2,742.79 $2,742.79
Annual Value of Savings $2,387.40 $848.34 $3,413.44

17
Figure 18: Minimum Travel Time Savings Required to Equal Added Annual Cost of Daily Commute Between Waukegan and Schaumburg
Regional Impact The value of travel time saved offers the opportunity for significant economic development due to more efficient travel opportunities for both businesses and consumers. CMAP specifically measured the anticipated long-term economic development by analyzing changes in accessibility, delay, and overall travel conditions for the seven-county CMAP region. As shown in Figure 19, compared to all fiscally constrained projects identified in CMAP’s GO TO 2040, Route 53/120 is expected to contribute the most to annual gross regional product (GRP) in 2040 at $1.20 billion. This is more than twice the contribution expected from the second-most impactful project, the Elgin O’Hare Western Access project.
Figure 19: CMAP GO TO 2040 Gross Regional Product for Fiscally Constrained Projects (GRP), 2040
Impact of Construction To complement CMAP’s long-term regional economic impact analysis, the following analysis considers the short-term economic impact from the construction of Route 53/120. This section uses IMPLAN (IMpact analysis for PLANning) to assess the net impact of these costs and benefits on economic activity and employment, particularly in Lake County, Illinois. IMPLAN is an input-output software that estimates the multiplier, or ripple effect, of changes in industry spending or household expenditures based on U.S. Census Bureau data. In essence, IMPLAN follows each dollar flowing through the economy and uses recent trends to estimate the impact of future policy changes or events. IMPLAN is considered the “gold standard” for economic impact modeling (Vowels, 2012). Figure 20 summarizes the variables input into the model. These costs represent the total project costs originally estimated by the Finance Committee in its Feasibility Analysis. The economic impact results presented in this section are the product of using the low estimate, so as to maintain conservative projections.
Variables Minimum ValueTime Savings Per Trip 16.9 minutes
Project GRP ($ millions annually)IL 53/120 Tollway $1,203
Elgin O'Hare Western Access $598
Illiana Expressway $425
I-55 Express Toll Lane $371
Circle Interchange $295
I-290 Express Toll Lane $272
I-294/I-57 Interchange Addition $95
I-90 Add Lanes $93
I-190 Access Improvements $0Source: CMAP, Major Capital Projects
18
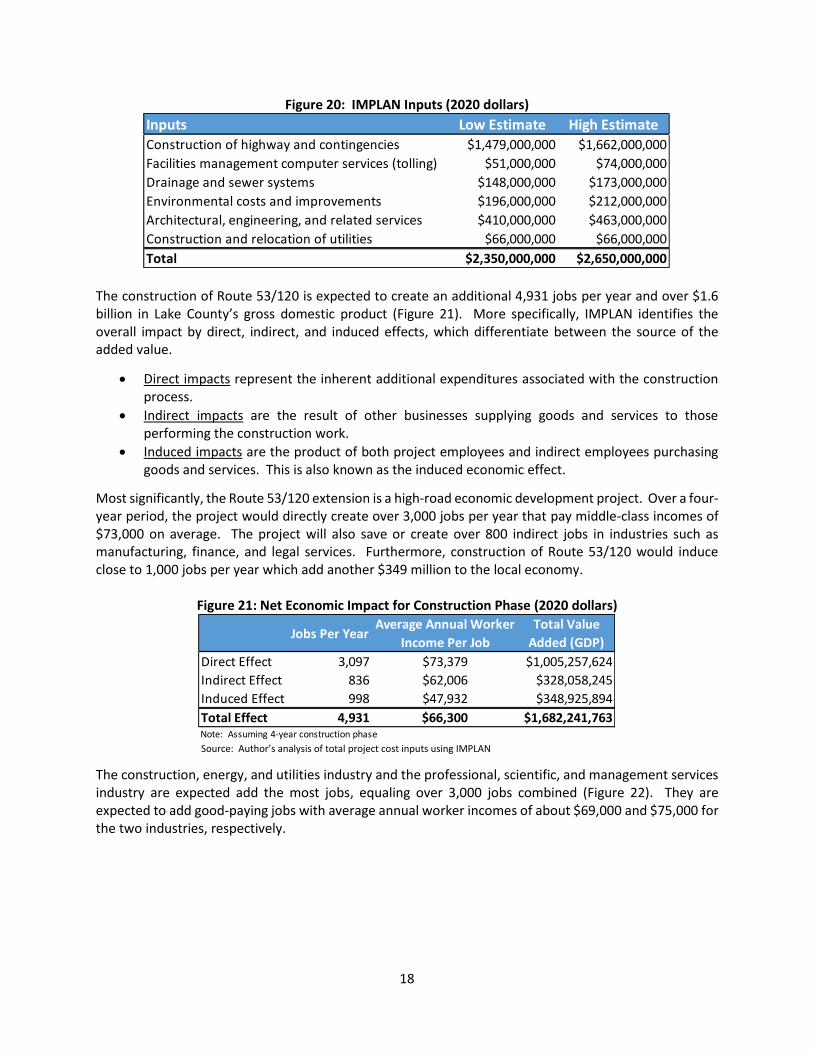
Figure 20: IMPLAN Inputs (2020 dollars)
The construction of Route 53/120 is expected to create an additional 4,931 jobs per year and over $1.6 billion in Lake County’s gross domestic product (Figure 21). More specifically, IMPLAN identifies the overall impact by direct, indirect, and induced effects, which differentiate between the source of the added value.
Direct impacts represent the inherent additional expenditures associated with the construction process.
Indirect impacts are the result of other businesses supplying goods and services to those performing the construction work.
Induced impacts are the product of both project employees and indirect employees purchasing goods and services. This is also known as the induced economic effect.
Most significantly, the Route 53/120 extension is a high-road economic development project. Over a four-year period, the project would directly create over 3,000 jobs per year that pay middle-class incomes of $73,000 on average. The project will also save or create over 800 indirect jobs in industries such as manufacturing, finance, and legal services. Furthermore, construction of Route 53/120 would induce close to 1,000 jobs per year which add another $349 million to the local economy.
Figure 21: Net Economic Impact for Construction Phase (2020 dollars)
Source: Author’s analysis of total project cost inputs using IMPLAN
The construction, energy, and utilities industry and the professional, scientific, and management services industry are expected add the most jobs, equaling over 3,000 jobs combined (Figure 22). They are expected to add good-paying jobs with average annual worker incomes of about $69,000 and $75,000 for the two industries, respectively.
Inputs Low Estimate High Estimate
Construction of highway and contingencies $1,479,000,000 $1,662,000,000
Facilities management computer services (tolling) $51,000,000 $74,000,000
Drainage and sewer systems $148,000,000 $173,000,000
Environmental costs and improvements $196,000,000 $212,000,000
Architectural, engineering, and related services $410,000,000 $463,000,000
Construction and relocation of utilities $66,000,000 $66,000,000
Total $2,350,000,000 $2,650,000,000
Jobs Per YearAverage Annual Worker
Income Per Job
Total Value
Added (GDP)
Direct Effect 3,097 $73,379 $1,005,257,624
Indirect Effect 836 $62,006 $328,058,245
Induced Effect 998 $47,932 $348,925,894
Total Effect 4,931 $66,300 $1,682,241,763 Note: Assuming 4-year construction phase

19
Figure 22: Jobs Created or Saved During Construction Phase by Industry
Source: Author’s analysis of total project cost inputs using IMPLAN Constructing Route 53/120 will have broad economic costs and benefits. The proposed $0.04 motor fuel tax will impact all Lake County residents and the cost of tolls will impact motorists using the newly constructed roadway. Additionally, the project will require between $1.36 billion and $1.91 billion in additional funding from ISHTA, potentially resulting in increased tolls across the system in the Chicago region. However, these costs are nominal compared to the significant transportation improvements and corresponding regional economic benefits due to reduced congestion and improved mobility. Furthermore, as this analysis shows, middle-class construction jobs will be created and consumer demand throughout the construction phase will boost economic activity in Lake County. The Route 53/120 extension presents a variety of transportation and economic benefits and would increase the attractiveness of the Chicago region as a location to open or expand a business.
CONCLUDING OBSERVATIONS
Over the years, Route 53/120 has been surrounded by the controversy of intersecting and dividing existing communities, imposing added costs onto Lake County residents, and generally diminishing residents’ quality of life. In reality, construction of the Route 53/120 extension will provide a net benefit to the local economy and improve the quality of life for Lake County residents. Considerable population and employment growth is expected by 2040. Existing travel patterns indicate strong north-south movements, which are likely to continue and can result in future congestion along these routes. Route 53/120 has the means to reduce traffic volumes on existing routes and improve travel times. Without some form of transportation improvements, congestion will grow and cause a decline in the quality of life for existing residents. Planning appropriate projects to address expected growth is necessary in any community; Route 53/120 is an appropriate project and, when designed accordingly, can benefit Lake County residents.
Industry Jobs Per Year
Average Annual Worker
Income Per JobAgriculture, Forestry, Fishing, and Hunting 6 $24,439
Construction, Energy, and Utilities 1,864 $69,229
Manufacturing 88 $117,429
Retail and Wholesale Trade, Transportation, and Warehousing 313 $64,311
Information 38 $81,051
Finance, Insurance, and Real Estate 246 $43,489
Professional, Scientific, and Management Services 1,735 $75,181
Educational Services 56 $36,459
Health Care 154 $70,919
Social Services 39 $17,045
Arts, Entertainment, and Recreation 40 $30,428
Accommodation and Food Services 215 $24,388
Other Services 131 $45,812
Government 6 $73,461
Total 4,931 $66,300Note: Assuming 4-year construction phase
20
Recent efforts surrounding the development of Route 53/120 have put the project into the hands of the local communities. This ensures that both the design and funding are considered and decided on by local officials and stakeholders. ISHTA created the BRAC and corresponding committees to ensure local involvement; this process ultimately dictated a less-intense design that favors slower speed limits, improved site lines for nearby residences, and environmental sensitivity, all of which aid in preserving the community character. Without this input, it is probable that a typical roadway design would have been employed. Instead, local communities spoke and helped guide the design. Similarly, the Finance Committee developed relevant funding measures to address the costs of the project, some of which will impact local residents. However, their impact is appropriate and reasonable.
Motor Fuel Tax An added motor fuel tax of $0.04 per gallon will be levied within Lake County, of which 50 percent will contribute to Route 53/120 and the remaining amount will support other Lake County transportation projects. As shown above, this added cost will minimally increase annual transportation costs for a Lake County resident. This negligible cost is an appropriate contribution towards a project that will significantly improve mobility throughout Lake County; not only will those using Route 53/120 benefit from improved mobility, but congestion on nearby arterial roads is also expected to decrease by 10 percent (CMAP, 2012). Furthermore, Lake County is surrounded by counties (DuPage, Kane, and McHenry) that levy a similar tax. This tax will allow Lake County to create overall transportation improvements and maintain a competitive transportation system compared to nearby counties. Route 53/120 Tolling A standard rate of $0.20 per mile and a congestion rate of $0.29 per mile will be used on the Route 53/120. Tolls are a basic form of transportation finance that falls under the concept of “user fees,” which charge those using a particular transportation services. Consequently, only those using a tolled roadway will be impacted by the increased costs. As shown in the previous analysis, even those using the entire length of Route 53 and half of Route 120 between Waukegan and Schaumburg for a standard daily commute will benefit from the significant amount of travel time saved. It can be expected that others using the roadway for shorter distances will still find the cost of tolls worth the amount of travel time saved.
Real Estate Tax Revenue Capture - Sustainable Transportation Fund (STF) Funding for the STF will be generated by 25 percent of the increase in adjacent, new non-residential land values within one mile of the corridor and two miles of interchanges. The development to support this fund only becomes attractive and viable following the construction of Route 53/120. Consequently, the construction of the project would supply Lake County with property tax revenue that was not previously feasible.
Route 53/120 can offer substantial transportation benefits for minimal costs to the general public. Following guidance from local participation, the project will address expected growth, improve mobility within Lake County and throughout the region, create middle-class construction jobs, offer the opportunity for new local development, positively impact the region’s economy, and increase the attractiveness of the Chicago region as a location to open or expand businesses.
21
APPENDIX A
Figure 23: CMAP Municipal Aggregation of Subzones
Source: CMAP
22
Figure 24: CMAP Municipal Aggregation of Subzones in Lake County
Source: CMAP

23
APPENDIX B
Value of Travel Time Savings – Lake County Analysis The value of travel time savings (VTTS) used in the analysis was developed based on guidelines from the United States Department of Transportation (U.S. DOT). These guidelines outline the process and data required to compute the VTTS for personal and business travel for different transportation modes. These values are computed as a function of median household income and median gross compensation for personal and business travel, respectively (U.S. DOT, 2015). Figure 24 summarizes the U.S. DOT’s recommended ratios to compute the value of travel time savings.
Figure 25: Recommended Ratios to Determine Value of Travel Time Savings (per person-hour as
percentage of total earnings)
Due to the nature of the value of travel time saving being subject to ambiguity, the U.S. DOT developed both the recommended ratio and plausible ranges. Although the recommended ratio represents the most likely estimate, the plausible ranges should also be presented to show any sensitivity to potential errors (U.S. DOT, 2015). Variables The U.S. DOT identifies several variables to differentiate between which ratio is appropriate. Relevant variables and how they are used in this analysis are defined below. Hourly Income
The U.S. DOT determined that the best method to determine the VTTS is by representing it as a portion of median household income for personal travel and median hourly wage for business travel. Median household income is converted to an hourly rate by dividing by 2,080 hours per year. For the purposes of this analysis, only median household income was used because only person travel was considered. Personal vs. Business Trip purpose is identifiable by whether the trip is “on-the-clock,” thus signifying business, or is for personal purposes. The U.S. DOT considers commuting trips as personal. For the purposes of this analysis, only personal travel was considered. Local vs. Intercity Differentiating between “local” and “intercity” trips indicates that a person will typically place a higher value on time when travelling a longer distance. While there isn’t an exact definition of an intercity trip, the U.S. DOT states that intercity trips are associated with long trips that may include
Recommended
ValuePlausible Ranges
Recommended
ValuePlausible Ranges
Personal 50% 35% - 60% - -
Business 100% 80% - 120% - -
Personal 70% 60% - 90% 70% 60% - 90%
Business 100% 80% - 120% 100% 80% - 120%
CategorySurface Modes Air and High-Speed Rail Travel
Local
Intercity
TravelSource: U.S. DOT

24
additional lodging and food costs (U.S. DOT, 2015), thus indicating that trips within the Chicago region are considered local. For the purpose of this analysis, trips are being analyzed within or very near Lake County and are considered local. Surface Modes vs. Air and High-Speed Rail Travel Surface Modes include all personal vehicle and local transit trips; air and high-speed rail trips are separated due to the difference in fares and how passengers perceive the value of time. For the purposes of this analysis, trips are being analyzed only as surface modes.
VTTS Analysis for Lake County The analysis completed for this report determines the VTTS for Lake County residents performing commuting (personal) trips. First, the 2014 median household income for Lake County was identified, converted into an hourly rate, and increased to a 2016 value, as shown in Figure 25. Following the U.S. DOT’s guidelines, the 2014 median household income was increased at a rate of 1% each year.
Figure 26: 2016 Hourly Median Household Income Calculation
The hourly median household income was then used to determine the VTTS by multiplying it by the associated ratio. Figure 26 shows the calculation and final hourly value of travel time savings for local, personal, surface mode travel within Lake County in 2014.
Figure 27 : Range of 2016 Hourly Value of Travel Time Savings for Local / Personal/ Surface Mode Travel in Lake County
2014 Median Household Income $77,873.00
2014 Hourly Median Household Income $37.44
2016 Hourly Median Household Income $38.19Source: U.S. Census Bureau, 2010-2014 American Community Survey 5-year Estimate; the 2014 median
income was increased by 1.0 percent/year to determine the value for 2016, this is in accordance with
the U.S. DOT's recommendation in the VTTS guildelines
Hourly Earning Rate
Ratio Hourly Rate Hourly Value
Recommended Value 50% $38.19 $19.10
Plausible Low Value 35% $38.19 $13.37
Plausible High Value 60% $38.19 $22.91Source: U.S. DOT (Ratios)
25
REFERENCES
Blue Ribbon Advisory Council (BRAC). (2012, June 7). Illinois Route 53/120 Project Blue Ribbon Advisory Council Resolution and Summary Report. Retrieved from http://www.illinoistollway.com/documents/10157/48743/2012-06_FinalCouncilSummaryReport_web.pdf.
Chicago Metropolitan Agency for Planning (CMAP). (2012, October). Congestion Pricing: An Analysis of
the GO TO 2040 Major Capital Projects. Retrieved from http://www.cmap.illinois.gov/documents/10180/24896/FY13-0028+CONGESTION+PRICING+STUDY.pdf/ca284fd8-43ba-479a-b328-15d3a541e3fd.
Chicago Metropolitan Agency for Planning (CMAP) (a). (2014, October). GO TO 2040 Plan Update
Appendix Major Capital Projects. Retrieved from http://www.cmap.illinois.gov/documents/10180/332742/Update+Major+Capital+Projects+FINAL.pdf/51a1943f-0c2d-4243-8d94-9232f4598566.
Chicago Metropolitan Agency for Planning (CMAP) (b). (2014, October). GO TO 2040 Plan Update
Appendix Socioeconomic Forecast Update Overview. Retrieved from http://www.cmap.illinois.gov/documents/10180/332742/Update+Socioeconomic+Forecast+FINAL.pdf/41d87400-d211-4763-b941-b487022d8032.
Federal Highway Administration (FHWA). (2014, July). Integrating Context Sensitive Solutions in
Transportation Planning. Retrieved from http://www.fhwa.dot.gov/planning/csstp/integrating/csstransplan24.cfm#a4.
Federal Highway Administration (FHWA). (2015, December). Table VM-1, Annual Vehicle Distance
Traveled in Miles and Related Data. Retrieved from http://www.fhwa.dot.gov/policyinformation/statistics/2014/vm1.cfm.
Finance Committee. (2015, April 15). Illinois Route 53/120 Feasibility Analysis. Retrieved from
http://www.illinoistollway.com/documents/10157/3249733/2015+03+53-120+Finance+Committee_Final+Report.pdf.
Illinois Department of Natural Resources (IDNR). (2014, October). Illinois Threatened and Endangered
Species by County. Retrieved from https://www.dnr.illinois.gov/ESPB/Documents/ET_by_County.pdf.
IMPLAN. (2016). IMPLAN Group, LLC, IMPLAN System (data and software). 16740 Birkdale Commons
Parkway, Suite 206, Huntersville, NC 28078. Available at: www.implan.com. Lake County Board. (2009, April 14). Meeting Minutes of the Lake County Board. Retrieved from
https://lakecounty.legistar.com/View.ashx?M=M&ID=54010&GUID=400080B3-22DA-446E-83C3-4760942A0E5F.
26
Lake County Communications. (2015, December 17). Tollway Board Gives Green Light to Next Phase of Study for IL Rt. 53/120. Retrived from http://content.govdelivery.com/accounts/ILLAKE/bulletins/12ba1f0.
Land Use Committee. (2015, November 12). Illinois Route 53/120 Corridor Land Use Strategy.
Retrieved from https://www.dropbox.com/s/jblte0tep828alk/53-120%20FINAL-Reduced.pdf?dl=0.
U.S. Census Bureau. (2014). OnTheMap Application. Longitudinal-Employer Household Dynamics
Program. Retrieved from http://onthemap.ces.census.gov/. U.S. Department of Transportation (U.S. DOT). (2015). The Value of Travel Time Savings: Departmental
Guidance for Conducting Economic Evaluations Revision 2. Retrieved from https://www.transportation.gov/sites/dot.gov/files/docs/Revised%20Departmental%20Guidance%20on%20Valuation%20of%20Travel%20Time%20in%20Economic%20Analysis.pdf.
U.S. Energy Information Administration. (2016, August). Monthly Energy Review. Retrieved from
http://www.eia.gov/totalenergy/data/monthly/pdf/mer.pdf. U.S. Fish and Wildlife Service (USFWS). (2015, September). Illinois County Distribution: Federally
Endangered, Threatened, and Candidate Species. Retrieved from https://www.fws.gov/midwest/endangered/lists/illinois-cty.html.
Vowels, Scott. (2012). The Economic Impact of NCMSDC Certified Minority Businesses on Northern
California. The Northern California Minority Supplier Development Council. Retrieved from http://www.wrmsdc.org/docs/EconomicImpactStudySummary.pdf.
We Ask America. (2015). “Lake County Route 53 Extension Poll.” 923 responses on October 14, 2015,
with a margin of error of ±3.23%. Retrieved from http://www.lcca-il.org/news/nov2015/53.pdf.