Embed Size (px)
Citation preview
National Energy Technology Laboratory
OFFICE OF FOSSIL ENERGY
James Littlefield Booz|Allen|Hamilton October 7, 2014
Understanding the Importance of Leakage Rates to the GHG Footprint of Natural Gas Production
LCA XIV – San Francisco, CA

2 OFFICE OF FOSSIL ENERGY
Natural gas (NG) leakage is misunderstood from a life cycle perspective
Source: http://thinkprogress.org/climate/2014/06/04/3443211/energy-department-lng-no-climate-benefits/
• Upstream methane (CH4) is a significant contributor to NG life cycle greenhouse gas (GHG) emissions
• NG leakage rates are often compared without considering boundaries and representativeness
“…it seems conservative to take the middle of the range, 5.4%. That’s particularly conservative given that 3 separate studies by NOAA found leakage rates just from NG production of 4%, 17%, and 6-12%!"
3 OFFICE OF FOSSIL ENERGY
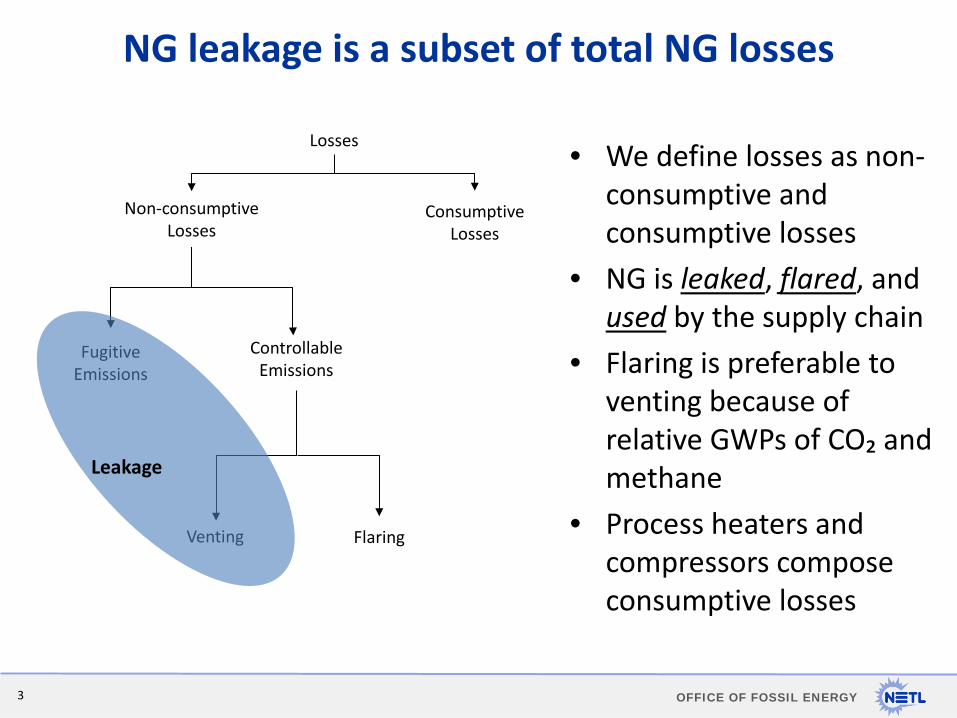
NG leakage is a subset of total NG losses
• We define losses as non-consumptive and consumptive losses
• NG is leaked, flared, and used by the supply chain
• Flaring is preferable to venting because of relative GWPs of CO₂ and methane
• Process heaters and compressors compose consumptive losses
Losses
Controllable Emissions
Fugitive Emissions
Venting Flaring
Leakage
Non-consumptive Losses
Consumptive Losses
4 OFFICE OF FOSSIL ENERGY
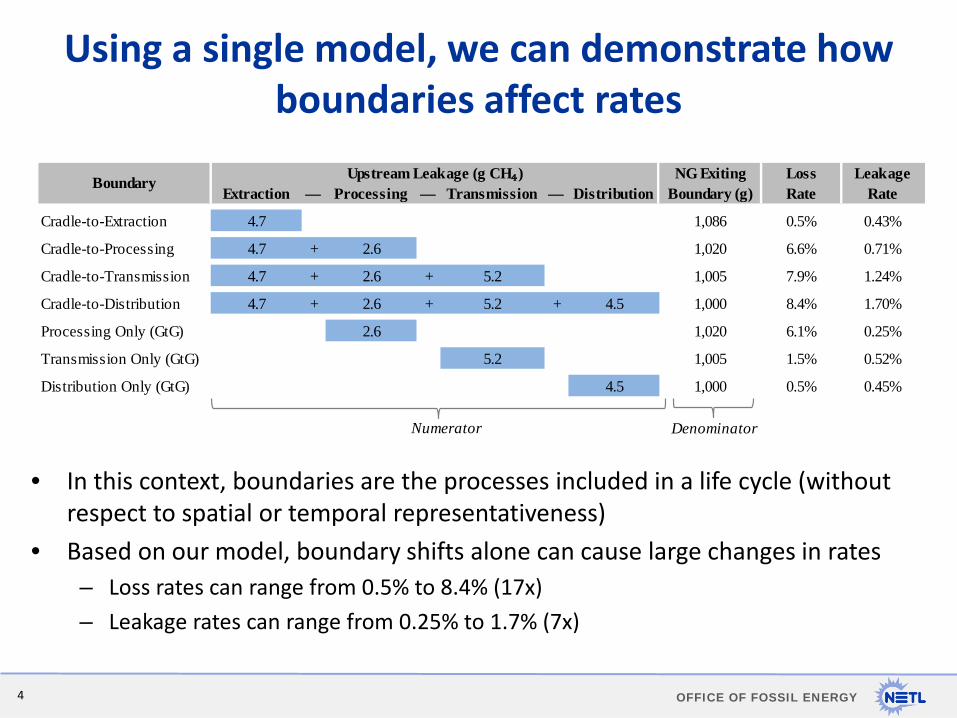
Using a single model, we can demonstrate how boundaries affect rates
LossExtraction — Processing — Transmission — Distribution Rate
Cradle-to-Extraction 4.7 1,086 0.5% 0.43%
Cradle-to-Processing 4.7 + 2.6 1,020 6.6% 0.71%
Cradle-to-Transmission 4.7 + 2.6 + 5.2 1,005 7.9% 1.24%
Cradle-to-Distribution 4.7 + 2.6 + 5.2 + 4.5 1,000 8.4% 1.70%
Processing Only (GtG) 2.6 1,020 6.1% 0.25%
Transmission Only (GtG) 5.2 1,005 1.5% 0.52%
Distribution Only (GtG) 4.5 1,000 0.5% 0.45%
Boundary Upstream Leakage (g CH₄) NG ExitingBoundary (g)
Leakage Rate
Numerator Denominator
• In this context, boundaries are the processes included in a life cycle (without respect to spatial or temporal representativeness)
• Based on our model, boundary shifts alone can cause large changes in rates – Loss rates can range from 0.5% to 8.4% (17x) – Leakage rates can range from 0.25% to 1.7% (7x)
5 OFFICE OF FOSSIL ENERGY
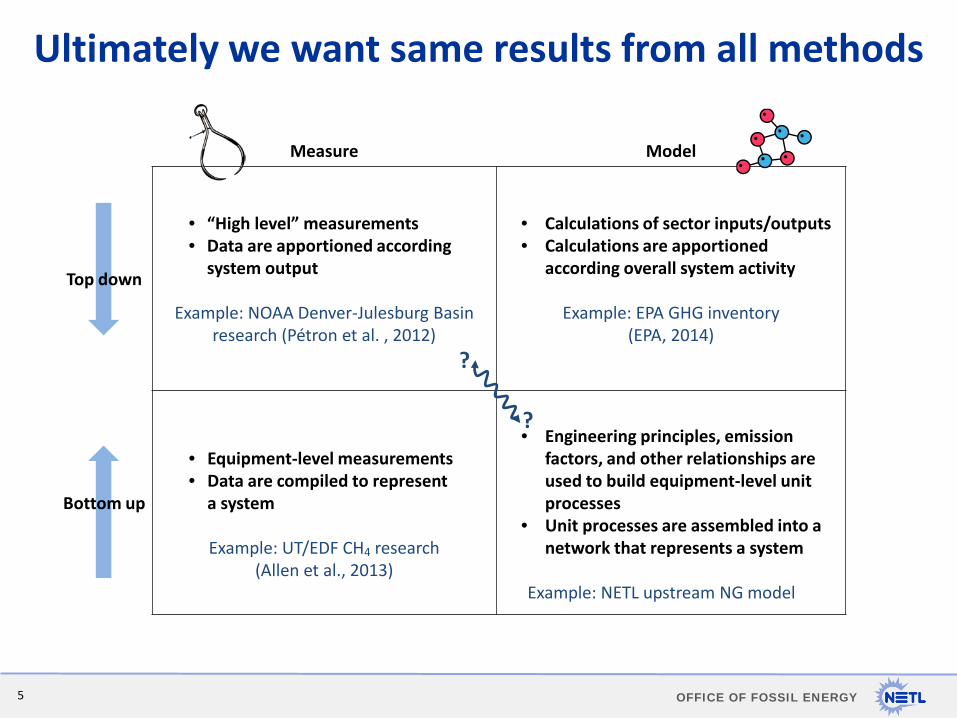
Measure Model
Top down
• “High level” measurements • Data are apportioned according
system output
Example: NOAA Denver-Julesburg Basin research (Pétron et al. , 2012)
• Calculations of sector inputs/outputs • Calculations are apportioned
according overall system activity
Example: EPA GHG inventory (EPA, 2014)
Bottom up
• Equipment-level measurements • Data are compiled to represent
a system Example: UT/EDF CH4 research
(Allen et al., 2013)
• Engineering principles, emission
factors, and other relationships are used to build equipment-level unit processes
• Unit processes are assembled into a network that represents a system
Example: NETL upstream NG model
Ultimately we want same results from all methods
?
?
6 OFFICE OF FOSSIL ENERGY
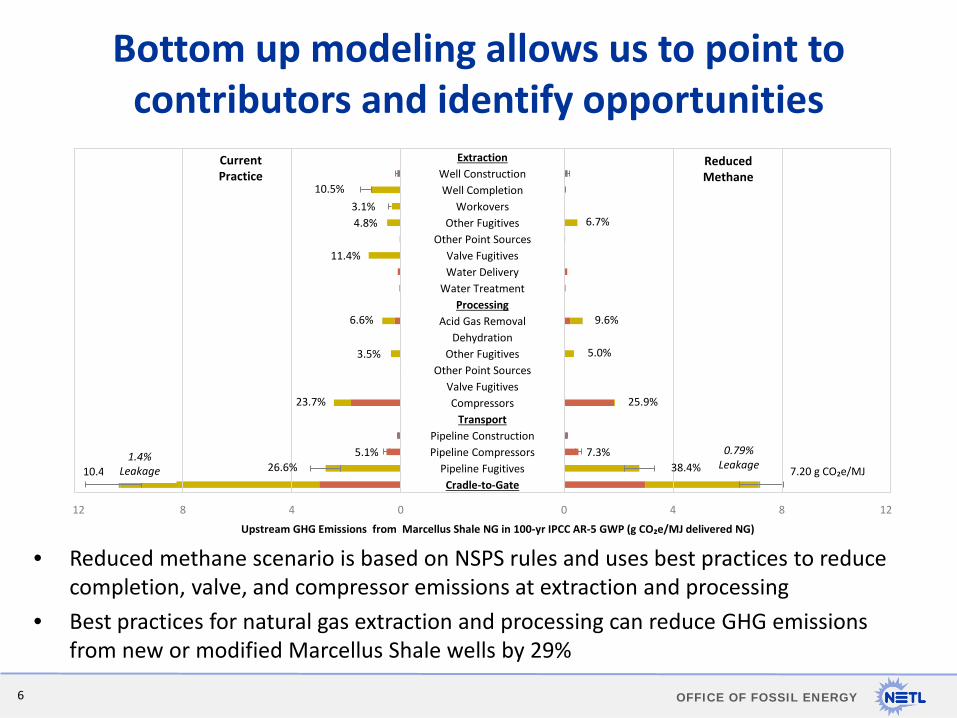
Bottom up modeling allows us to point to contributors and identify opportunities
• Reduced methane scenario is based on NSPS rules and uses best practices to reduce completion, valve, and compressor emissions at extraction and processing
• Best practices for natural gas extraction and processing can reduce GHG emissions from new or modified Marcellus Shale wells by 29%
10.4 g CO₂e/MJ 26.6% 5.1%
23.7%
3.5%
6.6%
11.4%
4.8% 3.1%
10.5%
Cradle-to-Gate Pipeline Fugitives
Pipeline Compressors Pipeline Construction
Transport Compressors
Valve Fugitives Other Point Sources
Other Fugitives Dehydration
Acid Gas Removal Processing
Water Treatment Water Delivery Valve Fugitives
Other Point Sources Other Fugitives
Workovers Well Completion
Well Construction Extraction
7.20 g CO₂e/MJ 38.4% 7.3%
25.9%
5.0%
9.6%
6.7%
12 8 4 0 0 4 8 12
Upstream GHG Emissions from Marcellus Shale NG in 100-yr IPCC AR-5 GWP (g CO₂e/MJ delivered NG)
Current Practice
Reduced Methane
1.4% Leakage
0.79% Leakage

7 OFFICE OF FOSSIL ENERGY
Life cycle of delivered electricity is an equivalent basis for comparing natural gas and coal
• Our calculated leakage rates are well below the breakeven leakage rates • Results are sensitive to GWP timeframe
Fleet Coal 5.9%
Fleet Coal 15.8% New
Coal 4.5%
New Coal
11.9%
0
500
1,000
1,500
0% 5% 10% 15% 20%
g CO
₂e/k
Wh
CH₄ Leakage Rate
20-yr GWP
100-yr GWP
Coal-Gas Breakeven
Current Practice (1.2%)
Reduced CH₄ (0.8%)

8 OFFICE OF FOSSIL ENERGY
Technology warming potential (TWP) calculates radiative forcing each year
• TWP method developed by EDF as a way to compare life cycle GHGs of different applications without selecting a specific time frame (Alvarez, 2012)
• Intersections between natural gas scenarios and horizontal line (y=1) show number of years at which natural gas and coal systems have same cumulative radiative forcing
1
0 30 60 90 120 150 180
Tech
nolo
gy W
arm
ing
Pote
ntia
l
t (years)
Reduced CH₄
Current Practice
4.5% Leakage Rate(20-year Adv. Coal Breakeven)11.9% Leakage Rate(100-year Adv. Coal Breakeven)
9 OFFICE OF FOSSIL ENERGY
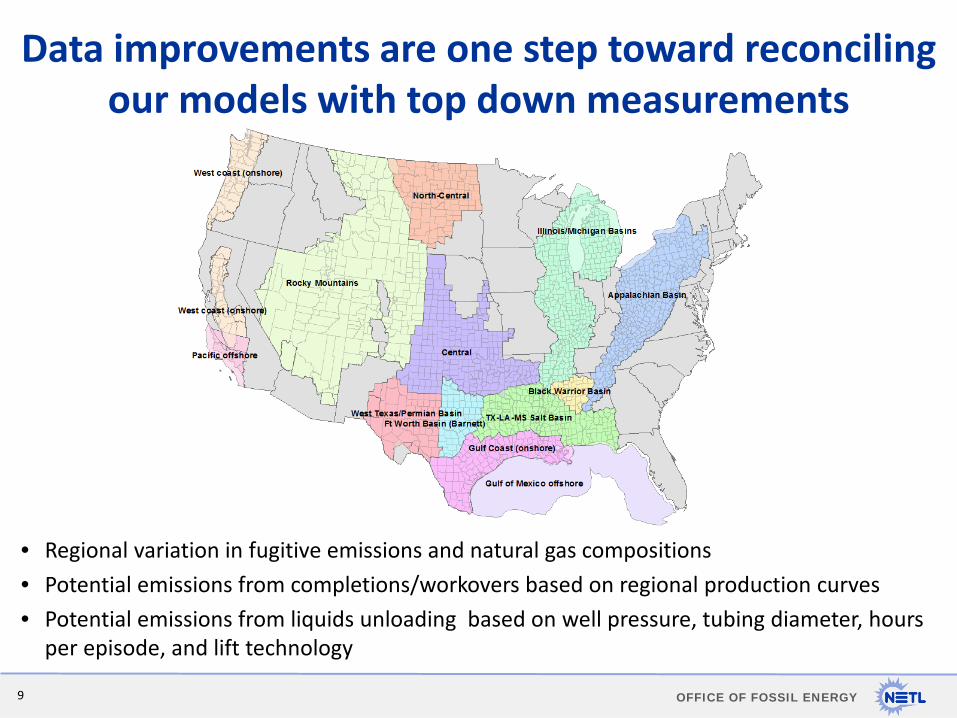
Data improvements are one step toward reconciling our models with top down measurements
• Regional variation in fugitive emissions and natural gas compositions • Potential emissions from completions/workovers based on regional production curves • Potential emissions from liquids unloading based on well pressure, tubing diameter, hours
per episode, and lift technology
10 OFFICE OF FOSSIL ENERGY
Summary
• Conclusions about natural gas leakage are often confounded by boundary inconsistencies and representativeness
• Bottom-up modeling approach has allowed NETL to respond to questions about natural gas leakage
• Reconciliation between top-down and bottom-up models is possible, but requires research
• Data improvements will further increase the accuracy and representativeness of NETL’s results

11 OFFICE OF FOSSIL ENERGY
Contact Us Timothy J. Skone, P.E. Senior Environmental Engineer • Strategic Energy Analysis and Planning Division • (412) 386-4495 • [email protected]
Joe Marriott, Ph.D. Lead Associate • Booz|Allen|Hamilton • (412) 386-7557 • [email protected]
James Littlefield Associate • Booz|Allen|Hamilton • (412) 386-7560 • [email protected]
netl.doe.gov/lca/ [email protected] @NETL_News

12 OFFICE OF FOSSIL ENERGY
References Allen, D. T., Torres, V.M., Thomas, J., Sullivan, D.W., Harrison, M., Hendler, A., Herndon, S.C., Kolb, C.E., Fraser, M.P.,
Hill, A.D., Lamb, B.K., Miskimins, J., Sawyer, R.F. & Seinfeld, J.H. (2013). Measurements of methane emissions at natural gas production sites in the United States. Proceedings of the National Academy of Sciences, 110(44), 17768-17773.
Alvarez, R. A., Pacala, S. W., Winebrake, J. J., Chameides, W. L., & Hamburg, S. P. (2012). Greater focus needed on
methane leakage from natural gas infrastructure. Proceedings of the National Academy of Sciences, 109(17), 6435-6440.
Brandt, A.R., Heath, G.A., Kort, E.A., O’Sullivan, F., Pétron, G., Jordaan, S.M., Tans, P., Wilcox, J., Gopstein, A.M., Arent, D., Wofsy, S., Brown, N.J., Bradley, R., Stucky, G.D., Eardley, D., Harriss, R. (2014). Methane Leaks from North American Natural Gas Systems. Science. Vol. 343, no. 6172, pp. 733-735.
EPA (2014). Inventory U.S. Greenhouse Gas Emissions and Sinks: 1990-2012. EPA 430-R-14-003. U.S. Environmental Production Agency.
Pétron, G., Frost, G., Miller, B.R., Hirsch, A.I., Montzka, S.A., Karion, A., Trainer, M., Sweeney, C., Andrews, A.E., Miller, L., Kofler, J., Bar-Ilan, A., Dlugokencky, E.J., Patrick, L., Moore Jr., C.T., Ryerson, T.B., Siso, C., Kolodzey, W., Lang, P.M., Conway, T., Novelli, P., Masarie, K., Hall, B., Guenther, D., Kitzis, D., Miller, J., Welsh, D., Wolfe, D., Neff, W. & Tans, P. (2012). Hydrocarbon emissions characterization in the Colorado Front Range: A pilot study. Journal of Geophysical Research: Atmospheres (1984–2012), 117(D4).
Romm, J. (2014). Energy Department Bombshell: LNG Has No Climate Benefit For Decades, IF EVER*. Thinkprogress.org. Accessed on October 2, 2014 at http://thinkprogress.org/climate/2014/06/04/3443211/energy-department-lng-no-climate-benefits/

13 OFFICE OF FOSSIL ENERGY
Our models use a variety of data sources
Lege
nd
14 OFFICE OF FOSSIL ENERGY
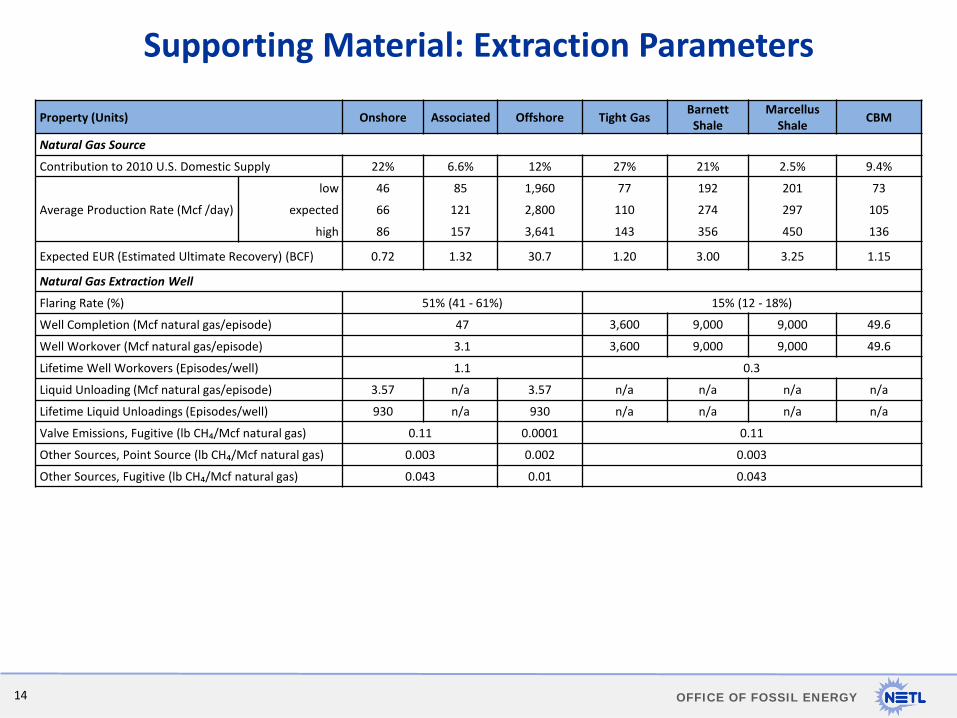
Supporting Material: Extraction Parameters
Property (Units) Onshore Associated Offshore Tight Gas Barnett Shale
Marcellus Shale CBM
Natural Gas Source Contribution to 2010 U.S. Domestic Supply 22% 6.6% 12% 27% 21% 2.5% 9.4%
Average Production Rate (Mcf /day) low 46 85 1,960 77 192 201 73
expected 66 121 2,800 110 274 297 105 high 86 157 3,641 143 356 450 136
Expected EUR (Estimated Ultimate Recovery) (BCF) 0.72 1.32 30.7 1.20 3.00 3.25 1.15
Natural Gas Extraction Well Flaring Rate (%) 51% (41 - 61%) 15% (12 - 18%) Well Completion (Mcf natural gas/episode) 47 3,600 9,000 9,000 49.6
Well Workover (Mcf natural gas/episode) 3.1 3,600 9,000 9,000 49.6
Lifetime Well Workovers (Episodes/well) 1.1 0.3 Liquid Unloading (Mcf natural gas/episode) 3.57 n/a 3.57 n/a n/a n/a n/a Lifetime Liquid Unloadings (Episodes/well) 930 n/a 930 n/a n/a n/a n/a Valve Emissions, Fugitive (lb CH₄/Mcf natural gas) 0.11 0.0001 0.11 Other Sources, Point Source (lb CH₄/Mcf natural gas) 0.003 0.002 0.003 Other Sources, Fugitive (lb CH₄/Mcf natural gas) 0.043 0.01 0.043
15 OFFICE OF FOSSIL ENERGY
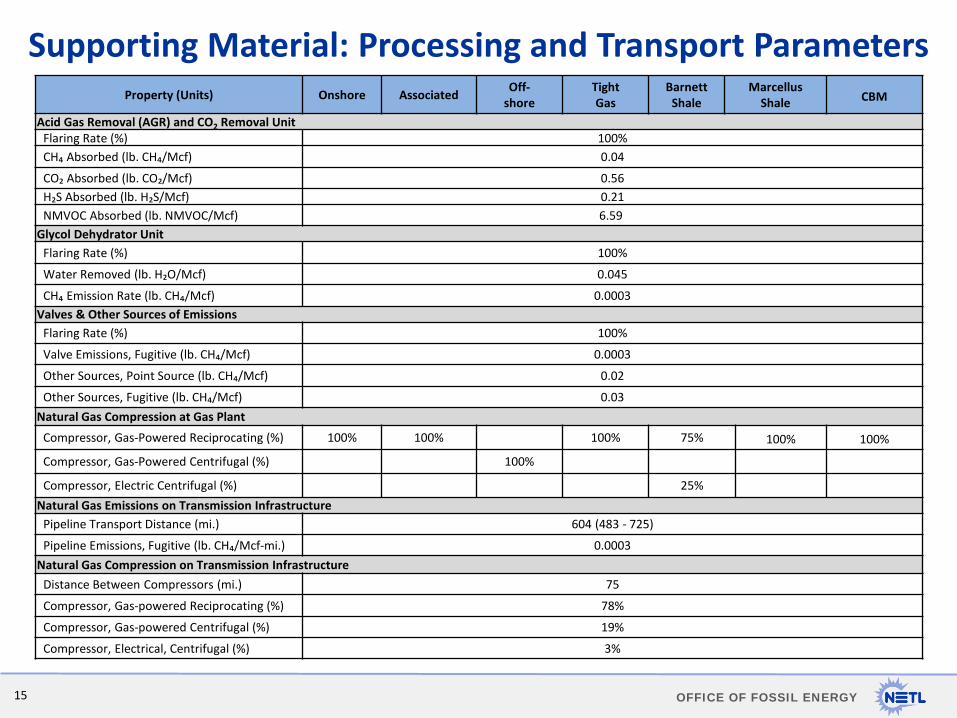
Supporting Material: Processing and Transport Parameters Property (Units) Onshore Associated Off-
shore Tight Gas
Barnett Shale
Marcellus Shale CBM
Acid Gas Removal (AGR) and CO2 Removal Unit Flaring Rate (%) 100% CH₄ Absorbed (lb. CH₄/Mcf) 0.04
CO₂ Absorbed (lb. CO₂/Mcf) 0.56 H₂S Absorbed (lb. H₂S/Mcf) 0.21 NMVOC Absorbed (lb. NMVOC/Mcf) 6.59
Glycol Dehydrator Unit Flaring Rate (%) 100%
Water Removed (lb. H₂O/Mcf) 0.045
CH₄ Emission Rate (lb. CH₄/Mcf) 0.0003 Valves & Other Sources of Emissions
Flaring Rate (%) 100%
Valve Emissions, Fugitive (lb. CH₄/Mcf) 0.0003
Other Sources, Point Source (lb. CH₄/Mcf) 0.02
Other Sources, Fugitive (lb. CH₄/Mcf) 0.03 Natural Gas Compression at Gas Plant
Compressor, Gas-Powered Reciprocating (%) 100% 100% 100% 75% 100% 100%
Compressor, Gas-Powered Centrifugal (%) 100%
Compressor, Electric Centrifugal (%) 25%
Natural Gas Emissions on Transmission Infrastructure Pipeline Transport Distance (mi.) 604 (483 - 725)
Pipeline Emissions, Fugitive (lb. CH₄/Mcf-mi.) 0.0003 Natural Gas Compression on Transmission Infrastructure
Distance Between Compressors (mi.) 75
Compressor, Gas-powered Reciprocating (%) 78%
Compressor, Gas-powered Centrifugal (%) 19%
Compressor, Electrical, Centrifugal (%) 3%
16 OFFICE OF FOSSIL ENERGY
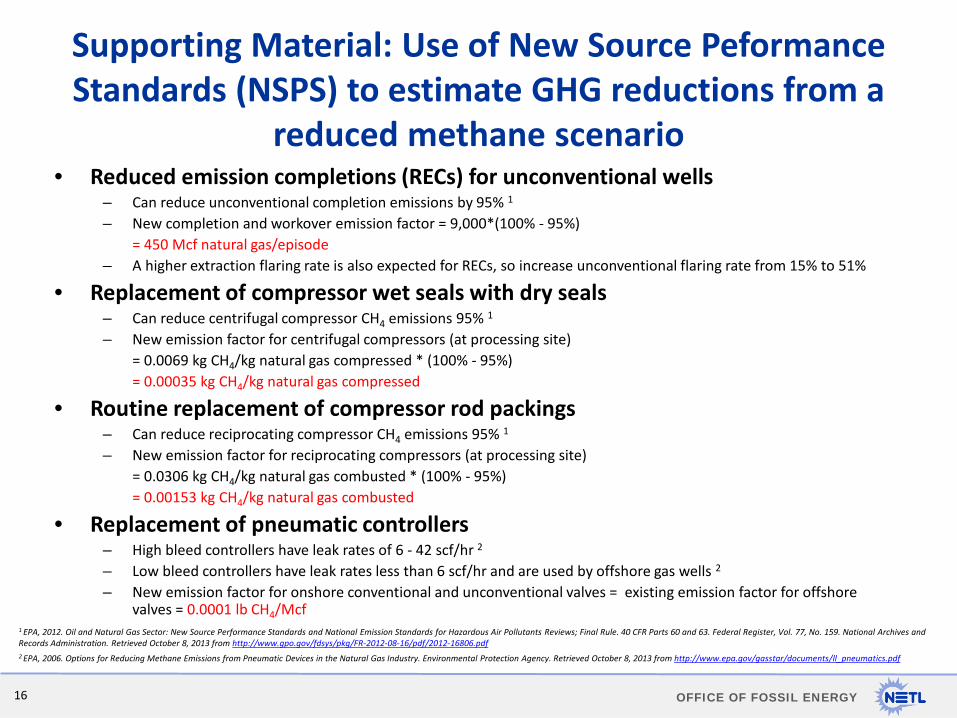
• Reduced emission completions (RECs) for unconventional wells – Can reduce unconventional completion emissions by 95% 1
– New completion and workover emission factor = 9,000*(100% - 95%) = 450 Mcf natural gas/episode – A higher extraction flaring rate is also expected for RECs, so increase unconventional flaring rate from 15% to 51%
• Replacement of compressor wet seals with dry seals – Can reduce centrifugal compressor CH4 emissions 95% 1 – New emission factor for centrifugal compressors (at processing site) = 0.0069 kg CH4/kg natural gas compressed * (100% - 95%) = 0.00035 kg CH4/kg natural gas compressed
• Routine replacement of compressor rod packings – Can reduce reciprocating compressor CH4 emissions 95% 1 – New emission factor for reciprocating compressors (at processing site) = 0.0306 kg CH4/kg natural gas combusted * (100% - 95%) = 0.00153 kg CH4/kg natural gas combusted
• Replacement of pneumatic controllers – High bleed controllers have leak rates of 6 - 42 scf/hr 2
– Low bleed controllers have leak rates less than 6 scf/hr and are used by offshore gas wells 2
– New emission factor for onshore conventional and unconventional valves = existing emission factor for offshore valves = 0.0001 lb CH4/Mcf
Supporting Material: Use of New Source Peformance Standards (NSPS) to estimate GHG reductions from a
reduced methane scenario
1 EPA, 2012. Oil and Natural Gas Sector: New Source Performance Standards and National Emission Standards for Hazardous Air Pollutants Reviews; Final Rule. 40 CFR Parts 60 and 63. Federal Register, Vol. 77, No. 159. National Archives and Records Administration. Retrieved October 8, 2013 from http://www.gpo.gov/fdsys/pkg/FR-2012-08-16/pdf/2012-16806.pdf 2 EPA, 2006. Options for Reducing Methane Emissions from Pneumatic Devices in the Natural Gas Industry. Environmental Protection Agency. Retrieved October 8, 2013 from http://www.epa.gov/gasstar/documents/ll_pneumatics.pdf

17 OFFICE OF FOSSIL ENERGY
• EPA GHG Inventory (as defined in Subpart W1)
– Vented emissions are “intentional or designed releases of CH₄ or CO₂ containing natural gas or hydrocarbon gas (not including stationary combustion flue gas), including process designed flow to the atmosphere through seals or vent pipes, equipment blowdown for maintenance, and direct venting of gas used to power equipment (such as pneumatic devices)”
– Fugitive emissions “could not reasonably pass through a stack, chimney, vent, or other functionally-equivalent opening”
– Combustion emissions “result from the use of petroleum-derived fuels and natural gas as fuel in equipment (e.g., heaters, engines, furnaces, etc.) in the petroleum and gas industry”
• Intergovernmental Panel on Climate Change (IPCC)2 broadly defines all venting, flaring, and other non-fuel-combustion emissions as fugitives
– Fugitives include • “venting of natural gas and waste gas/vapour streams at gas facilities” • “flaring of natural gas and waste gas/vapour streams at gas facilities” • “equipment leaks, storage losses, pipeline breaks, well blowouts, gas migration to the surface
around the outside of wellhead casing, surface casing vent bows and any other gas or vapour releases not specifically accounted for as venting or flaring"
• Energy Information Administration (EIA) Natural Gas Reporting3
– Fugitive emissions are “ unintended leaks of gas from the processing, transmission, and/or transportation of fossil fuels”
– Extraction losses include volumes of natural gas used at production (lease) site and by processing losses.
• Natural gas used at the production site includes (1) the volume returned to reservoirs in cycling, repressuring of oil reservoirs, and conservation operations; and (2) gas vented and flared
• Processing losses incudes (1) nonhydrocarbon gases (e.g., water vapor, carbon dioxide, helium, hydrogen sulfide, and nitrogen) removed from the gas stream; and (2) gas converted to liquid form, such as lease condensate and plant liquids
Supporting Material: Natural gas losses are not defined consistently
1 EPA (2011) Background Technical Support Document – Petroleum and Natural Gas Industry. Retrieved November 18, 2013 from http://www.epa.gov/ghgreporting/documents/pdf/2010/Subpart-W_TSD.pdf 2 IPCC (2006). 2006 IPCC Guidelines for National GHG Inventories. Retrieved November 18, 2013 from http://www.ipcc-nggip.iges.or.jp/public/2006gl/pdf/2_Volume2/V2_4_Ch4_Fugitive_Emissions.pdf 3 EIA Glossary: http://www.eia.gov/tools/glossary/index.cfm