Embed Size (px)
Citation preview

UNDERSTANDING THE GAMING PAYMENTS EXPERIENCE
3
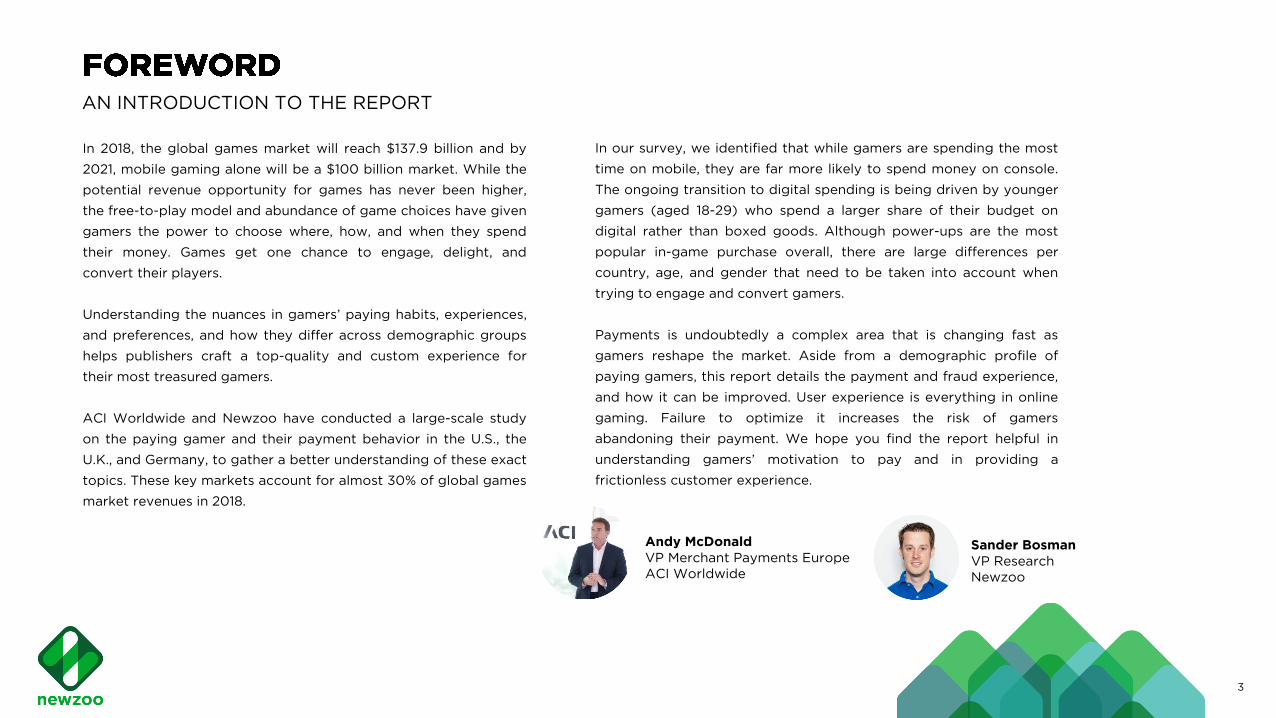
AN INTRODUCTION TO THE REPORT
In 2018, the global games market will reach $137.9 billion and by
2021, mobile gaming alone will be a $100 billion market. While the
potential revenue opportunity for games has never been higher,
the free-to-play model and abundance of game choices have given
gamers the power to choose where, how, and when they spend
their money. Games get one chance to engage, delight, and
convert their players.
Understanding the nuances in gamers’ paying habits, experiences,
and preferences, and how they differ across demographic groups
helps publishers craft a top-quality and custom experience for
their most treasured gamers.
ACI Worldwide and Newzoo have conducted a large-scale study
on the paying gamer and their payment behavior in the U.S., the
U.K., and Germany, to gather a better understanding of these exact
topics. These key markets account for almost 30% of global games
market revenues in 2018.
In our survey, we identified that while gamers are spending the most
time on mobile, they are far more likely to spend money on console.
The ongoing transition to digital spending is being driven by younger
gamers (aged 18-29) who spend a larger share of their budget on
digital rather than boxed goods. Although power-ups are the most
popular in-game purchase overall, there are large differences per
country, age, and gender that need to be taken into account when
trying to engage and convert gamers.
Payments is undoubtedly a complex area that is changing fast as
gamers reshape the market. Aside from a demographic profile of
paying gamers, this report details the payment and fraud experience,
and how it can be improved. User experience is everything in online
gaming. Failure to optimize it increases the risk of gamers
abandoning their payment. We hope you find the report helpful in
understanding gamers’ motivation to pay and in providing a
frictionless customer experience.
Sander Bosman
VP Research
Newzoo
Andy McDonald
VP Merchant Payments Europe
ACI Worldwide


5
Mobile games are the most popular
segment in all three countries, played by
more than 90% of gamers. In Germany,
one of the biggest PC gaming markets in
Europe, console games are noticeably
less popular than in the U.S. and the U.K.
MOBILE IS THE MOST-PLAYED
GAMING SEGMENT
Looking at the devices that gamers are
using on each platform, German gamers
diverge from the others; 60% use Android
devices to play mobile games, compared
to less than half of U.S. and U.K gamers.
They are also much more likely to be
using a PC (versus a laptop or Mac) for
PC games and less likely to be using a
PS4 on console.
GERMAN GAMERS HAVE
DIFFERENT DEVICE PREFERENCES
Modern gamers are not exclusively loyal
to one gaming platform. Over 70% of
gamers across the three countries are
playing games on mobile, console, and
PC. Many publishers are catering to this
trend by releasing and optimizing titles
for each platform. In terms of franchises,
Mario is still the most played title overall
with newcomer Fortnite at #5.
MAJORITY OF GAMERS PLAY ON
ALL PLATFORMS
© copyright Newzoo 2018

95%87% 85%
94%85% 85%
91% 88%
75%
Mobile PC Console Mobile PC Console Mobile PC Console
6
SHARE OF GAMERS PER PLATFORM PER COUNTRY | MOBILE, PC, CONSOLE
SHARE OF GAMERS | PER PLATFORM
Base: Play games on any platform for at least 2 hours per week. © copyright Newzoo 2018
of gamers across the three countries are playing mobile
titles.
German gamers have traditionally preferred PC gaming over
console and this is the only market where PC is far more
popular than console.
Looking at hours spent, gamers also spend the most time on
mobile, with 33% of mobile gamers playing for more than six
hours a week across the three countries.
PayPal is the preferred payment method for each gaming
platform, in every country.PAYMENT
METHOD
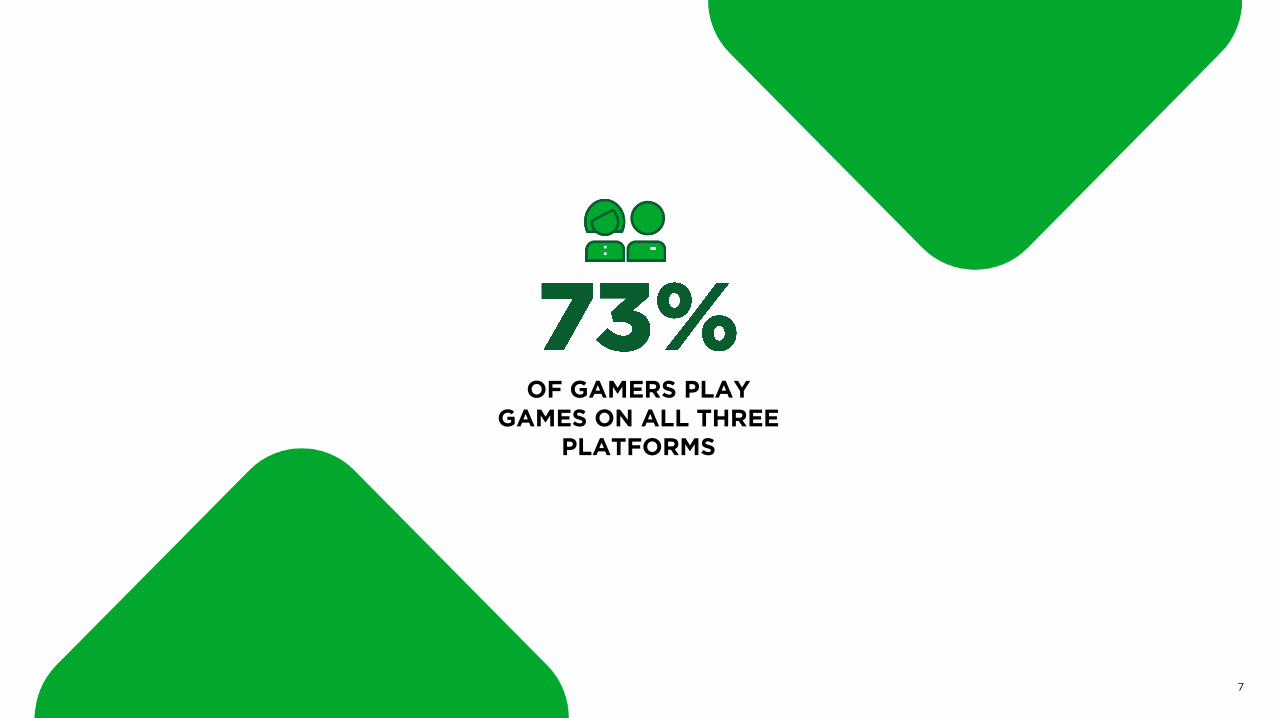
OF GAMERS PLAY
GAMES ON ALL THREE
PLATFORMS
7

© copyright Newzoo 2018 8
Android devices are the most popular mobile devices
for gaming, followed by the iPhone.
SMARTPHONE
SHARE OF GAMERS
WHO OWN AND USE
ANDROID FOR GAMING
49% 44% 60%
PlayStation 4 (incl. Slim and Pro) is the most popular
console device, owned and used by 42% of gamers, while
28% own and use an Xbox One (incl. X or S).
CONSOLE
SHARE OF GAMERS
WHO OWN AND USE A
PS4 FOR GAMING
43% 45% 35%
56% of gamers own and use a PC to play games,
compared to 10% who own and use a Mac.
PC
SHARE OF GAMERS
WHO OWN AND USE A
PC FOR GAMING
55% 49% 66%

MOST PLAYED FRANCHISES PER COUNTRY
9
FRANCHISES U.S. U.K. GERMANY
MARIO 38% 26% 26%
CALL OF DUTY 37% 33% 18%
CANDY CRUSH SAGA 35% 26% 23%
GRAND THEFT AUTO 32% 36% 25%
FORTNITE 35% 26% 17%
POKÉMON 30% 21% 18%
MINECRAFT 27% 18% 14%
ASSASSIN'S CREED 24% 25% 19%
CLASH OF CLANS 23% 14% 15%
FIFA 17% 32% 22%
We also looked at gamers’ favorite genres and saw that 55%
of players enjoy action/adventure games, making this the
most popular genre across the three countries. Strategy is
the second most popular genre overall (50%), but is less
popular in the U.K. than the other countries (41%).
The casino genre is notably more popular in the U.S. (22%)
than in the U.K. (13%) and Germany (11%).
GENRES
FRANCHISES
Base: Play games on any platform for at least 2 hours per week.
TOP FRANCHISES PLAYED IN THE LAST 3 MONTHS
of players in the U.S. play Mario, where it’s the number one
title. It’s also the top title in Germany. In the U.K., Grand
Theft Auto is the most popular game with a 36% player
share. Overall, German gamers are less likely to be playing
all of the top franchises.
© copyright Newzoo 2018

11
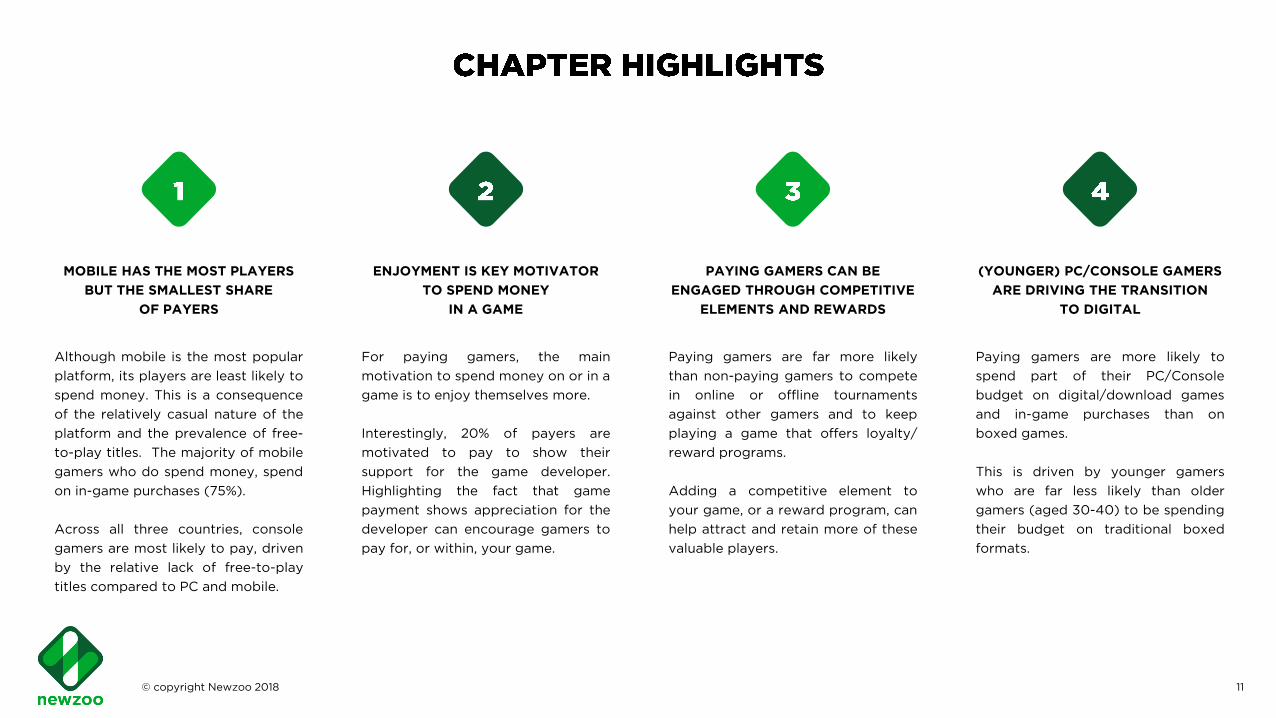
PAYING GAMERS CAN BE
ENGAGED THROUGH COMPETITIVE
ELEMENTS AND REWARDS
Paying gamers are far more likely
than non-paying gamers to compete
in online or offline tournaments
against other gamers and to keep
playing a game that offers loyalty/
reward programs.
Adding a competitive element to
your game, or a reward program, can
help attract and retain more of these
valuable players.
(YOUNGER) PC/CONSOLE GAMERS
ARE DRIVING THE TRANSITION
TO DIGITAL
Paying gamers are more likely to
spend part of their PC/Console
budget on digital/download games
and in-game purchases than on
boxed games.
This is driven by younger gamers
who are far less likely than older
gamers (aged 30-40) to be spending
their budget on traditional boxed
formats.
MOBILE HAS THE MOST PLAYERS
BUT THE SMALLEST SHARE
OF PAYERS
Although mobile is the most popular
platform, its players are least likely to
spend money. This is a consequence
of the relatively casual nature of the
platform and the prevalence of free-
to-play titles. The majority of mobile
gamers who do spend money, spend
on in-game purchases (75%).
Across all three countries, console
gamers are most likely to pay, driven
by the relative lack of free-to-play
titles compared to PC and mobile.
ENJOYMENT IS KEY MOTIVATOR
TO SPEND MONEY
IN A GAME
For paying gamers, the main
motivation to spend money on or in a
game is to enjoy themselves more.
Interestingly, 20% of payers are
motivated to pay to show their
support for the game developer.
Highlighting the fact that game
payment shows appreciation for the
developer can encourage gamers to
pay for, or within, your game.
© copyright Newzoo 2018

SHARE OF U.S. GAMERS WHO PAY PER PLATFORM, GENDER COMPARISON
12
76%70%
63%60%
54%56%
Console PC Mobile
of American men who play console games spend money on
them. With 70% of all console players paying for console
games, console has the highest ratio of payers to players
compared to the other gaming platforms.
Men Women
Base: Gamers who play games on that platform
YOUNG PAYERS
(18-29)
OLDER PAYERS
(30-40)
CONSOLE 72% 73%
PC 71% 70%
MOBILE 55% 58%
SHARE OF PLAYERS THAT ARE AVERAGE/BIG SPENDERS*
SHARE OF PAYING GAMERS PER PLATFORM
© copyright Newzoo 2018
*Average/big spenders spend at least $5 per month on the relevant platform
AGE

AGE-GENDER AND KEY FACTS ON GAMERS WHO SPEND MONEY
13
24%
30%11%
15%
15%
5%
65%of American
paying gamers
are male
Men
18-25
Men
26-35
Men
36-40
Women
18-25
Women
26-35
Women
36-40
Base: Play games on any platform for at least 2 hours per week AND pay on or in games. © copyright Newzoo 2018
KEY FACTS ON THE PAYING GAMER | U.S.
are more likely to keep playing a game if it
offers loyalty/reward programs vs. 61% of non-payers.
compete in online or offline tournaments
against other gamers (28% for men and 19% for women)
vs. 5% of non-payers.
have gambled for real money in the past 6
months vs. 12% of non-payers.

SHARE OF U.K. GAMERS WHO PAY PER PLATFORM, GENDER COMPARISON
14
71%66%
49%
60%
49% 48%
Console PC Mobile
Men Women
YOUNG PAYERS
(18-29)
OLDER PAYERS
(30-40)
CONSOLE 73% 74%
PC 62% 73%
MOBILE 43% 46%
SHARE OF PLAYERS THAT ARE AVERAGE/BIG SPENDERS*
*Average/big spenders spend at least $5 per month on the relevant platform
of men and 48% of women who play mobile games spend
money on them.
This is interesting as there is a much bigger gender gap
when it comes to paying on the other platforms. This is
especially true for PC where 66% of men and 49% of women
spend money.
AGE
© copyright Newzoo 2018
Base: Gamers who play games on that platform
SHARE OF PAYING GAMERS PER PLATFORM
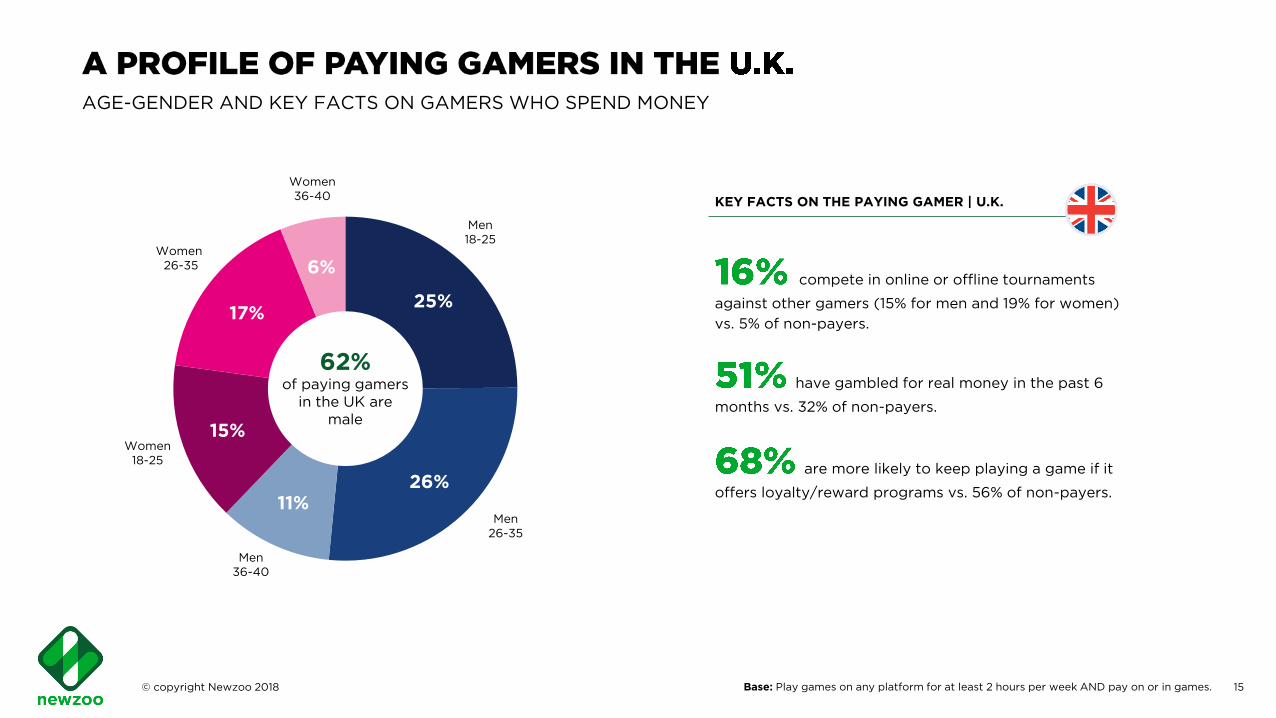
15
are more likely to keep playing a game if it
offers loyalty/reward programs vs. 56% of non-payers.
compete in online or offline tournaments
against other gamers (15% for men and 19% for women)
vs. 5% of non-payers.
have gambled for real money in the past 6
months vs. 32% of non-payers.
AGE-GENDER AND KEY FACTS ON GAMERS WHO SPEND MONEY
Base: Play games on any platform for at least 2 hours per week AND pay on or in games.
25%
26%
11%
15%
17%
6%
62%of paying gamers
in the UK are
male
Men
18-25
Men
26-35
Men
36-40
Women
18-25
Women
26-35
Women
36-40KEY FACTS ON THE PAYING GAMER | U.K.
© copyright Newzoo 2018

SHARE OF GERMAN GAMERS WHO PAY PER PLATFORM, GENDER COMPARISON
16
65% 63%
46%
60%
46%
39%
Console PC Mobile
Men Women of men who play console games in Germany pay for them
versus 60% of women. This is the smallest pay gap on console
that we see across the three countries.
Women who play mobile games in Germany are the least likely
to spend money on that platform – 39% vs. 48% (U.K.) and 54%
(U.S).
YOUNG PAYERS
(18-29)
OLDER PAYERS
(30-40)
CONSOLE 66% 72%
PC 77% 72%
MOBILE 44% 50%
*Average/big spenders spend at least $5 per month on the relevant platform
SHARE OF PLAYERS THAT ARE AVERAGE/BIG SPENDERS*
AGE
© copyright Newzoo 2018
Base: Gamers who play games on that platform
SHARE OF PAYING GAMERS PER PLATFORM

AGE/GENDER AND KEY FACTS ON GAMERS WHO SPEND MONEY
Base: Play games on any platform for at least 2 hours per week AND pay on or in games. 17
24%
24%
13%
17%
15%
8%
61%paying gamers
in Germany are
male
Men
18-25
Men
26-35
Men
36-40
Women
18-25
Women
26-35
Women
36-40 KEY FACTS ON THE PAYING GAMER | GERMANY
are more likely to keep playing a game if it
offers loyalty/reward programs vs. 59% of non-payers.
compete in online or offline tournaments
against other gamers (16% for men and 8% for women) vs.
3% of non-payers.
have gambled for real money in the past 6
months vs. 12% of non-payers.
© copyright Newzoo 2018

of gamers across the three countries spend money on
games. The U.S. has the largest share of payers overall, with
78%, followed by the U.K. (77%). Germany has the lowest
player/payer ratio with 70%.
Console has the highest player/payer ratio in every country,
followed by PC and mobile. American gamers are far more
likely to pay on mobile than the others with a 60% payer
rate vs. 49% and 43% for the U.K. and Germany,
respectively.
60%64%
70%
49%
59%
67%
43%
55%
63%
Mobile PC Console Mobile PC Console Mobile PC Console
18
SHARE OF PAYERS PER PLATFORM PER COUNTRY | MOBILE, PC, CONSOLE
SHARE OF PAYERS | PER PLATFORM
Base: Play games on any platform for at least 2 hours per week. © copyright Newzoo 2018
The U.S. has the highest share of big and average
spenders (spend at least $5 per month) on every
platform and this is most pronounced on mobile; 34%
versus 21% in the U.K. and 20% in Germany. Console
payers are the most likely group to spend a big or
average amount in every country.
LEVEL
OF SPEND

19
FACTORS THAT MAKE PAYERS WANT TO SPEND IN GAME
39%
27%
27%
20%
19%
16%
16%
14%
13%
10%
9%
Enjoy myself more with the game
Give myself a gift
Have a gift card/voucher
Show my appreciation/support for developer
Reward/loyalty program offered to spenders
Fear of missing out
Impatience
Keep up with my friends
Urge to beat the competition
Watched the game streamed online/in-person at an esports event
Frustration
Base: Play games on any platform for at least 2 hours per week AND pay on or in games.
of paying gamers say that more enjoyment of a game is one
of their main motivators for spending money and 20% of
payers spend money to show appreciation for the
developer. Female paying gamers are less motivated by this
than men (15% vs. 23%). Women are more likely to be
influenced to pay by reward programs (23% vs. 17%).
The next biggest factors for players to spend on a game are
to give themselves a gift or to spend a gift card that they
have. Frustration is the least important factor at 9%.
© copyright Newzoo 2018

20
HOW PAYERS ARE SPENDING THEIR GAMING BUDGET
SHARE OF PAYING MOBILE
GAMERS THAT SPEND MONEY
ON IN-GAME PURCHASES
78% 65% 65%
WHERE PC/CONSOLE PAYERS SPEND THEIR BUDGET
62%
51%46%
29%
Downloaded/
Digital games
In-game
purchases
Boxed/Disc
games
Subscriptions
Paying PC/console gamers aged 30-40 are more likely to
buy boxed/disc games (51%) compared to younger gamers
aged 18-29 (43%). Older PC/console payers are less likely to
spend their budget on downloaded/digital games or
subscriptions compared to younger payers.
Base: Play games on any platform for at least 2 hours per week AND pay on or in games.
of paying PC/console gamers spend some of their gaming
budgets on downloaded/digital games. Just over half of
them spend money on in-game purchases. They are least
likely to spend their money on subscriptions.
For mobile payers, 75% of them spend money on in-game
purchases. This high share is driven by American gamers.
AGE
© copyright Newzoo 2018

21
WHAT PAYERS WHO BUY IN-GAME PURCHASES ARE SPENDING THEIR MONEY ON
WOMEN MEN WOMEN MEN WOMEN MEN
POWER-UPS 53% 45% 47% 39% 46% 38%
DLC/EXPANSION
PACKS30% 49% 36% 44% 29% 50%
PLAYABLE
CHARACTERS33% 39% 35% 33% 41% 44%
COSMETICS/SKINS 35% 36% 27% 24% 23% 28%
LOOT BOXES 28% 32% 19% 28% 17% 26%
TIME-SAVERS 34% 28% 26% 25% 20% 17%
In general, cosmetics/skins purchases are more popular with
younger than older payers. Power-ups are less popular with
younger payers (40%) than older (55%), among whom it’s
the most popular in-game item to buy. DLC/expansion
packs are the most popular in-game item among younger
payers.
of German men spend money on DLC/expansion packs,
compared to 29% of women.
Women are more likely to be buying power-ups and time-
savers than men in all three countries. The U.K is the only
country where a higher share of women are buying
cosmetics/skins than men.
AGE
© copyright Newzoo 2018
Base: Gamers who said that they spend part of their budget on in-game purchases

22
REASONS NOT TO SPEND MONEY ON A GAME | PAYING GAMERS VS. NON-PAYING GAMERS
38% 36% 50%
NON-PAYERS WHO DO NOT SPEND
BECAUSE THEY’RE SATISFIED WITH
THE FREE EXPERIENCE
Paying gamers Non-paying gamers
33%
32%
28%
27%
17%
16%
47%
21%
40%
35%
12%
19%
Want to spend my moneyon other things
Need to pay too often toprogress (feels like pay to
play)
Satisfied with the freegaming experience
Don't have enough sparemoney
Feel like it's cheating
Don't think it will make thegaming experience more
fun
Base: Play games on any platform for at least 2 hours per week.
of non-paying gamers say that one of the reasons they
wouldn’t spend on a certain game is because they are
satisfied with the free gaming experience. This trend is
driven by Germany, where half of non-payers don’t spend
for this reason.
A much larger share of payers than non-payers (32% vs.
21%) don’t spend on a game because it requires them to pay
too many times, making it feel like a pay-to-play game.
Payers are, interestingly, more likely than non-payers to not
pay for a game because they think it feels like cheating.
© copyright Newzoo 2018

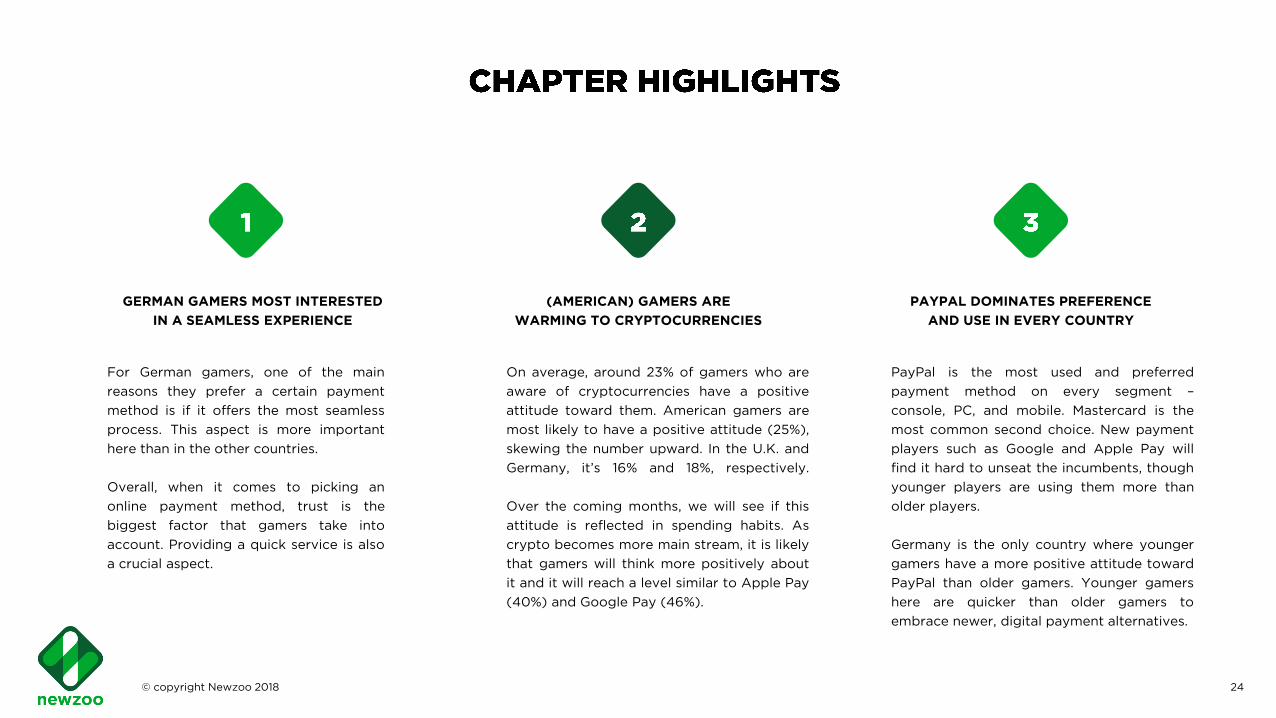
24
For German gamers, one of the main
reasons they prefer a certain payment
method is if it offers the most seamless
process. This aspect is more important
here than in the other countries.
Overall, when it comes to picking an
online payment method, trust is the
biggest factor that gamers take into
account. Providing a quick service is also
a crucial aspect.
GERMAN GAMERS MOST INTERESTED
IN A SEAMLESS EXPERIENCE
On average, around 23% of gamers who are
aware of cryptocurrencies have a positive
attitude toward them. American gamers are
most likely to have a positive attitude (25%),
skewing the number upward. In the U.K. and
Germany, it’s 16% and 18%, respectively.
Over the coming months, we will see if this
attitude is reflected in spending habits. As
crypto becomes more main stream, it is likely
that gamers will think more positively about
it and it will reach a level similar to Apple Pay
(40%) and Google Pay (46%).
(AMERICAN) GAMERS ARE
WARMING TO CRYPTOCURRENCIES
PayPal is the most used and preferred
payment method on every segment –
console, PC, and mobile. Mastercard is the
most common second choice. New payment
players such as Google and Apple Pay will
find it hard to unseat the incumbents, though
younger players are using them more than
older players.
Germany is the only country where younger
gamers have a more positive attitude toward
PayPal than older gamers. Younger gamers
here are quicker than older gamers to
embrace newer, digital payment alternatives.
PAYPAL DOMINATES PREFERENCE
AND USE IN EVERY COUNTRY
© copyright Newzoo 2018

25
WHY PLAYERS PREFER CERTAIN ONLINE* PAYMENT METHODS I COUNTRY COMPARISON
39%
30%
26% 25%
12%
36%
30%
23%
27%
14%
36%
30%
35%
31%
6%
United States United Kingdom Germany
*Can be in any online setting, not necessarily while gaming
Offer the most
seamless
process
Never had a bad
experience with
them
Use the same
payment method
as friends/family
Trust them
the mostProvide the
quickest
service
Base: Play games on any platform for at least 2 hours per week AND pay on or in games.
of gamers across the three countries say that trust is the
biggest reason they prefer the online payment method that
they do.
In Germany, having a seamless experience is almost as
important as trust and is a much bigger motivator for
preferring a provider (35%) than in the U.S. (26%) and the
U.K. (23%).
Gamers in Germany were also more likely to prefer a
payment method because they’ve never had a bad
experience with them (31%), compared to gamers in the U.S.
(25%) and the U.K. (27%).
© copyright Newzoo 2018

PayPal Prepaid Cards
/ Gift Cards
Mastercard Visa Checkout Google Pay Apple Pay
77%
70%
53% 53%
46%41%
80%
73%
66%63%
51%
45%
26
ATTITUDE TOWARD VARIOUS PAYMENT TYPES
SHARE OF GAMERS WITH A POSITIVE ATTITUDE* TOWARD CERTAIN PAYMENT TYPES**
*Respondents answered either positive or very positive when asked for their attitude toward a list of payment methods
18-29 30-40
Base: Play games on any platform for at least 2 hours per week.
of older gamers in the U.S. who are aware of PayPal have a
positive attitude toward it with younger gamers also very
positive: 77%. Both groups are also very positive about
prepaid cards/gift cards.
In general, older gamers are more positive about the
payment types presented here than younger gamers. This is
especially interesting in the case of newer digital payment
methods, such as Google Pay and Apple Pay. It seems that
older gamers in the U.S. are even more willing to embrace
modern payment methods than younger gamers.
© copyright Newzoo 2018
**Based on those aware of the relevant payment type
25%
of gamers in the U.S. who are aware of
cryptocurrency, have a positive attitude
toward it.
CRYPTO

27
PREFERENCE AND USAGE OF PAYMENT METHODS AMONG PAYING GAMERS
Base: Play games on any platform for at least 2 hours per week AND pay on or in games.
Mastercard
Mastercard
Mastercard
PayPal
PayPal
PayPal
MOST USED PAYMENT METHOD PER GAMING DEVICE
Prepaid cards/gift cards
Prepaid cards/gift cards
Google Pay
of paying gamers in the U.S. say that mobile is their most
preferred platform for paying for games, making it the top
choice.
Across all devices, paying gamers are most likely to be using
PayPal, followed by Mastercard. Prepaid cards/gift cards are
the third most used payment method on console and PC. On
mobile, Google Pay is the third most popular choice.
© copyright Newzoo 2018
49%
28%
15%
54%
26%
14%
44%
22%
12%
Younger payers are less likely to use Mastercard as a
payment method when paying for games across all
devices compared to older payers. Apple Pay is used
more by younger than older payers when paying for
mobile games.
AGE

28
ATTITUDE TOWARD VARIOUS PAYMENT TYPES
PayPal Visa Checkout Other Debit /
Credit Cards
Mastercard Google Pay Apple Pay
74%
60%55%
36%34% 36%
82%
67%63%
54%
44%40%
Base: Play games on any platform for at least 2 hours per week.
18-29 30-40
of 30-40-year-olds have a positive attitude toward Visa
Checkout, a higher share than the younger age group (60%).
Younger gamers are slightly more positive about Apple Pay
compared to Google Pay, while older gamers show the
reverse. Similar to the U.S., the younger age group
demonstrates a less positive attitude toward all of the
selected payment methods compared to older gamers.
16%
of gamers in the U.K. who are aware of
cryptocurrency, have a positive attitude
toward it.
*Respondents answered either positive or very positive when asked for their attitude toward a list of payment methods
CRYPTO
© copyright Newzoo 2018
**Based on those aware of the relevant payment type
SHARE OF GAMERS WITH A POSITIVE ATTITUDE* TOWARD CERTAIN PAYMENT TYPES**

29
PREFERENCE AND USAGE OF PAYMENT METHODS AMONG PAYING GAMERS
Base: Play games on any platform for at least 2 hours per week AND pay on or in games.
of paying gamers in the U.K. say that PC is their most
preferred platform for paying for games, making it the top
choice.
Across all devices, paying gamers are most likely to be using
PayPal. Visa Checkout performs relatively well in the U.K.
and is the second most popular payment method on console
and PC and the third most popular on mobile. Apple Pay is
the second most popular way to pay for mobile games.
© copyright Newzoo 2018
61%
15%
12%
63%
13%
10%
MOST USED PAYMENT METHOD PER GAMING DEVICE
Young mobile payers are more likely to use Google Pay
and Apple Pay to pay for mobile games than older
mobile payers.AGE
Visa Checkout
Visa Checkout
Apple Pay
PayPal
PayPal
PayPal
Mastercard
Mastercard
Visa Checkout
61%
13%
9%

30
ATTITUDE TOWARD VARIOUS PAYMENT TYPES
Base: Play games on any platform for at least 2 hours per week.
18-29 30-40
PayPal Pay Per Invoice Sofort Mastercard Google Pay Giropay
83%
62%
53%
32%
43%
37%
77%73%
47%
41% 39% 37%
*Respondents answered either positive or very positive when asked for their attitude toward a list of payment methods
of 30-40-year-old gamers in Germany who are aware of
paying by invoice have a positive attitude toward it, higher
than the younger age group with 62%.
Germany is the only country where younger gamers
demonstrate a more positive attitude toward some of the
selected payment methods, including PayPal and Google
Pay, than the older generation.
18%
of German gamers who are aware of
cryptocurrency have a positive attitude
toward it.
CRYPTO
© copyright Newzoo 2018
**Based on those aware of the relevant payment type
SHARE OF GAMERS WITH A POSITIVE ATTITUDE* TOWARD CERTAIN PAYMENT TYPES**

31
PREFERENCE AND USAGE OF PAYMENT METHODS AMONG PAYING GAMERS
Base: Play games on any platform for at least 2 hours per week AND pay on or in games.
of paying gamers in Germany say that PC is their most
preferred platform for paying for games, making it the top
choice.
Across all devices, paying gamers are most likely to be using
PayPal. In fact, PayPal is used by at least 70% of gamers on
every device, making it more popular here than in the U.S.
and the U.K.
Prepaid cards and gifts are also relatively more popular in
Germany, as one of the top three payment methods on
every device.
70%
11%
10%
76%
12%
11%
MOST USED PAYMENT METHOD PER GAMING DEVICE
Younger payers are more likely to use PayPal when
spending money on games across all devices compared to
older payers. AGE
Mastercard
Voucher
Prepaid cards/gift cards
PayPal
PayPal
PayPal
Prepaid cards/gift cards
Prepaid cards/gift cards
Voucher
71%
10%
7%

33
OLDER GAMERS ARE LESS
CONCERNED ABOUT SECURITY
THAN YOUNGER GAMERS
Interestingly, older gamers seem less
concerned with security; they are
more likely to want to skip security
measures after completing them
once and to register their details in
advance of a purchase.
They are also more likely to agree
that extra security measures make it
less likely they will complete in-game
purchases or make future ones.
GERMAN GAMERS ARE NOT
NEGATIVELY AFFECTED BY
SECURITY MEASURES
German gamers are the least likely to
have had a negative payment
experience online and to have
experienced fraud. This is likely tied
to their relatively slower uptake of
digital payment methods compared
to the other countries.
Following this, they are much less
likely than other gamers to be
negatively impacted by extra security
measures.
PAYMENT FRAUD IS A TOP CONCERN
FOR GAMERS AND A CONTINUING
BARRIER TO PAYMENT
19% of gamers have experienced
fraud when paying for or in games
online and one-third of paying
gamers say that worrying about
fraud makes them less likely to spend
within a game.
Building a holistic fraud management
strategy which is configured to drive
conversion rates is a way to keep
sales moving safely through the
funnel.
LOYALTY/REWARD PROGRAMS
FOR IN-GAME SPENDING
IMPROVES PAYMENT EXPERIENCE
Of paying gamers, 44% think the
payment experience within games can
be improved. The most common thing
that they would like to see is more
loyalty/reward programs offered for
in-game payments.
Gamers in both age groups indicated
that they would want this.
© copyright Newzoo 2018

*Can be in any online setting, not necessarily while gaming 34
OF GAMERS HAVE HAD
A NEGATIVE
EXPERIENCE WHILE
PAYING ONLINE*

35
PAYMENT METHODS WHERE GAMERS SAY THEY HAVE HAD A NEGATIVE EXPERIENCE*
SHARE OF GAMERS THAT HAVE HAD A NEGATIVE
EXPERIENCE WHEN PAYING ONLINE
40% 35% 34%
United States United Kingdom Germany
*Can be in any online setting, not necessarily while gamingBase: Play games on any platform for at least 2 hours per week and is aware
of the relevant payment method © copyright Newzoo 2018
PayPal Apple Pay Mastercard Google Pay Prepaid Cards /
Gift CardsPhone Carrier
BillingVisa Checkout
21%
10% 10%
7% 7% 6% 6%
22%
7%
4%
7%
4%
1%
7%
17%
7% 7%
10%
5%
9%
3%
of gamers in the U.K. have had a negative experience when
paying with PayPal. In the U.S. and Germany, the share is
21% and 17%, respectively.
American gamers are more likely to have a bad experience
with Apple Pay and Mastercard than the other gamers, while
German gamers have had more negative experiences with
Google Pay.

36
BIGGEST PAYMENTS EXPERIENCE FAILURES PER COUNTRY*
31% 30%30%
26%25%
22%
27%
32%
24%23%
26%28%
23%
28%26%
High
Transaction
Fees
Payment
fraud-
related
experience
Slow
Payment
Process
Confusing
Payment
Process
Failed Payment Due
to Fault with the
Payment Provider
United States United Kingdom Germany
of gamers in the U.K. have a bad experience online where
the payment process was too slow, making this the most
common negative experience for them. This is compared to
23% of German gamers and 30% of American gamers.
For German gamers, fraud and confusing processes are the
most common negative experience. In the U.S., they are high
transaction fees and fraud.
Overall, the experiences are quite similar across all three
markets.
*Can be in any online setting, not necessarily while gaming Base: Play games on any platform for at least 2 hours per week. © copyright Newzoo 2018
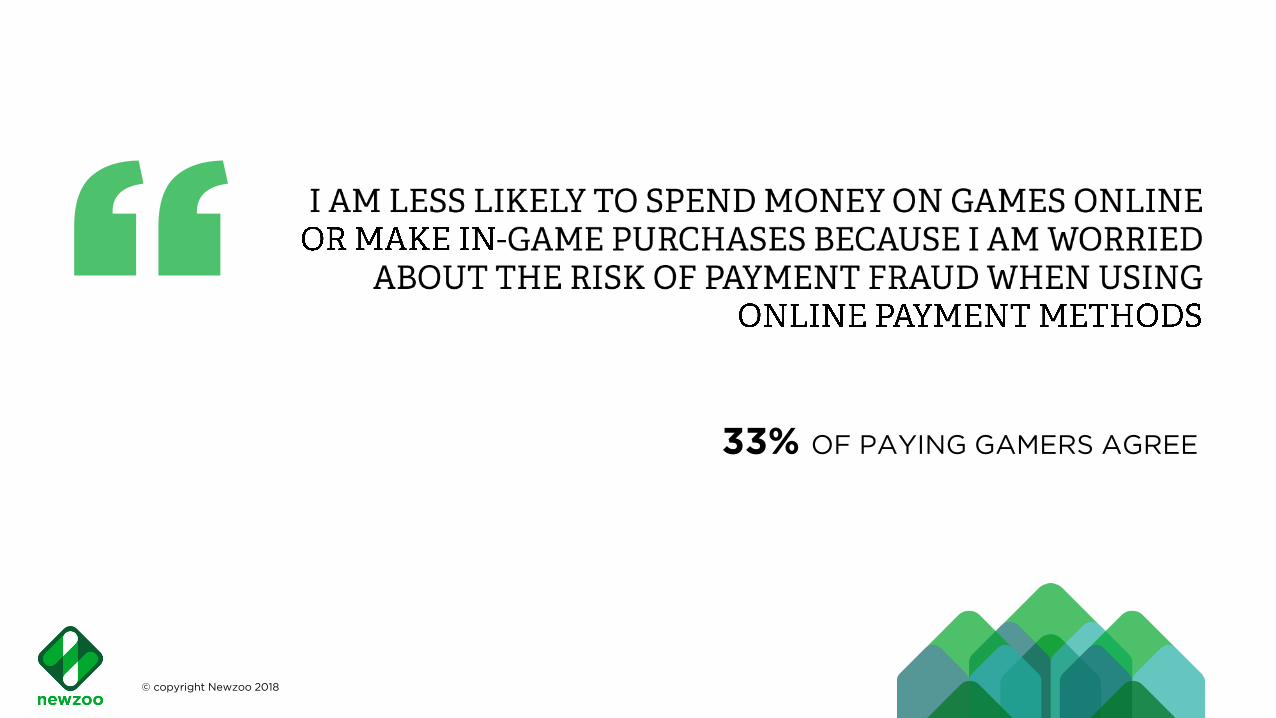
© copyright Newzoo 2018
33% OF PAYING GAMERS AGREE

38
PAYMENT TYPES WHERE FRAUD OCCURRED WHILE GAMING
20% 18% 17%HAS EXPERIENCED FRAUD
WHILE PAYING FOR GAMES
56% of paying gamers purchase, sell, or trade in-game items
outside of a game. One third of these have experienced
fraud while doing this. OUTSIDE
OF GAMES
© copyright Newzoo 2018
TOP FIVE PAYMENT METHODS WHERE PLAYERS EXPERIENCED FRAUD
of paying gamers have experienced fraud when paying for games.
In terms of payment methods, the rate of fraud is highest for
PayPal: 52% of those who have experienced payment fraud when
gaming, experienced it with PayPal. This make sense, as the
majority of gamers are using PayPal.
Base: Payers who have experienced fraud when gaming and are aware of the relevant payment method
52%
38% 37%
17%
PayPal Mastercard Apple Pay Google Pay

OF PAYING GAMERS THINK THE PAYMENT EXPERIENCE WITHIN
GAMES CAN BE IMPROVED*
*Agreed or strongly agreed with: “In my opinion, the online payment
user experience within games could be significantly improved.”39

40
THE IMPROVEMENTS PLAYERS WANT TO SEE IN THEIR ONLINE PAYMENTS EXPERIENCE
24% 20% 27%
SHARE OF GAMERS WHO WANT TO BE OFFERED
LOYALTY / REWARD PROGRAM FOR IN-GAME PAYMENTS
© copyright Newzoo 2018 Base: Payers who agree that the experience can be improved
of paying gamers who believe the payment experience can
be improved would like to see loyalty/reward programs
offered for in-game payments.
Younger payers consider simplifying the payment process
and making more payment options available to be more
important than the older age group.
A much higher share of older payers than younger payers
would like the option to register their payment details in
advance and to skip security measures after completing
them once.
18-29 30-40
24.5%
21%
18% 18%
9%
6%
24%
19%17%
14% 15%
10%
Loyalty /
reward
program for
in-game
payments
Simplify the
payment
process
Make the
payment process
quicker
More payment
options
available
Register
payment
details in
advance
Skip security
measures after
completing them
once
HOW TO IMPROVE THE ONLINE PAYMENT EXPERIENCE IN GAMES

ATTITUDE TOWARD IN-GAME PAYMENT SECURITY MEASURES | COUNTRY COMPARISON
© copyright Newzoo 2018
SHARE OF PAYERS WHO AGREE* WITH THE FOLLOWING STATEMENT:
44%
36%
19%
of paying gamers in the U.S. agreed that encountering
additional security measures when making in-game
purchases negatively impacts their gaming experience and
makes them less likely to pay.
Payers in the U.K. were also negative about encountering
additional in-game security measures, with more than one-
third in agreement with the statement.
Interestingly, only 19% of German payers agreed with the
statement, indicating that these extra security measures do
not bother them as much as gamers in the other countries.
As Germans have been slower to adopt digital online
payment methods, these additional security measures may
help them to feel more confident with the digital payment
process.

© copyright Newzoo 2018 42
CONSOLE HAS THE LEAST PLAYERS BUT THE
HIGHEST PLAYER/PAYER RATIO
Mobile games are the most popular segment in all three countries, played by
more than 90% of gamers. However, the player/payer ratio is the lowest of all
platforms (56%). This is a consequence of the relatively casual nature of the
platform and the prevalence of free-to-play titles. Across all three countries,
console gamers are most likely to spend money with a player/payer ratio of
69%.
AGE AND GENDER IMPACT SPENDING CHOICE
Across all the countries and platforms, men are more likely than women to
spend money. Older gamers (aged 30-40) are slightly more likely to be average
or big spenders (meaning they spend $5 or more a month) on mobile and
console, but younger players (18-29) spend more on PC. When it comes to in-
game purchases, women are more likely to buy power-ups and time-savers than
men in every country. Power-ups are the #1 item for older gamers, but
DLC/expansion packs are the favorite add-on for the younger age group.
LOYALTY/REWARD PROGRAMS ENCOURAGE
ENGAGEMENT AND SPENDING
Loyalty/reward programs are one of the key factors that motivate paying
gamers to spend money on a game. Additionally, gamers of all ages said the #1
way the paying experience can be improved would be to add these programs.
Offering rewards can also increase time spent on your game; more than two-
thirds of paying gamers are more likely to keep playing a game if loyalty/reward
programs are offered.

© copyright Newzoo 2018 43
(YOUNGER) PC/CONSOLE GAMERS ARE
DRIVING THE TRANSITION TO DIGITAL
Paying gamers are more likely to spend part of their PC/console budget on
digital/downloadable games and in-game purchases than on boxed games.
This move to digital is driven by younger gamers who are far less likely than
older gamers to be spending their budget on traditional boxed formats.
PAYPAL DOMINATES, GAMERS WARMING TO
CRYPTOCURRENCY
PayPal is by far the most used and the most preferred payment method for
every gaming segment (console, PC, and mobile) and every age group.
Gamers also have a more positive attitude toward it than any other payment
method. The newest payment method that was researched, cryptocurrency, is
perceived positively by 23% of gamers. American gamers are notably more
positive about it than their European counterparts. It is likely that as crypto
becomes more widely known and used, it will catch up to more established
payment methods like Apple Pay (40%) and Google Pay (46%).
CONCERNS ABOUT FRAUD ARE STILL A
PAYMENTS BARRIER
For one-third of paying gamers, worrying about fraud makes them less likely
to spend within a game and 19% of them have experienced fraud when paying
for games online. This highlights the fact that trust and security are still an
extremely important factor for consumers. Gaming companies must ensure
the right levels of protection are in place to build consumer trust, underpin a
smooth payments experience, and safeguard brand reputation.

44
RESEARCH OBJECTIVES AND SCOPE
TOPICS
PLAYING BEHAVIOR
E.g. Device(s) played on, genres played, franchises played, etc.
PAYING BEHAVIOR
E.g. Device(s) paid on, money spent on, spending benefits, motivations,
and deterrents, etc.
PAYMENT METHODS
E.g. Attitude toward payment methods, payment method use and
preference, negative experience with payment methods, etc.
PAYMENT (USER) EXPERIENCE WITHIN GAMES
E.g. Preferred device to pay with, payment fraud experience, improving
the payment experience, etc.
RESPONDENTS & METHODOLOGY
RESPONDENTS:
2,051 gamers (play at least two hours per week on any platform) across the
U.S., U.K., and Germany. Respondents were aged 18-40 and are nationally
representative of the gamer group.
COMPUTER ASSISTED WEB INTERVIEWING CAWI:
Sent out to “invitation-only” respondents, conducted over a period of two
weeks, including two weekends for a balanced sample (May 02– May 14, 2018).
QUESTIONNAIRE LENGTH:
Average length per respondent: 15-17 minutes
RESEARCH OBJECTIVES
This research project was conducted to explore paying behavior, payment
preferences, and the payment experience among gamers in order to
gather insights into the most effective ways to optimize payment
conversion in games.
COUNTRIES
DEFINITIONS OF KEY TERMS USED
PLAYERS: Gamers who play on any platform at least two hours per week.
PAYERS: Play for at least two hours per week across any platform AND spend
money on games.
YOUNG PLAYERS/PAYERS: Aged 18-29.
OLDER PLAYERS/PAYERS: Aged 30-40.
AVERAGE/BIG SPENDERS: Spend at least $5 per month on the relevant platform.

The current pace of change in consumer behavior,
media, and technology requires a new type of
intelligence firm that is agile, innovative, truly global,
and ahead of the curve. We are that firm. As the
number one provider of games, esports, and mobile
intelligence in the world, we support our global clients
daily in growing their businesses.
MORE THAN 150 GLOBAL SUBSCRIBERSOUR MISSION
OUR EXPERTISE
MARKET
FORECASTS
TRACKING
DATA
CONSUMER
INSIGHTS
OUR SOLUTIONS
STANDARD
SUBSCRIPTIONS
MARKET
PACKAGES
CUSTOM
SERVICES
PARTNER
MODEL
GLOBAL LEADER IN GAMES, ESPORTS, AND MOBILE INTELLIGENCE
45
ACI WORLDWIDE, THE UNIVERSAL PAYMENTS (UP) COMPANY
ACI Worldwide, the Universal Payments (UP) company, powers electronic
payments for more than 5,100 organizations around the world, executing $14
trillion each day in payments and securities.
ACI’s UP eCommerce Payments solution is an integrated payments gateway
and fraud management solution designed to support the fast-moving gaming,
retail and digital goods sectors. It offers access to an extensive global
payments network, with immediate coverage in more than 160 countries to
enable payments acceptance from consumers anywhere and any way they
want to pay.
Our global team of payment and risk experts have in-depth gaming sector
expertise, and understand the challenges around gaming monetization,
building customer loyalty and the struggle of balancing those needs with
effective fraud prevention.
For more information, please contact us at [email protected]
or visit: www.aciworldwide.com/gaming
Using our gaming sector-specific machine learning technology and data, ACI
helps gaming clients deploy tailored strategies and solutions designed to both
prevent fraud and maintain high conversion rates.
Gaming merchants get the cost-effective, flexible tools and technology they
need to power seamless payments across any channel, geography or device.
Delivered in the cloud, ACI’s resilient, scalable solutions also give the
confidence to handle mass volume transactions at peak trading times and
ensure an uninterrupted player experience.
ACI has a proven track record helping gaming merchants deliver against player
expectations to secure their share of the gaming payments opportunity.