Embed Size (px)
Citation preview

Understanding Statistics
Note: Bring exam review questions next week. Please do
not provide answers.

Descriptive vs. Inferential
• Descriptive statistics– Summarize/organize a group of numbers from
a research study
• Inferential statistics– Draw conclusions/make inferences that go
beyond the numbers from a research study– Determine if a causal relationship exists
between the IV and DV

Descriptive statistics
• A set of tools to help us exam data– Descriptive statistics help us see patterns.
• 49, 10, 8, 26, 16, 18, 47, 41, 45, 36, 12, 42, 46, 6, 4, 23, 2, 43, 35, 32
– Can you see a pattern in the above data?• Imagine if the data set was larger.
– 100 cases– 1000 cases
• What could we do?

What are Inferential Statistics?
• Refer to certain procedures that allow researchers to make inferences about a population based on data obtained from a sample.
• Obtaining a random sample is desirable since it ensures that this sample is representative of a larger population.
• The better a sample represents a population, the more researchers will be able to make inferences.
• Making inferences about populations is what Inferential Statistics are all about.

Statistics vs. Parameters
• A parameter is a characteristic of a population.– It is a numerical or graphic way to summarize data
obtained from the population
• A statistic is a characteristic of a sample.– It is a numerical or graphic way to summarize data
obtained from a sample

Sampling Error
• It is reasonable to assume that each sample will give you a fairly accurate picture of its population.
• However, samples are not likely to be identical to their parent populations.
• This difference between a sample and its population is known as Sampling Error.
• Furthermore, no two samples will be identical in all their characteristics.
Hypothesis Testing
• Hypothesis testing is a way of determining the probability that an obtained sample statistic will occur, given a hypothetical population parameter.
• The Research Hypothesis specifies the predicted outcome of a study.
• The Null Hypothesis typically specifies that there is no relationship in the population.

Practical vs. Statistical Significance
• The terms “significance level” or “level of significance” refers to the probability of a sample statistic occurring as a result of sampling error.
• Significance levels most commonly used in educational research are the .05 and .01 levels.
• Statistical significance and practical significance are not necessarily the same since a result of statistical significance does not mean that it is practically significant in an educational sense.

Correlational Research


The Nature of Correlational Research
• Correlational Research is also known as Associational Research.
• Relationships among two or more variables are studied without any attempt to influence them.
• Investigates the possibility of relationships between two variables.
• There is no manipulation of variables in Correlational Research.

Purpose of Correlational Research
• Correlational studies are carried out to explain important human behavior or to predict likely outcomes (identify relationships among variables).
• If a relationship of sufficient magnitude exists between two variables, it becomes possible to predict a score on either variable if a score on the other variable is known (Prediction Studies).
• The variable that is used to make the prediction is called the predictor variable (independent).

Purpose of Correlational Research(cont.)
• The variable about which the prediction is made is called the criterion variable (dependent).
• Both scatterplots and regression lines are used in correlational studies to predict a score on a criterion variable
• A predicted score is never exact. Through a prediction equation, researchers use a predicted score and an index of prediction error (standard error of estimate) to conclude if the score is likely to be incorrect.

Correlation Coefficients
• Pearson product-moment correlation– The relationship between two variables of
degree.• Positive: As one variable increases (or decreases)
so does the other.• Negative: As one variable increases the other
decreases.
– Magnitude or strength of relationship • -1.00 to +1.00
– Correlation does not equate to causation

Positive Correlation

Negative Correlation

No Correlation

Prediction Using a Scatterplot
More Complex Correlational Techniques
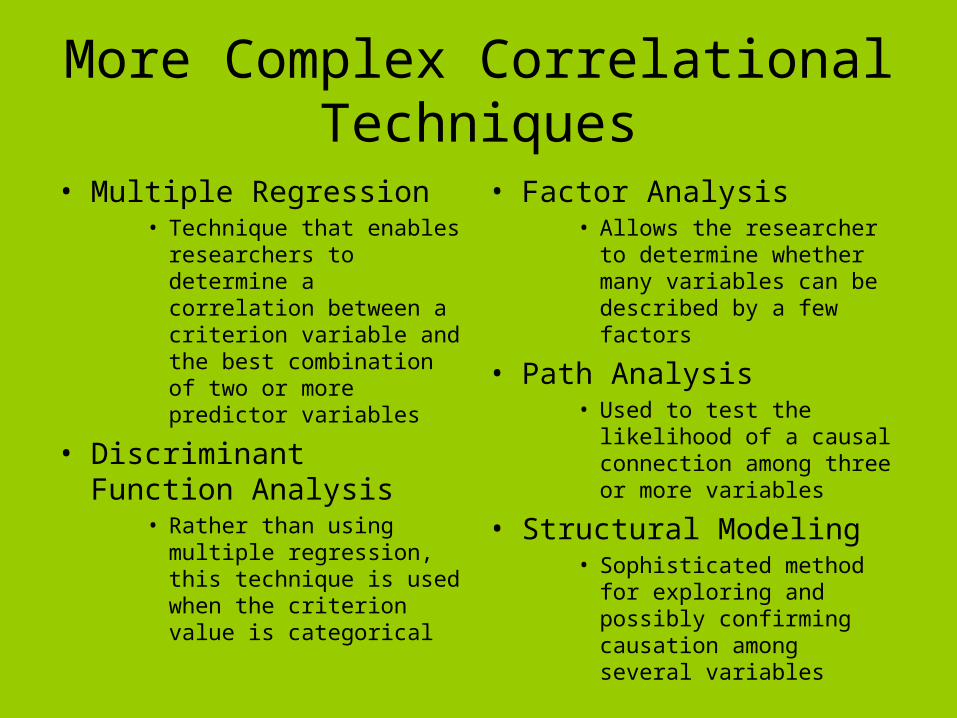
• Multiple Regression• Technique that enables
researchers to determine a correlation between a criterion variable and the best combination of two or more predictor variables
• Discriminant Function Analysis
• Rather than using multiple regression, this technique is used when the criterion value is categorical
• Factor Analysis• Allows the researcher to
determine whether many variables can be described by a few factors
• Path Analysis• Used to test the likelihood
of a causal connection among three or more variables
• Structural Modeling• Sophisticated method for
exploring and possibly confirming causation among several variables

Path Analysis Diagram

What Do Correlational Coefficients Tell Us?
• The meaning of a given correlation coefficient depends on how it is applied.
• Correlation coefficients below .35 show only a slight relationship between variables.
• Correlations between .40 and .60 may have theoretical and/or practical value depending on the context.
• Only when a correlation of .65 or higher is obtained, can one reasonably assume an accurate prediction.
• Correlations over .85 indicate a very strong relationship between the variables correlated.

Magnitude of effect
• Coefficient of determination – Also known as
• Shared variance• The proportion of
variance accounted for• Percentage of variance
accounted for
• Coefficient of nondetermination – Proportion of variance
not accounted for
2r
21 r

Threats to Internal Validityin Correlational Research
• Subject characteristics
• Mortality• Instrument decay
• Testing• History• Data collector
characteristics• Data collector bias

Causal-Comparative Research

Similarities and Differences Between Causal-Comparative and
Correlational Research• Similarities
– Associative research– Attempt to explain
phenomena of interest– Seek to identify variables
that are worthy of later exploration through experimental research
– Neither permits the manipulation of variables
– Attempt to explore causation
• Differences– Causal studies compare
two or more groups of subjects
– Causal studies involve at least one categorical variable
– Causal studies often compare averages or use crossbreak tables instead of scatterplots and correlations coefficients

The Basic Causal-Comparative Designs
Independent DependentGroup variable variable
(a) I C O(Group possesses (Measurement)
characteristic)
II –C O(Group does (Measurement)not possess
characteristic)
(b) I C1 O(Group possesses (Measurement)characteristic 1)
II C2 O(Group possesses (Measurement)characteristic 2)
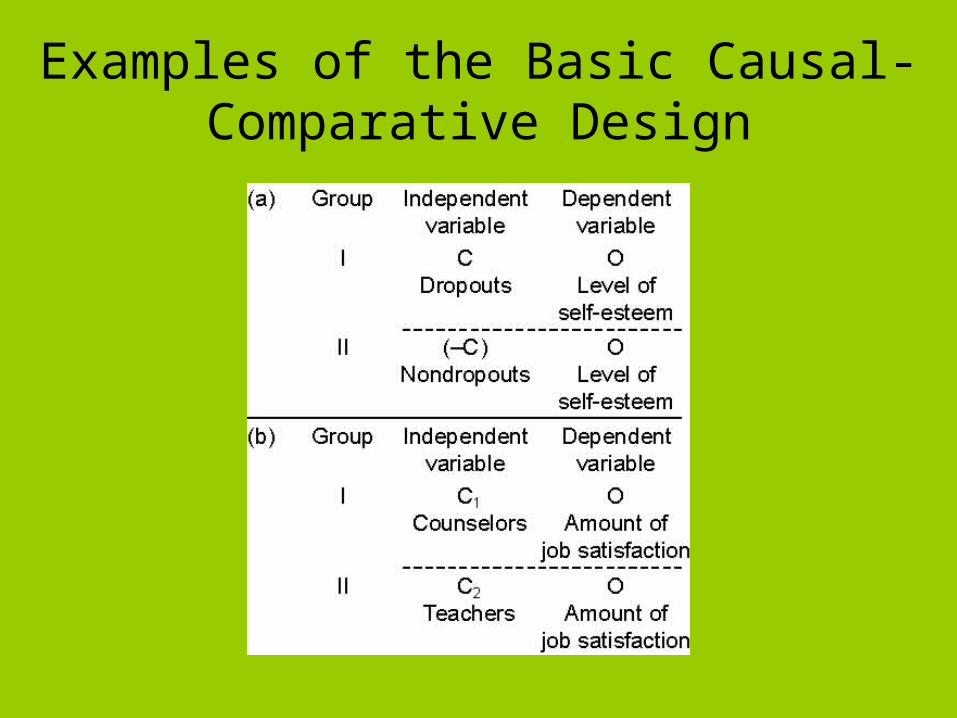
Examples of the Basic Causal-Comparative Design

Threats to Internal Validity in Causal-Comparative Research
• Subject Characteristics• The possibility exists that the groups are not equivalent on
one or more important variables• One way to control for an extraneous variable is to match
subjects from the comparison groups on that variable• Creating or finding homogeneous subgroups would be
another way to control for an extraneous variable• The third way to control for an extraneous variable is to use
the technique of statistical matching

Other Threats
• Loss of subjects• Instrumentation• History• Maturation
• Data collector bias• Regression

Evaluating Threats to Internal Validity in Causal-Comparative Studies
• Involves three sets of steps as shown below:
– Step 1: What specific factors are known to affect the variable on which groups are being compared or may be logically be expected to affect this variable?
– Step 2: What is the likelihood of the comparison groups differing on each of these factors?
– Step 3: Evaluate the threats on the basis of how likely they are to have an effect and plan to control for them.


![JAM 2014 Question Papers with Answers for Mathematical Statistics [MS] Code B](https://img.pdfslide.us/doc/110x75/55cf970f550346d0338f8d27/jam-2014-question-papers-with-answers-for-mathematical-statistics-ms-code.jpg)

