Embed Size (px)
Citation preview
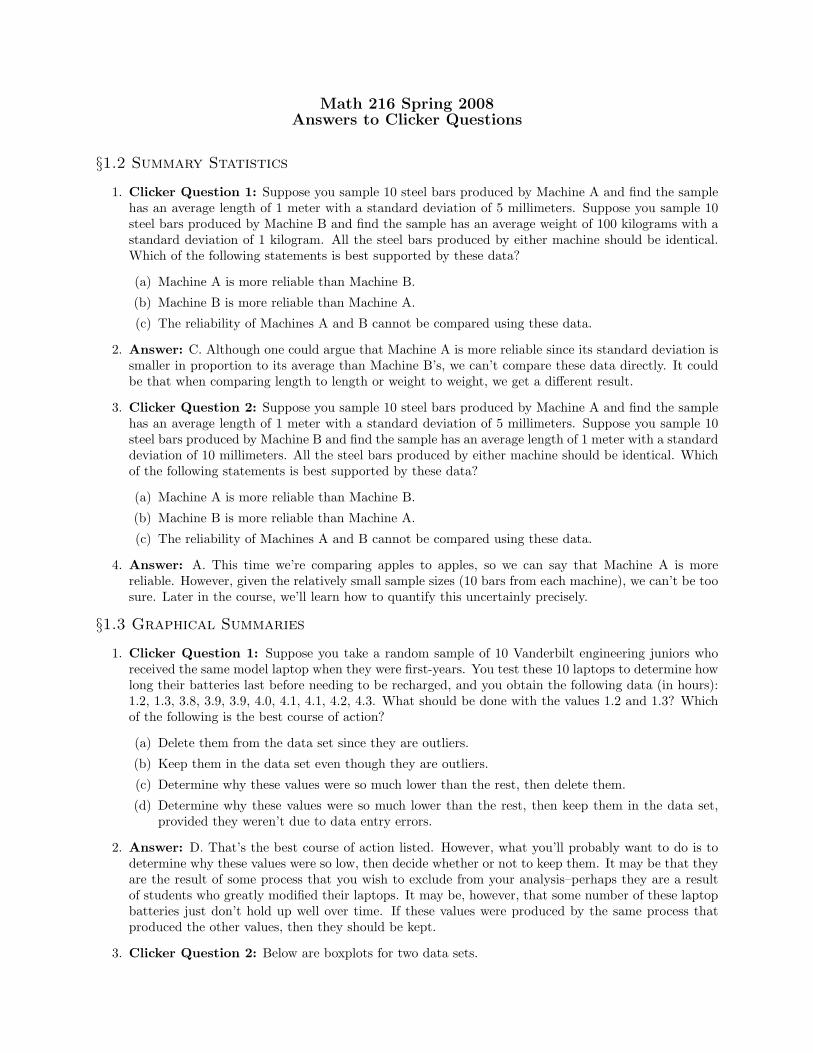
Math 216 Spring 2008Answers to Clicker Questions
§1.2 Summary Statistics
1. Clicker Question 1: Suppose you sample 10 steel bars produced by Machine A and find the samplehas an average length of 1 meter with a standard deviation of 5 millimeters. Suppose you sample 10steel bars produced by Machine B and find the sample has an average weight of 100 kilograms with astandard deviation of 1 kilogram. All the steel bars produced by either machine should be identical.Which of the following statements is best supported by these data?
(a) Machine A is more reliable than Machine B.
(b) Machine B is more reliable than Machine A.
(c) The reliability of Machines A and B cannot be compared using these data.
2. Answer: C. Although one could argue that Machine A is more reliable since its standard deviation issmaller in proportion to its average than Machine B’s, we can’t compare these data directly. It couldbe that when comparing length to length or weight to weight, we get a different result.
3. Clicker Question 2: Suppose you sample 10 steel bars produced by Machine A and find the samplehas an average length of 1 meter with a standard deviation of 5 millimeters. Suppose you sample 10steel bars produced by Machine B and find the sample has an average length of 1 meter with a standarddeviation of 10 millimeters. All the steel bars produced by either machine should be identical. Whichof the following statements is best supported by these data?
(a) Machine A is more reliable than Machine B.
(b) Machine B is more reliable than Machine A.
(c) The reliability of Machines A and B cannot be compared using these data.
4. Answer: A. This time we’re comparing apples to apples, so we can say that Machine A is morereliable. However, given the relatively small sample sizes (10 bars from each machine), we can’t be toosure. Later in the course, we’ll learn how to quantify this uncertainly precisely.
§1.3 Graphical Summaries
1. Clicker Question 1: Suppose you take a random sample of 10 Vanderbilt engineering juniors whoreceived the same model laptop when they were first-years. You test these 10 laptops to determine howlong their batteries last before needing to be recharged, and you obtain the following data (in hours):1.2, 1.3, 3.8, 3.9, 3.9, 4.0, 4.1, 4.1, 4.2, 4.3. What should be done with the values 1.2 and 1.3? Whichof the following is the best course of action?
(a) Delete them from the data set since they are outliers.
(b) Keep them in the data set even though they are outliers.
(c) Determine why these values were so much lower than the rest, then delete them.
(d) Determine why these values were so much lower than the rest, then keep them in the data set,provided they weren’t due to data entry errors.
2. Answer: D. That’s the best course of action listed. However, what you’ll probably want to do is todetermine why these values were so low, then decide whether or not to keep them. It may be that theyare the result of some process that you wish to exclude from your analysis–perhaps they are a resultof students who greatly modified their laptops. It may be, however, that some number of these laptopbatteries just don’t hold up well over time. If these values were produced by the same process thatproduced the other values, then they should be kept.
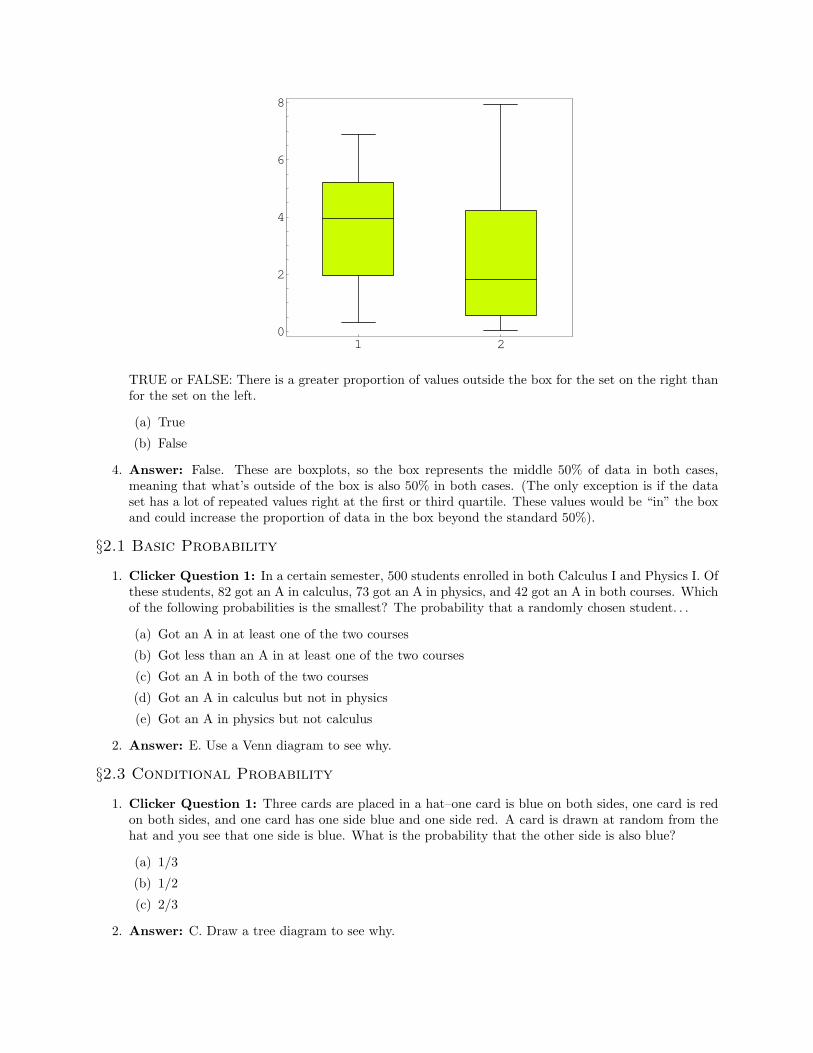
3. Clicker Question 2: Below are boxplots for two data sets.
1 20
2
4
6
8
TRUE or FALSE: There is a greater proportion of values outside the box for the set on the right thanfor the set on the left.
(a) True
(b) False
4. Answer: False. These are boxplots, so the box represents the middle 50% of data in both cases,meaning that what’s outside of the box is also 50% in both cases. (The only exception is if the dataset has a lot of repeated values right at the first or third quartile. These values would be “in” the boxand could increase the proportion of data in the box beyond the standard 50%).
§2.1 Basic Probability
1. Clicker Question 1: In a certain semester, 500 students enrolled in both Calculus I and Physics I. Ofthese students, 82 got an A in calculus, 73 got an A in physics, and 42 got an A in both courses. Whichof the following probabilities is the smallest? The probability that a randomly chosen student. . .
(a) Got an A in at least one of the two courses
(b) Got less than an A in at least one of the two courses
(c) Got an A in both of the two courses
(d) Got an A in calculus but not in physics
(e) Got an A in physics but not calculus
2. Answer: E. Use a Venn diagram to see why.
§2.3 Conditional Probability
1. Clicker Question 1: Three cards are placed in a hat–one card is blue on both sides, one card is redon both sides, and one card has one side blue and one side red. A card is drawn at random from thehat and you see that one side is blue. What is the probability that the other side is also blue?
(a) 1/3
(b) 1/2
(c) 2/3
2. Answer: C. Draw a tree diagram to see why.
3. Clicker Question 2: Consider tossing a fair coin, that is, one that comes up heads half of the timeand tails half of the time. Let A be the event “the first toss is a head,” B be the event “the secondtoss is a tails,” C be the event “the two outcomes are the same,” D be the event “two heads turn up.”Which of the following pairs of events is not independent?
(a) A and B
(b) A and C
(c) A and D
4. Answer: C. Use the definition of independence (P (A|B) = P (A) must be true) to see why.
5. Clicker Question 3: Suppose A is the event that it rains today and B is the event that I brought myumbrella into work today. What is wrong with the following argument? “These events are independentbecause bringing an umbrella to work doesn’t effect whether or not it rains today.”
(a) These events are not independent, because one’s decision of bringing an umbrella is dependenton the likelihood of rain. (However, rain is definitely not dependent on one carrying an umbrellaalthough Murphy’s Law might prove the opposite.)
(b) Although bringing an umbrella to work doesn’t cause it to rain, given that you’ve brought yourumbrella to work, the probability that it’s a rainy day is higher than the chance of rain on anyrandom day. s
(c) These events are independent because the probability of bringing an umbrella to work doesn’teffect the probability of the event its rains today and vice versa.
(d) It is false because the fact that it is raining today means that it was probably predicted to rain.If you checked that prediction then you would be more likely to bring in an umbrella making theevents linked.
6. Answer: B. Here’s another example: Suppose you’re running an ice cream stand. Let A be theevent that it is a hot day and let B be the event that you sell more ice cream than usual. It seemsclear that these events aren’t independent since it’s more likely that B will occur if A occurs–you’llsell more ice cream than usual on hot days. Mathematically, we know that if P (B) 6= P (B|A), thenP (A) 6= P (A|B), but what does this mean in terms of the events? It doesn’t mean that selling moreice cream than usual causes it to be a hot day. It does, however, mean that when you just look atdays on which you sell more ice cream, the proportion of hot days is higher than the proportion of hotdays to all days. That is, given that you’re selling more ice cream than usual, the probability that it’sa hot day is greater than the probability of any given day being hot. This is a great example, sincecausation creates the dependence in one direction, but not in the other direction.
7. Clicker Question 4: Through accounting procedures, it is known that about 10% of the employeesin a store are stealing. The managers would like to fire the thieves, but their only tool in distinguishingthem from the honest employees is a lie detector test that is only 90% accurate. That is, if an employeeis a thief, he or she will fail the test with probability 0.9, and if an employee is not a thief, he or shewill pass the test with probability 0.9. If an employee fails the test, what is the probability that he orshe is a thief?
(a) 90%
(b) 75%
(c) 66 2/3%
(d) 50%
8. Answer: D. Construct a tree diagram to see why.
§2.4 Random Variables
1. Clicker Question 1: Suppose your instructor asks you a multiple-choice question with three answerchoices in class. You are to submit your answer and also rate the confidence (low, medium, or high)with which you believe in that answer. You will be scored based on the following chart.
Confidence Correct Answer Incorrect AnswerLow 3 2Medium 4 1High 5 0
If have no idea what the answer to the question is and you have to guess randomly among the threeavailable answer choices, what confidence level should you choose in order to maximize your points?1
(a) Low
(b) Medium
(c) High
(d) It doesn’t matter.
2. Answer: A. Note that since your chance of guessing incorrectly is twice as much as your chance ofguessing correctly, the expected value for “low” is greater than the expected values for “medium” or“high.”
3. Clicker Question 2: Suppose your instructor asks you a multiple-choice question with two answerchoices in class. You are to submit your answer and also rate the confidence (low, medium, or high)with which you believe in that answer. You will be scored based on the following chart.
Confidence Correct Answer Incorrect AnswerLow 3 2Medium 4 1High 5 0
If have no idea what the answer to the question is and you have to guess randomly among the twoavailable answer choices, what confidence level should you choose in order to maximize your points?2
(a) Low
(b) Medium
(c) High
(d) It doesn’t matter.
4. Answer: It depends. In this case, the expected values for “low,” “medium,” and “high” are the same.However, the variance for each choice differs. Since the variance for “low” is the smallest, “low” is yourleast risky choice. Why should this effect your confidence level? Over a large number of questions, allthree confidence levels will give you the same average score. However, over a small number of questions,the “medium” and “high” confidence levels will have more volatility. It all depends on if you feel luckyor not.
5. Draw the following dart board: A dart board is constructed from three concentric circles with radii 1inch, 2 inches, and 3 inches, respectively. If a dart lands in the innermost circle, the player receives4 points. If the dart lands between the innermost circle and the middle circle, the player receives 2points. If the dart lands between the middle circle and the outermost circle, the player receives 1 point.Assume that the probability of a dart landing in any particular region is proportional to the area ofthat region.
1Adapted from Dennis Jacobs’ CRS question point scheme.2Adapted from Dennis Jacobs’ CRS question point scheme.
6. Clicker Question 3: Define the random variable X to be the sum of the player’s score on twosuccessive throws. Then X is what type of random variable?
(a) discrete
(b) continuous
7. Answer: A. The possible values for X are 2, 3, 4, 5, 6, and 8–a countable number of values.
8. Clicker Question 4: Same dart board, but now suppose that a player’s score on a single dart throwis defined to be the distance between the dart and the center of the board. Define the random variableX to be the sum of the player’s score on two successive throws. Then X is what type of randomvariable?
(a) discrete
(b) continuous
9. Answer: B. The possible values for X are any number between 0 and 6–an uncountable number ofvalues.
10. Clicker Question 5: A radioactive mass emits particles at an average rate of 15 particles per minute.Define the random variable X to be the number of particles emitted in a 10-minute time frame. ThenX is what type of random variable?
(a) discrete
(b) continuous
11. Answer: A. The possibles values for X are all integers between 0 and the number of particles in themass. Even if there were an infinite number of particles in the mass, this would still be a discreterandom variable, since the possible values are countable (1, 2, 3, . . . ).
12. Clicker Question 6: A radioactive mass emits particles at an average rate of 15 particles per minute.A particle is emitted at noon today. Define the random variable X to be the time elapsed betweennoon and the next emission. Then X is what type of random variable?
(a) discrete
(b) continuous
13. Answer: B. X can take on any positive value, which is an uncountable set of values.
14. Clicker Question 7: Consider the continuous random variable X = the weight in pounds of arandomly selected newborn baby born in the United States during 2006. Let f be the probabilitydensity function for X. It is probably safe to say that P (X < 0) = 0 and P (X < 20) = 1. Which ofthe following is not a justifiable conclusion about f given this information?
(a) No portion of the graph of f can lie below the x-axis.
(b) The area under the entire graph of f equals 1.
(c) The area under the graph of f between x = 0 and x = 20 is 1.
(d) The nonzero portion of the graph of f lies entirely between x = 0 and x = 19.
15. Answer: D. Since X is a continuous random variable, it can take on values between 19 and 20. Theremay be some nonzero portion of the graph of f that lies between x = 19 and x = 20. (In fact, theGuinness Book of World Records lists as the heaviest baby born to a healthy mother a boy weighing22 pounds, 8 ounces, born in Aversa, Italy, in September 1955.) Draw a graph for f and illustratethese three properties.
16. Clicker Question 8: Consider the continuous random variable X = the weight in pounds of arandomly selected newborn baby born in the United States during 2006. Let F be the cumulativedistribution function for X. It is probably safe to say that P (X < 0) = 0 and P (X < 20) = 1. Whichof the following is not a justifiable conclusion about F given this information?
(a) F (x) = 0 for all x ≤ 0.
(b) F (x) = 1 for all x ≥ 20.
(c) The area under the graph of F between x = 0 and x = 20 is 1.
(d) F is an non-decreasing function between x = 0 and x = 20.
17. Answer: C. That statement is true of f , but not of F . In fact, the area under the curve betweenx = 19 and x = 20 alone is probably pretty close to 1.
§4.2 The Binomial Distribution
1. Clicker Question 1: Consider the following experiment. On a Friday night, a highway patrol officersets up a roadblock and stops 100 drivers. A given driver is considered a success if he or she is wearinga seat belt; the driver is considered a failure otherwise. Can we consider this experiment a binomialexperiment?
(a) Yes
(b) No
2. Answer: B is probably the best choice here. If there’s a line at the checkpoint, then the driverswaiting in line are likely to buckle their seat belts, which means that the probability that a driver iswearing a seat belt is not likely to be the same from car to car.
3. Clicker Question 2: Consider the following experiment. A particular car club has 100 members, 70of which regularly wear their seat belts and 30 of which do not. Ten of these members are selectedat random without replacement as they leave a car show. A given driver is considered a success ifhe or she is wearing a seat belt. The driver is considered a failure otherwise. Can we consider thisexperiment a binomial experiment?
(a) Yes
(b) No
4. Answer: B is the technically correct choice. Since the selection is done without replacement, theprobability of selecting a driver wearing a seat belt changes as each selection is made, which means thatthe “trials” are not independent. However, in this case, the sample size (10) is fairly small compared tothe population size (100), so those probabilities won’t change much, so this is pretty close to a binomialexperiment.
§4.3 The Poisson Distribution
1. Clicker Question 1: Suppose that trucks arrive at a receiving dock with an average arrival rate of 3per hour. What is the probability exactly 5 trucks will arrive in a two-hour period?
(a)e−335
5!
(b)e−332.5
2.5!
(c)e−665
5!
(d)e−556
6!
2. Answer: C. In this case, λ, the expected outcome, is equal to 6 since we expect 6 trucks to arrive ina two-hour period.
§4.5 The Normal Distribution
1. Clicker Question 1: Consider the continuous random variable X = the weight in pounds of arandomly selected newborn baby born in the United States last year. Suppose that X can be modeledwith a normal distribution with mean µ = 7.57 and standard deviation σ = 1.06. If the standarddeviation were σ = 1.26 instead, how would that change the graph of the pdf of X?
(a) The graph would be narrower and have a greater maximum value.
(b) The graph would be narrower and have a lesser maximum value.
(c) The graph would be narrower and have the same maximum value.
(d) The graph would be wider and have a greater maximum value.
(e) The graph would be wider and have a lesser maximum value.
(f) The graph would be wider and have the same maximum value.
2. Answer: E. Increasing the standard deviation increases the spread of the random variable, whichmeans the graph will be wider. Since the area under the curve must be 1, making the graph widermeans making it shorter as well so that the area remains constant.
3. Clicker Question 2: Consider the continuous random variable X = the weight in pounds of arandomly newborn baby born in the United States during 2006. Suppose that X can be modeled witha normal distribution with mean µ = 7.57 and standard deviation σ = 1.06. If the mean were µ = 7.27instead, how would that change the graph of the pdf of X?
(a) The graph would be shifted to the left.
(b) The graph would be shifted to the right.
(c) The graph would become more negatively skewed.
(d) The graph would become more positively skewed.
(e) The graph would have a greater maximum value.
(f) The graph would have a lesser maximum value.
4. Answer: A. Decreasing the mean without changing the standard deviation moves the entire graph tothe left, 0.3 units in this case.
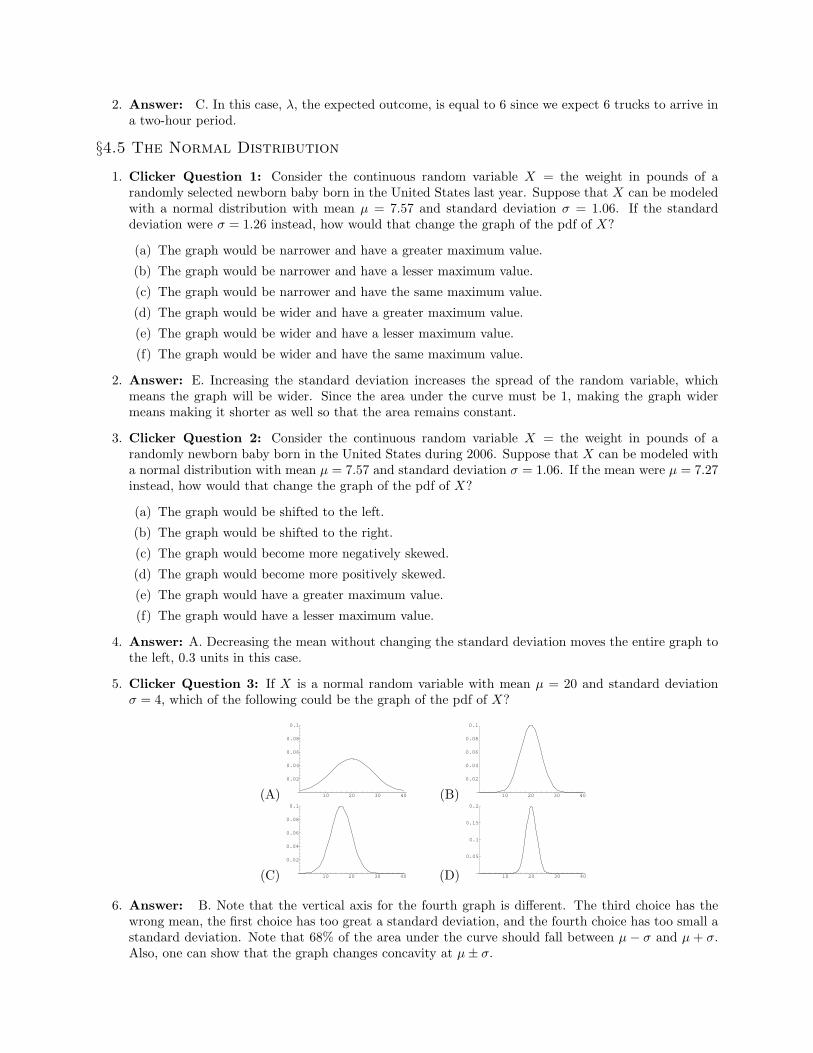
5. Clicker Question 3: If X is a normal random variable with mean µ = 20 and standard deviationσ = 4, which of the following could be the graph of the pdf of X?
(A) 10 20 30 40
0.02
0.04
0.06
0.08
0.1
(B) 10 20 30 40
0.02
0.04
0.06
0.08
0.1
(C) 10 20 30 40
0.02
0.04
0.06
0.08
0.1
(D) 10 20 30 40
0.05
0.1
0.15
0.2
6. Answer: B. Note that the vertical axis for the fourth graph is different. The third choice has thewrong mean, the first choice has too great a standard deviation, and the fourth choice has too small astandard deviation. Note that 68% of the area under the curve should fall between µ − σ and µ + σ.Also, one can show that the graph changes concavity at µ± σ.
7. Clicker Question 4: Let Z be a standard normal random variable. Which of the following probabil-ities is the smallest?
(a) P (−2 < Z < −1)
(b) P (0 < Z < 2)
(c) P (Z < 1)
(d) P (Z > 2)
8. Answer: D. Looking at the graph of the pdf for Z quickly narrows the choices down. Adding inthe rules of thumb about standard deviations (e.g. 68% of the population lies within one standarddeviation of the mean) helps us finalize our answer.
9. Clicker Question 5: Let Z be a standard normal random variable. Which of the following probabil-ities is the smallest?
(a) P (0 ≤ Z ≤ 2.07)
(b) P (−0.64 ≤ Z ≤ −0.11)
(c) P (Z > −1.06)
(d) P (Z < −0.88)
10. Answer: D. Looking at the graph of the pdf for Z narrows the choices down to 2 or 4. Using TableA.2, we can compute these and determine which is smaller.
§4.6 The Lognormal Distribution
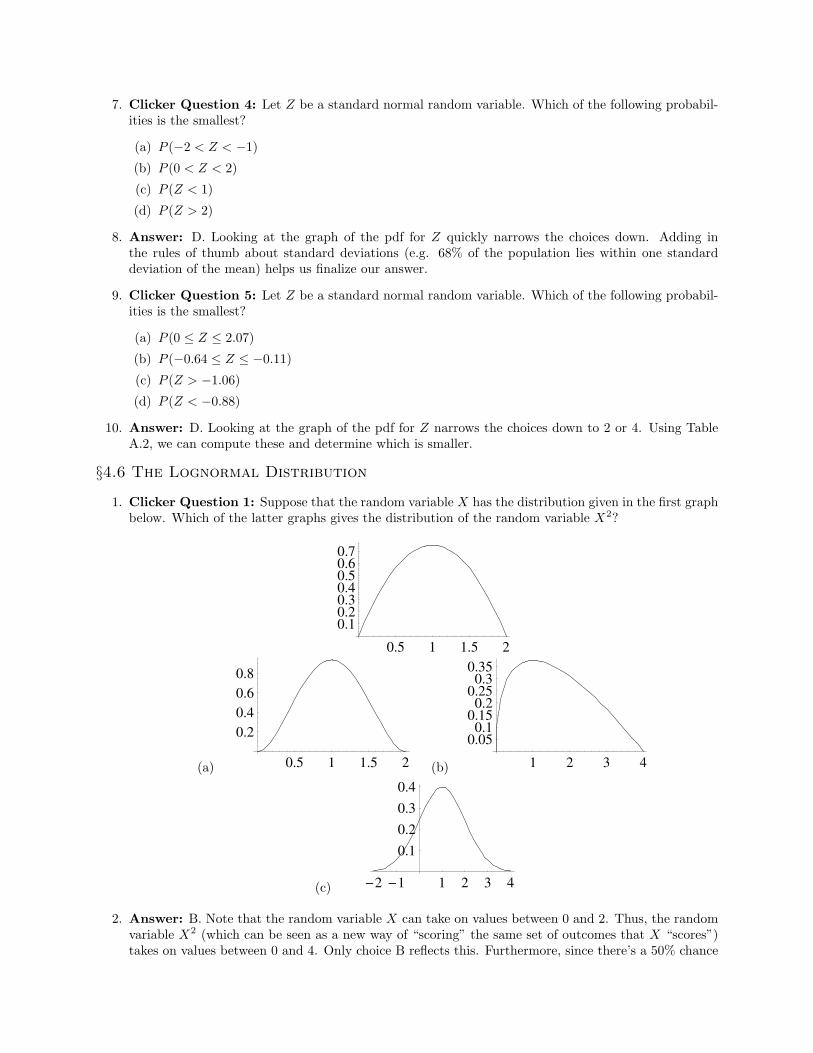
1. Clicker Question 1: Suppose that the random variable X has the distribution given in the first graphbelow. Which of the latter graphs gives the distribution of the random variable X2?
0.5 1 1.5 20.10.20.30.40.50.60.7
(a) 0.5 1 1.5 2
0.20.40.60.8
(b) 1 2 3 40.050.1
0.150.2
0.250.3
0.35
(c) -2 -1 1 2 3 4
0.10.20.30.4
2. Answer: B. Note that the random variable X can take on values between 0 and 2. Thus, the randomvariable X2 (which can be seen as a new way of “scoring” the same set of outcomes that X “scores”)takes on values between 0 and 4. Only choice B reflects this. Furthermore, since there’s a 50% chance
that X will take on a value between 0 and 1, there should be a 50% chance that X2 takes on a valuebetween 02 = 0 and 12 = 1, which is seen in the fact that half the area under the curve in choice Boccurs to the left of x = 1.
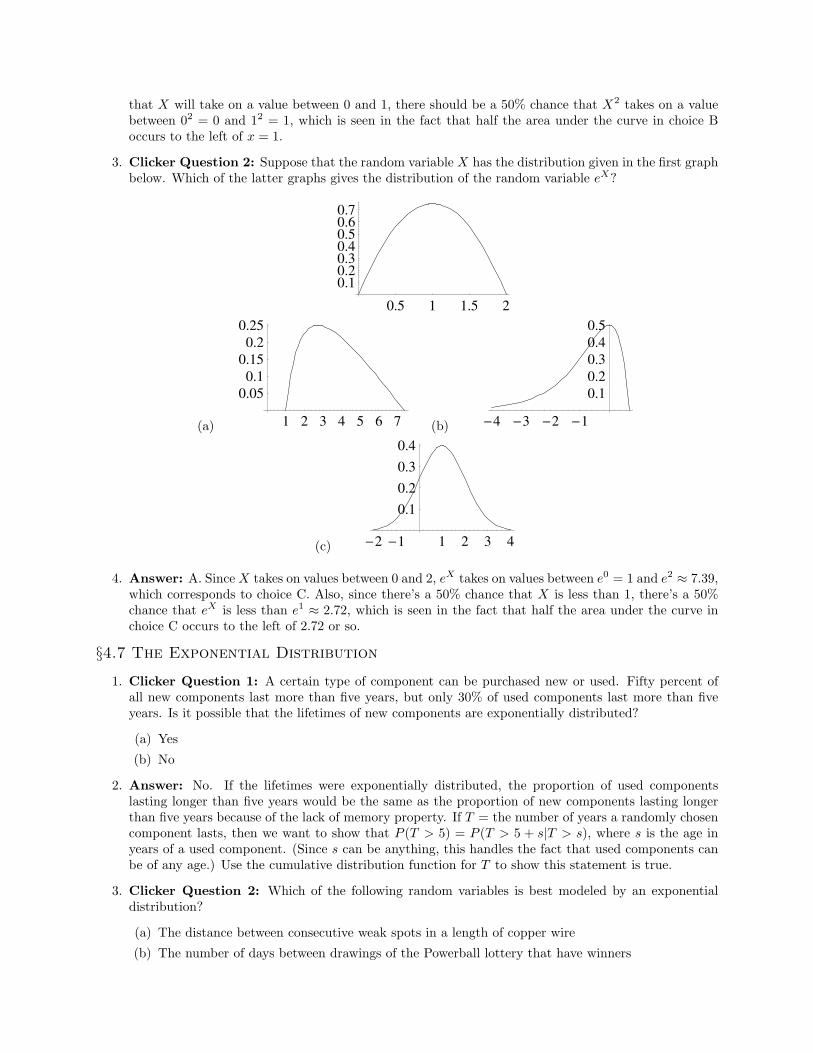
3. Clicker Question 2: Suppose that the random variable X has the distribution given in the first graphbelow. Which of the latter graphs gives the distribution of the random variable eX?
0.5 1 1.5 20.10.20.30.40.50.60.7
(a) 1 2 3 4 5 6 7
0.050.1
0.150.2
0.25
(b) -4 -3 -2 -1
0.10.20.30.40.5
(c) -2 -1 1 2 3 4
0.10.20.30.4
4. Answer: A. Since X takes on values between 0 and 2, eX takes on values between e0 = 1 and e2 ≈ 7.39,which corresponds to choice C. Also, since there’s a 50% chance that X is less than 1, there’s a 50%chance that eX is less than e1 ≈ 2.72, which is seen in the fact that half the area under the curve inchoice C occurs to the left of 2.72 or so.
§4.7 The Exponential Distribution
1. Clicker Question 1: A certain type of component can be purchased new or used. Fifty percent ofall new components last more than five years, but only 30% of used components last more than fiveyears. Is it possible that the lifetimes of new components are exponentially distributed?
(a) Yes
(b) No
2. Answer: No. If the lifetimes were exponentially distributed, the proportion of used componentslasting longer than five years would be the same as the proportion of new components lasting longerthan five years because of the lack of memory property. If T = the number of years a randomly chosencomponent lasts, then we want to show that P (T > 5) = P (T > 5 + s|T > s), where s is the age inyears of a used component. (Since s can be anything, this handles the fact that used components canbe of any age.) Use the cumulative distribution function for T to show this statement is true.
3. Clicker Question 2: Which of the following random variables is best modeled by an exponentialdistribution?
(a) The distance between consecutive weak spots in a length of copper wire
(b) The number of days between drawings of the Powerball lottery that have winners
(c) The number of accidents that occur in a certain intersection in a given year
(d) The amount of rainfall in Nashville in a week given an average rainfall of 0.2 inches per day
4. Answer: Choice (b) isn’t a continuous random variable nor does it involve a Poisson process. Choice(c) involves a Poisson process, but is a Poisson random variable, not an exponetial one. Choice (d)doesn’t involve a Poisson process. Choice (a), on the other hand, can be modeled by an exponentialrandom variable with parameter λ = average number of weak spots per unit of distance.
§4.10 Probability Plots
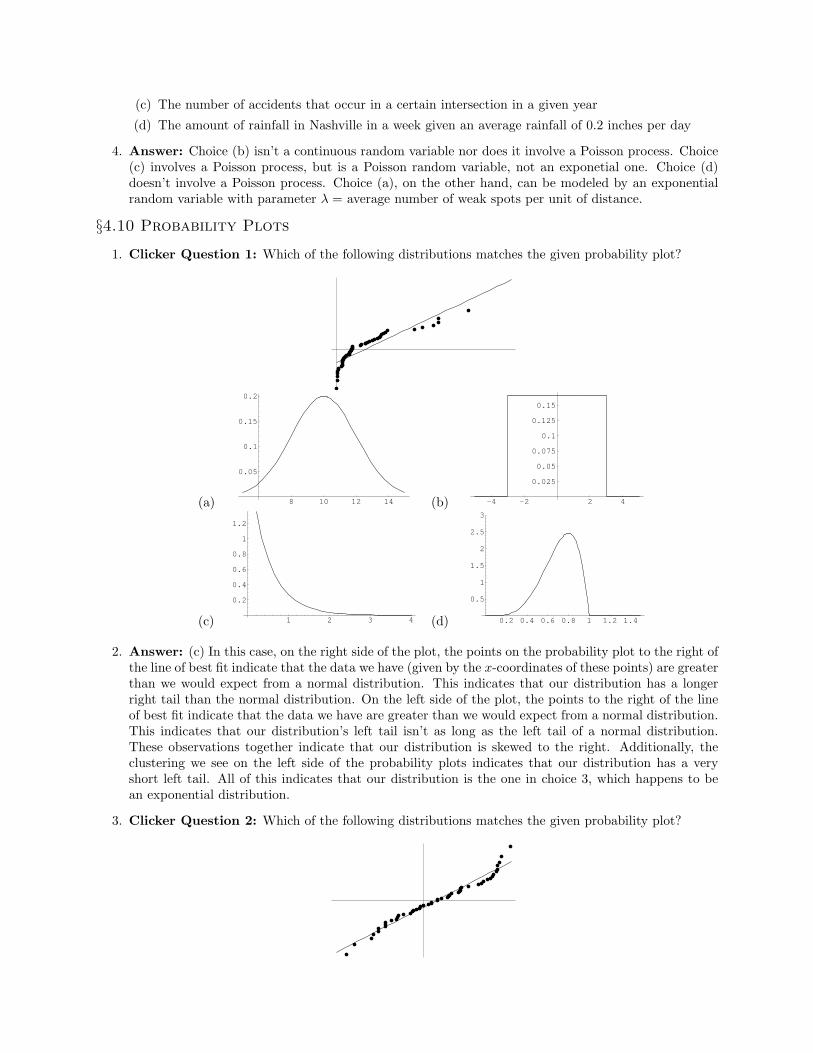
1. Clicker Question 1: Which of the following distributions matches the given probability plot?
(a) 8 10 12 14
0.05
0.1
0.15
0.2
(b) -4 -2 2 4
0.025
0.05
0.075
0.1
0.125
0.15
(c) 1 2 3 4
0.2
0.4
0.6
0.8
1
1.2
(d) 0.2 0.4 0.6 0.8 1 1.2 1.4
0.5
1
1.5
2
2.5
3
2. Answer: (c) In this case, on the right side of the plot, the points on the probability plot to the right ofthe line of best fit indicate that the data we have (given by the x-coordinates of these points) are greaterthan we would expect from a normal distribution. This indicates that our distribution has a longerright tail than the normal distribution. On the left side of the plot, the points to the right of the lineof best fit indicate that the data we have are greater than we would expect from a normal distribution.This indicates that our distribution’s left tail isn’t as long as the left tail of a normal distribution.These observations together indicate that our distribution is skewed to the right. Additionally, theclustering we see on the left side of the probability plots indicates that our distribution has a veryshort left tail. All of this indicates that our distribution is the one in choice 3, which happens to bean exponential distribution.
3. Clicker Question 2: Which of the following distributions matches the given probability plot?
(a) 8 10 12 14
0.05
0.1
0.15
0.2
(b) -4 -2 2 4
0.025
0.05
0.075
0.1
0.125
0.15
(c) 1 2 3 4
0.2
0.4
0.6
0.8
1
1.2
(d) 0.2 0.4 0.6 0.8 1 1.2 1.4
0.5
1
1.5
2
2.5
3
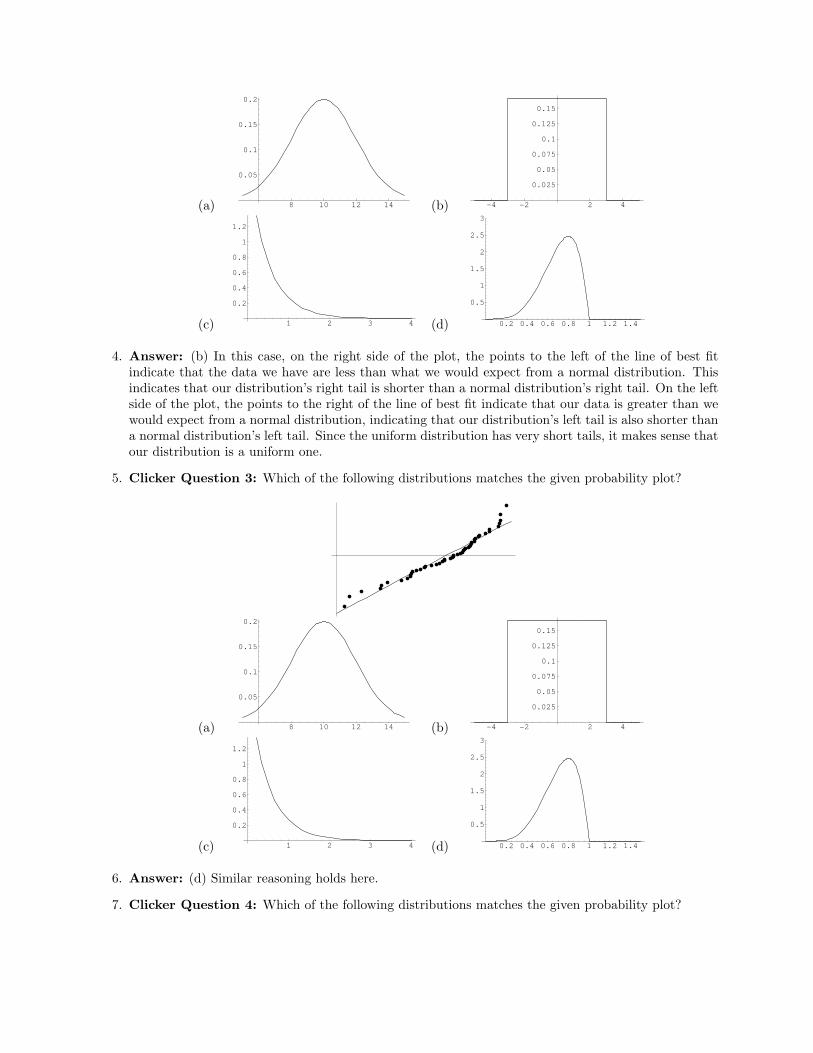
4. Answer: (b) In this case, on the right side of the plot, the points to the left of the line of best fitindicate that the data we have are less than what we would expect from a normal distribution. Thisindicates that our distribution’s right tail is shorter than a normal distribution’s right tail. On the leftside of the plot, the points to the right of the line of best fit indicate that our data is greater than wewould expect from a normal distribution, indicating that our distribution’s left tail is also shorter thana normal distribution’s left tail. Since the uniform distribution has very short tails, it makes sense thatour distribution is a uniform one.
5. Clicker Question 3: Which of the following distributions matches the given probability plot?
(a) 8 10 12 14
0.05
0.1
0.15
0.2
(b) -4 -2 2 4
0.025
0.05
0.075
0.1
0.125
0.15
(c) 1 2 3 4
0.2
0.4
0.6
0.8
1
1.2
(d) 0.2 0.4 0.6 0.8 1 1.2 1.4
0.5
1
1.5
2
2.5
3
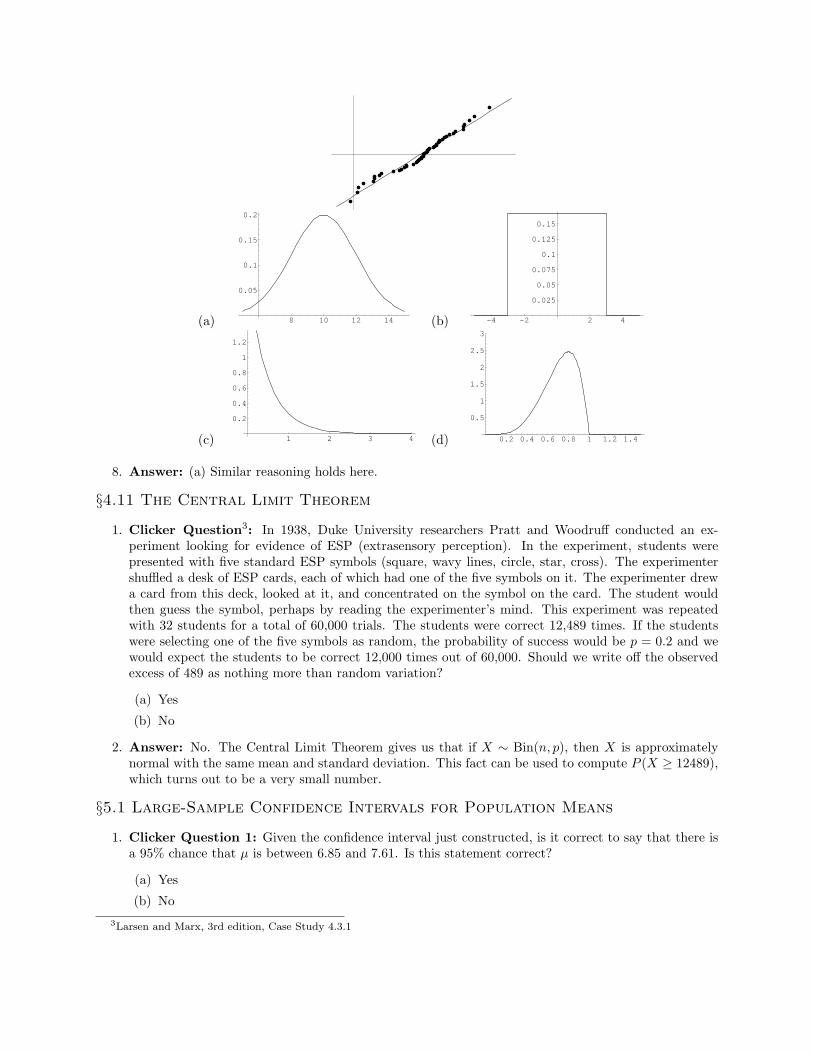
6. Answer: (d) Similar reasoning holds here.
7. Clicker Question 4: Which of the following distributions matches the given probability plot?
(a) 8 10 12 14
0.05
0.1
0.15
0.2
(b) -4 -2 2 4
0.025
0.05
0.075
0.1
0.125
0.15
(c) 1 2 3 4
0.2
0.4
0.6
0.8
1
1.2
(d) 0.2 0.4 0.6 0.8 1 1.2 1.4
0.5
1
1.5
2
2.5
3
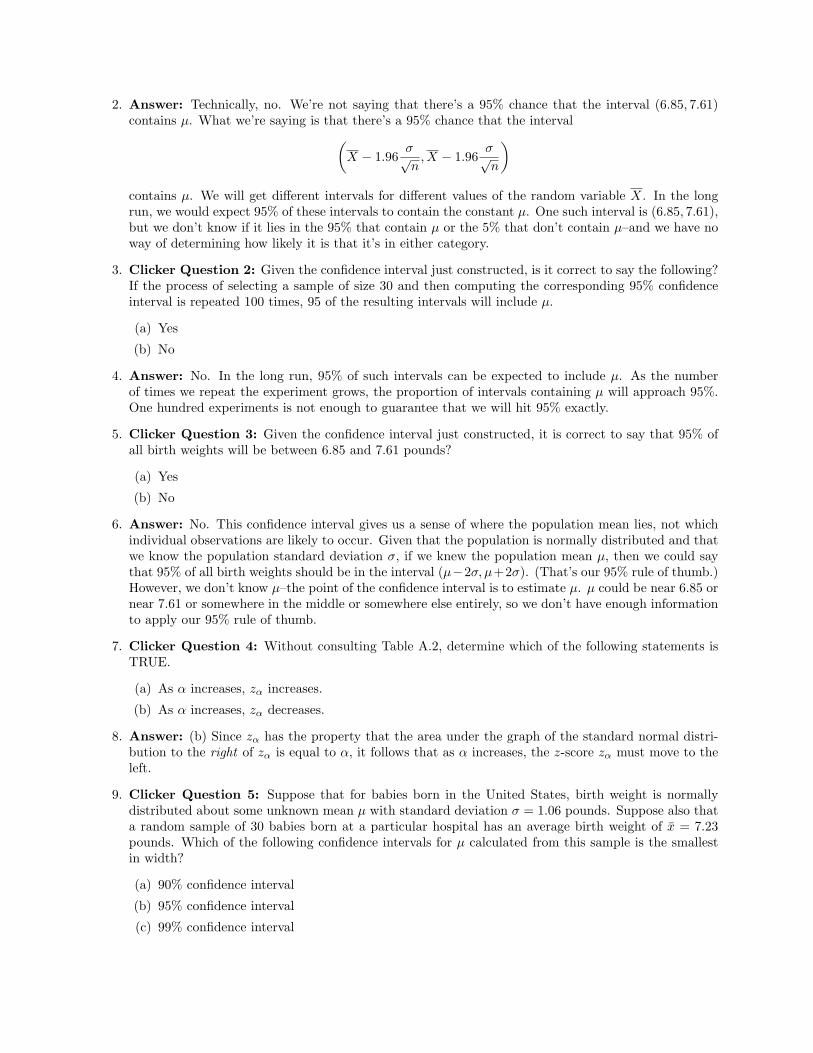
8. Answer: (a) Similar reasoning holds here.
§4.11 The Central Limit Theorem
1. Clicker Question3: In 1938, Duke University researchers Pratt and Woodruff conducted an ex-periment looking for evidence of ESP (extrasensory perception). In the experiment, students werepresented with five standard ESP symbols (square, wavy lines, circle, star, cross). The experimentershuffled a desk of ESP cards, each of which had one of the five symbols on it. The experimenter drewa card from this deck, looked at it, and concentrated on the symbol on the card. The student wouldthen guess the symbol, perhaps by reading the experimenter’s mind. This experiment was repeatedwith 32 students for a total of 60,000 trials. The students were correct 12,489 times. If the studentswere selecting one of the five symbols as random, the probability of success would be p = 0.2 and wewould expect the students to be correct 12,000 times out of 60,000. Should we write off the observedexcess of 489 as nothing more than random variation?
(a) Yes
(b) No
2. Answer: No. The Central Limit Theorem gives us that if X ∼ Bin(n, p), then X is approximatelynormal with the same mean and standard deviation. This fact can be used to compute P (X ≥ 12489),which turns out to be a very small number.
§5.1 Large-Sample Confidence Intervals for Population Means
1. Clicker Question 1: Given the confidence interval just constructed, is it correct to say that there isa 95% chance that µ is between 6.85 and 7.61. Is this statement correct?
(a) Yes
(b) No
3Larsen and Marx, 3rd edition, Case Study 4.3.1
2. Answer: Technically, no. We’re not saying that there’s a 95% chance that the interval (6.85, 7.61)contains µ. What we’re saying is that there’s a 95% chance that the interval(
X − 1.96σ√n
,X − 1.96σ√n
)contains µ. We will get different intervals for different values of the random variable X. In the longrun, we would expect 95% of these intervals to contain the constant µ. One such interval is (6.85, 7.61),but we don’t know if it lies in the 95% that contain µ or the 5% that don’t contain µ–and we have noway of determining how likely it is that it’s in either category.
3. Clicker Question 2: Given the confidence interval just constructed, is it correct to say the following?If the process of selecting a sample of size 30 and then computing the corresponding 95% confidenceinterval is repeated 100 times, 95 of the resulting intervals will include µ.
(a) Yes
(b) No
4. Answer: No. In the long run, 95% of such intervals can be expected to include µ. As the numberof times we repeat the experiment grows, the proportion of intervals containing µ will approach 95%.One hundred experiments is not enough to guarantee that we will hit 95% exactly.
5. Clicker Question 3: Given the confidence interval just constructed, it is correct to say that 95% ofall birth weights will be between 6.85 and 7.61 pounds?
(a) Yes
(b) No
6. Answer: No. This confidence interval gives us a sense of where the population mean lies, not whichindividual observations are likely to occur. Given that the population is normally distributed and thatwe know the population standard deviation σ, if we knew the population mean µ, then we could saythat 95% of all birth weights should be in the interval (µ−2σ, µ+2σ). (That’s our 95% rule of thumb.)However, we don’t know µ–the point of the confidence interval is to estimate µ. µ could be near 6.85 ornear 7.61 or somewhere in the middle or somewhere else entirely, so we don’t have enough informationto apply our 95% rule of thumb.
7. Clicker Question 4: Without consulting Table A.2, determine which of the following statements isTRUE.
(a) As α increases, zα increases.
(b) As α increases, zα decreases.
8. Answer: (b) Since zα has the property that the area under the graph of the standard normal distri-bution to the right of zα is equal to α, it follows that as α increases, the z-score zα must move to theleft.
9. Clicker Question 5: Suppose that for babies born in the United States, birth weight is normallydistributed about some unknown mean µ with standard deviation σ = 1.06 pounds. Suppose also thata random sample of 30 babies born at a particular hospital has an average birth weight of x = 7.23pounds. Which of the following confidence intervals for µ calculated from this sample is the smallestin width?
(a) 90% confidence interval
(b) 95% confidence interval
(c) 99% confidence interval
10. Answer: Choice (a) is the correct choice. The smallest interval is the 90% confidence interval.Confidence and interval width are always trade-offs. Note that the width of a confidence intervalis proportional to zα/2, and, as we saw in an earlier clicker question, as α/2 increases, zα/2 increases.Similarly, as α/2 decreases, zα/2 decreases and the confidence interval gets narrower.
11. Clicker Question 6: Suppose you construct a 95% confidence interval from a random sample of sizen = 20 with sample mean x = 100 taken from a population with unknown mean µ and known standarddeviation σ = 10, and the interval is fairly wide. Which of the following conditions would NOT leadto a narrower confidence interval?
(a) If you decreased your confidence level
(b) If you increased your sample size
(c) If the sample mean was smaller
(d) If the population standard deviation was smaller
12. Answer: Choice (c) is the correct answer. As we saw in the last question, decreasing your confidencelevel results in decreasing zα/2 which results in a narrower confidence interval. Since the width of theconfidence interval is proportional to 1/
√n, increasing the sample size will also narrow the interval.
Likewise, the width of the confidence interval is proportional to σ, so a smaller population standarddevation will result in a narrower interval. On the other hand, the interval is centered at the samplemean, but its width doesn’t depend on the sample mean, so decreasing the sample mean won’t narrowthe interval–it will just shift it to the left.
13. Clicker Question 7: Suppose that for babies born in the United States, birth weight is normallydistributed about some unknown mean µ with standard deviation σ = 1.06 pounds. What is theminimum sample size necessary to ensure that the resulting 99% confidence interval has a width of atmost 0.5?
(a) 70
(b) 119
(c) 120
(d) 140
14. Answer: (c) If we use z.005 = 2.575, then we find that n ≥ 119.2, thus n = 120 is the minimize samplesize to ensure a 99% CI of width at most 0.5. Of course, any n ≥ 120 will do, so choice (d) would workas well, it’s just not the minimum sample size.
15. Clicker Question 8: Suppose a random sample of size n = 50 of ball bearings produced by a particularmachine is taken and the diameter of each ball bearing in the sample is measured. Suppose that for thissample, x = 5.14 and s = 0.34. Which of the following is the corresponding 95% confidence intervalfor the population mean µ?
(a)(
5.14− z0.025 ·0.34√
50, 5.14 + z0.025 ·
0.34√50
)(b)
(5.14− t49,0.025 ·
0.34√50
, 5.14 + t49,0.025 ·0.34√
50
)(c) There is not enough information given to construct a 95% confidence interval for µ.
16. Answer: Choice (a) is the best choice here. In this case, the sample size is large enough that thedistribution of X is approximately normal. We don’t know the population standard deviation σ, butwith a sample size this large, the sample standard deviation s is a good approximation of σ, so we cango with choice (a).
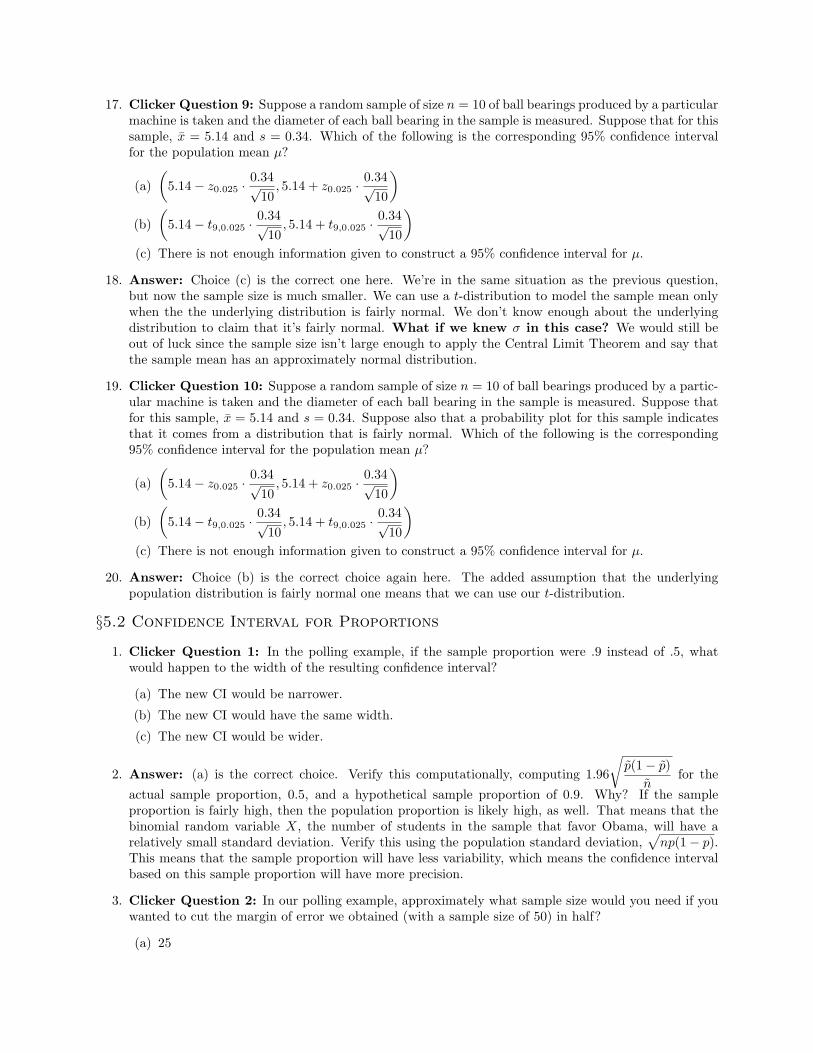
17. Clicker Question 9: Suppose a random sample of size n = 10 of ball bearings produced by a particularmachine is taken and the diameter of each ball bearing in the sample is measured. Suppose that for thissample, x = 5.14 and s = 0.34. Which of the following is the corresponding 95% confidence intervalfor the population mean µ?
(a)(
5.14− z0.025 ·0.34√
10, 5.14 + z0.025 ·
0.34√10
)(b)
(5.14− t9,0.025 ·
0.34√10
, 5.14 + t9,0.025 ·0.34√
10
)(c) There is not enough information given to construct a 95% confidence interval for µ.
18. Answer: Choice (c) is the correct one here. We’re in the same situation as the previous question,but now the sample size is much smaller. We can use a t-distribution to model the sample mean onlywhen the the underlying distribution is fairly normal. We don’t know enough about the underlyingdistribution to claim that it’s fairly normal. What if we knew σ in this case? We would still beout of luck since the sample size isn’t large enough to apply the Central Limit Theorem and say thatthe sample mean has an approximately normal distribution.
19. Clicker Question 10: Suppose a random sample of size n = 10 of ball bearings produced by a partic-ular machine is taken and the diameter of each ball bearing in the sample is measured. Suppose thatfor this sample, x = 5.14 and s = 0.34. Suppose also that a probability plot for this sample indicatesthat it comes from a distribution that is fairly normal. Which of the following is the corresponding95% confidence interval for the population mean µ?
(a)(
5.14− z0.025 ·0.34√
10, 5.14 + z0.025 ·
0.34√10
)(b)
(5.14− t9,0.025 ·
0.34√10
, 5.14 + t9,0.025 ·0.34√
10
)(c) There is not enough information given to construct a 95% confidence interval for µ.
20. Answer: Choice (b) is the correct choice again here. The added assumption that the underlyingpopulation distribution is fairly normal one means that we can use our t-distribution.
§5.2 Confidence Interval for Proportions
1. Clicker Question 1: In the polling example, if the sample proportion were .9 instead of .5, whatwould happen to the width of the resulting confidence interval?
(a) The new CI would be narrower.
(b) The new CI would have the same width.
(c) The new CI would be wider.
2. Answer: (a) is the correct choice. Verify this computationally, computing 1.96
√p(1− p)
nfor the
actual sample proportion, 0.5, and a hypothetical sample proportion of 0.9. Why? If the sampleproportion is fairly high, then the population proportion is likely high, as well. That means that thebinomial random variable X, the number of students in the sample that favor Obama, will have arelatively small standard deviation. Verify this using the population standard deviation,
√np(1− p).
This means that the sample proportion will have less variability, which means the confidence intervalbased on this sample proportion will have more precision.
3. Clicker Question 2: In our polling example, approximately what sample size would you need if youwanted to cut the margin of error we obtained (with a sample size of 50) in half?
(a) 25
(b) 100
(c) 200
(d) 400
4. Answer: Choice (c) is the correct one. This can be seen from the formula for margin of error. Thanksto the square root in the formula, halving the margin of error requires quadrupling the sample size.
5. Clicker Question 3: Which of the following does not result in a larger margin of error?
(a) Increasing the confidence level
(b) Decreasing the sample size
(c) Having a larger population size
6. Answer: Choice (c) is the correct one. Choices (a) and (b) can be explained using the formula forthe margin of error. While one might think that the larger the population, the greater our marginof error (and conversely, the smaller the population, the lesser our margin of error), margin of errordoesn’t depend on the population size. As long as the population size is sufficiently greater than thesample size (so that the binomial assumption we made way back when holds), it doesn’t matter whatthe population size is. This means that we can take a random sample of 1200 people from the much,much larger population of all registered voters, and still have a margin of error of 2.83%, even thoughour sample size is much smaller than our population size.
§6.1 Large-Sample Tests for a Population Mean§6.2 Drawing Conclusions from the Results of Hypothesis Test
1. Example: Suppose that Bayside High School was chosen to participate in the evaluation of a newalgebra and geometry curriculum. In the recent past, Bayside’s students would be considered “typical,”having earned scores on standardized exams that are consistent with national averages.
Two years ago, a cohort of 86 Bayside sophomores, all randomly selected, were assigned to a specialset of classes that integrated algebra and geometry. According to test results that have just beenreleased, those students averaged 502 on the SAT-I math exam. Nationwide, seniors averaged 494with a standard deviation of 124 with a normal distribution of scores. Can it be claimed that thenew curriculum had an effect? (Let µ be the mean of the hypothetical population of all Bayside HighSchool students taking the new curriculum.)
2. Clicker Question 1: In the Bayside High School example, which of the following should the schooladministrators choose for their alternate hypothesis?
(a) H1 : µ < 494
(b) H1 : µ 6= 494
(c) H1 : µ > 494
3. Answer: Choice (c) is probably the best choice here. We’re interested in showing that the newcurriculum improves learning here. Note that Choice (c) means that our null hypothesis is H0 : µ ≤ 494.
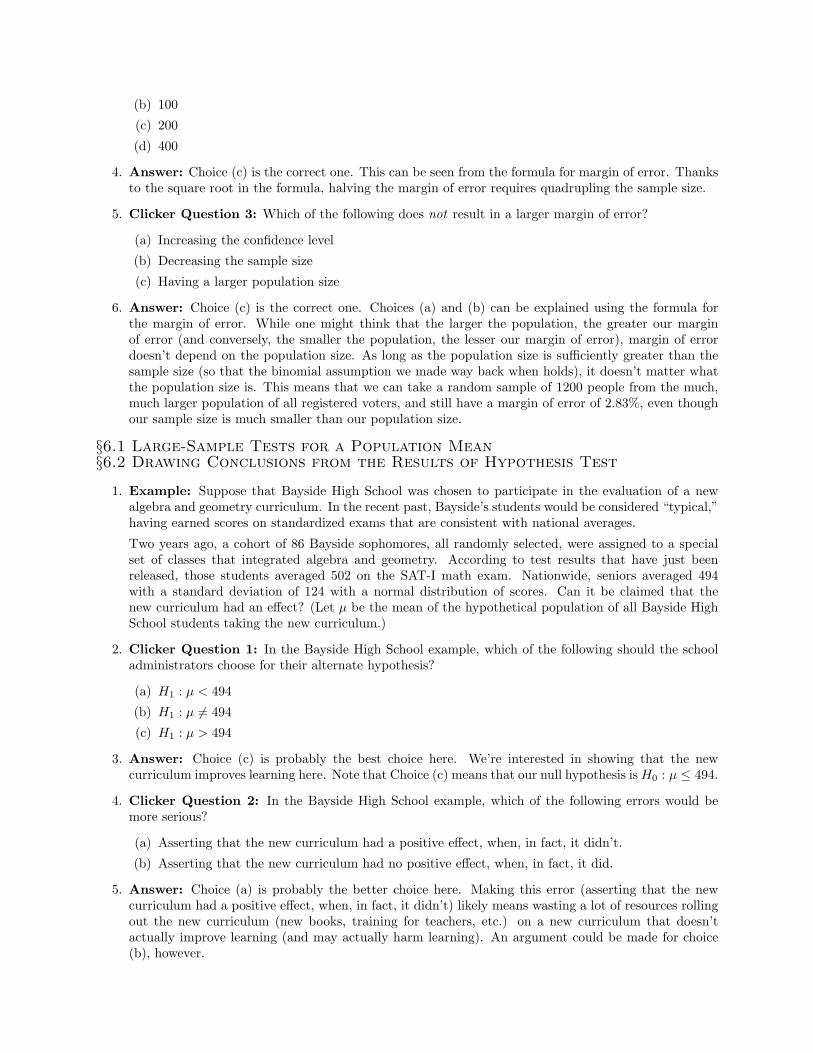
4. Clicker Question 2: In the Bayside High School example, which of the following errors would bemore serious?
(a) Asserting that the new curriculum had a positive effect, when, in fact, it didn’t.
(b) Asserting that the new curriculum had no positive effect, when, in fact, it did.
5. Answer: Choice (a) is probably the better choice here. Making this error (asserting that the newcurriculum had a positive effect, when, in fact, it didn’t) likely means wasting a lot of resources rollingout the new curriculum (new books, training for teachers, etc.) on a new curriculum that doesn’tactually improve learning (and may actually harm learning). An argument could be made for choice(b), however.
6. Clicker Question 3: Water samples are taken from water used for cooling as it is being dischargedfrom a power plant into a river. It has been determined that as long as the mean temperature of thedischarged water is at most 150 degrees Fahrenheit, there will be no negative effects on the river’secosystem. To investigate whether the plan is in compliance with the regulations that prohibit a meandischarge water temperature above 150 degrees, 50 water samples will be taken at randomly selectedtimes, and the temperatures of each sample recorded. Which of the following hypothesis tests shouldbe used?
(a) H0 : µ ≥ 150 versus H1 : µ < 150
(b) H0 : µ ≤ 150 versus H1 : µ > 150
7. Option (a) is the hypothesis test H0 : µ ≥ 150 versus H1 : µ < 150. If we were to get a low P -value withthis hypothesis test (e.g. P = 0.02), then that would be strong evidence that the water temperatureis less than 150 degrees. (There would be only a 2% chance that we would get water temperatures aslow as, say, 145 degrees if the temperature were really greater than 150. Since this probability is solow, we would conclude that the water temperature must be lower than 150.)
Option (b) is the hypothesis test H0 : µ ≤ 150 versus H1 : µ > 150. If we were to get a low P -value withthis hypothesis test (e.g. P = 0.02), then that would be strong evidence that the water temperature isgreater than 150 degrees. (There would only be a 2% chance that we would get water temperatures asbig as, say, 155 degrees if the temperature were really less than 150. Since this probability is so low,we would conclude that the water temperature must be greater than 150.)
Now suppose you’re the power plant owner, and you want to avoid an unnecessary fine by the EPS forhigh discharge water temperatures. You would want to use Option (b) since you’ll want to see strongevidence that your water temperature is too high. If you got a low P -value, then that would be strongevidence that your water temperature is too high, so you would go along with the EPA fine. If you gota high P -value, then there’s not strong evidence that your water temperature is too high, so the EPApresumably wouldn’t fine you. A low P -value minimizes the chance of an unnecessary fine.
Now suppose you’re Green Peace and you really don’t want high water temperatures to kill fish. Youwould want to use Option (a) since you’ll want to see strong evidence that the water temperature is lowenough. If you got a low P -value, then that would be strong evidence that the water temperature islow enough, so you would be okay with the EPA not fining the power plant. If you got a high P -value,then there would not be strong evidence that the water temperature is low enough, so you would wantthe EPA to go ahead and fine the power plant. A low P -value minimizes the chance that the powerplant will “get away” with too-high water temperatures.
In practice, you would typically collect your water samples and compute the sample mean. If the meanwere bigger than 150, then if you’re the power plant, then you would want to conduct an Option (b)hypothesis test to see if there’s really sufficient evidence that your water is too hot. If the mean werebigger than 150 and you’re Green Peace, then you would just say, “Fine the power plant.”
If the mean were lower than 150, then if you’re the power plant, then you would tell the EPA not tofine you since your water is cool enough. If the sample mean were lower than 150 and you’re GreenPeace, then you would want to conduct an Option (a) hypothesis test to see if there’s really sufficientevidence that the water is cool enough.
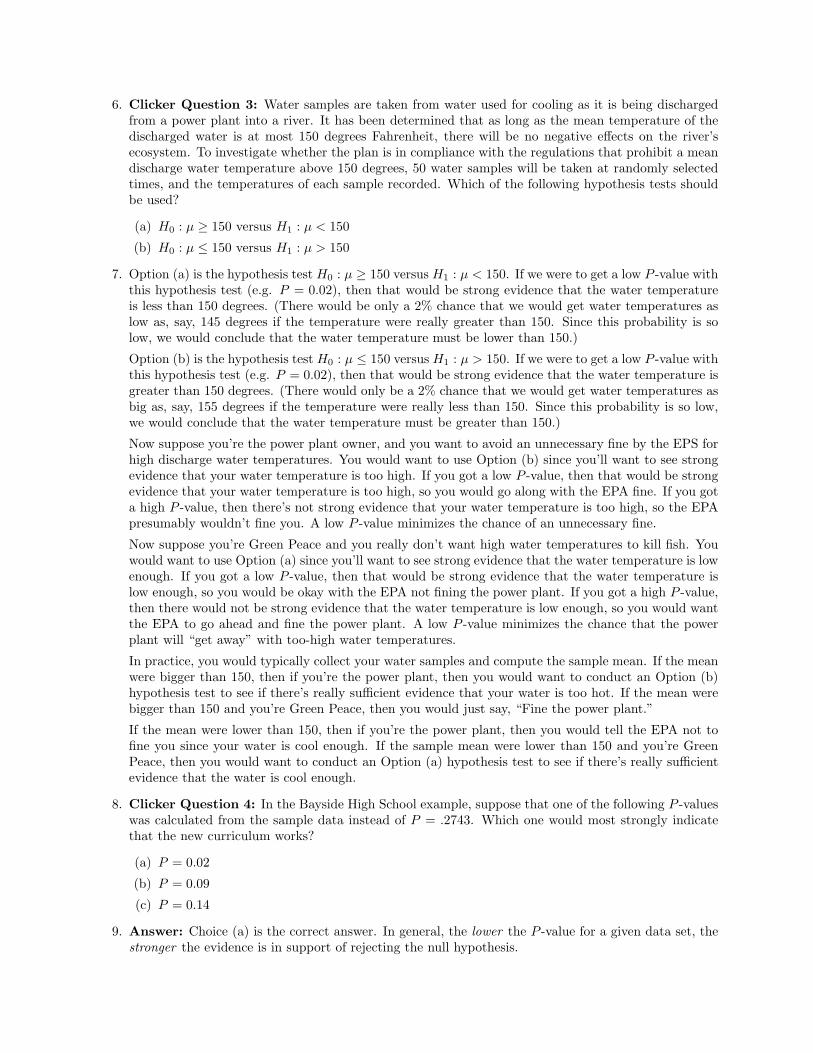
8. Clicker Question 4: In the Bayside High School example, suppose that one of the following P -valueswas calculated from the sample data instead of P = .2743. Which one would most strongly indicatethat the new curriculum works?
(a) P = 0.02
(b) P = 0.09
(c) P = 0.14
9. Answer: Choice (a) is the correct answer. In general, the lower the P -value for a given data set, thestronger the evidence is in support of rejecting the null hypothesis.
10. Clicker Question 5: In the Bayside example, we found that the P -value for the sample data was.2743. Which of the following is the lowest level at which this result is statistically significant?
(a) 1%(b) 5%(c) 10%(d) 30%
11. Answer: Choice (d) is the correct answer. See the definition of “statistically significant” for anexplanation.
12. Clicker Question 6: In the Bayside High School example, we found that if a sample of n = 86students scored an average of 502, then the P -value was .2743. If a random sample of 860 studentsscored an average of 502, would this raise or lower our P -value?
(a) Raise(b) Lower
13. Answer: Choice (b) is the correct choice. It’s much less likely that a sample 860 students wouldaverage 8 points above the national average than it is for a sample of 86 students to do so. Thus, thedata would provide stronger evidence for rejecting the null hypothesis, which means the p-value wouldbe lower. Compute the p-value as a check.
14. Clicker Question 7: Suppose that in the Bayside example, we had found that the P -value for thesample data was 0.04. What is the probability that the new curriculum has no positive effect?
(a) 2%(b) 4%(c) 8%(d) We have insufficient information with which to answer this question.
15. Answer: Choice (d) is the correct answer. The P -value is the probability that we would get a resultlike the one at hand if the null hypothesis (that the curriculum has no effect) is true. The P -value isnot the probability that the null hypothesis is true. The null hypothesis is either true or false. Thetruth or falsehood of the null hypothesis does not vary each time we collect a sample. Since it is nota random variable (that is, it does not vary), it does not make sense to discuss the “probability” thatit is true or not.
§6.3 Tests for a Population Proportion§6.4 Small-Sample Tests for a Population Mean
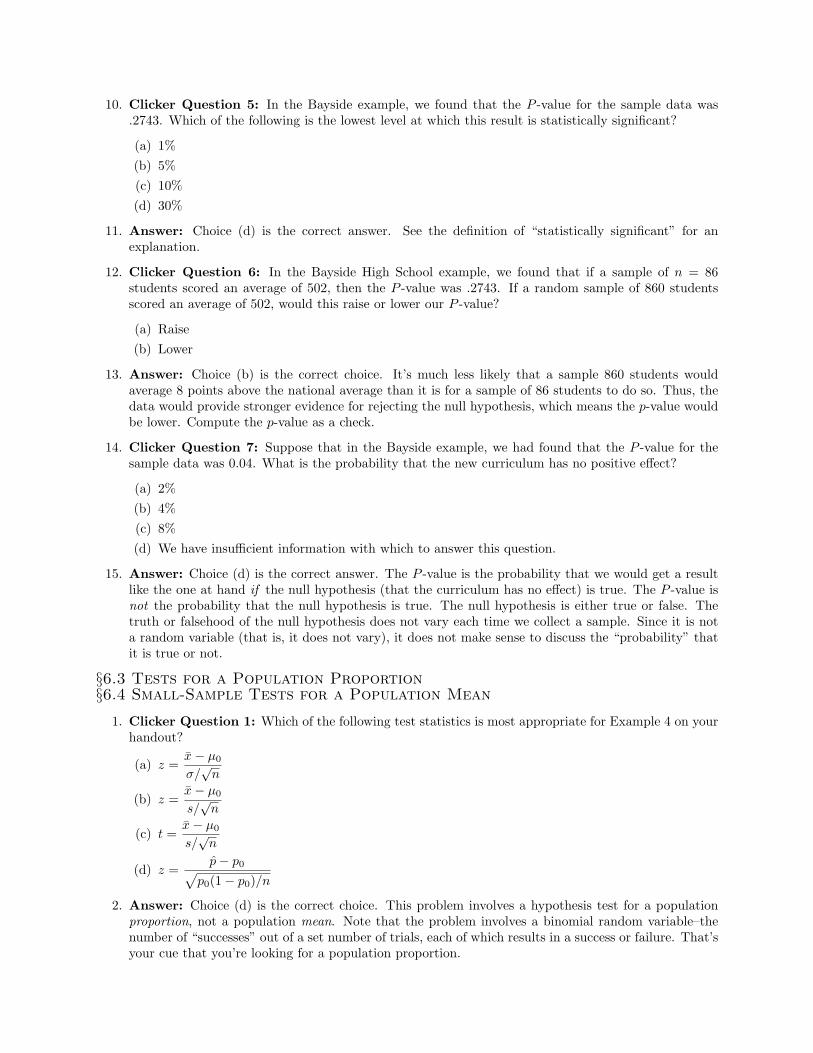
1. Clicker Question 1: Which of the following test statistics is most appropriate for Example 4 on yourhandout?
(a) z =x− µ0
σ/√
n
(b) z =x− µ0
s/√
n
(c) t =x− µ0
s/√
n
(d) z =p− p0√
p0(1− p0)/n
2. Answer: Choice (d) is the correct choice. This problem involves a hypothesis test for a populationproportion, not a population mean. Note that the problem involves a binomial random variable–thenumber of “successes” out of a set number of trials, each of which results in a success or failure. That’syour cue that you’re looking for a population proportion.
3. Clicker Question 2: Which of the following test statistics is most appropriate for Example 5 on yourhandout?
(a) z =x− µ0
σ/√
n
(b) z =x− µ0
s/√
n
(c) t =x− µ0
s/√
n
(d) z =p− p0√
p0(1− p0)/n
4. Answer: Choice (a) is the correct choice here. Initially, it might seem that choice (c) is the correctone, since we have a small sample size. However, since we know the population standard deviation σ,we don’t need to estimate σ with the sample standard deviation s. As a result, we don’t need to usea t-test, which is designed to handle the extra variability introduced when we approximate σ with s.We can instead use a z-test.
5. Clicker Question 3: Which of the following test statistics is most appropriate for Example 6 on yourhandout?
(a) z =x− µ0
σ/√
n
(b) z =x− µ0
s/√
n
(c) t =x− µ0
s/√
n
(d) z =p− p0√
p0(1− p0)/n
6. Answer: Choice (b) is the correct choice here. We have a large sample, so we can use a z-test, thanksto the Central Limit Theorem. Since we don’t know the population standard deviation σ, we have touse the sample standard deviation s.
§6.8 Paired Tests for Difference Between Two Means
1. Clicker Question 1: Two methods are used to predict the shear strength for steel plate girders. Eachmethod is applied to nine specific girders and the ratio of predicted load to observed load is calculatedfor each method and each girder. What kind of t-test should we use to compare these data?
(a) Independent t-test
(b) Paired t-test
2. Answer: Choice (b) is the correct one. In this case, each pair of data has something in common–theyare generated by applying one of the two methods to the same girder.
3. Clicker Question 2: Two catalysts are being analyzed to determine how they affect the mean yieldof a chemical process. Catalyst 1 is used in the process eight times and the yield in percent is measuredeach time. Then catalyst 2 is used in the process eight times and the yield is measured each time.What kind of t-test should be used to compare these data?
(a) Independent t-test
(b) Paired t-test
4. Answer: Choice (a) is the correct one. In this case, catalyst 1 is applied to a different set of processesthan catalyst 2, thus there is no way to match data from the first set with data from the second set.
5. Clicker Question 3: Six river locations are selected and the zinc concentration is determined forboth surface water and bottom water at each location. What kind of t-test should be used to comparethese data?
(a) Independent t-test
(b) Paired t-test
6. Answer: Choice (b) is the correct one. In this case, each pair of data has something in common–theyare taken from the same river.
§7.1–7.3 Simple Linear Regression
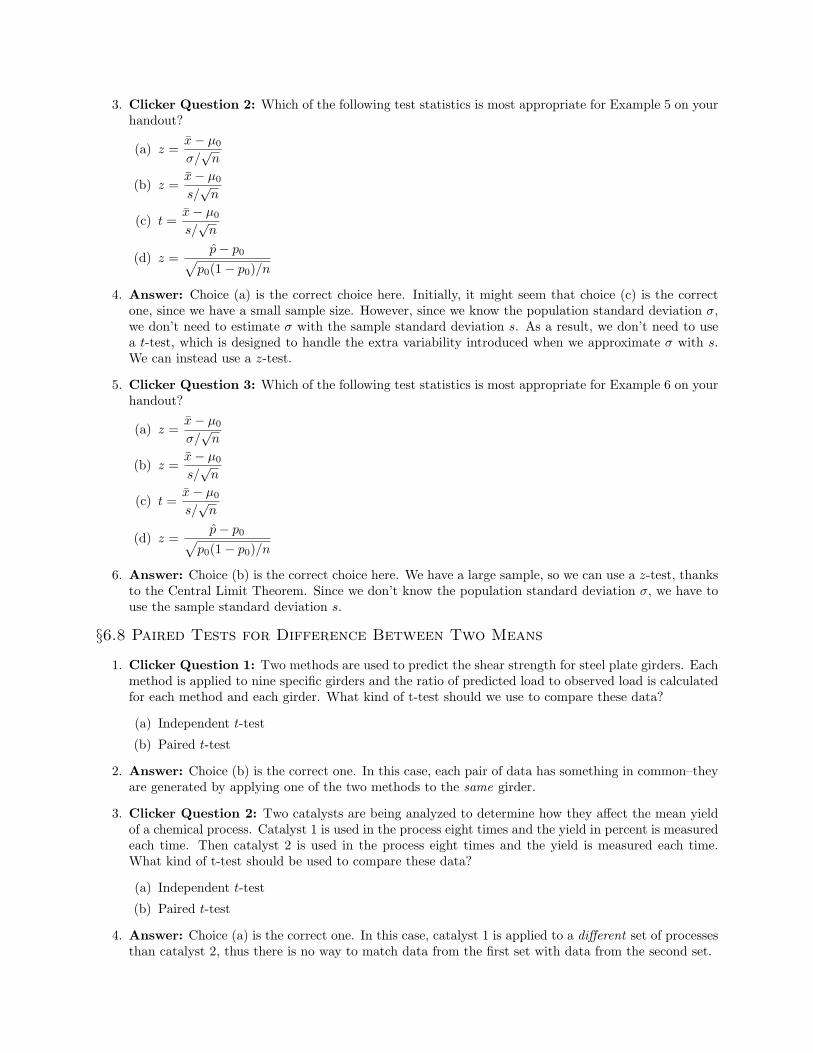
1. Clicker Question 1: The line y = 4 + 2x has been proposed as a line of best for the following foursets of bivariate data. For which data set is this line the best fit?
(a) 1 2 3 4 5 6
6
8
10
12
14
16
(b) 1 2 3 4 5 6
6
8
10
12
14
16
(c) 1 2 3 4 5 6
6
8
10
12
14
16
(d) 1 2 3 4 5 6
6
8
10
12
14
16
2. Answer: Choice (c) is the correct one. As mentioned in the book, the line that best fits a set of datais the one that minimizes the sum of the squares of the residuals:
S =n∑
i=1
e2i =
n∑i=1
(yi − yi)2 =
n∑i=1
(yi − β0 − β1xi
)2
.
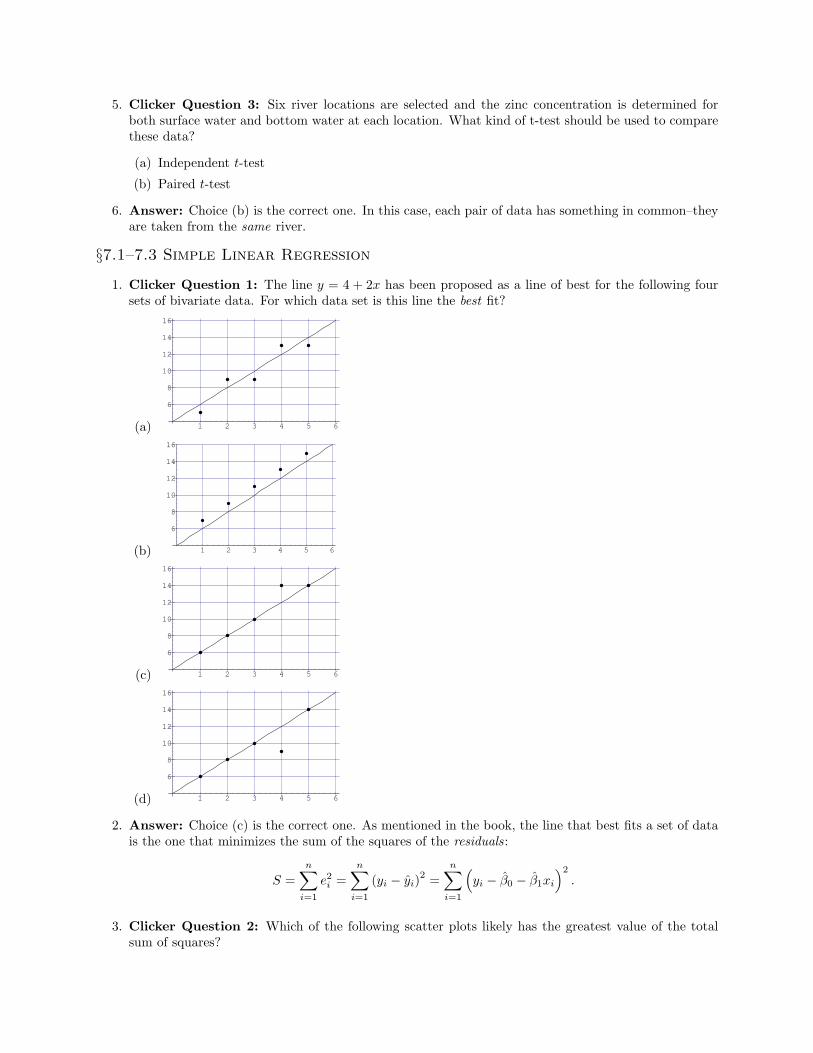
3. Clicker Question 2: Which of the following scatter plots likely has the greatest value of the totalsum of squares?
(a) 0.5 1 1.5 2 2.5 3
5
10
15
20
25
30
35
40
(b) 0.5 1 1.5 2 2.5 3
5
10
15
20
25
30
35
40
(c) 0.5 1 1.5 2 2.5 3
5
10
15
20
25
30
35
40
(d) 0.5 1 1.5 2 2.5 3
5
10
15
20
25
30
35
40
4. Answer: Choice (d) is the correct choice. Ignoring the x-values, choice 4 has the greatest sum ofsquares of differences between the observed y-values and the average of the observed y-values.
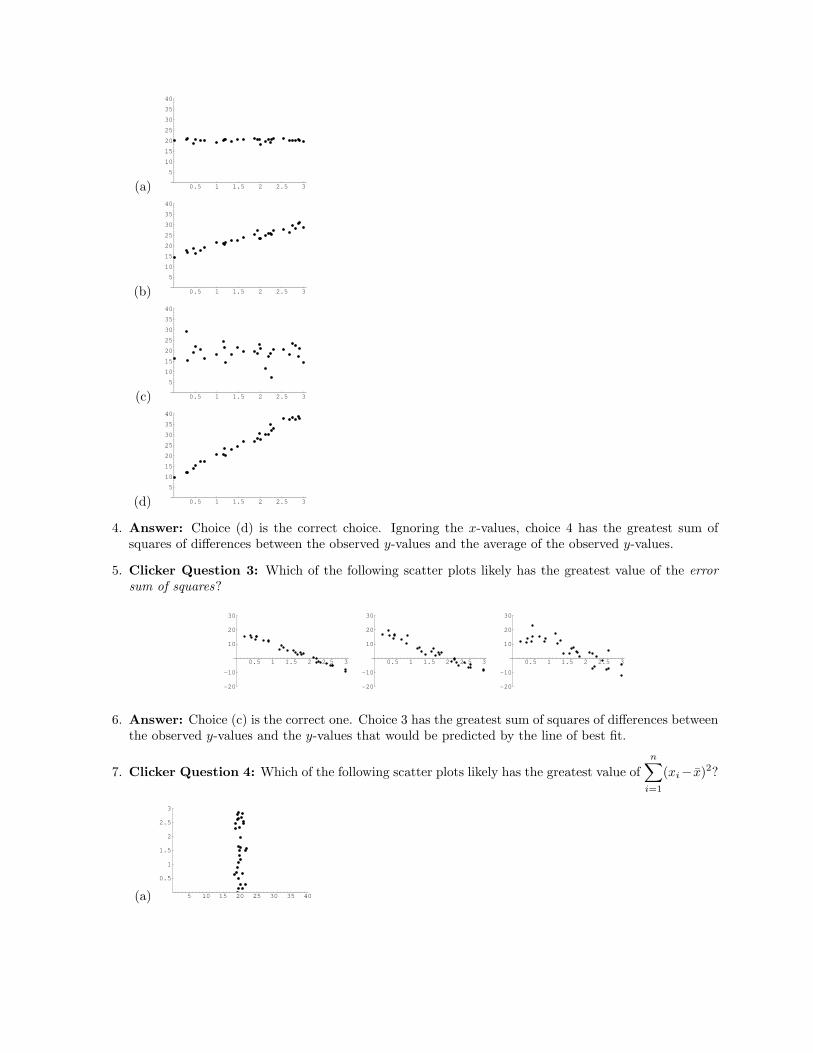
5. Clicker Question 3: Which of the following scatter plots likely has the greatest value of the errorsum of squares?
0.5 1 1.5 2 2.5 3
-20
-10
10
20
30
0.5 1 1.5 2 2.5 3
-20
-10
10
20
30
0.5 1 1.5 2 2.5 3
-20
-10
10
20
30
6. Answer: Choice (c) is the correct one. Choice 3 has the greatest sum of squares of differences betweenthe observed y-values and the y-values that would be predicted by the line of best fit.
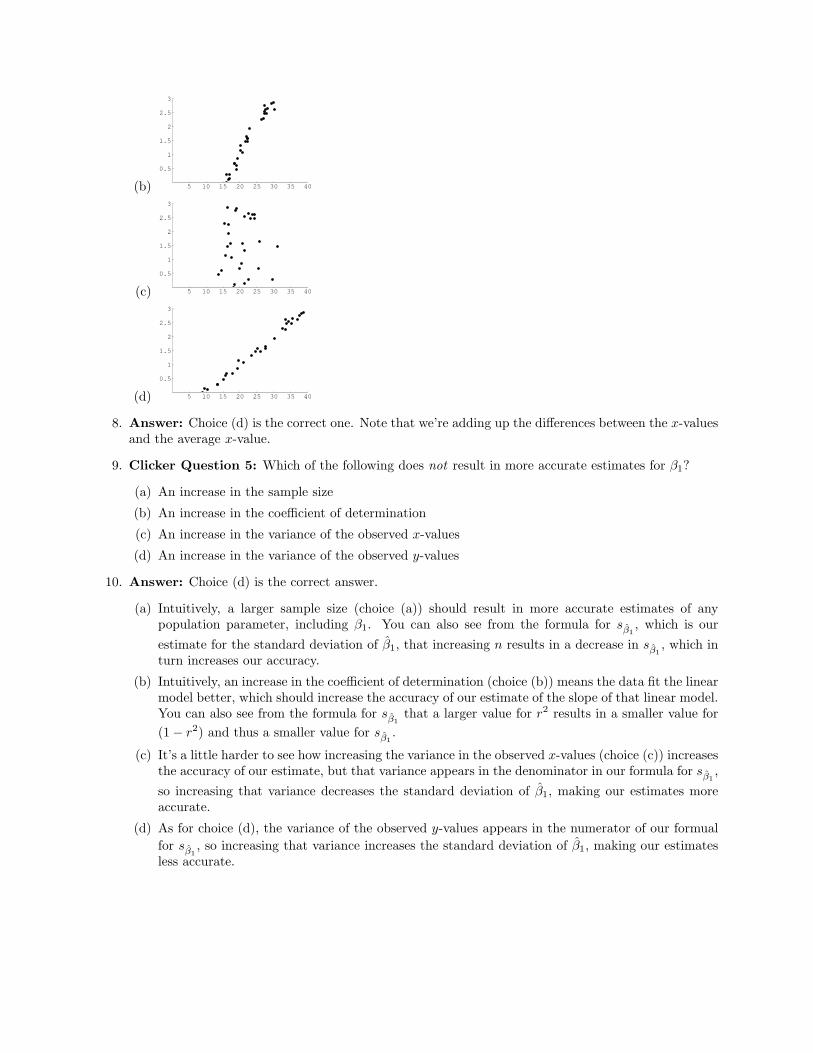
7. Clicker Question 4: Which of the following scatter plots likely has the greatest value ofn∑
i=1
(xi− x)2?
(a) 5 10 15 20 25 30 35 40
0.5
1
1.5
2
2.5
3
(b) 5 10 15 20 25 30 35 40
0.5
1
1.5
2
2.5
3
(c) 5 10 15 20 25 30 35 40
0.5
1
1.5
2
2.5
3
(d) 5 10 15 20 25 30 35 40
0.5
1
1.5
2
2.5
3
8. Answer: Choice (d) is the correct one. Note that we’re adding up the differences between the x-valuesand the average x-value.
9. Clicker Question 5: Which of the following does not result in more accurate estimates for β1?
(a) An increase in the sample size
(b) An increase in the coefficient of determination
(c) An increase in the variance of the observed x-values
(d) An increase in the variance of the observed y-values
10. Answer: Choice (d) is the correct answer.
(a) Intuitively, a larger sample size (choice (a)) should result in more accurate estimates of anypopulation parameter, including β1. You can also see from the formula for sβ1
, which is ourestimate for the standard deviation of β1, that increasing n results in a decrease in sβ1
, which inturn increases our accuracy.
(b) Intuitively, an increase in the coefficient of determination (choice (b)) means the data fit the linearmodel better, which should increase the accuracy of our estimate of the slope of that linear model.You can also see from the formula for sβ1
that a larger value for r2 results in a smaller value for(1− r2) and thus a smaller value for sβ1
.
(c) It’s a little harder to see how increasing the variance in the observed x-values (choice (c)) increasesthe accuracy of our estimate, but that variance appears in the denominator in our formula for sβ1
,so increasing that variance decreases the standard deviation of β1, making our estimates moreaccurate.
(d) As for choice (d), the variance of the observed y-values appears in the numerator of our formualfor sβ1
, so increasing that variance increases the standard deviation of β1, making our estimatesless accurate.