Embed Size (px)
Citation preview

Understanding Services at the heart of a competitive
economy
An ABAC Initiative
Champions: ABAC Hong Kong China and ABAC Philippines October 2011

1
Table of Contents
Summary and Conclusions ................................................................................................................. 3
1. Introduction .................................................................................................................................... 4
2. Importance of Services in APEC Economies ............................................................................... 5
2. 1 Defining and Measuring Services ....................................................................................................... 5
2.2. The Role of Services in Regional Growth and Job Creation .............................................................. 6
3. Services Contributions to Trade and Investment ..................................................................... 13
4. How International Services Providers engage in International Business ............................... 19
4.1 Trade in Services ............................................................................................................................... 19
4.2 Innovation and Export ....................................................................................................................... 20
4.3 Services Value Chains ........................................................................................................................ 20
5. Why the Importance of services is not properly recognized .................................................... 24
5.1 Services Trade Statistics .................................................................................................................... 24
5.2 Embedded and Embodied Services .................................................................................................... 26
6. Distinctive Barriers to Trade in Services ................................................................................... 35
7. Measuring the Barriers ............................................................................................................... 38
8. Capacity-building to improve services sector competitiveness ................................................ 44
8.1 Competitiveness Framework .............................................................................................................. 44
8.2 Regulatory Coherence ....................................................................................................................... 47
8.3 Building Services Infrastructure ........................................................................................................ 48
8.4 Promotion of SME Innovation and Export ........................................................................................ 48
9. Facilitating Services-related Trade, Investment and People Movement ................................ 50
9.1 Lack of Progress in the Doha Development Agenda ......................................................................... 50
9.2 Intensifying Regulatory Reform ......................................................................................................... 51
9.3 Facilitating Services-related Commercial Presence ......................................................................... 52
9.4 Temporary Movement of Providers of Services ................................................................................. 53
10. ABAC proposals ......................................................................................................................... 55
Annex: Case Studies ......................................................................................................................... 58
Case Study 1: Benefits from Telecommunications Reform ...................................................................... 58
Case Study 2: Take-off in Philippines BPO ............................................................................................. 59

2
Case Study 3: Liberalizing Retail Services in China, PRC ..................................................................... 61
Case Study 4: The Domestic Regulatory Frameworks for Health Tourism ............................................ 62
Case Study 5: The Role of Air Transport Liberalization in Boosting Tourism in the Philippines .......... 65
References ......................................................................................................................................... 70
3
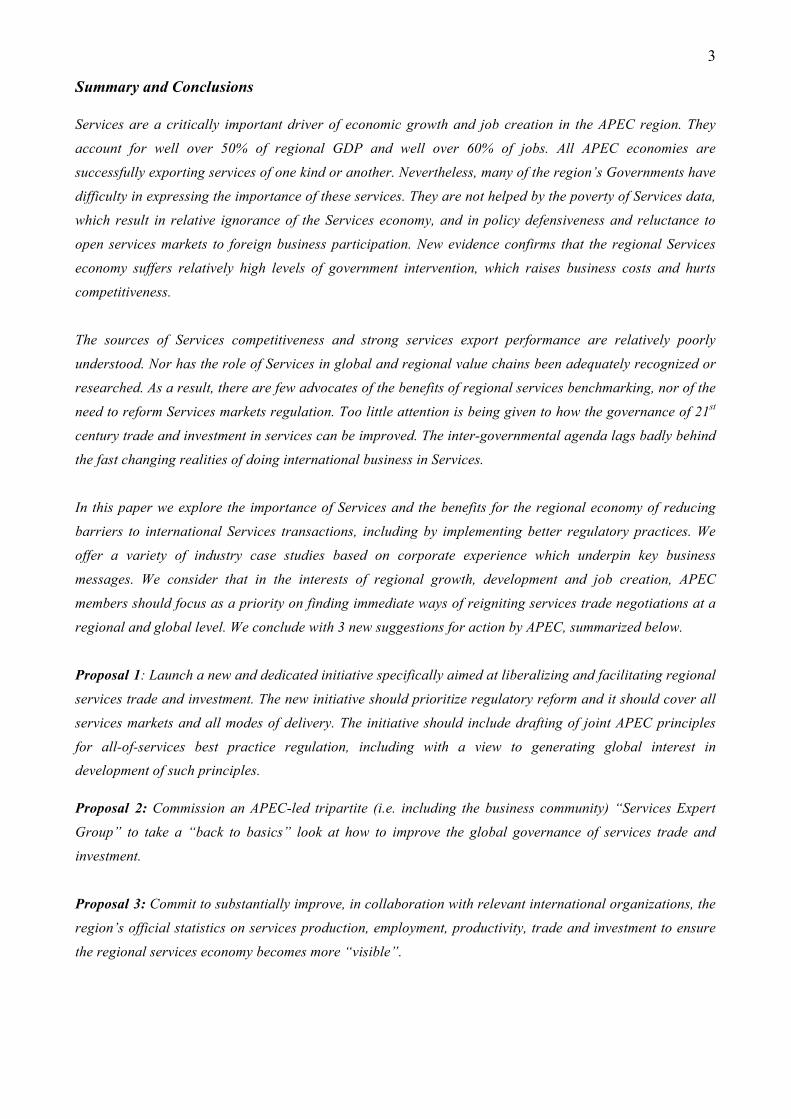
Summary and Conclusions
Services are a critically important driver of economic growth and job creation in the APEC region. They
account for well over 50% of regional GDP and well over 60% of jobs. All APEC economies are
successfully exporting services of one kind or another. Nevertheless, many of the region’s Governments have
difficulty in expressing the importance of these services. They are not helped by the poverty of Services data,
which result in relative ignorance of the Services economy, and in policy defensiveness and reluctance to
open services markets to foreign business participation. New evidence confirms that the regional Services
economy suffers relatively high levels of government intervention, which raises business costs and hurts
competitiveness.
The sources of Services competitiveness and strong services export performance are relatively poorly
understood. Nor has the role of Services in global and regional value chains been adequately recognized or
researched. As a result, there are few advocates of the benefits of regional services benchmarking, nor of the
need to reform Services markets regulation. Too little attention is being given to how the governance of 21st
century trade and investment in services can be improved. The inter-governmental agenda lags badly behind
the fast changing realities of doing international business in Services.
In this paper we explore the importance of Services and the benefits for the regional economy of reducing
barriers to international Services transactions, including by implementing better regulatory practices. We
offer a variety of industry case studies based on corporate experience which underpin key business
messages. We consider that in the interests of regional growth, development and job creation, APEC
members should focus as a priority on finding immediate ways of reigniting services trade negotiations at a
regional and global level. We conclude with 3 new suggestions for action by APEC, summarized below.
Proposal 1: Launch a new and dedicated initiative specifically aimed at liberalizing and facilitating regional
services trade and investment. The new initiative should prioritize regulatory reform and it should cover all
services markets and all modes of delivery. The initiative should include drafting of joint APEC principles
for all-of-services best practice regulation, including with a view to generating global interest in development of such principles.
Proposal 2: Commission an APEC-led tripartite (i.e. including the business community) “Services Expert
Group” to take a “back to basics” look at how to improve the global governance of services trade and
investment.
Proposal 3: Commit to substantially improve, in collaboration with relevant international organizations, the
region’s official statistics on services production, employment, productivity, trade and investment to ensure
the regional services economy becomes more “visible”.

4
1. Introduction
Services are talked of as “the mangy dog” of the spluttering Doha Development Round trade negotiations.
After more than 10 years of negotiations which have mostly focused on farm trade and trade in manufactured
goods, liberalization of our economies to trade in services has attracted negligible attention from negotiators.
By almost any rational measure, this is a puzzle, because for most of the world’s economies – and APEC is
no exception – services account for the majority of our GDP. For virtually all of our economies, the large
majority of new jobs to be created in coming decades will be services jobs. In spite of the negligible attention
paid to services trade liberalization by our trade negotiators, the Services sector is likely in the coming
decades to account for the large majority of our growth.
What accounts for this neglect? And how can it be remedied? This paper aims to address these issues. It
starts from a simple admission: most people have only the crudest idea of what services are, and why they
are so pivotally important.
The general public and the policy community perhaps recognize accounting services or legal services, but
are largely ignorant of the critically important services that are “embodied” in every manufactured item, or
“embedded” services linked with the provision of traded goods. Most ignore the critical role a strong
logistics supply chain plays in making manufactured goods available on a timely basis either within an
economy, or for trade. Most ignore the pivotal importance of a strong and trustworthy banking and financial
services economy for manufacturers or investors to have the confidence to lay roots in an economy. Many
governments (and some in business) harbor a chauvinism that “real men” make “stuff”, and that services are
of dubious value – “hamburger flipper jobs” in the words of a former US President.
Just as problematic, very little effort has been put into gathering services-related data – and what is not
measured almost always gets overlooked.
This study will first provide a picture of just how important services are for every one of our economies, and
why this importance is so ill-recognized. It will then identify key characteristics of services, trade in services,
and the distinctive barriers to services trade. Finally, it will examine how trade in services can be facilitated,
including how economies can build their capacity to compete in services trade. ABAC will conclude with a
number of recommendations for consideration.
In a nutshell, what is generally meant in this Report by “Services” or the “Services sector” consists interalia
of: Financial services (banking, insurance, securities), Telecommunications, Computer and IT services,
Professional and Technical services (Architecture, Engineering, Legal, Accountancy, Management
Consulting, Advertising, Market Research, Public Relations, Property Management), Education, R&D,
Health, Energy (generation, distribution etc), Mining Technology, Environmental services (including Water
supply and distribution), Tourism, Transport (Air, Maritime, Ground), Distribution services, Logistics,
Audiovisual services, Cultural and Entertainment services, Media and also Construction.

5
2. Importance of Services in APEC Economies
2. 1 Defining and Measuring Services
“Services” encompass a very broad and diverse range of activities, but tend to be intangible and difficult to
measure. In its broadest sense, the services sector has tended to be thought of negatively—that is, the sector
includes all economic activity that is not mining, manufacturing, agriculture, forestry, and fishing. Services
are generally poorly understood except as activities that do not produce tangible “things” or “goods”.
This view of services as some kind of “residual” is nonsensical in practice. Many service activities do, in
fact, result in production of a “thing”, e.g. a restaurant meal, a movie or a published consultancy report.
Similarly, significant services sector activities are embedded within all goods-producing industries. A more
positive and accurate definition of services is needed to focus attention directly on service activities in their
own right; this is essential if progress is to be made in identifying the drivers of competition and innovation
specifically in services and hence in defining a strategy to help meet the policy needs of actual and potential
service providers.
To describe what services are, rather than what they are not, some definitions focus on their intangibility. But
while all goods are indeed tangible, not all services are intangible, such as repair, transport, the delivery of
water or electricity, or construction. Other definitions place an emphasis on ownership, noting that services
provide temporary possession, rather than ownership, and that payments for services typically take the form
of rental or access fees. Yet other definitions focus on the intellectual property content of services. Elements
of each of these definitions are mirrored in the internationally agreed economic definition set out in the
System of National Accounts which says that services are “the result of a production activity that changes
the conditions of the consuming units, or facilitates the exchange of products or financial assets.” 1
If defining services is conceptually complicated, devising appropriate methodologies for the collection of
national services statistics has proved no easier. In practice, a lazy solution has been adopted; the services
sector has simply been measured as a straightforward residual after allowing for agriculture, fisheries,
forestry, mining, and manufacturing. The evident result of this under-investment in the collection of services
statistics is that the sector is understated and lacks a good statistical database. One consequence, for all the
statistical figures provided in this paper, is that relevant, comparable, up to date data is not always available
across all APEC economies.
1 SNA (2008: section 6.17) identifies two major types of services: Transformation services which change the condition of consuming
units (goods or people) and Margin services which facilitate the exchange of goods or services. Neither are separate entities over
which ownership rights can be established—they cannot be traded separately from their production. By the time their production is
completed, the services must have been provided to consumers. SNA 2008 also identifies a range of Knowledge-capturing
services which have many of the same characteristics as goods in that ownership rights can be established and used repeatedly.

6
To give one example, in many national statistical collections, “Utilities” including Energy, and Construction
(all obviously part of the Services sector) are still separated out in the National Accounts from the aggregate
statistics on Services. So we often end up with 4 or 5 sectors; Primary, Manufacturing,
Energy/Utilities/Construction and Services, with the contribution of the Services sector to GDP and
employment computed without the inclusion of Energy/Utilities and Construction. In Hong Kong, for
example, “Services” officially accounts for 92.6% of GDP and “Utilities and Construction” contributes
another 5.5%. So even simple exercises such as comparing, across APEC economies, the Services share of
GDP or employment are sometimes not so simple – as the official aggregate data may not be strictly
comparable.
The intangibility of many services and the fact that services can change in quality and nature quite rapidly
are consistently cited as the chief reasons for the lack of progress in improving measurement methodologies
in services. Constant improvements in technology add to the complexity of collecting data on services as
new services are developed in areas such as finance and communications. It is only in the last decade that
these various factors have been recognized as signals of innovation and hence relevant to productivity
measurement, justifying further public investment to improve the statistical database for services.
2.2. The Role of Services in Regional Growth and Job Creation
As shown in Figure 1, services are now the greatest contributor to economic activity in almost all APEC
economies. In 2009 Services value added contributed on average, around 56% of each individual APEC
members’ GDP.
Figure 1: Services Value-Added as % of GDP (2009 or latest available year)
Source: APEC Statistical Database, World Bank's World Development Indicators Database, and author's calculations.

7
We also know, as illustrated in Figure 2 for the APEC region, that as per capita income increases, most
countries witness a rising share of services in total output. The Services sector’s share of regional
employment has also grown vigorously and in 2007 contributed 61% of APEC employment, roughly double
the level of 30% in 20002. Services have become a central driver of economic growth and development in the
region.
Figure 2: GDP per Capita and Services Value Added (% of GDP, 2007)
Source: Atje and Mugijayani (2011)
Many services industries provide the essential infra-structural networks for the goods-producing sectors; the
sector consequently plays a key enabling role across the whole economy. “Backbone” Services industries
essential to the productivity of the economy as a whole include education, health, energy, water, banking and
financial services, telecommunications, transport and logistics.
Efficiency in these infra-structural services is critical for competitiveness in goods-producing industries.
Some of these services, for example telecommunications and information technology are also essential
enablers of remote delivery (including cross-border) of other services, such as architectural services or e-
finance.
2 Atje and Mugijayani (2011)

8
Figure 3: Services are the dominant source of global growth
Source; Ghani, Grover and Kharas (2011)
One of the factors making services so important to the APEC regional economy is the consequent role that
services productivity growth plays in generating productivity gains across the whole economy (See Figure
3). The data available for productivity in services is as poor as the data available on trade in services.
Nevertheless, recent evidence has emerged that “multi-factor productivity” which used to be the un-
measurable residual which was generally labelled “technological change”, should be better understood as
“services innovation”. Recent analysis in the United Kingdom (UK) 3 provides evidence of an increase in the
value and use of intangible capital (services-related corporate intellectual property such as copyright,
business methodologies, brand names) in both absolute terms and relative to investment in machinery and
equipment.4 The contribution of intangible capital deepening and growth in multi-factor productivity
contributed as much as 67% of the growth in labour productivity in the UK over 2000-2007.
It is important to note that services play a critical role in developing countries’ transition to middle income
status and the marked correlation between services sector growth and poverty reduction (Figure 4). A recent
World Bank study5 looked at 136 countries over 2000-2005 and found a stronger correlation between
Services sector growth and overall GDP growth, than between Manufacturing growth and overall GDP
growth. The simultaneous trend over time to a higher Services share in the economy shows moreover that
higher real growth in Services has not been offset by price declines. Comparing the growth models in India
and in China, the study shows that Services growth in India has been led by export demand and that the rate
of growth of productivity growth in Services in India matches the levels of labour productivity growth seen
in Manufacturing in China. The study goes on to find, for a sample of 50 developing countries over the
3 National Endowment for Science, Technology and the Arts (NESTA)
4 McCredie et al (2010)
5 Ghani and Kharas (2010)
9
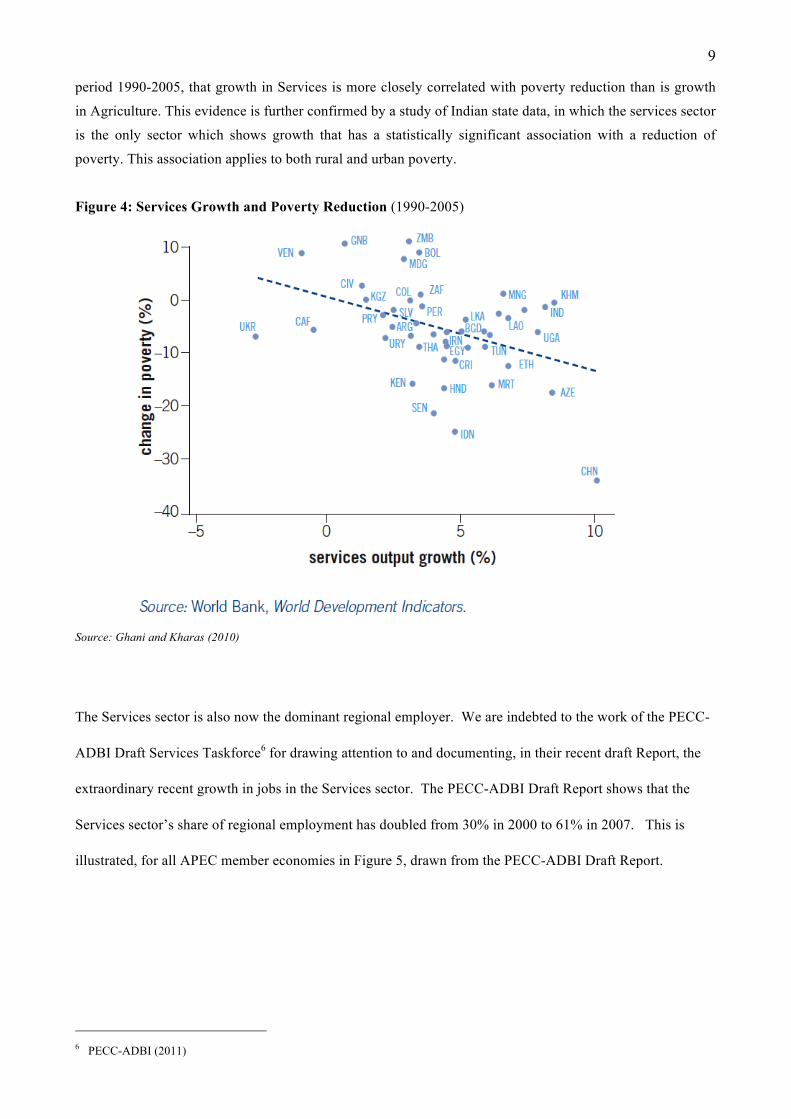
period 1990-2005, that growth in Services is more closely correlated with poverty reduction than is growth
in Agriculture. This evidence is further confirmed by a study of Indian state data, in which the services sector
is the only sector which shows growth that has a statistically significant association with a reduction of
poverty. This association applies to both rural and urban poverty.
Figure 4: Services Growth and Poverty Reduction (1990-2005)
Source: Ghani and Kharas (2010)
The Services sector is also now the dominant regional employer. We are indebted to the work of the PECC-
ADBI Draft Services Taskforce6 for drawing attention to and documenting, in their recent draft Report, the
extraordinary recent growth in jobs in the Services sector. The PECC-ADBI Draft Report shows that the
Services sector’s share of regional employment has doubled from 30% in 2000 to 61% in 2007. This is
illustrated, for all APEC member economies in Figure 5, drawn from the PECC-ADBI Draft Report.
6 PECC-ADBI (2011)

10
Figure 5: Share of Services Employment in Total Employment (averaged over 1990-2000 and 2001-
2009)
0.00 10.00 20.00 30.00 40.00 50.00 60.00 70.00 80.00 90.00
China
Viet Nam
Papua New Guinea
Thailand
Indonesia
The Philippines
Peru
Malaysia
Chinese Taipei
Mexico
Russia
Chile
Korea
Japan
New Zealand
Canada
Australia
Singapore
United States
Brunei Darussalam
Hong Kong, China
2001-‐2009 1990-‐2000
Source: World Development Indicators, from Figure 5 (Atje and Mugiyani) page 6 of PECC-ADBI Draft Services Taskforce Report
A very interesting study undertaken by Tcha for the PECC-ADBI Taskforce showed for Korea, set out in
Table 1, that the services industries create the largest number of new jobs when 1 billion won of new
investment is injected to each industry sector.
Table 1: New Jobs Created in each industry sector in Korea, with 1b won new investment injection
Category 2000 2003 2005 2006 2007
Manufacturing industry 8.8 8.6 7.2 6.9 6.6
Electricity, gas, water services 4.7 3.9 3.2 3.1 3.1
Construction 14.6 16.3 14.8 15.2 14.8
Service industry 13.7 13.7 12.6 12.6 12.6
Source: (Tcha) page 6 of PECC-ADBI Draft Services Taskforce Report.

11
A recent US study by Jensen7 provides valuable new data, showing that the business services sector alone
accounts for 25% of US employment -more than twice as many jobs as the entire manufacturing sector.
Employment in business services increased almost 30% over the decade 1997-2007, while manufacturing
employment decreased by over 20%. In addition, for 2007, average annual wages in business services were
more than 22% higher than manufacturing wages. Jensen shows moreover that exporter wage premiums in
business services are double what they are in manufacturing. Comparing services exporters and services non-
exporters, without taking into account which specific services industry they are in, the study finds that
exporters pay 40% higher wages. When exporters and non-exporters within specific services sub-sectors are
compared, exporters pay 20% higher wages.
Until the results of various country studies underway become available, the evidence base is perhaps not
sufficient to draw firm conclusions that Services growth necessarily always generates higher wages growth,
though we do know, for example, that male and female wages growth has recently been higher in India’s
Services sector than in Manufacturing or Agriculture. We also note the World Bank evidence that high
shares of employment in Services tend to be associated with high female participation rates (See Figure 6).8
This goes some way to explaining the relationship between Services growth and poverty reduction as
employment of women is known to play a special role in reducing poverty.9
The US International Trade Commission (ITC)10 has also undertaken a study on the impact on US domestic
employment of commercial presence abroad by US services companies. The study finds strong evidence that
intra-firm exports from the parent to the offshore foreign affiliate do in fact support jobs at the US
headquarters and throughout their US-based services supply chains. The ITC finds that establishment abroad
by US services firms supports around 700,000 US-based jobs.
7 Jensen (2011)
8 Ghani and Kharas (2010)
9 Ghani and Kharas (2010)
10 ITC (2011)

12
Figure 6: Service Employment and female participation rates (2005)

13
3. Services Contributions to Trade and Investment
According to WTO data, Services constitute about 20% of international trade (See Figure 7). (This is known
to be a very considerable underestimate, as explained in detail in Chapter 4.)
Figure 7: Services exports as proportion of world total exports (1980-2010)
0%
5%
10%
15%
20%
25%
1980 1982 1984 1986 1988 1990 1992 1994 1996 1998 2000 2002 2004 2006 2008 2010
Total World Services Exports
World Services Exports Less Travel and Transport
Source: WTO Database.
For most APEC economies, services’ share of exports is still well under the global average. The services
share of APEC exports is on average 17% (See Figure 8).

14
Figure 8: Services Share of Total Exports for APEC Economies (2010)
Source: WTO Database, and author's calculations. (Brunei Darussalam data refers to 2009)
In the early part of the last decade, the rate of growth of the APEC region’s exports of Services lagged
behind the global average. APEC economies’ share of global Services exports dropped from 42% in 2000 to
a low of 38% in 2007. Global trade in services proved more crisis-resilient than trade in goods, declining
much less in 2009 than the decline in trade in goods that year11. Importantly, the APEC region experienced
even less of a decline in Services exports than the global average, the outcome being that APEC economies
gained in percentage share of global Services exports in 2009, a trend that continued, indeed intensified, into
2010 (See Figure 9). In 2010, the APEC region accounted for 41% of global Services exports, almost making
up for the early decline.
11 Borchert and Mattoo (2009)

15
Figure 9: Decade of Global and Regional Growth in Services Exports ($USb)
Source: UNCTAD Database.
Breaking Services trade into its components, the global share accounted for by Transport has been steady at
around 24% since 2000, the share of travel had declined to 25% by 2008, and “Other commercial services”
had risen to over 51% and have become the single fastest growing sector of international trade (See Figure
8). The biggest contributors to the recent growth have been the knowledge-intensive business services such
as telecommunications, computer and IT Services, R&D Services, financial services, legal, accountancy,
management consultancy services, architecture, engineering and other technical and professional services,
advertising, market research, media and energy and environmental services (See Figure 10).

16
Figure 10: Composition of Services Exports (Example of the United States, 2007)
Source: Christen, Francois, Hoekman (2011)
The United States (US) is the world’s largest commercial Services exporter with a 14% share in 2010.
Business Services exports from China have been growing well over 10% a year for the last decade12 and in
2010, China was the world’s 4th largest commercial Services exporter with a 5% share of the market,
followed by Japan (6th), Singapore (8th), Hong Kong (11th) and Korea (14th).
Exporting Services is not an activity confined to the highest income countries. Countries at all stages of
economic development are successfully exporting Services and every APEC member has Services export
stories to tell. Chinese Taipei, Mexico and Russia are significant players in international construction
services. Chile is a successful exporter of retail, financial and environmental services. Thailand is a global
Tourism destination excelling in health services. The Philippines and Canada have captured a significant
share of the IT Services market. IT and other business services are important for Vietnam and for Peru.
Malaysia has seen success in higher education, Islamic finance, medical and airline Services. Indonesia and
the Philippines are achieving growth in workers’ remittances from contractual services suppliers such as
nurses and seafarers. Education, Tourism, Financial services, Legal services and a wide range of Business
Services are major foreign exchange earners for Australia and New Zealand; New Zealand is also a
successful exporter of audiovisual services.
12 China’s Computer and IT Services exports increased by an average 43% per annum over 2000-2008.

17
As discussed later in this paper, one way, indeed the dominant way, in which international business in
services has been taking place is “commercial presence” or “establishment” offshore, most commonly
measured on a proxy basis by Foreign Direct Investment (FDI). Given the nature of services – that they tend
to be rendered and consumed over the same period of time – it makes sense that services delivery via foreign
affiliates is so important.
World FDI growth has outpaced growth in both world trade and world GDP over the last three decades.
Global FDI today is more than 30 times that recorded in 1980, having grown around six times as fast as
world GDP (See Figure 11). Most of this growth in FDI is accounted for by services businesses. According
to the UNCTAD World Investment Report 2009, the services sector now accounts for three fifths of the
global stock of FDI.
Figure 11: Globalisation indices: FDI, world trade, world GDP
Source: UNCTAD Database and author’s calculations.
Despite the impressive growth, the case remains that, on average across all APEC economies, only about
18% of Services industry value added13 is (measured as being) exported (See Figure 12). A few economies
stand out as exporting very much higher levels of their services industry value added - Singapore (67%),
Hong Kong (50%) and Malaysia (39%). So despite the increasing trade-ability of services, the percentage of
APEC-wide services value added that is actually traded, as shown in figure 11, is relatively small. The recent
13 The value added of an industry sector is the contribution it makes to overall GDP. Value added equals the difference between an
industry’s gross output and the cost of its intermediate inputs (including energy, raw materials, semi-finished goods, and services
that are purchased from all sources).

18
study undertaken for the APEC PSU suggests that the chief explanatory factor is the existence of policy–
related barriers to international business in services14
Figure 12: Services Exports as % of Services Value Added (2008 or latest year)
Source: Shepherd and Van Der Marel (2010)
14 Shepherd and Van der Marel (2010)

19
4. How International Services Providers engage in International Business
4.1 Trade in Services
To examine the apparent relative underperformance of Services firms in export markets, we also need to
understand the distinctive nature of trade in Services. Unlike manufactures – which can be put in a box, sent
across a country or half way round the world, and can be consumed by strangers who have never met, nor
need to know anything about, the manufacturing company – services tend to need a human being to deliver
them. New technologies have complicated this distinction, because an increasing number of services can
nowadays be delivered over the internet without the service provider ever leaving his or her office, but the
basic principle still applies: services tend to require a human hand. They tend to be labour-intensive, and
these hands are often quite knowledge- or skill-intensive.
This distinctive characteristic makes trade in Services very different from trade in goods. Services need to be
delivered to markets both by services firms and individual services suppliers in a number of different ways,
defined in the General Agreement on Trade in Services (GATS) in the WTO as four “modes” of delivery.
Mode 1: Cross-border supply covers services flows which are transmitted by a resident of one country
to a resident of another country via telecommunications and internet linkages (e.g. e-banking or e-health
services)
Mode 2: Consumption abroad refers to situations where a non resident services client (e.g. a tourist,
student or medical patient) travels temporarily into another country’s territory (that of the exporter) to
obtain a service abroad.
Mode 3: Commercial presence takes place where a services supplier of one country (the exporter)
establishes a local presence, including through ownership or lease of premises, in another country’s
territory to provide a service in that market (e.g. domestic subsidiaries of foreign insurance companies or
hotel chains). This activity may be picked up and measured and described as “investment” but
conceptually, from an international trade policy and trade law perspective, this activity constitutes
international supply of services. Services franchises are included under this mode.
Mode 4: Movement of natural persons consists of services providers of one country (the exporter)
travelling temporarily to the territory of another country to supply a service (e.g. accountants, lawyers,
engineers, architects, doctors, teachers, consultants, nurses, construction workers, housemaids).
The concept of four separate and distinct modes of international services delivery has never made much
sense in the business community. Most services firms are actually “multimodal” – they need to use all four
modes at the same time, in different combinations. Face to face contact between services provider and client
is consistently described by services firms as essential. Even for firms operating essentially via mode 1, a
certain amount of business still requires at least some face-to-face contact and personal client attention.
Commercial presence in offshore markets is one way to achieve the face to face contact required, but
offshore offices rarely replace fly-in/fly-out services provision entirely.

20
4.2 Innovation and Export Typically services firms find that because Services tend to be built upon relationships, they cannot sell in the
global market exactly the same set of Services they provide in the home market. Business case studies15
suggest that firms often find they can provide a subset of those services in which they have expertise but that
client expectations and other market conditions are sufficiently different that they must nevertheless innovate
in various ways in order to do offshore business. Services firms thus tend to have to innovate both in terms
of “product” and of corporate process, if they are to succeed as exporters.
Innovation tends to take place not in an R&D laboratory, but at the point where the company meets the
client, as the Services provider discovers the distinct problems that the client needs to solve and the
circumstances in which the problem must be solved. Providing the solution i.e. the Service, is therefore
frequently different from all previous such performances. The nature of Services innovation is consequently
highly collaborative involving many individuals across the firm. It is also typically on-going, sometimes in a
virtual “innovation zone” into which anyone in the firm can drop ideas. Free flow of information, including
across borders, is therefore important to the operations of Services firms, whether or not they deliver chiefly
via mode 1. Intellectual property protection is similarly especially important for Services exporters.
4.3 Services Value Chains
The concept of value-added is as relevant to Services activities as it is to merchandise production. Value
chains, including global value chains, exist not only in the goods sectors but also in the Services sector. In
new business models, enterprises are outsourcing not only the assembly of goods, but also many increasingly
fragmented services-related tasks.
This value chain story is not only about large global enterprises. Small and Medium Sized Enterprises are
actively involved and increasingly it is SMEs in the Services sector which are most engaged in global value
chains. OECD work shows evidence that since 1997, more Services SMEs have been involved in
international alliances than manufacturing SMEs; by the year 2000, there were nearly 4 times as many
Services SMEs engaged in international alliances than manufacturing SMEs enagaged in international
alliances.16
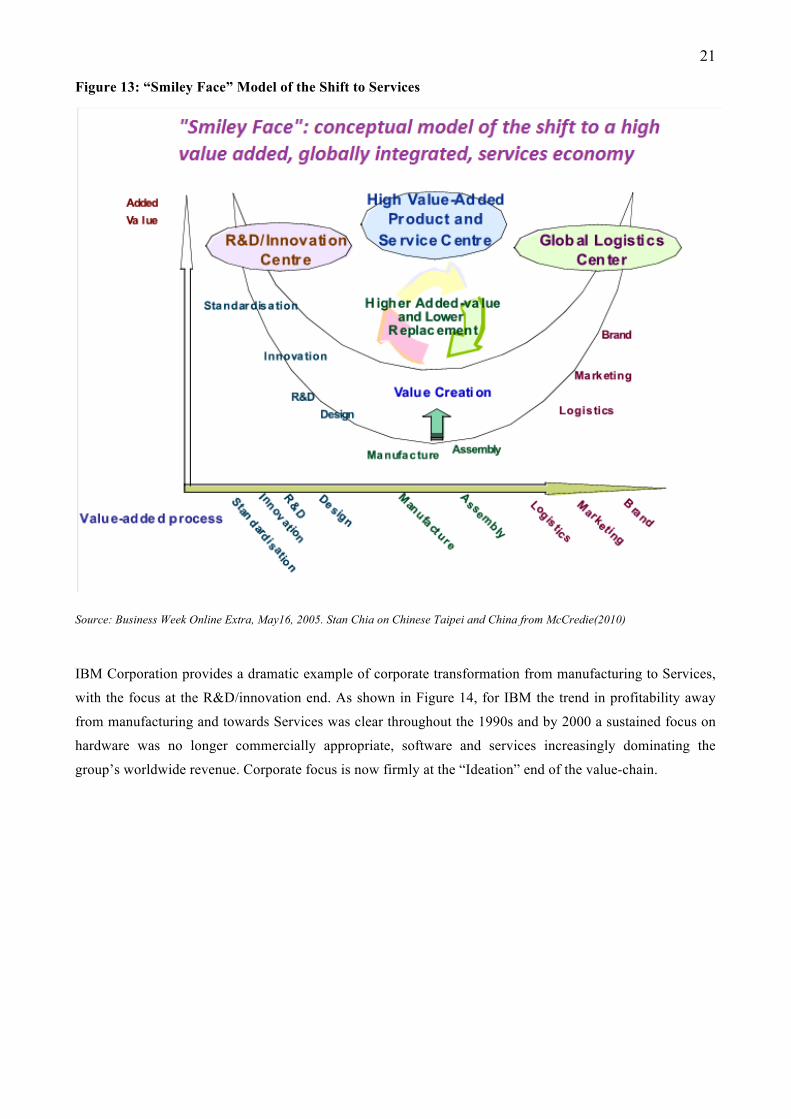
To achieve competitiveness, Services firms, like goods firms, are seeking to go up the value chain, to focus
on core competency and to outsource all the rest. As Stanley Chia of ACER computers demonstrated in his
famous “Smiley Face” shown in Figure 13, the highest value added services activities such as
R&D/innovation or global logistics, increasingly dominate the value of traded merchandise.
15 McCreadie et al (2011)
16 Pasadilla (2007)
21
Figure 13: “Smiley Face” Model of the Shift to Services
Source: Business Week Online Extra, May16, 2005. Stan Chia on Chinese Taipei and China from McCredie(2010)
IBM Corporation provides a dramatic example of corporate transformation from manufacturing to Services,
with the focus at the R&D/innovation end. As shown in Figure 14, for IBM the trend in profitability away
from manufacturing and towards Services was clear throughout the 1990s and by 2000 a sustained focus on
hardware was no longer commercially appropriate, software and services increasingly dominating the
group’s worldwide revenue. Corporate focus is now firmly at the “Ideation” end of the value-chain.

22
Figure 14: IBM’s Business Transformation to “Ideation”
The sourcing group Li and Fung illustrates the shift from manufacturing Services to more much complex
global logistics (See Box 1). In the garment sector, for example, the group no longer merely brokers between
a client and a producer, but orchestrates a sophisticated global network of suppliers of yarn, dyeing and
weaving operations as well as cutting, making and trimming, for just in time supply at the retail end.
Box 1: Li and Fung; Business Transformation to “Orchestration”
Li & Fung produces more than two billion pieces of apparel, toys and other consumer items every year. Li & Fung now accounts for more than US$8 billion in garments and consumer goods for some of the best brands in the world. By the time of its one-hundredth anniversary in 2006, Li & Fung had become the world’s largest sourcing company, growing at a compound annual rate of 23 percent for the last 14 years. Yet Li & Fung does not own a single factory. It is a flat business for a flat world. The company started as a trading broker in Guangzhou (Canton) in 1906 during the Qing Dynasty and transformed itself into a Hong Kong–based exporter and then into a multinational corporation. Finally, the company reinvented itself for the flat world in a new role, as a “network orchestrator.” It is now the orchestrator of a network of more than 8,300 suppliers served by more than 70 sourcing offices in more than 40 countries and territories. The company indirectly provides employment for more than two million people in its network of suppliers, but only less than half a percent of these are on Li & Fung’s payroll. With this lean structure, each of the company’s own employees generates about US$1 million in sales, earning a return on equity of more than 38 percent per year. Source; Fung, Fung and Wind
These examples illustrate what appears to be a steady ongoing process of corporate transformation towards
Services. Some have described this as part of an inevitable trend to the new paradigm of “Services-Dominant
Business Logic” (See Figure 15).

23
Figure 15: The Emergence of Services-Dominant Business Logic
Services dominant Business Logic
Source; McCreadie et al (2011)

24
5. Why the Importance of services is not properly recognized
5.1 Services Trade Statistics
The main reason the services economy is undervalued is because traditional measurement techniques do not
capture all aspects of services international engagement. The national statistical collections of most APEC
economies pay relatively little attention to trade in services. First, trade statistics are collected only for
extremely aggregated sets of services activities; most APEC economies publish services trade data only for
the few categories (Transport, Travel and “Other Commercial Services”) required by the IMF standards17.
Second, no APEC member collects or publishes trade data by each of the 4 modes of supply. Third, not all
APEC members collect or publish any bilateral breakdown showing the geographic direction of services
trade.
Guidance for the compilation of Services trade statistics is set out in the Manual on Statistics of International
Trade in Services (MSITS) using two building blocks: the Balance of Payments (for modes 1, 2, 4) and
Foreign Affiliates Statistics (mode 3).18
In principle, the Balance of Payments covers the aggregation of modes 1, 2 and 4, often described as “cross-
border trade in Services”. In practice, measurement of each of these modes is highly inadequate. Mode 2
transactions (consumption abroad) tend to be based on relatively unsophisticated and formulaic guess work
and estimation. Measurement of mode 1 (cross-border supply) is based on sample surveys and subject to the
vagaries of corporate self-declaration. There has effectively been no effort at all to date to measure mode 4
(contractual service suppliers, intra-corporate transferees and services business visitors). Many developing
countries use workers’ remittances as an imperfect proxy. The revised edition of MSITS includes a chapter
on how to measure mode 4 for the first time.
Even in principle, the Balance of Payments does not cover mode 3 (commercial presence) at all. Special
Foreign Affiliates Statistics (FATS) are required for this purpose. This is because by statistical convention,
as set out in the System of National Accounts, “imports” are services delivered by non-residents to residents,
17 “Other commercial services” includes; Construction, Insurance and Pension services, Financial services, Charges for the use of
intellectual property, Telecommunications, Computer and information services, Other business services, Personal, cultural and
recreational services and Government Services.
18 MSITS was revised in 2010 as was the Balance of Payments, 6th edition though few APEC members have yet adopted the new
statistical conventions. One new feature is the stricter application of the ownership principle, which saw certain items reclassified
from trade in goods to trade in Services and vice versa. For example, goods sent abroad for processing, without any change in
ownership of the inputs, were reclassified as "Manufacturing Services” (this includes oil refining, liquefaction of natural gas,
assembly of clothing and electronics, assembly, labelling, and packing: BPM6 para. 10.63) Repair and Maintenance costs were
also reclassified as Services. In contrast, Merchanting (where an ownership change takes place, although the good never enters
the country of the merchant) is now reclassified as trade in goods.

25
and “exports” are services delivered by residents to non-residents. Mode 3 transactions are not considered
“exports” because they do not take place between residents and non-residents, the foreign affiliate being
considered a resident in the country in which it is located. Because the concept of mode 3 pushes awkwardly
up against the statistical conventions, in most APEC member economies it goes completely unmeasured; at
most 2 or 3 APEC members compile regular FATS statistics. FDI statistics are used as a proxy guide; but
this is increasingly imperfect as Services have come to dominate the FDI statistics.
The UNCTAD data that is available suggests that the value of services delivered to markets through foreign
affiliates is at least as high as the value of exports of services recorded in the balance of payments. WTO
research likewise estimates that commercial presence accounts for 55-60% of total global world trade in
services (See Table 2).19
Table 2: Share of Global Services Trade by Mode of Supply
Mode of Supply Relevant Statistical Domains Share of Services
Trade
Mode 1: Cross border supply
BOP: commercial services (excluding travel and construction services)
25-30%
Mode 2: Consumption abroad
BOP: travel 10-15%
Mode 3: Commercial presence
FATS statistics—only US has regular survey BOP: FDI data, construction services; for confidentiality reasons very little data is available
55-60%
Mode 4: Presence of natural persons
Insufficiently covered Construction services BOP: commercial service (excluding travel) BOP statistics: compensation of employees’ and workers’ remittances
< 5%
Source: Magdeleine and Maurer (2008)
In 2006 the sales of foreign affiliates of US-based firms amounted to US$760 billion.20 A sectoral study
undertaken this year by the Australia Bureau of Statistics21, confirms the importance of mode 3. The study
shows that international sales of financial and insurance services by Australian companies are
overwhelmingly delivered through foreign affiliates, rather than through direct sales from within Australia.
19 (MSITS 2010:section 2.5)
20 ITS Global (2010)
21 Australian Government (2011)

26
5.2 Embedded and Embodied Services
It is also important to take into account the fact that the services sector makes a much larger contribution to
exports than is recognized because services are often integrated or bundled with goods and trade indirectly as
intermediate inputs into merchandise production. These fall into two categories – “embodied”, and
“embedded” services. “Embodied” services are the services contained in products from the mining,
agricultural and manufacturing sectors (e.g. energy, transport, communications, insurance, accountancy,
design, software, and other technical expertise. Other Services are “embedded” at the point of merchandise
sale, for example financing, training, maintenance, repair and other after-sales service. For many
manufactured goods – especially expensive, high value ones – embedded or embodied services can account
for a surprisingly large proportion of the value of the goods. For trade purposes, however, the full export
value of embodied services is counted as manufactured exports, with no export value attributed to services.
For many consumer goods - combinations of merchandise with embedded services are becoming key
methods of merchandise differentiation in the market and key methods of achieving higher overall value-
add.
Traditional measurement techniques completely overlook the value of these “embodied” and “embedded”
services. Embodied Services alone are thought to account for a rapidly growing proportion of global
merchandise exports, now estimated around an average of 25% (See Figure 16).
Figure 16: Embedded services growing as a percentage of OECD area manufactures
0
5
10
15
20
25
30
Japan
United S
tate
s Ita
ly
Austra
lia
Germ
any
France
United K
ingdom
Denm
ark
Nether
lands
Canad
a
% Early 1970s Mid-1970s Early 1980s Mid-1980s Early 1990s Mid-1990s
Source: OECD (2005)
Outside the OECD area, one recent estimate for Indonesia puts embodied services similarly at around 25%
on average of Indonesia’s manufactures (See Figure 17).22
22 Atje, Rahardja and Maidir (2010)

27
Figure 17: Embodied Services; Estimates for Indonesia
0% 20% 40% 60% 80% 100%
Agric, forestry,fishery
Mining
Manufacture
Services
Others
Construction Wholesale, retailRestaurants, hotels Transport, telecomFinancial, business services Other servicesOther intermidiate input
Sectors Source of intermediate input :
Source; Atje, Rahardja and Maidir, 2010
A 2010 study undertaken to measure the extent of embodied services in Australia’s exports, as distinct from
production, shows that services are nearly twice as important to Australian export performance as exports of
services recorded in the balance of payments suggests (See Box 2).23 Services are embodied in all
merchandise exports, even the apparently least transformed, as the example in the box on Australian coal
production demonstrates.
Box 2: Embodied Services are 24% of the value of Australian Coal
To extract $100 worth of coal in 2005-06, the Australian Bureau of Statistics Input-Output Tables show that the average mining company spent $11.40 on wages and other labor on-costs, and $30.50 on intermediate inputs. Intermediate inputs are the goods and services that mining companies buy to enable its miners to extract coal with the company’s plant and equipment. The average company spent $6.10 on goods — timber for construction, diesel fuel for its mobile plant, explosives, prefabricated buildings and new machinery. It also spent $24.40 on services— specialist mining expertise such as geotechnical and mining engineering services, electricity to power the fixed plant and equipment, construction and maintenance of the plant, rail transport and property and business services such as legal services and accountancy. Over 80% of the intermediate inputs used to extract coal were services. Intermediate services accounted for 24.4% of the final value of the coal produced in 2005-06.
Source: ITS Global (2010)
23 DFAT (2010)

28
Another study24 drew attention to the increasing importance of embodied Services as a component of value-
add in regional and global supply chains for many elaborately transformed manufactures. The study
suggested that for any global location, over 50% of the average cost of manufacturing an automobile is
embodied R&D, engineering and quality assessment Services. For one particular “American” car, it was
shown that quite apart from the 17.5% of value from high tech components from Japan, 4% for minor parts
from Chinese Taipei and Singapore and 30% for assembly in Korea, 7.5% of value was added in Germany
(design) and 2.5% in Ireland or Barbados (data processing). Similarly the Texas Instruments
telecommunications chip was conceived in Sweden, designed in France with software instruments developed
in the USA, produced in Japan and the USA and tested in Chinese Taipei. And the Barbie Doll is made in
APEC (See Box 3)!
Box 3: The Barbie Doll Value Chain
Designed in California;
Oil is refined into ethylene in Taiwan and formed into plastic pellets that are used to produce the doll’s body;
Barbie’s nylon hair – Japan;
Barbie’s wardrobe cloth – China;
Clothes are made in Mexico;
Moulds for doll, paint pigments and cardboard for packaging – California;
Assembly – Indonesia and Malaysia;
Quality testing and marketing – California
Source; Pasadilla (2007)
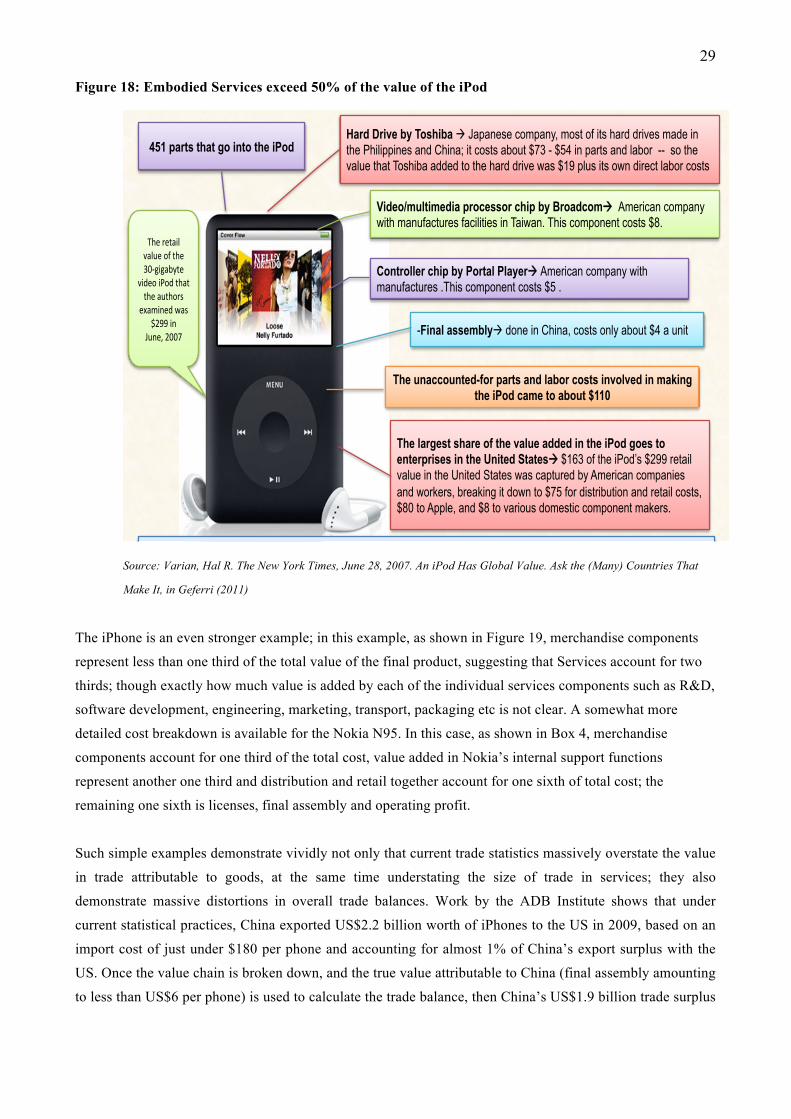
The business reality that high-value-adding services are pivotal to the elaborate transformation of
manufactures needs to be much better understood in trade policy circles. Figure 18 shows, for example, how
more than 50% of the iPod’s value has nothing to do with merchandise components and everything to do
with the Services activities involved in conception, design, retail and distribution.
24 Pasadilla (2007)
29
Figure 18: Embodied Services exceed 50% of the value of the iPod
!"#$%&%''()*+('&%++&#,-.'/&*01&-$+2&3(1'&%*-01&45&6(7&0$#1&8&-7&90'1&-:(7&;<&-=&1"(&>?&7(1%#+&67#@(&-=&4ABB&
451 parts that go into the iPod
C"(&7(1%#+&:%+0(&-=&1"(&ABD3#3%*21(&
:#.(-&#,-.&1"%1&1"(&%01"-7'&
(E%)#$(.&F%'&4GHH&#$&
I0$(/&GBBJ&
The bulk of the iPod’s value is in the conception and design of the iPod. That is why Apple gets $80 for each of these video iPods it sells, which is by far the largest piece of value added in the entire supply chain. Apple figured out how to combine 451 mostly generic parts into a valuable product.
Hard Drive by Toshiba ! Japanese company, most of its hard drives made in the Philippines and China; it costs about $73 - $54 in parts and labor -- so the value that Toshiba added to the hard drive was $19 plus its own direct labor costs
Video/multimedia processor chip by Broadcom! American company with manufactures facilities in Taiwan. This component costs $8.
Controller chip by Portal Player! American company with manufactures .This component costs $5 .
- Final assembly! done in China, costs only about $4 a unit
The unaccounted-for parts and labor costs involved in making the iPod came to about $110
The largest share of the value added in the iPod goes to enterprises in the United States! $163 of the iPod’s $299 retail value in the United States was captured by American companies and workers, breaking it down to $75 for distribution and retail costs, $80 to Apple, and $8 to various domestic component makers.
Source: Varian, Hal R. The New York Times, June 28, 2007. An iPod Has Global Value. Ask the (Many) Countries That
Make It, in Geferri (2011)
The iPhone is an even stronger example; in this example, as shown in Figure 19, merchandise components
represent less than one third of the total value of the final product, suggesting that Services account for two
thirds; though exactly how much value is added by each of the individual services components such as R&D,
software development, engineering, marketing, transport, packaging etc is not clear. A somewhat more
detailed cost breakdown is available for the Nokia N95. In this case, as shown in Box 4, merchandise
components account for one third of the total cost, value added in Nokia’s internal support functions
represent another one third and distribution and retail together account for one sixth of total cost; the
remaining one sixth is licenses, final assembly and operating profit.
Such simple examples demonstrate vividly not only that current trade statistics massively overstate the value
in trade attributable to goods, at the same time understating the size of trade in services; they also
demonstrate massive distortions in overall trade balances. Work by the ADB Institute shows that under
current statistical practices, China exported US$2.2 billion worth of iPhones to the US in 2009, based on an
import cost of just under $180 per phone and accounting for almost 1% of China’s export surplus with the
US. Once the value chain is broken down, and the true value attributable to China (final assembly amounting
to less than US$6 per phone) is used to calculate the trade balance, then China’s US$1.9 billion trade surplus

30
in iPhones is transformed into a trade DEFICIT of US$48 million. 25
25 Xing and Detert (2010)

31
Figure 19: Identifying the Value of Embedded Services in the Apple iPhone 4
Source: The Economist (2011).

32
Box 4: Identifying Embedded Services in the Nokia N95 Value Chain
Source: Al-Yrkko, J et al (2011)
The official balance of payments data is completely unable to capture the business realities behind these
various examples. One study26 based on 2004 data concluded at a global level, that taking embodied Services
into account would reduce the manufacturing sector’s share in world trade from 74% to 47% and increase
the share of services from 17% to 39%. Another recent study measuring the linkages between Services and
manufacturing,27 based on 2007 data, shows that while cross-border services exports are variously estimated
at around 20-27% of world trade, the share of Services rises to almost 50% if merchandise trade flows are
measured in terms of direct and indirect value added content rather than on the basis of the gross value of
goods crossing the border.
The ITS Global study mentioned above suggested that, on the basis of IMF forecasts of global GDP and
trade volumes, total embodied services exports could increase to $47.2 billion by 2014-15. ITS Global points
out that the outlook for embodied services exports will depend on any shifts in the intensity with which
intermediate services are used to produce and deliver merchandise exports. Every percentage point increase
in the intensity of intermediate services use in merchandise production is estimated to add over $1 billion to
embodied services exports each year. The study notes the evidence that a convergence in production systems
in manufacturing and services is well underway, with embodied Services intensity increasing. It observes
that if the increase in the intensity of services use which occurred between 1998-99 and 2005-06 were to be
repeated over the period to 2014-15, embodied services exports would be around $53 billion a year in real
terms by the end of the period.
The concept of “Made in the World”, coined recently by the WTO and IDE/JETRO in their groundbreaking
collaborative work on Trade in Tasks/Supply Chain Trade28, is very slowly coming to be understood in
policy circles with respect to merchandise production and trade. This cutting-edge study, in its bilateral
26 Daudin et al (2011), based on GTAP data for 2004.
27 WTO data for 2007; see Cristen, Francois and Hoekman (2011)
28 WTO and IDE/JETRO (2011)
Integrated Circuits: 6%
Camera: 3%
Other parts: 11%
Licences: 4%
Value Added in Nokia’s internal
support functions: 31%
Nokia Operating Profit: 16%
Final Assembly: 2%
Distribution: 4%
Retailing: 11%
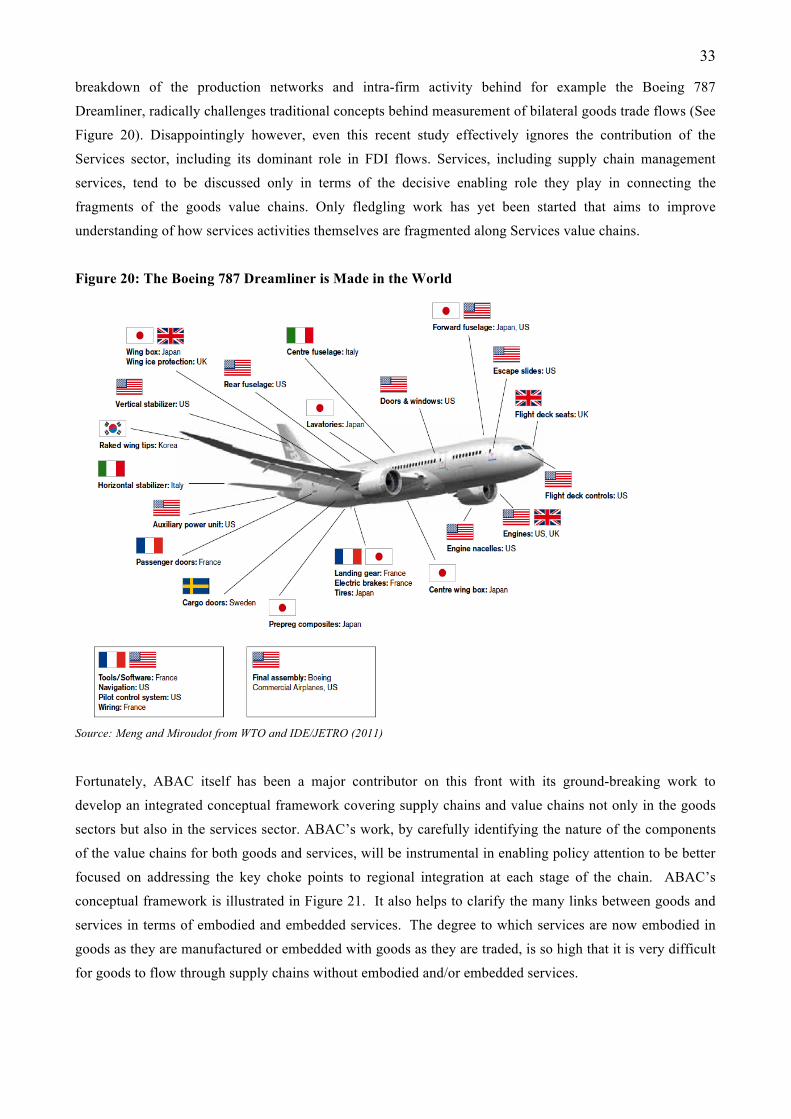
33
breakdown of the production networks and intra-firm activity behind for example the Boeing 787
Dreamliner, radically challenges traditional concepts behind measurement of bilateral goods trade flows (See
Figure 20). Disappointingly however, even this recent study effectively ignores the contribution of the
Services sector, including its dominant role in FDI flows. Services, including supply chain management
services, tend to be discussed only in terms of the decisive enabling role they play in connecting the
fragments of the goods value chains. Only fledgling work has yet been started that aims to improve
understanding of how services activities themselves are fragmented along Services value chains.
Figure 20: The Boeing 787 Dreamliner is Made in the World
Source: Meng and Miroudot from WTO and IDE/JETRO (2011)
Fortunately, ABAC itself has been a major contributor on this front with its ground-breaking work to
develop an integrated conceptual framework covering supply chains and value chains not only in the goods
sectors but also in the services sector. ABAC’s work, by carefully identifying the nature of the components
of the value chains for both goods and services, will be instrumental in enabling policy attention to be better
focused on addressing the key choke points to regional integration at each stage of the chain. ABAC’s
conceptual framework is illustrated in Figure 21. It also helps to clarify the many links between goods and
services in terms of embodied and embedded services. The degree to which services are now embodied in
goods as they are manufactured or embedded with goods as they are traded, is so high that it is very difficult
for goods to flow through supply chains without embodied and/or embedded services.

34
Figure 21: ABAC Integrated Supply Chain Conceptual Framework
35
6. Distinctive Barriers to Trade in Services
The distinctive nature of services means that barriers to services trade are much more diffused and less clear.
For a company selling manhole covers, for example, ability to sell into a country will normally be clear-cut,
depending on compliance with local standards, and being willing/able to pay whatever border tariff is in
place. Ask that company whether it can sell manhole covers to a particular country, and the company can
normally give a quick “yes” or “no” answer. Conversations with services providers about their ability to sell
services into a market are much less clear-cut. Few will say a market is completely closed. Rather, they will
talk about the many convoluted arrangements they have had to make to circumvent or comply with local
regulations, or to obtain specific licences.
The barriers to delivery of their services are much more subtle and diffused than barriers to the delivery of
goods. To the extent that they occur “at the border”, they tend to involve restrictions on commercial presence
or FDI (mode 3) and visa restrictions on inwards movement of natural persons (mode 4) rather than
restrictions on internet transfers of information (mode 1) or restrictions on purchases which can be made by
residents when travelling offshore (mode 2).
The barriers “at the border” tend not to be sector or industry specific but to be generally applicable i.e. they
affect all services activities in varying degrees. For this reason, these barriers tend to be described as
“horizontal” or “cross-cutting”. Foreign Investment regimes, for example, often include “horizontal” barriers
to trade in services.
Sector-specific barriers to trade in services also occur “beyond” or “behind the border” in the form of
regulatory e.g. licensing regimes which in a myriad of different ways can constrain a foreign firm’s scope of
business in the host country market. Sometimes, in services, trade restrictions can also be a function of the
absence of regulation, for example the absence of transparent and objective rules for licensing. These
situations sometimes lead to the worst of regulatory instruments: discretionary authority.29 Differences in
Services standards and technical regulations can also diminish services business’ ability to connect across the
border. Major departures or disconnects from commonly accepted international or regional regulatory
practice can also constitute effective barriers to doing international business in services.
Behind the border regulatory barriers are typically less transparent and harder to describe or to detect than
barriers at the border. Below is a list of classic of barriers experienced by businesses
• nationality and residency requirements
• commercial presence requirements
• licensing and qualification requirements
• membership of professional bodies
• restrictions on incorporation
• restricted eligibility for contracts, including government procurement
29 Mamdouh (2011)

36
• restrictions on FDI and ownership
• restrictions on number of expatriate staff
• requirements related to employment of local staff
• visas/work permits conditions and other temporary entry arrangements
• restrictions on advertising
• restrictions on using firm name
• existence of exclusive suppliers
Box 5: Barriers to Trade in Services
Barriers to trade in services are classified in the WTO into one of three categories:
Market Access Impediments
• Limitations on the number of service suppliers (numerical quotas, monopolies, exclusive service suppliers).
• Limitations on the total value of services transactions or assets in the form of numerical quotas or the requirement of an Economic Needs Test.
• Limitations on the total number of service operations or on the total quantity of service output. • Sector specific Economic Needs Tests or limitations on the number of persons that can be employed. • Measures that restrict or require specific types of legal entity or joint venture through which a service
may be provided. • Limitations on the participation of foreign capital in terms of a maximum percentage limit on foreign
shareholding or the total value of individual or aggregate foreign investment. National Treatment Impediments
• Measures which affect nationals differently from foreigners (e.g. taxation/incentive measures, local content requirements, other performance requirements).
• Measures which affect established foreign companies differently from established nationally-owned companies
Most Favoured Nation Impediments
• Measures which affect service providers from any one trading partner differently from service providers from any other trading partner.
Unlike trade in goods, the WTO rules for international trade in services do not focus on removing these
barriers (See Box 5). The General Agreement on Trade in Services (GATS) is structured around the four
basic principles: Transparency, Non-Discrimination, Market Access and National Treatment. Only the first
two are mandatory. The second two are a matter of the specific legal schedules submitted by each WTO
member under the GATS. So there is no one rule on Services. Each WTO member makes its own individual
commitments on opening up to competition from foreign service suppliers.
This means the GATS schedule shows a positive list of commitments (which vary enormously from country
to country) but provides no information at all about the extent or nature of barriers remaining in services
sectors, or for modes of delivery for which no commitment is made. Where there is no GATS commitment
or ”binding”, the country remains free to introduce a new restrictive measure in future; this introduces an
element of unpredictability into the business environment which can itself be considered a barrier to trade
and investment in services.

37
Given that there is no single rule and hence no single guideline as to best practice in trade in services, the
question arises as to how restrictive a regulatory regime has to be to constitute a “barrier” to trade, justifying
business complaint and inter-governmental action. It can be hard to judge for example, just how open a
particular nation is to foreign services and services providers, since the barriers are so thoroughly mixed in
with domestic regulation, standards and business practices. To answer this question, it can be useful to first
establish a benchmark of what full liberalisation in services might look like.
Full liberalization with respect for example to Commercial Presence (mode 3) and Movement of Natural
Persons (mode 4) might be expected to involve a high degree of transparency in investment and visa
approvals processes and readily to permit:
• Up to 100% foreign ownership and control, including through joint ventures, of an existing business
• Establishment of a new wholly owned foreign owned and controlled business
• Short-term temporary entry for business visitors of up to 90 days
• Temporary entry and stay of contractual service suppliers
• The right of spouses of services suppliers that enter temporarily (for more than 12 months) to work for a period for a time equivalent to that available to the services supplier
• Temporary entry and stay of intra-corporate transferees, for a maximum stay of four years, with possibility of extension
Any departure from the above “liberalized” benchmark, could justifiably be claimed by business to
constitute a restriction to market access in modes 3 and/or 4. It follows that any market access negotiations
on services will necessarily have to go beyond discussions on cross-border commerce and to involve a mix
of rules on FDI and movement of persons.
The past four decades of trade liberalization negotiations have tended to focus on lowering or eliminating
border tariffs. But the challenge of identifying, measuring and lowering barriers to trade in services is clearly
much harder – and has only barely begun.

38
7. Measuring the Barriers
The last three decades have seen a transformation in the services economy, away from the old model, where
services were often government functions provided by public-utility entities, towards a new paradigm of
private sector-led competitive markets where services are exchanged, and traded, on a commercial basis. The
role of governments has fundamentally changed. Instead of being the provider of the service, it has become
the supervisor or regulator responsible for protecting public interest.
Given this history, the services sector is by far the most heavily protected sector globally, burdened with the
highest degrees of government intervention. While tariffs have come down in goods trade, a wide range of
opaque regulatory and other impediments to international business continue to distort regional trade and
investment in services.
The OECD is undertaking important work to create a Services Trade Restrictiveness Index and the results for
the Asia Pacific region should become available during 2012. The World Bank is currently compiling
survey-based data which will also shortly become available.
The data is classified according to regions of the world which do not correspond neatly to the APEC
membership. “East Asia and Pacific” corresponds closely to the East Asian membership of APEC; 5 of the 7
countries in this category are APEC members. In addition there are 2 APEC members in the “Latin America”
Group and 6 APEC members in the “OECD” group. It is not appropriate, therefore, to draw firm conclusions
from this aggregated data about APEC as a whole. What is clear is that services policies in “East Asia and
the Pacific” are relatively restrictive compared with other regions and even with the world average. The level
of restrictiveness is considerably higher than in Latin America – or even Africa (See Figure 22). Figure 22: World Bank Trade Policy Index on Services:
Gootiiz and Mattoo (2009)

39
The World Bank data provides some industry breakdown into financial services, telecommunications,
maritime transport, retail and professional services. In all of these services industries, the “East Asia and the
Pacific” region is more restrictive than other regions and more restrictive than the world average. Retail
services are relatively less restricted than the other sub sectors; but the story is nevertheless not rosy; the only
region in the world with more restrictions on retail is South Asia. Everywhere in the world professional
services are by far the most restricted (See Figure 23).
Figure 23: World Bank trade policy indices by sector.
Source: Gootiiz and Mattoo (2009)
More disaggregated World Bank data will come on stream early in 2012. But the story is already clear. There
is much work to be done, especially in East Asia. And as shown in Figure 22, there is an important stock of
best practice in the region, which APEC members need to draw upon.
The work is worth doing. There is extensive economic modeling evidence to demonstrate that liberalization
of barriers to the international delivery of services would provide substantial gains for the world economy.
One study commissioned by the United States Coalition of Services Industries30 suggested that full services
sector liberalization could result in global gains in GDP of US$1.7 trillion. This was more than double the
potential gains from global liberalization of trade in industrial goods, and 31 times the projected gains from
liberalization of agriculture.
Box 6 sets out the underlying economics explaining why the gains from liberalizing barriers to services trade
and investment are relatively so large. For the services sector, regulatory reform in particular tends to
improve the business environment for both domestic firms and foreigners. Services trade liberalization
30 CSI (2006)

40
consequently tends to be win-win rather than win-lose. The evidence is that the domestic services sector
tends to grow, rather than decline, when the sector is opened up to increased competition. This is unlike the
situation in goods markets, where trade liberalization may lead to a decline in former heavily protected
industries. This suggests that regulatory reform should figure high in trade in services liberalization
priorities; but this is only part of the story.
Box 6: The Productivity Win-Win of reducing Barriers to Services
It is widely accepted by economists that services trade liberalisation, like goods trade liberalisation, improves
an economy’s efficiency and productivity. Some kinds of services trade barriers create rents (like tariffs do).
Rent-creating (or tariff-like) measures include for example quantitative restrictions that limit market entry,
thereby raising the price of the service and generating “rents” for incumbent suppliers. Other kinds of
services trade barriers increase the costs of supply. Cost-increasing measures are for example those
associated with regulatory compliance and other burdens generated by inefficient regulation, which raise the
cost of, and sometimes prohibit, service delivery, thereby dampening productivity.
The process of liberalising both kinds of barriers is illustrated in simplified form in the graphs below. The
diagrams plot standard (downward sloping) Demand and (upward sloping) Supply curves on P=Price and
Q=Quantity axes. Liberalising rent-creating (tariff-like) services trade barriers shifts the Supply curve to the
right; producers lose as prices fall but consumers gain as quantities consumed increase; the net economic
gain in the efficiency of resource allocation is the shaded triangular area in the first diagram. There would
also be redistributive effects away from incumbent firms to new entrants. So far, this is exactly the same as
the analysis of the gains for trade in goods.
Q
P
Q
P
The second diagram shows what happens, in addition, when liberalisation of cost-increasing barriers to
services trade takes place. This time, an equivalent shift of the Supply curve to the right generates a much
larger productivity gain (saving in real resources) as shown in the shaded rectangular area in the second
diagram. Importantly, this could raise returns to incumbent services providers while also lowering prices for
users.
Liberalising cost-increasing measures can therefore be expected to enhance national welfare far more than
removing rent-creating measures. What this means is that services trade liberalisation that removes cost-
increasing measures provides a “win-win” outcome. There need be none of the traditional fear of “win-lose”
typically associated with liberalization of trade in goods.
Source: Dee, Findlay and Pomfret (2007)

41
A more recent Australian study31 assumed the overnight liberalization on 1 January 2011 of mode 1 (cross-
border supply) and mode 3 (commercial presence) barriers to trade and investment in services, for all
countries and regions. Developing countries experienced on average a 0.9% gain to real GDP; developed
countries experienced an average gain of 0.2% of GDP.
Given the greater height of the barriers, liberalization of barriers to investment in services was shown to
deliver greater economic gains than liberalization of barriers to cross-border supply of services.
Liberalization of barriers to investment in services accounted for 52% of the real GDP gain for developed
countries and 89% of the GDP gain for developing countries. Another important study32 has looked at the
impact on the volume of trade in services of restrictiveness in FDI regimes in services sectors. Figure 24
shows the costs imposed on business as a result of FDI restrictions and the negative associated impact on
services trade flows.
Figure 24: Quantifying the Negative Impact of Services Trade of Restrictions on FDI
Source: Christen, Francois and Hoekman (2011)
A study undertaken this year for the APEC Policy Support Unit (PSU)33 quantifies the gains from
liberalization, including investment liberalization, in specific services sectors; air transport, maritime
31 CIE (2010)
32 Christen, Francois and Hoekman (2011)
33 Findlay (2011)

42
transport, rail transport, electricity and gas and telecommunications. The modeled package of reforms
generated US$175b a year in additional real income APEC-wide and productivity improvements in the range
of 2–14%. The largest productivity gains accrued in Indonesia, Malaysia, Mexico, the Philippines, Chinese
Taipei and Viet Nam. APEC-wide, the projected gains from reforms in just these few services sectors were
almost twice as big as the gains from further liberalization of merchandise trade. The study showed, for
example, that full openness in air transport would lead to an average reduction in air freight prices for all
APEC economies of 15%. For maritime transport, full liberalization for all APEC economies would on
average reduce maritime freight rates by about 20%.
Another Australian study34 summarizes, in Box 7, the academic literature documenting the negative impact
of restrictions on Professional services, including Legal Services and Accountancy, and highlights the gains
available from regulatory reform.
34 Source; Nguyen-Hong (2000)

43
Box 7: Effects of Restrictions on Professional Services

44
8. Capacity-building to improve services sector competitiveness
8.1 Competitiveness Framework
Given that relatively less progress has been made to date in liberalizing trade in services compared with trade
in goods, despite the gains on offer, we take a look at some of the root causes and the extent to which they
could be addressed by APEC capacity building efforts.
Policy makers in many developing APEC economies often claim to have difficulty seeing where their
national interests in services lie. This would go some way to explaining the apparent reluctance to open up
domestic services sectors to higher levels of foreign competition. It might especially explain the reluctance to
make binding commitments and the apparent preference to retain discretionary policy space for possible
“industry policy intervention”. Officials often seem unaware, moreover, of their significant existing export
interests in services or that with the right reforms in place, efficiency, productivity and competitiveness
would significantly boost foreign exchange earnings from services.
It is not easy to work out where an economy’s competitive strengths in services might lie. We attempt to set
out, from a business perspective, a preliminary framework of factors which appear to have a determining role
in services competitiveness. The framework draws on recent firm-level evidence emerging from business
associations in the APEC region35, and on early empirical results from a variety of developing country case
studies being undertaken by the World Bank.36
Framework of 8 Factors relevant to international competitiveness on Services
1. Endowments, especially Human Capital (talent, education, skills, ideas, culture of customer focus)
• business stakeholder interviews refer to the importance of vocational training
• firms refer to the importance of multi- and cross-disciplinary education, including languages
• World Bank work shows tertiary enrolment is significant in affecting services exports. 2. Investment in Intangible Assets (corporate IP e.g. copyright, business methodologies, brands)
• analysis in the UK provides evidence of intangible capital deepening contributing the bulk of growth in labour productivity
• firms refer to the importance of a supportive environment for innovation, including business process innovation
3. Enabling Digital Infrastructure
• World Bank confirms the importance of the quality of the telecommunications network and
• extent of internet penetration (though this is not always critical)
35 ASR 2010
36 Saez 2011

45
4. Quality of Institutions
• World Bank work identifies transparency/degree of corruption/rule of law as being relevant
• World Bank identifies the economic freedom index
• firms refer to the role played by institutions which undertake independent analysis of the costs and benefits of regulatory regimes
5. Efficiency of Domestic Regulation
• firms refer to constraints imposed by the complexity of the business environment
• rigidity or other inefficiencies in employment laws; for services companies, human capital costs are often 70-80 % of total cost, everything to do with recruiting, training and deploying people is critical
• firms refer overwhelmingly to the burdensomeness of regulatory compliance costs
• firms refer to the need for an environment which gives them flexibility to adjust to rapid change 6. Connectedness with the International Market
• two-way trade and investment openness
• firms refer to the quality of export promotion efforts and tool kits and opportunities to connect with supply chains
• firms refer to the need for mutual recognition and interoperability of standards
• firms are increasingly concerned about seamlessness of regulation across markets 7. Services Business Stakeholder Consultation
• World Bank work suggests that services business groups (such as NASSCOM in India and BPAP in the Philippines) play a positive role
• firms stress the importance of stakeholder consultation mechanisms, for example the newly formed Indonesian Services Forum
8. Policy Focus
• firms refer to the need for better services statistics
• firms refer to the need for inter-agency coordination
• existence of a vision and roadmap for services
• World Bank work is inconclusive about the role, if any, of specific sub-sectoral targeting

46
Box 8: Skills are relevant to Competitiveness in Services
Source; Chanda, R and Pasadilla, G (2011)
The World Bank concludes that differences between countries are not static and evolve depending on the
policy choices a country makes. The problem remains that there is relatively little literature available on how
to grow a services industry, or a hub of services excellence. Or how to train, attract and retain services skill
sets. Or facilitate services innovation, collaboration and customer orientation. Which enabling infrastructure
to provide – and which regulatory settings to ensure interoperability across the value chain (See Box 8).
Some of these issues could be addressed through a reinforced focus in APEC capacity building programs on
services productivity issues, for example in the following key areas;
• Benchmarking of services regulation via regional regulatory dialogue;
Human resource inputs are overwhelmingly important for IT services firms. Decisions on where to source work, at what level of value-add, will depend on access to numbers of trained people, the quality of training and the associated likely wage structures.
Country Salary of Graduates US$ p.a.
Total Number of graduates p.a.
India 2400 2,000,000
China 2000 950,000
Philippines 2900 380,000
Mexico 1400 137,600
Ireland 19500 43,200
Malaysia 7200 30,000
Singapore 16500 12,500

47
• Enhancing the “soft” infrastructure for services (Information and communications technology and education and training); and
• Promoting services SME innovation and export/onshoring.
These three key capacity building needs are addressed in turn below.
8.2 Regulatory Coherence
The work of cutting unnecessary regulatory red tape should always have high economic priority, given the
strong international evidence of links between regulatory reform & productivity growth. For services firms,
inefficient regulatory regimes constrain the international competitiveness of domestic firms as much as they
constrain foreign participation. Services regulators in APEC economies need to get together for more regular
structured dialogue, on a whole-of-services basis. The objective would be to gain deeper insights, from being
exposed to a wide variety of other services sectors, on regulatory pitfalls and inefficiencies as well as best
regional practices.
In many APEC economies, the regulatory regimes for many services industries are opaque, unduly complex,
uncoordinated, overlapping, duplicative and excessively burdensome for business. There is rarely a one stop
shop, and each step in the process adds to business costs. This has real negative economic consequences,
because so many services activities are infrastructural or “enabling” of competitiveness in other industries
and other sectors. Where the regulations allow for a high degree of discretion with respect to
implementation, the regulatory environment can also become prone to corrupt practices.
Typically, many administrations do not have a close understanding of all the exact details of their own
regulatory frameworks; many Trade Ministries are unaware of the exact requirements imposed by other
Ministries. Any one government agency, including the agency responsible for trade policy, will rarely know
the full extent of the regulatory regime applicable to any particular services sector.
Sometimes, of course, governments do know, but they lack the capacity needed to implement badly needed
reforms. Sometimes governments need technical solutions. Sometimes they need reform strategies.
Sometimes governments just need some simple principles to guide reform; e.g. “one regulation in - one
regulation out”. Sometimes new processes are needed; sometimes new institutions.
APEC members do not currently work closely enough together to benchmark appropriate and efficient
regulatory practice for services. APEC trade officials only rarely meet with APEC regulators, either
domestically or in the regional context. Many line agencies with responsibility for the international
dimension of services policy appear to work in a vacuum, without input from the Ministry responsible for
Trade.
The absence of sufficient regular focused regulatory exchange on best practices, whether on an all-of-
services basis, or sector by sector, means that inadequate progress is made in working conscientiously

48
towards greater convergence of regulatory practice or more rapid implementation of mutual recognition of
services standards across the APEC region.
What private sector services stakeholders repeatedly say is that they want to do business in each others’
economies the same way they do business at home. This is fundamental to cutting business transaction costs
and facilitating trade. It is fundamental to growing the regional services economy.
8.3 Building Services Infrastructure
One way to improve services productivity is to create a positive climate for investment in the services
infrastructure essential to 21st century economies. Education and ICT are themselves both services industries
as well as essential enablers of all other services activities. Attracting investment into both of these sectors
inevitably requires reform of border measures as well as behind-the-border regulations. APEC members
already engage in regulatory dialogue on telecoms; and share experience and perspectives on education and
training needs. Both agendas should be broadened specifically to include trade officials and a sharing of
experience on the costs and benefits of greater openness to foreign participation.
8.4 Promotion of SME Innovation and Export
Services SMEs deserve particular attention because the bulk of services firms are SMEs, and the bulk of
SMEs provide services. APEC members need to design new capacity building exercises to share experiences
on how to facilitate services innovation and on how to promote services exports, with a special focus on
SMEs. The objective would be to boost international engagement on the part of SME services firms in all
APEC economies.
Most services firms are SMEs. Some can achieve commercial presence offshore; some can compete on a fly-
in/fly-out basis. But increasingly, most need also to master the art of attracting supply chain “tasks” onshore
and operating via mode 1. This generally requires innovation of some kind - and new promotional tool kits.
APEC members need to ensure that their policy approaches, both to services innovation, and to services
export promotion are benchmarked to best practice, because both are totally different from innovation and
export promotion for goods. Services export promotion requires different skills from goods export promotion
and a whole new toolkit. A few agencies in APEC economies are making significant progress, and have
much to share with other APEC Members, if activities were planned at APEC level to facilitate this.
Given the way in which services firms engage internationally, services export promotion requires a new
focus on facilitation of movement of people (skill sets) both onshore and offshore and a new focus not only
on attracting foreign direct investment but of facilitating commercial presence/establishment offshore for
local services firms, often via joint venture type arrangements. Sometimes the effective promotion of
services exports (e.g. offshore workers) requires the development of new regulatory bodies. In cross-border
trade in services, the objective is usually to attract global work on-shore, preferably higher value–added
work. The process of attracting global work on-shore into local “centers of excellence” can seem very

49
different from the process of attracting a foreign buyer for a container load of onions or garments, given the
very different manner of offshore delivery. It tends to require that firms undertake significant business
process innovation, in order to enter the relevant global supply chains. SMEs in particular need public efforts
to facilitate such innovation.
Efforts to facilitate SME entry into regional and global supply chains will continue to prove ineffective
unless simultaneous efforts are made to ensure connectivity at the technical level. Without ensuring cross-
border connectivity in every sense of the word, small services firms will continue to struggle to move up the
value chain and to meet the challenges of the international market. The business reality is that any disconnect
between standards generates a chokepoint in the cross-border supply chain. Such chokepoints add to the
operating cost of all firms. For SMEs, they often make cross-border business impossible.
Innovation policy, standards setting and export promotion tend to be handled by different government
agencies, each with limited links and understanding of each other. Insights need to be built on how services
firms work, with the emphasis on SMEs (See Box 9). Improvements in competitiveness, through innovation,
and demonstrated by higher export performance, requires a more concerted whole-of-government
understanding to be brought to bear; APEC capacity building could assist in nurturing a services trade policy
mind-set.
Box 9: Domestic Inter-agency Coordination matters for Services
Everywhere in the world, the international dimension of the work of all government Ministries and agencies is increasing. International trade matters impact on all these Ministries and are increasingly relevant to them. Some of these Ministries have line responsibility for individual services sectors, such as telecommunications or for individual industries such as banking and hence have a critical role in sectoral regulation and consequently also in trade policy formulation. Others have responsibility for horizontal, cross-sectoral matters relevant to trade such as investment, immigration, intellectual property or government procurement. In all countries, the Ministry of Trade or its counterpart needs some sort of institutional mechanism through which to communicate and consult with all these other relevant Ministries and agencies. Sometimes the best mechanism is formal; sometimes it operates satisfactorily on an informal, working level basis. But ultimately, for communicating a trade policy position both domestically and in an international organization such as APEC or the WTO, a coordinated and coherent “whole-of-government” trade policy position is essential. It is commonplace for Ministries which have traditionally seen their responsibilities as purely “domestic” to be reluctantly surprised by the recent need to relate more closely to Ministries responsible for Trade. It is similarly commonplace for Ministries responsible for Trade to find it difficult to maintain technical expertise across all sectors especially of the Services economy. It is everywhere throughout the APEC region becoming more and more evident that Ministries need to learn to work together to ensure policy coherence. International experience has many potential lessons to share, which could be shared through capacity building efforts. It is not just in isolated pockets of APEC administrations that trade policy coordination problems can be identified. On the contrary, when it comes to the Services sector, the problem is truly endemic. Nor is there any supportive regional whole-of-services regulatory dialogue, which if it existed, might help galvanize potential domestic champions for change.

50
9. Facilitating Services-related Trade, Investment and People Movement
9.1 Lack of Progress in the Doha Development Agenda
It is now quite clear to most of the business community that the current negotiations on services in the WTO
are not going to deliver commercially meaningful outcomes. Even if a “solution” of some kind or other is
stitched together to bring the Doha Development Agenda as a whole to some kind of resolution, the business
community no longer expects there to be much, if any, negotiated commitment to meaningful new
liberalization in services trade and investment.
Figure 25 below illustrates the fact that the services policy bindings which are being negotiated in the WTO
(the Green line) have very little to do with anything going on in the actual market place. The figure maps the
World Bank’s Services Trade Restrictiveness Index of actual barriers to trade (in red), DDA offers (in green)
and existing Uruguay Round commitments (in blue). It is clear from the figure that the reduction in bound
levels of liberalization which the DDA might achieve are still significantly inferior to actual levels of
intervention - and hence deliver no new liberalization.
Figure 25: WTO Commitments, Doha Offers and Actual Policies
ZAF
KENNGA
MUSPHL
CHN
IDNMYS
THA
ALB
CZE
TUR
LTU
HUN
POLBGR
BHR
OMN
DOM
MEX
CHL
BRAPE R
BOL
TTOGTMHND
ARG
URY
PAN
CRI
COLNIC PRY
JOR
MAR
TUNEGY
NZL
USA
DNK
AUSGRC
FIN
JPN
PRT
AUT IRLSWEDEU NLDCANGBR
KOR BEL
ESP
ITAFRA
LKA
IND
PAK
ZAF
KEN
NGAMUS
PHL
CHN
IDN MYSTHA
ALB
CZE
TUR
LTU
HUNPOL
BGR
BHR
OMN
DOM
MEX
CHL
BRA
PE R
BOL
TTOGTMHND
ARG
URY
PAN
CRI
COLNIC PRY
JOR
MAR
TUNEGY
NZL
USADNK
AUSGRC
FINJPN
PRT
AUTIRL
SWEDEUNLD
CAN
GBR
KORBEL
ESP
ITA FRA
LKAIND
PAK
ZAFKENNGA
MUS
PHL
CHN
IDNMYS
THA
ALB CZETUR
LTU
HUN
POLBGR
BHROMN
DOM
MEXCHL
BRAPE RBOL
TTO
GTMHND ARG
URY
PAN
CRI
COLNIC
PRY
JOR
MAR
TUN
EGY
NZL
USADNK
AUSGRC
FIN
JPN
PRTAUT
IRLSWEDEU
NLD
CANGBR
KORBEL
ESP
ITAFRA
LKA
IND
PAK
020
4060
8010
0
Serv
ices
trade
rest
rictiv
enes
s in
dex
0 10000 20000 30000 40000GDP per capita,PPP
Restr ictive ness of GATS co mmitment Fitted values
Restr ictive ness of DOHA Offers Fitted values
Restr ictive ness of actual policy Fitted values
STRI for 61 countries, excluding Qatar and 31 countries that did not submit offers
Source; Borchert, Gootiiz and Mattoo, 2010
Businesses are keen to harvest all new “bindings” which have been offered, as they reduce, to a degree, the
level of policy uncertainty faced in the market. But it is difficult to expect that businesses would get very
excited about these offers given that they involve no new actual market opening and that no new trade or
investment is actually likely to flow as a result of them.

51
The simple fact is that governments everywhere are retaining a vast amount of “discretionary policy space”
which, especially in light of the “win-win” of services trade reform, makes no economic sense whatsoever.
APEC economies should start cutting into actual levels of restrictiveness if they are to unlock the sought-
after productivity gains from increased services trade and investment flows.
This does not mean that the business community has given up on finding ways of harvesting the services
offers that have been made or might yet still be tabled in the DDA. But it does mean that the business
community senses that the negotiations are merely fiddling at the margins of the constraints faced by
business in the actual market place.
After 10 years of DDA negotiations, and at a time of immense global change in business realities, businesses
would prefer to see specific results. Below is a brief discussion explaining some general business priorities
on regulatory reform, commercial presence and temporary movement of people.
9.2 Intensifying Regulatory Reform
Every services industry is affected by government decisions on who can do business and how business must
be conducted. If a country’s regulatory house is not in order, domestic competition is impaired and export
potential is prejudiced. The biggest challenge that governments and policy-makers face in the transformation
of the services sector is the regulatory challenge.
One of the GATS' important conceptual bases is the distinction between liberalization and regulation.
Liberalization under the GATS, in sectors where commitments are made, means granting market access and
removing all forms of discrimination. Apart from that, governments and regulators are free to decide the
shape and content of the remaining regulatory framework. While the GATS does not interfere with the
regulatory agenda, nor does it provide much guidance on how to pursue a sound regulatory approach.
An effective approach to sound regulation normally emanates from a clear policy vision for the services
sector concerned, its role in the economy, its contribution to society and the direction that the process of
reform needs to take. A number of different commentators, chiefly from the business community, have
begun to call for international development of an agreed set of whole-of-services sector guiding principles
for regional best practice. There is much that could be done in this direction in the APEC region, given the
stock of best practice available across many economies and the ready way in which APEC capacity building
mechanisms allow for regional focus on benchmarking.
It is worth noting that at their meeting in Busan, Korea in 2005, APEC Ministers adopted an important tool,
developed in cooperation with the OECD, in the form of an Integrated Checklist for Regulatory Reform37.
This is essentially a Questionnaire, designed to assist APEC members go through a regulatory self
37 APEC, 2005

52
assessment or audit process to improve regulatory practice across all sectors of the economy. It is an
extremely simple and useful tool, the application of which now needs to be intensified and extended.
The services sector, moreover, requires specific separate focus, for the simple reason that the history of
government ownership and intervention in so many services sub-sectors means that levels of regulatory
intervention for public policy purposes are much higher than in other sectors. Informed commentators38 are
beginning to suggest that dealing with the regulatory challenge may require agreement on principles that
could serve as an introductory step towards better practice.
One model might be the WTO Telecommunications Reference Paper, which is a negotiated set of principles
which provides essential guidance and discipline to telecommunications regulation. Whole-of-services
principles might provide guidance, for example, not only on regulatory content, but also on design and
scope. They might also cover the institutional framework with principles focused on functions and modus
operandi, independence and accountability, resourcing and coordination with other governmental and non-
government institutions.
9.3 Facilitating Services-related Commercial Presence
This is an area where questions sometimes arise as to why there is a need for policy focus specifically on
services–related commercial presence, rather than liberalization of investment regimes impacting on all
sectors. Ultimately, from a business perspective, the policy focus should be on freeing up all investment. But
there are currently no binding multilateral obligations which provide a framework within which to achieve
this, unlike the GATS which does provide a binding multilateral legal framework which specifically
disciplines barriers to commercial presence for services firms.
There is moreover, strong evidence to suggest that mode 3 is the dominant mode of trade in services and has
been the fastest growing. This evidence underlines the importance for services firms in establishing a
physical presence in overseas markets. Commercial presence in Services warrants a dedicated APEC focus,
independently from and in addition to, the APEC work underway on Investment.
There has been much public and media conjecture in recent years about whether the foreign activities of
domestic firms create jobs at home or whether they erode them. The US International Trade Commission
(ITC) released a groundbreaking study in August 2011 on the relationship between investment in
commercial presence abroad by US services companies, and their employment in the US. The study39, finds
that intra-firm or intermediate services exports from the parent to the foreign affiliate are supporting jobs at
the US headquarters and throughout their US-based services supply chains. The largest flows of intra-firm
services exports were in intangible intellectual property, business, technical and professional services and
management and consulting services. The ITC finds that these intra-firm exports by US services firms to
38 See for example Mamdouh (2010)
39 ITC (2011)

53
their offshore affiliates support around 700,000 US-based jobs. The ITC concludes that domestic
employment and foreign activity in services are complements. In banking services alone, the study suggests
that establishment abroad creates 45,000 new US jobs across all sectors of the economy.
9.4 Temporary Movement of Providers of Services
Mode 4 is the supply of a service through temporary presence of natural persons. In some policy circles, the
question has arisen as to why liberalization of temporary movement of people for business purposes should
be limited only to the Services sector. NAFTA for example, and many of the US FTAs which followed,
experimented with going further by covering the temporary movement of a person who is engaged in trade in
goods, the provision of services or the conduct of investment activities. Domestic political sensitivities over
perceived potential job losses brought this experimentation on the part of the US to an abrupt end after
completion of the US/Chile FTA, which was the last US FTA to include provisions on temporary movement
of business personnel. The fact remains that the GATS is the only multilateral agreement which sets out legal
disciplines in the area of movement of natural persons.
Quite wrongly, Mode 4 has come to be perceived as a north-south deal-breaking issue. Developing countries
certainly have strong commercial interests in Mode 4 liberalisation, as the importance of worker remittances
testifies for so many developing APEC members. But developed economies have equally strong commercial
interests in Mode 4. Despite these interests, and irrespective of level of development, all APEC economies
are defensive in their approach to Mode 4 liberalisation. Paradoxically, some of the most active mode 4
demandeurs, are themselves restrictive in this area.
The awkward reality is that the difficulties in liberalizing this area are unlikely to be overcome until the
scope of mode 4 is sufficiently clarified to enable it to be distinguished, in the minds of regulators, from
immigration policy. Despite – or perhaps because of - all the sensitivities, the APEC region should attempt to
make some headway. “Fly–in/Fly-out” business is so fundamental for services firms, given the imperative
for face to face contact with the client, that no other mode of supply can ever fully replace it.40
Some commentators have suggested 41 that there is an important role that the private sector could play in
helping governments move away from the purely defensive mind-set regarding mode 4 and to focus on the
benefits they stand to gain in this area. For example, there could be agreement on regulatory collaboration
arrangements between sending and receiving countries. Sending countries could contemplate undertaking
obligations, such as establishing pre-screening arrangements, providing guarantees for return of citizens to
ensure temporariness of stay, as well as assume other responsibilities (including social-security
arrangements) vis-à-vis mode 4 citizens residing in “export” markets. The Philippines has made great
headway on this front in dealing with Hong Kong. It should be possible to come up with agreements that
40 ASR (2010)
41 Mamdouh (2010)

54
effectively cover many of the concerns raised by receiving countries and hence facilitate more widespread
progress with mode 4 services market access.
APEC has already demonstrated a major success in this arena, in the form of the APEC Business Travel
Card scheme. APEC could go the next step, perhaps on a pathfinder basis, to experiment with possible
solutions to the apparent deadlock on mode 4, so destructive of wider progress on services market access
issues. Practical measures of this kind, which is APEC’s forte, are of real interest to business as they visibly
cut trade transaction costs and facilitate international business.

55
10. ABAC proposals
In light of the insights arising from this study, we set out some potential practical measures that could
realistically be taken in APEC to address some of the key problematic issues raised. ABAC considers that in
the interests of regional growth, development and job creation, APEC members should seek ways of
reigniting services trade negotiations at a regional and global level.
Proposal 1: Launch a new and dedicated initiative specifically aimed at liberalizing and facilitating regional
services trade and investment. The new initiative should prioritize regulatory reform and it should cover all
services markets and all modes of delivery. The initiative should include drafting of joint APEC principles
for all-of-services best practice regulation, with a view to generating global interest in development of such
principles.
This Proposal 1 should be “visible” to the business community. The initiative should cover infrastructural or
backbone services industries but it should also include all professional services, which have been shown to
be the most restricted everywhere. The initiative should go beyond “commercial services” and include
government services, in order to unlock innovation and efficiency in the provision of vital citizen-centric
services. It should bring together under a “Services” umbrella fragmented work already underway in both the
Committee on Trade and Investment and the Economics Committee and add separate but related components
designed to achieve the following;
• enhance domestic inter-governmental coordination on services trade
• experiment at a regional level with ways of bringing services regulators together with trade officials, both sector-by-sector and at whole-of-services level, to:
o identify the barriers to regional integration,
o share regulatory experience,
o raise awareness of regulatory incoherence,
o consider options for improving regional practice
o implement improvements including build new institutions and
o benchmark progress
• reenergize advocacy and use of the APEC-OECD 2005 Integrated Checklist on Regulatory Reform, including as a model of voluntary regulatory audit for adoption beyond the region.
• initiate drafting of joint APEC principles for all-of-services best practice regulation, with a view to generating global interest in development of such principles
• design practical regulatory mechanisms, in consultation with the business community, to increase recipient country confidence regarding mode 4 supply of services
• deepen consultation with private sector stakeholders on regulatory/technical chokepoints in regional Services value chains
• deepen policy understanding of the role of Embedded Services in goods production networks and the value for goods producers of reforming Services regulation.

56
The new initiative should also encompass capacity building exercises oriented to promoting innovation and
export by services SMEs. Export promotion efforts need to be better directed to attracting SME onshoring of
higher value added tasks in regional and global supply chains.
Proposal 2: Commission an APEC-led tripartite (i.e. including the business community) “Services Expert
Group” to take a “back to basics” look at how to improve the global governance of services trade and
investment.
The “Services Expert Group” should examine whether the inter-governmental negotiating process in the
GATS might itself be contributing to the lack of progress in services trade negotiations and what sort of
adjustments could be designed that might help42. The terms of reference for this study group should therefore
include a critical assessment of the impact of:
• the request-offer modalities and the associated incremental approach
• the absence of an official inventory of quantitative measures of services barriers
• the confidentiality/public opacity of services offers
• the private sector stakeholder consultation mechanisms in place in Geneva
• the negotiating location in Geneva
The terms of reference for this study should also include a critical assessment of the desirability and
feasibility of:
• recommencing stand-alone services negotiations as mandated in the Uruguay Round built-in agenda (on a “critical mass”, plurilateral, mfn-basis or other basis43)
• negotiation of a new multi-modal services accord (such as a standstill and rollback type deal, with or without individual schedules of commitments, on either a positive, negative or hybrid list basis)
• finding ways of bringing the regulators to the negotiating table
• negotiation, with the regulators, of a generic cross-sectoral Services Reference Paper (modeled for example on the Telecoms Reference Paper) setting out pro-competitive principles including
transparency and dialogue
42 The nature of a multilateral “round” and the WTO concept of a “single undertaking” have perhaps themselves impacted negatively
on the prospects for services, given that the DDA negotiating focus to date has been on agriculture and manufactures. Some
commentators also consider aspects of the GATS and the GATS negotiating modalities to be problematic, for example: the
technical complexity of GATS schedules; the unintelligibility of the GATS itself and its disconnect from business reality;
uncertainties in GATS interpretation given the relative absence of dispute settlement case law; and the absence of any “formula”
by which to quantify progress in reducing services barriers and the public opacity of services “offers”.
43 Some commentators suggest a plurilateral approach might be more effective, given that only a third of WTO members have
submitted a DDA services offer. Questions arise as to what a services plurilateral might look like, why it might have any
likelihood of success and what would constitute a “critical mass”. The WTO Information Technology Agreement has been cited
as a potential MFN-based model; another WTO model cited is the Agreement on Government Procurement which operates on a
reciprocal basis among the signatories.

57
• Instituting permanent ongoing (“living”) services negotiations accompanied by a regulatory benchmarking dialogue (with stakeholder consultation opportunities)
• Calling for establishment of GATS working groups on movement of natural persons and on technical standards causing choke points in international services value chains.
• Calling for intensified WTO work on global governance on investment and competition.
• Calling for WTO technical support enabling intensified domestic attention to regulatory audits and regulatory institution building
The terms of reference should also cover how services negotiations can capture insights from the
forthcoming OECD and World Bank Services Trade Restrictiveness Indices.
Proposal 3: In collaboration with relevant international organizations, commit to substantially improve the
region’s official statistics on services production, employment, productivity, trade and investment to ensure
the regional services economy becomes more “visible”.

58
Annex: Case Studies
A number of case studies are set out below to highlight, from a business perspective, how important services
trade liberalization, including regulatory reform, is for domestic growth and development. The case studies
are drawn from a variety of representative services sectors and from economies at different levels of
development across the APEC region. Each example has been chosen for its relevance in demonstrating
aspects of ABAC’s case for greater regional progress with services trade and investment liberalization. The
objective, in setting out these examples, is to demonstrate how the absence of policy effort to reform the
regulatory environment and open up in Services is prejudicial to domestic productivity and competitiveness -
and how on the contrary, determined steps to liberalize have led to quantifiable domestic gains.
Case Study 1: Benefits from Telecommunications Reform
There is evidence that countries with substantial liberalizing WTO telecoms commitments have experienced
a more rapid rate of growth in telecom sector investment and revenues, and more rapid and deeper reduction
in call costs, than those without such commitments. In low-income countries in Europe and Central Asia,
telecom sector revenue in countries with liberalizing WTO commitments grew from 1.5% to more than 4%
of GDP in the years following the WTO Agreement on Telecoms (1997-2002), while the figure was
essentially flat during the same period for countries that made no liberalizing commitments. Analysis by the
World Bank has shown that for every 10 percentage-point increase in the penetration of broadband services,
there is 1.3 percentage-point increase in economic growth.44
A recent study for the PSU45 shows that as of 2009 the majority of APEC economies had adopted full market
entry liberalization. However, it is still a common practice to limit foreign investment from gaining dominant
positions in fixed-line operators. Similarly, by 2009 all APEC economies had liberalized their mobile
telecommunications sectors. In most economies new licenses are granted based on market-oriented
approaches unless limited by the availability of spectrum. APEC members have undertaken – as required by
their respective GATS treaty commitments – to allocate spectrum in an objective, timely, transparent and
non-discriminatory manner.
A liberalization program began in Chinese Taipei in 1997, first in mobile then in fixed-line services. The
subsequent change in performance has been remarkable in comparison with its APEC peers. Mobile
penetration in Chinese Taipei exceeds 100%. Fixed-line penetration exceeded that of Australia and Japan in
1998 and of the USA in 2003: it peaked at 65% in 2005. Broadband penetration is at the same level as these
comparator economies.
Fixed-line development in Viet Nam has also been outstanding. Prior to 2003 Viet Nam had a similar level
of fixed-line penetration as Indonesia and the Philippines of around 5%. Starting from 2003, access has
44 Global Services Coalition (2010)
45 Findlay (2011)

59
jumped. In fixed-line availability, Viet Nam is now at 35% and mobile penetration is at 80%. Monthly
subscription charges for mobile services had fallen to zero by 2004, compared to $US17 in 1999. Structural
reform efforts contributed to this outcome, including the establishment of the universal service fund.
The introduction of competition into the mobile sector in PNG has led to near universal coverage, following
a rise of 700% in the number of mobile subscribers since mid 2007 and a wider variety of services. Charges
have fallen by 11% in the peak times for domestic calls and 51% in off-peak periods. In an economy like
PNG with such a difficult terrain, the benefits cannot be underestimated. Social interaction, such as the rate
of response to medical emergencies, is better and mobile banking initiatives are now underway. The
provision of market pricing information for rural commodities through mobile phone services will be
valuable because the livelihood of the bulk of the population is from agricultural and fishing activities.
The biggest consumers of digital services and the networks over which they travel are other services
industries, such as financial services, healthcare providers and professional service providers. All of these
services are enabled by liberalizing the telecommunications sector.
Case Study 2: Take-off in Philippines BPO
Since 2004, services exports have strongly outperformed goods exports in the Philippines, with growth
concentrated in Business Process Outsourcing (BPO)-related services. BPO-related exports soared from
1.7% of GDP in 2004 to some 4.5% in 2009 (See Figure A). The Philippines is now the third largest player
in the global BPO market, accounting for 15% of the market, after India (37%) and Canada (27%).46
Figure A: Services exports are growing faster than goods (% growth compared to 1999, 1999=0)
!"#
#
"#
$##
$"#
%##
$&&&%###%##$ %##%%##'%##( %##"%##)%##*%##+ %##&
,--./ 0123451/
Source; Yi (2011)
The BPO industry has a long history; HSBC has outsourced to the Philippines since the 19th century and
IBM since the 1950s. The early focus was in data entry, especially accounting. In addition to low relative
46 Yi (2011)
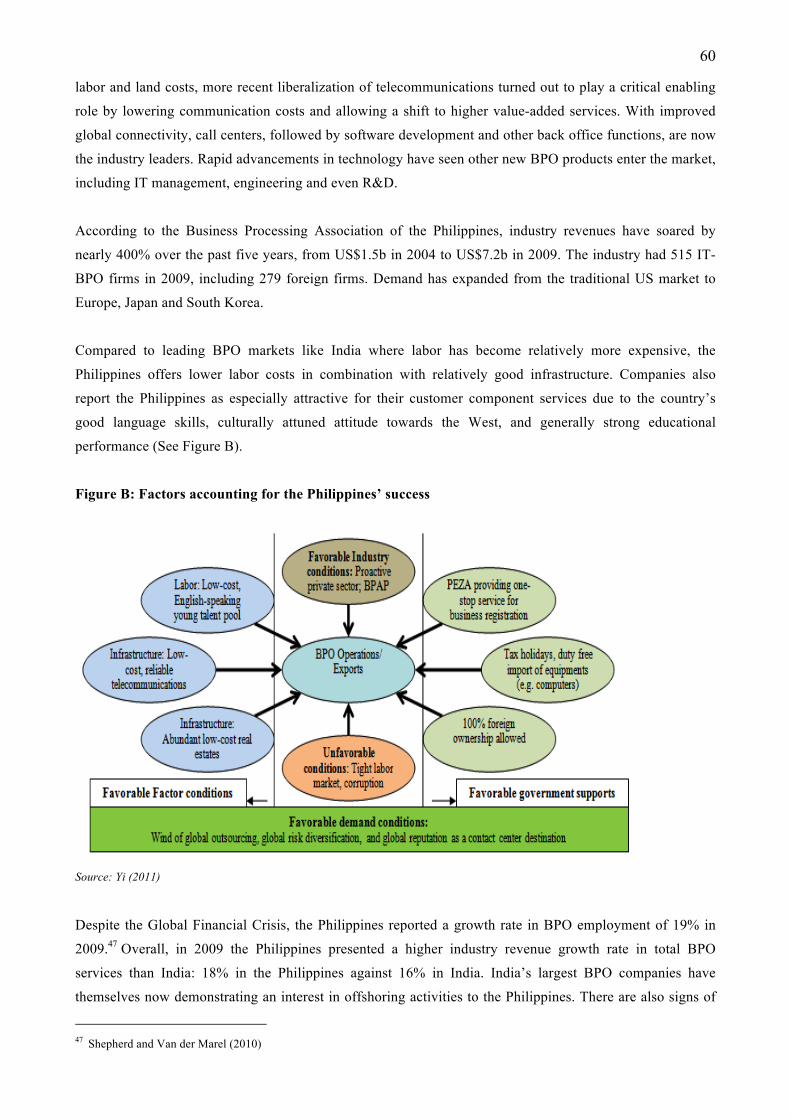
60
labor and land costs, more recent liberalization of telecommunications turned out to play a critical enabling
role by lowering communication costs and allowing a shift to higher value-added services. With improved
global connectivity, call centers, followed by software development and other back office functions, are now
the industry leaders. Rapid advancements in technology have seen other new BPO products enter the market,
including IT management, engineering and even R&D.
According to the Business Processing Association of the Philippines, industry revenues have soared by
nearly 400% over the past five years, from US$1.5b in 2004 to US$7.2b in 2009. The industry had 515 IT-
BPO firms in 2009, including 279 foreign firms. Demand has expanded from the traditional US market to
Europe, Japan and South Korea.
Compared to leading BPO markets like India where labor has become relatively more expensive, the
Philippines offers lower labor costs in combination with relatively good infrastructure. Companies also
report the Philippines as especially attractive for their customer component services due to the country’s
good language skills, culturally attuned attitude towards the West, and generally strong educational
performance (See Figure B).
Figure B: Factors accounting for the Philippines’ success
Source: Yi (2011)
Despite the Global Financial Crisis, the Philippines reported a growth rate in BPO employment of 19% in
2009.47 Overall, in 2009 the Philippines presented a higher industry revenue growth rate in total BPO
services than India: 18% in the Philippines against 16% in India. India’s largest BPO companies have
themselves now demonstrating an interest in offshoring activities to the Philippines. There are also signs of
47 Shepherd and Van der Marel (2010)

61
increasing value-added activities in the Philippines. During the recession in 2009, the Knowledge Process
Outsourcing (KPO) sector increased by 35% and currently the Philippines is diversifying its offshoring
sector to more quality oriented industry-specific service activities. The global BPO market was estimated at
US$120-150b in 2005 with a current penetration rate of merely 8%. Huge additional untapped potential
awaits. Case Study 3: Liberalizing Retail Services in China, PRC
Virtually every good or commodity makes its way to the market through distributors, wholesalers, retailers,
commissioned agents and franchisers who provide the domestic infrastructure for moving goods to
consumers. The value added in the distribution stages can greatly exceed the value added in production; the
value created in distribution accounts for 70% of total value for textiles and over 75% for food products,
according to UNCTAD.48
On entry to the WTO, China made significant commitments, on a 5 year transition basis, on distribution
services - providing market access and national treatment advances in all four modes, including
commissioned agents, wholesaling, retailing and franchising. China also agreed to phase out restrictions on
foreign firms’ establishment of Joint Ventures.49
The transition period expired in 2005, and in that single year, according to Ministry of Commerce data, a
total of 1,027 foreign firms were granted approval, three times the total number approved during the 12
previous years. The contracts, worth US$1.82b, involved the opening of 1,660 shops covering 4.7m squares
meters. Most of these firms were in wholesale; only 187 were in the retail sector, including Wal-Mart,
Staples, B&Q, Carrefour, Auchan, Metro and OBI. An impact study by the China Chain Store & Franchise
Association, covering 27 cities, showed that foreign firms subsequently accounted for 23% of stores in big
shopping outlets, but still only for a mere 6% of the total number. Ministry of Commerce data showed
foreign firms accounting for less than 5% of total retail sales. By 2008, FDI inflow into wholesale and retail
trade (US$4.4b) was the fourth highest of all services activities. National Bureau of Statistics data shows
growth in annual per capital retail sales of consumer goods from 184.5 Yuan in 1979 to 9119.85b RMB
Yuan in 2008.
A recent study at the University of International Business and Economics in Beijing50 documents the decline
in barriers to foreign retail services and the positive impacts of this opening up. The study explains that
foreign retailers have brought significant benefits to consumers in the form of greater choice at lower prices,
more attentive services and higher product quality. The adoption by foreign firms of multiple retail formats,
including hypermarkets, supermarkets and discount stores has meant greater opportunities for a wider
48 Findlay et al (2010)
49 Other than mail-order, commercial presence is the most important mode of supply in distribution and a number of both horizontal
and sector–specific barriers remain in place, for example minimum registered capital requirements and measures affecting
commercial land. Largely non-discriminatory regulatory restrictions also impact on location and size of different kinds of outlets.
50 Ying Fan (2010)
62
number of market segments, including lower income groups. There has also been large scale foreign retail
investment into the poorer western regions of China, promoting local growth in these under-developed areas.
The study notes that entry of foreign firms has, moreover, had a “huge catfish effect” in that heightened
competition in the domestic retail market has generated improvements in the general level of quality of local
Chinese retail enterprises.
Foreign retail groups have proved to be critical role models in demonstrating the improvements in overall
business efficiency offered though innovation. Most local Chinese enterprises have now followed suit by
setting up more efficient modern satellite systems and commercial networks, adopting Bar Code technology
and implementing Point of Sale Management, Electronic Data Interchange, Management Information and
Global Positioning Systems. The study suggests that application of IT and e-commerce and other
improvements in business and marketing management has helped local firms make up their “late comer
disadvantage” more quickly than would otherwise have been possible.
In addition to this beneficial transfer of technology, the study notes that the experience of watching the
process of inward foreign investment through cross border mergers and acquisitions has been an important
source of reference for domestic Chinese retail businesses as they implement a “going out” strategy of their
own.
Liberalization of distribution services has also created jobs. Retail draws employees primarily from the lower
economic strata and provides training, job security, good wages and often the first opportunity for
management experience. In 2008, there were 7.37m people employed in the distribution sector in firms over
a designated size i.e. 9.3% of total employees in China, including a relatively high number of management
personnel.
Very importantly the study shows that opening up of the distribution sector has also impacted positively
upstream on local merchandise producers who have benefitted from a wide variety of opportunities including
foreign retail firms’ linkages to offshore markets.
The study shows that the opening up to foreign retailers has had the effect of attracting major new
procurement opportunities for Chinese producers. More than 40 of the world’s top 50 retail groups now
purchase nearly $US1.5trillion in China, through procurement centers which account for 60% of total
procurement in Asia.
Of course, the study concludes, there is still more work to be done – to achieve greater transparency of
domestic regulations, smoother administrative procedures and clearer foreign investment guidelines.
Case Study 4: The Domestic Regulatory Frameworks for Health Tourism
“Health tourism” involves patients going to another country for urgent or elective medical procedures,
including rehabilitation and recuperation. The main services providers are private hospitals and clinics.

63
Health tourism demand is rising. The global market for “spa wellness” and “medical tourism” combined was
estimated in 2005 at US$40b (Monitor Group 2005) and expected to grow to $100b in 2012. Greater
awareness of alternative medicines and natural healing is driving demand for “spa wellness”, longer hospital
waiting times and increasing domestic costs are driving “medical tourism” and ageing populations are
driving associated “silver/retirement services”.51 Developing countries are offering advantages of cost,
speed, quality of service and attractive locations. The main health tourism destinations in APEC are
Thailand, Singapore and Malaysia.
In 2005, medical tourism generated respectively US$470m, US$915m, US$94m and US$333m. Singapore
aimed to expand its medical tourism export market to US$3b by 2012, Thailand to US$2b and Malaysia to
US$1b. Two-thirds of foreign patients in Thailand are Japanese, three-quarters of Singapore’s foreign
patients are from Indonesia and Malaysia and three-fifths of Malaysia’s are from Indonesia.
Health tourism in Malaysia has been llargely private sector driven, coordinated by the Association of Private
Hospitals of Malaysia. Foreign investment has been strong; private hospital numbers grew by 350% between
1980 and 2005 and links to global health supply chains deepened, with new systems of referrals and cross
referrals between regionally and internationally-linked hospitals and clinics. The regulatory environment has
been supportive: the government has recognizing 35 private hospitals as facilities for health tourism and
provides associated fast track clearance for patient visas.
The Philippines has recently entered the market, with medical tourism arrivals from Indonesia, the US,
Guam and South Korea and anticipated spa wellness arrivals from Japan and China, PRC (See Box A). (The
Asian Eye Institute in the Philippines offers cataract implants at US$1,000-1,500, compared with US$3,000
in the US.)
Box A: The Philippines has potential competitive advantage in Health Tourism
Table B.1.1. The Philippines' competitive advantages
Spa Wellness
Traditional Filipino massage products such as "hilot" and "dagdagay" , recently have gained more international recognitionLarge pool of nurses and theraphiestsAbundance of natural hot springs
Medical tourism Low costs on medical treatmentsHigh quality medical services provision Large pool of medical professionalsA pool of expert surgeons in major hospitals(e.g. Asian Hospital, St. Luke's Medical Centerand Medical City, Asian Eye Institute)
Table B.1.2. Medical treatment costs (US$)Treatment US India PhilippinesDental implants 2,000 600 400-‐500Root canal 500 50 30-‐50Porcelain-‐Medtal crown/bridge 600 70 30-‐40Lasik surgery 7,000 1,200-‐1,700 1,600-‐1,800Botox 350-‐500 365 230-‐400Table B.1.3. Number of professionals As of 2006Registered doctors 109,043Registered nurses 413,047Other medical professionals 74,025
Source: Foundation for Rural Enterprise and Economic Development (2006), “National Strategy and Policy Framework for Cross-
Border Health and Wellness Professional Services,” the Philippines, in Yi (2011)
51 Yi (2011) and Findlay (2011)

64
For the industry to take off, the business environment needs to be improved, including reducing corruption
and simplifying procedures to start a business. Hospitals need to tie up with travel agents to provide a one-
stop service to arrange for medical and travel packages for prospective customers.
In other important tourist destinations such as Australia, which are not attracting medical tourists; local
industry associations are advocating a targeted approach to attracting a share of this significant growth
market, including significant domestic regulatory reform.
Industry Example: Factors preventing medical tourism from taking off in Australia
The medical tourism market in Australia is small and scattered. Australia’s share of the global tourism
market is 0.6% by visitors and 3.3% by visitor expenditure, but Australia’s share of the medical tourism
market only around 0.001%. In 2010, visitors for medical reasons comprised only 0.23% of total visitors to
Australia.
The number of medical visitors is growing rapidly however; between 2005 and 2010, the average annual
growth rate of medical tourists was 14% compared to 2% for all tourists. And medical tourism is high value-
add; conservative estimates suggest that the average medical visitor spent about 14 nights in Australia,
spending A$3,973 on airfares, accommodation and other activities, including medical treatment and care. In
contrast, the average visitor to Australia stayed for around 34 nights in total and spent a total A$3,276.
The reasons for Australia’s relative under performance in this sector lie not only in lack of price
competitiveness but also in underinvestment in infrastructure, in inadequate medical and other health
workforce skills training and the absence of development of commercial or regulatory facilitators. Industry
representatives also point to regulatory gaps and the relative absence, compared with other regional
destinations, of government support.
Visa application processes for medical tourists are relatively slow and tight compared to competitors with an
expedited visa process. Relative to competitors, Australia has lower levels of government support. For
example India imposes lower import duties on medical equipment; Thailand, Singapore and Korea offer tax
breaks; some other competitors offer subsidies on prime land for health facilities. Together these factors have
prevented the emergence of a coordinated industry with sufficient critical mass to be globally competitive.
Australian tourism industry representatives are of the view that a sustainable competitive advantage is
unlikely to emerge unless there is a government policy decision to intentionally target these issues.
Business stakeholders suggest the major regulatory issues relate to medical insurance and liability. In the
context of no internationally accepted legal framework to regulate medical tourism, it is unclear who is liable
in the case of medical treatment provided abroad. In Australia in particular, there is no mandatory policy that
an international patient seeking medical treatment in Australia must purchase medical insurance. The short
stay and long stay medical treatment visas to Australia require only that a person provides evidence that they
have enough money to support themselves and any accompanying friends and family while in Australia and

65
that adequate payment arrangements are in place for the treatment. The process for a patient from the US is
likely to be that their primary physician and insurance provider endorses their choice to travel overseas for
surgery, so it is unclear as to who is liable if the patient suffers post-surgical complications after returning
home (i.e. whether it is the primary care doctor, the surgeon or the insurance company). There are also
uncertainties surrounding whether the patient, after accumulating unexpected out-of-pocket costs for
treatment of the complications, sue domestically or abroad.
One suggestion for an international regulatory framework is that all clients arranging international healthcare
with the assistance of a medical tourism company should be required to purchase compulsory medical travel
insurance. These issues of legal recourse by medical tourists would clearly need to be resolved if
development of the medical tourism industry in Australia is to take off (See Table A).
Table A: The Importance of Insurance Coverage for Health Tourism
Category Market RequirementsImportance of
Insurance converage Major players
Spa Wellness tourism Hot springsNatural endowment and skilled theraphists
Mostly in alternative medicine (e.g. acupuncture)
The US, Thailand, Singapore,
Indonesia, Austria
Medical tourism Second opinion/ Diagnostics
Medical specialists, language and cultural affinities Yes
Thailand, India, the US, Malaysia, Australia
Medical, dental, plastic surgery operations
Skilled manpower (surgeons, nurses, specialists), a higher level of technology, language and cultural affinities
Yes, excluding plastic surgeries
India, Thailand, Cuba, Malaysia
Specialized surgical treatments using advanced technology
Skilled manpower (surgeons, nurses, specialists), a higher level of technology, language and cultural affinities Yes
The US, Singapore, the UK, Australia,
India
RehabilitationTherapeutic intervention, language and cultural affinities Yes
Thailand, Malaysia, the US (Florida) and
the Caribbean
Retirement tourismLong stay (more than 6 months)
Medical capacity and language and cutural affinities Yes
Thailand, Malaysia, the Caribbean
ImmigrationMedical capacity and language and cutural affinities Yes
The US (Florida), Spain, Canada,
Source: Foundation for Rural Enterprise and Economic Development (2006) in Yi (2011)
Case Study 5: The Role of Air Transport Liberalization in Boosting Tourism in the Philippines
Compared with regional neighbors such as Malaysia, Thailand, Indonesia and Vietnam, tourism is
underperforming in the Philippines. The average growth rate of tourist arrivals was 9% over 2006-9; this
compares poorly with Indonesia at 13% and Malaysia at 18%. Many factors are contributing to this outcome,
including safety and security concerns, health and hygiene concerns, ineffective branding and marketing,
institutional and regulatory gaps, as well as insufficiently well organized private sector stakeholder policy
input. This case study focuses specifically however on the weaknesses in air transport infrastructure – and

66
even more specifically the gains that might be achieved from liberalizing air transport services, leading to
easier accessibility to the Philippines and lower airfares.
The Philippines offers a potentially attractive holiday destination. The country’s strengths lie in its natural
resources (rank 23rd in the Travel & Tourism Competitiveness Index 2009 in terms of the number of World
Heritage sites), price competitiveness (rank 16th), particularly in hotel prices, low ticket taxes and airport
charges and ease of obtaining a visa (rank 3rd). Nevertheless, tourism export receipts and employment have
flattened over the past two decades and been overtaken in importance by the BPO sector which, following
liberalization of telecommunications, has taken a quantum leap forward (Figure C).
Figure C: Decreasing travel earnings (proxy for tourism) and increasing information and business
services (proxy for BPO sector), as % of services exports
0%
10%
20%
30%
40%
50%
60%
70%
80%
19992000200120022003200420052006200720082009
TravelInformation and business services
Source: Yi (2011)
Slow progress in deregulating air transport services has reduced accessibility: in the absence of fully
implemented open skies agreements, routes are limited and air fares are relatively high. The absence of on-
line one-stop travel portals also generates inconvenience in reserving airline tickets and hotel facilities.
Overall, therefore, the Travel & Tourism Competitiveness Index 2009 ranks the Philippines 86th out of 133
economies, five places behind Indonesia and five places lower than in 2008.
This is despite the fact that Tourism is a designated foreign investment priority; 100% foreign equity
participation is allowed for large hotel development (a 40% foreign equity limit otherwise applies); tourism
enterprises receive 12 year fiscal incentives, and other benefits through the Tourism Infrastructure and
Enterprise Zone Authority including some investment protection and some easing of the restrictions
otherwise applying on visas for foreign personnel and on foreign land ownership and leasing.

67
Weak infrastructure is a big part of the problem. The World Economic Forum’s Global Competitiveness
Index 2009-2010 ranks the Philippines 98th out of 133 countries on Infrastructure. China, PRC ranks 52
places ahead at 46th. The only APEC member that ranks behind the Philippines is Vietnam (111th). The
associated business leaders perception survey ranks “inadequate supply of infrastructure” as the third most
problematic factor for productivity in the Philippines. In Malaysia and Thailand, by contrast, no business
respondents have pointed to poor infrastructure as a source of problems. In addition to ground and air
transportation infrastructure, high energy costs and power outages contribute to the lack of competitiveness,
the average cost of electricity in the Philippines being by far the highest in the ASEAN region.
Figure D sets out a comparison of the Travel & Tourism Competitiveness Index rankings with neighboring
countries with similar natural endowments (Thailand and Indonesia), confirming the Philippines’
performance is most severely constrained by inadequacies in transport infrastructure as well as by lack of
government prioritization of building competitiveness in travel and tourism.
Figure D: The Philippines is lagging in infrastructure and in policy
prioritization of travel and tourism
0
0.2
0.4
0.6
0.8
1
Policy rules and regulations
Environmental sustainability
Safety and security
Health and hygiene
Prioritization of Travel & Tourism
Air transport infrastructure
Ground transport infrastructure
Tourism infrastructure
ICT infrastructure
Price competitiveness in T&T industry
Human resources
Affinity for T&T
Natural resources
Cultural resources
Philippines
Indonesia
Thailand
Source: Yi (2011, forthcoming)
The Philippines certainly scores particularly low in terms of the quality of roads. The Global
Competitiveness Index 2009-2010 ranks the Philippines the lowest in the East Asian Pacific region. The
other major current constraint is air transport. The Travel and Tourism Competitiveness Index for 2009 ranks
Philippines 89th in terms of the quality of air transport infrastructure, far behind Thailand (28th) and
Indonesia (75th). All the international airports require major upgrades if they are to attract a higher number of
number of international arrivals. Ninoy Aquino International Airport in Manila, the main international
gateway, ranks at the bottom among Asian international airports, owing to limited and outdated facilities and

68
poor passenger comfort. The newer second and third terminals are underutilized and incomplete having been
the subject of serious contractual disputes and now require facility upgrades including to link them to each
other.
In addition to inadequacies in the physical infrastructure, the Philippines lags behind other ASEAN members
in achieving open skies. This is important because the academic literature provides ample evidence52 of a
positive and statistically significant effect of air transport liberalization on international passenger flows. In
particular, the literature shows that the greater the degree of liberalization, i.e. Bilateral Air Services
Agreements which provide for the seventh freedom, cabotage, free determination of capacity, free pricing,
multiple designated airlines and multiple destinations, have the most strongly positive impact on passenger
numbers.
The Philippines has acted to deregulate domestic air transport services; and as a result, scores relatively well
on scheduled available domestic seat kilometers (158 million seat kilometers per week in 2008). But its
international seat kilometers are only one-third those of Thailand (355 foreign carrier-flights per week to the
Philippines compared with more than 1000 to Thailand).
The government commenced what was to be a progressive liberalization of Bilateral Air Services
Agreements (BASAs) in 1999, but competition in international air transport services remains limited. The
Philippines scores only 13.1 in the WTO index on openness of bilateral BASAs (0 being most restrictive and
50 the most liberal). Philippine BASAs are relatively restrictive in terms of controls on capacities,
frequencies, designated airlines, fare approvals and tend to limit airlines to third and fourth freedoms only.
The Philippines’ charter arrangements are also restrictive, unless deemed not to significantly interrupt
scheduled services. Cabotage is prohibited. Even though the government theoretically encourages foreign
airlines to operate services to regional airports – Cebu, Davao, and Clark/Subic, they are often subject to
BASAs which inhibit entitlements.
There is no doubt that lack of sufficient progress in opening up air transportation, and airline uncertainty
with respect to the intended pace of reform, has impacted negatively on international seat availability.
Executive Order 500 issued in 2006 increased the number of flights (passengers) to more than 4000
(470,000) in 2006 from less than 500 (50,000) in 2004 by allowing low-cost airlines to serve Diosdado
Macapagal International Airport without limitations on traffic rights, capacity, and air freedom rights. This
order was retracted six months later, as a result of which a number of airlines such as Tiger Airways have cut
back on their flights.
The Philippines is also yet to fully implement ASEAN “open skies” policies. Malaysia and Indonesia
adopted a full fifth freedom agreement to facilitate tourism in the Brunei Darussalam–Indonesia–Malaysia–
Philippines East Asian Growth Area, while the Philippines granted the fifth freedom only to designated
airlines.
52 Yi (2011)

69
The story seems quite clear. For international arrivals to grow, and tourism to really take off, airlines will
need more open access to the market.

70
References
Al-Yrkko, J., Rouvinen, P., Seppala, T. and Yla-Antilla, P., “Who Captures Value in Global Supply Chains”,
ETLA, The Research Institute of the Finnish Economy, 2011
APEC/OECD Integrated Checklist for Regulatory Reform 2005, (retrieved on 28 August, 2011 from
http://www.oecd.org/dataoecd/41/9/34989455.pdf)
APEC Principles for Cross-Border Trade in Services, 2009/AMM/011app05, Singapore, November 12, 2009
APEC Services Action Plan, 2009/AMM/011app04, Singapore, November 12, 2009
Atje, R., and Mugijayani, W, “The Role of Infrastructure-Related Services in Developing APEC Economies:
A Review”, Paper presented at the PECC/ADBI Conference on Services Trade: New Approaches for the 21st
Century, Hong Kong, 1-3 June. Retrieved 28 August, 2011 from
http://www.pecc.org/component/eventlist/details/194-pecc-adbi-services-trade-new-approaches-for-the-21st-
century.
Atje, R., Rahardja, S and Maidir, I “ Development of Indonesia’s Services Industries; Questions Going
Forward”, Indonesian Services Forum, January 13, 2010.
Australian Government, “Australia’s Global Services Network”, Canberra, August 2011 (accessed 16
August, 2011 from www.dfat.gov.au)
Australian Tourism Export Council (2011), Preliminary Draft Report on Medical Tourism for Australian
Tourism Research Advisory Board.
Findlay, C. and Drake-Brockman, J., “An Independent Report of Key Business Messages emerging from
Services Industry Workshops conducted on behalf of the Australian Services Roundtable in November
2010”, ASR, Canberra, March 2010 (accessed on 28 August 2011 from
http://servicesaustralia.co/publications/reports)
Borchert, I., and Matoo, A., “The Crisis-Resilience of Services Trade”, Policy Research Working Paper
4917, The World Bank, April 2009.
Centre for International Economics, “Services Trade Reform: Measuring the Gains”, Canberra, Sept 2010.
Accessed on 1 November, 2010 from www.dfat.gov.au/trade
Chanda, R and Pasadilla, G., “Employment and People-Movement Impacts of Services Trade
Liberalization”, Paper presented at the PECC/ADBI Conference on Services Trade: New Approaches for the
21st Century, Hong Kong, 1-3 June. Retrieved 28 August, 2011 from
http://www.pecc.org/component/eventlist/details/194-pecc-adbi-services-trade-new-approaches-for-the-21st-

71
century.
Cristen, E., Francois, J., and Hoekman, B., “Modelling Policy in Services”, Paper presented at the
PECC/ADBI Conference on Services Trade: New Approaches for the 21st Century, Hong Kong, 1-3 June.
Retrieved 28 August, 2011 from http://www.pecc.org/component/eventlist/details/194-pecc-adbi-services-
trade-new-approaches-for-the-21st-century.
Coalition of Service Industries, United States, “Making the Most of the Doha Opportunity: Benefits from
Services Liberalization”, Washington, July 2006.
Daudin, G., Rifflart, C., Schweisguth, D. (2009), Who produces for whom in the world economy, OFCE, No.
2009-18.
Dee, P. “International Student Movements and the Effects of Barriers to Trade in Higher Education
Services” in
Economist Magazine, “Apple and Samsung's symbiotic relationship: Slicing an Apple; How much of an
iPhone is made by Samsung?” (accessed 10 August 2011 from
http://www.economist.com/blogs/dailychart/2011/08/apple-and-samsungs-symbiotic-relationship)
Findlay, C. and Tierney, W.G.(eds) Globalisation and Tertiary Education in the Asia-Pacific; The Changing
Nature of a Dynamic Market, World Scientific, Feb 2010.
Dee, P., Findlay, C. and Pomfret, R. Trade Facilitation: What, Why, How and Where? 2007.
Donald, B, “Emerging Patterns of Australia’s Linkages with East Asia: A Place in Production Networks”,
paper presented at Workshop on “Emerging Trends and Patterns of Trade and Investment in Asia”, 1-2
February 2008; Global Development Network Conference, Brisbane, 2008.
Drake-Brockman, J., “The Importance of Measuring Mode 3 Services Trade; Some Case Studies from
Australian Business Experience”, ADBI Working Paper 295, 2011. (accessed 28 August 2011 from
http://www.adbi.org/workingpaper/2011/07/12/4641.measuring.delivery.service.australia/)
Findlay, C. (ed), The Impacts and Benefits of Structural Reforms in the Transport, Energy and
Telecommunications Sectors in APEC Economies, Report prepared for the APEC Policy Support Unit. 2011
Fung, V.K., Fung, W.K., and Wind, Y., Competing in a Flat World; Building Enterprises for a Borderless
World”, Wharton School Publishers, New Jersey, 2008

72
Geferri, G., ”Global Value Chain Analysis and its Implications for Measuring Global Trade”, Presentation at
the Global Forum on Trade Statistics Measuring Global Trade- do we have the right numbers?, Geneva
Switzerland, 2, February 2011.
Ghani, E., and Kharas, H., ”The Service Revolution”, in Economic Premise, number 14, World Bank, May
2010.
Ghani, E., Grover, A., Kharas, H., ”Service with a smile: A new growth engine for poor countries”, 4 May,
2011 VoxEU.org
Global Services Coalition, “Services and Economic Development”, September 22, 2010. (accessed on 1
November 2010 from http://www.esf.be/new/wp-content/uploads/2010/09/GSC-Statement-on-Development-
FINAL.pdf)
Gootiiz, S., and Mattoo, A. “Services in Doha: What’s on the table?” Policy Research Working Paper No.
4903, The World Bank. 2009
Hong Kong General Chamber of Commerce, “Service Sector in Hong Kong” Statistical Card 2011
IMF, System of National Accounts, 2008
IMF, Balance of Payments and International Investment Position Manual, 6th edition
ITS Global, “Services International Linkages; The importance of embodied services in trade and paths to
increased trade”, Canberra, November 2010 (accessed 28 August from
http://www.dfat.gov.au/publications/trade/Services-International-Linkages.pdf)
International Trade Commission (2011), “U.S. Multinational Services Companies: Effects of Foreign
Affiliate Activity on U.S. Employment”, Office of Industries Working Paper, Washington, DC. August 2011
Jensen, J. Bradford, Global Trade in Services: Fear, Facts, and Offshoring, Peterson Institute, Washington
DC, September 2011
Magdeleine, J., and Maurer, A., Measuring GATS Mode 4 Trade Flows. Staff Working Paper ERSD-2008-
05. Geneva: WTO. 2008
Mamdouh, H. “Services Liberalization, Negotiations and Regulation”, revised paper prepared for the
PECC/ADBI Conference on Services Trade: New Approaches for the 21st Century, Hong Kong, 1-3 June.
Retrieved 28 August, 2011 from http://www.pecc.org/component/eventlist/details/194-pecc-adbi-services-
trade-new-approaches-for-the-21st-century.

73
Maurer, A., and Tschang, T.F., “An Exploratory Framework for Measuring Services Value-added”, Paper
presented at the PECC/ADBI Conference on Services Trade: New Approaches for the 21st Century, Hong
Kong, 1-3 June. Retrieved 28 August, 2011 from http://www.pecc.org/component/eventlist/details/194-pecc-
adbi-services-trade-new-approaches-for-the-21st-century.
McCredie, A., Soderbaum, J., Drake-Brockman,J., Kelly, P., Chou, Y., Taborda, R., and Hodges, R. The
New Economic Challenge: Responding to the Rise of Services in the Australian Economy. Australian
Services Roundtable and ACIL Tasman, Canberra 2010.
Miroudot, S., Sauvage, J., and Shepherd, B. “Measuring the cost of international trade in services”, Working
Paper, GEM Sciences Po. 2010
Mishra, S., Lundstrom, S., and Anand, R., ”Sophistication in Service Exports and Economic Growth”, in
Economic Premise, number 55 World Bank, April 2011.
Nguyen-Hong, D., “Restrictions on Trade in Professional Services”, Staff Research Paper, Australian
Productivity Commission, Commonwealth of Australia, 2000.
OECD, OECD Science, Technology and Industry: Scoreboard 2005, Paris, 2005.
Pacific Economic Cooperation Council, State of the Region 2011-2012, September 2011.
Pacific Economic Cooperation Council-Asian Development Bank Institute, Draft Services Taskforce Report
“Strategies to Enhance Competitiveness and Facilitate Regional Trade and Investment in Services”,
September 2011 (APEC Document 2011/SOM3/GOS/023, submitted by PECC to the 46th Group on Services
Meeting, San Francisco, 16 September 2011)
Pasadilla, G, “Production Fragmentation and Trade Policies; Some Global Trends”, Presentation to APEC
Senior Officials Policy Dialogue, Adelaide, 27 April, 2007
Saez, S., “Exporting Services: A Developing Country Perspective”, Paper presented at the PECC/ADBI
Conference on Services Trade: New Approaches for the 21st Century, Hong Kong, 1-3 June. Retrieved 28
August, 2011 from http://www.pecc.org/component/eventlist/details/194-pecc-adbi-services-trade-new-
approaches-for-the-21st-century <http://www.pecc.org/component/eventlist/details/194-pecc-adbi-services-
trade-new-approaches-for-the-21st-century>
Shepherd, B. and Van Der Marel, E. Trade in services in the APEC region: Patterns, determinants, and
policy implications, Report prepared for the APEC Policy Support Unit. 2010
Tcha, M., “Determinants of Competitiveness and Factors Affecting Productivity in Services”, Paper
presented at the PECC/ADBI Conference on Services Trade: New Approaches for the 21st Century, Hong
Kong, 1-3 June. Retrieved 28 August, 2011 from http://www.pecc.org/component/eventlist/details/194-pecc-

74
adbi-services-trade-new-approaches-for-the-21st-century
<http://www.pecc.org/component/eventlist/details/194-pecc-adbi-services-trade-new-approaches-for-the-
21st-century>
UNCTAD. World Investment Report 2004: The Shift Towards Services. (accessed March 2010 from
http://www.unctad.org/en/docs/wir2004_en.pdf).
UNCTAD. World Investment Report 2009: Transnational Corporations, Agricultural Production and
Development. (accessed August 2010 from http://www.unctad.org/en/docs/wir2009_en.pdf)
UNSC. Manual on Statistics for International Trade in Services (MSITS 2002). Geneva, Luxembourg, New
York, Paris, Washington, DC: UNSC. 2002
UNSC. Manual on Statistics for International Trade in Services (MSITS 2010). Geneva, Luxembourg, New
York, Paris, Washington, DC: UNSC. 2010. (accessed 3 Sept 2010 from
http://unstats.un.org/unsd/statcom/doc10/BG-MSITS2010.pdf)
World Bank, Services Trade for Development, International Trade Department, Poverty Reduction and
Economic Management Anchor, November 13, 200
WTO (2009). International Trade Statistics 2009, WTO, Geneva
WTO (2011). Trade Patterns and Global Value Chains in East Asia: From Trade in Goods to Trade in Tasks,
WTO, Geneva
Xing, Y and Detert, N, “How the iphone widens the United States Trade Deficit with the People’s Republic
of China”, ADBI Working Paper 257, December 2010.
Yi, S., “Policy and Regulatory Priorities for Developing Efficient Services Industries”, Paper presented at the
PECC/ADBI Conference on Services Trade: New Approaches for the 21st Century, Hong Kong, 1-3 June.
Retrieved 28 August, 2011 from http://www.pecc.org/component/eventlist/details/194-pecc-adbi-services-
trade-new-approaches-for-the-21st-century.
Yi, S., “Reaching the World through Private Sector Initiative: Services Exports for the Philippines”, Draft
Chapter for the World Bank, forthcoming, 2011.
Ying, Fan. “China’s Liberalization of Trade in Distribution Services”, paper prepared for ADBI/UNESCAP-
ARTNet Conference on Regulatory Reforms and liberalization in Services: Examining Impacts on Inclusive
and Sustainable Development”, Bali, October 2010, publication forthcoming.