Embed Size (px)
Citation preview
OPERATİONS & LOGİSTİCS MANAGEMENT İN AİR TRANSPORTATİON
PROFESSOR DAVİD GİLLEN (UNİVERSİTY OF BRİTİSH COLUMBİA )&PROFESSOR BENNY MANTİN (UNİVERSİTY OF WATERLOO)
Air Transportation Systems and Infrastructure
Strategic Planning
Module 2-3 : 9-10 June 2014
Istanbul Technical University
Air Transportation Management
M.Sc. Program
UNDERSTANDİNG PROCESSES
2
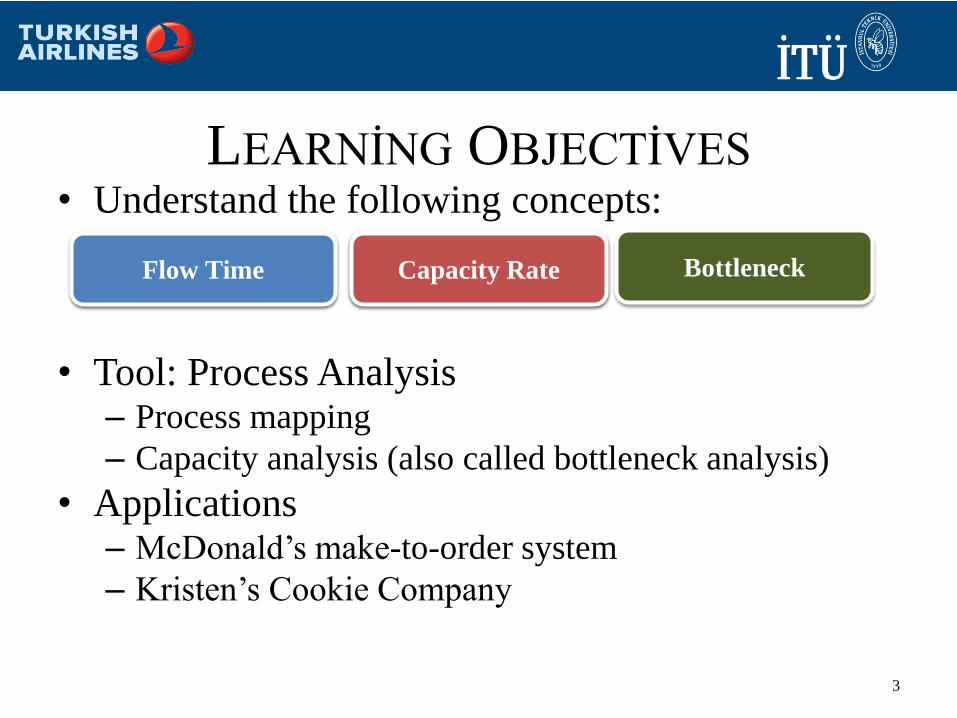
LEARNİNG OBJECTİVES• Understand the following concepts:
• Tool: Process Analysis– Process mapping
– Capacity analysis (also called bottleneck analysis)
• Applications– McDonald’s make-to-order system
– Kristen’s Cookie Company
3
Flow Time BottleneckCapacity RateFlow Time Capacity Rate
4
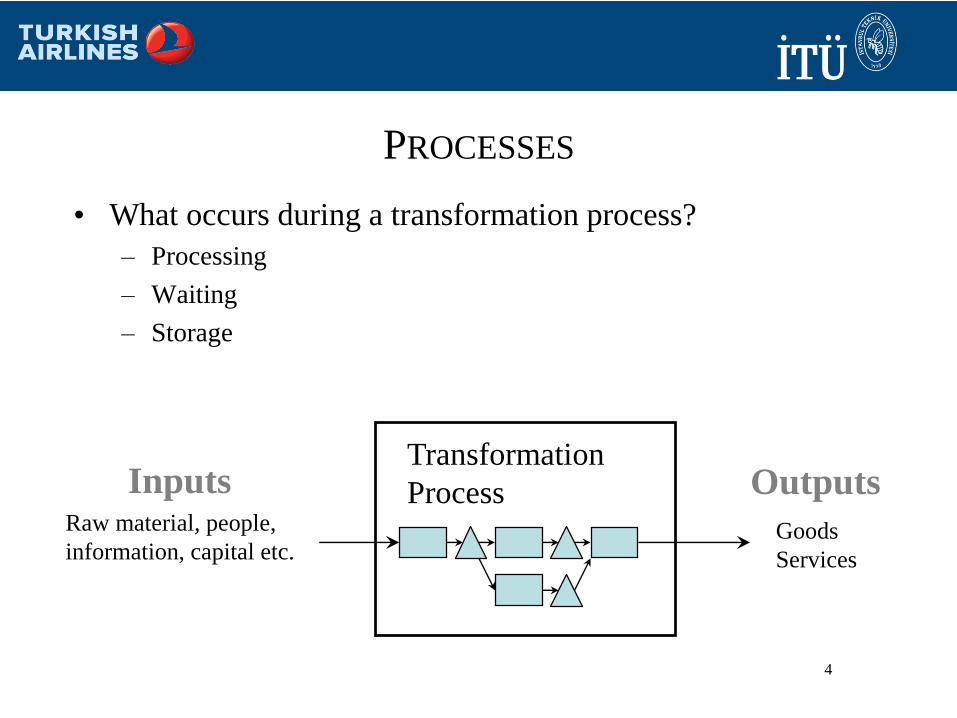
PROCESSES
• What occurs during a transformation process?
– Processing
– Waiting
– Storage
Inputs Outputs
Goods
Services
Raw material, people,
information, capital etc.
Transformation
Process
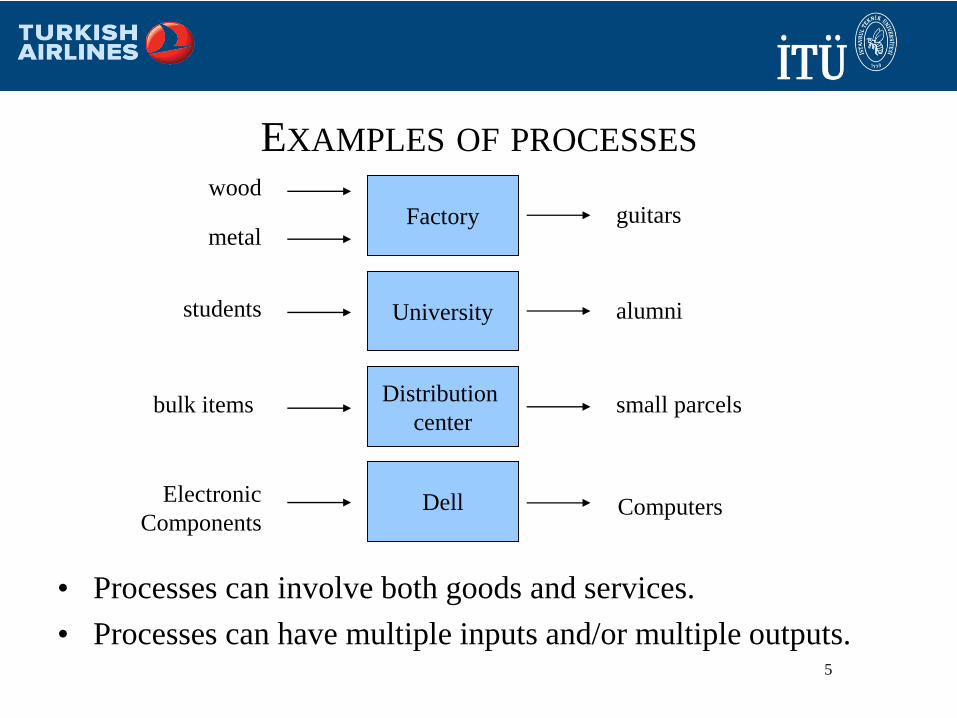
EXAMPLES OF PROCESSES
Factory
wood
metalguitars
Universitystudents alumni
Distribution
centerbulk items small parcels
DellElectronic
ComponentsComputers
• Processes can involve both goods and services.
• Processes can have multiple inputs and/or multiple outputs.5
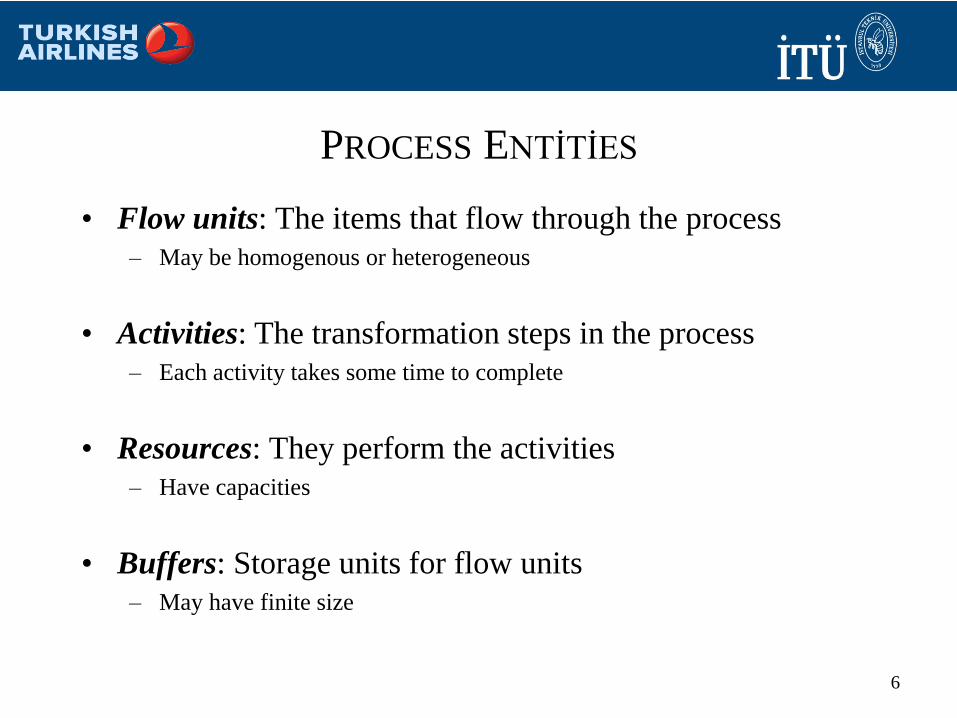
PROCESS ENTİTİES
• Flow units: The items that flow through the process
– May be homogenous or heterogeneous
• Activities: The transformation steps in the process
– Each activity takes some time to complete
• Resources: They perform the activities
– Have capacities
• Buffers: Storage units for flow units
– May have finite size
6
Packed
Bread
Finished
Bread
Raw
Material
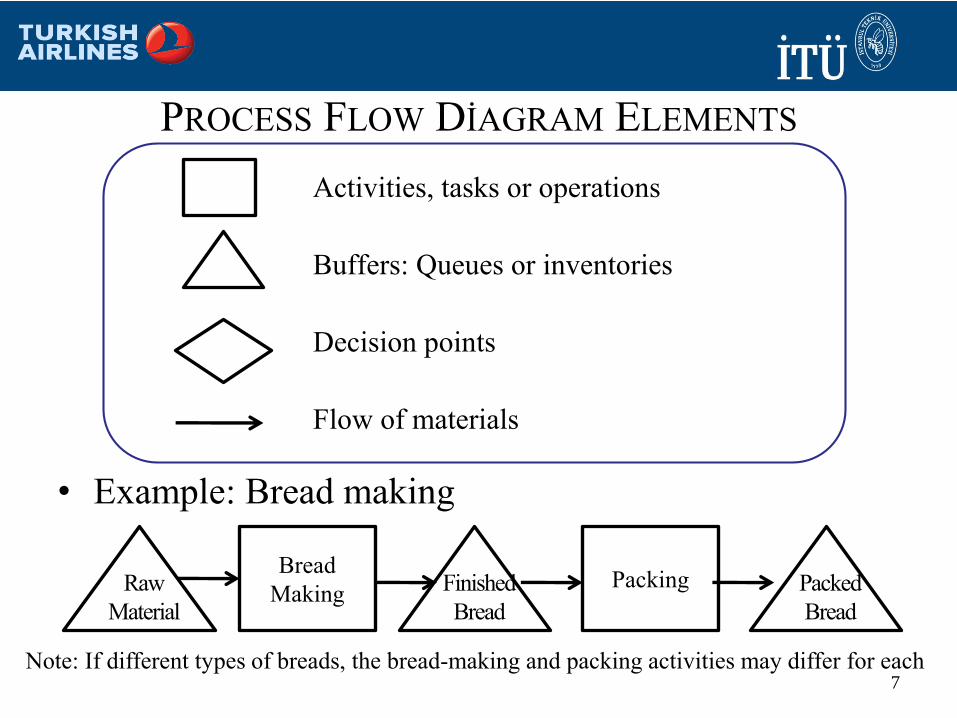
PROCESS FLOW DİAGRAM ELEMENTS
Activities, tasks or operations
Buffers: Queues or inventories
Decision points
Flow of materials
7
• Example: Bread making
Note: If different types of breads, the bread-making and packing activities may differ for each
Bread
MakingPacking
8
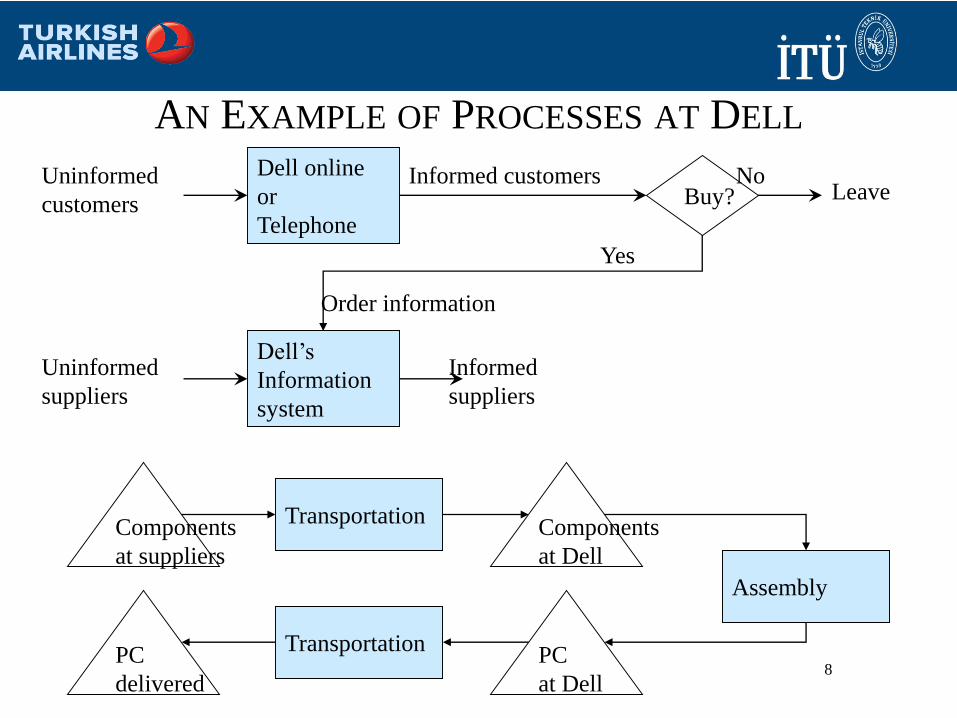
AN EXAMPLE OF PROCESSES AT DELL
Dell’s
Information
system
Dell online
or
Telephone
Uninformed
customers
Informed customersBuy?
Uninformed
suppliers
Informed
suppliers
No
Yes
Leave
Order information
TransportationComponents
at suppliers
Components
at Dell
Assembly
TransportationPC
delivered
PC
at Dell
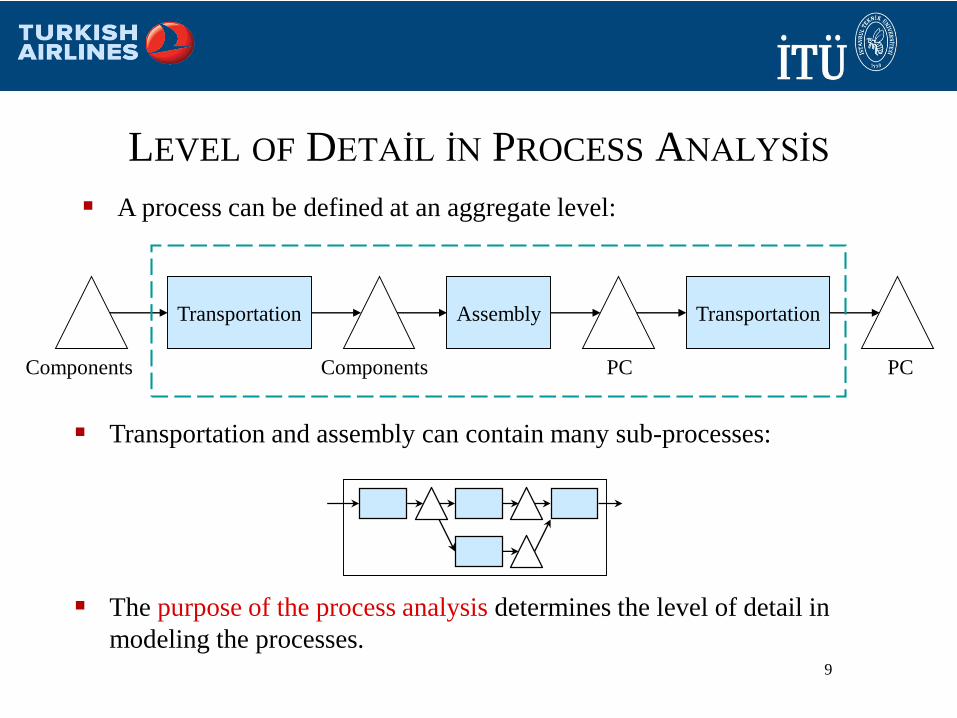
LEVEL OF DETAİL İN PROCESS ANALYSİS
9
Transportation Assembly Transportation
Components Components PC PC
Transportation and assembly can contain many sub-processes:
The purpose of the process analysis determines the level of detail in
modeling the processes.
A process can be defined at an aggregate level:
10
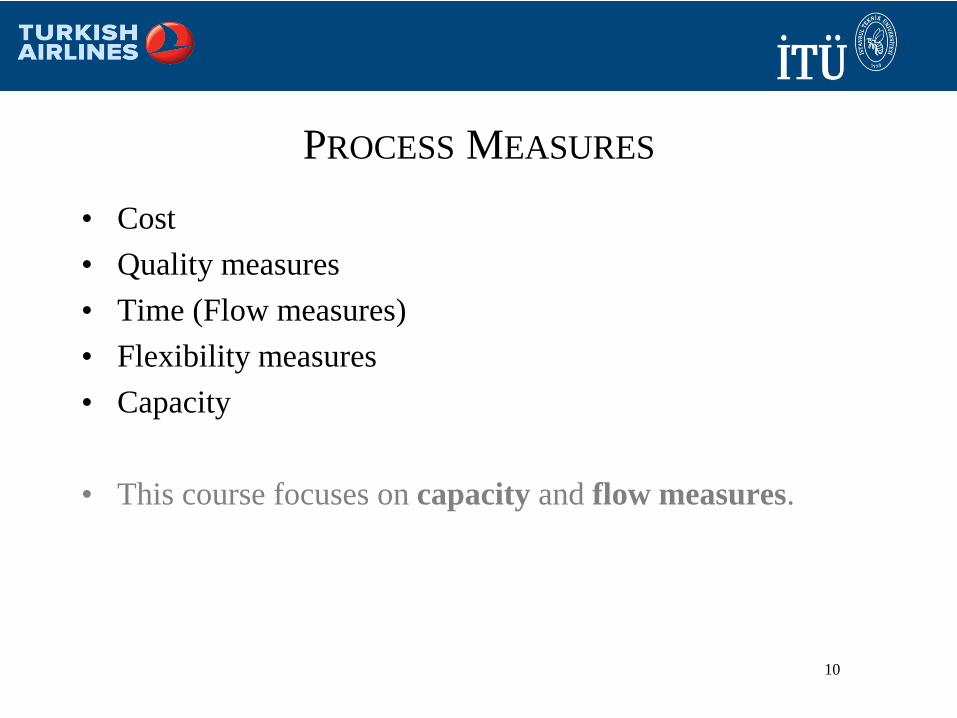
PROCESS MEASURES
• Cost
• Quality measures
• Time (Flow measures)
• Flexibility measures
• Capacity
• This course focuses on capacity and flow measures.
11
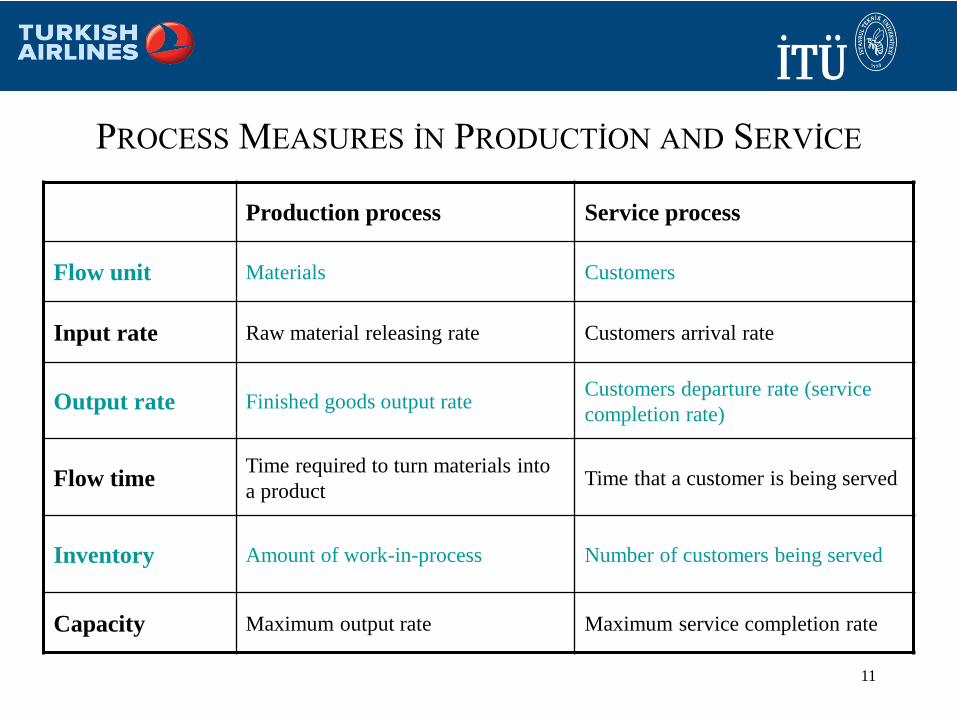
PROCESS MEASURES İN PRODUCTİON AND SERVİCE
Production process Service process
Flow unit Materials Customers
Input rate Raw material releasing rate Customers arrival rate
Output rate Finished goods output rateCustomers departure rate (service
completion rate)
Flow timeTime required to turn materials into
a productTime that a customer is being served
Inventory Amount of work-in-process Number of customers being served
Capacity Maximum output rate Maximum service completion rate
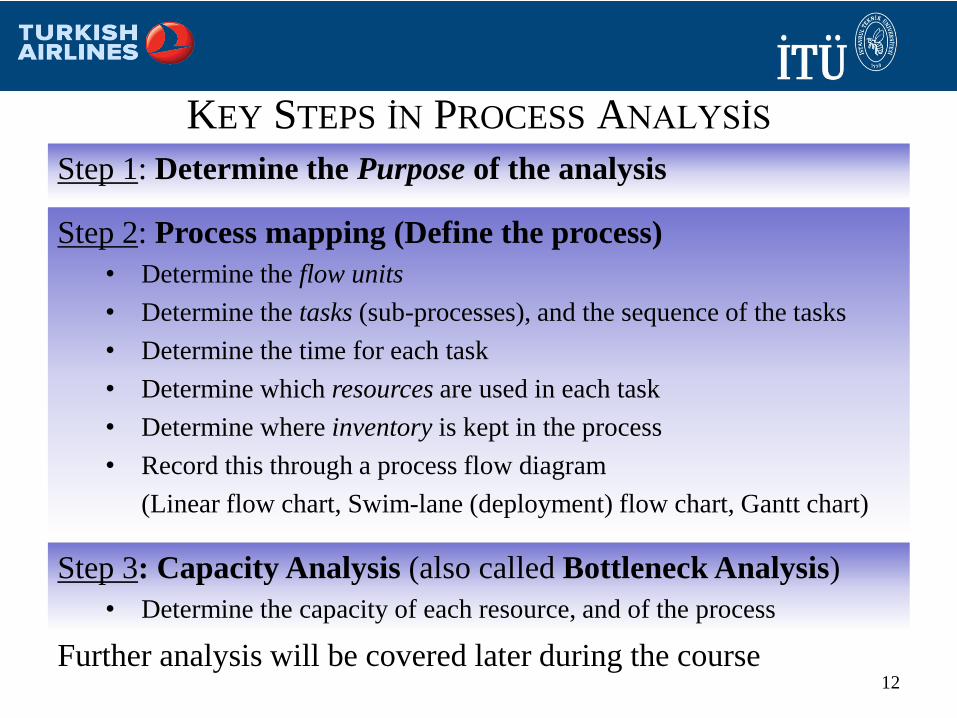
KEY STEPS İN PROCESS ANALYSİS
Step 1: Determine the Purpose of the analysis
12
Step 2: Process mapping (Define the process)
• Determine the flow units
• Determine the tasks (sub-processes), and the sequence of the tasks
• Determine the time for each task
• Determine which resources are used in each task
• Determine where inventory is kept in the process
• Record this through a process flow diagram
(Linear flow chart, Swim-lane (deployment) flow chart, Gantt chart)
Step 3: Capacity Analysis (also called Bottleneck Analysis)
• Determine the capacity of each resource, and of the process
Further analysis will be covered later during the course
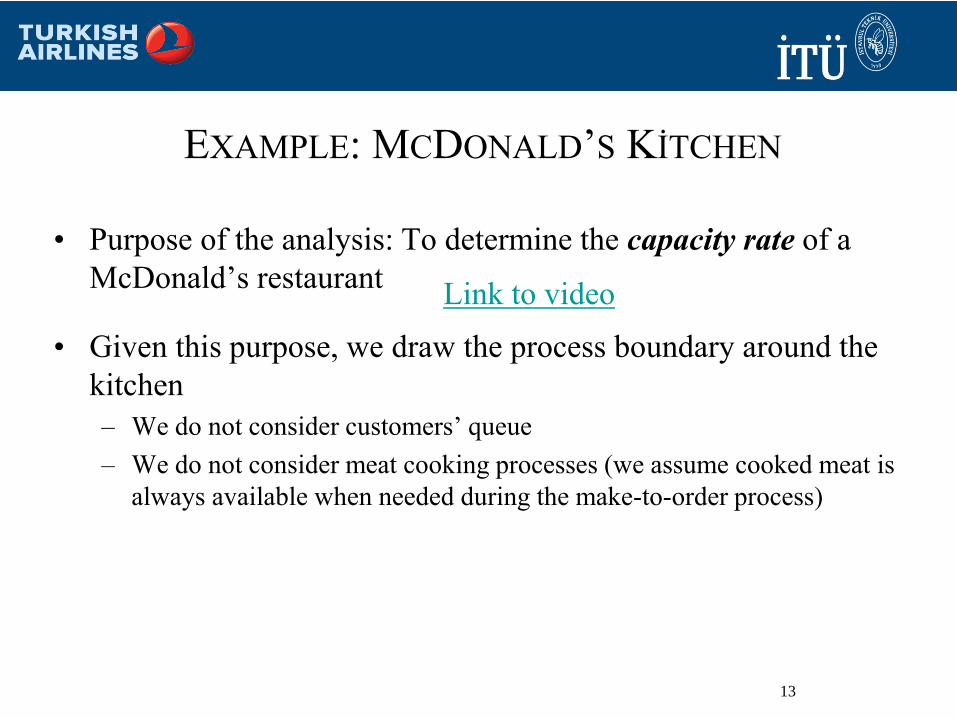
EXAMPLE: MCDONALD’S KİTCHEN
• Purpose of the analysis: To determine the capacity rate of a
McDonald’s restaurant
• Given this purpose, we draw the process boundary around the
kitchen
– We do not consider customers’ queue
– We do not consider meat cooking processes (we assume cooked meat is
always available when needed during the make-to-order process)
13
Link to video
14
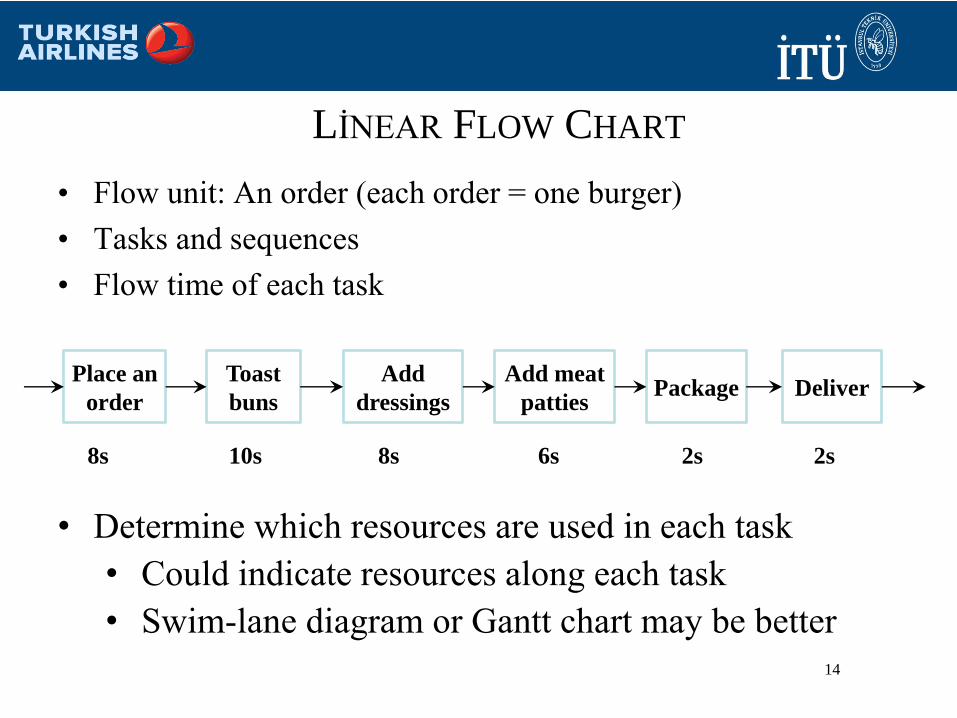
LİNEAR FLOW CHART
• Flow unit: An order (each order = one burger)
• Tasks and sequences
• Flow time of each task
• Determine which resources are used in each task
• Could indicate resources along each task
• Swim-lane diagram or Gantt chart may be better
Toast
buns
Add
dressings
Add meat
pattiesPackage Deliver
Place an
order
8s 10s 8s 6s 2s 2s
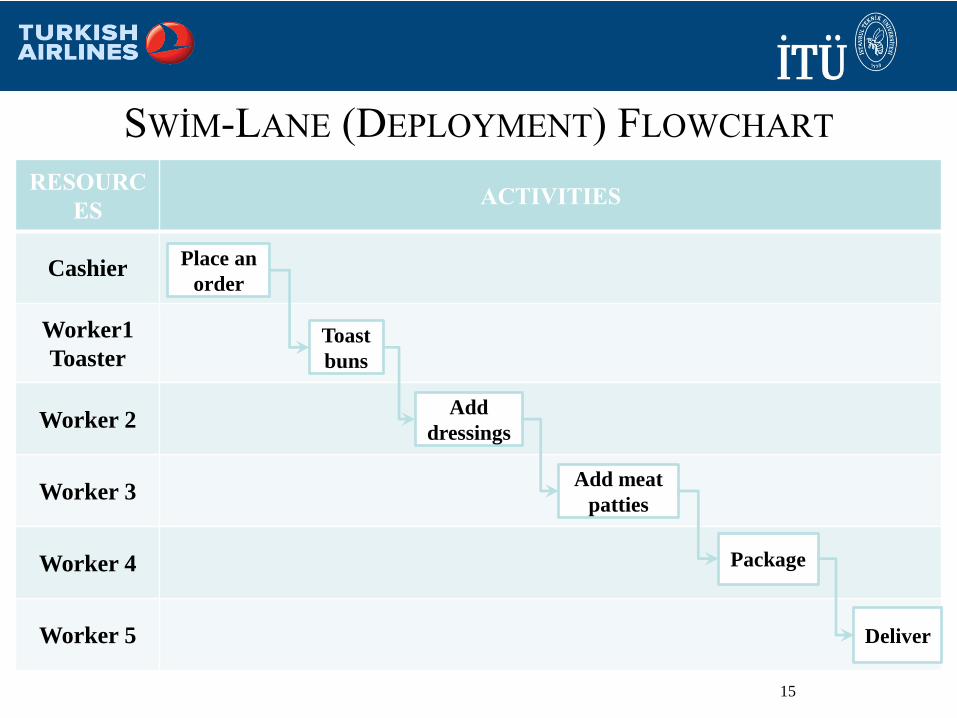
SWİM-LANE (DEPLOYMENT) FLOWCHART
15
RESOURC
ESACTIVITIES
Cashier
Worker1
Toaster
Worker 2
Worker 3
Worker 4
Worker 5
Toast
buns
Add
dressings
Add meat
patties
Package
Deliver
Place an
order
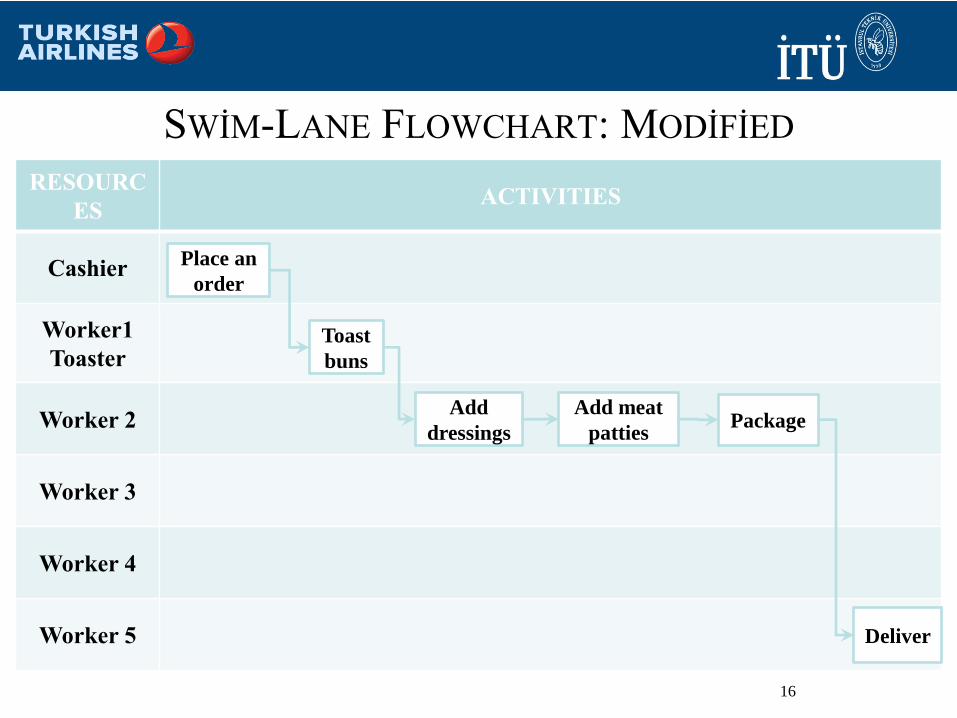
SWİM-LANE FLOWCHART: MODİFİED
16
RESOURC
ESACTIVITIES
Cashier
Worker1
Toaster
Worker 2
Worker 3
Worker 4
Worker 5
Toast
buns
Add
dressings
Add meat
pattiesPackage
Deliver
Place an
order
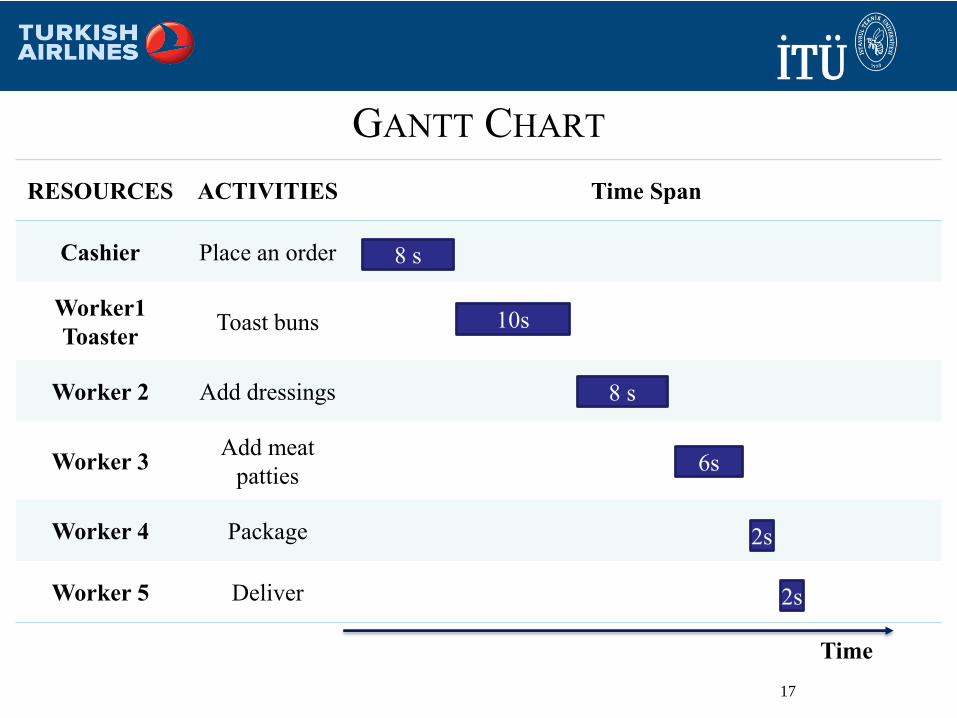
GANTT CHART
17
RESOURCES ACTIVITIES Time Span
Cashier Place an order
Worker1
ToasterToast buns
Worker 2 Add dressings
Worker 3Add meat
patties
Worker 4 Package
Worker 5 Deliver
Time
10s
8 s
6s
2s
8 s
2s
18
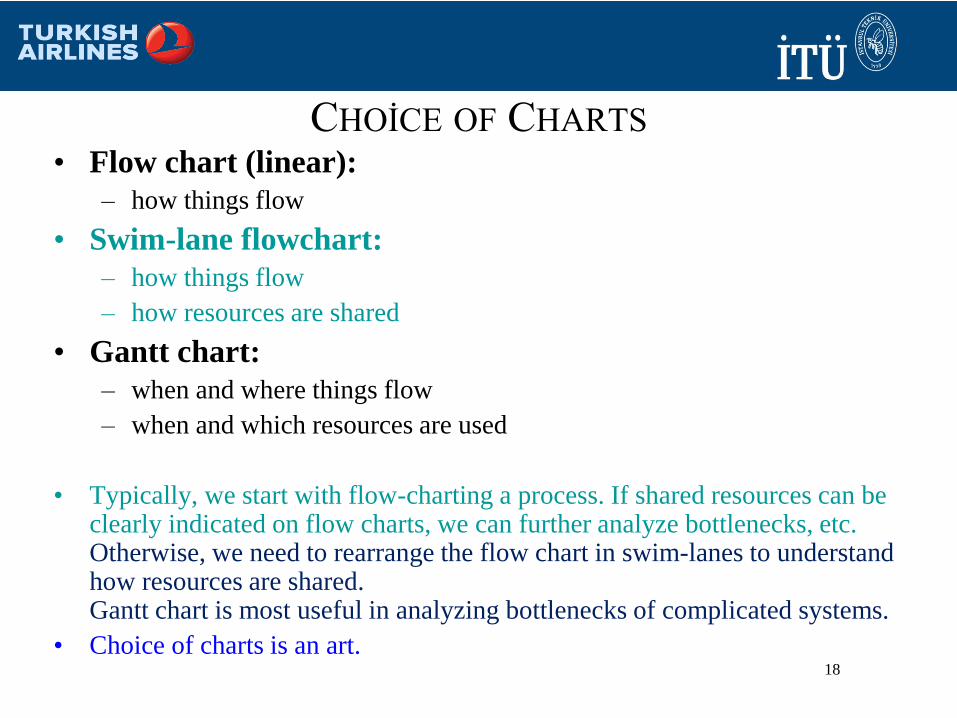
CHOİCE OF CHARTS
• Flow chart (linear):
– how things flow
• Swim-lane flowchart:
– how things flow
– how resources are shared
• Gantt chart:
– when and where things flow
– when and which resources are used
• Typically, we start with flow-charting a process. If shared resources can be clearly indicated on flow charts, we can further analyze bottlenecks, etc. Otherwise, we need to rearrange the flow chart in swim-lanes to understand how resources are shared. Gantt chart is most useful in analyzing bottlenecks of complicated systems.
• Choice of charts is an art.
PROCESS MAPPİNG: SOME NOTES
• There is no one way to draw a process map
• Get feedback from all the people involved in the
process to validate the process map
Do not map the process as you think it works
Map it as it actually works
• Process maps are surprisingly informative
Common response: “I never knew we did it that
way!”
• Starting point for process analysis, and a great tool
for brainstorming process improvements
20
21
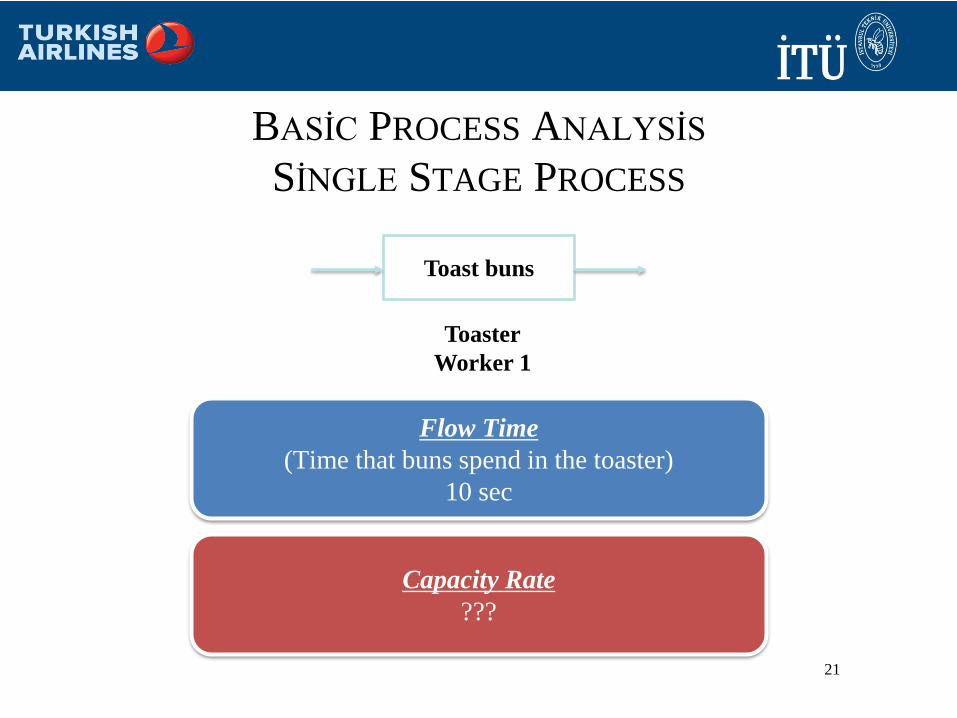
BASİC PROCESS ANALYSİS
SİNGLE STAGE PROCESS
Toast buns
Toaster
Worker 1
Capacity Rate
???
Flow Time
(Time that buns spend in the toaster)
10 sec
22
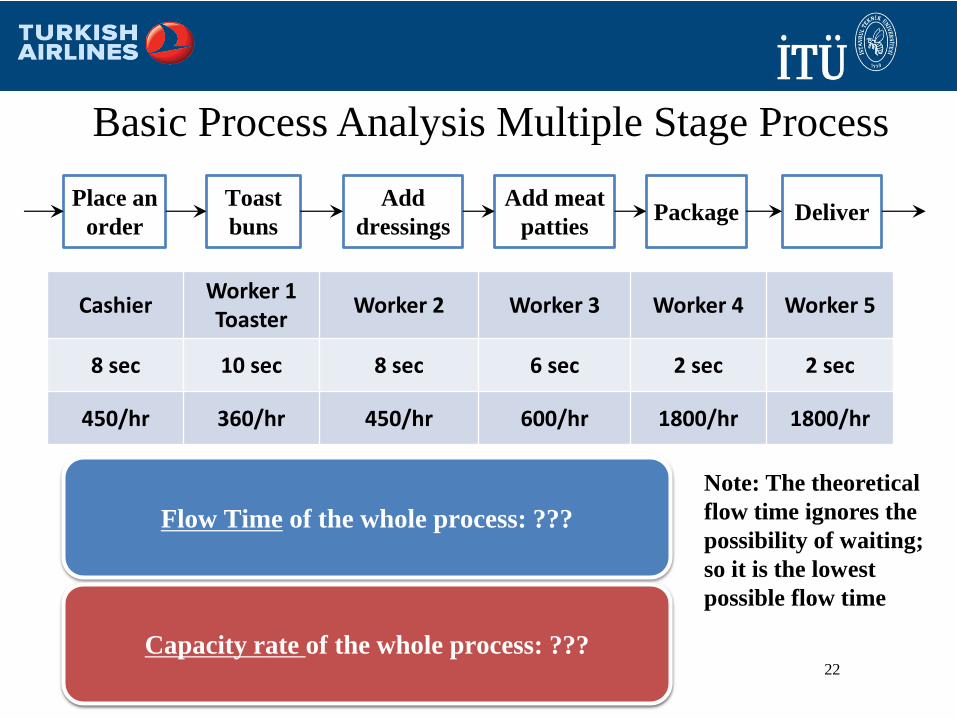
Basic Process Analysis Multiple Stage Process
Toast
buns
Add
dressings
Add meat
pattiesPackage Deliver
Place an
order
CashierWorker 1Toaster
Worker 2 Worker 3 Worker 4 Worker 5
8 sec 10 sec 8 sec 6 sec 2 sec 2 sec
450/hr 360/hr 450/hr 600/hr 1800/hr 1800/hr
Theoretical Flow Time of the whole process: 36
sec
Note: The theoretical
flow time ignores the
possibility of waiting;
so it is the lowest
possible flow time
Capacity rate of the whole process: 360 orders/hr
Flow Time of the whole process: ???
Capacity rate of the whole process: ???
23
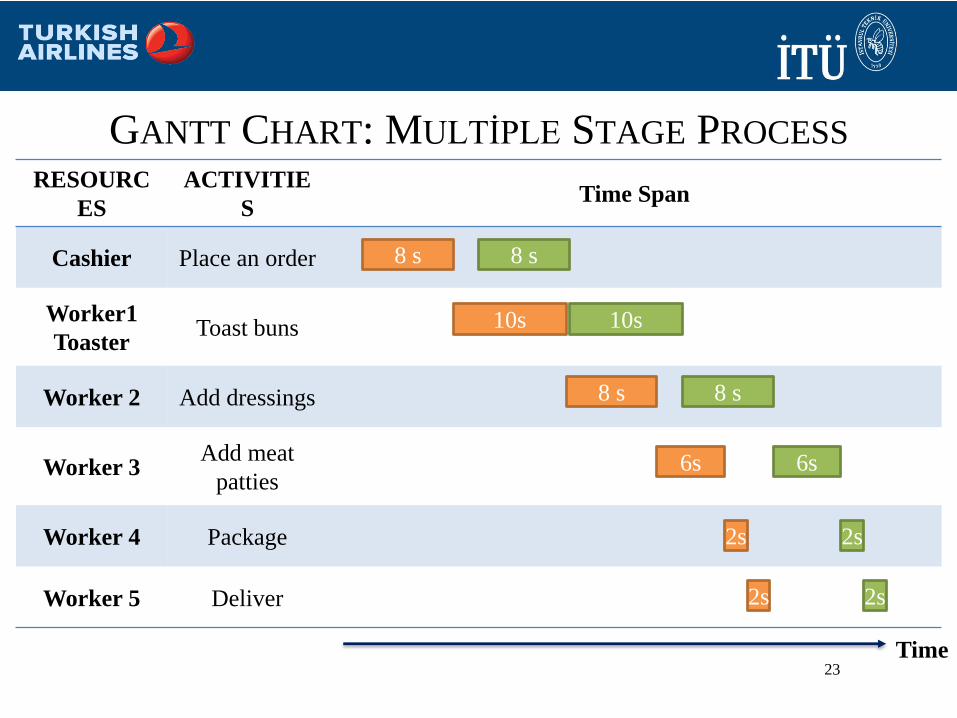
GANTT CHART: MULTİPLE STAGE PROCESS
RESOURC
ES
ACTIVITIE
STime Span
Cashier Place an order
Worker1
ToasterToast buns
Worker 2 Add dressings
Worker 3Add meat
patties
Worker 4 Package
Worker 5 Deliver
Time
10s
8 s
6s
2s
8 s
2s
10s
8 s
6s
2s
8 s
2s
24
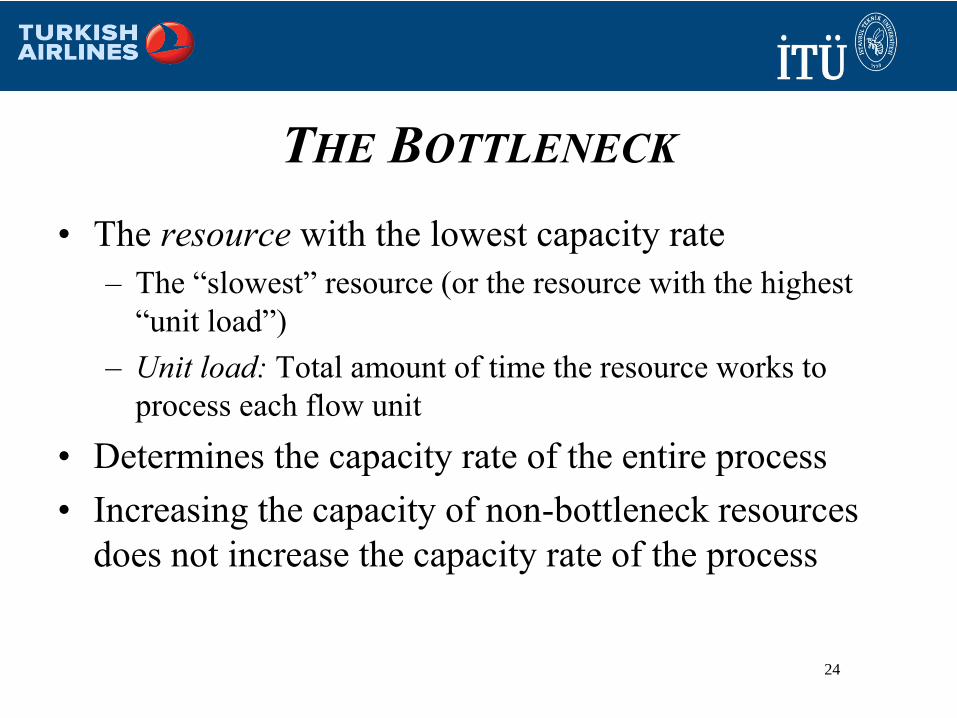
THE BOTTLENECK
• The resource with the lowest capacity rate
– The “slowest” resource (or the resource with the highest
“unit load”)
– Unit load: Total amount of time the resource works to
process each flow unit
• Determines the capacity rate of the entire process
• Increasing the capacity of non-bottleneck resources
does not increase the capacity rate of the process
25
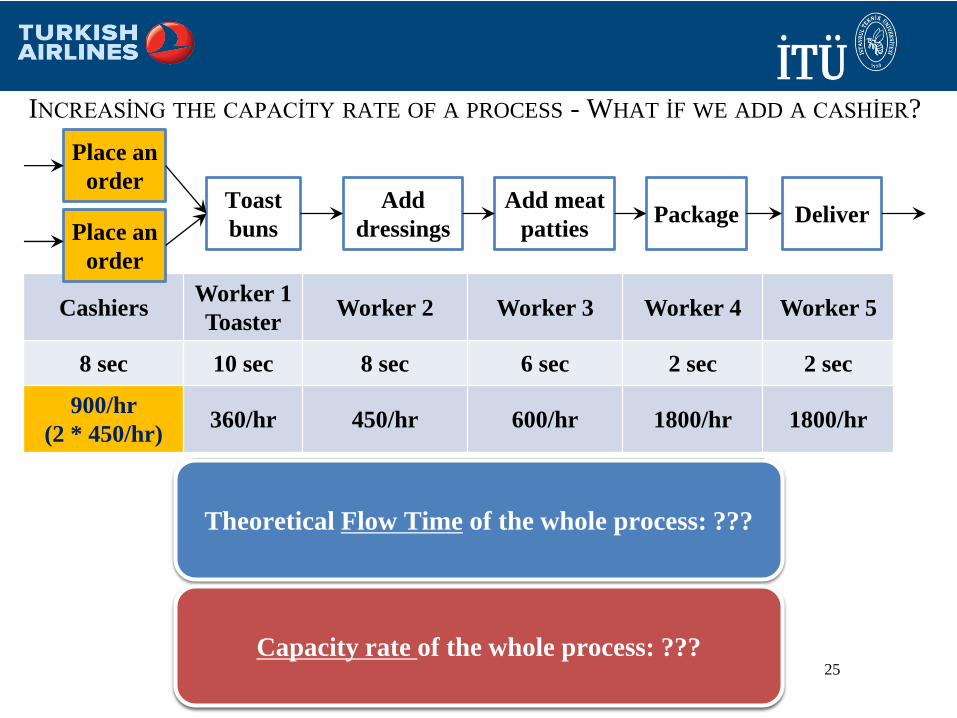
INCREASİNG THE CAPACİTY RATE OF A PROCESS - WHAT İF WE ADD A CASHİER?
Toast
buns
Add
dressings
Add meat
pattiesPackage Deliver
Place an
order
CashiersWorker 1
ToasterWorker 2 Worker 3 Worker 4 Worker 5
8 sec 10 sec 8 sec 6 sec 2 sec 2 sec
900/hr
(2 * 450/hr)360/hr 450/hr 600/hr 1800/hr 1800/hr
Theoretical Flow Time of the whole process: 36
sec
Capacity rate of the whole process: 360 orders/hr
Theoretical Flow Time of the whole process: ???
Capacity rate of the whole process: ???
Place an
order
26
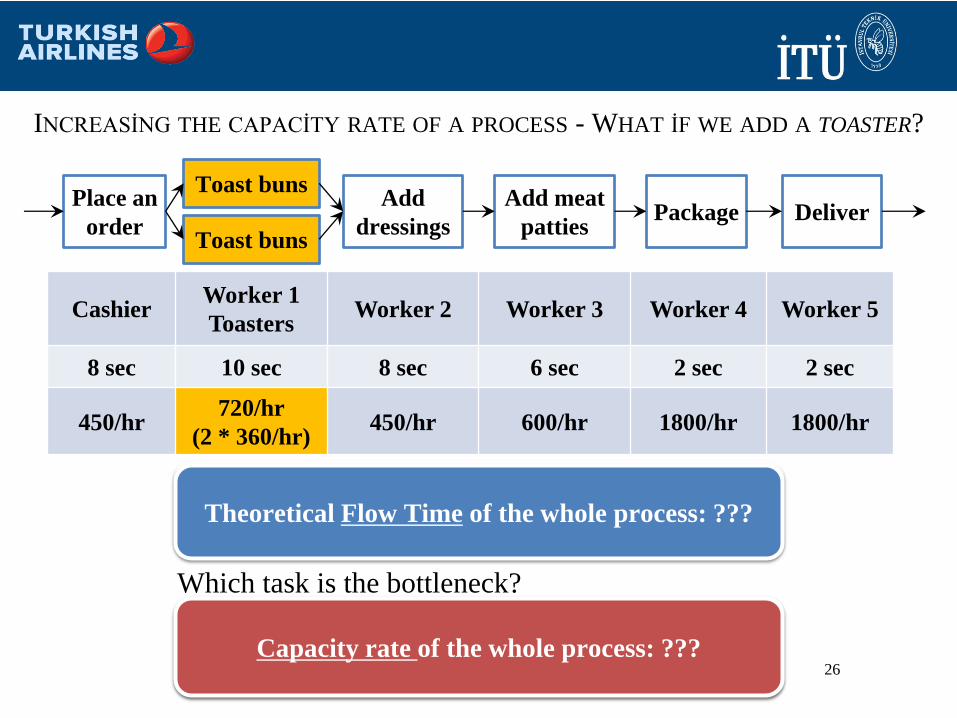
INCREASİNG THE CAPACİTY RATE OF A PROCESS - WHAT İF WE ADD A TOASTER?
Capacity rate of the whole process: 450 orders/hrCapacity rate of the whole process: ???
Toast bunsAdd
dressings
Add meat
pattiesPackage Deliver
Place an
order
CashierWorker 1
ToastersWorker 2 Worker 3 Worker 4 Worker 5
8 sec 10 sec 8 sec 6 sec 2 sec 2 sec
450/hr720/hr
(2 * 360/hr)450/hr 600/hr 1800/hr 1800/hr
Theoretical Flow Time of the whole process: 36 secTheoretical Flow Time of the whole process: ???
Toast buns
Which task is the bottleneck?
27
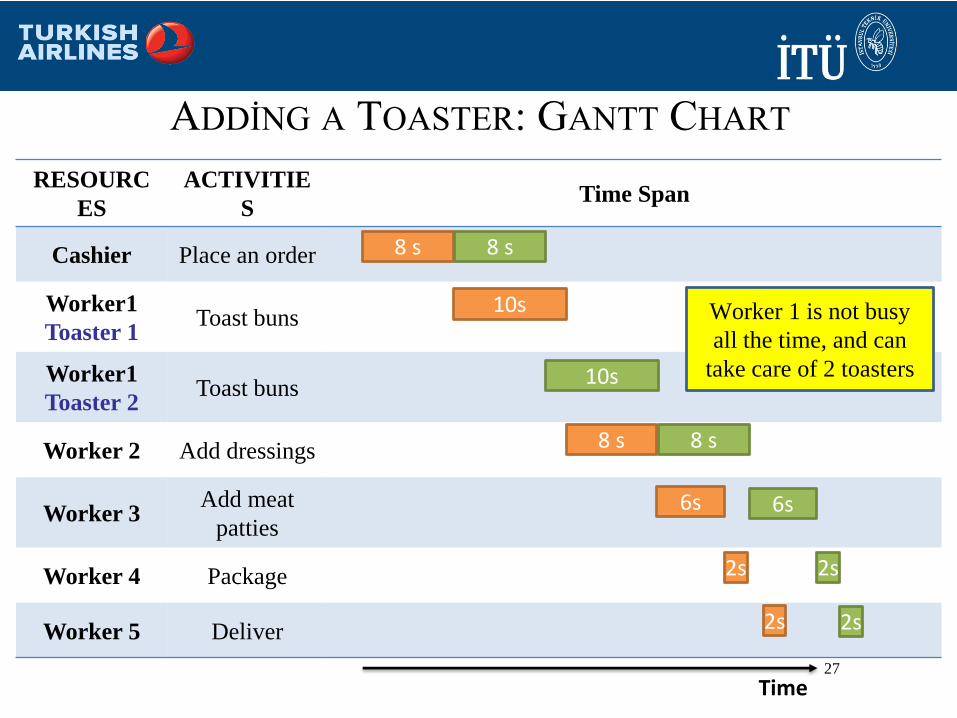
ADDİNG A TOASTER: GANTT CHART
RESOURC
ES
ACTIVITIE
STime Span
Cashier Place an order
Worker1
Toaster 1Toast buns
Worker1
Toaster 2Toast buns
Worker 2 Add dressings
Worker 3Add meat
patties
Worker 4 Package
Worker 5 Deliver
Time
10s
8 s
6s
2s
8 s
2s
10s
8 s
6s
2s
8 s
2s
Worker 1 is not busy
all the time, and can
take care of 2 toasters
28
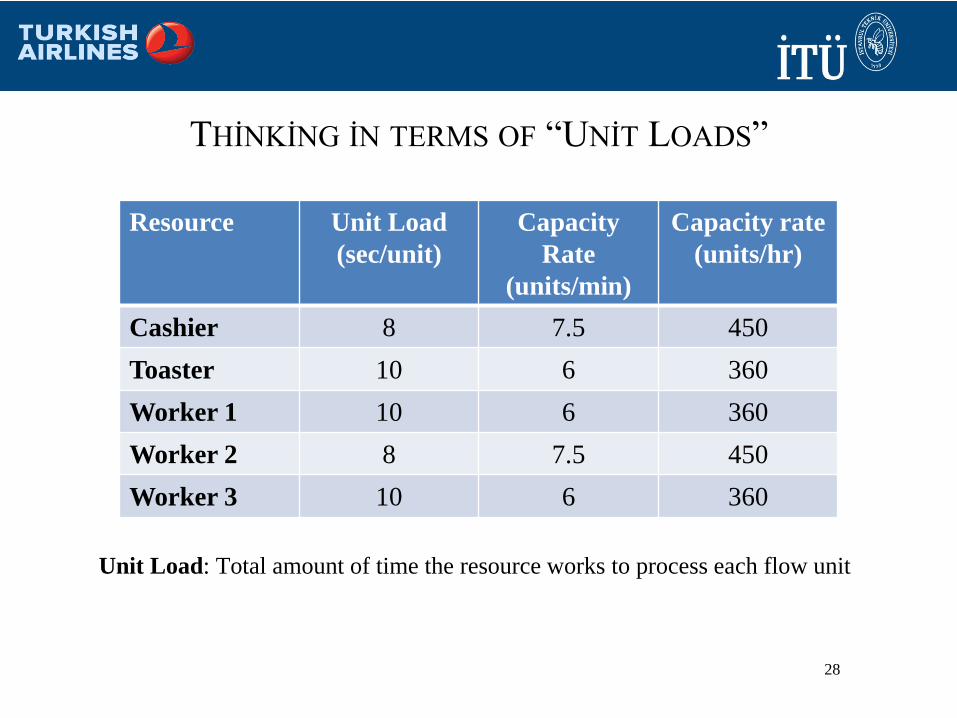
THİNKİNG İN TERMS OF “UNİT LOADS”
Unit Load: Total amount of time the resource works to process each flow unit
Resource Unit Load
(sec/unit)
Capacity
Rate
(units/min)
Capacity rate
(units/hr)
Cashier 8 7.5 450
Toaster 10 6 360
Worker 1 10 6 360
Worker 2 8 7.5 450
Worker 3 10 6 360
29
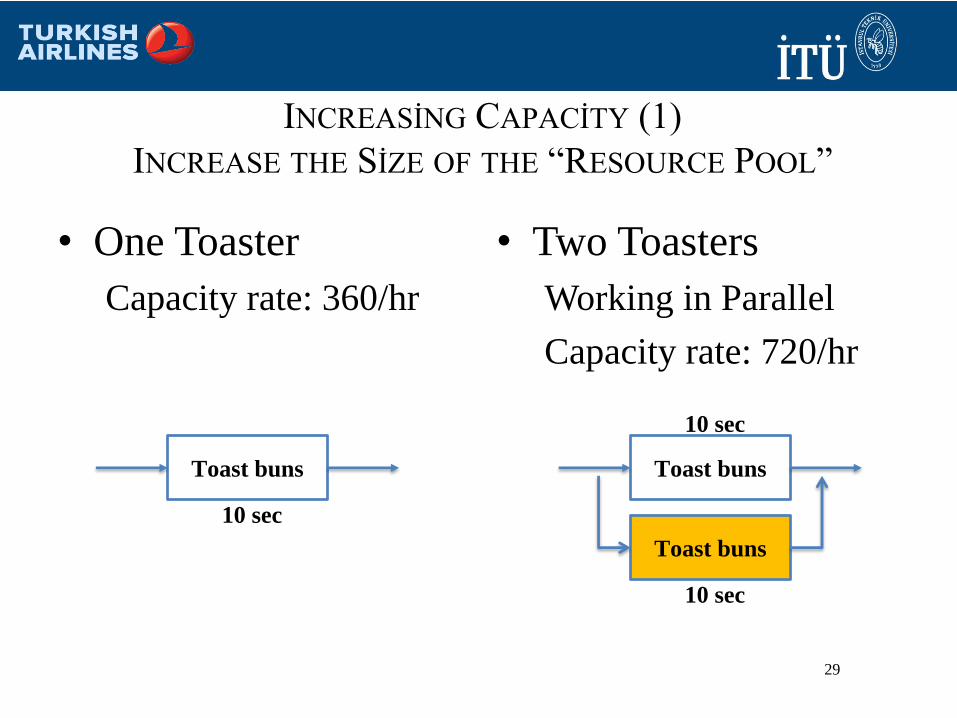
INCREASİNG CAPACİTY (1)
INCREASE THE SİZE OF THE “RESOURCE POOL”
• One Toaster
Capacity rate: 360/hr
• Two Toasters
Working in Parallel
Capacity rate: 720/hr
Toast buns
10 sec
Toast buns
10 sec
Toast buns
10 sec
30
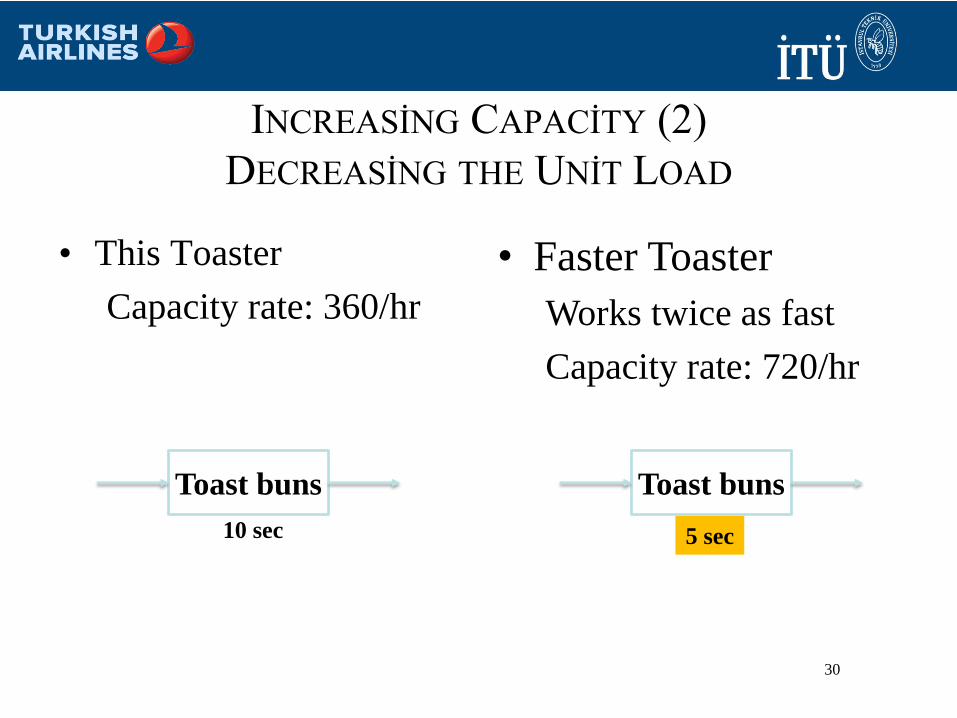
INCREASİNG CAPACİTY (2)
DECREASİNG THE UNİT LOAD
• This Toaster
Capacity rate: 360/hr
• Faster Toaster
Works twice as fast
Capacity rate: 720/hr
Toast buns
10 sec
Toast buns
5 sec
31
INCREASİNG THE CAPACİTY RATE OF A
PROCESS
• Increase the capacity rate of the bottleneck
• Some other resources may become a
bottleneck when capacity is added
– Important when we justify additional capacity
32
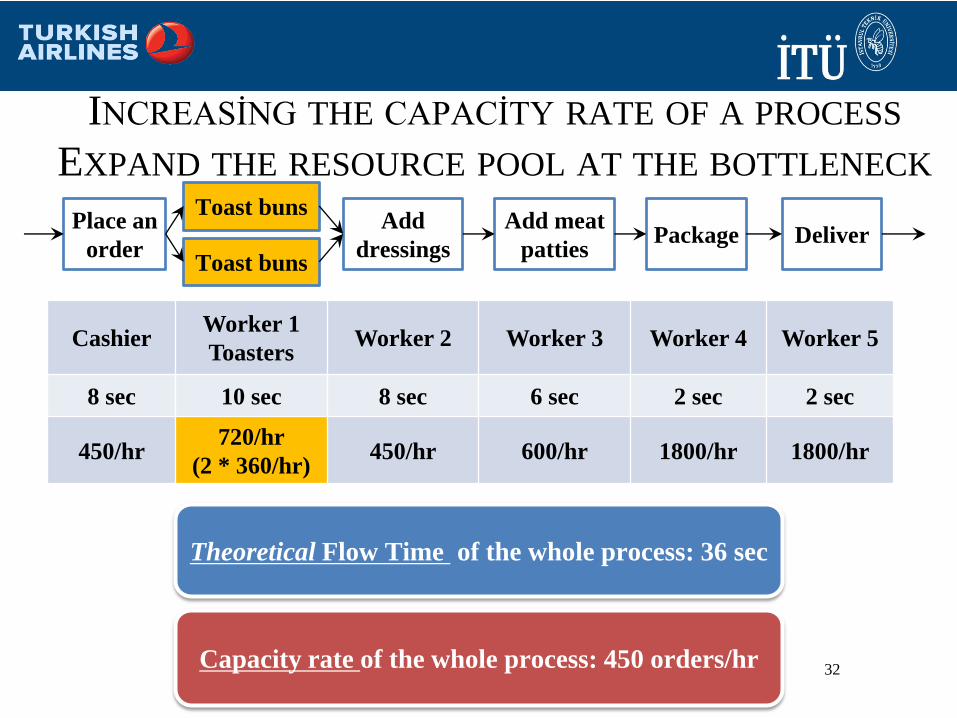
INCREASİNG THE CAPACİTY RATE OF A PROCESS
EXPAND THE RESOURCE POOL AT THE BOTTLENECK
Capacity rate of the whole process: 450 orders/hr
Toast bunsAdd
dressings
Add meat
pattiesPackage Deliver
Place an
order
CashierWorker 1
ToastersWorker 2 Worker 3 Worker 4 Worker 5
8 sec 10 sec 8 sec 6 sec 2 sec 2 sec
450/hr720/hr
(2 * 360/hr)450/hr 600/hr 1800/hr 1800/hr
Theoretical Flow Time of the whole process: 36 sec
Toast buns
33
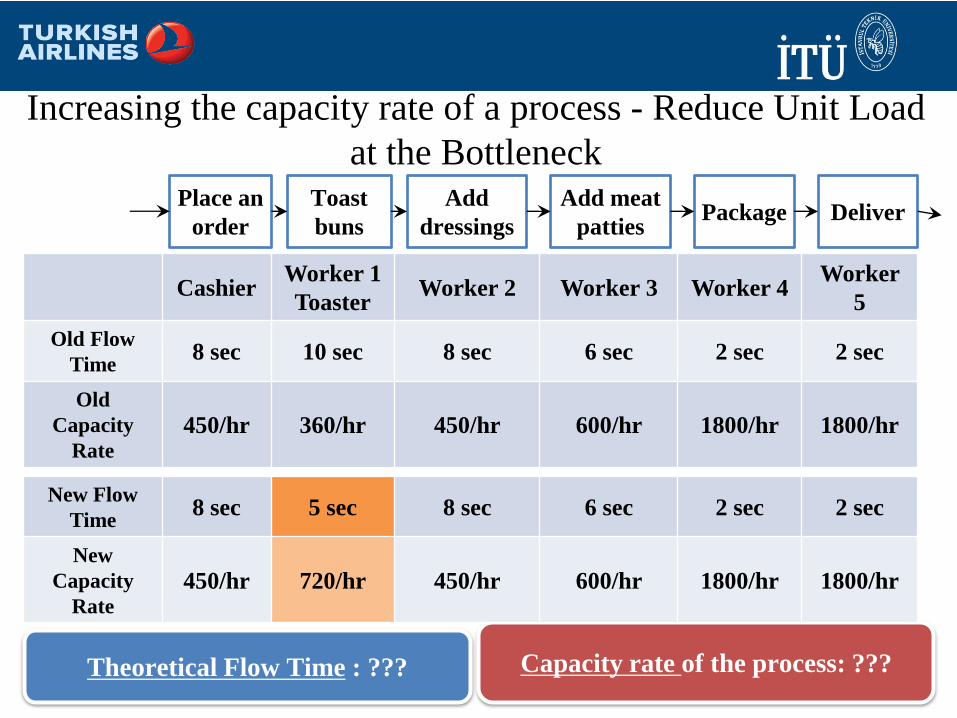
Increasing the capacity rate of a process - Reduce Unit Load
at the BottleneckToast
buns
Add
dressings
Add meat
pattiesPackage Deliver
Place an
order
CashierWorker 1
ToasterWorker 2 Worker 3 Worker 4
Worker
5
Old Flow
Time8 sec 10 sec 8 sec 6 sec 2 sec 2 sec
Old
Capacity
Rate
450/hr 360/hr 450/hr 600/hr 1800/hr 1800/hr
Theoretical Flow Time : ??? Capacity rate of the process: ???
New Flow
Time8 sec 5 sec 8 sec 6 sec 2 sec 2 sec
New
Capacity
Rate
450/hr 720/hr 450/hr 600/hr 1800/hr 1800/hr
34
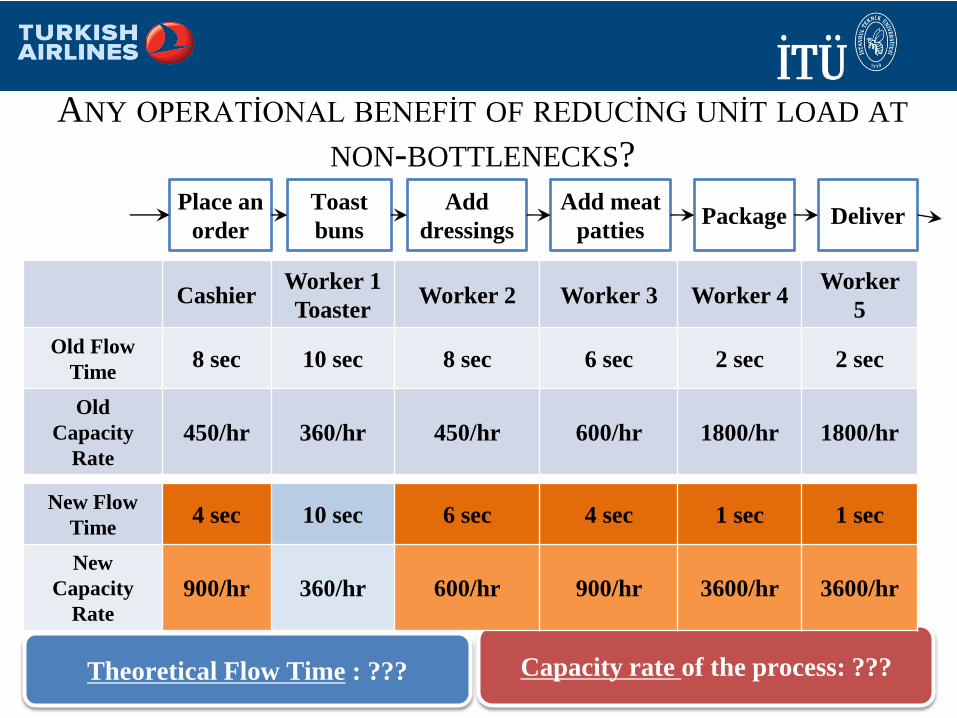
ANY OPERATİONAL BENEFİT OF REDUCİNG UNİT LOAD AT
NON-BOTTLENECKS?
Toast
buns
Add
dressings
Add meat
pattiesPackage Deliver
Place an
order
CashierWorker 1
ToasterWorker 2 Worker 3 Worker 4
Worker
5
Old Flow
Time8 sec 10 sec 8 sec 6 sec 2 sec 2 sec
Old
Capacity
Rate
450/hr 360/hr 450/hr 600/hr 1800/hr 1800/hr
Theoretical Flow Time : ??? Capacity rate of the process: ???
New Flow
Time4 sec 10 sec 6 sec 4 sec 1 sec 1 sec
New
Capacity
Rate
900/hr 360/hr 600/hr 900/hr 3600/hr 3600/hr
35
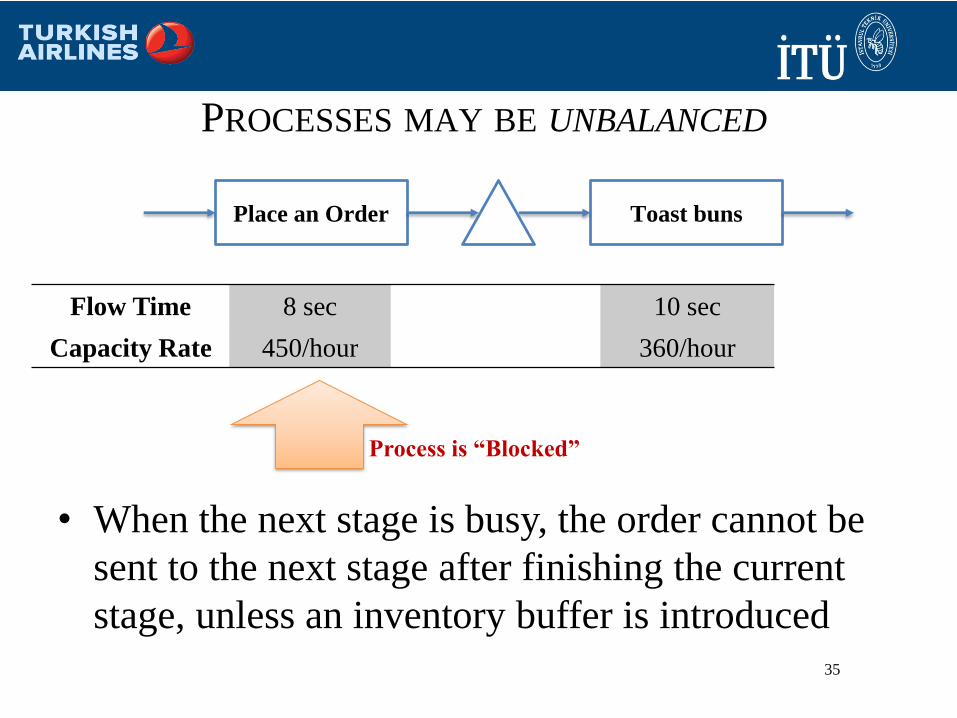
PROCESSES MAY BE UNBALANCED
• When the next stage is busy, the order cannot be
sent to the next stage after finishing the current
stage, unless an inventory buffer is introduced
Place an Order Toast buns
Flow Time 8 sec 10 sec
Capacity Rate 450/hour 360/hour
Process is “Blocked”
36
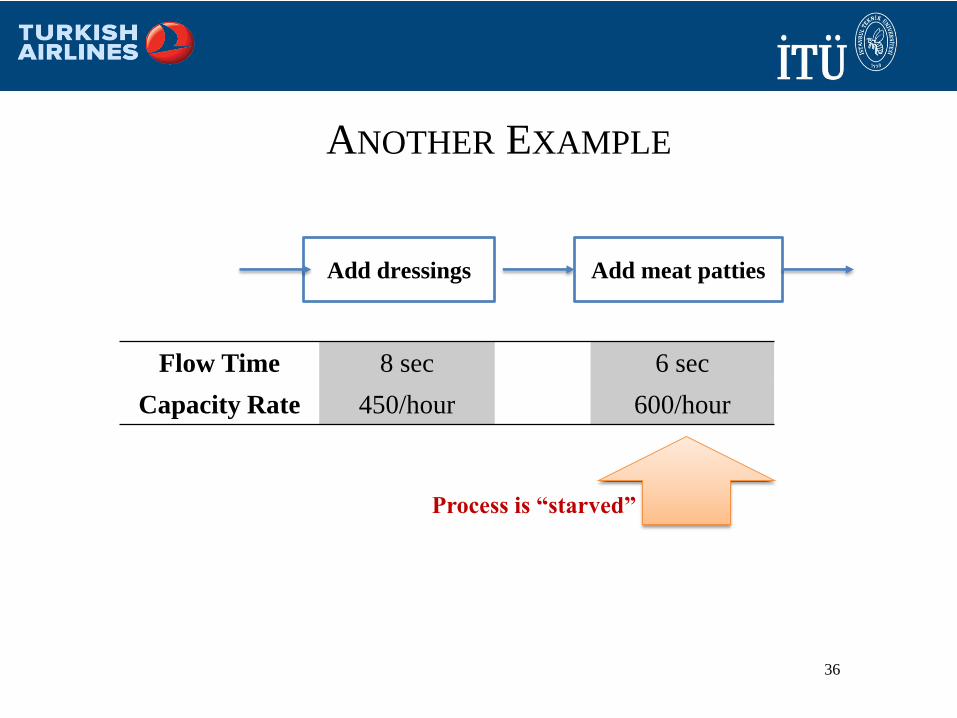
ANOTHER EXAMPLE
Add dressings Add meat patties
Flow Time 8 sec 6 sec
Capacity Rate 450/hour 600/hour
Process is “starved”
37
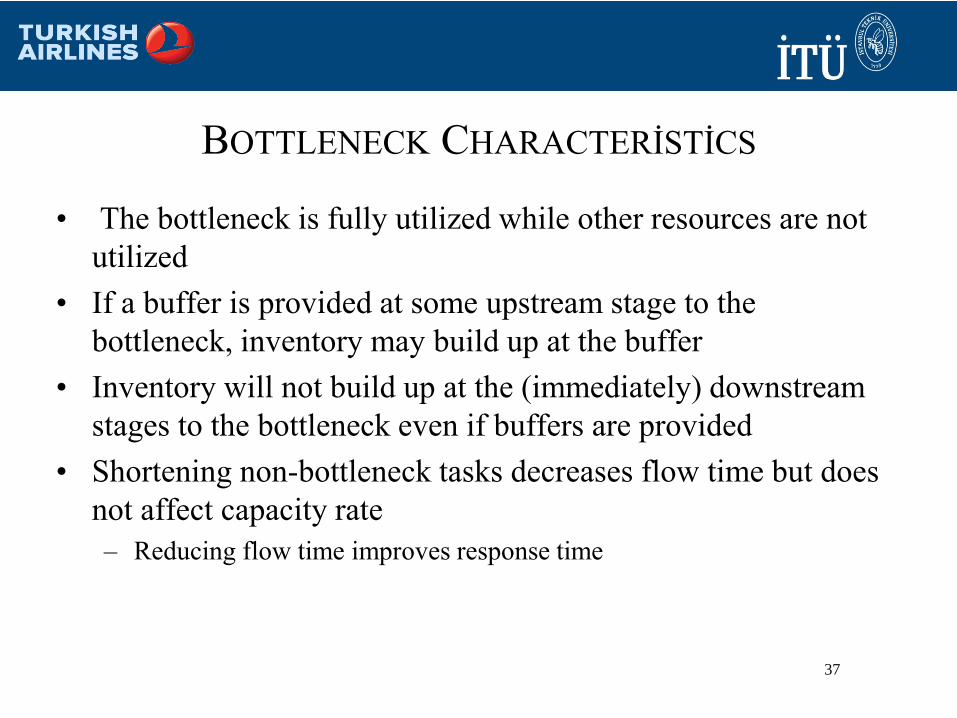
• The bottleneck is fully utilized while other resources are not
utilized
• If a buffer is provided at some upstream stage to the
bottleneck, inventory may build up at the buffer
• Inventory will not build up at the (immediately) downstream
stages to the bottleneck even if buffers are provided
• Shortening non-bottleneck tasks decreases flow time but does
not affect capacity rate
– Reducing flow time improves response time
BOTTLENECK CHARACTERİSTİCS
38
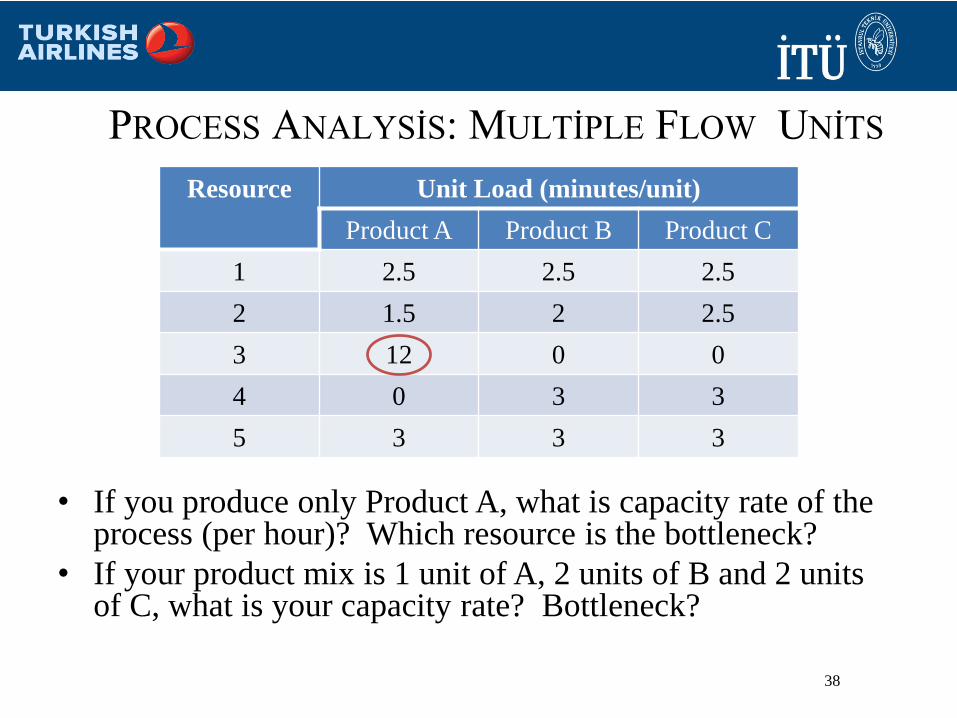
PROCESS ANALYSİS: MULTİPLE FLOW UNİTS
Resource Unit Load (minutes/unit)
Product A Product B Product C
1 2.5 2.5 2.5
2 1.5 2 2.5
3 12 0 0
4 0 3 3
5 3 3 3
• If you produce only Product A, what is capacity rate of the process (per hour)? Which resource is the bottleneck?
• If your product mix is 1 unit of A, 2 units of B and 2 units of C, what is your capacity rate? Bottleneck?
39
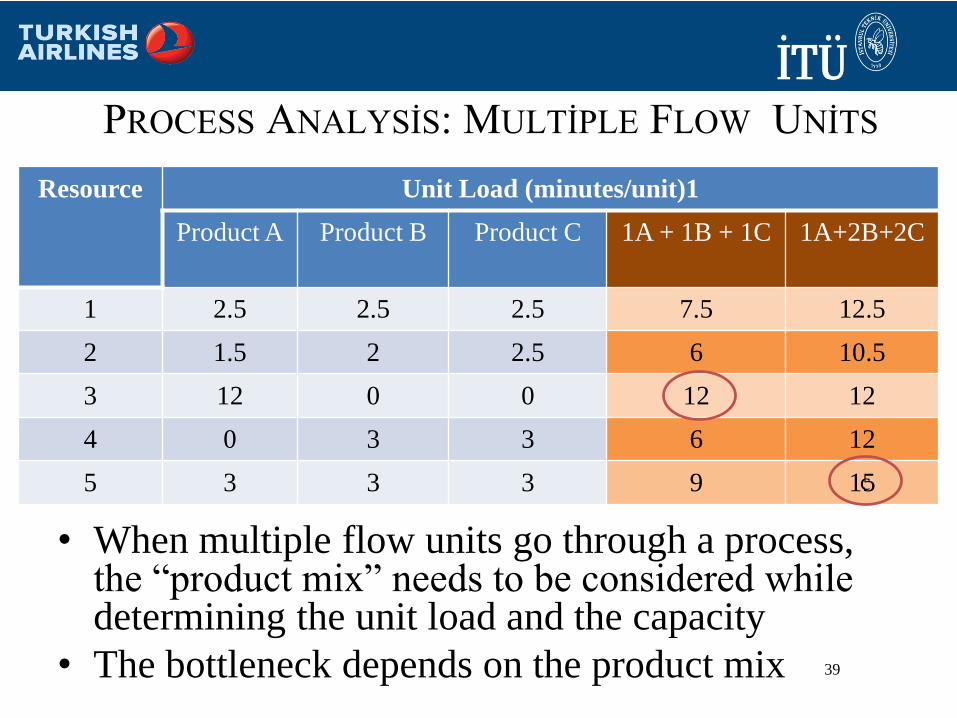
PROCESS ANALYSİS: MULTİPLE FLOW UNİTS
Resource Unit Load (minutes/unit)1
Product A Product B Product C 1A + 1B + 1C 1A+2B+2C
1 2.5 2.5 2.5 7.5 12.5
2 1.5 2 2.5 6 10.5
3 12 0 0 12 12
4 0 3 3 6 12
5 3 3 3 9 15
• When multiple flow units go through a process, the “product mix” needs to be considered while determining the unit load and the capacity
• The bottleneck depends on the product mix
c
40
• Flow diagrams are not easy to draw
• How to identify bottleneck?
– Count the total amount of work per resource (also known as the “unit
load”)
• When multiple flow units go through a process, a “product
mix” needs to be considered while determining capacity
• The bottleneck depends on the product mix
• The bottlenecks can move as the product mix changes
PROCESS ANALYSİS: MULTİPLE FLOW UNİTS
41
• Some capacity is lost due to machine maintenance,
machine set-ups, etc.
• Example. Changing over from one product type to
another may require adjustments to the machine,
tools, etc (“set-ups”)
• Railways/London Underground shut down lines to
inspect and maintain track
THEORETİCAL VERSUS EFFECTİVE CAPACİTY
42
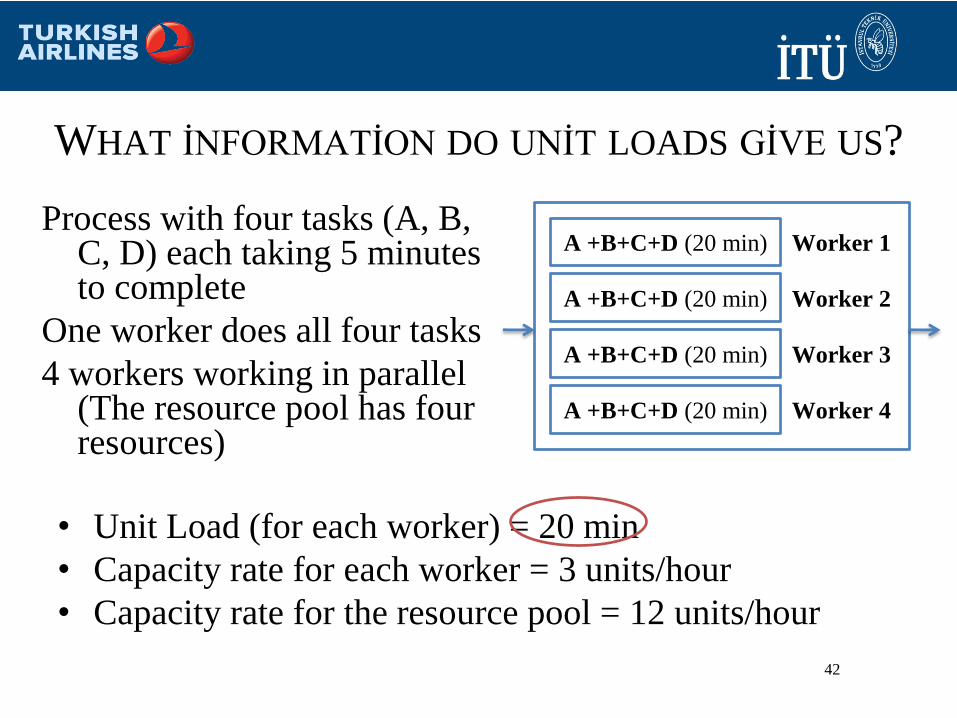
WHAT İNFORMATİON DO UNİT LOADS GİVE US?
Process with four tasks (A, B, C, D) each taking 5 minutes to complete
One worker does all four tasks
4 workers working in parallel (The resource pool has four resources)
• Unit Load (for each worker) = 20 min
• Capacity rate for each worker = 3 units/hour
• Capacity rate for the resource pool = 12 units/hour
A +B+C+D (20 min)
A +B+C+D (20 min)
A +B+C+D (20 min)
A +B+C+D (20 min)
Worker 1
Worker 2
Worker 3
Worker 4
43
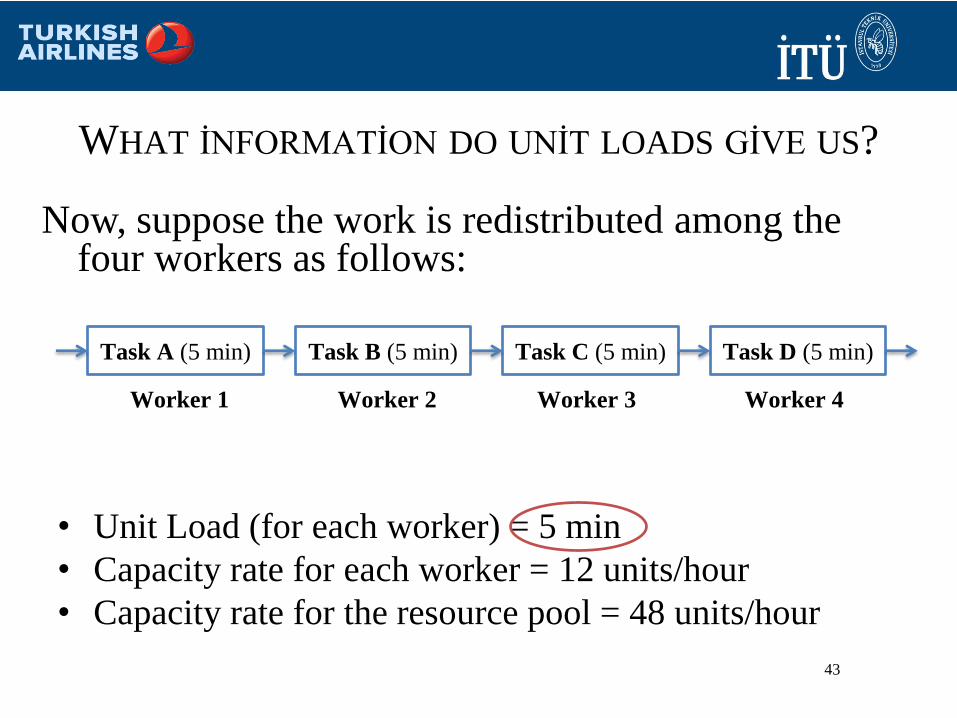
WHAT İNFORMATİON DO UNİT LOADS GİVE US?
Now, suppose the work is redistributed among the four workers as follows:
• Unit Load (for each worker) = 5 min
• Capacity rate for each worker = 12 units/hour
• Capacity rate for the resource pool = 48 units/hour
Task A (5 min) Task B (5 min) Task C (5 min) Task D (5 min)
Worker 1 Worker 2 Worker 3 Worker 4
44
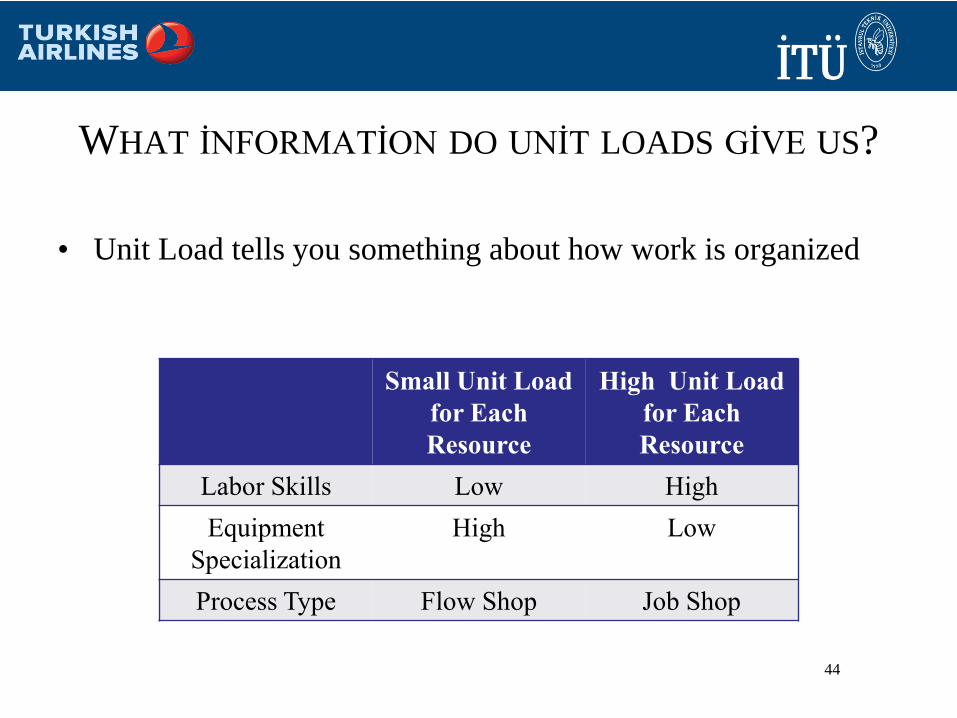
WHAT İNFORMATİON DO UNİT LOADS GİVE US?
• Unit Load tells you something about how work is organized
Small Unit Load
for Each
Resource
High Unit Load
for Each
Resource
Labor Skills Low High
Equipment
Specialization
High Low
Process Type Flow Shop Job Shop
45
• An Experiment in “humanistic” production at its Kalmar and
Uddevalla plants (late 1980s)
• Teams jointly assemble cars at a fixed location, no moving
assembly line
• Plants shut down in 1993-1994
• Recommended reading
– “Edges Fray on Volvo’s Brave New Humanistic World” New York
Times, July 7, 1991.
THE VOLVO EXPERİMENT
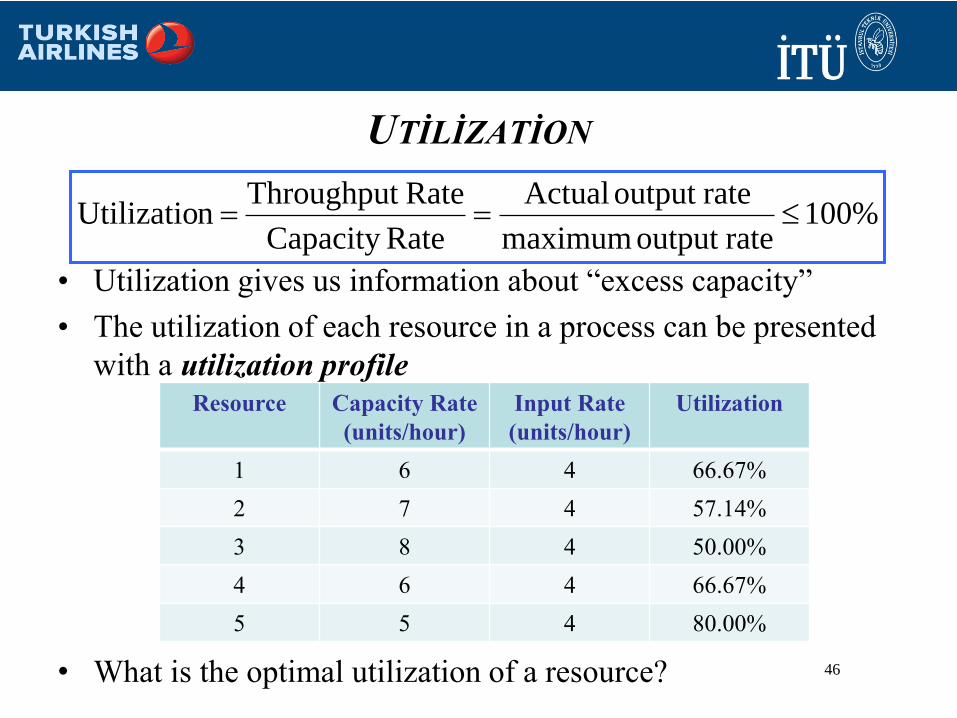
UTİLİZATİON
• Utilization gives us information about “excess capacity”
• The utilization of each resource in a process can be presented
with a utilization profile
%100rateoutput maximum
rateoutput Actual
RateCapacity
Rate Throughput n Utilizatio
• What is the optimal utilization of a resource?
Resource Capacity Rate
(units/hour)
Input Rate
(units/hour)
Utilization
1 6 4 66.67%
2 7 4 57.14%
3 8 4 50.00%
4 6 4 66.67%
5 5 4 80.00%
46
OPERATİONAL CHALLENGE
MİSMATCH BETWEEN DEMAND AND SUPPLY
• In any process, the input and output rates will vary over time
• A key operational challenge is matching supply and demand
– i.e., matching the input and output rates
• For a variety of reasons, a perfect match is not possible
– What are some of these reasons?
47
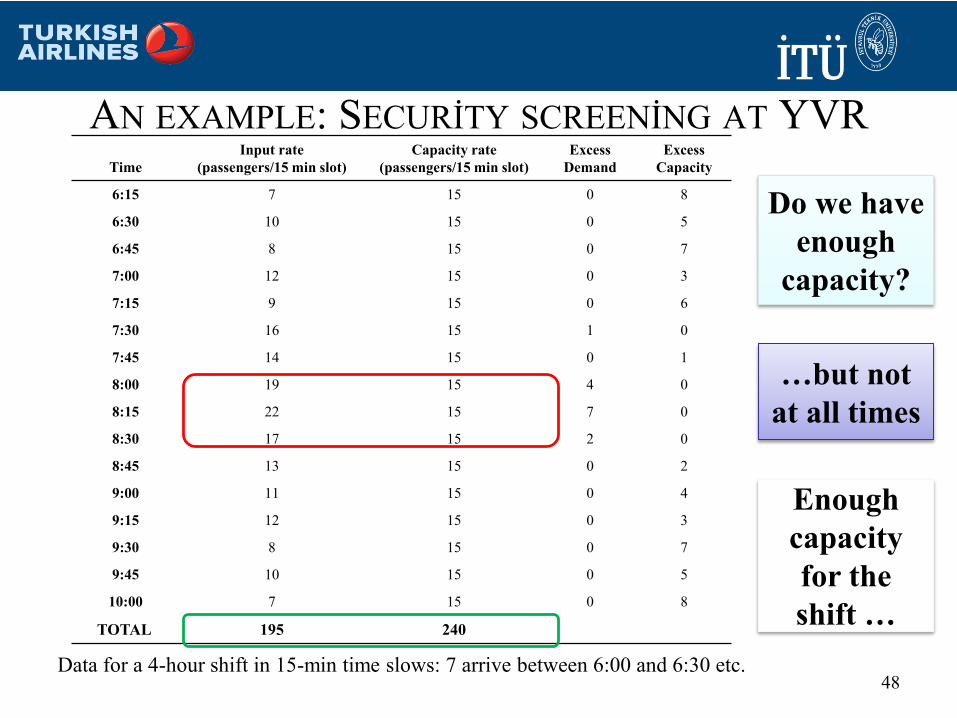
AN EXAMPLE: SECURİTY SCREENİNG AT YVR
48
Time
Input rate
(passengers/15 min slot)
Capacity rate
(passengers/15 min slot)
Excess
Demand
Excess
Capacity
6:15 7 15 0 8
6:30 10 15 0 5
6:45 8 15 0 7
7:00 12 15 0 3
7:15 9 15 0 6
7:30 16 15 1 0
7:45 14 15 0 1
8:00 19 15 4 0
8:15 22 15 7 0
8:30 17 15 2 0
8:45 13 15 0 2
9:00 11 15 0 4
9:15 12 15 0 3
9:30 8 15 0 7
9:45 10 15 0 5
10:00 7 15 0 8
TOTAL 195 240
Enough
capacity
for the
shift …
Data for a 4-hour shift in 15-min time slows: 7 arrive between 6:00 and 6:30 etc.
…but not
at all times
Do we have
enough
capacity?
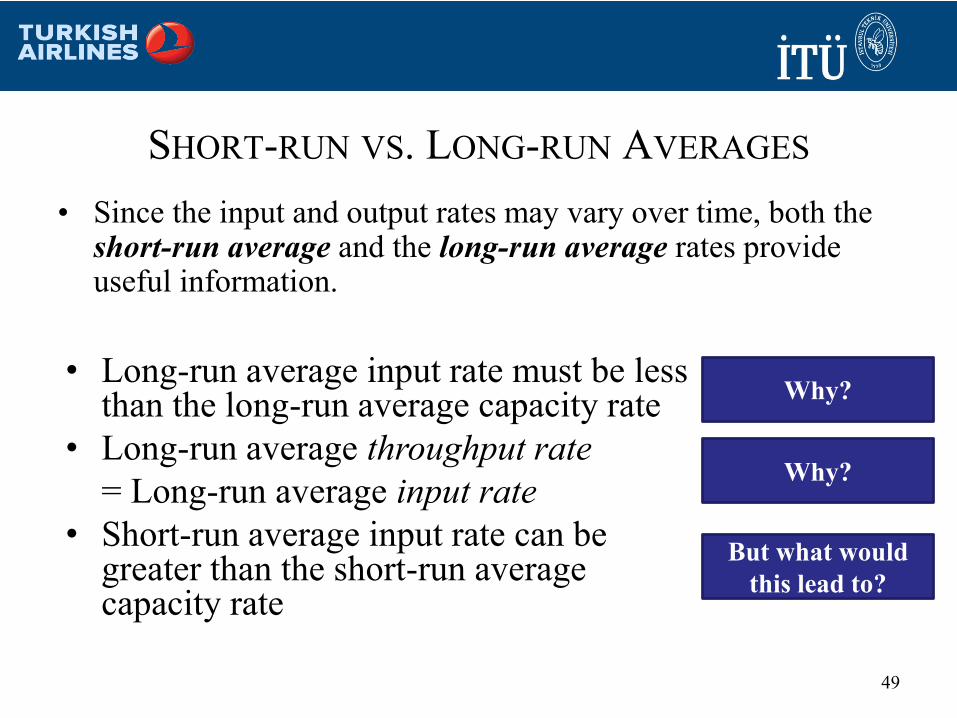
SHORT-RUN VS. LONG-RUN AVERAGES
• Since the input and output rates may vary over time, both the short-run average and the long-run average rates provide useful information.
49
• Long-run average input rate must be less than the long-run average capacity rate
• Long-run average throughput rate
= Long-run average input rate
• Short-run average input rate can be greater than the short-run average capacity rate
But what would
this lead to?
Why?
Why?
RateCapacity
Rate Throughput n Utilizatio
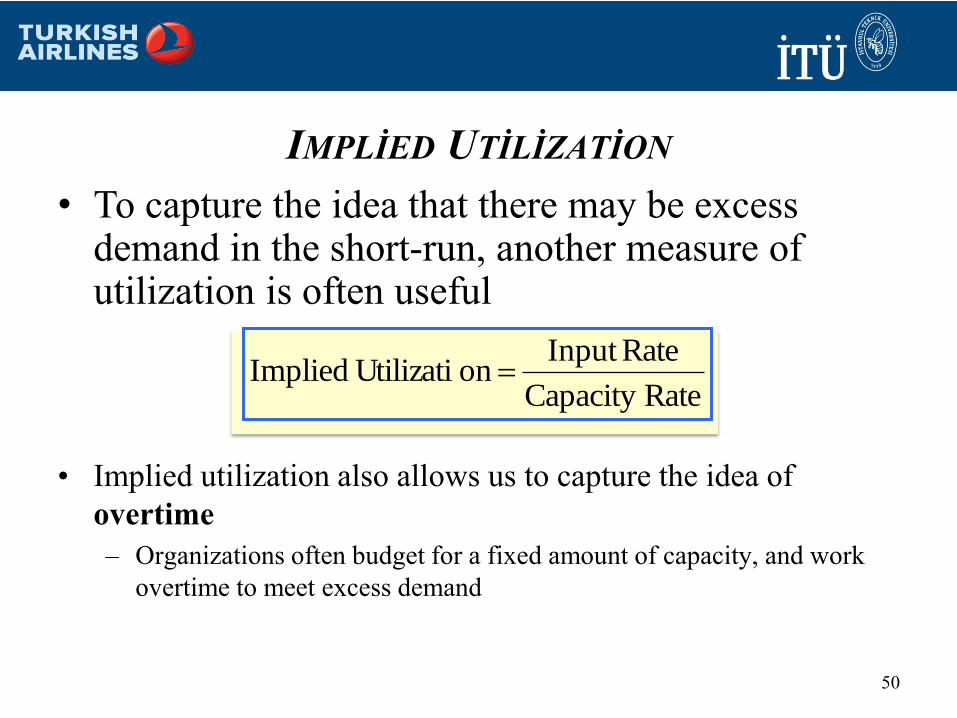
IMPLİED UTİLİZATİON
• Implied utilization also allows us to capture the idea of
overtime
– Organizations often budget for a fixed amount of capacity, and work
overtime to meet excess demand
50
• To capture the idea that there may be excess demand in the short-run, another measure of utilization is often useful
RateCapacity
RateInput on UtilizatiImplied
SECURİTY SCREENİNG EXAMPLE REVİSİTED
• What is the capacity rate?
Note: In this example, the capacity rate is given. In practice, it
may not be obvious. Finding the capacity rate will involve
drawing a process flow map, identifying activities, times,
resources, etc, and finding the bottleneck
• What is the (average) size of the line?
• How long do passengers wait (flow time)?
51
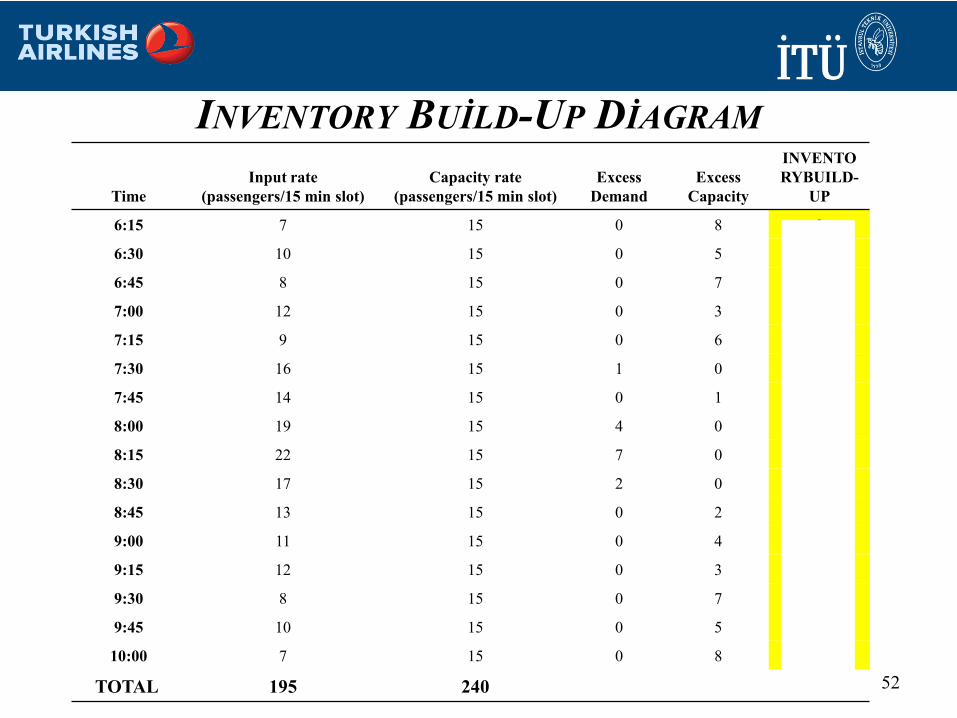
INVENTORY BUİLD-UP DİAGRAM
52
Time
Input rate
(passengers/15 min slot)
Capacity rate
(passengers/15 min slot)
Excess
Demand
Excess
Capacity
INVENTO
RYBUILD-
UP
6:15 7 15 0 8 0
6:30 10 15 0 5 0
6:45 8 15 0 7 0
7:00 12 15 0 3 0
7:15 9 15 0 6 0
7:30 16 15 1 0 1
7:45 14 15 0 1 0
8:00 19 15 4 0 4
8:15 22 15 7 0 11
8:30 17 15 2 0 13
8:45 13 15 0 2 11
9:00 11 15 0 4 7
9:15 12 15 0 3 4
9:30 8 15 0 7 0
9:45 10 15 0 5 0
10:00 7 15 0 8 0
TOTAL 195 240
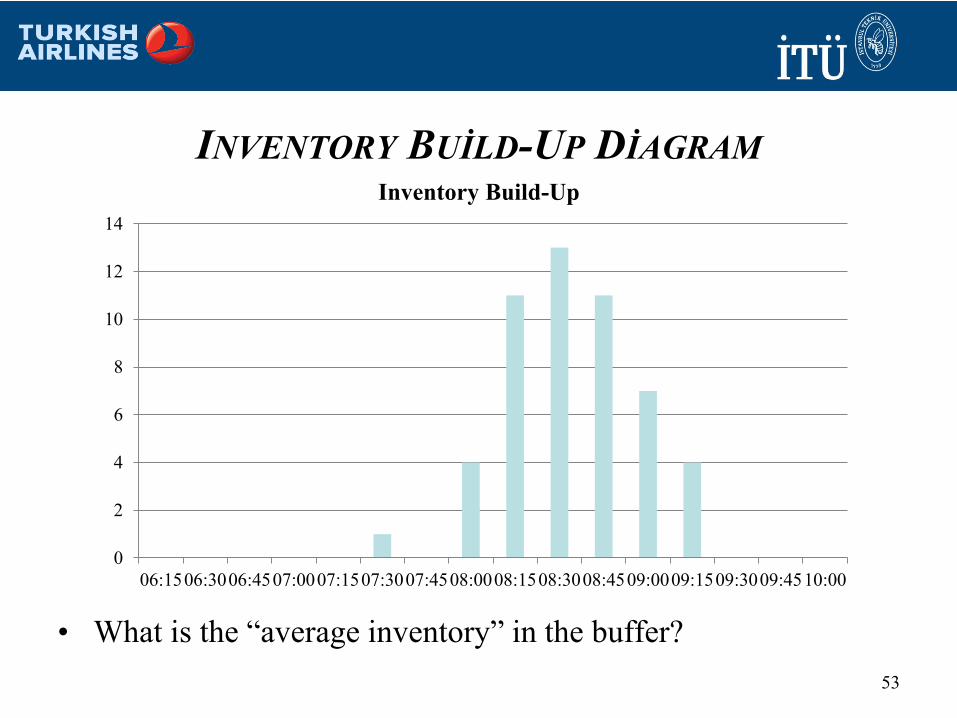
INVENTORY BUİLD-UP DİAGRAM
53
0
2
4
6
8
10
12
14
06:1506:3006:4507:0007:1507:3007:4508:0008:1508:3008:4509:0009:1509:3009:4510:00
Inventory Build-Up
• What is the “average inventory” in the buffer?
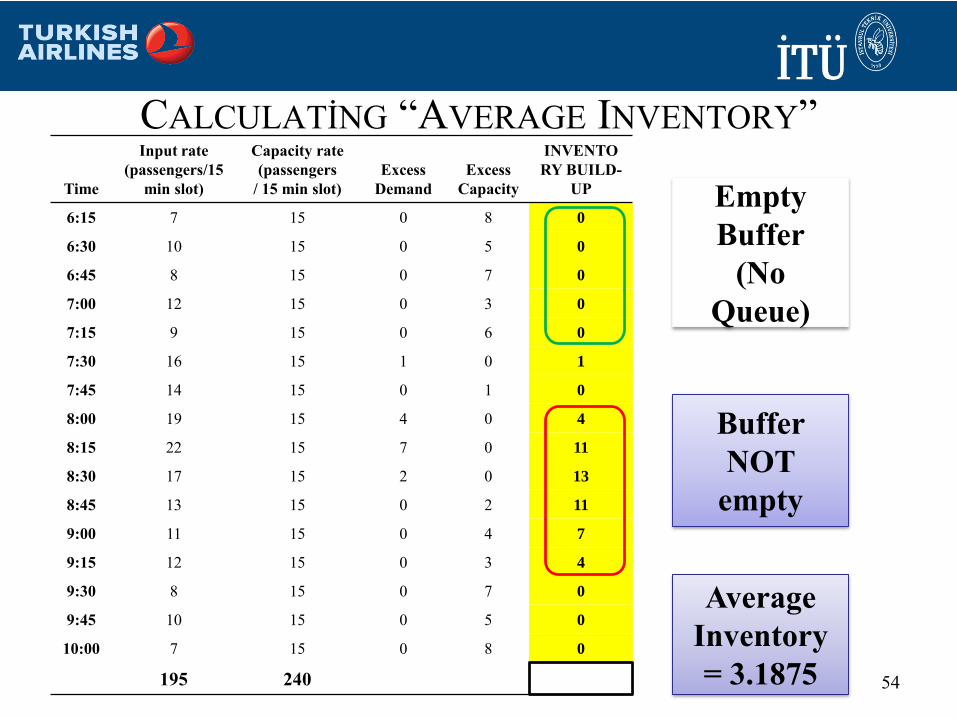
CALCULATİNG “AVERAGE INVENTORY”
54
Time
Input rate
(passengers/15
min slot)
Capacity rate
(passengers
/ 15 min slot)
Excess
Demand
Excess
Capacity
INVENTO
RY BUILD-
UP
6:15 7 15 0 8 0
6:30 10 15 0 5 0
6:45 8 15 0 7 0
7:00 12 15 0 3 0
7:15 9 15 0 6 0
7:30 16 15 1 0 1
7:45 14 15 0 1 0
8:00 19 15 4 0 4
8:15 22 15 7 0 11
8:30 17 15 2 0 13
8:45 13 15 0 2 11
9:00 11 15 0 4 7
9:15 12 15 0 3 4
9:30 8 15 0 7 0
9:45 10 15 0 5 0
10:00 7 15 0 8 0
195 240 3.1875
Empty
Buffer
(No
Queue)
Buffer
NOT
empty
Average
Inventory
= 3.1875
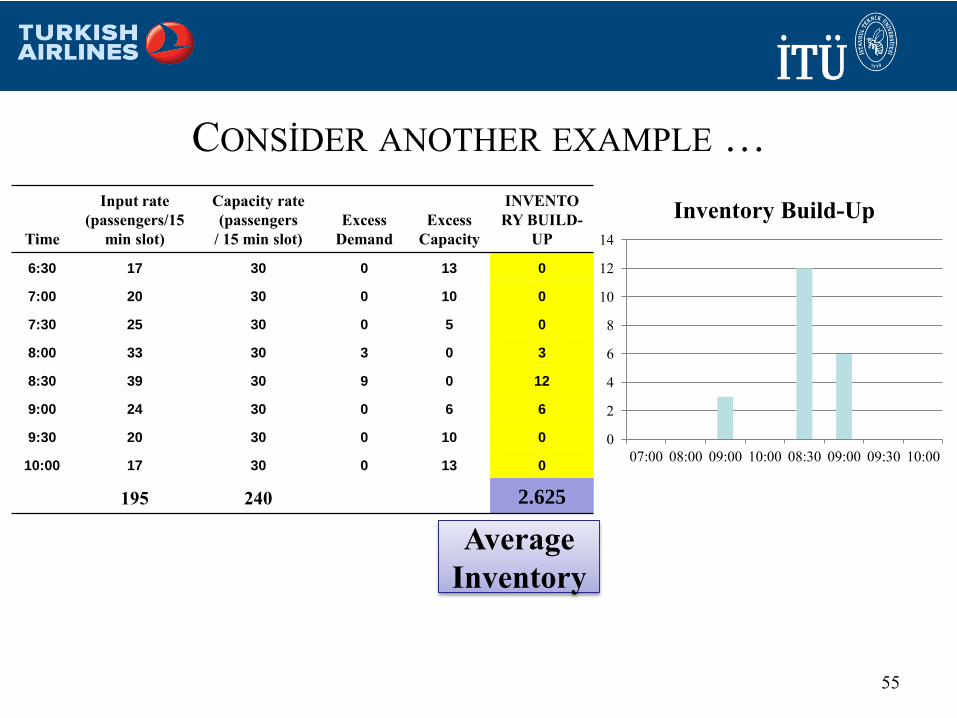
CONSİDER ANOTHER EXAMPLE …
55
Time
Input rate
(passengers/15
min slot)
Capacity rate
(passengers
/ 15 min slot)
Excess
Demand
Excess
Capacity
INVENTO
RY BUILD-
UP
6:30 17 30 0 13 0
7:00 20 30 0 10 0
7:30 25 30 0 5 0
8:00 33 30 3 0 3
8:30 39 30 9 0 12
9:00 24 30 0 6 6
9:30 20 30 0 10 0
10:00 17 30 0 13 0
195 240 2.625
0
2
4
6
8
10
12
14
07:00 08:00 09:00 10:00 08:30 09:00 09:30 10:00
Inventory Build-Up
Average
Inventory
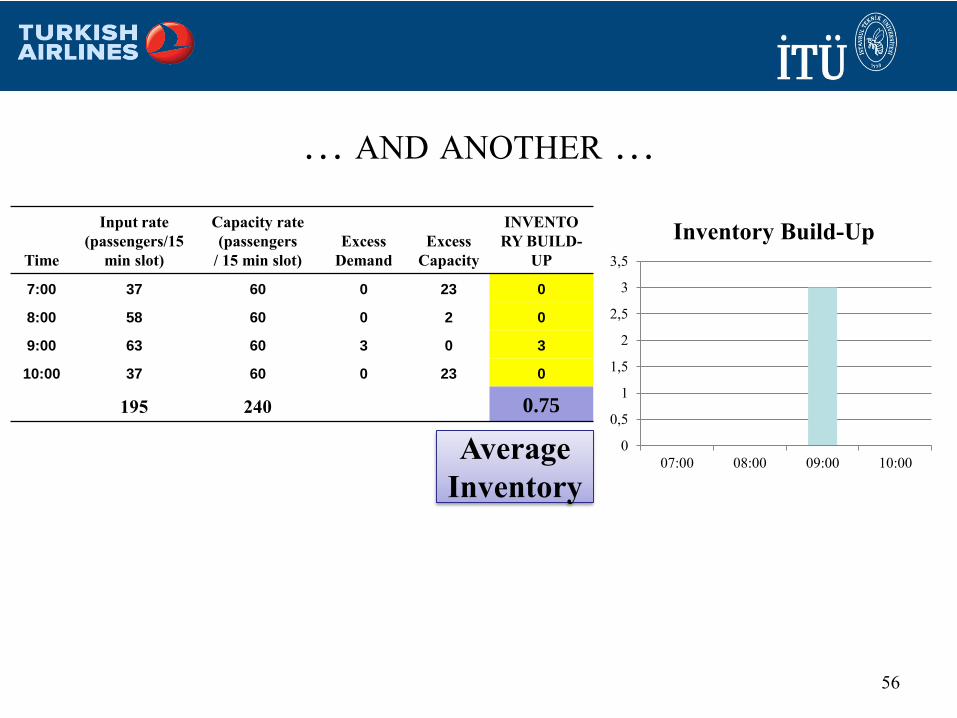
… AND ANOTHER …
56
Time
Input rate
(passengers/15
min slot)
Capacity rate
(passengers
/ 15 min slot)
Excess
Demand
Excess
Capacity
INVENTO
RY BUILD-
UP
7:00 37 60 0 23 0
8:00 58 60 0 2 0
9:00 63 60 3 0 3
10:00 37 60 0 23 0
195 240 0.75
Average
Inventory
0
0,5
1
1,5
2
2,5
3
3,5
07:00 08:00 09:00 10:00
Inventory Build-Up
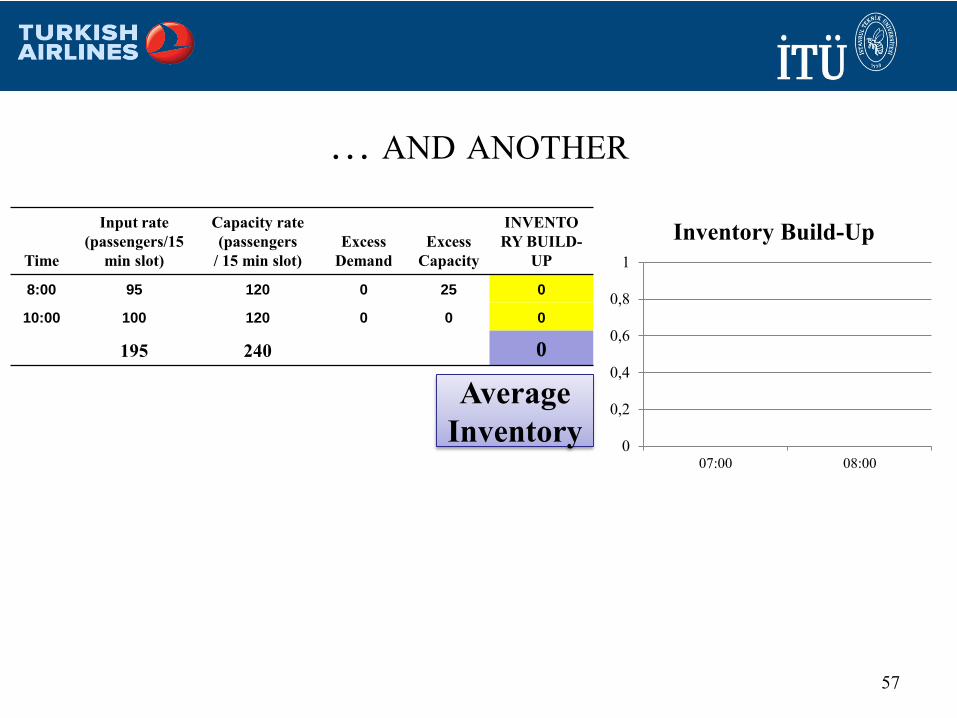
… AND ANOTHER
57
Time
Input rate
(passengers/15
min slot)
Capacity rate
(passengers
/ 15 min slot)
Excess
Demand
Excess
Capacity
INVENTO
RY BUILD-
UP
8:00 95 120 0 25 0
10:00 100 120 0 0 0
195 240 0
Average
Inventory 0
0,2
0,4
0,6
0,8
1
07:00 08:00
Inventory Build-Up
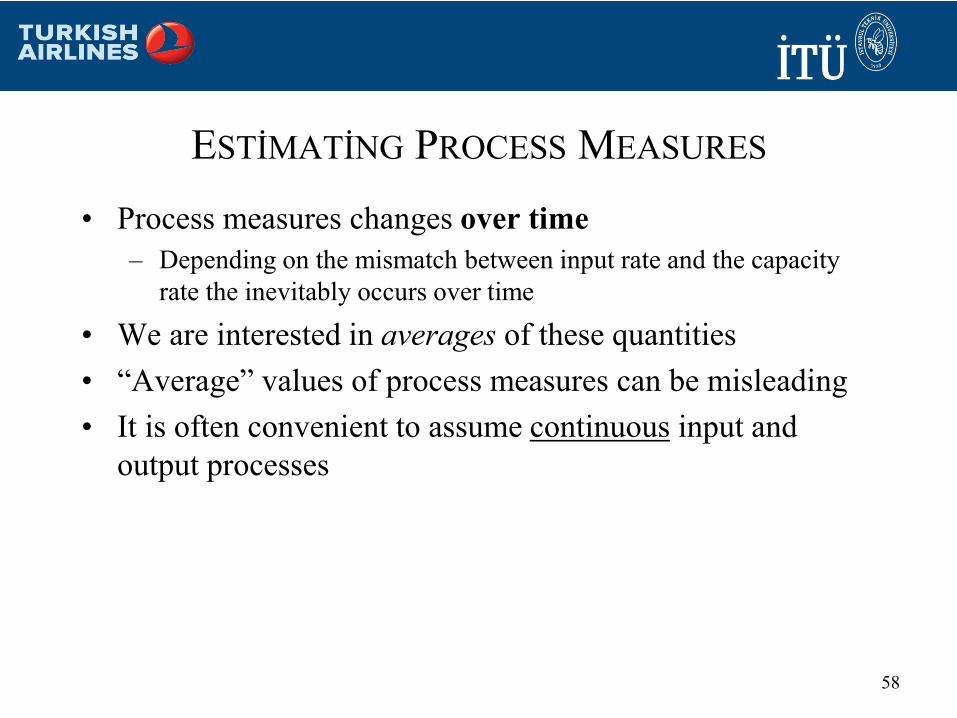
ESTİMATİNG PROCESS MEASURES
• Process measures changes over time
– Depending on the mismatch between input rate and the capacity
rate the inevitably occurs over time
• We are interested in averages of these quantities
• “Average” values of process measures can be misleading
• It is often convenient to assume continuous input and
output processes
58
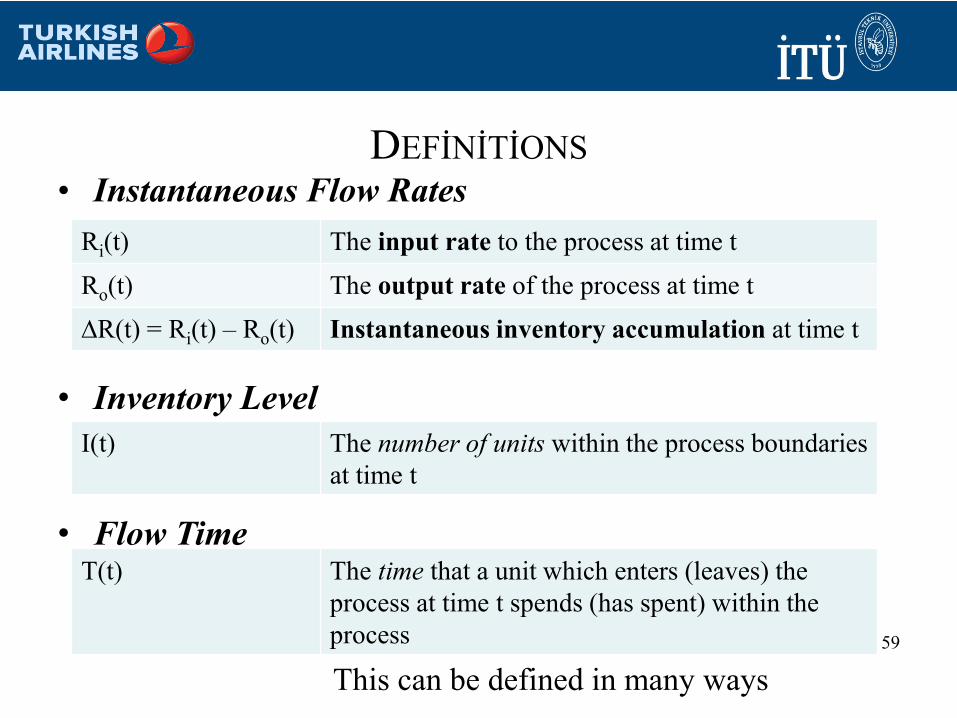
DEFİNİTİONS
• Instantaneous Flow Rates
59
Ri(t) The input rate to the process at time t
Ro(t) The output rate of the process at time t
∆R(t) = Ri(t) – Ro(t) Instantaneous inventory accumulation at time t
• Inventory Level
• Flow Time
I(t) The number of units within the process boundaries
at time t
T(t) The time that a unit which enters (leaves) the
process at time t spends (has spent) within the
process
This can be defined in many ways
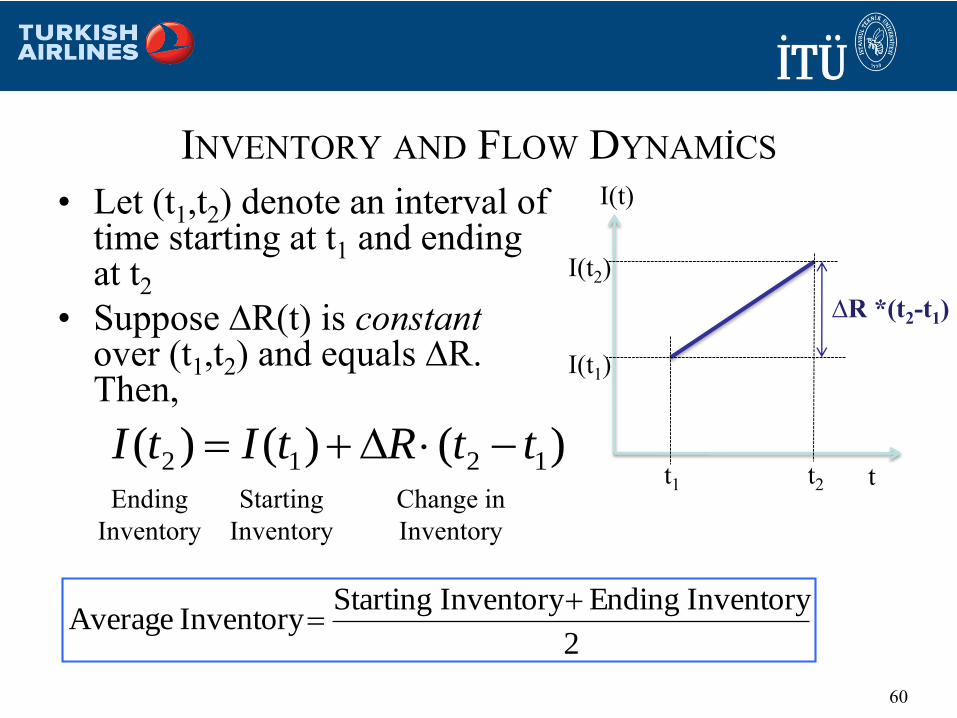
INVENTORY AND FLOW DYNAMİCS
• Let (t1,t2) denote an interval of time starting at t1 and ending at t2
• Suppose ∆R(t) is constantover (t1,t2) and equals ∆R. Then,
60
t1 t2
I(t1)
I(t2)
I(t)
t
∆R *(t2-t1)
)()()( 1212 ttRtItI
2
Inventory EndingInventory StartingInventory Average
Ending
Inventory
Starting
Inventory
Change in
Inventory
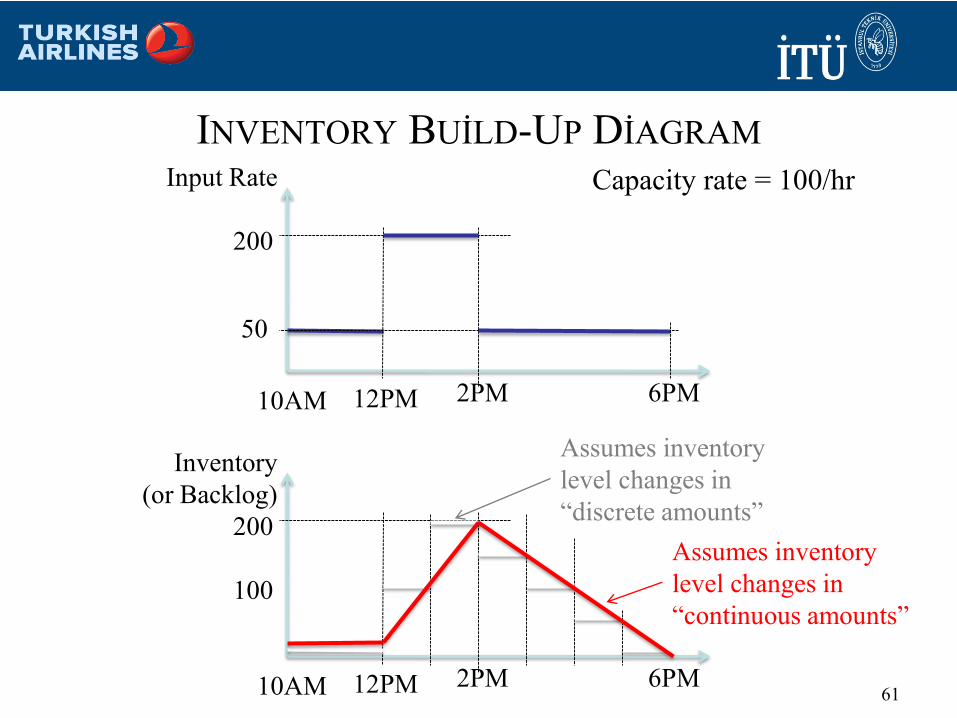
INVENTORY BUİLD-UP DİAGRAM
Capacity rate = 100/hr
61
10AM
50
200
Input Rate
12PM 2PM 6PM
10AM
100
200
Inventory
(or Backlog)
12PM 2PM 6PM
Assumes inventory
level changes in
“discrete amounts”
Assumes inventory
level changes in
“continuous amounts”
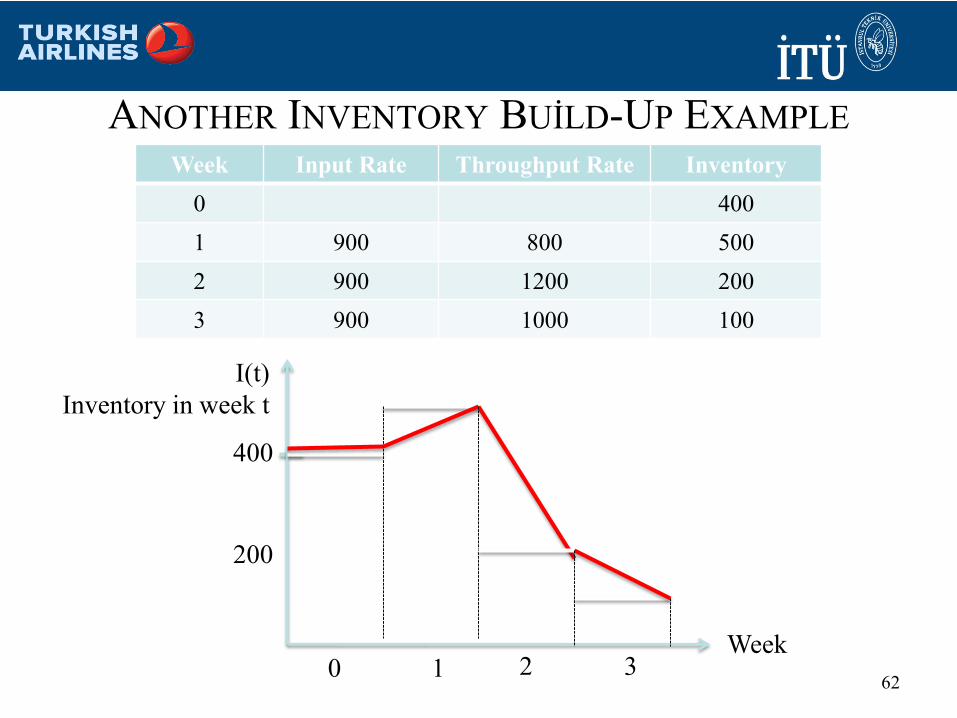
ANOTHER INVENTORY BUİLD-UP EXAMPLE
620
200
400
I(t)
Inventory in week t
1 2 3
Week Input Rate Throughput Rate Inventory
0 400
1 900 800 500
2 900 1200 200
3 900 1000 100
Week
Under the continuous
assumption:
The average inventory?
“Area under the curve”
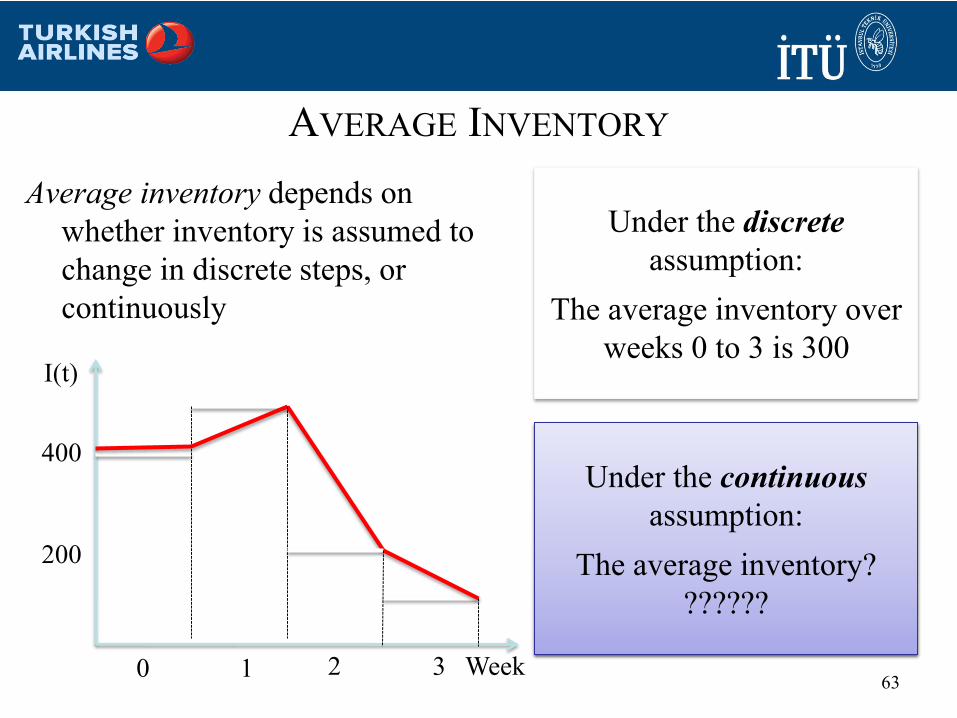
AVERAGE INVENTORY
Average inventory depends on
whether inventory is assumed to
change in discrete steps, or
continuously
630
200
400
I(t)
1 2 3 Week
Under the discrete
assumption:
The average inventory over
weeks 0 to 3 is 300
Under the continuous
assumption:
The average inventory?
??????
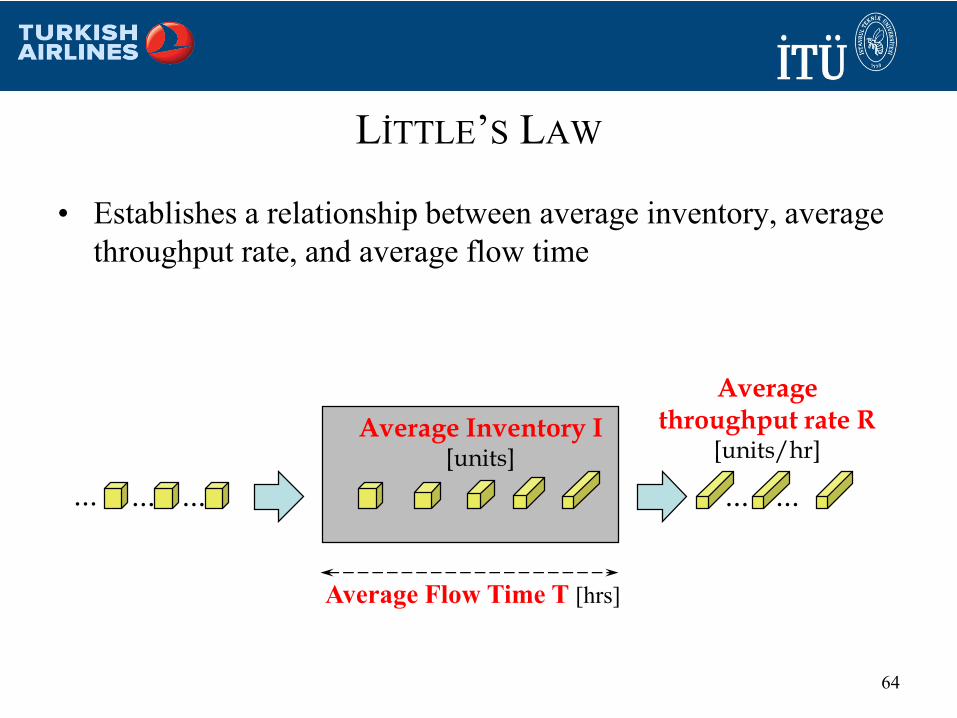
LİTTLE’S LAW
64
Average Inventory I [units]
Average throughput rate R
[units/hr]
... ...
Average Flow Time T [hrs]
... ......
• Establishes a relationship between average inventory, average
throughput rate, and average flow time
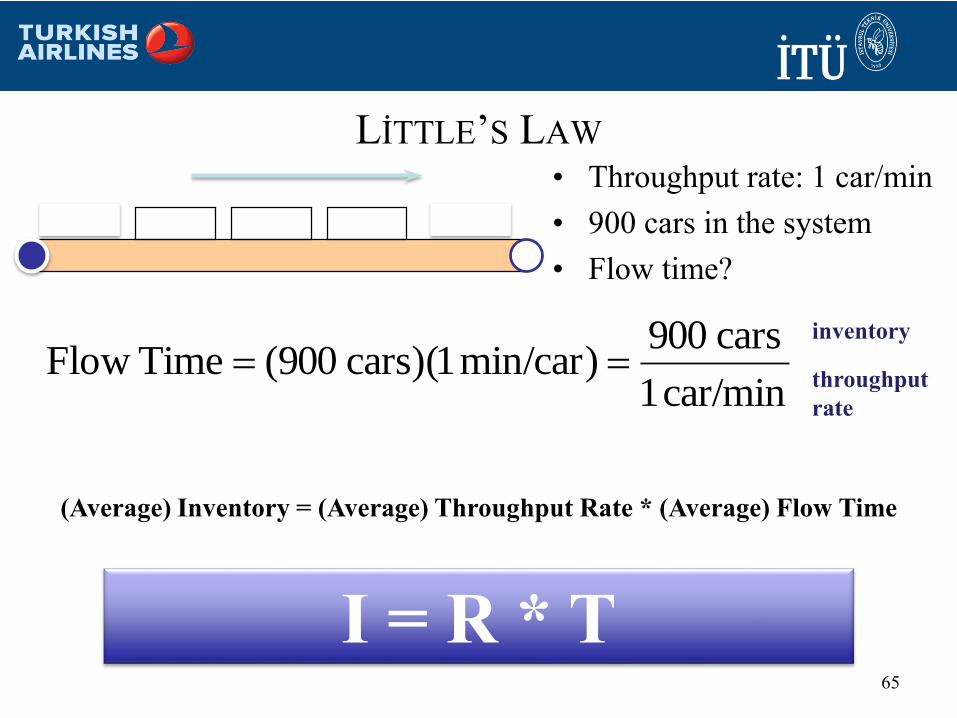
LİTTLE’S LAW
• Throughput rate: 1 car/min
• 900 cars in the system
• Flow time?
65
car/min 1
cars 900)min/car 1)(cars 900(Time Flow
inventory
throughput
rate
(Average) Inventory = (Average) Throughput Rate * (Average) Flow Time
I = R * T
LİTTLE’S LAW: EXAMPLE 1
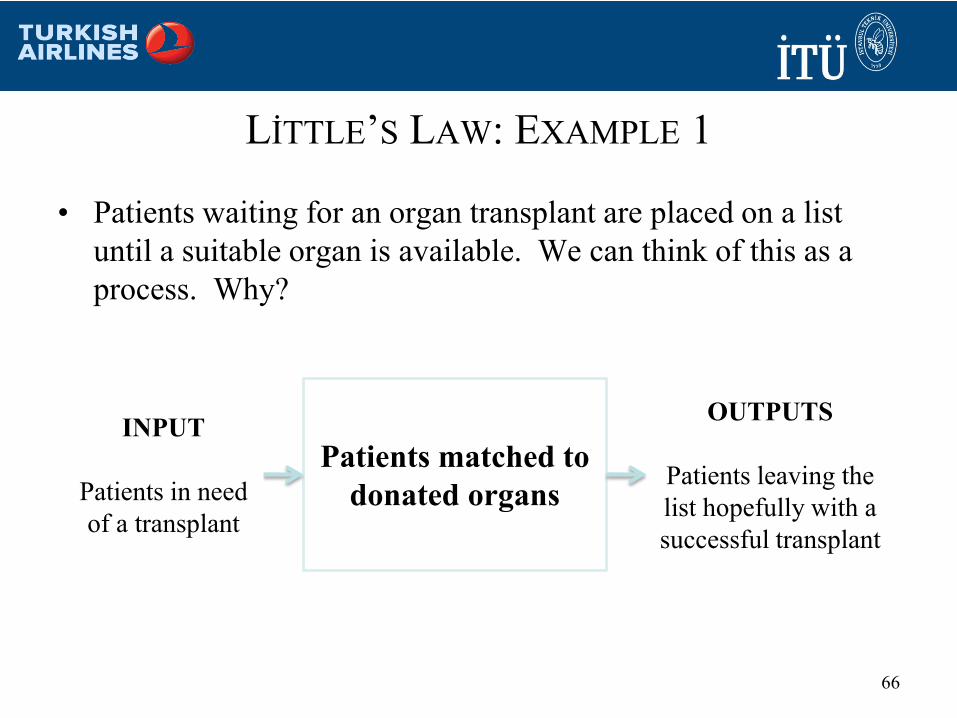
• Patients waiting for an organ transplant are placed on a list
until a suitable organ is available. We can think of this as a
process. Why?
66
Patients matched to
donated organs
INPUT
Patients in need
of a transplant
OUTPUTS
Patients leaving the
list hopefully with a
successful transplant
LİTTLE’S LAW: EXAMPLE 1
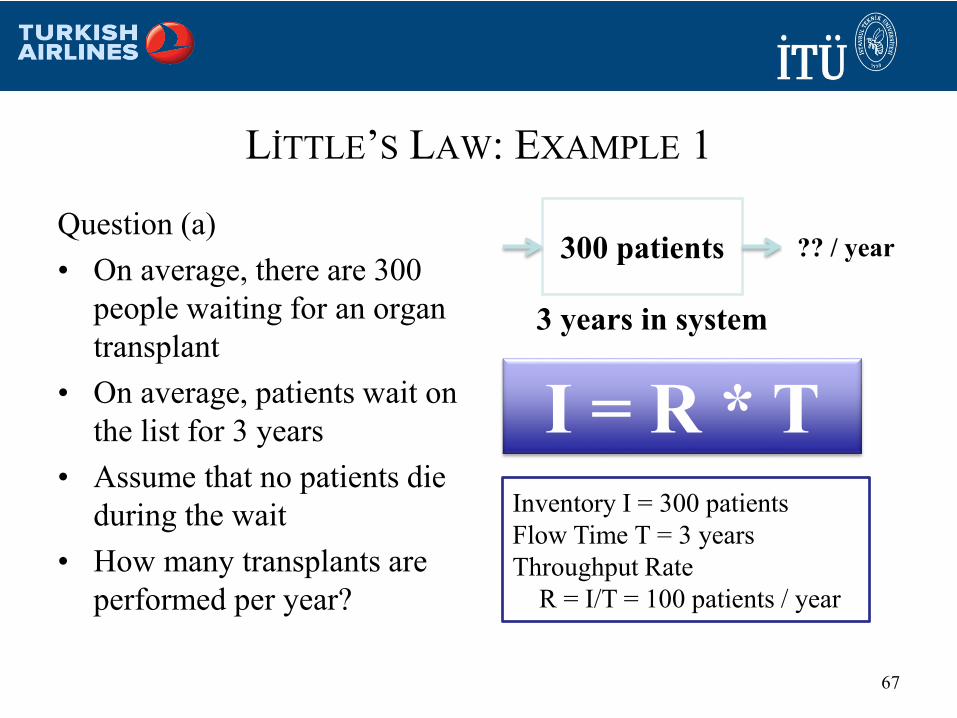
Question (a)
• On average, there are 300
people waiting for an organ
transplant
• On average, patients wait on
the list for 3 years
• Assume that no patients die
during the wait
• How many transplants are
performed per year?
67
300 patients ?? / year
3 years in system
I = R * TInventory I = 300 patients
Flow Time T = 3 years
Throughput Rate
R = I/T = 100 patients / year
LİTTLE’S LAW: EXAMPLE 1
68
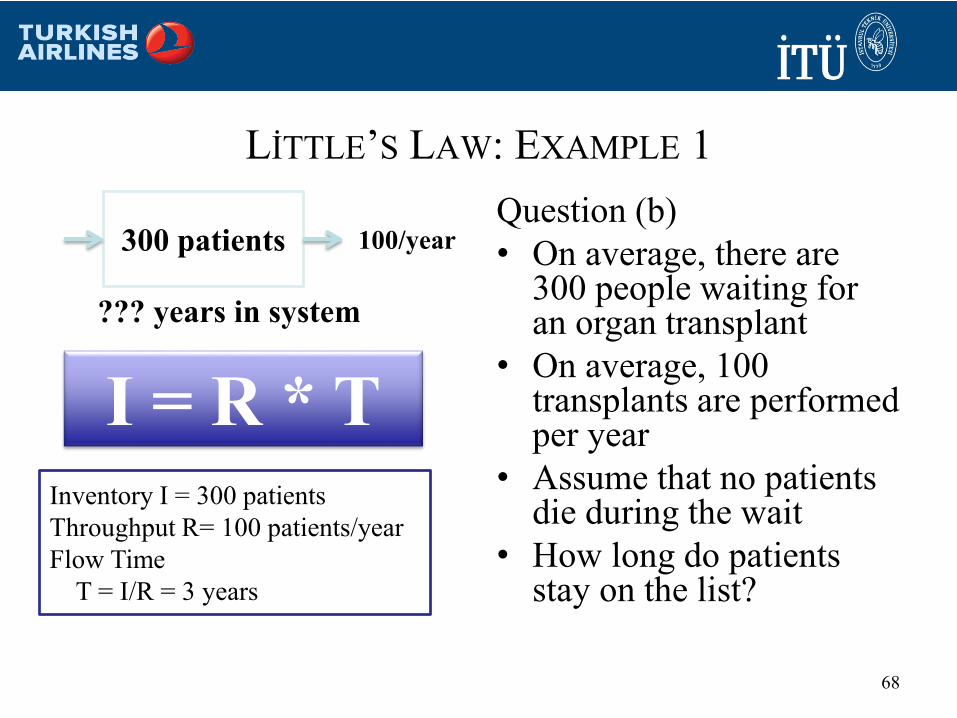
Question (b)
• On average, there are 300 people waiting for an organ transplant
• On average, 100 transplants are performed per year
• Assume that no patients die during the wait
• How long do patients stay on the list?
300 patients 100/year
??? years in system
I = R * TInventory I = 300 patients
Throughput R= 100 patients/year
Flow Time
T = I/R = 3 years
LİTTLE’S LAW: EXAMPLE 2
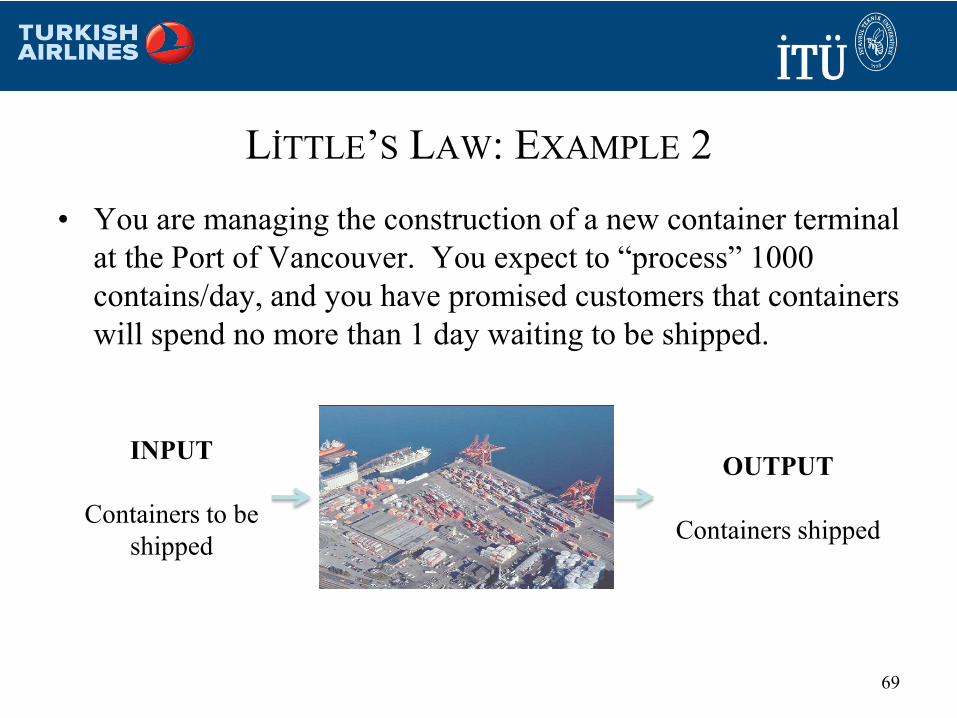
• You are managing the construction of a new container terminal
at the Port of Vancouver. You expect to “process” 1000
contains/day, and you have promised customers that containers
will spend no more than 1 day waiting to be shipped.
69
INPUT
Containers to be
shipped
OUTPUT
Containers shipped
LİTTLE’S LAW: EXAMPLE 2
Question (a)
• On average, your container storage yard can hold 500
containers.
• Is your yard big enough?
70
LİTTLE’S LAW: EXAMPLE 2Question (b)
• Suppose the yard is expanded to hold 2000 containers
• Since container traffic is growing rapidly, you are soon
processing 2000 containers/day
• You are asked to make improvement to the terminal to
handle 4000 containers/day
• But there is no more room to expand the yard
• What changes can you make in order to process 4000
containers/day?
71
INSİGHTS FROM LİTTLE’S LAW
• Throughput rate, flow time, and inventory are related
• Depending on the situation, a manager can influence any
one of these measures by controlling the other two
– You cannot independently choose flow time, throughput and
inventory levels!
– Once two are chosen, the third is determined
– For example, if the flow time is fixed, the only way to reduce
inventory is to increase throughput
72
INSİGHTS FROM LİTTLE’S LAW
• How would you reduce wait time for patients on the
transplant waiting list?
– Increase throughput rate
– Decrease number of people on the list (inventory)
• How would you increase throughput rate of containers at
the port
– Decrease flow time
– Increase “inventory”
73
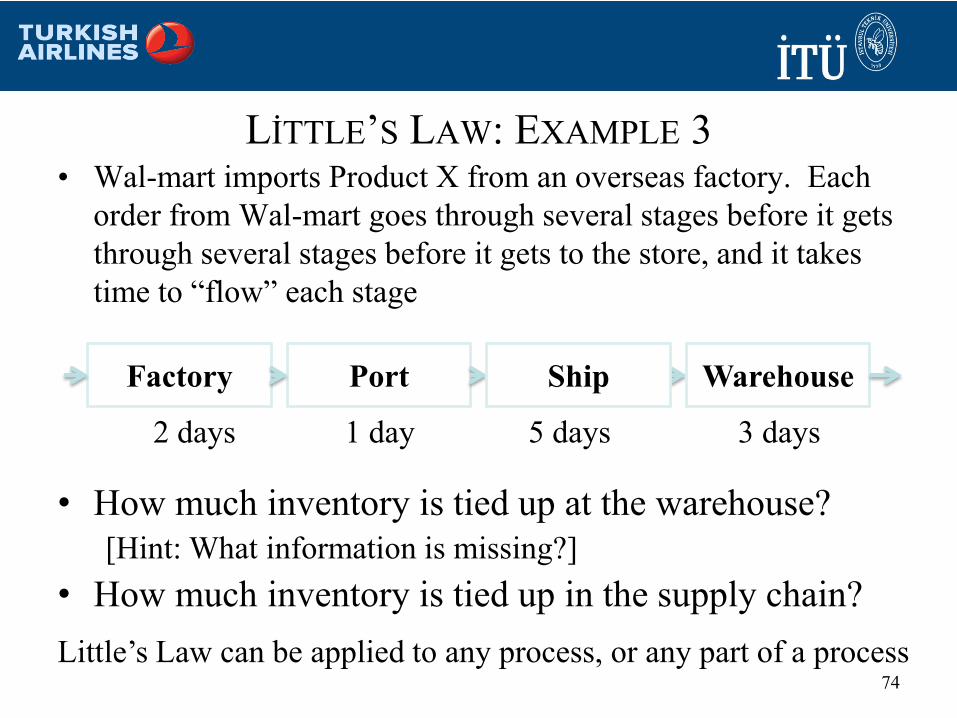
LİTTLE’S LAW: EXAMPLE 3• Wal-mart imports Product X from an overseas factory. Each
order from Wal-mart goes through several stages before it gets
through several stages before it gets to the store, and it takes
time to “flow” each stage
74
Port
1 day
Ship WarehouseFactory
2 days 5 days 3 days
• How much inventory is tied up at the warehouse?
[Hint: What information is missing?]
• How much inventory is tied up in the supply chain?
Little’s Law can be applied to any process, or any part of a process
LESSONS
• Capacity rate versus throughput rate (Utilization)
• “Short-run” versus “long-run” averages
• Input and output rates vary over time resulting in
– Excess capacity
– Inventory build-ups
• Inventory build-up diagrams are useful tools, but
– Average can be misleading; need to be carefully calculated
• Little’s Law helps make the connection between average
flow measures
• 3 key performance measures-inventory, flow rate, flow
time
75
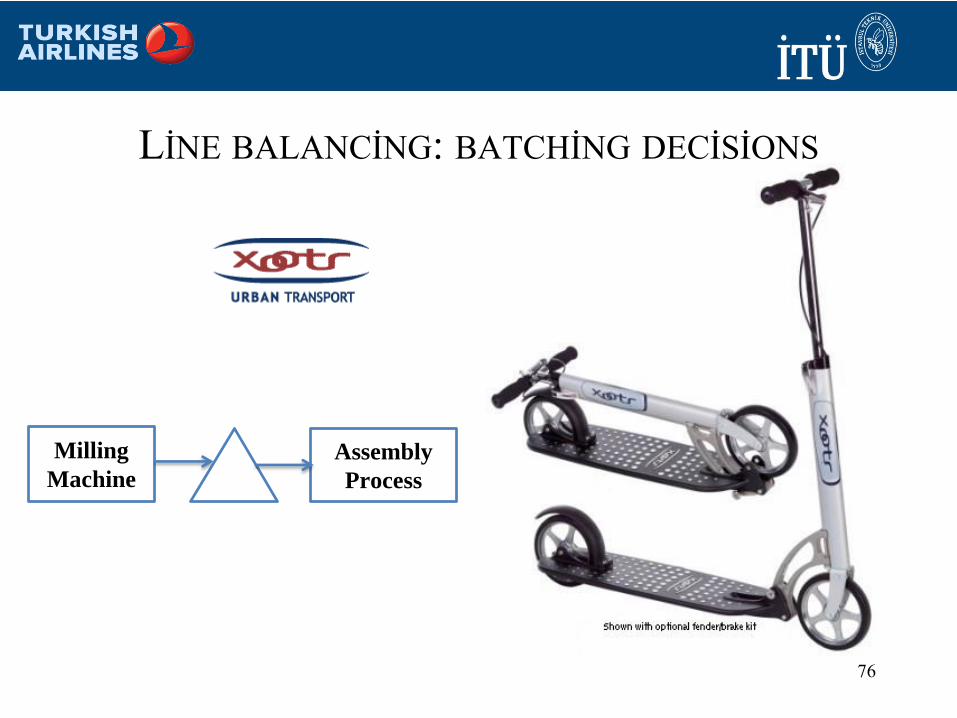
LİNE BALANCİNG: BATCHİNG DECİSİONS
76
Milling
Machine
Assembly
Process
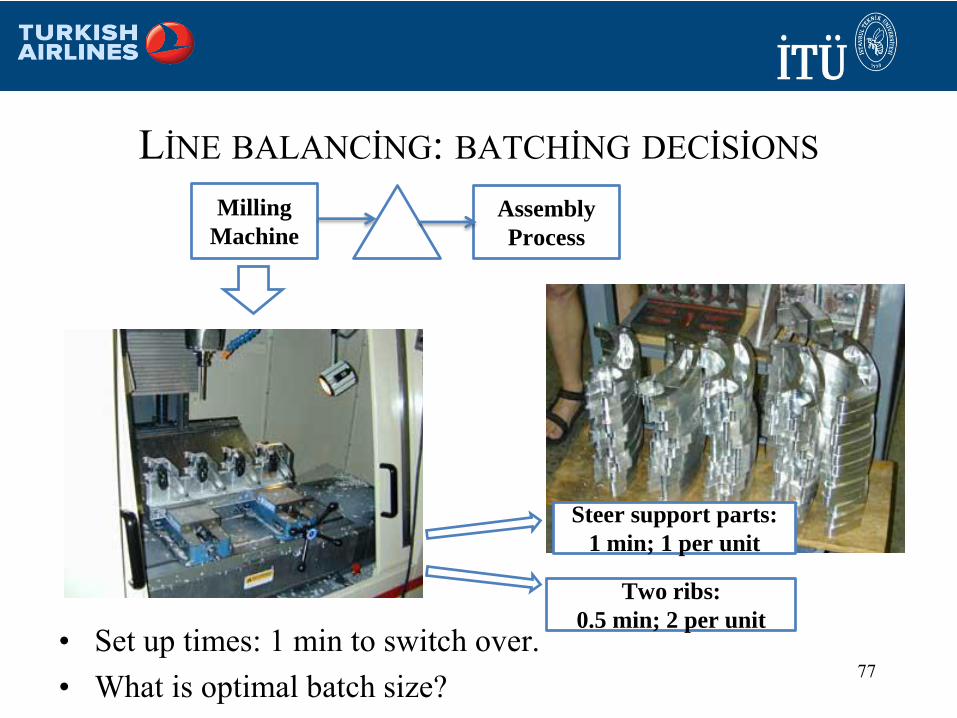
LİNE BALANCİNG: BATCHİNG DECİSİONS
77
Milling
Machine
Assembly
Process
Steer support parts:
1 min; 1 per unit
Two ribs:
0.5 min; 2 per unit• Set up times: 1 min to switch over.
• What is optimal batch size?
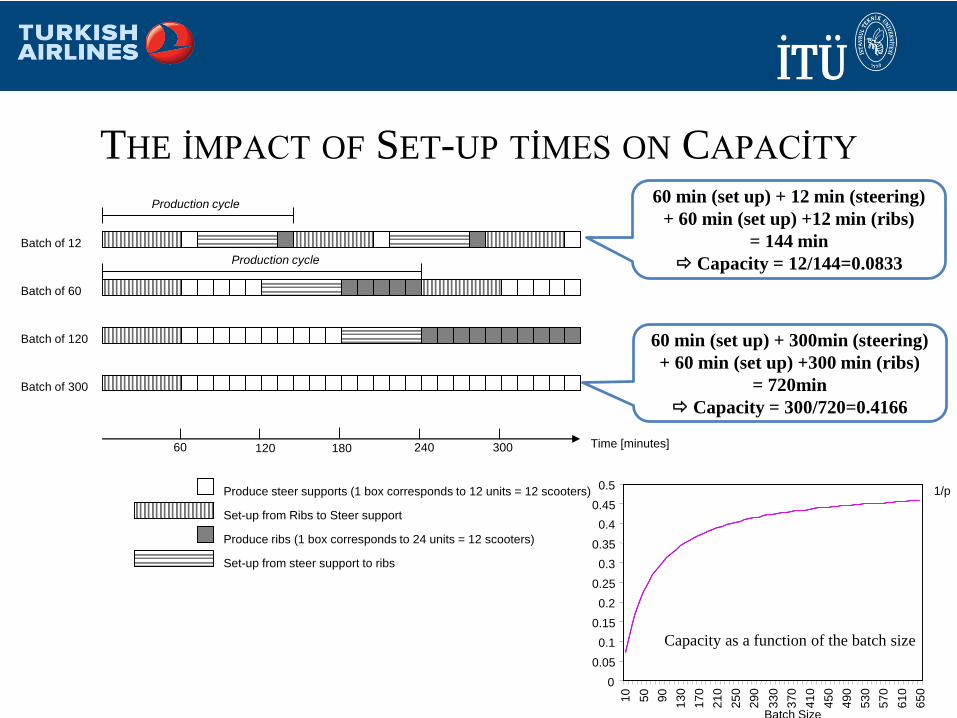
THE İMPACT OF SET-UP TİMES ON CAPACİTY
78
Batch of 12
Batch of 60
Batch of 120
Batch of 300
Time [minutes]60 120 180 240 300
Set-up from Ribs to Steer support
Set-up from steer support to ribs
Produce ribs (1 box corresponds to 24 units = 12 scooters)
Produce steer supports (1 box corresponds to 12 units = 12 scooters)
Production cycle
Production cycle
60 min (set up) + 12 min (steering)
+ 60 min (set up) +12 min (ribs)
= 144 min
Capacity = 12/144=0.0833
60 min (set up) + 300min (steering)
+ 60 min (set up) +300 min (ribs)
= 720min
Capacity = 300/720=0.4166
1/p
0
0.05
0.1
0.15
0.2
0.25
0.3
0.35
0.4
0.45
0.5
10
50
90
13
0
17
0
21
0
25
0
29
0
33
0
37
0
41
0
45
0
49
0
53
0
57
0
61
0
65
0
Batch Size
Capacity as a function of the batch size
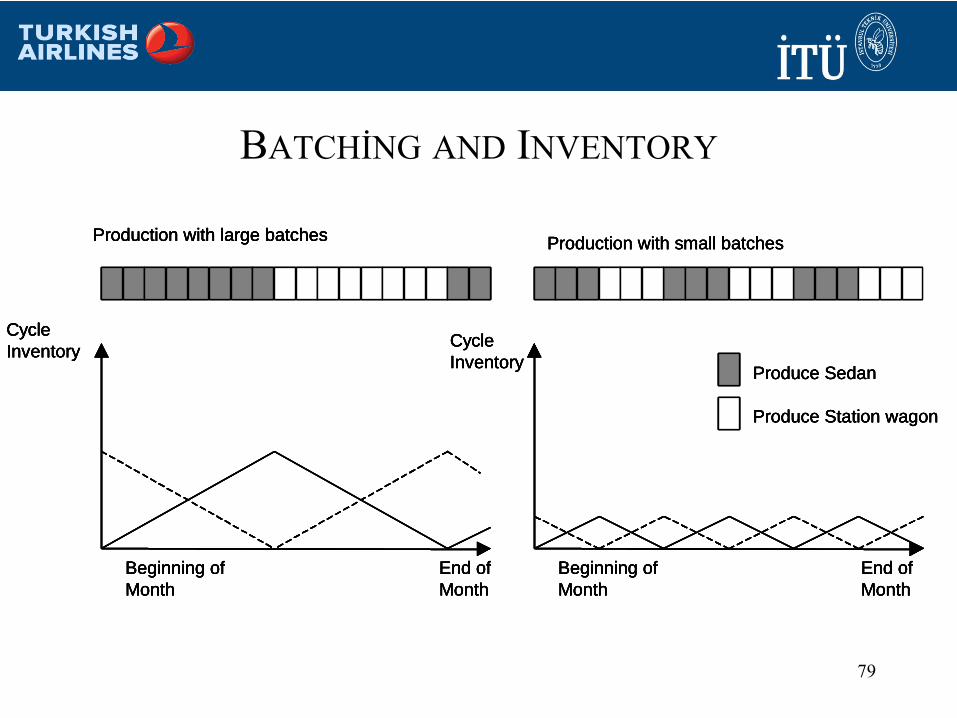
BATCHİNG AND INVENTORY
79
Production with large batches Production with small batches
Cycle
Inventory
End of
Month
Beginning of
Month
Cycle
Inventory
End of
Month
Beginning of
Month
Produce Sedan
Produce Station wagon
Production with large batches Production with small batches
Cycle
Inventory
End of
Month
Beginning of
Month
Cycle
Inventory
End of
Month
Beginning of
Month
Produce Sedan
Produce Station wagon
Production with large batches Production with small batches
Cycle
Inventory
End of
Month
Beginning of
Month
Cycle
Inventory
End of
Month
Beginning of
Month
Produce Sedan
Produce Station wagon
Production with large batches Production with small batches
Cycle
Inventory
End of
Month
Beginning of
Month
Cycle
Inventory
End of
Month
Beginning of
Month
Produce Sedan
Produce Station wagon
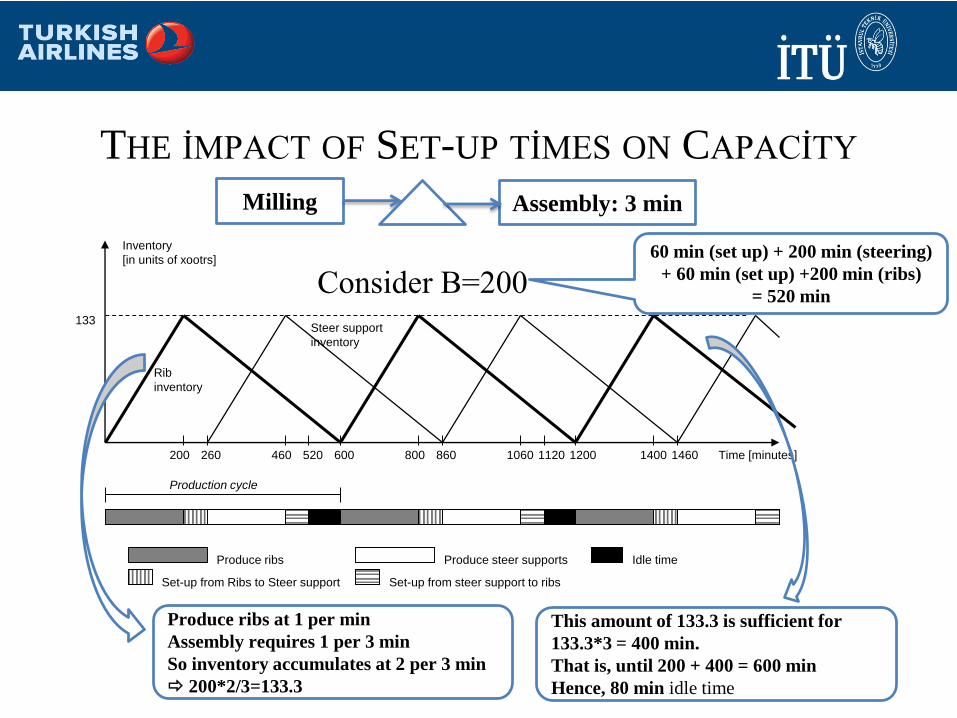
THE İMPACT OF SET-UP TİMES ON CAPACİTY
80
Inventory
[in units of xootrs]
Time [minutes]200 260 600
Set-up from Ribs to Steer support Set-up from steer support to ribs
Produce ribs Produce steer supports
Production cycle
460 520 800 860 12001060 1120 1400 1460
Idle time
133
Rib
inventory
Steer support
inventory
Consider B=20060 min (set up) + 200 min (steering)
+ 60 min (set up) +200 min (ribs)
= 520 min
Milling Assembly: 3 min
Produce ribs at 1 per min
Assembly requires 1 per 3 min
So inventory accumulates at 2 per 3 min
200*2/3=133.3
This amount of 133.3 is sufficient for
133.3*3 = 400 min.
That is, until 200 + 400 = 600 min
Hence, 80 min idle time
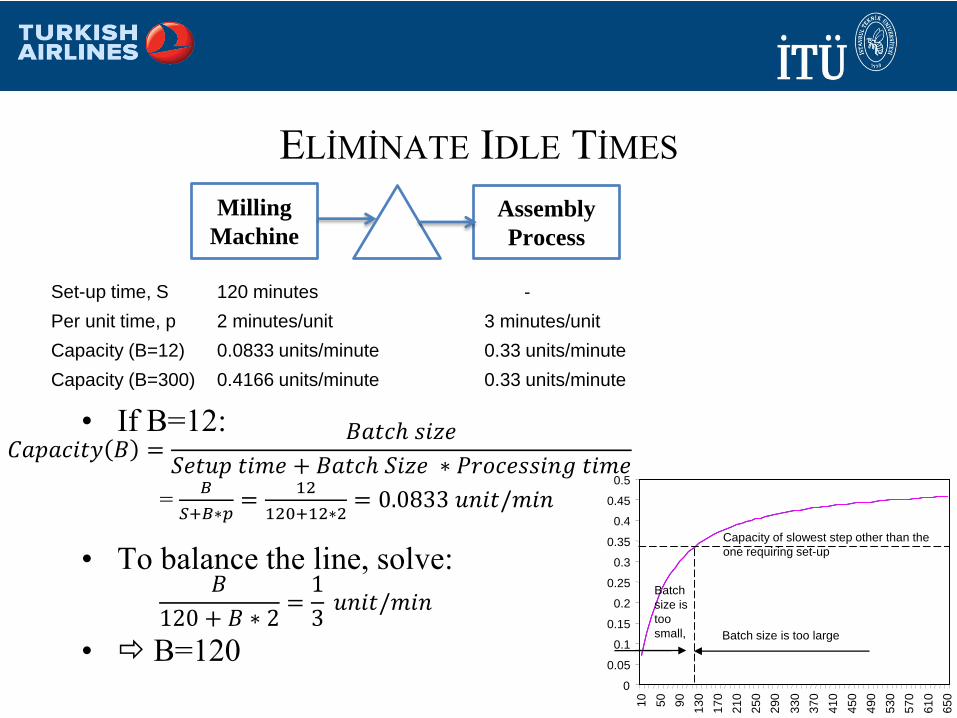
ELİMİNATE IDLE TİMES
• If B=12:
• To balance the line, solve:
• B=12081
Milling
Machine
Assembly
Process
Set-up time, S 120 minutes -
Per unit time, p 2 minutes/unit 3 minutes/unit
Capacity (B=12) 0.0833 units/minute 0.33 units/minute
Capacity (B=300) 0.4166 units/minute 0.33 units/minute
𝐶𝑎𝑝𝑎𝑐𝑖𝑡𝑦 𝐵 =𝐵𝑎𝑡𝑐ℎ 𝑠𝑖𝑧𝑒
𝑆𝑒𝑡𝑢𝑝 𝑡𝑖𝑚𝑒 + 𝐵𝑎𝑡𝑐ℎ 𝑆𝑖𝑧𝑒 ∗ 𝑃𝑟𝑜𝑐𝑒𝑠𝑠𝑖𝑛𝑔 𝑡𝑖𝑚𝑒
= 𝐵
𝑆+𝐵∗𝑝=
12
120+12∗2= 0.0833 𝑢𝑛𝑖𝑡/𝑚𝑖𝑛
𝐵
120 + 𝐵 ∗ 2=1
3𝑢𝑛𝑖𝑡/𝑚𝑖𝑛
0
0.05
0.1
0.15
0.2
0.25
0.3
0.35
0.4
0.45
0.5
10
50
90
13
0
17
0
21
0
25
0
29
0
33
0
37
0
41
0
45
0
49
0
53
0
57
0
61
0
65
0
Capacity of slowest step other than the
one requiring set-up
Batch size is too large
Batch
size is
too
small,
82
PROCESS MEASURES: FLOW MEASURES
• Identify “flow units”
– What is my “product”?
• Flow Rates (Input Rate and Output Rate)
– What is the demand on my system, and what is my capacity?
• Flow Times (Time spent in process)
– How long does it take me to produce one “product”?
• Inventory
– How much inventory (of flow units) is building up?
– Where do I need to hold inventory?