Embed Size (px)
Citation preview

Barker, Marvin, and Curtin: Understanding Risk in Evacuation Operations 1
Understanding Operational Risk in Evacuation Operations
Using Spatially Explicit Network Simulation
Alec D. Barker,1,2,3
Brett L. Marvin,1,4
Kevin M. Curtin3
1 Operations Analysis Division, United States Marine Corps Combat Development Command, 3300
Russell Road, Quantico VA 22134, USA
2 Group W Inc., 8315 Lee Highway, Suite 400, Fairfax VA 22031, USA
3 Department of Geography and Geoinformation Science, George Mason University, 4400 University
Drive, MS 6C3, Fairfax VA 22030, USA
4 School of Public Policy, University of Maryland, 2101 Van Munching Hall, College Park MD 20742,
USA
A Manuscript Submitted to Military Operations Research
Abstract: Joint forces execute noncombatant evacuation operations (NEOs) in order to protect
civilians from the effects of natural and/or manmade disasters. These operations are logistically
sophisticated, involving the rapid and coordinated movement of assets and people across great
distances while exposed to many different hazards. Joint force planners may benefit from tools
that help them understand and anticipate how well their NEO plans will perform under various
risk conditions. This paper proposes methods and a tool to understand the operational risks that
arise in NEOs. ESCAPE is a simulation model that integrates geographic information analysis,
network flow algorithms, time-expanded networks, step-variable cost functions, formal concept
analysis, and Monte Carlo methods to produce a probabilistic distribution of mission outcomes
using total evacuation time as a key measure of performance. ESCAPE is applied to a historical
case study of the U.S. military’s NEO in the eastern Mediterranean Sea that arose from the 34-
day military conflict between Israel and Hezbollah in Lebanon in the summer of 2006. This
paper demonstrates how joint force planners can better assess resource trades by studying their
operational risks with a quantitative model that incorporates techniques from geography and
operations research.
Application Area: Joint Campaign Analysis
OR Method: Network Methods
Note: This paper was produced under a United States Government contract awarded by the
United States Marine Corps. The information contained in this article is unclassified and
approved for public release by the Operations Analysis Division of the U.S. Marine Corps
Combat Development Command. The views expressed in this paper are those of the authors and
do not reflect the official policy or position of the United States Marine Corps, Department of
Defense, or the United States Government.

2 Under Review, Military Operations Research
1. INTRODUCTION
Noncombatant Evacuation Operations (NEOs) are diplomatic and military activities to
quickly remove compatriot and allied civilian citizens from danger in a foreign country. Joint
forces, especially Air Force, Marine Corps, and Navy units are often called upon, with little
advance warning, to perform NEOs. The danger precipitating a NEO may originate from natural
causes such as earthquakes, floods, and hurricanes, or anthropogenic causes such as war, crime,
or civil unrest. NEOs are complex and time-sensitive operations involving the rapid mobilization
and deployment of numerous capabilities to move people and equipment over long distances to
safety.
One difficulty with NEO planning is that the likely effectiveness of a plan cannot be
usefully anticipated by intuition. Joint force planners cannot easily estimate in advance how
many or what type of resources and capabilities will be required to achieve an evacuation target.
The consequence is that joint force planners may either commit resources indefinitely -
decreasing their ability to respond adequately to other contingencies - or they may fail to
proactively allocate sufficient resources to the NEO, exposing evacuees to grave possibilities
involving injury or death. While there are numerous methods and tools useful to support
evacuation planning, there remains a demand for an integrated planning support capability that
specializes in the NEO problem set. Such a capability might help planners to better understand,
for example, that the minimum resources required to achieve a targeted total evacuation time are
far greater or far lesser than otherwise expected.
This paper proposes an integrated modeling approach appropriate for NEO planning support
and applies this approach to a case study of the U.S. Navy’s and U.S. Marine Corps’ NEO in the
eastern Mediterranean Sea that arose from the 34-day military conflict between Israel and
Hezbollah in Lebanon in 2006. The paper consists of six sections. The literature review and
Barker, Marvin, and Curtin: Understanding Risk in Evacuation Operations 3
background surveys prior research in evacuation modeling and presents the historical
circumstances of the case study. The methods section describes the modeling approach and the
tool it produced, the Evacuation Simulation for Cost and Performance Evaluation (ESCAPE).
The data section outlines the geographic, transportation, and operational information that
provided input to ESCAPE. The results section presents the outputs gained from ESCAPE in
analyzing the factual events of 2006 as well as the potential events of one plausible operational
alternative. The conclusion section assesses the meaning and utility of the results as well as the
significance of the ESCAPE approach to future NEO planning efforts. The future research
section sketches an agenda to sustain improvements to joint force planning for noncombat
operations.
2. LITERATURE REVIEW and BACKGROUND
Among operations researchers, human geographers, and computational scientists, the topic
of transportation network modeling is well-trodden ground (Curtin, 2007; Magnanti and Wong,
1984; Papageorgiou et al., 2003). Generally, there are deterministic and stochastic model types
and the treatments of evacuation evolve from the techniques of network flow, agent-based,
and/or physics-based modeling. The scope of analysis may vary from the level of a room or
building to a neighborhood or to a large geographic region.
Engineering, architecture, and urban planning professionals have frequently confronted the
need to model evacuations. As a consequence of disasters like the 1911 Triangle Shirtwaist
Factory fire, the maximization of egress flows, and therefore the design of egress routes, is an
essential component of modern urban architecture (Thompson and Marchant, 1995; Tubbs and
Meacham, 2007). Over the last several decades, network flow models have contributed an ever-
growing awareness of evacuation factors to building design (Çağdaş and Sağlamer, 1995;
4 Under Review, Military Operations Research
Chalmet et al., 1982; Choi et al., 1988; Huang and Shekhar, 2003; Shen, 2005; Weinroth, 1989).
Similarly, network models have assisted with urban traffic management difficulties like
congestion, accident routing, and dynamic demand (Church and Sexton, 2002; Daganzo, 1995;
Janson, 1991; Kobayashi et al., 2001; Watling, 1991). At the regional level, network flow
approaches have helped improve evacuation operations in the aftermath of natural and manmade
disasters like hurricanes, chemical exposures, and wildfires (Church and Cova, 2000; Cova and
Church, 1997; Southworth, 1991; Yamada, 1996).
Many evacuation models are spatially explicit and focus on emergency transportation
problems. Objectives include knowing where to route evacuees along a transportation network,
understanding where to locate potentially hazardous facilities, and understanding the spatial
extent of danger zones (Cova and Church, 1997; Pidd et al., 1996). Some models directly
integrate Geographic Information Systems (GIS) and simulation in order to produce Spatial
Decision Support Systems used to improve evacuation planning and execution (Church and
Cova, 2000). Spatial evacuation modeling has been demonstrated as an effective tool to
understand evacuation risk and the estimated time needed to clear a population from a danger
zone (De Silva and Eglese, 2000; Pidd et al., 1996).
NEOs are a particular kind of short notice regional evacuation that usually involves aerial,
naval, and combined air-sea transportation modes. Owing to evacuation experiences since 1991
in Sub-Saharan Africa, the Philippines, Albania, and Lebanon, the U.S. Government has devoted
increasing resources and attention to NEOs, resulting in improved doctrine and policies (Carter,
2013; Clinton, 1998; Ford et al., 2007b; Standifer, 2008; United States Department of Defense,
1997). Major risk factors associated with NEOs include military communications and
coordination with the civilian evacuation coordinators (Dingbaum, 1998; Lee, 1997; Siegel,
1991; Standifer, 2008), the performance of complex logistical functions from ship-based

Barker, Marvin, and Curtin: Understanding Risk in Evacuation Operations 5
platforms (Hagan, 1998), the potential use of force, the availability of support capabilities such
as medical care (Clark, 1995), problematic coordination among geographic component
commands (Snyder, 2007), and/or the absence of NEO-specific training (Stahl, 1992). Prior
efforts to model NEOs have involved discrete event simulation (Gregg, 2010; Olsen, 2011;
Scheer, 2011) and discrete event simulation with detailed simulation-independent animation
(Sumner and Zahn, 1996).
The 2006 NEO in the Eastern Mediterranean Sea was precipitated by the rapid outbreak of
hostilities between the Israeli Defense Forces and the Lebanon-based militant forces of
Hezbollah. The U.S. Ambassador in Lebanon requested military assistance with the evacuation
of thousands of U.S. and Allied citizens from a single Evacuation Control Center (ECC) in
Beirut on 14 July, 2006. This led to a 15 day effort to remove many thousands of evacuees from
the Port of Beirut with the support of the Lebanese Government.
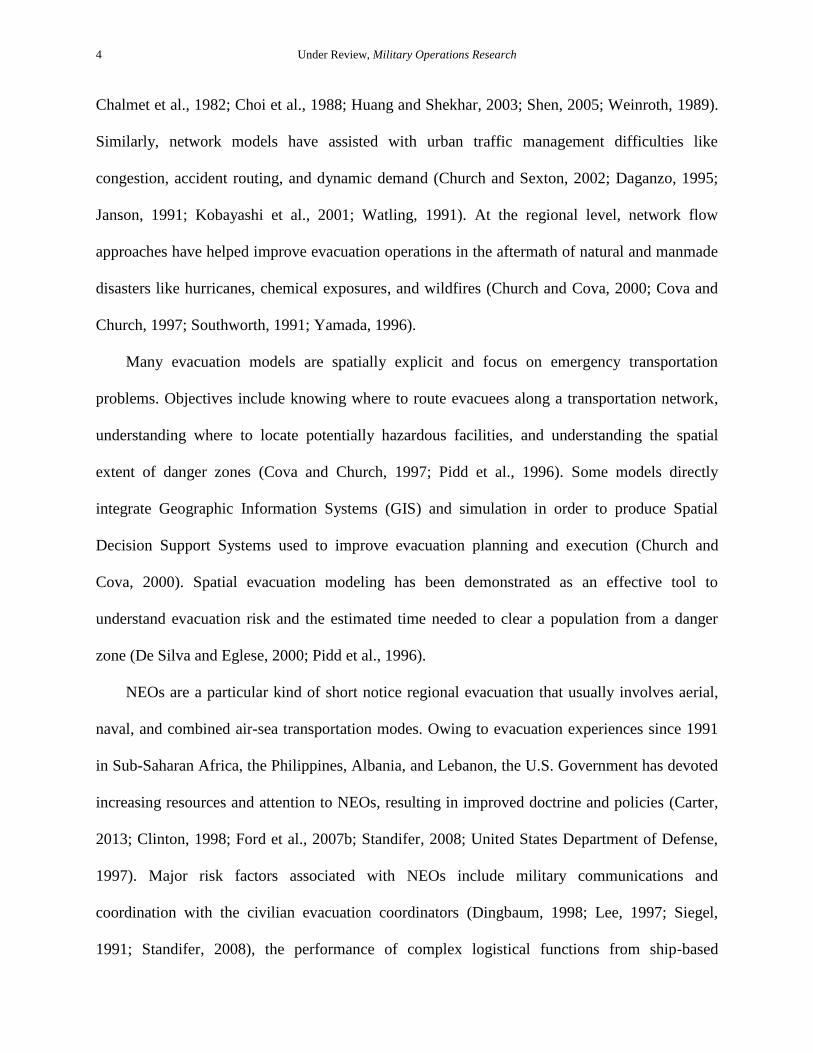
Although officially stated estimates are that about 15,000 evacuees were removed from
Lebanon (Ford et al., 2007a), there is only enough specific data available to trace the movement
of 13,846 evacuees (Harris, 2006). The task force transported evacuees to either of two safe areas
to receive shelter and await repatriation by commercial air travel: Limassol-Larnaca, Cyprus and
Mersin-Incirlik Air Base, Turkey. Figure 1 illustrates the area of operations in 2006.

6 Under Review, Military Operations Research
Figure 1: The Area of Operations in 2006
The U.S. Navy deployed a naval task force embarked with a Marine Expeditionary Unit
(MEU) to support the NEO. A MEU is a multi-capable amphibious task force comprised of
about 2,400 Marines and Sailors. While there were many ships that participated in the
evacuation, the ships that were directly involved in moving evacuees out of Lebanon were the
USS Iwo Jima (LHD 7), USS Trenton (LPD 13), USS Nashville (LPD 14), and the USS
Whidbey Island (LSD 41). Numerous CH-53 and CH-46 helicopters deployed with these ships to
provide air evacuation capabilities. Table 1 summarizes the facts of the 2006 NEO as derived
from authoritative sources (Ford et al., 2007a; Harris, 2006).
Barker, Marvin, and Curtin: Understanding Risk in Evacuation Operations 7
Table 1: A Summary of the Evacuation Activities of the 2006 NEO in Lebanon
3. METHODS
The research described here resulted in the generation of a simulation model called
ESCAPE. ESCAPE is spatially explicit in that it incorporates spatial representations and
Date Evacuation Activity Description MIL COM Evacuated
15-Jul-06 3 helicopters arrive at Larnaca X 0
16-Jul-06 2 helicopters evacuate 21 (1 sortie) from Beirut to Larnaca X 21
17-Jul-06 2 helicopters evacuate 42 (2 sorties) from Beirut to Larnaca X 42
2 helicopters evacuate 242 (2 sorties) from Beirut to Larnaca X 242
1 merchant vessel evacuates 1066 from Beirut to Limassol X 1066
1 merchant vessel evacuates 126 from Beirut to Limassol X 126
19-Jul-06 2 helicopters evacuate 157 (3 sorties) from Beirut to Larnaca X 157
2 helicopters evacuate 191 (4 sorties) from Beirut to Larnaca X 191
The USS Nashville (LPD 14) evacuates 1058 from Beirut to Larnaca X 1058
1 merchant vessel evacuates 160 from Beirut to Limassol X 160
1 merchant vessel evacuates 874 from Beirut to Limassol X 874
2 helicopters evacuate 191 (2 sorties) from Beirut to Larnaca X 191
The USS Trenton (LPD 13) evacuates 1854 from Beirut to Limassol X 1854
The USS Nashville (LPD 14) evacuates 1130 from Beirut to Limassol X 1130
1 merchant vessel evacuates 824 from Beirut to Limassol X 824
2 helicopters evacuate 40 (2 sorties) from Beirut to the USS Whidbey Island (LSD 41) X 40
The USS Whidbey Island (LSD 41) evacuates 817 from Beirut to Limassol X 817
The USS Trenton (LPD 13) evacuates 1641 from Beirut to Mersin X 1641
The USS Nashville (LPD 14) evacuates 526 from Beirut to Limassol X 526
2 helicopters evacuate 28 (1 sortie) from Beirut to Larnaca X 28
1 merchant vessel evacuates 776 from Beirut to Limassol X 776
1 merchant vessel evacuates 154 from Beirut to Limassol X 154
2 helicopters evacuate 40 (1 sortie) from Beirut to Larnaca X 40
1 merchant vessel evacuates 282 from Beirut to Limassol X 282
1 merchant vessel evacuates 489 from Beirut to Limassol X 489
1 merchant vessel evacuates 173 from Beirut to Limassol X 173
1 merchant vessel evacuates 379 from Beirut to Limassol X 379
1 merchant vessel evacuates 250 from Beirut to Limassol X 250
27-Jul-06 2 helicopters evacuate 2 (1 sortie) from Beirut to Larnaca X 2
2 helicopters evacuate 5 (1 sortie) from Beirut to Larnaca X 5
1 merchant vessel evacuates 308 from Beirut to Limassol X 308
29-Jul-06 Operations suspended X 0
7985
5861
13846
28-Jul-06
22-Jul-06
23-Jul-06
Total
Commercial (COM) Evacuees
Military (MIL) Evacuees
26-Jul-06
20-Jul-06
18-Jul-06
21-Jul-06
24-Jul-06
25-Jul-06
8 Under Review, Military Operations Research
differentiates behaviors and predictions according to the spatial locations of the objects that it
models (Goodchild and Janelle, 2004). ESCAPE depends on a dynamic network flow model that
abstracts the flow of evacuees across a transportation network comprised of arcs with capacities
that vary over multiple periods in time (Aronson, 1989; Glockner and Nemhauser, 2000; Jarvis
and Ratliff, 1982; Lu et al., 2003). ESCAPE is in the family of minimum cost flow models in that
it employs a modified version of the Capacity Scaling Minimum Cost Flow algorithm developed
by Orlin (Ahuja et al., 1993; Orlin, 1993). Whereas Orlin’s algorithm originally assumed fixed
transit costs per arc and unit, this implementation uses a step-variable transit cost function.
ESCAPE uses Monte Carlo methods to test planning assumptions and Formal Concept Analysis
to associate these assumptions with their operational effects (Fishman, 1996; Ganter and Wille,
1997). In this simulation, faulty planning assumptions result in decremented arc capacities and/or
increased arc costs.
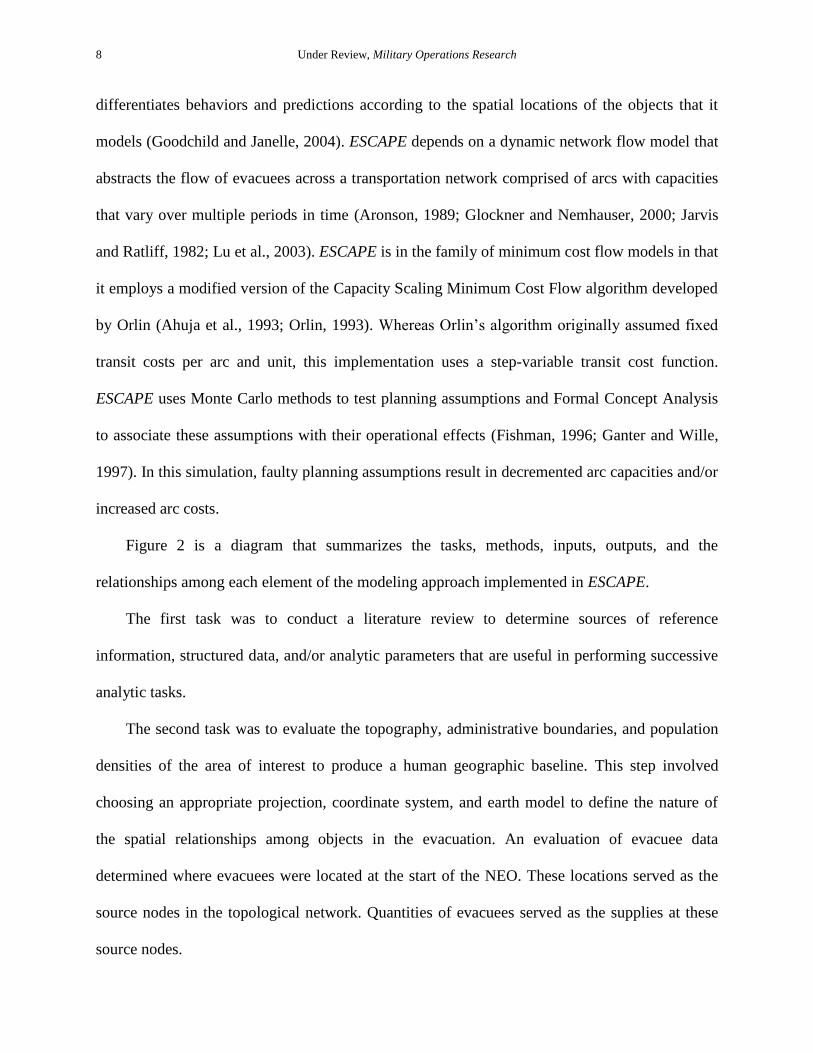
Figure 2 is a diagram that summarizes the tasks, methods, inputs, outputs, and the
relationships among each element of the modeling approach implemented in ESCAPE.
The first task was to conduct a literature review to determine sources of reference
information, structured data, and/or analytic parameters that are useful in performing successive
analytic tasks.
The second task was to evaluate the topography, administrative boundaries, and population
densities of the area of interest to produce a human geographic baseline. This step involved
choosing an appropriate projection, coordinate system, and earth model to define the nature of
the spatial relationships among objects in the evacuation. An evaluation of evacuee data
determined where evacuees were located at the start of the NEO. These locations served as the
source nodes in the topological network. Quantities of evacuees served as the supplies at these
source nodes.
Barker, Marvin, and Curtin: Understanding Risk in Evacuation Operations 9
Figure 2. A process diagram of the modeling approach
The geographic analysis also produced a distance matrix containing the inter-point distances
of each node in geographic space. This information supported the development of cost matrices
for air and maritime modes of transportation. Geographic Information Systems enabled this task
and the next task: transportation analysis.
The third task was to study transportation networks and equipment characteristics to
understand what will be the costs, in terms of time, to move evacuees on each route by each
mode of transit. This task began by identifying the likely evacuation routes by equipment type.
This analysis also determined transit nodes between the sources and the sinks, which together
constitute the set of nodes (N) of the network flow model. Identifying every tail node (i) and
head node (j) and the routes among them defined the set of arcs (A) of the network flow model.
10 Under Review, Military Operations Research
Further analysis determined the inter-point distances of each node in network space. These
distances applied to the ground transportation modes in the modeled evacuation network.
Thereafter, application of average speed by equipment type allowed the analysis of nominal
arc costs and assemblage of a cost matrix. Nominal arc costs refer to the time associated with
transiting an arc according to a particular mode of transit and vehicle under generic conditions.
Real arc costs (Cij (i,j)A), which are specific to the modes of transportation and equipment
associated with a particular evacuation plan, were adjusted from nominal arc costs in the
following task, operations analysis.
The fourth task was to extract from the joint force’s plans and alternate plans arc capacities,
probabilities associated with planning assumptions, and critical dependencies associated with
each planning assumption. The assignment of transportation assets to routes in each plan
determined the arc capacities (Uij (i,j)A) by constraining the number of passengers that may
have been moved along any route.
Some plans called for multiple trips, called sorties (Sij (i,j)A), along the same route with
the same vehicle(s). The arc capacities were multiplied by the total number of sorties on an arc to
derive the multiple-sortie capacity on each arc (Mij = Sij(Uij) (i,j)A).
Any plan arises from choices people make about alternative courses of action (Davidoff and
Reiner, 1962). Each of these alternatives contains assumptions upon which critical operational
capabilities ultimately depend (Mason, 1969). Planning assumptions are both implicitly and
explicitly asserted.
The process of extracting assumptions and dependencies from a plan can be supported with
a formal analytical technique such as Formal Concept Analysis or FCA (Ganter and Wille,
1997). FCA involves representing data in hierarchical structures known as concept lattices.

Barker, Marvin, and Curtin: Understanding Risk in Evacuation Operations 11
Functionally, concept lattices organize objects into sets of subconcept-superconcept relations
(Wille, 2009). Although the design of concept lattices is to support mathematical investigation,
they are also helpful as a generic form of knowledge representation. The adaptation and
application of FCA in the analysis of military plans has produced useful lattices that interrelate
assumptions, tasks, and objectives (Ham et al., 2010).
Each assumption was associated with a probability (or range of probabilities, in the case of
fuzzy logic) that it will not hold true in a real situation. We represented the probability that
assumption x will be false with notation Pfx. Ideally these probabilities should derive from
empirical distributions. Where appropriate data are not available, these probabilities may be
asserted by expert judgment.
Similarly, the plan’s capabilities and activities may derive negative effects from a false
assumption. We represented the effect upon capability y when assumption x is false with notation
Dyfx. Where an assumption was a subconcept and a capability was a superconcept in a concept
pair, the relationship between both concepts was called here a dependency.
The nature of the dependency should also derive from empirical observations. For example,
it is predictable that when weather conditions deteriorate to a particular extent, helicopter
aviation becomes too dangerous to execute and helicopter flights cease. Again, where
appropriate data are not available, these dependencies may be asserted by expert judgment.
The fifth task was to produce a dynamic network flow model using modified network flow
algorithms. This model held all variables constant and computed flows (Xij (i,j)A)
deterministically.
Since the structure and capabilities of the evacuation network varied throughout time
according to the operational design in the plan, the network needed to be time-expanded. It is
necessary to represent this variability by changing arc capacities, sorties, and costs at each time
12 Under Review, Military Operations Research
step t. Transit routes that do not exist or are otherwise unviable at any point in the plan had zero
capacity and no sorties.
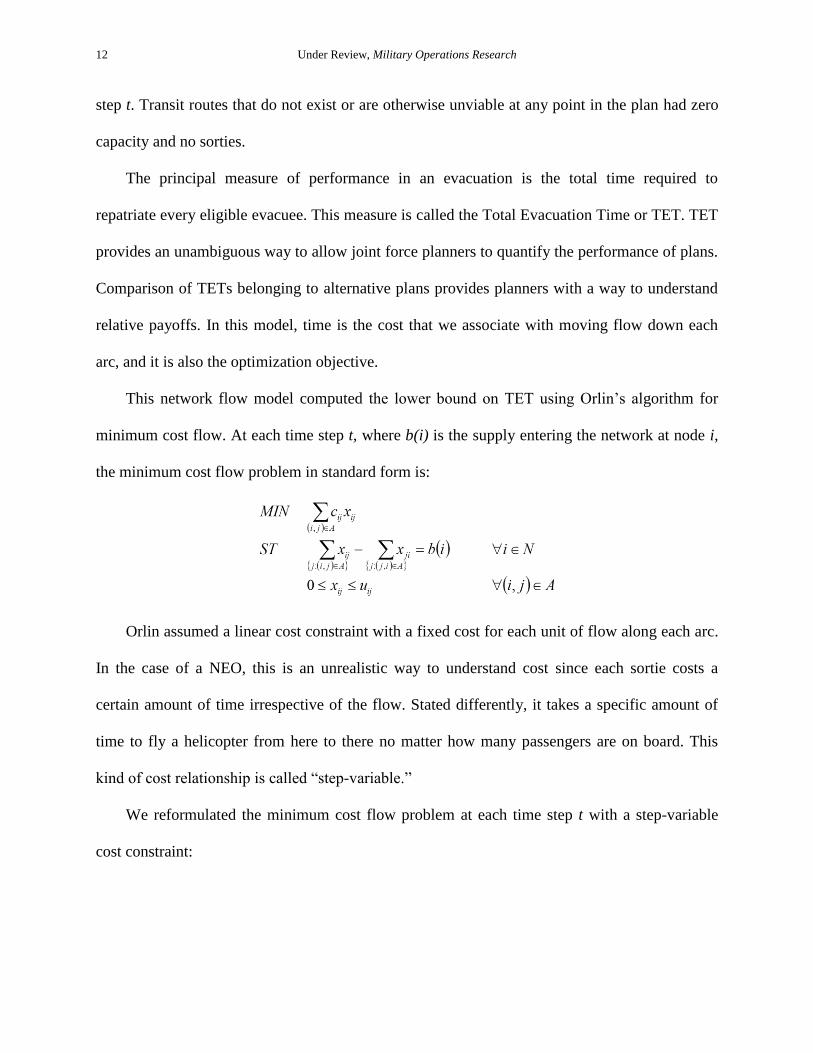
The principal measure of performance in an evacuation is the total time required to
repatriate every eligible evacuee. This measure is called the Total Evacuation Time or TET. TET
provides an unambiguous way to allow joint force planners to quantify the performance of plans.
Comparison of TETs belonging to alternative plans provides planners with a way to understand
relative payoffs. In this model, time is the cost that we associate with moving flow down each
arc, and it is also the optimization objective.
This network flow model computed the lower bound on TET using Orlin’s algorithm for
minimum cost flow. At each time step t, where b(i) is the supply entering the network at node i,
the minimum cost flow problem in standard form is:
Orlin assumed a linear cost constraint with a fixed cost for each unit of flow along each arc.
In the case of a NEO, this is an unrealistic way to understand cost since each sortie costs a
certain amount of time irrespective of the flow. Stated differently, it takes a specific amount of
time to fly a helicopter from here to there no matter how many passengers are on board. This
kind of cost relationship is called “step-variable.”
We reformulated the minimum cost flow problem at each time step t with a step-variable
cost constraint:
Barker, Marvin, and Curtin: Understanding Risk in Evacuation Operations 13
Using this formulation, the model optimized flow across the evacuation network to
minimize TET at each time step t, which was set to one day increments. If at a given time step,
supply remained and all capacity was exhausted, then the residual supply was carried over to the
next time step. The optimization was repeated for successive time steps until either no supply
remained (and all of the evacuees had been successfully repatriated) or no more time steps
remained in the plan (and some amount of evacuees remained in the evacuation zone). The
results of the optimization were the TET, the set of arcs (routes, equipment types, and sortie
quantities) that achieved this TET, and the flows (passenger quantities) to move on each arc. We
repeated the optimization for the alternative plan and derived a point estimate of TET for each.
We may begin to understand operational risk by comparing the estimated TETs and the
resources required by each plan. This is the way in which joint force planners might understand,
for example, that they can expect to achieve an acceptable TET with far fewer resources than
they had first allocated.
The sixth task was to convert the network flow model into a network flow simulation model
using Monte Carlo methods and the probabilities and dependencies associated with each plan. At
each time step and for every assumption x, the simulation drew a random number r such that 0 <
r < 1. If r < Pfx, then x is false. For every capability y that depended upon x, there was a
dependency Dyfx that resulted in either decremented capacity or increased cost along a
corresponding arc in the evacuation network. The simulation then applied the minimum cost
flow algorithm. Repeating this process numerous times, ESCAPE derived a probabilistic
14 Under Review, Military Operations Research
distribution of TET, associated with a plan, given a set of probabilities and dependencies.
Comparison of TET, probabilities, dependencies, and associated confidence intervals provided a
sense of the risk associated with each plan.
4. DATA
The geographic data and the road network data were obtained from the United Nations
Office for the Coordination of Humanitarian Affairs Common and Fundamental Operational
Datasets Registry (United Nations Office for the Coordination of Humanitarian Affairs, 2012).
Boundary data was provided by the GADM database of Global Administrative Areas (Hijmans,
2012). The operational data were collected from after-action reports and other reports referenced
above (Ford et al., 2007a; Ford et al., 2007b, Snyder, 2007) with special emphasis on the Navy-
Marine task force’s report (Harris, 2006). Alternative courses of action, specific probabilities,
and critical dependencies were extracted, extrapolated, and/or asserted from the basis of these
reports.
This information was transformed to the Mercator map projection using the coordinate
system and earth model of the World Geodetic System (1984). This cylindrical projection
minimizes distortion to distance and direction at locations near the equator, providing an
excellent spatial reference for nautical navigation in the eastern Mediterranean Sea.
This analysis modeled a primary plan (“Plan A”) and an alternative plan (“Plan B”) to
demonstrate differences in risk and anticipated outcomes.
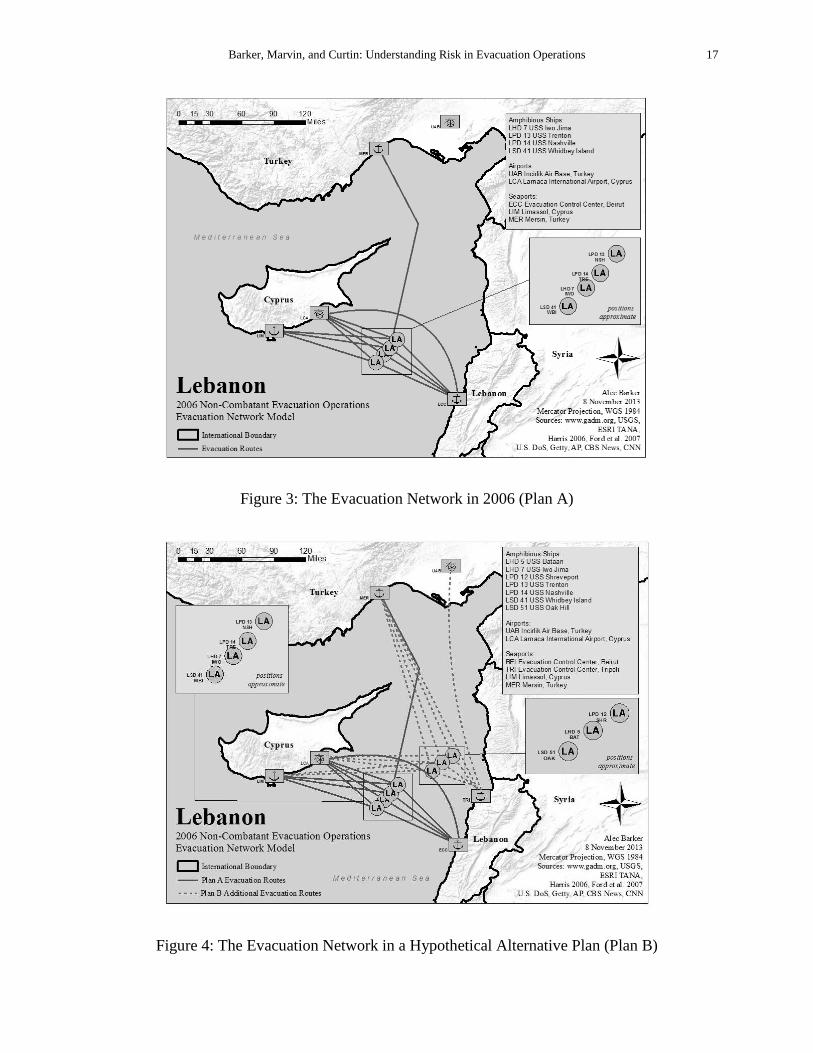
The facts of the operation as it was actually executed in 2006 provided the basis of Plan A.
A generic (i.e. time-independent) evacuation network was derived from Plan A. This network is
illustrated with military standard symbols in Figure 3.

Barker, Marvin, and Curtin: Understanding Risk in Evacuation Operations 15
The total number of evacuees is the supply entering the network. Since 5,861 evacuees were
removed by charter vessels, 7,985 is the adjusted supply applicable to the military portion of the
evacuation in both plans.
Arc costs and capacities are extracted from this network by applying vehicle types to each
arc according to the plan. Vehicle characteristics such as cruising speed and maximum passenger
capacity provide the basis for these values. Table 2 is an example of this arc, cost, and capacity
data.
Table 2: Plan A Arcs, Costs (Time), and Capacities
Arc Vehicle From (Tail Node) To (Head Node) Capacity Time (mins) Time (hrs)
1 CH-53 Beirut, Lebanon LPD 13 88 24 0.41
2 CH-53 Beirut, Lebanon LPD 14 88 24 0.41
3 CH-53 Beirut, Lebanon LHD 7 88 25 0.41
4 CH-53 Beirut, Lebanon LSD 41 88 26 0.43
5 CH-53 LPD 13 Larnaca, Cyprus 88 24 0.40
6 CH-53 LPD 14 Larnaca, Cyprus 88 23 0.38
7 CH-53 LHD 7 Larnaca, Cyprus 88 22 0.37
8 CH-53 LSD 41 Larnaca, Cyprus 88 22 0.36
9 CH-53 Beirut, Lebanon Larnaca, Cyprus 88 47 0.79
10 LCU Beirut, Lebanon LPD 13 400 415 6.92
11 LCU Beirut, Lebanon LPD 14 400 415 6.92
12 LCAC Beirut, Lebanon LHD 7 22 105 1.76
13 LCAC Beirut, Lebanon LSD 41 22 110 1.83
14 LPD13 LPD 13 Larnaca, Cyprus 1050 193 3.22
15 LSD41 LSD 41 Larnaca, Cyprus 800 186 3.11
16 LCAC_PTM Beirut, Lebanon LSD 41 150 110 1.83
17 LPD13 LPD 13 Limassol, Cyprus 1050 289 4.81
18 LPD14 LPD 14 Mersin, Turkey 1050 496 8.27
19 LPD14 LPD 14 Limassol, Cyprus 1050 274 4.57
20 LSD41 LSD 41 Limassol, Cyprus 800 263 4.38

16 Under Review, Military Operations Research
The 2006 NEO ran for 15 days. Since the plan executed different missions on each day, not
every arc in the generic evacuation network was available on every day. Furthermore, the plan
may not have used every arc that was available. The model handled this variability by adjusting
sorties in the dynamic network. For example, Table 3 presents sortie and total capacity data for
Plan A.
Plan B is a hypothetical planning alternative that would have responded to the NEO with
two task forces including two MEUs. Additionally, Plan B would have allowed for a second
evacuee control center at the Port of Tripoli, Lebanon, as well as increased evacuee flow to
Mersin-Incirlik, Turkey. While this plan would have required significantly greater resources, it
may have also proved more resistant to the effects of particular operational risks, and is therefore
an interesting excursion. Under Plan B, 5,900 evacuees egress through Beirut and 1,985
evacuees move through Tripoli. Figure 4 illustrates the evacuation network associated with Plan
B.
Barker, Marvin, and Curtin: Understanding Risk in Evacuation Operations 17
Figure 3: The Evacuation Network in 2006 (Plan A)
Figure 4: The Evacuation Network in a Hypothetical Alternative Plan (Plan B)

18 Under Review, Military Operations Research
Table 3: Plan A Sorties and Effective Total Capacities per Day
Both plans relied upon the same sets of assumptions with one exception. Since Mersin is an
extremely busy seaport, Plan B added an additional assumption that Mersin would be available
to accept evacuees disembarking from U.S. ships. The list of assumptions is presented in Table
4.
Table 4: Planning Assumptions and Probabilities (Pf)
Arc Day 1 D2 D3 D4 D5 D6 D7 D8 D9 D10 D11 D12 D13 D14 D15
4 0 0 0 0 0 0 0 2 0 0 0 0 0 0 0
9 0 2 4 4 4 4 4 2 2 2 2 2 2 2 0
10 0 0 0 0 0 2 4 0 0 0 0 0 0 0 0
11 0 0 0 0 0 0 4 0 4 0 0 0 0 0 0
13 0 0 0 0 0 0 0 4 0 0 0 0 0 0 0
14 0 0 0 0 0 1 0 0 0 0 0 0 0 0 0
16 0 0 0 0 0 0 0 4 0 0 0 0 0 0 0
17 0 0 0 0 0 0 1 0 0 0 0 0 0 0 0
18 0 0 0 0 0 0 0 0 1 0 0 0 0 0 0
19 0 0 0 0 0 0 1 0 0 0 0 0 0 0 0
20 0 0 0 0 0 0 0 1 0 0 0 0 0 0 0
Arc D1 D2 D3 D4 D5 D6 D7 D8 D9 D10 D11 D12 D13 D14 D15
4 0 0 0 0 0 0 0 166 0 0 0 0 0 0 0
9 0 166 352 352 352 352 352 166 166 166 166 166 166 166 0
10 0 0 0 0 0 800 1600 0 0 0 0 0 0 0 0
11 0 0 0 0 0 0 1600 0 1600 0 0 0 0 0 0
13 0 0 0 0 0 0 0 88 0 0 0 0 0 0 0
14 0 0 0 0 0 1050 0 0 0 0 0 0 0 0 0
16 0 0 0 0 0 0 0 600 0 0 0 0 0 0 0
17 0 0 0 0 0 0 1050 0 0 0 0 0 0 0 0
18 0 0 0 0 0 0 0 0 1050 0 0 0 0 0 0
19 0 0 0 0 0 0 1050 0 0 0 0 0 0 0 0
20 0 0 0 0 0 0 0 800 0 0 0 0 0 0 0
Number of Sorties
Effective Total Capacity
Assumption Description if False Pf
1 Visibility < 0.25 miles 5%
2 Visibility < 1 mile 10%
3 Seas >= NATO Sea State 4 (6 ft) 20%
4 Seas >= NATO Sea State 6 (14 ft) 5%
5 LCAC PTM unavailable 15%
6 Delayed Task Force arrival 10%
7 Aircraft mechanical abort 10%
8 Insufficient medical capacity 5%
9 Insufficient humanitarian aid capacity 15%
10 Naval Forward Command Element unavailable 20%
11 Ceiling < 100' ASL 5%
12 UAV unavailable to clear helicopter landing zones 10%
13 Unable to dock at Mersin (Plan B only) 10%
Barker, Marvin, and Curtin: Understanding Risk in Evacuation Operations 19
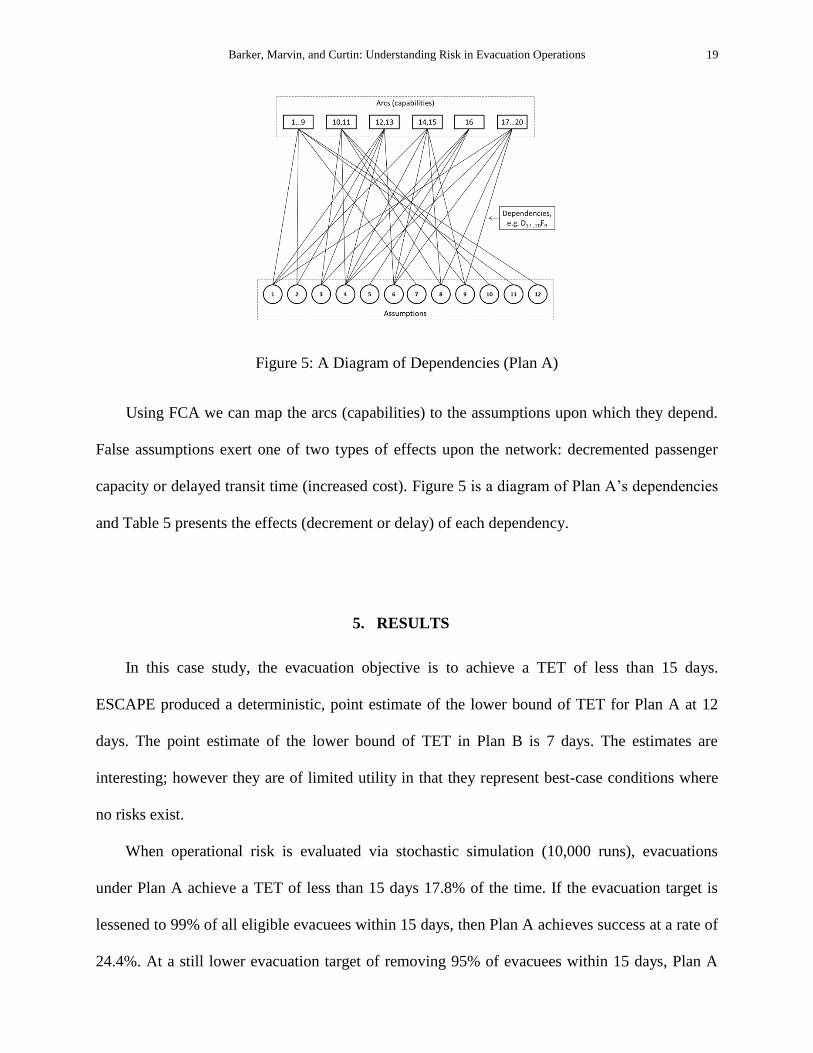
Figure 5: A Diagram of Dependencies (Plan A)
Using FCA we can map the arcs (capabilities) to the assumptions upon which they depend.
False assumptions exert one of two types of effects upon the network: decremented passenger
capacity or delayed transit time (increased cost). Figure 5 is a diagram of Plan A’s dependencies
and Table 5 presents the effects (decrement or delay) of each dependency.
5. RESULTS
In this case study, the evacuation objective is to achieve a TET of less than 15 days.
ESCAPE produced a deterministic, point estimate of the lower bound of TET for Plan A at 12
days. The point estimate of the lower bound of TET in Plan B is 7 days. The estimates are
interesting; however they are of limited utility in that they represent best-case conditions where
no risks exist.
When operational risk is evaluated via stochastic simulation (10,000 runs), evacuations
under Plan A achieve a TET of less than 15 days 17.8% of the time. If the evacuation target is
lessened to 99% of all eligible evacuees within 15 days, then Plan A achieves success at a rate of
24.4%. At a still lower evacuation target of removing 95% of evacuees within 15 days, Plan A

20 Under Review, Military Operations Research
yields a success rate of 44.0%. Under Plan B, however, the full evacuation success rate under a
slightly expanded set of risks in a separate 10,000 run simulation improves to 99.8%.
Table 5: Dependency Effects (Plan A)
Dependency Decrement Delay
D1…9F1 100% 0%
D1…9F2 0% 200%
D1…9F7 100% 0%
D1…9F11 100% 0%
D1…9F12 0% 133%
D10,11F3 0% 150%
D10,11F4 100% 0%
D10,11F10 0% 175%
D10,11F9 33% 0%
D10,11F8 25% 0%
D12,13F6 0% 300%
D12,13F4 100% 0%
D12,13F3 0% 150%
D12,13F1 100% 0%
D12,13F2 0% 150%
D14,15F6 100% 0%
D14,15F9 33% 0%
D14,15F8 25% 0%
D14,15F4 0% 20%
D14,15F1 0% 10%
D16F5 100% 0%
D16F6 0% 300%
D16F4 100% 0%
D16F3 0% 150%
D16F1 100% 0%
D17…20F6 100% 0%
D17…20F9 33% 0%
D17…20F8 25% 0%
D17…20F4 0% 20%
D17…20F1 0% 10%

Barker, Marvin, and Curtin: Understanding Risk in Evacuation Operations 21
6. CONCLUSIONS
The aggregate effects of the critical probabilities and dependencies associated with each
plan, when derived via simulation, correspond to each plan’s aggregate risk. This is because the
probability of a failed assumption is in fact the likelihood of a detrimental event occurring, and
the affected dependency is in fact the effect of that event on organizational objectives (Purdy,
2010). Importantly, the risks asserted in this paper illustrate some hazards that could have
hypothetically borne upon the real events of the 2006 evacuation. Indeed, the real evacuation
successfully removed 13,846 people from harm’s way within 15 days of operations.
In this case, quantitative simulation and analysis has shown that a primary evacuation plan
(Plan A) delivered 17.8% confidence of accomplishing the mission objective given a set of
hypothesized operational risks. On the other hand, an alternate evacuation plan (Plan B) is
predicted to accomplish the same mission objective with 99.8% confidence while subject to
nearly the same set of risks. One could draw from these stark results the pithy conclusion that
under the circumstances, two MEUs are significantly better than one.
This paper demonstrates how a modeling approach like that of ESCAPE can contribute to
joint force planners’ awareness of the operational risk associated with the complex logistical
efforts of a noncombatant evacuation operation. While we cannot foreknow negative events that
influence evacuation operations, we can develop a comprehensive and powerful understanding of
potential mission outcomes, as well as vulnerabilities and their effects, using this method.
7. FUTURE RESEARCH
Insofar as this model has faithfully reproduced the outcomes of historically demonstrable
events, it has already offered some degree of informal validity. However, it requires a thorough
process of certification appropriate for any serious modeling and simulation effort. Future work

22 Under Review, Military Operations Research
will be dedicated to processing ESCAPE through external verification, validation, and
accreditation.
Different measures of operational performance may provide means to improve the utility of
this modeling approach. If, instead of relying on TET, this model sought to minimize individual
evacuee transit time, identify and reduce network chokepoints, or maximize service value to a
population, then this model could provide a more sophisticated understanding of risk.
While this implementation used a fixed rate of evacuee arrival at the departure site(s), there
is a need to model variable evacuee arrival as a stochastic process. Future implementations of
ESCAPE may use a distributed evacuee arrival function such as that which may be derived via a
Poisson process.
Finally, this modeling method may be further developed to isolate a specific area of
operational risk which has been identified as highly challenging to the US government:
interagency cooperation. An instance of ESCAPE could be tailored to stress those risks which
involve the relationship between military forces and diplomatic activities. This would require
thoughtful quantification of the factors of bureaucratic cooperation, which is an infamously
amorphous phenomenon.
8. REFERENCES
Ahuja, R. K., T. L. Magnanti, and J. B. Orlin. 1993. Network Flows: Theory, Algorithms, and
Applications (1st ed.). Prentice Hall.
Aronson, J. E. 1989. A survey of dynamic network flows. Annals of Operations Research, Vol
20, No 1-4, 1–66.

Barker, Marvin, and Curtin: Understanding Risk in Evacuation Operations 23
Çağdaş, G. and G. Sağlamer. 1995. A Simulation Model to Predict the Emptying Times of
Buildings. Architectural Science Review, Vol 38, No 1, 9–19.
Carter A. 2013. Directive 3025.14: Evacuation of U.S. Citizens and Designated Aliens from
Threatened Areas Abroad, United States Department of Defense, Washington, DC.
Chalmet, L.G., R. L. Francis, and P.B. Saunders. 1982. Network models for building evacuation.
Fire Technology, Vol 18, No 1, 90–113.
Choi, W., H.W. Hamacher, and S. Tufekci. 1988. Modeling of building evacuation problems by
network flows with side constraints. European Journal of Operational Research, Vol 35,
No 1, 98–110.
Church, R.L. and T. J. Cova. 2000. Mapping evacuation risk on transportation networks using a
spatial optimization model. Transportation Research Part C: Emerging Technologies,
Vol 8, No 1–6, 321–336.
Church, R. L. and R. M. Sexton. 2002. Modeling Small Area Evacuation: Can Existing
Transportation Infrastructure Impede Public Safety? Working Paper. National Center for
Geographic Information and Analysis, Santa Barbara, California.
Clark, R.L. 1995. Noncombatant Evacuation Operations: Major Considerations for the
Operational Commander. Thesis. United States Naval War College, Newport, Rhode
Island.
Clinton, W.J. 1998. Executive Order 13074--Amendment to Executive Order 12656-234.
Executive Office of the President of the United States of America, Washington, DC.
24 Under Review, Military Operations Research
Cova, T.J. and R.L. Church. 1997. Modelling community evacuation vulnerability using GIS,
International Journal of Geographical Information Science, Vol 11, No 8, 763–784.
Curtin, K. M. 2007. Network Analysis in Geographic Information Science: Review, Assessment,
and Projections, Cartography and Geographic Information Science, Vol 34, No 2, 103–
111.
Daganzo, C. F. 1995. The cell transmission model, part II: Network traffic, Transportation
Research Part B: Methodological, Vol 29, No 2, 79–93.
Davidoff, P. and T.A. Reiner. 1962. A Choice Theory of Planning, Journal of the American
Institute of Planners, Vol 28, No 2, 103–115.
De Silva, F.N. and R.W. Eglese. 2000. Integrating Simulation Modelling and GIS: Spatial
Decision Support Systems for Evacuation Planning, The Journal of the Operational
Research Society, Vol 51, No 4, 423-430.
Dingbaum, S.D. 1998. Unity of Effort During Noncombatant Evacuation Operations. Thesis.
United States Naval War College, Newport, Rhode Island.
Fishman, G. 1996. Monte Carlo: Concepts, Algorithms, Applications. Springer-Verlag New
York, Inc.
Ford, J., D. Maurer, J. Carney, I. Ferguson, J. Fremont, and K. Halpern. 2007. State Department:
The July 2006 Evacuation of American Citizens from Lebanon. Report. United States
Government Accountability Office, Washington, DC.
Barker, Marvin, and Curtin: Understanding Risk in Evacuation Operations 25
Ford, J., D. Maurer, I. Ferguson, J. Fremont, K. Halpern, C. Hurley, … J. Carney. 2007. State
Department: Evacuation Planning and Preparations for Overseas Posts Can Be
Improved. Report. United States Government Accountability Office, Washington, DC.
Ganter, B. and R. Wille. 1997. Formal Concept Analysis: Mathematical Foundations (1st ed.),
Springer-Verlag New York, Inc.
Glockner, G.D. and G.L. Nemhauser. 2000. A Dynamic Network Flow Problem with Uncertain
Arc Capacities: Formulation and Problem Structure, Operations Research, Vol 48, No 2,
233–242.
Goodchild, M.F. and D.G. Janelle. 2004. Spatially Integrated Social Science. Oxford University
Press, 3–22.
Gregg, A.N. 2010. Optimizing Crisis Action Planning in the Noncombatant Evacuation
Operation Setting. Thesis. United States Air Force Institute of Technology, Wright-
Patterson Air Force Base, Ohio.
Hagan, R.M. 1998. Modeling Sea-Based Sustainment of Marine Expeditionary Unit (Special
Operations Capable) (MEU(SOC)) Operations Ashore. Thesis. United States Naval
Postgraduate School, Monterrey, California.
Ham, C.F., G. Fontenot, D. Pendall, and L. Closter. 2010. Red Team Reign: Red Team Support
to Joint Task Force Decision Processes. Red Team Journal Occasional Paper, Vol 2.

26 Under Review, Military Operations Research
Harris, S. 2006. Expeditionary Strike Group Iwo Jima After Action Report: Non-Combatant
Evacuation Operation Lebanon - July 2006. Report. United States Joint Forces Staff
College Reserve JOPP Course, Norfolk, Virginia.
Hijmans, R. 2012. Global Administrative Areas. Geographic Data. University of California -
Berkeley, Museum of Vertebrate Zoology and the International Rice Research Institute,
Berkeley, California.
Janson, B.N. 1991. Dynamic network modelling of travel guidance impacts. Conference paper.
Vehicle Navigation and Information Systems Conference, Troy, Michigan, 857–870.
Jarvis, J. J. and H.D. Ratliff. 1982. Note—Some Equivalent Objectives for Dynamic Network
Flow Problems. Management Science, Vol 28, No 1, 106–109.
Kobayashi, T., R.M. Medina, and T.J. Cova. 2001. Visualizing Diurnal Population Change in
Urban Areas for Emergency Management. The Professional Geographer, Vol 63, No 1,
113–130.
Lee, J.A. 1997. The Tower of Babel: Interagency Dynamics in Noncombatant Evacuation
Operations. Thesis. United States Naval War College, Newport, Rhode Island.
Lu, Q., Y. Huang, and S. Shekhar. 2003. Evacuation Planning: A Capacity Constrained Routing
Approach, Intelligence and Security Informatics, H. Chen, R. Miranda, D. D. Zeng, C.
Demchak, J. Schroeder, and T. Madhusudan (Editors), Springer Berlin, 111–125.
Magnanti, T.L. and R.T. Wong. 1984. Network Design and Transportation Planning: Models and
Algorithms. Transportation Science, Vol 18, No 1, 1–55.

Barker, Marvin, and Curtin: Understanding Risk in Evacuation Operations 27
Mason, R. O. 1969. A Dialectical Approach to Strategic Planning. Management Science, Vol 15,
No 8, 403–414.
Olsen, C.M. 2011. Simulation Study of Evacuation Control Center Operations Analysis. Thesis.
United States Air Force Institute of Technology, Wright-Patterson Air Force Base, Ohio.
Orlin, J.B. 1993. A Faster Strongly Polynomial Minimum Cost Flow Algorithm. Operations
Research, Vol 41, No 2, 338–350.
Papageorgiou, M., C. Diakaki, V. Dinopoulou, A. Kotsialos, and Y. Wang. 2003. Review of road
traffic control strategies. Proceedings of the IEEE, Vol 91, No 12, 2043–2067.
Pidd, M., F.N. de Silva, and R.W. Eglese. 1996. A simulation model for emergency evacuation.
European Journal of Operational Research, Vol 90, No 3, 413–419.
Purdy, G. 2010. ISO 31000:2009—Setting a New Standard for Risk Management. Risk Analysis,
Vol 30, No 6, 881–886.
Scheer, M.A. 2011. Noncombatant Evacuation Operations in USEUCOM. Thesis. United States
Air Force Institute of Technology, Wright-Patterson Air Force Base, Ohio.
Shen, T.S. 2005. ESM: a building evacuation simulation model. Building and Environment, Vol
40, No 5, 671–680.
Siegel, A.B. 1991. Eastern Exit: The Noncombatant Evacuation Operation (NEO) From
Mogadishu, Somalia, in January 1991. Report. Center for Naval Analyses, Alexandria,
Virginia.
28 Under Review, Military Operations Research
Snyder, W. 2007. Noncombatant Evacuation Operations (NEO) and the New Combatant
Commander – AFRICOM. Thesis. United States Naval War College, Newport, Rhode
Island.
Southworth, F. 1991. Regional Evacuation Modeling: A State-of-the-& Review. Report. Oak
Ridge National Laboratories, Oak Ridge, Tennessee.
Stahl, D.T. 1992. Noncombatant Evacuation Operations in Support of the National Military
Strategy. Thesis. United States Army Command and General Staff College, School of
Advanced Military Studies, Fort Leavenworth, Kansas.
Standifer, K.M. 2008. Working Together during Noncombatant Evacuation Operations. Thesis.
United States Naval War College, Newport, Rhode Island, 2008.
Sumner, J.E. and E.A. Zahn. 1996. A simulation of the evacuation of American citizens with an
object-oriented, animated model. Conference paper. Simulation Conference 1996
Proceedings Winter, Coronado, California, 967–974.
Thompson, P.A. and E.W. Marchant. 1995. A computer model for the evacuation of large
building populations. Fire Safety Journal, Vol 24, No 2, 131–148.
Tubbs, J.S. and B.J. Meacham. 2007. Egress Design Solutions: A Guide to Evacuation and
Crowd Management Planning. John Wiley & Sons.
United States Department of Defense. 1997. JP 3-07.5: Joint Tactics, Techniques, and
Procedures for Noncombatant Evacuation Operations, Washington, DC.
Barker, Marvin, and Curtin: Understanding Risk in Evacuation Operations 29
United Nations Office for the Coordination of Humanitarian Affairs. 2012. Humanitarian
Response Common and Fundamental Operational Datasets Registry. New York City,
New York.
Watling, D. 1991. A Review of Models of Urban Traffic Networks (With Particular reference to
the Requirements for Modelling Dynamic Route Guidance Systems). Working paper.
Institute of Transport Studies, University Of Leeds, Leeds, England.
Weinroth, J. 1989. A Model for the Management of Building Evacuation. Simulation, Vol 53, No
3, 111–119.
Wille, R. 2009. Restructuring Lattice Theory: An Approach Based on Hierarchies of Concepts,
Formal Concept Analysis, Springer Berlin, 314–339.
Yamada T. 1996. A network flow approach to a city emergency evacuation planning.
International Journal of Systems Science, Vol 27, No 10, 931–936.