Embed Size (px)
Citation preview

Understanding International Gross Capital Flows
1
International Gross Capital Flows: New Uses of
Balance of Payments Data and Application to
Financial Crises
Thorsten Janus, University of Wyoming
Daniel Riera-Crichton, Bates College
Abstract
Most studies of international financial openness and crises link economic performance to
either the net inflow of capital or the gross inflow (outflow) defined as the change in
foreign (domestic) holdings of domestic (foreign) assets over a period. In this paper we
decompose the net inflow into four rather than two components. We show that the four-
way decomposition provides a better understanding of six recent financial crises and
predicts sudden stops better than a standard two-way decomposition. We conclude that
four-way decompositions can be more informative than either the net capital inflow or
two-way decompositions of the net inflow.
Keywords: Capital Flows, Financial Integration, External Crises, Balance of Payments
Crises
JEL: F21, F32, F36, G15
Understanding International Gross Capital Flows
2
1. Introduction
With a supportive institutional framework, international capital flows and financial
openness have the potential to advance economic growth, stability, and development. For
instance, they can promote investment and financial development (Baldwin and Martin
1999, Chinn and Ito 2006) or even jump-start economic development (Murphy et al
1989). When the institutional framework is weak, however, international capital flows
and financial openness can lead to bubbles and financial crises (Prasad et al. 2003).
A number of papers explore the economics of capital flows. However, most
empirical (Burnside et al. 2004, Bordo et al. 2010) as well as theoretical papers -
including business cycle and growth studies (Barro et al. 1992, Aghion et al. 2004) as
well as financial crisis models (Calvo 1998, Dooley 2000) – have focused on the net
capital inflow. A smaller empirical literature, which we discuss below, distinguishes
gross inflows and outflows of capital.1 In this paper, however, we argue that a focus on
either net flows or its component gross in- and outflows may be unnecessarily restrictive.
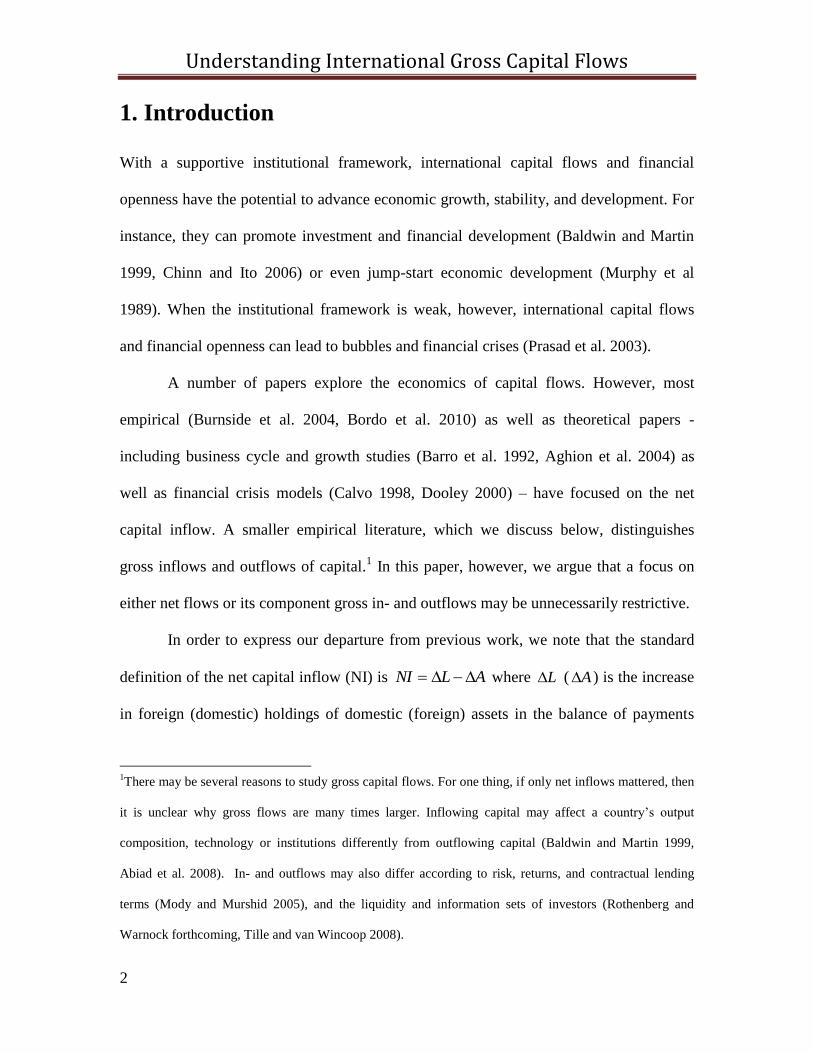
In order to express our departure from previous work, we note that the standard
definition of the net capital inflow (NI) is ALNI where L ( A ) is the increase
in foreign (domestic) holdings of domestic (foreign) assets in the balance of payments
1There may be several reasons to study gross capital flows. For one thing, if only net inflows mattered, then
it is unclear why gross flows are many times larger. Inflowing capital may affect a country’s output
composition, technology or institutions differently from outflowing capital (Baldwin and Martin 1999,
Abiad et al. 2008). In- and outflows may also differ according to risk, returns, and contractual lending
terms (Mody and Murshid 2005), and the liquidity and information sets of investors (Rothenberg and
Warnock forthcoming, Tille and van Wincoop 2008).

Understanding International Gross Capital Flows
3
(BoP) over the period.2 The gross inflow (outflow) is L ( A ). Although this definition
seems intuitive, a sizable share of the BoP recorded changes in assets holdings (for
various countries, years and asset categories), however, are actually negative.3 A negative
change in foreign (domestic) holdings of domestic (foreign) assets represents
disinvestment in the domestic (foreign) economy. When the standard definition of the
inflow (outflow), L ( A ) simply adds the negative and positive changes across asset
categories in the BoP –the categories are FDI, portfolio, and other capital flows - it fails
to distinguish a fall in new foreign investment from a corresponding disinvestment. Since
many countries face imperfections in financial markets, the implicit assumption that
economy-wide foreign investment and disinvestment are perfect substitutes is unlikely to
be correct. Intuitively, disinvestment is the disruption of an existing credit relationship,
and if collateral or information is relationship-specific, it may be difficult for a borrower
to find a new domestic or foreign lender despite a high social return to lending (Bernanke
1983, Caballero and Krishnamurthy 2001). Liquidity problems of industries hit by
disinvestment shocks may spread via backward and forward linkages. For instance,
Hendricks and Singhal (2005) find that supply-chain disruptions for US firms lead to
cumulative abnormal stock market returns of -40% over a three year period starting one
year before the disruption announcement.4
2 See for example Ito (1999), Caballero et al. (2004), Alfaro et al. (2005), Faucette et al. (2005), Prasad and
Wei (2005), Rothenberg and Warnock (forthcoming), and Tille and van Wincoop (2008).
3 In our dataset, about 25% of recorded asset changes and more than 10% of liability changes are negative.
4 Foreign disinvestments may also warn future investors to stay away or cause a fire-sale of assets
exacerbating initial liquidity problems. Even if some domestic agents increase foreign credit access at the

Understanding International Gross Capital Flows
4
Given the potential asymmetries between foreign investment and disinvestment,
we extract a disinvestment measure from the balance of payments using the identity
AALLNI4 , (1)
0L : positive liability changes/inflowing foreign investment
0L : absolute value of negative liability changes/outflowing foreign disinvestment
0A : positive asset changes/outflowing domestic investment
0A : absolute value of negative asset changes/inflowing domestic disinvestment.
Equation (1) identifies four sources of variation in a country’s net capital inflow.
In contrast, the two-way decompositions used in previous work only considers variations
in the “net gross” inflow )( LLL and the “net gross” outflow )( AAA .
Thus, the standard decomposition fails to measure investment separately from
disinvestment and treats the two as perfect substitutes. We show below that the four-way
decomposition provides a better explanation of six recent financial crises and predicts
sudden stops empirically better than the standard decomposition. For instance, the
standard methodology suggests that recent crises in Indonesia, Mexico, and South Korea
largely reflected declining gross capital inflows. Our more precise method shows that
these crises were mainly due to foreign disinvestment. We further show that that in South
Korea there was a sizable domestic capital outflow accompanied by domestic capital
repatriation during the crisis. We similarly identify a large amount of capital repatriation
to the US and UK during the global crisis of 2008-9.
same time others lose it, leaving aggregate foreign lending unchanged, credit-unconstrained agents may be
unwilling to lend to constrained agents (Caballero and Krishnamurthy 2001).

Understanding International Gross Capital Flows
5
We believe that the four-way decomposition of net capital inflows in equation (1)
can be important for policy makers. First, it can help distinguish the output effects of
international investments from those of disinvestments. For instance, if foreign
disinvestments [ L ] decrease output more than domestic capital outflows [ A ] during
financial crises (Janus and Riera-Crichton 2010), then the benefits of capital controls may
outweigh the costs for the former but not the latter.5 If domestic residents tend to be well-
informed, and their capital promotes output growth more than asset bubbles, then it may
be better to encourage inflows from capital repatriation [ A ] than foreign inflows [ L ].
Second, the four-way decomposition can reveal whether policies needed to retain existing
investors and attract new investors are different. Third, as noted it can help policy
markers predict financial crises. Fourth, by distinguishing four rather than two types of
capital flows, and correctly classifying disinvestments as outflows rather than negative
inflows, it can help policy-makers design and monitor effectiveness of capital controls.
The paper belongs to the literature linking international capital flows to economic
outcomes, such as growth and financial crises. While the literature has focused on net
capital flows (see Obstfeld 2009 for a survey), several recent papers link gross capital
flows to financial crises. Broner et al. (2011) show that gross capital flows are large and
volatile compared to net flows, as well as procyclical in the sense of retrenching during
crises. Rothenberg and Warnock (forthcoming) find that roughly half of the sudden stops
in their sample reflect a rise in capital outflows or “sudden flight” more than a fall in
inflows or a “true sudden stop” (Faucette et al. 2005). Using different definitions, Cowan
5 Conversely, controls on domestic outflows may be justified if they are the main driver of fluctuations in
the net capital inflow (Rothenberg and Warnock forthcoming).

Understanding International Gross Capital Flows
6
et al. (2008) find that outflow surges account for eighteen of one hundred sudden stops in
their sample, while inflow declines account for fifty-seven. Forbes and Warnock
(forthcoming) study episodes of “surge,” “stop,” “flight,” and “retrenchment” in capital
flows, defined, respectively, as sharply increasing and decreasing inflows and sharply
increasing and decreasing outflows. Our key departure from these papers is that we study
a four-way rather than two-way decomposition of net capital flows.
In the remainder of the paper, Section 2 applies the four-way decomposition (1) to
explain six recent financial crises. Section 3 applies it to sudden stop prediction and
Section 4 concludes. Most variable definitions and data sources are in the appendix.
2. Explaining Six Recent Financial Crises
In this section we study gross private international capital flows during six recent
financial crises: South Korea and Indonesia in 1997, Mexico in 1994, Argentina in 2002,
and the US and UK during the Great Recession of 2008-9.6
In Figure 1, the thick lines mark the balance of payments crises suffered by
Indonesia and South Korea in 1997-8, as identified in Kaminsky and Reinhart (1999).
According to the standard two-way net inflow decomposition, the proximate cause of
both South Korea’s and Indonesia’s balance of payments crisis was a sharp decline in
gross capital inflows from positive to highly negative levels. Although a negative total
inflow implies some degree of disinvestment, the size of the disinvestment is not clear. In
6 We focus on private capital flows rather than official flows because the former are more important for
most countries and may have different dynamics than official flows. The data source is described below.

Understanding International Gross Capital Flows
7
contrast, our four-way decomposition estimates the foreign disinvestment more precisely
(the sharp spike in private outflows from liabilities [ L ] in the upper panels).
Interestingly, between the second quarter of 1997 and the time the crisis hit in the fourth
quarter, there was almost no change in foreign inflows to Indonesia (private inflows from
liabilities L[ ]) and only a moderate fall in foreign inflows to South Korea. The four-way
decomposition therefore establishes, in a firmer and more precise manner than the
standard two-way decomposition, that the proximate cause of both crises was investment
reversals. Another novel finding is that we observe both a rise in South Korean capital
outflows (private outflows from assets [ A ]) and repatriation of capital by South
Koreans (private inflows from assets ][ A ). One possibility is that South Korean
investors repatriated funds from abroad to buy or support projects abandoned by foreign
investors. Thus, South Korean capital may have put a floor under asset prices.
Next, using the left half of Figure 2 we study Mexico’s balance of payments crisis
in 1994-95 (again as defined in Kaminsky and Reinhart (1999)). As for the Asian
economies, the standard decomposition suggests that Mexico’s loss of capital was
entirely due to a fall in gross inflows. However, it remains unclear how much reflected
disinvestment as opposed to declining new investment. The four-way decomposition
shows that after an early sharp decline inflows actually remained substantial and stable in
the four quarters leading up to the crisis. As with the Asian crises, therefore, Mexico’s
balance of payments crisis was associated with foreign disinvestment more than a fall in
new foreign investment.

Understanding International Gross Capital Flows
8
The right side of Figure 3 shows capital flows surrounding Argentina’s current
account reversal, banking and debt crisis in the first quarter of 2002.7 In this case, while
the two-way decomposition shows a declining capital inflow leading up to the crisis, the
four-way decomposition shows that foreign investment in Argentina (private inflows
from liabilities) actually increased in the two quarters preceding the crisis. Thus, the fall
in foreign acquisitions of Argentinean assets is more than fully explained by foreign
disinvestment. Moreover, as in South Korea, both foreign disinvestment (private outflows
from liabilities) and Argentinean capital repatriation (private inflows from assets) rose
preceding the crisis. Similarly to South Koreans, therefore, Argentineans may have
purchased domestic assets from foreigners. Finally we note that, comparing the spikes in
outflows from assets with those of outflows from liabilities, the former appear to lead the
latter. This may suggest that domestic investors left Argentina before foreign investors.
Based on data from financial markets, Frankel and Schmukler (1996) similarly find that
domestic investor flight Granger-caused foreign flight during Mexico’s 1994-95 crisis
and conclude that domestic investors may have seen the crisis coming earlier.
Understanding any information asymmetries and causal relations between foreign and
domestic investor behavior may be important to understand and predict financial crises.
Finally, in Figure 4, we focus on the United States and United Kingdom during
the Great Recession. According to the two-way decomposition, both capital inflows to
the US and outflows fell sharply before the crisis. Once the crisis began, inflows were
7Since Argentina’s crisis and the Great Recession years we study in Figure 4 are not included in Kaminsky
and Reinhart (1999), we get the crisis quarters from Janus and Riera-Crichton (2010). Each crisis quarter
features a rise in the current account-to-GDP ratio of more than twice the country-specific standard
deviation of that ratio, as well as an annual three percentage point rise in the current account-to-GDP ratio.

Understanding International Gross Capital Flows
9
fairly stable, but there was a sizable increase in outflows. In contrast, but more consistent
with the anecdotal evidence, the four-way decomposition shows a large increase in both
foreign disinvestment from the US (outflows from liabilities) and US repatriation of
capital (inflows from assets). Thus, as foreign investors disengaged from the US, US
investors disengaged from abroad. The standard two-way decomposition fails to capture
the size of both foreign flight from the US (the standard inflows measure only goes
slightly negative) and US disinvestment from abroad. Nor does it reveal that only a small
part of the rise in US holdings of foreign assets after the crisis came from US residents
purchasing foreign assets. Rather, as shown by the four-way decomposition, it came from
falling US repatriation of capital (inflows from assets). For the UK, similarly, the two-
way decomposition underestimates both foreign investor flight and capital repatriation.
3. Predicting Sudden Stops
In this section, we study the ability of a four-way decomposition of net capital inflows to
predict financial crises in the form of sudden stops. Following Hutchison and Noy (2006)
we define a sudden stop as the simultaneous occurrence of a currency crisis and a current
account reversal. Calvo (1998) argues that the output loss from a current account reversal
may be larger when accompanied by a real depreciation and Hutchison and Noy (2006)
provide supporting evidence. For robustness, we use two measures of current account
reversals: a rise in the current account-to-GDP ratio of more than twice the country-
specific standard deviation of that ratio (ST1); and a rise of three percentage points or
more in the current account-to-GDP ratio compared to the same quarter the previous year

Understanding International Gross Capital Flows
10
(ST2).8 We define a currency crisis as a departure of two standard deviations or more in
the level of exchange market pressure (Eichengreen et al. 1996), formulated as follows
for country i and time t : 2
%
2
%
%%
Ei
it
Ri
it
it
EREMP
. In this expression, itR% is the
percent change in official reserves from last period, itE% stands for the percent change
in the real exchange rate, and 2
% Ri and 2
% Ei are the respective country-specific
variances of the percent change over the sample years.9
Due to the binary nature of the dependent variables, we estimate a logit model.
The state transition matrices presented in Table 1 uncover a sizeable persistence in the
two crisis dummies and undergoing financial turmoil one quarter may affect the
probability of turmoil the next quarter. Thus, we control for lagged crisis incidence.
The estimated crisis probability for each observation, denoted ipö , is a continuous
variable, while the dependent variable is binary. We, therefore, follow the large body of
literature on Early Warning Systems in defining a threshold C as follows: If Cpi ö ,
then, the model is said to predict a crisis, and otherwise, it does not. The threshold is
usually chosen to minimize the noise-to-signal ratio, i.e. the ratio of incorrectly to
correctly predicted crises (Berg and Patillo 1999): )(/)( CTPCFPNSR , where FP and
8 The incidence of the two types of sudden stops in the data is available on request.
9While Hutchison and Noy (2006) also use real exchange rates, Eichengreen et al. (1996) use nominal rates.
The latter also include nominal interest rate deviations in the EMP index, but most of the subsequent
literature has focused on reserve and exchange rate changes due to data limitations.

Understanding International Gross Capital Flows
11
TP denote the number of false and true positive predictions. For generality we present
the NSRs generated by the capital flow decompositions for all thresholds )1,0(C .10
Our regressions use quarterly balance of payments data from the IMF’s
International Financial Statistics (IFS). It includes 43 non-OECD economies, most of
which are emerging markets, as well as Mexico and South Korea.11
It spans 1970 to
2009, although it is limited before the mid 1980s. Table 2 shows the summary statistics.
Apart from gross capital flows, we control for the lags of output growth, the current
account, the stock of international reserves, domestic credit growth, a dummy for
hyperinflation, and relative export growth (the growth of the exports-imports ratio).12
Columns (1) and (3) in Table 3 show the results for the four-way decomposition
of capital flows. Columns (2) and (4) show the results for the two-way decomposition. A
Wald test after each of regressions (1) and (3) rejects at the 99% confidence level that the
coefficient on inflows from liabilities equals minus the coefficient on outflows from
liabilities. Thus, the coefficient on inflows using the standard decomposition seems to
reflect the average of the heterogeneous effects of a rise in new foreign investment and a
fall in foreign investment reversals.13
In Figure 4 we show our method’s relative ability
10
The working paper shows that using other measures to compare Early Warning Systems gives similar
results. Candelon et al (2010) and Granger and Machina (2006) present a broader discussion of forecasting.
11 We drop the Bahamas, Bahrain, Panama and Tonga due to their large capital flows-to-GDP ratios.
12 These controls follow the literature on Early Warning Systems (Berg and Patillo 1999, Kaminsky and
Reinhart 1999, Kumar et al. 2003, Candelon et al. 2010).
13 The qualitative results are not sensitive to omitting the lagged dependent variable or adding country fixed
effects; estimating a complementary log-log, linear or probit model; or controlling for fiscal expenditures,
economic or financial risk, terms of trade, financial development or trade openness. We are also aware that,

Understanding International Gross Capital Flows
12
to predict sudden stops as measured by the NSR . Using our first sudden stop measure, the
results in the upper panel show that the four-way decomposition of net inflows neither
helps nor hinders crisis prediction.14
In contrast, the results for the second sudden stop
measure in the lower panel strongly favor four-way decomposition: the NSR is
substantially lower than for the two-way decomposition for almost all crisis thresholds.
4. Conclusion
Most macroeconomic studies of international capital flows focus on either net inflows or
gross inflows (outflows) computed as the increase in foreign (domestic) holdings of
domestic (foreign) assets in the balance of payments. In this paper, however, we show
that decomposing net inflows into four rather than two gross flow components can help to
explain six recent financial crises and predict sudden stops empirically. On this basis we
believe that four-way decompositions can increase the ability of policy-makers to
monitor and manage international capital flows. all else constant, a change in any gross capital flow in (1) will affect the current account used to define the
sudden stop dummy. This mechanical link between gross flows and the current account cannot be driving
the results, however. First, we are already controlling for the current account. Second, gross capital flows
define the level of the current account, while sudden stops are defined using the change.
14 One reason the NSRs are similar using our first sudden stop measure may the relatively few crisis in the
data. For instance, with 20 false and 35 true positives, one falsely predicted crisis changes the NSR by (21-
20)/35=0.029 (Candelon et al. 2010). The four-way decomposition does do slightly better at predicting true
positives, however. This is consistent with outflows from liabilities being the only significant gross flow in
the first two columns in Table 3, and may be important if the value of preparing for a crisis exceeds the
value of preparing needlessly (so true positives are more valuable than false positives).

Understanding International Gross Capital Flows
13
References
Abiad, A., Oomes, N. & Ueda, K. (2008) The Quality Effect: Does Financial
Liberalization Improve the Allocation of Capital? Journal of Development Economics,
87(2), 270-82.
Aghion, P., Howitt, P. & Mayer-Foulkes, D. (2004) The Effect of Financial Development
on Convergence: Theory and Evidence. Quarterly Journal of Economics, 120(1), 173-
222.
Alfaro, L., Kalemli-Ozcan, S. & Valosovych, V. (2005) Capital Flows in a Globalized
World: The Role of Policies and Institutions. In Capital Controls and Capital Flows in
Emerging Economies: Policies, Practices and Consequences (S. Edwards, Ed.). Chicago:
University of Chicago Press.
Baldwin, R. & Martin, P. (1999) Two Waves of Globalization: Superficial Similarities,
Fundamental Differences. NBER Working Paper No. 6904.
Barro, R. J, Mankiw, G. N. & Sala-i-Martin, X. (1992) Capital Mobility in Neoclassical
Models of Growth. NBER Working Paper No. 4206.
Berg, A., & Pattillo, C. (1999) Predicting Currency Crises: The Indicators Approach and
an Alternative. Journal of International Money and Finance, 18(4), 561-586.
Bernanke, B. S. (1983) Nonmonetary Effects of the Financial Crisis in the Propagation of
the Great Depression. American Economic Review, 73(3), 257-76.
Bordo, M., Cavallo, A. & Meissner, C. M. (2010) Sudden Stops: Determinants and
Output Effects in the First Era of Globalization. Journal of Development Economics,
91(2), 227–241.

Understanding International Gross Capital Flows
14
Broner, F. A, Didier, T., Erce, A. & Schmukler, S. L. (2011) Gross Capital Flows:
Dynamics and Crises. World Bank Policy Research Working Paper No. 5768.
Burnside, C., Eichenbaum, M. & Rebelo, S. (2004) Government Guarantees and Self-
Fulfilling Speculative Attacks. Journal of Economic Theory, 119(1), 31-63.
Caballero, R. J & Krishnamurthy, A. (2001) International and Domestic Collateral
Constraints in a Model of Emerging Market Crises. Journal of Monetary Economics,
48(3), 513-48.
Caballero, R. J, Cowan, K. & Kearns, J. (2004) Fear of Sudden Stops: Lessons from
Australia and Chile. Journal of Policy Reform, 8(4), 313-54.
Calvo, G.A. (1998) Capital Flows and Capital-Market Crises: The simple Economics of
Sudden Stops. Journal of Applied Economics, 1(1), 35-54.
Candelon, B., Dumitrescu, E.-I. & Hurlin, C. (2010) How to Evaluate an Early Warning
System? Towards a Unified Statistical Framework for Assessing Financial Crises
Forecasting Methods. Working Paper, Maastricht University.
Chinn, M. & Ito, H. (2006) What Matters for Financial Development? Capital Controls,
Institutions, and Interactions. Journal of Development Economics, 61(1), 163-192.
Cowan, K., De Gregorio, J., Micco, A. & Neilson, C. (2008) Financial Diversification,
Sudden Stops, and Sudden Starts. In Current Account and External Financing (K.
Cowan, S. Edwards, R. Valdés, & N. Loayza, Eds.). Central Bank of Chile.
Dooley, M. P. (2000) A Model of Crises in Emerging Markets. Economic Journal,
110(460), 256-272.
Eichengreen, B., Rose, A. & Wyplosz, C (1996) Contagious Currency Crises. NBER
Working Paper No. 5681.

Understanding International Gross Capital Flows
15
Faucette, J., Rothenberg, C. & Warnock, F. (2005) Outflows-induced Sudden Stops.
Journal of Policy Reform, 8(2), 119-130.
Forbes, K., & Warnock, F. (forthcoming) Capital Flow Waves: Surges, Stops, Flight and
Retrenchment. Journal of International Economics.
Frankel, J. A & Schmukler, S. L. (1996) Country Fund Discounts and the Mexican Crisis
of December 1994: Did Local Residents Turn Pessimistic before International Investors?
Open Economies Review, 7(1), 511-534.
Granger, C. W. J. & Machina, M. J. (2006) Forecasting and Decision Theory. In
Handbook of Economic Forecasting, Vol. 1 (G. Elliott, C. W. J. Granger & A.
Timmermann, Eds.). Amsterdam: North-Holland.
Hendricks, K. B & Singhal, V. R. (2005) An Empirical Analysis of the Effect of Supply
Chain Disruptions on Long-Run Stock Price Performance and Equity Risk of the Firm.
Production and Operations Management, 14(1), 35-52.
Hutchison, M. M. & Noy, I. (2006) Sudden Stops and the Mexican Wave: Currency
Crises, Capital Flow Reversals and Output Loss in Emerging Markets. Journal of
Development Economics, 79(1), 225-248.
Ito, T. (1999). Capital Flows in Asia. NBER Working Paper No. 7134.
Janus, T. & Riera-Crichton, D. (2010) The Output Effects of Gross Foreign Investment
Reversals. Working Paper, Bates College.
Kaminsky, G. L. & Reinhart, C. M. (1999) The Twin Crises: The Causes of Banking and
Balance-of-Payments Problems. American Economic Review, 89(3), 473-500.
Kumar, M., Moorthy, U. & Perraudin, W. (2003) Predicting Emerging Market Currency
Crashes. Journal of Empirical Finance, 10(4), 427-454.

Understanding International Gross Capital Flows
16
Mody, A. & Murshid, A. P. (2005) Growing up With Capital Flows. Journal of
International Economics, 65(1), 249-266.
Murphy K. M, Shleifer, A. & Vishny, R. W. (1989) Industrialization and the Big Push.
Journal of Political Economy, 97(5), 1003-26.
Obstfeld, M. (2009) International Finance and Growth in Developing Countries: What
Have We Learned? IMF Staff Papers, 56(1), 63-111.
Prasad, E., Rogoff, K., Wei, S.-J. & Kose, M. A. (2003) The Effects of Financial
Globalization on Developing Countries: Some Empirical Evidence. IMF Occasional
Paper No. 220.
Prasad, E. & Wei, S.-J. (2005) The Chinese Approach to Capital Inflows: Patterns and
Possible Explanations. IMF Working Paper No. 05/79.
Rothenberg, A., & Warnock, F. (forthcoming) Sudden Flight and True Sudden Stops.
Review of International Economics.
Tille, C. & Wincoop, E. v. (2008) International Capital Flows under Dispersed
Information: Theory and Evidence. NBER Working Paper No. 14390.

Understanding International Gross Capital Flows
17
Appendix: Variables, Data Sources, Figures and Tables
Real GDP Growth: Defined as the as the quarter-on-quarter percentage change in real
$US GDP, Ln(Y(t))-lnY(t-4)). The main source is the IMF’s International Financial
Statistics (IFS) dataset, from which we also draw GDP deflators. We first transform
nominal to real GDP, then convert it to US$ using the nominal exchange rate in IFS, and
then compute the growth rate. Other sources for real GDP are OECD Source, Economist
Intelligence Unit (EIU), DataStream (DS) and the CEIC Data Company Ltd. (CEIC).
Total Gross Capital Flows: Total gross flows are calculated adding up the absolute
value of all liability increases and decreases plus total asset increases and decreases from
the capital and financial balance of each country.
Private Outflows from Liabilities (POfL): Defined as the absolute value of all
decreases in foreign liabilities from private domestic residents in the financial and capital
accounts.
Private Inflows from Liabilities (PIfL): Defined as the absolute value of all increases in
foreign liabilities from private domestic residents in the financial and capital accounts.
Private Outflows from Assets (POfA): Defined as the absolute value of all increases in
foreign assets from private domestic residents in the financial and capital accounts.
Private Inflows from Assets (PIfA): Defined as the absolute value of all decreases in
foreign assets from private domestic residents in the financial and capital accounts.
Net Inflows: Defined as the current account deficit minus the increase in international
reserves. The main source for balance of payments data is the IMF’s Balance of
Payments Statistics (BOPS). Data for Taiwan and Switzerland was obtained from CEIC.
Understanding International Gross Capital Flows
18
Domestic Credit: defined Stock of domestic credit is measured as bank lending to public
and private sectors, plus bank lending in domestic currency overseas (Line 32 in IFS).
The Main source is IFS but we also use data from EIU, DS and CEIC.
Stock of Reserves: Defined as the total stock of international reserves minus gold.
Sources are IFS, DS and EIU.
Inflation: Domestic CPI Inflation. Main sources are IFS, DS, EIU and CEIC. Hyperinflation
is inflation exceeding 100% per quarter.
Relative Export Growth: The growth rate of the ratio (export/imports) in current US
dollars with export and import data extracted from IFS, DS, EIU and CEIC.
Real Effective Exchange Rate (REER): The real effective exchange rate index
represents a nominal effective exchange rate index adjusted for relative movements in
national price or cost indicators of the home country,
iw
ii
t
i PPeeREER )]/)(/[(
Where e: Exchange rate of the subject currency against the US dollar (US dollars per
rupee in index form); ei: Exchange rates of currency i against the US dollar (US dollars
per currency i in index form); wi: Weights attached to the country/ currency i in the
index; P: Consumer Price Index (CPI) of Subject country and Pi is the Consumer price
index of country i. An Increase in REER corresponds to a Real Domestic Appreciation.
Data belongs to the IFS dataset, OECD and the Broad REER calculated by JP Morgan
and provided through Datastream.

Understanding International Gross Capital Flows
19
Figure 1: Gross Capital Flows (percent of GDP) during the Asian Crisis (1997-98)
*Horizontal lines represent start and end of financial turmoil. Gross flows are deflated by Nominal GDP.
Indonesia
0
0.1
0.2
0.3
0.4
0.5
Private Outflows from LiabilitiesPrivate Inflows from LiabilitiesPrivate Outflows from AssetsPrivate Inflows from Assets
South Korea
0
0.1
0.2
0.3
Private Outflows from LiabilitiesPrivate Inflows from LiabilitiesPrivate Outflows from AssetsPrivate Inflows from Assets
Standard Gross Flows
-0.4
-0.2
0
0.2
0.4
Q1 1
996
Q2 1
996
Q3 1
996
Q4 1
996
Q1 1
997
Q2 1
997
Q3 1
997
Q4 1
997
Q1 1
998
Q2 1
998
Q3 1
998
Q4 1
998
Q1 1
999
Q2 1
999
Q3 1
999
Q4 1
999
Gross Private Outflow s
Gross Private Inflow s
Standard Gross Flows
-0.3
-0.2
-0.1
0
0.1
0.2
0.3
Q1 1
996
Q2 1
996
Q3 1
996
Q4 1
996
Q1 1
997
Q2 1
997
Q3 1
997
Q4 1
997
Q1 1
998
Q2 1
998
Q3 1
998
Q4 1
998
Q1 1
999
Q2 1
999
Q3 1
999
Q4 1
999
Gross Private Outflow s
Gross Private Inflow s

Understanding International Gross Capital Flows
20
Figure 2: Gross Capital Flows (percent of GDP) during financial turmoil in Latin America (Argentina 2002, Mexico 1995)
*Horizontal lines represent start and end of financial turmoil. Gross flows are deflated by Nominal GDP.
Mexico
0
0.01
0.02
0.03
0.04 Private Outflows from LiabilitiesPrivate Inflows from LiabilitiesPrivate Outflows from AssetsPrivate Inflows from Assets
Argentina
0
0.01
0.02
0.03
0.04
0.05
Private Outflows from LiabilitiesPrivate Inflows from LiabilitiesPrivate Outflows from AssetsPrivate Inflows from Assets
Standard Gross Flows
-0.04
-0.02
0
0.02
0.04
Q1 1
993
Q2 1
993
Q3 1
993
Q4 1
993
Q1 1
994
Q2 1
994
Q3 1
994
Q4 1
994
Q1 1
995
Q2 1
995
Q3 1
995
Q4 1
995
Q1 1
996
Q2 1
996
Q3 1
996
Q4 1
996
Gross Private Outflow s
Gross Private Inflow s
Standard Gross Flows
-0.04
-0.02
0
0.02
0.04
0.06
Q1 2
000
Q2 2
000
Q3 2
000
Q4 2
000
Q1 2
001
Q2 2
001
Q3 2
001
Q4 2
001
Q1 2
002
Q2 2
002
Q3 2
002
Q4 2
002
Q1 2
003
Q2 2
003
Q3 2
003
Q4 2
003
Gross Private Outflow s
Gross Private Inflow s

Understanding International Gross Capital Flows
21
Figure 3: Gross Capital Flows (percent of GDP) during the Great Recession (United States and United Kingdom 2008)
*Horizontal lines represent start and end of financial turmoil. Gross flows are deflated by Nominal GDP.
United States
0
0.02
0.04
0.06
Private Outflows from LiabilitiesPrivate Inflows from LiabilitiesPrivate Outflows from AssetsPrivate Inflows from Assets
k
United Kingdom
0
0.5
1
1.5
2
2.5
Private Outflows from LiabilitiesPrivate Inflows from LiabilitiesPrivate Outflows from AssetsPrivate Inflows from Assets
Standard Gross Flows
-0.04
-0.02
0
0.02
0.04
0.06
Q4 2
003
Q1 2
004
Q2 2
004
Q3 2
004
Q4 2
004
Q1 2
005
Q2 2
005
Q3 2
005
Q4 2
005
Q1 2
006
Q2 2
006
Q3 2
006
Q4 2
006
Q1 2
007
Q2 2
007
Q3 2
007
Q4 2
007
Q1 2
008
Q2 2
008
Q3 2
008
Q4 2
008
Q1 2
009
Q2 2
009
Gross Private Outflow s
Gross Private Inflow s
Standard Gross Flows
-2.5
-2
-1.5
-1
-0.5
0
0.5
1
1.5
2
2.5
Q4 2
003
Q1 2
004
Q2 2
004
Q3 2
004
Q4 2
004
Q1 2
005
Q2 2
005
Q3 2
005
Q4 2
005
Q1 2
006
Q2 2
006
Q3 2
006
Q4 2
006
Q1 2
007
Q2 2
007
Q3 2
007
Q4 2
007
Q1 2
008
Q2 2
008
Q3 2
008
Q4 2
008
Q1 2
009
Gross Private Outflow s
Gross Private Inflow s

Understanding International Gross Capital Flows
22
Figure 4: Noise-to-Signal Ratios (NSR) for Logit Models of Sudden Stops (Type 1 in Upper Panel, Type 2 in Lower Panel)

23
Table 1: Transition Matrices for Sudden Stops
ST 1 0 1 Total ST 2 0 1 Total
0 4,861 57 4,918 0 4,689 100 4,789
% 98.84 1.16 100 % 97.91 2.09 100
1 51 56 107 1 91 145 236
% 47.66 52.34 100 % 38.56 61.44 100
Total 4,912 113 5,025 Total 4,780 245 5,025
97.75 2.25 100 95.12 4.88 100
Notes: ST1 is a sudden stop defined as a currency crisis along with a rise in the current account-to-GDP
ratio of more than twice the country-specific standard deviation of that ratio; ST2 is a sudden stop defined
as a currency crisis along with a quarter-to-quarter rise of three percentage points or more in the current
account-to-GDP ratio.
Table 2: Summary Statistics
Variable Obs Mean Std. Dev. Min Max
Standard Private Gross Inflows* 5429 0.099943 0.241149 -2.04754 3.033564
Standard Private Gross Outflows* 5429 0.083404 0.240495 -2.74348 3.183507
Private Outflows from Liabilities* 5429 0.038408 0.107626 0 3.144324
Private Outflows from Assets* 5429 0.121371 0.256126 0 3.376829
Private Inflows from Liabilities* 5429 0.138351 0.255195 0 3.315092
Private Inflows from Assets* 5429 0.037968 0.107798 0 3.557818
Real Output Growth in US$ 5429 -0.00273 0.228313 -3.75227 0.89835
Current Account Balance* 5429 -0.01148 0.065682 -0.64946 0.291153
Stock of Reserves* 5429 0.432199 0.53556 0.001904 4.258942
Domestic Credit Growth 5429 0.022719 0.231026 -2.71431 3.881695
Hyperinflation dummy 5429 0.01492 0.121244 0 1
Relative Export Growth 5429 3.635688 246.7352 -936.756 18079.07
Notes: *Variables are deflated by GDP. [Private] Outflows from Liabilities, Outflows from Assets, Inflows
from Liabilities and Inflows from Assets correspond to, respectively, L- , A
+, L
+ , and A
- in equation (1).
Standard Private Gross Inflows and Outflows equal, respectively, )( LL and )( AA .
24
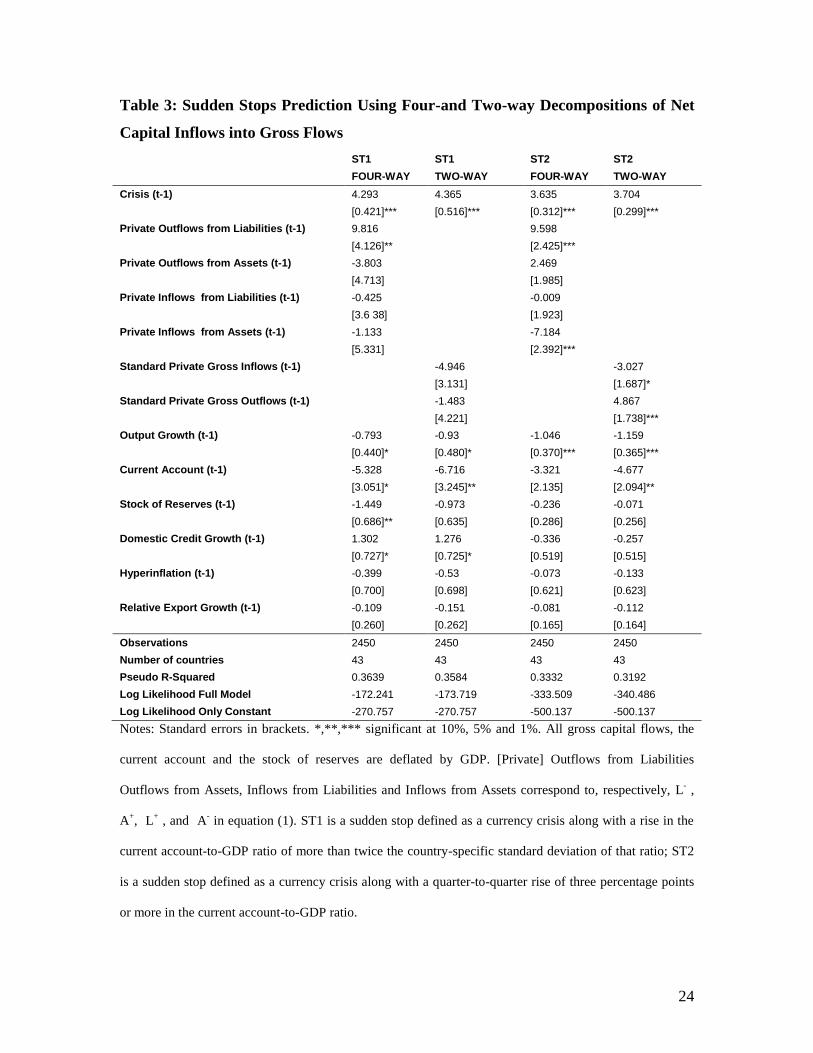
Table 3: Sudden Stops Prediction Using Four-and Two-way Decompositions of Net
Capital Inflows into Gross Flows
ST1 ST1 ST2 ST2 FOUR-WAY TWO-WAY FOUR-WAY TWO-WAY
Crisis (t-1) 4.293 4.365 3.635 3.704
[0.421]*** [0.516]*** [0.312]*** [0.299]***
Private Outflows from Liabilities (t-1) 9.816 9.598
[4.126]** [2.425]***
Private Outflows from Assets (t-1) -3.803 2.469
[4.713] [1.985]
Private Inflows from Liabilities (t-1) -0.425 -0.009
[3.6 38] [1.923]
Private Inflows from Assets (t-1) -1.133 -7.184
[5.331] [2.392]***
Standard Private Gross Inflows (t-1) -4.946 -3.027
[3.131] [1.687]*
Standard Private Gross Outflows (t-1) -1.483 4.867
[4.221] [1.738]***
Output Growth (t-1) -0.793 -0.93 -1.046 -1.159
[0.440]* [0.480]* [0.370]*** [0.365]***
Current Account (t-1) -5.328 -6.716 -3.321 -4.677
[3.051]* [3.245]** [2.135] [2.094]**
Stock of Reserves (t-1) -1.449 -0.973 -0.236 -0.071
[0.686]** [0.635] [0.286] [0.256]
Domestic Credit Growth (t-1) 1.302 1.276 -0.336 -0.257
[0.727]* [0.725]* [0.519] [0.515]
Hyperinflation (t-1) -0.399 -0.53 -0.073 -0.133
[0.700] [0.698] [0.621] [0.623]
Relative Export Growth (t-1) -0.109 -0.151 -0.081 -0.112
[0.260] [0.262] [0.165] [0.164]
Observations 2450 2450 2450 2450
Number of countries 43 43 43 43
Pseudo R-Squared 0.3639 0.3584 0.3332 0.3192
Log Likelihood Full Model -172.241 -173.719 -333.509 -340.486
Log Likelihood Only Constant -270.757 -270.757 -500.137 -500.137
Notes: Standard errors in brackets. *,**,*** significant at 10%, 5% and 1%. All gross capital flows, the
current account and the stock of reserves are deflated by GDP. [Private] Outflows from Liabilities
Outflows from Assets, Inflows from Liabilities and Inflows from Assets correspond to, respectively, L- ,
A+, L
+ , and A
- in equation (1). ST1 is a sudden stop defined as a currency crisis along with a rise in the
current account-to-GDP ratio of more than twice the country-specific standard deviation of that ratio; ST2
is a sudden stop defined as a currency crisis along with a quarter-to-quarter rise of three percentage points
or more in the current account-to-GDP ratio.