Embed Size (px)
Citation preview
The Japanese Geotechnical Society
Soils and Foundations
Soils and Foundations 2014;54(3):296–312
http://d0038-0
nCorAve, N
Peer
x.doi.org/1806/& 201
respondenedlands, W
review un
www.sciencedirect.comjournal homepage: www.elsevier.com/locate/sandf
Understanding ground deformation mechanisms for multi-proppedexcavation in soft clay
S.Y. Lamn, S.K. Haigh, M.D. Bolton
Department of Engineering, University of Cambridge, UK
Received 30 June 2012; received in revised form 14 May 2013; accepted 8 April 2014Available online 17 May 2014
Abstract
Deep excavation works are carried out to construct underground infrastructures such as deep basements, subways, and service tunnels. Theexecution of these deep excavation works requires the use of retaining walls and bracing systems. Inadequate support systems have always beenof major concern, as excessive ground movement induced during excavation could cause damage to neighboring structures, resulting in delays,disputes, and cost overruns. To gain a better understanding of the mechanisms involved in soil excavations, centrifuge model tests of deepexcavations in slightly over-consolidated soft clay have been carried out using a newly developed testing system, in which the constructionsequence of a multi-propped wall for deep excavations can be simulated in flight. Deformation mechanisms are observed using Particle ImageVelocimetry. Settlements of the ground surface and changes in pore water pressure are monitored during the excavation. The effects of propstiffness, wall rigidity, and excavation geometry on the characteristics of ground deformation and soil–structure interaction are demonstrated anddiscussed. The use of the conservation of energy within the framework of the mobilizable strength design in calculating ground movements isvalidated and shown to perform satisfactorily.& 2014 The Japanese Geotechnical Society. Production and hosting by Elsevier B.V. All rights reserved.
Keywords: Centrifuge; Multi-propped excavation; Deformation mechanisms; Mobilizable strength design
1. Introduction
Deep excavations in soft clay are carried out for a variety ofpurposes, including the construction of station boxes and cut-and-cover tunnels during underground railway construction.
0.1016/j.sandf.2014.04.0054 The Japanese Geotechnical Society. Production and hosting by
ce to: Advanced Geomechanics, Pty. Ltd. 52-54, MonashA 6009, Australia.
der responsibility of The Japanese Geotechnical Society.
In order to prevent the collapse of these excavations and tominimize the disruption to neighboring infrastructures due tosettlements, multiple levels of props are used to support theretaining walls during construction. In order to better under-stand the mechanisms involved in the construction of multi-propped deep excavations in soft clay, centrifuge model testshave been carried out using a newly developed testing system,in which the construction sequence of a multi-propped deepexcavation can be properly simulated (Lam et al., 2012).
2. Methodology
Small-scale centrifuge models can be used to simulate theprototype behavior of an excavation in soft soil. A
Elsevier B.V. All rights reserved.
S.Y. Lam et al. / Soils and Foundations 54 (2014) 296–312 297
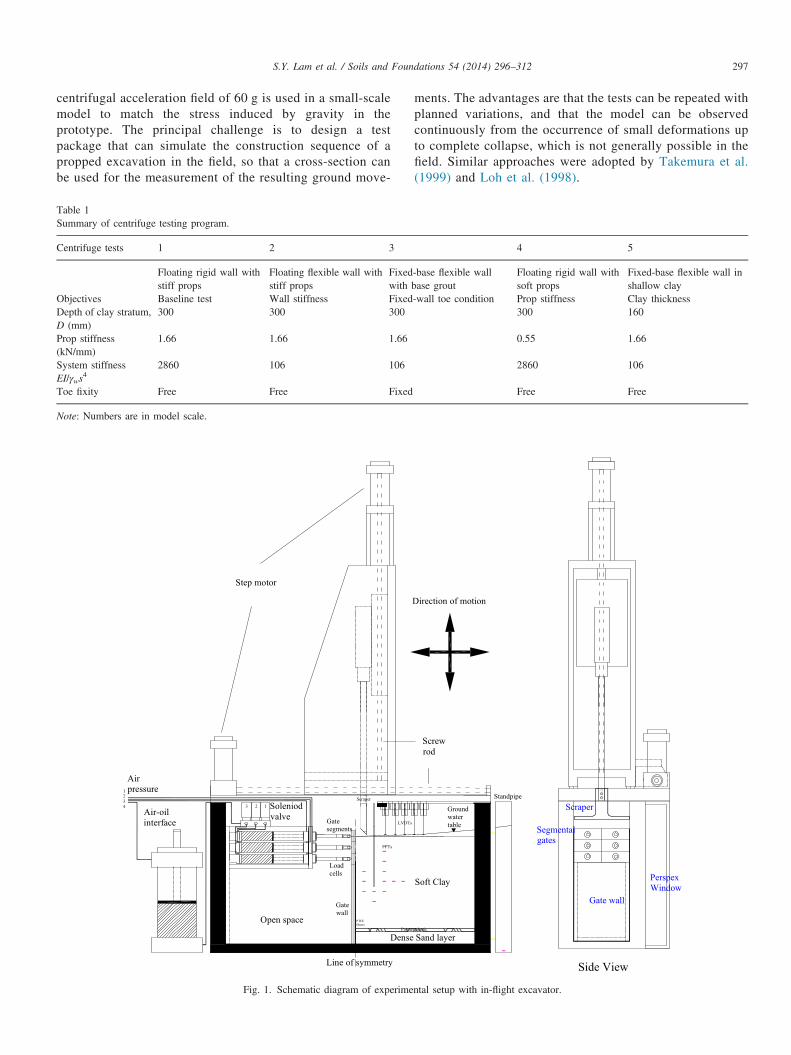
centrifugal acceleration field of 60 g is used in a small-scalemodel to match the stress induced by gravity in theprototype. The principal challenge is to design a testpackage that can simulate the construction sequence of apropped excavation in the field, so that a cross-section canbe used for the measurement of the resulting ground move-
Table 1Summary of centrifuge testing program.
Centrifuge tests 1 2 3
Floating rigid wall withstiff props
Floating flexible wall withstiff props
Fixedwith
Objectives Baseline test Wall stiffness FixedDepth of clay stratum,D (mm)
300 300 300
Prop stiffness(kN/mm)
1.66 1.66 1.66
System stiffnessEI/γws
42860 106 106
Toe fixity Free Free Fixed
Note: Numbers are in model scale.
Open space
Air pressure
Soleniod valve
Line of symmetry
Load cells
Gate segments
Dense
Air-oil interface
Gate wall
Step motor
Fig. 1. Schematic diagram of experime
ments. The advantages are that the tests can be repeated withplanned variations, and that the model can be observedcontinuously from the occurrence of small deformations upto complete collapse, which is not generally possible in thefield. Similar approaches were adopted by Takemura et al.(1999) and Loh et al. (1998).
4 5
-base flexible wallbase grout
Floating rigid wall withsoft props
Fixed-base flexible wall inshallow clay
-wall toe condition Prop stiffness Clay thickness300 160
0.55 1.66
2860 106
Free Free
Ground water table
Sand layer
Soft Clay
Standpipe
Screwrod
Direction of motion
Segmental gates
Gate wall
Perspex Window
Scraper
Side View
ntal setup with in-flight excavator.
S.Y. Lam et al. / Soils and Foundations 54 (2014) 296–312298
3. Test program
Five centrifuge model tests were carried out in order tostudy the undrained short-term behavior of excavations in softclays. Test 1 investigated the behavior of a floating rigid wallsupported by stiff props; Test 2 studied the effect of wallflexibility on the deformation mechanism; Test 3 looked intothe effects of a grout layer fixing the wall toe; Test 4 simulateda rigid wall supported by soft props to study the effect of softpropping on changes in the deformation pattern; Test 5 studiedthe case of an excavation in shallow clay using a flexible wall.A summary of the test program is given in Table 1.
4. Experimental setup
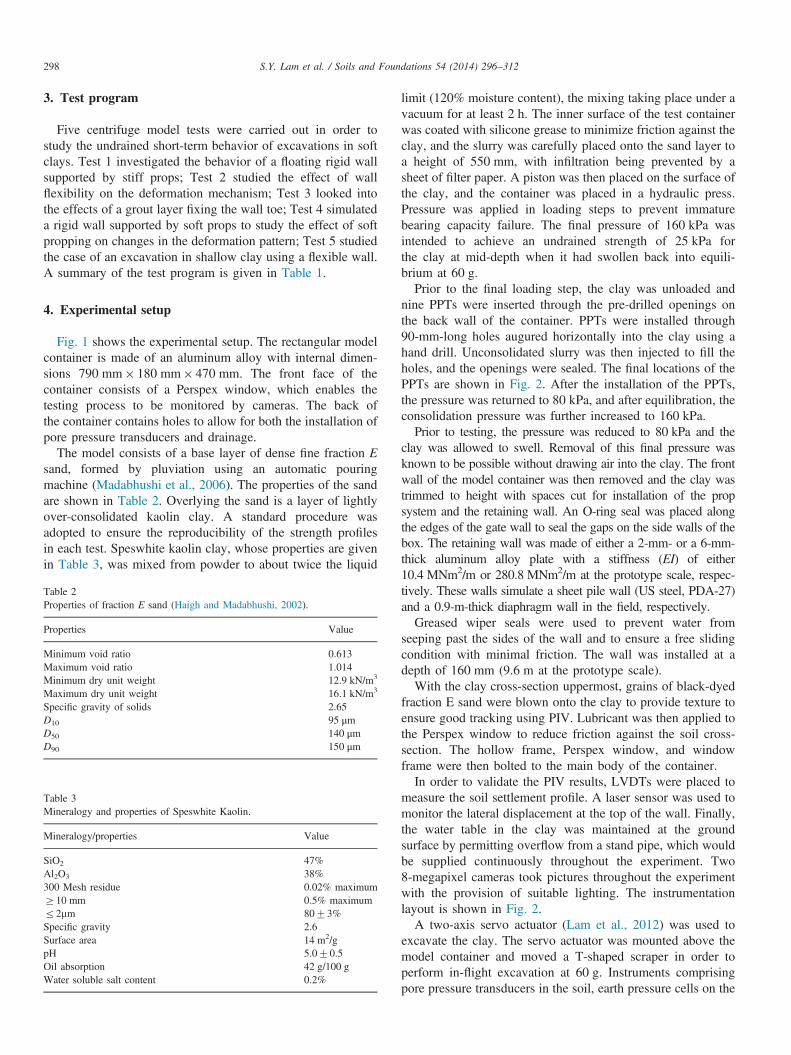
Fig. 1 shows the experimental setup. The rectangular modelcontainer is made of an aluminum alloy with internal dimen-sions 790 mm� 180 mm� 470 mm. The front face of thecontainer consists of a Perspex window, which enables thetesting process to be monitored by cameras. The back ofthe container contains holes to allow for both the installation ofpore pressure transducers and drainage.
The model consists of a base layer of dense fine fraction Esand, formed by pluviation using an automatic pouringmachine (Madabhushi et al., 2006). The properties of the sandare shown in Table 2. Overlying the sand is a layer of lightlyover-consolidated kaolin clay. A standard procedure wasadopted to ensure the reproducibility of the strength profilesin each test. Speswhite kaolin clay, whose properties are givenin Table 3, was mixed from powder to about twice the liquid
Table 2Properties of fraction E sand (Haigh and Madabhushi, 2002).
Properties Value
Minimum void ratio 0.613Maximum void ratio 1.014Minimum dry unit weight 12.9 kN/m3
Maximum dry unit weight 16.1 kN/m3
Specific gravity of solids 2.65D10 95 μmD50 140 μmD90 150 μm
Table 3Mineralogy and properties of Speswhite Kaolin.
Mineralogy/properties Value
SiO2 47%Al2O3 38%300 Mesh residue 0.02% maximumZ10 mm 0.5% maximumr2mm 8073%Specific gravity 2.6Surface area 14 m2/gpH 5.070.5Oil absorption 42 g/100 gWater soluble salt content 0.2%
limit (120% moisture content), the mixing taking place under avacuum for at least 2 h. The inner surface of the test containerwas coated with silicone grease to minimize friction against theclay, and the slurry was carefully placed onto the sand layer toa height of 550 mm, with infiltration being prevented by asheet of filter paper. A piston was then placed on the surface ofthe clay, and the container was placed in a hydraulic press.Pressure was applied in loading steps to prevent immaturebearing capacity failure. The final pressure of 160 kPa wasintended to achieve an undrained strength of 25 kPa forthe clay at mid-depth when it had swollen back into equili-brium at 60 g.Prior to the final loading step, the clay was unloaded and
nine PPTs were inserted through the pre-drilled openings onthe back wall of the container. PPTs were installed through90-mm-long holes augured horizontally into the clay using ahand drill. Unconsolidated slurry was then injected to fill theholes, and the openings were sealed. The final locations of thePPTs are shown in Fig. 2. After the installation of the PPTs,the pressure was returned to 80 kPa, and after equilibration, theconsolidation pressure was further increased to 160 kPa.Prior to testing, the pressure was reduced to 80 kPa and the
clay was allowed to swell. Removal of this final pressure wasknown to be possible without drawing air into the clay. The frontwall of the model container was then removed and the clay wastrimmed to height with spaces cut for installation of the propsystem and the retaining wall. An O-ring seal was placed alongthe edges of the gate wall to seal the gaps on the side walls of thebox. The retaining wall was made of either a 2-mm- or a 6-mm-thick aluminum alloy plate with a stiffness (EI) of either10.4 MNm2/m or 280.8 MNm2/m at the prototype scale, respec-tively. These walls simulate a sheet pile wall (US steel, PDA-27)and a 0.9-m-thick diaphragm wall in the field, respectively.Greased wiper seals were used to prevent water from
seeping past the sides of the wall and to ensure a free slidingcondition with minimal friction. The wall was installed at adepth of 160 mm (9.6 m at the prototype scale).With the clay cross-section uppermost, grains of black-dyed
fraction E sand were blown onto the clay to provide texture toensure good tracking using PIV. Lubricant was then applied tothe Perspex window to reduce friction against the soil cross-section. The hollow frame, Perspex window, and windowframe were then bolted to the main body of the container.In order to validate the PIV results, LVDTs were placed to
measure the soil settlement profile. A laser sensor was used tomonitor the lateral displacement at the top of the wall. Finally,the water table in the clay was maintained at the groundsurface by permitting overflow from a stand pipe, which wouldbe supplied continuously throughout the experiment. Two8-megapixel cameras took pictures throughout the experimentwith the provision of suitable lighting. The instrumentationlayout is shown in Fig. 2.A two-axis servo actuator (Lam et al., 2012) was used to
excavate the clay. The servo actuator was mounted above themodel container and moved a T-shaped scraper in order toperform in-flight excavation at 60 g. Instruments comprisingpore pressure transducers in the soil, earth pressure cells on the
LC3 & LC 4
LC1 & LC2
LVDT4LVDT2
LVDT5LVDT3
PPT 9
PPT 7
PPT 6PPT 8 PPT 5
PPT 4PPT 3
PPT 2
LVDT1
Soft Clay
Bearing stratum
295.00
Ground water table
Gate wall segments
PPT 1
@30.00 c/c
Porous plastic
@32.00 c/c
48.00
O-ring seal
LC5 & LC6
Scraper
32.00 c/c @30.00 c/c60.00
30.00
PPT SP
Standpipe
Overflow pipe
D=300
Fig. 2. Positions of instruments on model package in elevation view (in mm).
S.Y. Lam et al. / Soils and Foundations 54 (2014) 296–312 299
retaining wall, bending moment strain gauges on the wall, loadcells on the props, and linear variable transformers fordisplacement measurements were installed. Digital cameraswere mounted in front of the Perspex window and LED arrayswere situated to illuminate the clay cross-section withoutcausing glare or shadows.
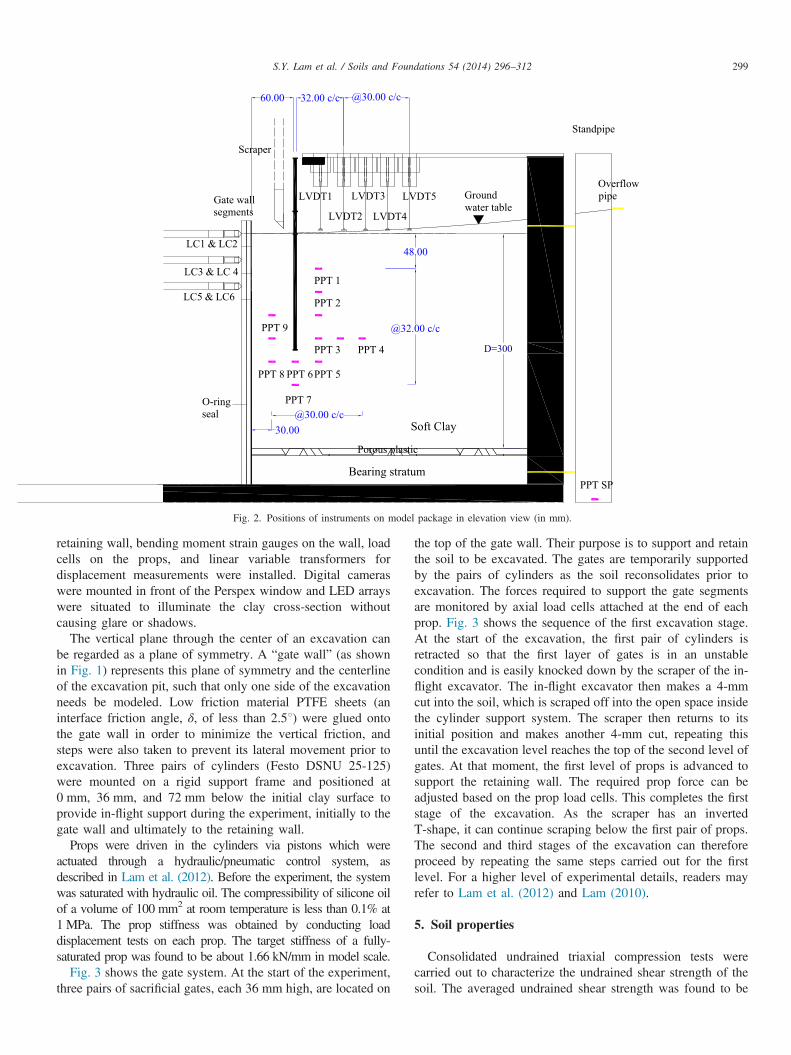
The vertical plane through the center of an excavation canbe regarded as a plane of symmetry. A “gate wall” (as shownin Fig. 1) represents this plane of symmetry and the centerlineof the excavation pit, such that only one side of the excavationneeds be modeled. Low friction material PTFE sheets (aninterface friction angle, δ, of less than 2.51) were glued ontothe gate wall in order to minimize the vertical friction, andsteps were also taken to prevent its lateral movement prior toexcavation. Three pairs of cylinders (Festo DSNU 25-125)were mounted on a rigid support frame and positioned at0 mm, 36 mm, and 72 mm below the initial clay surface toprovide in-flight support during the experiment, initially to thegate wall and ultimately to the retaining wall.
Props were driven in the cylinders via pistons which wereactuated through a hydraulic/pneumatic control system, asdescribed in Lam et al. (2012). Before the experiment, the systemwas saturated with hydraulic oil. The compressibility of silicone oilof a volume of 100 mm2 at room temperature is less than 0.1% at1 MPa. The prop stiffness was obtained by conducting loaddisplacement tests on each prop. The target stiffness of a fully-saturated prop was found to be about 1.66 kN/mm in model scale.
Fig. 3 shows the gate system. At the start of the experiment,three pairs of sacrificial gates, each 36 mm high, are located on
the top of the gate wall. Their purpose is to support and retainthe soil to be excavated. The gates are temporarily supportedby the pairs of cylinders as the soil reconsolidates prior toexcavation. The forces required to support the gate segmentsare monitored by axial load cells attached at the end of eachprop. Fig. 3 shows the sequence of the first excavation stage.At the start of the excavation, the first pair of cylinders isretracted so that the first layer of gates is in an unstablecondition and is easily knocked down by the scraper of the in-flight excavator. The in-flight excavator then makes a 4-mmcut into the soil, which is scraped off into the open space insidethe cylinder support system. The scraper then returns to itsinitial position and makes another 4-mm cut, repeating thisuntil the excavation level reaches the top of the second level ofgates. At that moment, the first level of props is advanced tosupport the retaining wall. The required prop force can beadjusted based on the prop load cells. This completes the firststage of the excavation. As the scraper has an invertedT-shape, it can continue scraping below the first pair of props.The second and third stages of the excavation can thereforeproceed by repeating the same steps carried out for the firstlevel. For a higher level of experimental details, readers mayrefer to Lam et al. (2012) and Lam (2010).
5. Soil properties
Consolidated undrained triaxial compression tests werecarried out to characterize the undrained shear strength of thesoil. The averaged undrained shear strength was found to be

Load cells
Scraper sen sen
Load cells
Scraper
sen
Load cells
Scraper
Load cells
Scraper
sens
Scraper
Fig. 3. Excavation sequences: segmental length¼36 mm.
Shear strain (%)
0 1 2 3 4 5
Dev
iato
r stre
ss, q
0102030405060
Vertical core test 1Vertical core test 2Horizontal core test 1Horizontal core test 2
Shear Strain
10-110-210-310-410-5
Seca
nt a
xial
st
iffne
ss E
(kPa
)
01000020000300004000050000
Vertical core Test 1Vertical core Test 2Horizontal core Test 1Horizontal core Test 2
Fig. 4. (a) Stress strain and (b) stiffness degradation curves for verticallyand horizontally cored samples at mid-depth of soft clay (p00 ¼125 kPa;p0 ¼26 kPa).
cu (kPa)
Dep
th a
t mod
el s
cale
(mm
)
0
50
100
150
200
250
300
Empirical estimation by Jamiolkowski et. al. (1985)
OCR0 5 10 15 20 25 30 35 5 10 15 20
0
50
100
150
200
250
3001
Fig. 5. (a) Undrained shear strength and (b) over-consolidation profile at 60 g.
S.Y. Lam et al. / Soils and Foundations 54 (2014) 296–312300
25.5 kPa, as shown in Fig. 4. In Fig. 5, an estimated profilewith the empirical relation suggested by Jamiolkowski et al.(1985) is shown for comparison.
Jamiolkowski et al. (1985) related the strength of the soil tothe vertical effective stress and over-consolidation ratio using
cu ¼ 0:22s0vðOCRÞ0:8 ð1ÞIn the present study, the stress strain behavior of lightly over-consolidated Speswhite kaolin at small and intermediate strainlevels was studied using a new local strain measurement anddynamic wave propagation system incorporated into a triaxialapparatus. Isotropically consolidated compression tests werecarried out on two vertically and two horizontally cutcylindrical specimens, 100 mm by 50 mm, taken from a blockof clay pre-consolidated at 160 kPa. All specimens wereisotropically consolidated to 125 kPa and then allowed toswell back to 26 kPa before application of the deviatoric load,in order to replicate the mean stress at the mid-depth of thewall. Compressive strain was applied over 8 h at a rate of0.16 mm/h. Secant Young's modulus was calculated as theratio of the deviator stress to the locally measured axial strain.Subsequently, the undrained shear modulus was derived byassuming a Poisson's ratio of 0.5. The secant axial modulus
was plotted against local strain on a semi-log scale for thepurpose of investigating the stiffness degradation in the verysmall to finite strain range. As observed in the stress–straincurves and stiffness degradation curves shown in Fig. 4, thehorizontally cut specimens are slightly stiffer and stronger thanthe vertically cut specimens. This could be ascribed to thedirection of the bedding plane of the clay particles formingduring the deposition and the one-dimensional consolidation.Shear wave velocity was measured using bender elements
within the samples. By sending shear waves with a highfrequency of 1 kHz, the difference between the arrival time andthe input signal can be assessed by the cross-correlationmethod. The sample length to wavelength ratio was chosento be 9.6 in order to separate the near-field coupled compres-sion and the shear waves, hence avoiding near-field effects(Leong et al., 2005).From the shear wave velocity, shear stiffness Go can be
determined from the elastic wave propagation theory asfollows:
Go ¼ ρVs2 ð2Þ
where ρ is the total density of the soil.Three bender element tests were carried out on one vertical
and two horizontal core samples. The maximum shear stiffness
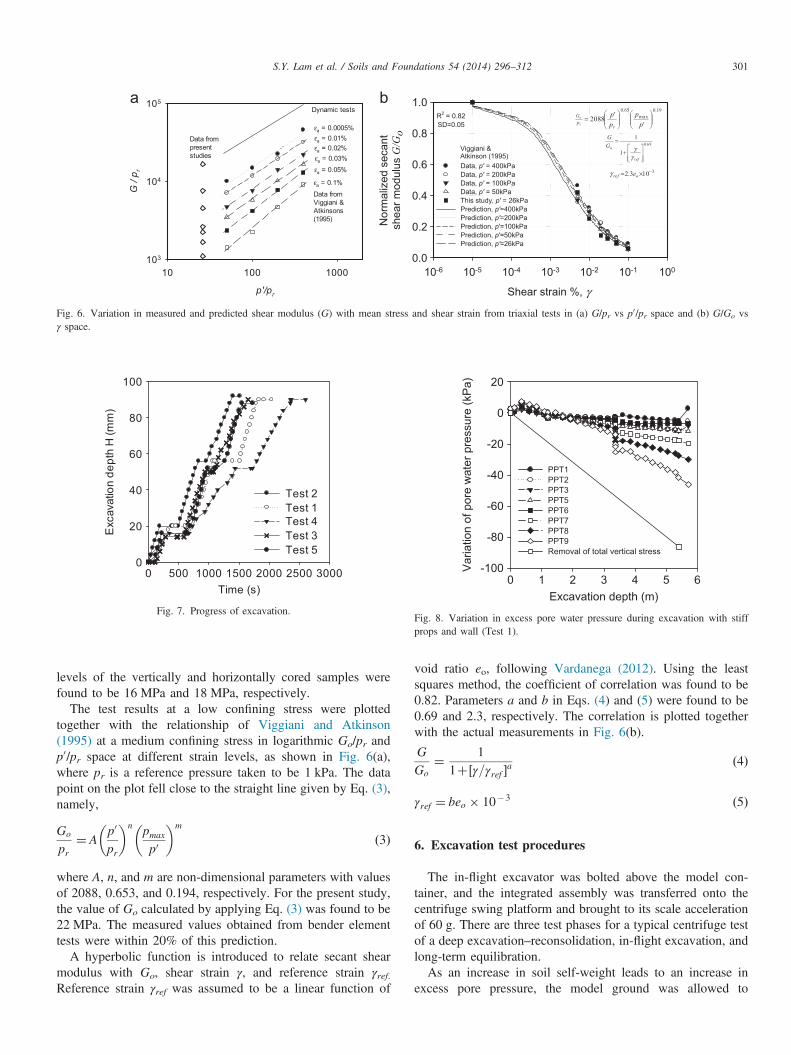
Fig. 6. Variation in measured and predicted shear modulus (G) with mean stress and shear strain from triaxial tests in (a) G/pr vs p0/pr space and (b) G/Go vsγ space.
Fig. 7. Progress of excavation.Fig. 8. Variation in excess pore water pressure during excavation with stiffprops and wall (Test 1).
S.Y. Lam et al. / Soils and Foundations 54 (2014) 296–312 301
levels of the vertically and horizontally cored samples werefound to be 16 MPa and 18 MPa, respectively.
The test results at a low confining stress were plottedtogether with the relationship of Viggiani and Atkinson(1995) at a medium confining stress in logarithmic Go/pr andp0/pr space at different strain levels, as shown in Fig. 6(a),where pr is a reference pressure taken to be 1 kPa. The datapoint on the plot fell close to the straight line given by Eq. (3),namely,
Go
pr¼ A
p0
pr
� �n pmaxp0
� �m
ð3Þ
where A, n, and m are non-dimensional parameters with valuesof 2088, 0.653, and 0.194, respectively. For the present study,the value of Go calculated by applying Eq. (3) was found to be22 MPa. The measured values obtained from bender elementtests were within 20% of this prediction.
A hyperbolic function is introduced to relate secant shearmodulus with Go, shear strain γ, and reference strain γref.Reference strain γref was assumed to be a linear function of
void ratio eo, following Vardanega (2012). Using the leastsquares method, the coefficient of correlation was found to be0.82. Parameters a and b in Eqs. (4) and (5) were found to be0.69 and 2.3, respectively. The correlation is plotted togetherwith the actual measurements in Fig. 6(b).
G
Go¼ 1
1þ½γ=γref �að4Þ
γref ¼ beo � 10�3 ð5Þ
6. Excavation test procedures
The in-flight excavator was bolted above the model con-tainer, and the integrated assembly was transferred onto thecentrifuge swing platform and brought to its scale accelerationof 60 g. There are three test phases for a typical centrifuge testof a deep excavation–reconsolidation, in-flight excavation, andlong-term equilibration.As an increase in soil self-weight leads to an increase in
excess pore pressure, the model ground was allowed to
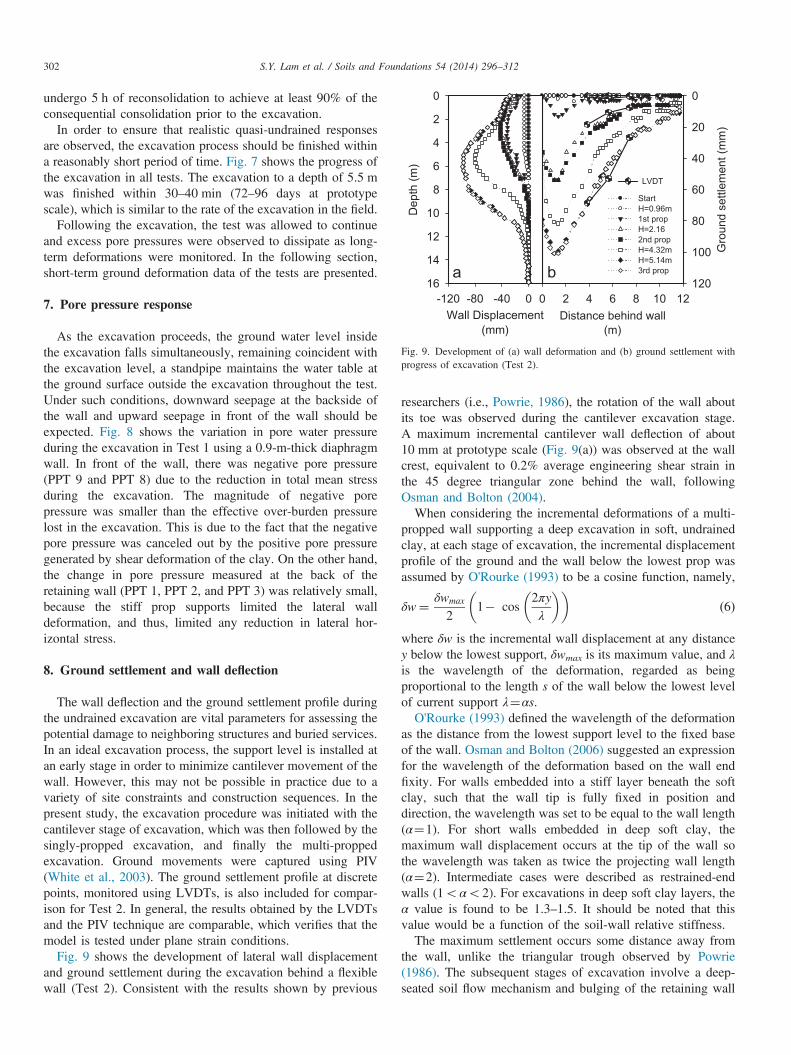
Fig. 9. Development of (a) wall deformation and (b) ground settlement withprogress of excavation (Test 2).
S.Y. Lam et al. / Soils and Foundations 54 (2014) 296–312302
undergo 5 h of reconsolidation to achieve at least 90% of theconsequential consolidation prior to the excavation.
In order to ensure that realistic quasi-undrained responsesare observed, the excavation process should be finished withina reasonably short period of time. Fig. 7 shows the progress ofthe excavation in all tests. The excavation to a depth of 5.5 mwas finished within 30–40 min (72–96 days at prototypescale), which is similar to the rate of the excavation in the field.
Following the excavation, the test was allowed to continueand excess pore pressures were observed to dissipate as long-term deformations were monitored. In the following section,short-term ground deformation data of the tests are presented.
7. Pore pressure response
As the excavation proceeds, the ground water level insidethe excavation falls simultaneously, remaining coincident withthe excavation level, a standpipe maintains the water table atthe ground surface outside the excavation throughout the test.Under such conditions, downward seepage at the backside ofthe wall and upward seepage in front of the wall should beexpected. Fig. 8 shows the variation in pore water pressureduring the excavation in Test 1 using a 0.9-m-thick diaphragmwall. In front of the wall, there was negative pore pressure(PPT 9 and PPT 8) due to the reduction in total mean stressduring the excavation. The magnitude of negative porepressure was smaller than the effective over-burden pressurelost in the excavation. This is due to the fact that the negativepore pressure was canceled out by the positive pore pressuregenerated by shear deformation of the clay. On the other hand,the change in pore pressure measured at the back of theretaining wall (PPT 1, PPT 2, and PPT 3) was relatively small,because the stiff prop supports limited the lateral walldeformation, and thus, limited any reduction in lateral hor-izontal stress.
8. Ground settlement and wall deflection
The wall deflection and the ground settlement profile duringthe undrained excavation are vital parameters for assessing thepotential damage to neighboring structures and buried services.In an ideal excavation process, the support level is installed atan early stage in order to minimize cantilever movement of thewall. However, this may not be possible in practice due to avariety of site constraints and construction sequences. In thepresent study, the excavation procedure was initiated with thecantilever stage of excavation, which was then followed by thesingly-propped excavation, and finally the multi-proppedexcavation. Ground movements were captured using PIV(White et al., 2003). The ground settlement profile at discretepoints, monitored using LVDTs, is also included for compar-ison for Test 2. In general, the results obtained by the LVDTsand the PIV technique are comparable, which verifies that themodel is tested under plane strain conditions.
Fig. 9 shows the development of lateral wall displacementand ground settlement during the excavation behind a flexiblewall (Test 2). Consistent with the results shown by previous
researchers (i.e., Powrie, 1986), the rotation of the wall aboutits toe was observed during the cantilever excavation stage.A maximum incremental cantilever wall deflection of about10 mm at prototype scale (Fig. 9(a)) was observed at the wallcrest, equivalent to 0.2% average engineering shear strain inthe 45 degree triangular zone behind the wall, followingOsman and Bolton (2004).When considering the incremental deformations of a multi-
propped wall supporting a deep excavation in soft, undrainedclay, at each stage of excavation, the incremental displacementprofile of the ground and the wall below the lowest prop wasassumed by O'Rourke (1993) to be a cosine function, namely,
δw¼ δwmax
21� cos
2πyλ
� �� �ð6Þ
where δw is the incremental wall displacement at any distancey below the lowest support, δwmax is its maximum value, and λis the wavelength of the deformation, regarded as beingproportional to the length s of the wall below the lowest levelof current support λ¼αs.O'Rourke (1993) defined the wavelength of the deformation
as the distance from the lowest support level to the fixed baseof the wall. Osman and Bolton (2006) suggested an expressionfor the wavelength of the deformation based on the wall endfixity. For walls embedded into a stiff layer beneath the softclay, such that the wall tip is fully fixed in position anddirection, the wavelength was set to be equal to the wall length(α¼1). For short walls embedded in deep soft clay, themaximum wall displacement occurs at the tip of the wall sothe wavelength was taken as twice the projecting wall length(α¼2). Intermediate cases were described as restrained-endwalls (1oαo2). For excavations in deep soft clay layers, theα value is found to be 1.3–1.5. It should be noted that thisvalue would be a function of the soil-wall relative stiffness.The maximum settlement occurs some distance away from
the wall, unlike the triangular trough observed by Powrie(1986). The subsequent stages of excavation involve a deep-seated soil flow mechanism and bulging of the retaining wall

Fig. 10. Development of (a) wall deformation and (b) ground settlement withprogress of excavation (Test 5).
S.Y. Lam et al. / Soils and Foundations 54 (2014) 296–312 303
below the lowest level of struts (Fig. 9(b)). The maximumincremental lateral wall displacements for the second and thirdstages were 30 mm and 90 mm, respectively. These move-ments were equivalent to about 0.6% and 1.5% of the averageincremental engineering shear strain, respectively, within thedeformation zone, according to Bolton et al. (2008).
These findings once again show the importance of the smallstrain stiffness of over-consolidated soil in the analysis ofmulti-propped excavations. The development of settlementtroughs is complicated by the superposition of deep andshallow mechanisms at different points during the excavationprocess. This observation is consistent with the generalobservation given by Clough and O'Rourke (1990) that thesettlement trough of a multi-propped excavation is bounded bya trapezoidal zone extending up to 2 times the maximumexcavation depth back from the wall.
9. Effect of depth to stiff bearing stratum
Mana and Clough (1981) presented parametric studies onthe effect of the depth to the bearing stratum on maximumlateral wall displacement for a fixed base wall. The resultsshowed that movements increase with both excavation widthand depth to the bearing stratum, the lateral wall displacementsincreasing by a factor of 1.5 when the depth to the stiff layerdoubled. In this analysis, however, soils are considered to beelastic, implying that the development of plastic strain is notpossible, hence over-predicting the soil movements.
Jen (1998) investigated the same issue with a moresophisticated numerical constitutive model, (MIT-E3). Para-metric studies on the effect of the depth to the hard stratumusing a floating wall were carried out. Results show that thedepth only affects the wall deflection below the excavationlevel, especially near the wall toe. On the other hand, thebehavior of shallower clay has a stronger impact on thedistribution of far-field ground settlement. As the location ofthe rigid base becomes shallower, the settlement trough tapersoff more rapidly. The width of the settlement trough isapproximately equal to the depth of the stiff stratum.
Fig. 10 shows the development of wall displacement andground settlement as the excavation in shallow clay progresses(Test 5). Since the wall toe is not fixed at the base, toe rotationand wall bulging are the major deformation modes. The lateralwall deformation shape is very similar to that of Test 2, exceptthat the length of the bulge is limited to the depth of thestiff layer.
The evolution of the soil displacement mechanism isillustrated in Fig. 11 at different stages of excavation. Theintroduction of the first pair of pre-loaded props inducesinward displacement at the wall crest (as shown in Fig. 11(a)). Beyond this stage, the deformation mechanism changed toa free bulging mode, equivalent to loading a vertical simply-supported beam. The majority of the wall rotation is developedat this stage since there is no rotational restraint at the wallcrest (as shown in Fig. 11(b)). After the introduction of thesecond row of props, the wall length below the lowest prop isrestrained from rotating at the prop location. The maximum
lateral wall displacement during the second and third stageswere 45 mm and 100 mm, respectively. These movementswere equivalent to about 0.9% and 2% of the average overallengineering shear strain, respectively, within the deformationzone according to Bolton et al. (2008).The maximum wall displacement is not affected by the
depth to the stiff stratum. The difference between the two testsis about 10%. This is comparable to the observation from thenumerical simulation of Jen (1998), who suggested thatthe maximum wall movement would differ only by 20% whenthe depth of stiff layer increased from 5 m to 50 m below thewall toe. The settlement trough is narrower when the soft claylayer is shallow, owing to the improved fixity at the wall base.This observation echoes the results simulated using FEA byJen (1998). This implies that an engineer who wants to controlthe extent of the excavation-induced movement shouldconsider improving the fixity at the wall toe with ground-improvement methods.
10. Effect of wall toe fixity conditions
For a deep excavation in a soft ground, the maximum walldeflection usually occurs at the final excavation level. To limitthe wall deflection at this level, ground improvement techni-ques such as jet-grouting are usually employed prior to theexcavation. A common approach is to improve the entire soillayer within the excavation zone below the excavation level tofix the wall toe. In the present study, a centrifuge test (Test 3)was carried out to understand how an infinitely stiff fixed-basegrout layer at the wall toe would affect the deformationmechanism.Fig. 12 shows the variation in wall displacement and ground
settlement for an excavation using a fixed-based wall (Test 3).Since the wall toe is fixed, only wall bulging movement ispossible. The lateral wall deformation mode shape is similar tothat of Test 2, except that a rotational restraint is imposed atthe wall toe. Fig. 12 shows the deformation of a fixed-base

Ground Surface
Ground Surface
Ground Surface
Fig. 11. Incremental displacements for different stages of excavation for Test 5.
S.Y. Lam et al. / Soils and Foundations 54 (2014) 296–312304

S.Y. Lam et al. / Soils and Foundations 54 (2014) 296–312 305
retaining wall for an excavation depth of 5.4 m. The maximumlateral wall displacements for the second and third stages were40 mm and 65 mm, respectively. These movements wereequivalent to about 0.8% and 1.3%, respectively, of theaverage overall engineering shear strain within the deformationzone. In effect, the wall toe fixity controlled the lateral soildeformation below the final excavation level. A reduction of50% in lateral wall movement for flexible retaining structurescan be achieved by fixing the wall toe.
Following the approach of Clough et al. (1989), the walldisplacement can be represented by a normalized wall dis-placement and depth below the lowest prop normalized by awavelength of deformation, as shown in Fig. 13. Results showthat the normalized curves for both floating and fixed-basewalls broadly follow the cosine curves. The deformation shapeis a good representation of a typical wall bulging displacementprofile below the lowest prop for multi-prop excavation stages.The wavelength of the deformation is a function of the depth to
Fig. 12. Development of (a) wall deformation and (b) ground settlement withprogress of excavation (Test 3).
Normalized distance, y/0.0 0.2 0.4 0.6 0.8 1.0
Nor
mal
ized
incr
emen
tal d
ispl
acem
ent
δw/δ
wm
ax
0.0
0.2
0.4
0.6
0.8
1.0
Deep clay (Test SYL05)Deep clay, fixed wall toe (Test SYL06)Cosine function
A
C
λ
Fig. 13. Variation in (a) normalized incremental displacement with distan
the stiff layer. For a fixed based wall, the wavelength is thesame as the unsupported length of the wall below the lowestprop, whereas the wavelength for a floating wall is 1.3–1.5times the unsupported length of the wall below the lowestprop. A simplified deformation mechanism for a narrowexcavation is suggested by Lam and Bolton (2011), as shownin Fig. 13. This mechanism of shearing at constant volumeconsists of three zones of distributed shear and generallyrepresents a continuous and compatible flow of soils with norelative sliding at the boundaries. Along the dashed flow lines,the displacement is described by Eq. (6).
11. Effect of wall stiffness
Fig. 14 shows the variation in wall displacement and groundsettlement for an excavation using a floating rigid diaphragmwall as the digging progresses (Test 1). Clough et al. (1989)proposed a semi-empirical procedure for estimating the move-ment of excavations in clay in which the maximum lateral wallmovement, δhm, is evaluated relative to the factor of safety (FS)and system stiffness η, defined as
η¼ EI=γwh4: ð7Þ
where EI is the flexural rigidity per unit width of the retainingwall, γw is the unit weight of water, and h is the averagesupport spacing.The variation in maximum normalized measured lateral
displacement (wmax/H) with system stiffness is shown inFig. 15. A worldwide database of excavation case historiesin soft clays (cuo75 kPa), as reported in Lam and Bolton(2011), is also included for reference. Lam and Bolton (2011)showed that the normalized lateral wall displacement decreaseswith an increasing factor of safety. There is no simpledependence, however, of normalized wall displacement onthe factor of safety. Similar observations can be made fromcentrifuge data. A large amount of scatter can be seen in thedata from walls with similar factors of safety and system
δwmax
δwmax
B
DF
E
I
H
λ
ce below the lowest prop and (b) simplified deformation mechanism.
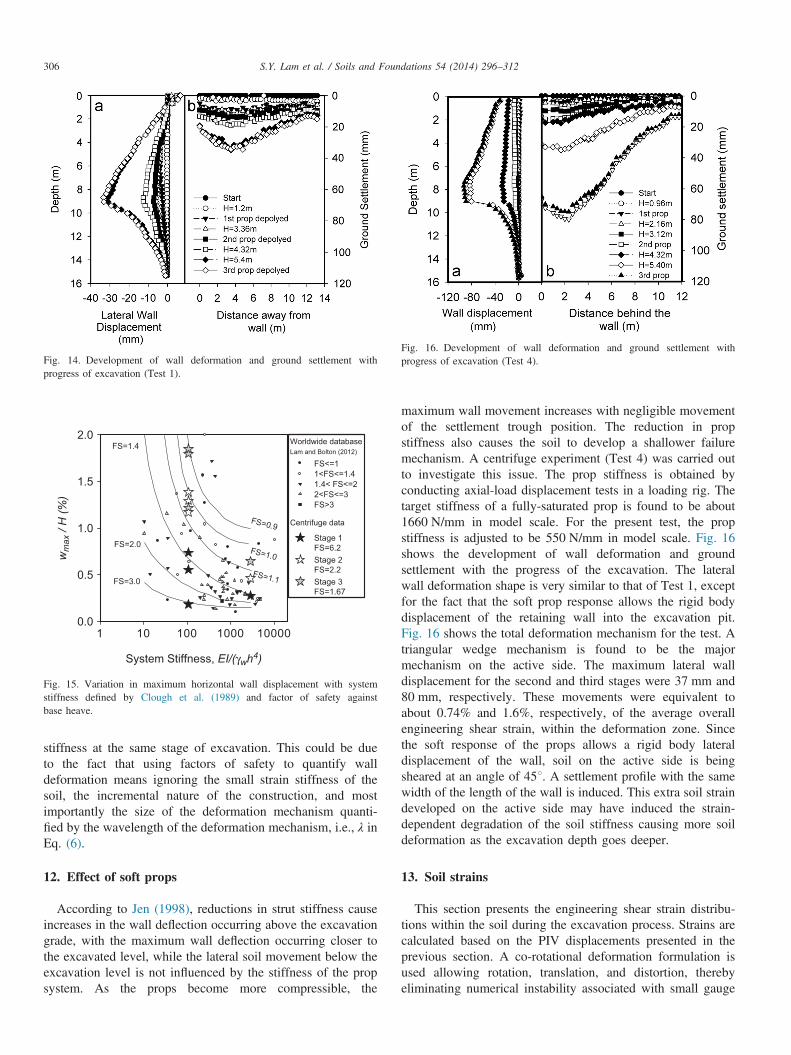
Fig. 14. Development of wall deformation and ground settlement withprogress of excavation (Test 1).
1 10 100 1000 100000.0
0.5
1.0
1.5
2.0
FS<=11<FS<=1.41.4< FS<=22<FS<=3FS>3
Stage 1FS=6.2Stage 2FS=2.2Stage 3FS=1.67
FS=1.0
FS=0.9
FS=1.1
FS=1.4
FS=2.0
FS=3.0
System Stiffness, EI/(γwh4)
wm
ax /
H (%
)
Worldwide databaseLam and Bolton (2012)
Centrifuge data
Fig. 15. Variation in maximum horizontal wall displacement with systemstiffness defined by Clough et al. (1989) and factor of safety againstbase heave.
Fig. 16. Development of wall deformation and ground settlement withprogress of excavation (Test 4).
S.Y. Lam et al. / Soils and Foundations 54 (2014) 296–312306
stiffness at the same stage of excavation. This could be dueto the fact that using factors of safety to quantify walldeformation means ignoring the small strain stiffness of thesoil, the incremental nature of the construction, and mostimportantly the size of the deformation mechanism quanti-fied by the wavelength of the deformation mechanism, i.e., λ inEq. (6).
12. Effect of soft props
According to Jen (1998), reductions in strut stiffness causeincreases in the wall deflection occurring above the excavationgrade, with the maximum wall deflection occurring closer tothe excavated level, while the lateral soil movement below theexcavation level is not influenced by the stiffness of the propsystem. As the props become more compressible, the
maximum wall movement increases with negligible movementof the settlement trough position. The reduction in propstiffness also causes the soil to develop a shallower failuremechanism. A centrifuge experiment (Test 4) was carried outto investigate this issue. The prop stiffness is obtained byconducting axial-load displacement tests in a loading rig. Thetarget stiffness of a fully-saturated prop is found to be about1660 N/mm in model scale. For the present test, the propstiffness is adjusted to be 550 N/mm in model scale. Fig. 16shows the development of wall deformation and groundsettlement with the progress of the excavation. The lateralwall deformation shape is very similar to that of Test 1, exceptfor the fact that the soft prop response allows the rigid bodydisplacement of the retaining wall into the excavation pit.Fig. 16 shows the total deformation mechanism for the test. Atriangular wedge mechanism is found to be the majormechanism on the active side. The maximum lateral walldisplacement for the second and third stages were 37 mm and80 mm, respectively. These movements were equivalent toabout 0.74% and 1.6%, respectively, of the average overallengineering shear strain, within the deformation zone. Sincethe soft response of the props allows a rigid body lateraldisplacement of the wall, soil on the active side is beingsheared at an angle of 451. A settlement profile with the samewidth of the length of the wall is induced. This extra soil straindeveloped on the active side may have induced the strain-dependent degradation of the soil stiffness causing more soildeformation as the excavation depth goes deeper.
13. Soil strains
This section presents the engineering shear strain distribu-tions within the soil during the excavation process. Strains arecalculated based on the PIV displacements presented in theprevious section. A co-rotational deformation formulation isused allowing rotation, translation, and distortion, therebyeliminating numerical instability associated with small gauge
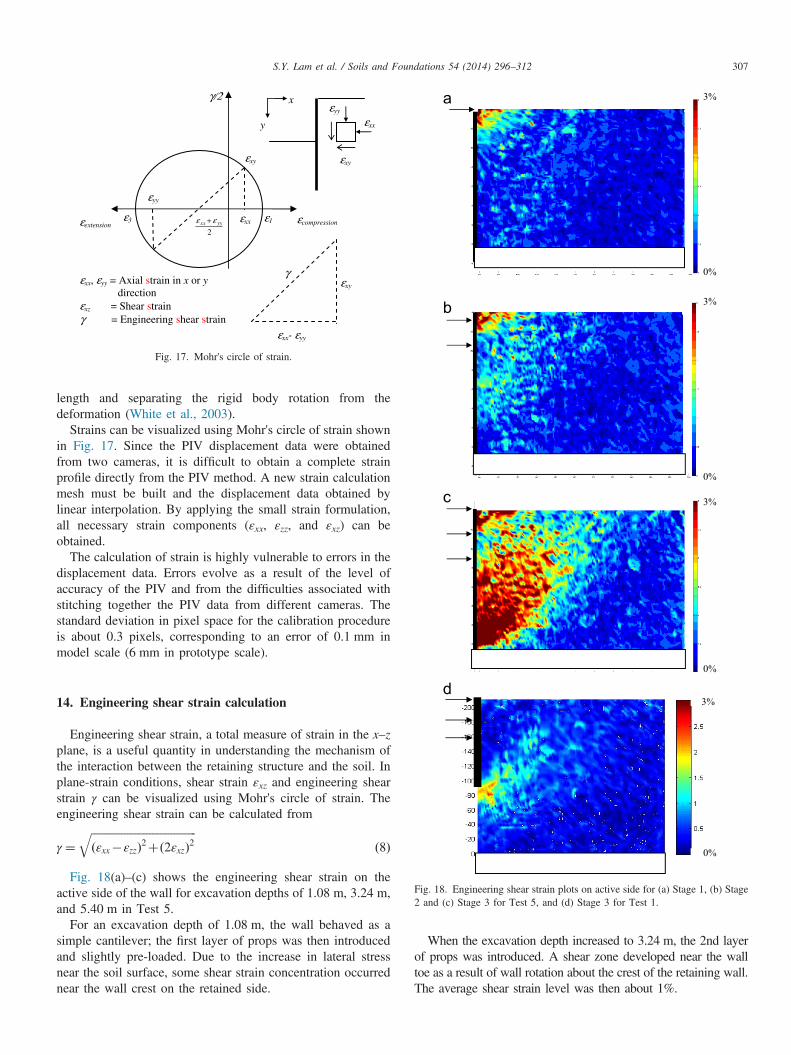
Fig. 17. Mohr's circle of strain.
3%
0%
3%
0%
3%
S.Y. Lam et al. / Soils and Foundations 54 (2014) 296–312 307
length and separating the rigid body rotation from thedeformation (White et al., 2003).
Strains can be visualized using Mohr's circle of strain shownin Fig. 17. Since the PIV displacement data were obtainedfrom two cameras, it is difficult to obtain a complete strainprofile directly from the PIV method. A new strain calculationmesh must be built and the displacement data obtained bylinear interpolation. By applying the small strain formulation,all necessary strain components (εxx, εzz, and εxz) can beobtained.
The calculation of strain is highly vulnerable to errors in thedisplacement data. Errors evolve as a result of the level ofaccuracy of the PIV and from the difficulties associated withstitching together the PIV data from different cameras. Thestandard deviation in pixel space for the calibration procedureis about 0.3 pixels, corresponding to an error of 0.1 mm inmodel scale (6 mm in prototype scale).
0%
3%
0%
Fig. 18. Engineering shear strain plots on active side for (a) Stage 1, (b) Stage2 and (c) Stage 3 for Test 5, and (d) Stage 3 for Test 1.
14. Engineering shear strain calculation
Engineering shear strain, a total measure of strain in the x–zplane, is a useful quantity in understanding the mechanism ofthe interaction between the retaining structure and the soil. Inplane-strain conditions, shear strain εxz and engineering shearstrain γ can be visualized using Mohr's circle of strain. Theengineering shear strain can be calculated from
γ ¼ffiffiffiffiffiffiffiffiffiffiffiffiffiffiffiffiffiffiffiffiffiffiffiffiffiffiffiffiffiffiffiffiffiffiffiffiffiffiðεxx�εzzÞ2þð2εxzÞ2
qð8Þ
Fig. 18(a)–(c) shows the engineering shear strain on theactive side of the wall for excavation depths of 1.08 m, 3.24 m,and 5.40 m in Test 5.
For an excavation depth of 1.08 m, the wall behaved as asimple cantilever; the first layer of props was then introducedand slightly pre-loaded. Due to the increase in lateral stressnear the soil surface, some shear strain concentration occurrednear the wall crest on the retained side.
When the excavation depth increased to 3.24 m, the 2nd layerof props was introduced. A shear zone developed near the walltoe as a result of wall rotation about the crest of the retaining wall.The average shear strain level was then about 1%.
ΔW=2.3 J/m
W=3.1 J/m
W=12.8 J/m
Δ
Δ
a
b
c
Fig. 19. Work done at excavation depths of (a) 1.08 m, (b) 3.24 m, and (c) 5.40 m for Test 5.
S.Y. Lam et al. / Soils and Foundations 54 (2014) 296–312308
After the installation of the third layer of props, a deepseated soil movement developed. A shear band developedfrom the wall toe and extended upwards towards the soilsurface.
Data from Test 5 (Fig. 18(c)) and Test 1 (Fig. 18(d)) offerthe opportunity of examining the difference in mechanismwhen comparing excavation cases with rigid and flexible walls.With a rigid retaining wall, the wall flexure below the lowestprop location is the main deformation mechanism. A very thinshear band developed at the toe of the wall and extendedtowards the soil surface. In contrast, around a flexible wall, no
soil arch forms as a result of the rigidity of the displacementboundary, suppressing the bulging of the wall.
15. Validation of the energy conservation principle
A simple analytical design framework, known as theMobilizable Strength Design (MSD) method, was developedby Osman and Bolton (2004). This uses the principle of theconservation of energy within a geo-structural mechanism topredict deformations based on known soil constitutive beha-vior. Lam and Bolton (2011) used this method to calculate the
ΔP=3.2 J/m
ΔP=1.1 J/m
ΔP=14.3 J/m
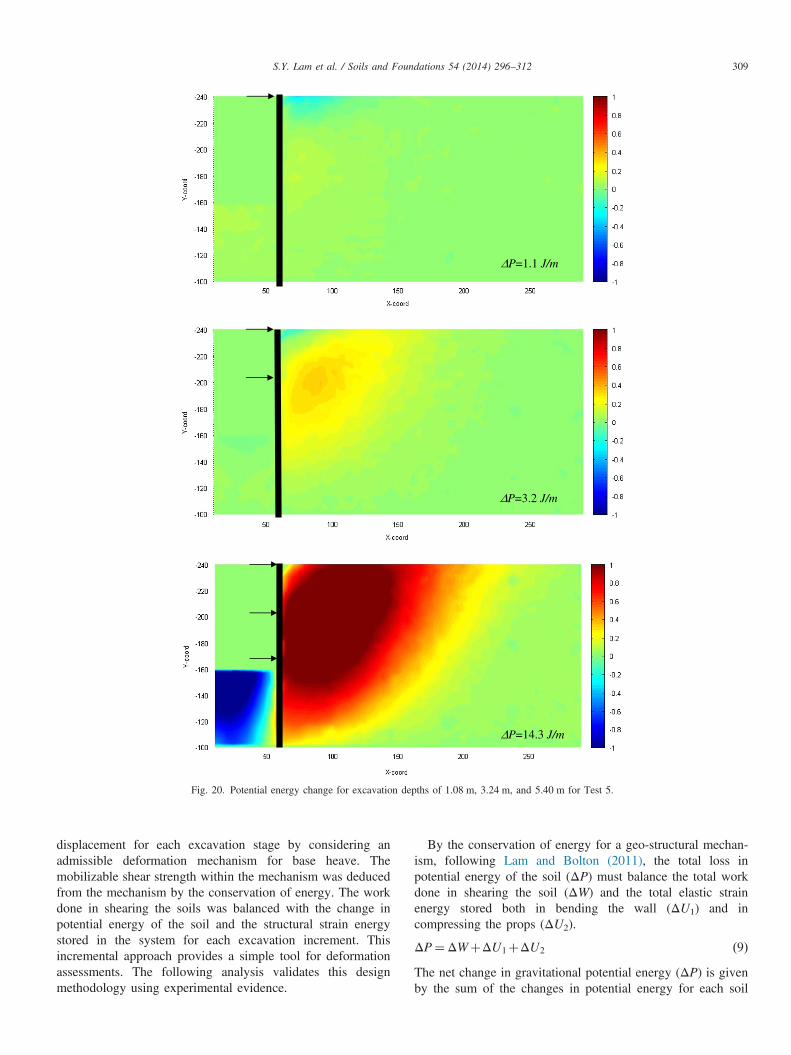
Fig. 20. Potential energy change for excavation depths of 1.08 m, 3.24 m, and 5.40 m for Test 5.
S.Y. Lam et al. / Soils and Foundations 54 (2014) 296–312 309
displacement for each excavation stage by considering anadmissible deformation mechanism for base heave. Themobilizable shear strength within the mechanism was deducedfrom the mechanism by the conservation of energy. The workdone in shearing the soils was balanced with the change inpotential energy of the soil and the structural strain energystored in the system for each excavation increment. Thisincremental approach provides a simple tool for deformationassessments. The following analysis validates this designmethodology using experimental evidence.
By the conservation of energy for a geo-structural mechan-ism, following Lam and Bolton (2011), the total loss inpotential energy of the soil (ΔP) must balance the total workdone in shearing the soil (ΔW) and the total elastic strainenergy stored both in bending the wall (ΔU1) and incompressing the props (ΔU2).
ΔP¼ΔWþΔU1þΔU2 ð9ÞThe net change in gravitational potential energy (ΔP) is givenby the sum of the changes in potential energy for each soil
ΔW+ΔU1+ΔU 2 (J/m)0 5 10 15 20 25 30
ΔP
(J/m
)
0
5
10
15
20
25
30
Test 5Test 3Test 2
Stage 3
Stage 2
Stage 1
Fig. 21. Potential energy change versus work done on the soil–structuresystem.
S.Y. Lam et al. / Soils and Foundations 54 (2014) 296–312310
element, as follows:
ΔP¼ ∑n
i ¼ 1
ZArea
γsatðiÞδwyðiÞ dA� �
ð10Þ
where δwy(i) is the vertical component of displacement of thesoil in the ith soil element and γsat(i) is the saturated unitweight of the soil in the ith soil element.
While calculating the engineering shear strain, soil elementsare formed as triangles linking three neighboring patches. Thetotal work done, ΔW, in shearing the soil is given by summingfor each element, namely,
ΔW ¼ ∑n
i ¼ 1
ZArea
cmobðiÞjδγðiÞj dA� �
ð11Þ
where cu(i) is the undrained shear strength of soil in the ithelement, dγ(i) is the shear strain increment of the soil in the ithelement, and the corresponding mobilized strength ratio isgiven by the stress–strain relation defined by the simple powerlaw derived from Eqs. (4) and (5) using the least squaresmethod.cmobcu
¼ ðγ=γuÞa ð12Þ
where parameters γu and a were found to be 5% and 0.33,respectively. The work done per unit area in the element iscalculated as the area under the stress strain curve.
The total elastic strain energy stored in the wall, ΔU1, can beevaluated by repeatedly updating the deflected shape of thewall. It is necessary to do this since U is a quadratic function ofdisplacement.
ΔU1 ¼Z s
0
EIκ2
2dx ¼
Z s
0
M2
2EIdx ð13Þ
where E, I, and κ are the elastic modulus, the second momentof area per unit width of the wall, and the wall curvature,respectively, and s is the length of the wall below thelowest prop.
The total elastic energy stored in the props, ΔU2, can beestimated by calculating the sum of the product of thedisplacement of the prop after installation and the maximumprop force at different elevations.
ΔU2 ¼ ∑n
i¼1
Fiwi
2ð14Þ
where Fi is the maximum prop force after installation and wi isthe corresponding compressive displacement.
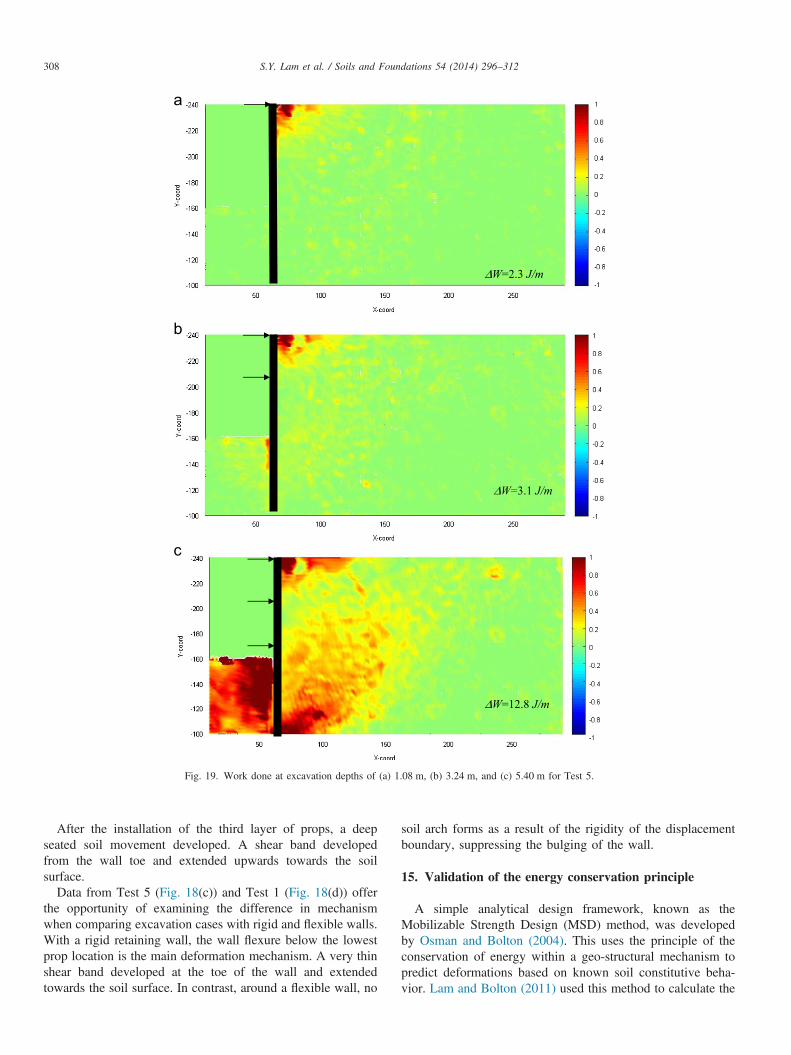
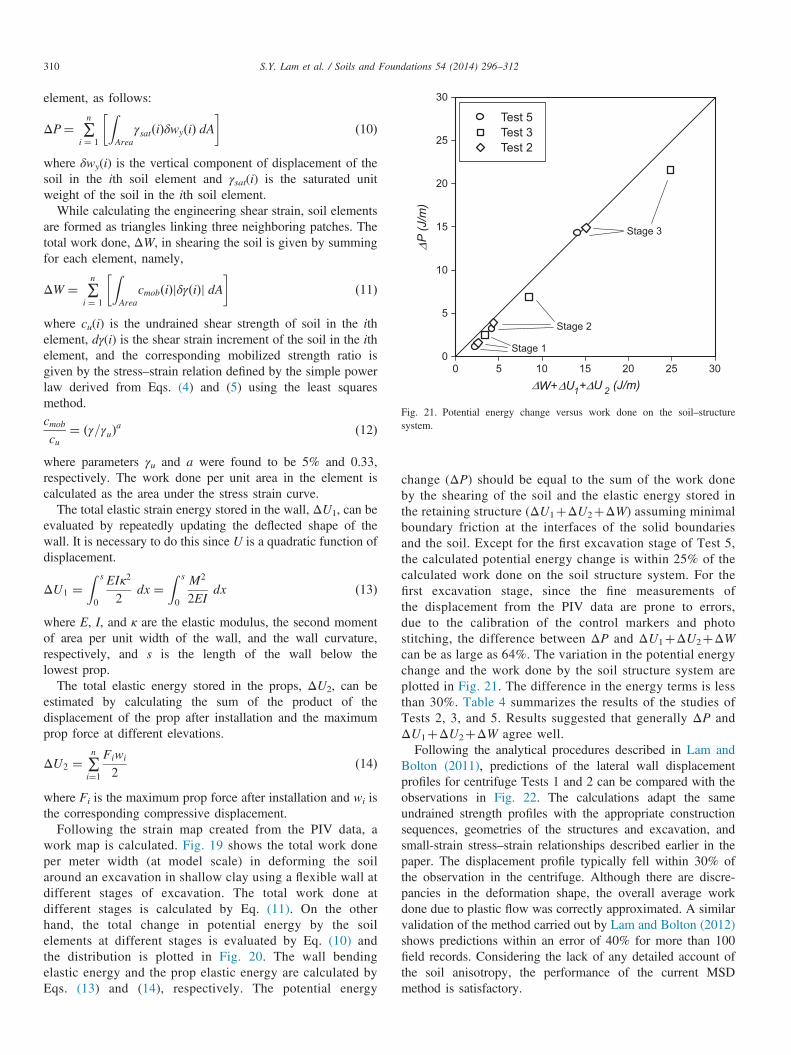
Following the strain map created from the PIV data, awork map is calculated. Fig. 19 shows the total work doneper meter width (at model scale) in deforming the soilaround an excavation in shallow clay using a flexible wall atdifferent stages of excavation. The total work done atdifferent stages is calculated by Eq. (11). On the otherhand, the total change in potential energy by the soilelements at different stages is evaluated by Eq. (10) andthe distribution is plotted in Fig. 20. The wall bendingelastic energy and the prop elastic energy are calculated byEqs. (13) and (14), respectively. The potential energy
change (ΔP) should be equal to the sum of the work doneby the shearing of the soil and the elastic energy stored inthe retaining structure (ΔU1þΔU2þΔW) assuming minimalboundary friction at the interfaces of the solid boundariesand the soil. Except for the first excavation stage of Test 5,the calculated potential energy change is within 25% of thecalculated work done on the soil structure system. For thefirst excavation stage, since the fine measurements ofthe displacement from the PIV data are prone to errors,due to the calibration of the control markers and photostitching, the difference between ΔP and ΔU1þΔU2þΔWcan be as large as 64%. The variation in the potential energychange and the work done by the soil structure system areplotted in Fig. 21. The difference in the energy terms is lessthan 30%. Table 4 summarizes the results of the studies ofTests 2, 3, and 5. Results suggested that generally ΔP andΔU1þΔU2þΔW agree well.Following the analytical procedures described in Lam and
Bolton (2011), predictions of the lateral wall displacementprofiles for centrifuge Tests 1 and 2 can be compared with theobservations in Fig. 22. The calculations adapt the sameundrained strength profiles with the appropriate constructionsequences, geometries of the structures and excavation, andsmall-strain stress–strain relationships described earlier in thepaper. The displacement profile typically fell within 30% ofthe observation in the centrifuge. Although there are discre-pancies in the deformation shape, the overall average workdone due to plastic flow was correctly approximated. A similarvalidation of the method carried out by Lam and Bolton (2012)shows predictions within an error of 40% for more than 100field records. Considering the lack of any detailed account ofthe soil anisotropy, the performance of the current MSDmethod is satisfactory.

Wall displacement (mm)-200 -150 -100 -50 0
Dep
th (m
)
0
2
4
6
8
10
12
14
16
Flexible, H = 3.12m, CentrifugeFlexible, H = 5.40m CentrifugeRigid, H = 3.12m, CentrifugeRigid, H = 5.40m, CentrifugeFlexible, H = 3.12m, MSDFlexible, H = 5.40m, MSDRigid, H = 3.12m, MSDRigid, H = 5.40m, MSD
Fig. 22. Predicted and measured lateral wall displacements with depth.
Table 4Summary of calculated energy terms for different tests.
Test & stage ΔU1 (J/m) ΔU2 (J/m) ΔW (J/m) ΔWþΔU1þΔU2 (J/m) ΔP (J/m) % Error
Test 5 1 0.007 0.03 2.3 2.3 1.1 �52.92 0.98 0.08 3.1 4.2 3.2 �23.13 1.1 0.19 12.8 14.1 14.3 1.49
Test 3 1 0.006 0.08 3.3 3.4 2.5 �34.22 1 0.12 7.4 8.5 6.9 �23.43 0.1 0.17 24.5 24.8 21.6 �12.8
Test 2 1 0.007 0.09 2.5 2.6 1.6 �63.52 1.00 0.12 3.3 4.4 3.9 �12.83 2.4 0.16 12.5 15.1 14.9 �1.06
S.Y. Lam et al. / Soils and Foundations 54 (2014) 296–312 311
16. Conclusions
With the aid of advanced physical model testing, theperformance of various model excavations was monitored.The ground deformation was closely monitored during the in-flight excavation process. Some of the key conclusions are
�
The wall deformation profile generally follows the cosinebulge equation proposed by O'Rourke (1993). Averagedsoil strains mobilized in the system are below 2%, reiter-ating the importance of small-strain stiffness for excavationproblems.�
The trend lines given by Clough et al. (1989) for estimatingwall lateral displacement in relation to factors of safetygenerally match the observed data. Should improvement onaccuracy be desired, engineers may look into the small-strain stiffness of soils, the incremental constructionsequence, and most importantly the characteristics of thedeformation mechanism.�
In general, the maximum wall displacement is more sensitive tothe fixity at the wall toe than to the depth of the clay stratum.The extent of the settlement trough behind the wall, however, isa function of the depth of the clay stratum.�
A reduction in strut stiffness increases wall deflection abovethe foundation level. The softer prop response induced ashallower local triangular mechanism with a deep, narrowtrough near the retaining structures.�
The conservation of energy as a principle for design isvalidated satisfactorily with experimental evidence. Theperformance of the MSD method falls within 30% of thecentrifuge test measurements.A simple MSD analysis can be performed within a reason-ably short time period, which could be a useful tool in takingkey design decisions as a precursor of a site-specific numericalanalysis.
References
Bolton, M.D., Lam, S.Y., Osman, A.S., 2008. Supporting Excavations in Clay-Form Analysis to Decision-Making. Special Lecture, 6th InternationalSymposium of Geotechnical Aspects of Underground Construction in SoftGround, Shanghai.
Clough, G.W., O'Rourke, T.D., 1990. Construction induced movements of in-situ walls. In: Proceedings of Design and Performance of Earth RetainingStructure, ASCE Special Conference, Ithaca, New York, pp. 439–470.
Clough, G.W., Smith, E.W., Sweeney, B.P., 1989. Movement control ofexcavation support system by iterative design. Foundation EngineeringCurrent Principles and Practices, vol. 2. ASCE, New York, NY869–882.
Haigh, S.K., Madabhushi, S.P.G., 2002. Dynamic centrifuge modeling of thedestruction of Sodom and Gomorrah, International conference on physicalmodeling in geotechnics. St. John's New found land, Canada.
Jamiolkowski, M., Ladd, C.C., Germaine, J.T., Lancellotta, R., 1985. Newdevelopments in field and laboratory testing of soils. In: Proceedings of11th ICSMFE, vol. 1, pp. 57–153.
Jen, L.C., 1998. The Design and Performance of Deep Excavation in Clay (Ph.D. thesis), MIT.
Lam, S.Y., 2010. Ground Movements Due to Excavation in Clay: Physical andAnalytical Models (Ph.D. thesis), University of Cambridge.
Lam, S.Y., Bolton, M.D., 2011. Energy conservation as a principle underlyingmobilizable strength design for deep excavations. J. Geotech. Geoenviron.Eng., ASCE 137 (11), 1062–1075.
S.Y. Lam et al. / Soils and Foundations 54 (2014) 296–312312
Lam, S.Y., Haigh, S.K., Bolton, M.D., 2011. Understanding ground deforma-tion mechanisms during multi-propped excavation in soft clay. In:Proceedings of the 7th International Symposium on Geotechnical Aspectsof Underground Construction in Soft Ground, Rome.
Lam, S.Y., Bolton, M.D., 2012. Energy conservation as a principle underlyingmobilizable strength design for deep excavations. J. Geotech. Geoenviron.Eng., ASCE 137, 1062–1075.
Lam, S.Y., Elshafie, M.Z.E.B., Haigh, S.K., Bolton, M.D., 2012. A new apparatusfor modelling excavations. Int. J. Phys. Model. Geotech. 12 (1), 24–38.
Leong, E.C., Yeo, S.H., Rahardjo, H., 2005. Measuring shear wave velocityusing bender elements. Geotechn. Test. J. 28 (5), 488–498.
Loh, C.K., Tan, T.S., Lee, F.H., 1998. Three dimensional excavation tests inthe centrifuge. In: Proceedings of Centrifuge 98, Tokyo.
Madabhushi, S.P.G., Houghton N.E., Haigh S.K., 2006. A new automatic sandpourer for model preparation at University of Cambridge. In: Proceedingsof the International Conference of Physical Modeling in Geotechnics, HongKong, pp. 217–222.
Mana, A.I., Clough, G.W., 1981. Prediction of movements for braced cuts inclay. ASCE J. Soil Mech. Found. Div. 107 (6), 759–777.
O'Rourke, T.D., 1993. Base stability and ground movement prediction forexcavations in soft clay. Retaining Structures. Thomas Telford, London131–139.
Osman, A.S., Bolton, M.D., 2004. A new design method for retaining walls inclay. Can. Geotech. J. 41 (3), 453–469.
Osman, A.S., Bolton, M.D., 2006. Ground movement predictions for bracedexcavations in undrained clay. J. Geotech. Geoenviron. Eng., ASCE 132(4), 465–477.
Powrie, W., 1986. The Behavior of Diaphragm Walls in Clay (Ph.D. thesis),University of Cambridge.
Takemura, J., Kondoh, M., Esaki, T., Kouda, M., Kusakabe, O., 1999.Centrifuge model tests on double propped wall excavation in soft clay.Soils Found. 39 (3), 75–87.
Vardanega, P.J., 2012. Strength Mobilization for Geotechnical Design and itsApplication to Bored Piles (Ph.D. thesis), University of Cambridge.
Viggiani, G., Atkinson, J.H., 1995. Stiffness of fine-grained soil at very smallstrains. Geotechnique 45 (2), 249–265.
White, D.J., Take, W.A., Bolton, M.D., 2003. Soil deformation measurementusing particle image velocimetry (PIV) and photogrammetry. Geotechnique53 (7), 619–631.