Embed Size (px)
Citation preview

ORNL/TM-2020/1739 M3LW-20OR0402025
Analysis of Deformation Localization Mechanisms in Highly Irradiated Austenitic Stainless Steel via In Situ Techniques
M. N. Gussev N. Bibhanshu E. Cakmak J. Dixon
September 2020
Approved for public release. Distribution is unlimited.

DOCUMENT AVAILABILITY
Reports produced after January 1, 1996, are generally available free via US Department of Energy (DOE) SciTech Connect. Website http://www.osti.gov/scitech/ Reports produced before January 1, 1996, may be purchased by members of the public from the following source: National Technical Information Service 5285 Port Royal Road Springfield, VA 22161 Telephone 703-605-6000 (1-800-553-6847) TDD 703-487-4639 Fax 703-605-6900 E-mail [email protected] Website http://classic.ntis.gov/ Reports are available to DOE employees, DOE contractors, Energy Technology Data Exchange representatives, and International Nuclear Information System representatives from the following source: Office of Scientific and Technical Information PO Box 62 Oak Ridge, TN 37831 Telephone 865-576-8401 Fax 865-576-5728 E-mail [email protected] Website http://www.osti.gov/contact.html
This report was prepared as an account of work sponsored by an agency of the United States Government. Neither the United States Government nor any agency thereof, nor any of their employees, makes any warranty, express or implied, or assumes any legal liability or responsibility for the accuracy, completeness, or usefulness of any information, apparatus, product, or process disclosed, or represents that its use would not infringe privately owned rights. Reference herein to any specific commercial product, process, or service by trade name, trademark, manufacturer, or otherwise, does not necessarily constitute or imply its endorsement, recommendation, or favoring by the United States Government or any agency thereof. The views and opinions of authors expressed herein do not necessarily state or reflect those of the United States Government or any agency thereof.

ORNL/TM-2020/1739
M3LW-20OR0402025
Fusion and Materials for Nuclear Systems Division Materials Science and Technology Division
Analysis of Deformation Localization
Mechanisms in Highly Irradiated Austenitic
Stainless Steel via In Situ Techniques
M. N. Gussev
N. Bibhanshu E. Cakmak
J. Dixon
Date Published: September 2020
Prepared under the direction of the U.S. Department of Energy
Office of Nuclear Energy
Light Water Reactor Sustainability Program Materials Research Pathway
Prepared by
OAK RIDGE NATIONAL LABORATORY
Oak Ridge, TN 37831-6285 managed by
UT-BATTELLE, LLC
for the
U.S. DEPARTMENT OF ENERGY under contract DE-AC05-00OR22725

(This page intentionally left blank)

iii
CONTENTS
LIST OF FIGURES ................................................................................................................................. v LIST OF TABLES ................................................................................................................................ vii ABBREVIATED TERMS .................................................................................................................... viii EXECUTIVE SUMMARY ..................................................................................................................... x 1. High-damage doses (50+ dpa) as weakly explored area .................................................................... 1 2. MATERIALS AND EXPERIMENTAL METHODS ....................................................................... 2
2.1 SEM/EBSD System and Miniature Tensile Frame for In Situ Testing ..................................... 2 2.2 Tested Material ...................................................................................................................... 2 2.3 Authentic archive material ...................................................................................................... 3 2.4 Specimen geometry ................................................................................................................ 4 2.5 Specimen manufacturing and list of manufactured and tested specimens ................................. 5 2.6 Specimen preparation ............................................................................................................. 7 2.7 Computed X-Ray tomography analysis ................................................................................... 7
3. DEFORMATION LOCALIZATION PROCESSES IN HIGH-DOSE SPECIMENS ........................ 8 3.1 Stages of typical in situ SEM/EBSD test ................................................................................. 8 3.2 mechanical behavior of the investigated specimens ............................................................... 11 3.3 Microstructure evolution in the high-dose specimens ............................................................ 13 3.4 Misorientation evolution as function of local strain level ...................................................... 16
4. Microfracture events during the in situ testing ................................................................................ 18 4.1 SEM observations ................................................................................................................ 18 4.2 Computed X-Ray tomography results ................................................................................... 19
4.2.1 Reference (Nonirradiated) Specimen ........................................................................ 19 4.2.2 Irradiated specimen (69 dpa) .................................................................................... 22
5. SUMMARY AND CONCLUSIONS ............................................................................................. 26 6. ACKNOWLEDGMENTS ............................................................................................................. 26 REFERENCES...................................................................................................................................... 26

(This page intentionally left blank)

v
LIST OF FIGURES
Figure 1. Damage dose as a function of applied stress. Closed symbols represent failures; open
symbols represent survived specimens. The figure was adopted from [1]. .................................... 1 Figure 2. Microstructure of the 304L steel studied in the present work. The inverse pole figure
(IPF), image quality (IQ) map, phase map, and kernel average misorientation (KAM) map are given for 69 dpa irradiated steel. The material contains ~1–1.5 vol. % of retained
ferrite, forming specific clusters in the structure. IPF map is colored in the horizontal
direction, which is tensile direction during in situ mechanical tests; if no special note is given, all IPF maps below are colored in the tensile direction. The IPF color key is the
same for all IPF maps below. ...................................................................................................... 3 Figure 3. (a) Drawings of the ultra-miniature SS-Teeny specimen (dimensions are in millimeters);
(b) specimen appearance and size. A pen is used for scale. .......................................................... 4 Figure 4. Grips for the K&W tensile stage to handle the ultra-miniature specimens. (left)
Specimen inside grips (shown semi-transparent. (right) full assembly with specimen
holders to prevent specimen fall if the fracture occurs. ................................................................ 5 Figure 5. Conventional tensile grips for the designed ultra-small specimens. ............................................ 5 Figure 6. EDM system installed in LAMDA to manufacture specimens from radioactive material. .......... 6 Figure 7. A98-2-TENSILE, 69 dpa. Typical appearance of the specimen surface after
electropolishing. One can see a clean metallic surface with a few scattered nonmetallic
inclusions of metallurgical origin. Note the image is 70° tilted with tilt correction applied. .......... 7 Figure 8. Scheme of a typical in situ test. S01-S14: steps of the in situ test, showing the category
(or categories) of the data obtained. Specimen ID: A98-2-TENSILE, 69 dpa. The test
took about 3 days at the SEM; the specimen was partially unloaded at the end of each day
to minimize creep-related processes. ........................................................................................... 8 Figure 9. A98-2-TENSILE, 69 dpa, specimen appearance at different stages of the test. Strain
values are given in the “global strain” terms (defined from the tensile curve). Note that
the images are 70-tilted; also, low-magnification SEM images may show some
distortion. ................................................................................................................................... 9 Figure 10. A98-2-TENSILE, 69 dpa, neck at step 14 (the last step). Arrows point to a few
microfracture events at the surface. A few additional fracture-related features need larger magnification (see section 4). .................................................................................................... 10
Figure 11. A98-2-TENSILE, 69 dpa, specimen surface morphology at different stages. The same
area is shown at different strain levels. ...................................................................................... 11 Figure 12. Raw tensile curves in “Engineering stress [MPa] – Displacement [mm]”coordinates,
recorded during in situ mechanical tests with reference and irradiated specimens. The
curves are shifted along the X-axis to aid the reader. Since the tests were interrupted before fracture, full elongation (and uniform elongation for the reference specimen)
cannot be determined. ............................................................................................................... 12 Figure 13. Tensile curves in “Engineering stress [MPa] – Plastic strain [relative units]”
coordinates. .............................................................................................................................. 12 Figure 14. Microstructure evolution at small strain levels, 69 dpa specimen (A98-2-TENSILE).
Strain level is given in local strain terms (i.e., engineering strain definition). IPF map is
colored in the tensile direction (horizontal). Wide black arrows mark localized color changes in the IPF map, showing the misorientations introduced by the dislocation
channel at step 5; white arrows point to local “hot spots” in the KAM map. Local strain
concept is discussed in [12]. ...................................................................................................... 14 Figure 15. Microstructure evolution at moderate strain levels, 69 dpa specimen (A98-2-
TENSILE). Dashed oval marks a massive twinning event in the bottom right map. ................... 15

vi
Figure 16. Microstructure evolution at moderate strain levels, 95 dpa specimen. One can see pronounced changes in the grain color resulting from lattice rotation phenomena. ..................... 16
Figure 17. GRODmax(): Maximum GROD value observed within an ROI as a function of the
local strain. The solid lines show data trends for the tested specimens to aid the reader.
95-dpa specimen data are still being analyzed............................................................................ 16 Figure 18. KAM(): Average KAM as the function of the local strain for the reference (Ref) and
high-dose specimens. EBSD step size 0.5 µm for all included scans. Note local strain
levels were determined for each selected and tracked ROI, as described in [12]; because of fast necking, the irradiated and deformed specimen will have areas with different local
strains. R1-R3: regions of interest. For each specimen, several ROs were selected,
mapped, and tracked. However, some ROIs showed no plastic strain, some were designated for HR-EBSD scanning, such data were omitted. Data processing is not fully
completed, so the plot will include more data later. ................................................................... 17 Figure 19. Microfracture events associated with nonmetallic inclusions. Discontinuity size was
~8–12 µm. 69 dpa specimen (A98-2-TENSILE). ....................................................................... 18 Figure 20. Evolution of localized deformation spot. Weak local depression appeared at some
point (step 7 or 8), became pronounced at step 10, and formed a local crack (~6–10 µm in
length) at step 11. No nonmetallic inclusion or ferrite grain or preexisting discontinuity was observed at this given location............................................................................................ 18
Figure 21. Local microfracture event associated with a ferrite grain. Ferrite, being stronger after
irradiation, creates elevated local strains and stresses. Localized strain area (usually near or close to the grain boundary) forms a local depression, which, in turn, transforms into a
crack. The crack, being, as believed, a subcritical defect, grows via a ductile tearing
mechanism, creating high and very localized strains. ................................................................. 19 Figure 22. 3D representation of the reconstructed image with the discontinuities (voids and pores)
segmented. The color scale corresponds to the void volume in μm3. Deformed reference
specimen. .................................................................................................................................. 20 Figure 23. Distribution of the void size (a) and aspect ratios (b) for the nonirradiated tensile
sample. ..................................................................................................................................... 21 Figure 24. Void size distribution as a function of aspect ratios for the nonirradiated tensile
sample. ..................................................................................................................................... 21 Figure 25. The size (a) and aspect ratio (b) distributions of the voids as a function of location
along the tensile direction of the nonirradiated sample. The colors of the bar charts do not
correspond to the colors in the pore coloring in Figure 22. ......................................................... 22 Figure 26. The 3D representation of the reconstructed image with the voids segmented. The color
scale corresponds to the void volume in μm3. ............................................................................ 23 Figure 27. 2D slice images of the irradiated sample a) arrow pointing to a possible surface crack
b) arrow pointing to a surface cavity. Here the tensile axis is out of the plane of the paper. ........ 23 Figure 28. The distribution of the void size (a) and aspect ratios (b) for the irradiated A96 tensile
sample. ..................................................................................................................................... 24 Figure 29. The distribution of the void size (a) and aspect ratios (b) for the irradiated A96 tensile
sample (red) in comparison to the non-irradiated reference sample (transparent green). ............. 24 Figure 30. The void size distribution as a function of aspect ratios for the irradiated A96 tensile
sample. ..................................................................................................................................... 25 Figure 31. The size (a) and aspect ratio (b) distributions of the voids as a function of location
along the tensile direction of the irradiated sample. The colors of the bar charts do not
correspond to the colors in the 3D images; however, the 3D images are color coded
where warmer colors correspond to larger voids and higher aspect ratios for a) and b), respectively. .............................................................................................................................. 25

vii
LIST OF TABLES
Table 1. Composition (wt. %) of the material of interest (304 H heat) ...................................................... 2 Table 2. List of manufactured and tested specimens (304L steel, 304-H heat) .......................................... 6

viii
ABBREVIATED TERMS
CEA French Alternative Energies and Atomic Energy Commission
dpa displacement per atom
EBSD electron backscatter diffraction
EDF Électricité de France S.A. EDM electrical discharge machine
EDS energy-dispersive x-ray spectroscopy
GB grain boundary GROD grain reference orientation deviation
HR-EBSD high resolution (or high angular resolution) electron backscatter diffraction
IASCC irradiation-assisted stress-corrosion cracking IPF inverse pole figure
IQ image quality
KAM kernel average misorientation
LAMDA Low Activation Materials Development and Analysis facility LWR light water reactor
LWRS Light Water Reactor Sustainability program
NPP nuclear power plant ORNL Oak Ridge National Laboratory
ROI region of interest
SEM scanning electron microscope/microscopy TEM transmission electron microscope/microscopy
XRT x-ray tomography
YS yield stress

(This page intentionally left blank)

x
EXECUTIVE SUMMARY
This report describes new experimental results on deformation localization phenomena in austenitic steels
irradiated to high-damage doses. Advanced in situ tests were performed with specimens irradiated up to
95 dpa at Oak Ridge National Laboratory’s Low Activation Materials Development and Analysis
facility. The tensile tests inside a scanning electron microscope (SEM) allowed for electron backscatter
diffraction (EBSD) analysis and studying cracking and fracture initiation processes. Experiments also
employed high-resolution EBSD to record and analyze Kikuchi patterns.
Section 1 briefly analyzes the issues associated with high-dose irradiation and their potential impact on
the light water reactor (LWR) performance. The section demonstrates the importance of exploring the
high-dose area and limited literature covering this topic. Section 2 describes the experimental tools and
methods used to conduct the work: the SEM/EBSD coupled with the miniature tensile frame, electric
discharge machine to manufacture ultra-small specimens, and x-ray tomography (XRT) to visualize the
3D specimen interior. Section 3 provides details of the in situ mechanical tests with high-dose specimens
and discusses the key outcomes, including microstructure maps with strain localization features,
misorientation evolution with strain increase, and observed deformation mechanisms. Section 4 discusses
the fracture processes including the appearance and development of strain-induced microcracks, pores,
and other defects.
Section 5 summarizes the work performed. The results of the present work suggest a substantial
contribution of retained ferrite into the local fracture events. An attempt was made to analyze the
defects/discontinuities in the material volume via XRT. The results are beneficial for understanding
deformation mechanisms in materials irradiated to high-damage doses, after long-term in-service life, as
well as for exploring strain localization phenomena and crack and fracture initiation processes.

(This page intentionally left blank)

1
1. HIGH-DAMAGE DOSES (50+ DPA) AS WEAKLY EXPLORED AREA
The continuous service of currently deployed nuclear power plants (NPPs), as well as the expected
lifetime extension procedures, leads to reaching the high-damage doses and accumulating high helium
values for the in-core materials. Many NPP components are close to achieving or exceeding 100 dpa,
which is “weakly explored territory” concerning the understanding of the radiation-induced processes.
One may expect new degradation mechanisms or more severe or detrimental appearance of the existing
phenomena. For instance, it is a general concern that does material become more susceptible to irradiation-assisted stress-corrosion cracking (IASCC) as damage dose increases? A significant body of
experimental data supports this statement for low- and moderate-dose areas (i.e., <20–25 dpa). However,
the effects of larger damage doses (i.e., 50+ dpa) are being explored by multiple research teams but are still not fully understood. An important set of results was presented and discussed in [1] (Figure 1). The
authors investigated crack initiation as a function of damage dose. Data on the O-ring specimens for 45–
80 dpa dose range did not reveal a difference in failure time as a function of dose. In other words, the
stress threshold of the 40–50 dpa specimens was not different from the apparent stress threshold of the 80 dpa specimens [1]. It was suggested that apparent threshold stress for IASCC might be set to 40% of the
irradiated yield stress. Nevertheless, the available datasets (Figure 1) may be interpreted as a steady
decrease in the threshold stress. The authors underline the necessity for further research on whether the stress threshold saturates above a dose of ~30 dpa or whether a further decrease in stress threshold may
occur.
Figure 1. Damage dose as a function of applied stress. Closed symbols represent failures; open symbols
represent survived specimens. The figure was adopted from [1].
This possibility—further decrease in the stress threshold—raises concerns for the lifetime extension of light water reactors (LWRs) when doses near 100 dpa may be reached and exceeded. The connection
between strain localization and IASCC [2,3], in turn, raises questions regarding acting deformation
mechanisms in high-dose specimens and their propensity to strain localization.
It is well known that dislocation pileups at the slip line–grain boundary (GB) interaction point generate
elevated local stresses [4–8]. The presence of areas with high local stresses influences material

2
performance, including fatigue and cracking. In the irradiated steel, dislocation channel formation and the appearance of dislocation pileups [8] may directly preclude stress corrosion crack initiation [4,5,9]. New
or extended forms of localized deformation may appear and need to be quantified.
The present work attempts to explore deformation mechanisms and quantify strain localization processes in situ (i.e., during straining) in specimens irradiated to high-damage doses of >50 dpa. As believed, this
approach provides unique data on strain localization processes before and after irradiation. This
knowledge is important for a mechanistic understanding of localization phenomena and predictive model development.
2. MATERIALS AND EXPERIMENTAL METHODS
2.1 SEM/EBSD SYSTEM AND MINIATURE TENSILE FRAME FOR IN SITU TESTING
A TESCAN MIRA3 scanning electron microscope (SEM) was purchased and installed in FY2018. The
SEM is equipped with a high-speed Oxford Symmetry electron backscatter diffraction (EBSD) system
with a detector resolution of 1244×1024 pixels (full-frame, no binning). The EBSD indexing rate reaches ~200 Hz in full-frame mode and ~3.5 kHz in 8×8 binning mode; typical scanning rates, at the specimen of
appropriate quality, are ~200–1000 Hz (points per second), which is ~4–10 times faster than the detector
used in earlier work discussed in [10]. The SEM has a slightly larger chamber than the VERSA 3D SEM, used previously [11], allowing for much easier installation and operation of the Kammrath & Weiss in
situ tensile frame [11,12].
2.2 TESTED MATERIAL
A set of tensile and compact tension specimens of multiple materials, as well as transmission electron
microscope (TEM) discs, were irradiated in the Russian BOR-60 fast reactor in the framework of BORIS
(BOR-60 Internal Study) irradiation experiments [13,14] between 2000 and 2010. Typical doses were 5–
20 dpa, but several capsules reached or exceeded 50 dpa. Low- and moderate-dose specimens (i.e., ~47 dpa and below) were involved in the Cooperative IASCC Research program [13] and multiple Light
Water Reactor Sustainability (LWRS) program tasks. In 2016, a set of high-dose tensile specimens (50+
dpa) became available for the LWRS program. The specimens were delivered to Oak Ridge National Laboratory (ORNL), processed at hot cell facility and ORNL’s Low Activation Materials Development
and Analysis (LAMDA) facility, and used for research tasks at the University of Michigan (UM) and
ORNL. Portions of the tensile bars were sliced, providing extra material for additional activities,
including in situ tensile testing.
For the present work, 304L steel (designated as 304 H heat in [13]) was selected. This material was
annealed before irradiation, eliminating preexisting lattice gradients. This heat also had some amount of
retained ferrite after the final thermo-treatment. Table 1 shows the element composition of the selected steel.
Table 1. Composition (wt. %) of the material of interest (304 H heat)
ID Cr Ni Mn Si Cu C S P Mo Co N
(ppm)
B (ppm)
304-1H
18.61 9.88 1.79 0.36 0.25 0.022 0.0007 0.032 – 0.064 610 9
3
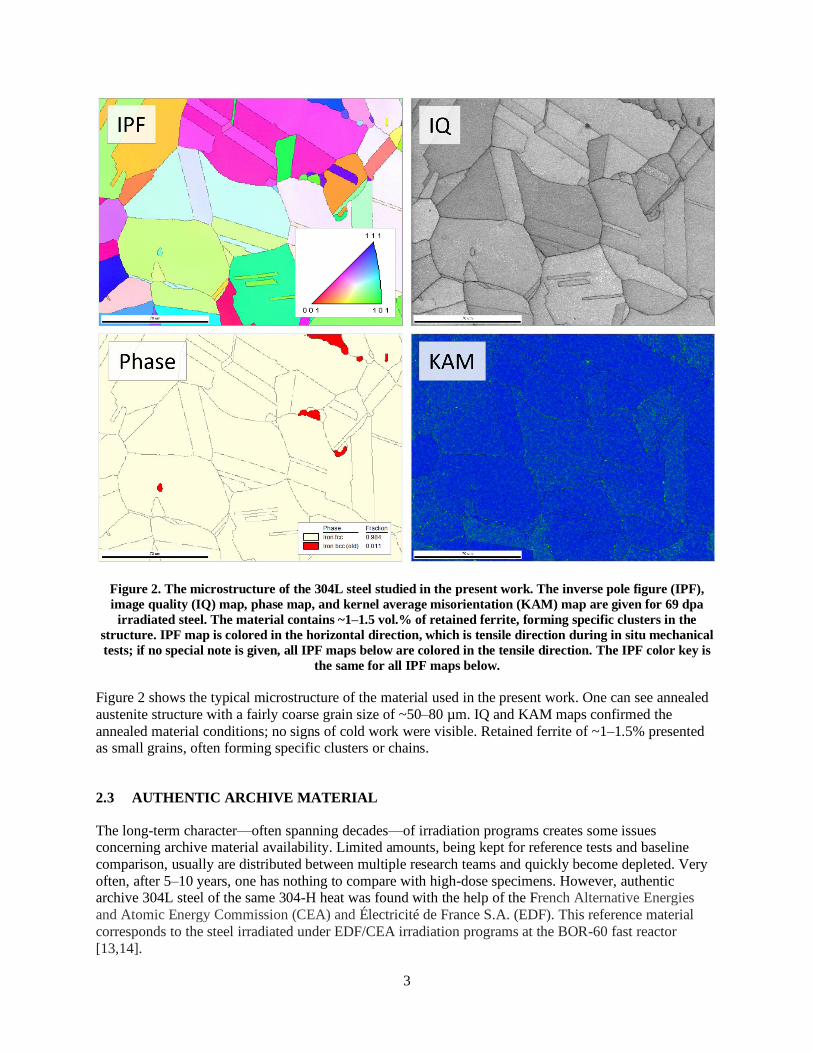
Figure 2. The microstructure of the 304L steel studied in the present work. The inverse pole figure (IPF),
image quality (IQ) map, phase map, and kernel average misorientation (KAM) map are given for 69 dpa
irradiated steel. The material contains ~1–1.5 vol.% of retained ferrite, forming specific clusters in the
structure. IPF map is colored in the horizontal direction, which is tensile direction during in situ mechanical
tests; if no special note is given, all IPF maps below are colored in the tensile direction. The IPF color key is
the same for all IPF maps below.
Figure 2 shows the typical microstructure of the material used in the present work. One can see annealed
austenite structure with a fairly coarse grain size of ~50–80 µm. IQ and KAM maps confirmed the
annealed material conditions; no signs of cold work were visible. Retained ferrite of ~1–1.5% presented as small grains, often forming specific clusters or chains.
2.3 AUTHENTIC ARCHIVE MATERIAL
The long-term character—often spanning decades—of irradiation programs creates some issues concerning archive material availability. Limited amounts, being kept for reference tests and baseline
comparison, usually are distributed between multiple research teams and quickly become depleted. Very
often, after 5–10 years, one has nothing to compare with high-dose specimens. However, authentic archive 304L steel of the same 304-H heat was found with the help of the French Alternative Energies
and Atomic Energy Commission (CEA) and Électricité de France S.A. (EDF). This reference material
corresponds to the steel irradiated under EDF/CEA irradiation programs at the BOR-60 fast reactor
[13,14].

4
2.4 SPECIMEN GEOMETRY
The available materials had a geometry of thin flat plates with dimensions of 5.5×3.5×1 mm. Severe
limitations on the tensile specimen geometry selection affected the present work. The geometries
designed and employed earlier [12] could not be used (i.e., minimal length of source plate 7–7.5 mm).
After several trials, ultra-small geometry (SS-Teeny, Figure 3) with a gauge length of 1.5 mm and a width of 0.6 mm was designed. These dimensions provided a length-to-width ratio of 2.5; as believed, it was
enough to avoid the impact of the specimen shoulders and limited gauge length on the necking processes.
The geometry also meets the common requirement of at least 5 grains across the smallest dimension for typical austenitic steels with a grain size of 60–80 µm.
The parent plate thickness (1 mm) provided enough space (~400 µm) to prepare the surface. Total specimen length (5 mm) allowed the researchers to use the Minimet polisher for mechanical grinding and
polishing (down to ~1 µm diamond sandpaper), making preparation faster and more reliable. (Note the
Minimet is challenging to use if specimen length exceeds ~11–12 mm.)
Figure 3. (a) Drawings of the ultra-miniature SS-Teeny specimen (dimensions are in millimeters); (b)
specimen appearance and size. A pen is used for scale.
Manufacturing of the SS-Teeny specimen consumes ~2.5×~5.5 mm space (~14 mm2), including extra
margins for electric discharge machine (EDM) cutting, compared to ~4×7.5 mm (~30 mm2) space for
geometry used by the researchers in earlier work [12]. This may be important for specific applications
such as targeted specimen manufacturing from weldments. Within the current project, the SS-Teeny specimens had activity levels ~3–4 mR/h@1 ft or less, which was beneficial from a radiological point of
view.
To perform in situ mechanical tests, new grips (Figure 4) were designed for the SEM tensile stage. The
grips—technically, insertions in the master K&W grips—are made of aged 718-alloy. They have
sufficient carrying capacity to test materials (SS-Teeny specimen geometry) with yield strength (YS) up
to ~1200 MPa. (Irradiated austenitic steels reach YS of ~900–1000 MPa at high doses.) To keep the specimen in place, two specific thin holders were employed; they also provided additional safety,
preventing the specimen from dropping off when the failure occurred.
5
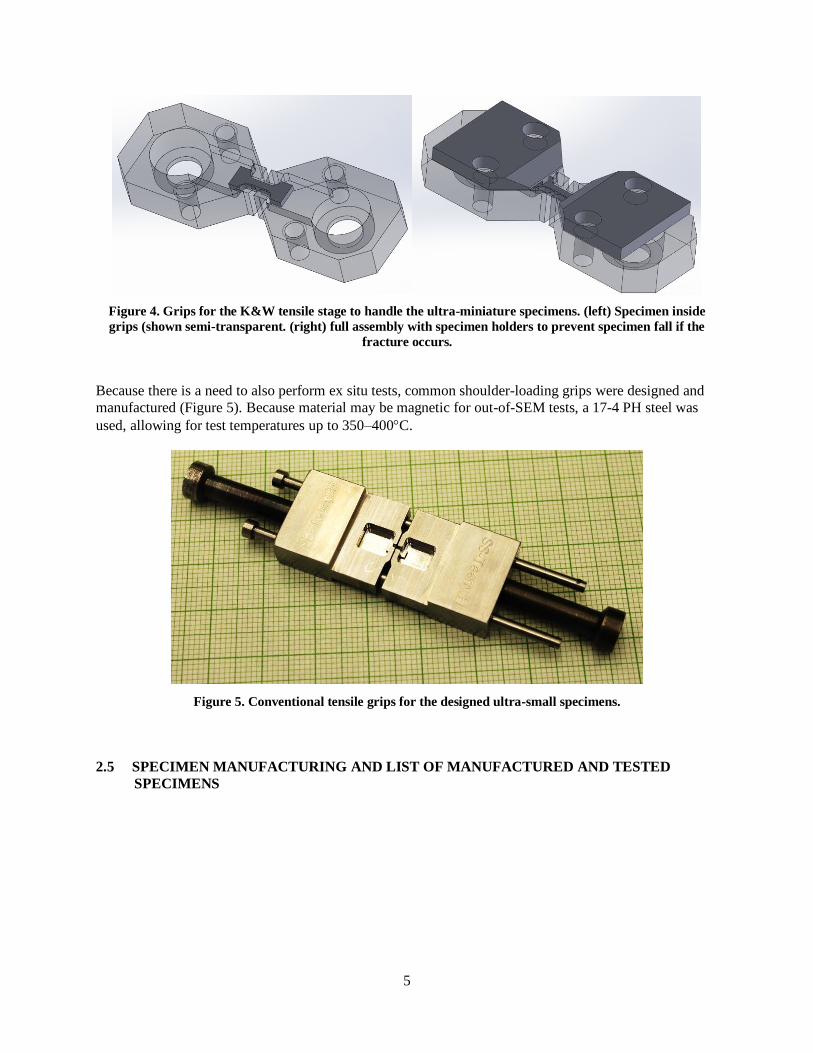
Figure 4. Grips for the K&W tensile stage to handle the ultra-miniature specimens. (left) Specimen inside
grips (shown semi-transparent. (right) full assembly with specimen holders to prevent specimen fall if the
fracture occurs.
Because there is a need to also perform ex situ tests, common shoulder-loading grips were designed and
manufactured (Figure 5). Because material may be magnetic for out-of-SEM tests, a 17-4 PH steel was
used, allowing for test temperatures up to 350–400C.
Figure 5. Conventional tensile grips for the designed ultra-small specimens.
2.5 SPECIMEN MANUFACTURING AND LIST OF MANUFACTURED AND TESTED
SPECIMENS

6
Figure 6. EDM system installed in LAMDA to manufacture specimens from radioactive material.
Miniature tensile specimens were manufactured using the EDM system (Figure 6), installed in the
LAMDA hot area. It allows for handling, processing, and cutting the irradiated materials involved in this
and other projects. The AgieCharmilles CUT 200 Sp commercial system was purchased approximately 2 years ago and has allowed for multiple wire diameters, providing an accuracy level up to 3–5 µm.
Cutting is performed on specimens fully submerged in water, which excludes any possibility of
overheating. Travel distances in the X-, Y- and Z-directions are 350, 250, and 250 mm, respectively. Taking into account the dimensions of irradiated source material (typically 10–15 mm or smaller), the
system provides sufficient volume to locate the source material, holders, and additional radiological
shielding, if necessary. There was a concern that accuracy may decrease during cutting for small objects,
comparable to the wire thickness (i.e., accuracy decreased for the wire in few first cuts). Multiple trial runs were performed to determine the best way to hold the object being cut. One solution may be to use a
much large dummy plate (i.e., master holder) of sufficient thickness.
Table 2 shows the list of specimens manufactured and used in the present work.
Table 2. List of manufactured and tested specimens (304L steel, 304-H heat)
# Specimen ID Dose (dpa) In situ experiment
1 A01-TENSILE-REF 0 Successful
2 A84-2-1-Tensile-LWRS 5.4 Partly successful (hardware failure)
3 A98-2-Tensile-LWRS 69 Successful
4 A96-2-Tensile-LWRS 95 Successful

7
2.6 SPECIMEN PREPARATION
Figure 7. A98-2-TENSILE, 69 dpa. Typical appearance of the specimen surface after electropolishing. One
can see a clean metallic surface with a few scattered nonmetallic inclusions of metallurgical origin. Note the
image is 70° tilted with tilt correction applied.
Electropolishing was selected as the final preparation step (standard Struer A2 solution, 30 V DC, duration from 5 to ~12 sec, depending on specimen). Compared to the colloidal silica polishing, this
process avoids any mechanical contact with the surface being prepared and provides a clean metallic
surface free of strain (Figure 7). EDM leads to a specific radiological risk: the EDM-cut objects often contain a thin remelted layer along the cut edge. Being brittle, this layer may readily crack and fracture
during the test, producing small debris particles able to contaminate the SEM. Electropolishing of proper
duration may remove the EDM layer (at least partly).
From the SEM/ESBD point of view, EBSD pattern quality is better with the electropolished surface,
compared to colloidal silica polishing. Electropolishing, however, requires careful solution selection, and
the resulting surface is slightly wavy compared to the colloidal silica polishing.
2.7 COMPUTED X-RAY TOMOGRAPHY ANALYSIS
SEM analysis is limited by the specimen surface only. Taking into account the importance and value of the studied materials (steel irradiated to high dose), getting additional data is always beneficial. Thus, x-
ray tomography (XRT) analysis was performed to investigate the specimen interior.
The deformed tensile samples were scanned using the Zeiss Xradia Versa 520 computed XRT instrument. A 160 kV x-ray energy was used at 10 W to produce high penetration into the sample and allowing for
maximum steel specimen thickness of ~2 mm. A 4× scintillator objective coupled with geometric
magnification was used to achieve a 0.36 μm voxel size with 1×1 binning on the charge-coupled device camera. The sample was scanned along the tensile length at four different locations. The images were
stitched together to achieve a large field of view in combination with high feature resolution.

8
Postprocessing and data analyses were performed using Dragonfly PRO v.3.5 software. A nonlocal means smoothing filter was applied to reduce noise while preserving the size and shape of the voids.
3. DEFORMATION LOCALIZATION PROCESSES IN HIGH-DOSE SPECIMENS
3.1 STAGES OF TYPICAL IN SITU SEM/EBSD TEST
During in situ tests, the tensile specimens are usually deformed in the step-by-step mode; the number of
steps may be as high as 10–15 or more. Several regions of interest (ROI) are selected and tracked through
the test. Each ROI may serve one or a few purposes. First, ROI may be designated for high-resolution EBSD (HR-EBSD) scans, with all Kikuchi patterns recorded and stored; HR-EBSD allows for evaluation
of geometrically necessary dislocation density and elastic strains and stresses within material [2,3,15,16].
HR-EBSD uses low scanning rates of 1–5 Hz to get high-quality patterns, so this approach is of limited use (usually only one ROI) because of time limitations. Additionally, HR-EBSD is very sensitive to
surface quality, so during in situ tests, it is usually limited to the elastic stress area (i.e., microplasticity)
and small plastic strains of a few percentages.
Second, conventional EBSD scans may be performed at each step, yielding information on plastic
deformation mechanisms, strain-induced phenomena, and localization processes. Conventional EBSD
provides limited outcome for elastic strain area and usually is used only to study plastic strains. Because plastic deformation generates surface roughness and reduces pattern quality, EBSD measurements are
limited by strain level. However, this value may vary; the typical limit is ~15–20% due to a high and fast-
growing fraction of lost (i.e., nonindexed) points.
Figure 8. Scheme of a typical in situ test. S01-S14: steps of the in situ test, showing the category (or categories)
of the data obtained. Specimen ID: A98-2-TENSILE, 69 dpa. The test took about 3 days at the SEM; the
specimen was partially unloaded at the end of each day to minimize creep-related processes.
Third, SEM imaging (sometimes coupled with energy-dispersive x-ray spectroscopy [EDS] scans) may be
employed for ROIs with different surface features such as nonmetallic inclusions, second-phase

9
grains/domains, or preexisting cracks. SEM imaging is usually available during all the experiments;
however, some areas may become invisible due to the high tilt angle (70 is best for EBSD analysis).
Additionally, as new features (e.g., fresh cracks) appear during the test, they may be tracked and analyzed using SEM, EBSD, and EDS.
In the present work, by analogy with previous work [12], the specimens were deformed in several stages (Figure 8). First, the elastic strain area was explored, making stress increments of ~150–200 MPa.
HR-EBSD scans were performed to study elastic in-grain stresses and strains. Once a specimen entered
the plastic area, the displacement control stage was initiated with strain increments of ~1–3%. Conventional EBSD scans were performed in the plastic strain area up to strain level ~0.15–0.2 (~15–
20%). After that, the pure-SEM stage occurred to track interesting features and phenomena.
Figure 9. A98-2-TENSILE, 69 dpa, specimen appearance at different stages of the test. Strain values are
given in the “global strain” terms (defined from the tensile curve). Note that the images are 70-tilted; also,
low-magnification SEM images may show some distortion.
Figure 9 shows the specimen appearance during the in situ test, step numbers correspond to Figure 8, and
strain/stress are “global” values calculated from the tensile curve. In the elastic area and the YS vicinity (around step 5), the specimen surface is smooth and clean and free of damage. Few inclusions (of
metallurgical origin) are visible at the gauge; being detrimental from the material performance point of
view, the inclusions play a role of visual marks at the surface, making SEM observation and navigation
10
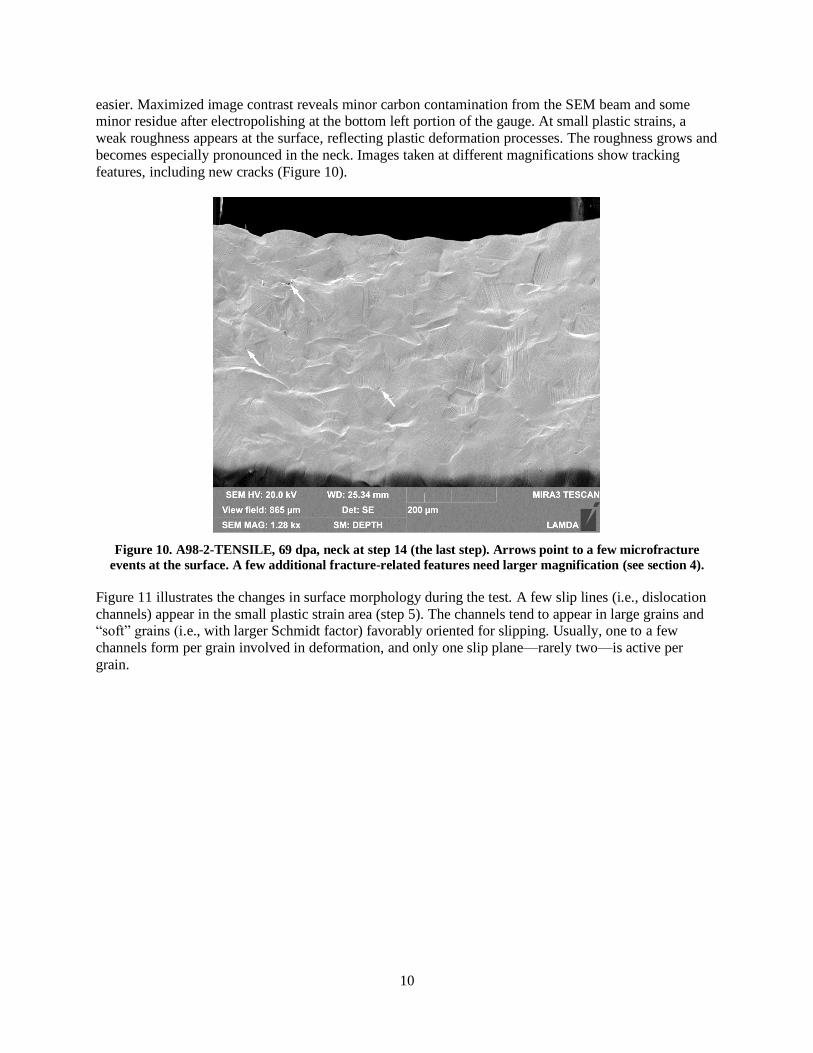
easier. Maximized image contrast reveals minor carbon contamination from the SEM beam and some minor residue after electropolishing at the bottom left portion of the gauge. At small plastic strains, a
weak roughness appears at the surface, reflecting plastic deformation processes. The roughness grows and
becomes especially pronounced in the neck. Images taken at different magnifications show tracking
features, including new cracks (Figure 10).
Figure 10. A98-2-TENSILE, 69 dpa, neck at step 14 (the last step). Arrows point to a few microfracture
events at the surface. A few additional fracture-related features need larger magnification (see section 4).
Figure 11 illustrates the changes in surface morphology during the test. A few slip lines (i.e., dislocation
channels) appear in the small plastic strain area (step 5). The channels tend to appear in large grains and “soft” grains (i.e., with larger Schmidt factor) favorably oriented for slipping. Usually, one to a few
channels form per grain involved in deformation, and only one slip plane—rarely two—is active per
grain.

11
Figure 11. A98-2-TENSILE, 69 dpa, specimen surface morphology at different stages. The same area is
shown at different strain levels.
As plastic strain increases (step 6), dislocation channel density grows, and multiple slip planes become active. Pronounced surface morphology develops, and the roughness degree increases with the strain
(compare images for step 6 and step 9 in Figure 11).
Similar results were observed for all irradiated specimens, regardless of the damage dose. Qualitatively, no specific features in the dislocation channel or surface morphology appear in the specimens irradiated
to high-damage doses; however, more careful quantitative analysis is necessary.
3.2 MECHANICAL BEHAVIOR OF THE INVESTIGATED SPECIMENS
Figure 12 demonstrates tensile curves obtained during in situ tests with high-dose specimens in
comparison with the curve for the reference specimen tested at the same conditions. The displacement rate during the tests was 1.6 µm/s providing a nominal strain rate of 0.001 s-1. Force drops at the curves
correspond to the test interruptions to perform specimen survey and EBSD or HR-EBSD scans.

12
Figure 12. Raw tensile curves in “Engineering stress [MPa] – Displacement [mm]” coordinates, recorded
during in situ mechanical tests with reference and irradiated specimens. The curves are shifted along the X-
axis to aid the reader. Since the tests were interrupted before fracture, full elongation (and uniform
elongation for the reference specimen) cannot be determined.
Figure 13 shows the same curves in coordinates “Engineering stress – Engineering strain” with
compliance and elastic strains removed.
Figure 13. Tensile curves in “Engineering stress [MPa] – Plastic strain [relative units]” coordinates.
One may see that the non-irradiated reference specimen showed relatively low strength level and
pronounced deformation hardening. Irradiation led to a strong increase in the strength level; deformation behavior also changed significantly. As a rule, weak force drop appeared immediately after yield stress,
and the tensile curve became flat, resembling yield plateau, after the yield stress. The 5.4-dpa specimen

13
revealed some tendency to the deformation hardening, and visually, judging on the surface morphology, most of the gauge was involved in straining. This dose (5.4 dpa) is not sufficient to fully suppress the
uniform deformation. Unfortunately, the experiment was interrupted earlier than planned because of an
emerging hardware issue.
69- and 95-dpa specimens showed a steady decrease in the acting force after yield stress; the neck
appeared and became apparent at the specimen surface. No uniform elongation was observed for these
specimens.
The in situ tests were stopped at the global strain levels of ~0.15 (~15%) for the irradiated specimens
because strain-induced roughness (strain-induced dislocation channels and lattice rotation) led to a strong degradation of the EBSD patterns, compromising data set integrity and making it difficult to track
selected locations, features, or objects of interest. Multiple nonindexed areas appear as a result of the
shadowing of the detector. The reference specimen showed acceptable EBSD results and was deformed
up to ~0.5 (~50%) plastic strain.
3.3 MICROSTRUCTURE EVOLUTION IN THE HIGH-DOSE SPECIMENS
This section briefly describes and illustrates results and the most interesting observations for the tested high-dose specimens. The description is intentionally qualitative; data analysis is in progress.
Figure 14 shows microstructure evolution for 69 dpa specimens in the plastic small strain area (i.e., a few percentages). Having smaller spatial resolution than the TEM, the EBSD allows for surveying much
larger areas (i.e., tens and hundreds of grains). Since pre-straining data are available, EBSD may clearly
show strain-induced features and changes.
In Figure 14, the reference maps (step 0) show features typical for annealed austenite structure: large
equi-axial grains with multiple annealing twins. The grain reference orientation deviation (GROD) map
demonstrates very limited in-grain misorientation gradients (on the order or ~1.5–2, shown in green).
The KAM map (standard scale: 0–5) reveals uniform blue or close-to-blue color, suggesting the absence
of localized dislocation features.

14
Figure 14. Microstructure evolution at small strain levels, 69 dpa specimen (A98-2-TENSILE). Strain level is
given in local strain terms (i.e., engineering strain definition). IPF map is colored in the tensile direction
(horizontal). Wide black arrows mark localized color changes in the IPF map, showing the misorientations
introduced by the dislocation channel at step 5; white arrows point to local “hot spots” in the KAM map. The
local strain concept is discussed in [12].
Small plastic strain at step 5 (below 1%) increases in-grain misorientation gradients in the GROD map
and generates multiple spot features in the KAM map. These are associated with dislocation channel formation and development of dislocation pileups near GB–channel interaction points. Such localized
dislocation arrays or “hot spots” at small strains are typical for neutron-irradiated and deformed steel [12].
Detailed analysis/quantification is in progress.
Figure 15 and Figure 16 show microstructure evolution and deformation mechanisms at moderate strain
levels in ~69 and ~95 dpa specimens. Lattice rotation (also often called grain rotation) is easy to see in the
IPF maps as a change of the grain color with strain increase. Thus, some austenite grains (G1, G2 in Figure 15) may keep their orientation with respect to the tensile axis sufficiently long enough, being stable with
respect to the lattice rotation processes. Other grains (e.g., G3 and G4 in Figure 15) rotate towards [001]
and [111] orientations.
Lattice rotation direction is different for austenite and ferrite. The ferrite cluster (marked as Fc, phase map
is not shown) rotates toward the [101] orientation; its color in the IPF map changes from close-to-blue to
green-like (Figure 15).

15
Figure 15. Microstructure evolution at moderate strain levels, 69 dpa specimen (A98-2-TENSILE). The
dashed oval marks a massive twinning event in the bottom right map.
Of particular interest is a massive twinning event, shown by a dashed oval in Figure 15, bottom right.
Well-developed twins of a few microns in width become apparent at step 8. One would expect usual
twinning characteristics such as multiple needle-like objects, which are closely associated with dislocation channels. However, twinning develops in the volume of the parent grain, consuming its
significant portion. (Compare the grain shape and dimensions at steps 8 and 10.) Such appearance of a
twinning process is unusual for irradiated material, especially considering limited strain levels (below or
comparable to 10%). For nonirradiated steel, twins have a lens-like or needle-like shape and usually do not consume the parent grain as a whole.
16
Figure 16. Microstructure evolution at moderate strain levels, 95 dpa specimen. One can see pronounced
changes in the grain color resulting from lattice rotation phenomena.
Lattice rotation (as also often called grain rotation) is easy to see in the IPF maps as a change of the grain color with strain increase. “Stable” austenite grains (G1, G2) may keep their orientation with respect to the
tensile axis sufficiently long enough (Figure 15 and Figure 16). Other grains (e.g., G3 and G4) rotate
toward the [001] and [111] orientations. Ferrite (bcc-phase) grains rotate toward the [101] orientation (see ferrite cluster marked as Fc, Figure 15).
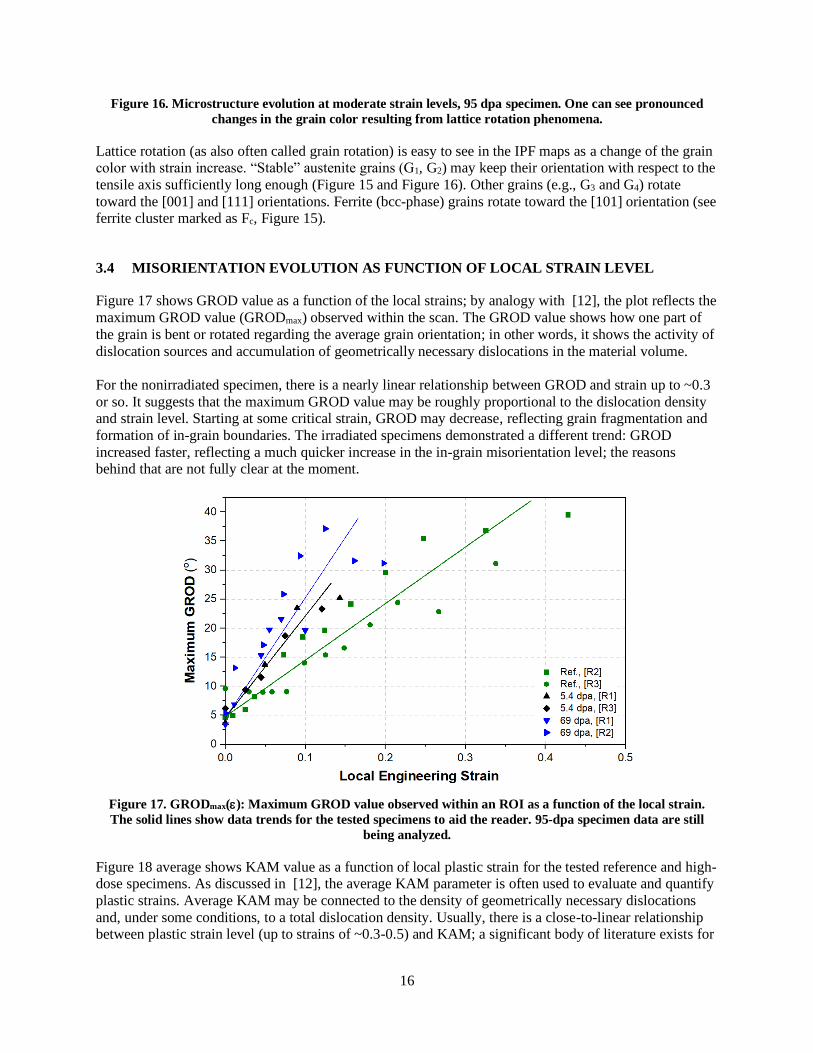
3.4 MISORIENTATION EVOLUTION AS FUNCTION OF LOCAL STRAIN LEVEL
Figure 17 shows GROD value as a function of the local strains; by analogy with [12], the plot reflects the
maximum GROD value (GRODmax) observed within the scan. The GROD value shows how one part of
the grain is bent or rotated regarding the average grain orientation; in other words, it shows the activity of
dislocation sources and accumulation of geometrically necessary dislocations in the material volume.
For the nonirradiated specimen, there is a nearly linear relationship between GROD and strain up to ~0.3
or so. It suggests that the maximum GROD value may be roughly proportional to the dislocation density and strain level. Starting at some critical strain, GROD may decrease, reflecting grain fragmentation and
formation of in-grain boundaries. The irradiated specimens demonstrated a different trend: GROD
increased faster, reflecting a much quicker increase in the in-grain misorientation level; the reasons behind that are not fully clear at the moment.
Figure 17. GRODmax(): Maximum GROD value observed within an ROI as a function of the local strain.
The solid lines show data trends for the tested specimens to aid the reader. 95-dpa specimen data are still
being analyzed.
Figure 18 average shows KAM value as a function of local plastic strain for the tested reference and high-dose specimens. As discussed in [12], the average KAM parameter is often used to evaluate and quantify
plastic strains. Average KAM may be connected to the density of geometrically necessary dislocations
and, under some conditions, to a total dislocation density. Usually, there is a close-to-linear relationship between plastic strain level (up to strains of ~0.3-0.5) and KAM; a significant body of literature exists for
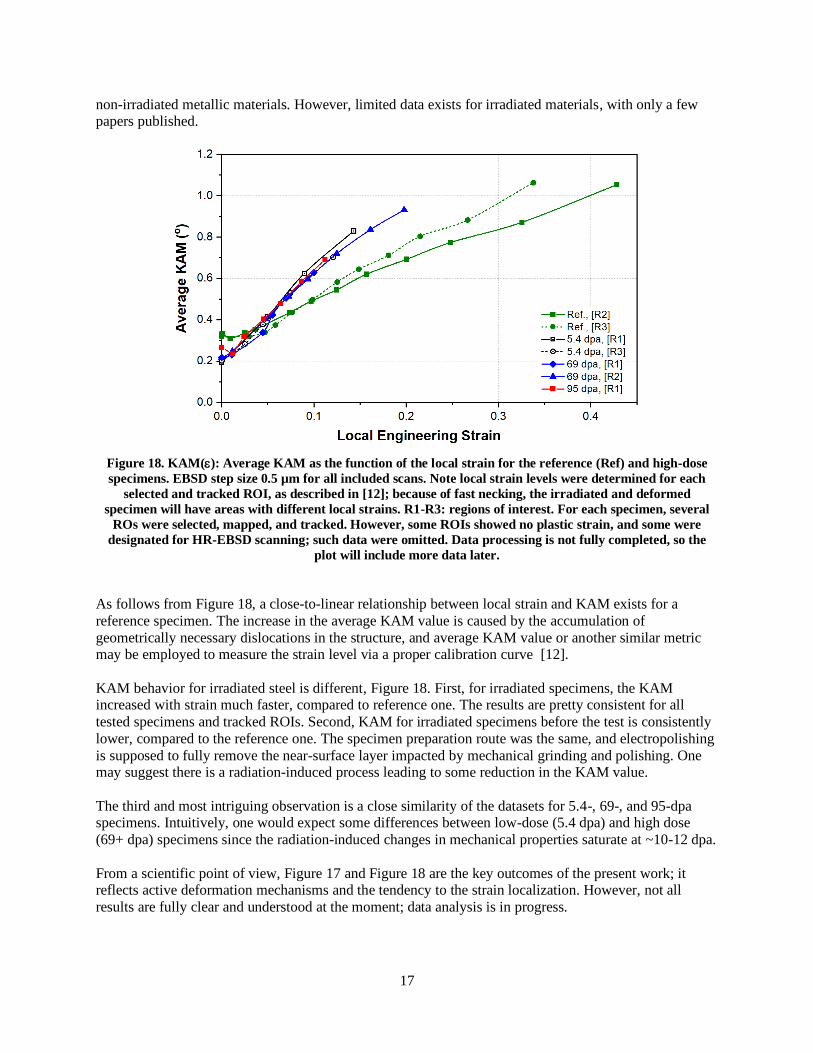
17
non-irradiated metallic materials. However, limited data exists for irradiated materials, with only a few papers published.
Figure 18. KAM(): Average KAM as the function of the local strain for the reference (Ref) and high-dose
specimens. EBSD step size 0.5 µm for all included scans. Note local strain levels were determined for each
selected and tracked ROI, as described in [12]; because of fast necking, the irradiated and deformed
specimen will have areas with different local strains. R1-R3: regions of interest. For each specimen, several
ROs were selected, mapped, and tracked. However, some ROIs showed no plastic strain, and some were
designated for HR-EBSD scanning; such data were omitted. Data processing is not fully completed, so the
plot will include more data later.
As follows from Figure 18, a close-to-linear relationship between local strain and KAM exists for a
reference specimen. The increase in the average KAM value is caused by the accumulation of
geometrically necessary dislocations in the structure, and average KAM value or another similar metric may be employed to measure the strain level via a proper calibration curve [12].
KAM behavior for irradiated steel is different, Figure 18. First, for irradiated specimens, the KAM increased with strain much faster, compared to reference one. The results are pretty consistent for all
tested specimens and tracked ROIs. Second, KAM for irradiated specimens before the test is consistently
lower, compared to the reference one. The specimen preparation route was the same, and electropolishing
is supposed to fully remove the near-surface layer impacted by mechanical grinding and polishing. One may suggest there is a radiation-induced process leading to some reduction in the KAM value.
The third and most intriguing observation is a close similarity of the datasets for 5.4-, 69-, and 95-dpa specimens. Intuitively, one would expect some differences between low-dose (5.4 dpa) and high dose
(69+ dpa) specimens since the radiation-induced changes in mechanical properties saturate at ~10-12 dpa.
From a scientific point of view, Figure 17 and Figure 18 are the key outcomes of the present work; it reflects active deformation mechanisms and the tendency to the strain localization. However, not all
results are fully clear and understood at the moment; data analysis is in progress.
18
4. MICROFRACTURE EVENTS DURING THE IN SITU TESTING
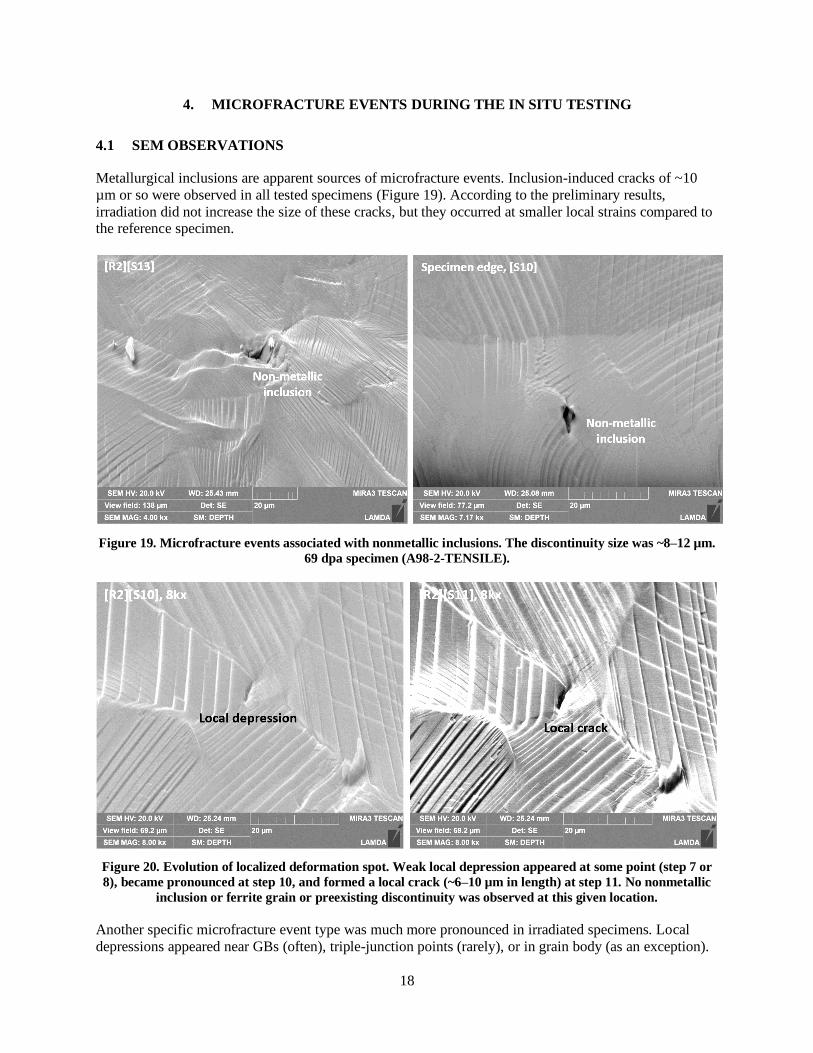
4.1 SEM OBSERVATIONS
Metallurgical inclusions are apparent sources of microfracture events. Inclusion-induced cracks of ~10
µm or so were observed in all tested specimens (Figure 19). According to the preliminary results,
irradiation did not increase the size of these cracks, but they occurred at smaller local strains compared to the reference specimen.
Figure 19. Microfracture events associated with nonmetallic inclusions. The discontinuity size was ~8–12 µm.
69 dpa specimen (A98-2-TENSILE).
Figure 20. Evolution of localized deformation spot. Weak local depression appeared at some point (step 7 or
8), became pronounced at step 10, and formed a local crack (~6–10 µm in length) at step 11. No nonmetallic
inclusion or ferrite grain or preexisting discontinuity was observed at this given location.
Another specific microfracture event type was much more pronounced in irradiated specimens. Local
depressions appeared near GBs (often), triple-junction points (rarely), or in grain body (as an exception).

19
Such depressions had a very high density of dislocation channels and tended to form localized cracks (Figure 20).
Many microcracks at the surface were associated with retained ferrite grains or colonies. Cracks
developed initially in the austenite grains, very close to ferrite ones, and grew via a ductile tearing mechanism (Figure 21). Ferrite-associated cracks were observed mostly in 69 and 95 dpa specimens; as
believed, this process is connected to the strong radiation hardening of the bcc-phases under irradiation.
Being stronger, ferrite generates additional strains in the surrounding material volume.
Figure 21. Local microfracture event associated with a ferrite grain. Ferrite, being stronger after irradiation,
creates elevated local strains and stresses. Localized strain area (usually near or close to the grain boundary)
forms a local depression, which, in turn, transforms into a crack. The crack, being, as believed, a subcritical
defect, grows via a ductile tearing mechanism, creating high and very localized strains.
4.2 COMPUTED X-RAY TOMOGRAPHY RESULTS
4.2.1 Reference (Nonirradiated) Specimen
A 3D reconstructed image of the tensile sample is presented in Figure 22 from two different view angles, showing the distribution of segmented voids in 3D. The voids are colored according to the volume they
occupy, as indicated on the legend.

20
Figure 22. 3D representation of the reconstructed image with the discontinuities (voids and pores)
segmented. The color scale corresponds to the void volume in μm3. Deformed reference specimen.
Overall, voids can be observed throughout the entire gauge section; however, larger voids are found to be concentrated within the center portion where necking has occurred. Furthermore, the voids can be seen to
be elongated along the tensile direction.
Next, quantification was performed to obtain void size and aspect ratio distributions. The results are presented in Figure 23a and b, respectively. To have a better representation of the void size, equivalent
diameters were calculated from the segmented volumes assuming spherical morphology (Figure 23a).
Both void nucleation and growth are captured with this approach wherein the smaller sizes correspond to newly nucleated voids, and larger sizes correspond to growth. Accordingly, most of the voids (number-
wise) can be stated as belonging to the newly nucleated group. The aspect ratio distributions, on the other
hand, are used to determine the void morphologies, where an aspect ratio of 1 corresponds to a perfect sphere. Following the qualitative observations, the majority of the voids are accumulated towards the
lower aspect ratios (<0.5), suggesting ellipsoidal (i.e., elongated) voids.
1 m
m 1 mm Neck

21
Figure 23. Distribution of the void size (a) and aspect ratios (b) for the nonirradiated tensile sample.
Furthermore, the relation between void size distribution and aspect ratios is presented in Figure 24. It
demonstrates that as the void size grows, the aspect ratio decreases. This shows void growth by
elongation (along the tensile direction in this case), leading to ellipsoidal voids.
Figure 24. Void size distribution as a function of aspect ratios for the nonirradiated tensile sample.
Finally, Figure 25a and b present the void size and aspect ratio distributions as a function of position along the tensile direction. The position along the tensile sample is arbitrary as the numbers refer to the
coordinates in the 3D space of the software; however, distances remain accurate.
Figure 25a illustrates that larger size voids tend to accumulate close to the center of the specimen where the neck has formed, which agrees with larger strains within this zone. On the other hand, the smallest
voids (2–6 μm) tend to accumulate away from the center. This agrees with the relatively lower strains in
these areas, where new voids may have started to nucleate. The aspect ratio distributions in Figure 25b
5 10 15 20 250
1
2
3
4
5
6
7
8
Rel
ativ
e F
req
uen
cy (
%)
Equivalent Diamater (mm)0.2 0.3 0.4 0.5 0.6 0.7 0.8
0
1
2
3
4
5
Rel
ativ
e F
req
uen
cy (
%)
Aspect Ratio
a) b)
0.225 0.325 0.425 0.525 0.625 0.7250
2
4
6
8
10
12
14
Cou
nt
(a.u
.)
Aspect Ratio
2 - 6
6 - 10
10 - 14
14 - 18
18 - 22
22 - 26
Void Size (mm)

22
show the lower aspect ratio (i.e., ellipsoidal) voids to be gathered closer to the center of the gauge. In agreement with the data presented in Figure 25a, Figure 25b signifies void growth via elongation in the
neck region. This concentration of large and elongated voids indicates that failure will occur in this region
with further growth and elongation as the sample is strained more.
Figure 25. The size (a) and aspect ratio (b) distributions of the voids as a function of location along
the tensile direction of the nonirradiated sample. The colors of the bar charts do not correspond to
the colors in the pore coloring in Figure 22.
4.2.2 Irradiated specimen (69 dpa)
A 3D reconstructed image of the deformed tensile sample is presented in Figure 26 from two different view angles, showing the distribution of segmented voids in 3D. The voids are colored according to the
volume they occupy, as indicated on the legend. Similar to the non-irradiated reference sample, the voids
can be observed throughout the entire gauge section. However, the largest voids do not necessarily coincide with the neck region. Furthermore, the voids are not elongated along the tensile direction, unlike
the reference sample.
-900 -500 -100 300 700 11000
2
4
6
8
10
12
Cou
nt
(a.u
.)
Position along the tensile direction (mm)
2 - 6
6 - 10
10 - 14
14 - 18
18 - 22
22 - 26
Void Size (mm)
-900 -500 -100 300 700 1100
-900 -500 -100 300 700 11000
2
4
6
8
10
Cou
nt
(a.u
.)Position along the tensile direction (mm)
0.02 - 0.18
0.18 - 0.34
0.34 - 0.5
0.5 - 0.66
0.66 - 0.82
0.82 - 0.98
Aspect Ratio
-900 -500 -100 300 700 1100
a) b)

23
Figure 26. The 3D representation of the reconstructed image with the voids segmented. The color scale
corresponds to the void volume in μm3.
2D slice images in Figure 27 shows two discontinuities connected to the surface: possible surface crack
(a) and a cavity-like feature (b). The feature, shown in Figure 27b, may correspond to the crack visible in Figure 21. Still, more detailed analysis and comparison with the SEM observations are necessary to
evaluate the origin of these objects.
Figure 27. 2D slice images of the irradiated sample a) arrow pointing to a possible surface crack b) arrow
pointing to a surface cavity. Here the tensile axis is out of the plane of the paper.
1 m
m1
mm
a) b)
1 mm

24
The void size and aspect ratio distributions are presented in Figure 28a and b, respectively. To have a
better representation of the void size, equivalent diameters were calculated from the segmented volumes
assuming spherical morphology, Figure 28a. The majority of the voids are found to be below ~5 μm
equivalent diameter. The aspect ratio distributions are used to determine the void morphologies, where an aspect ratio of 1 corresponds to a perfect sphere. The aspect ratio distribution (Figure 28b) is close to a
Gaussian distribution, with the majority of the voids grouped between 0.45 and 0.65.
Figure 28. The distribution of the void size (a) and aspect ratios (b) for the irradiated A96 tensile sample.
To compare the two sets of data, the quantitative results are presented together in Figure 29 where red
corresponds to the irradiated A96 sample and semi-transparent green to the non-irradiated reference
sample. Figure 29a shows that in the non-irradiated sample, larger voids are observed, whereas, in the
irradiated sample, smaller voids are present compared to the non-irradiated sample.
Figure 29. The distribution of the void size (a) and aspect ratios (b) for the irradiated A96 tensile sample (red)
in comparison to the non-irradiated reference sample (transparent green).
The comparison between the aspect ratios shown in Figure 29b. Two samples tend to segregate towards two different ends with lower aspect ratios occupied by the non-irradiated sample and the higher aspect
5 10 15 200
1
2
3
4
5
Rel
ativ
e F
requen
cy (
%)
Equivalent Diameter (mm)0.3 0.4 0.5 0.6 0.7 0.8
0.0
0.5
1.0
1.5
2.0
2.5
3.0
3.5
Rel
ativ
e F
requen
cy (
%)
Aspect Ratio
a) b)
0.2 0.3 0.4 0.5 0.6 0.7 0.80.0
0.5
1.0
1.5
2.0
2.5
3.0
3.5
4.0
4.5
5.0
Rel
ativ
e F
req
uen
cy (
%)
Aspect Ratio
5 10 15 20 250
1
2
3
4
5
6
7
8
Rel
ativ
e F
req
uen
cy (
%)
Equivalent Diamater (mm)
a) b)
25
ratios by the irradiated one. Overall, the comparisons in Figure 29 suggest that two different mechanisms of void formation between the irradiated and non-irradiated samples are present.
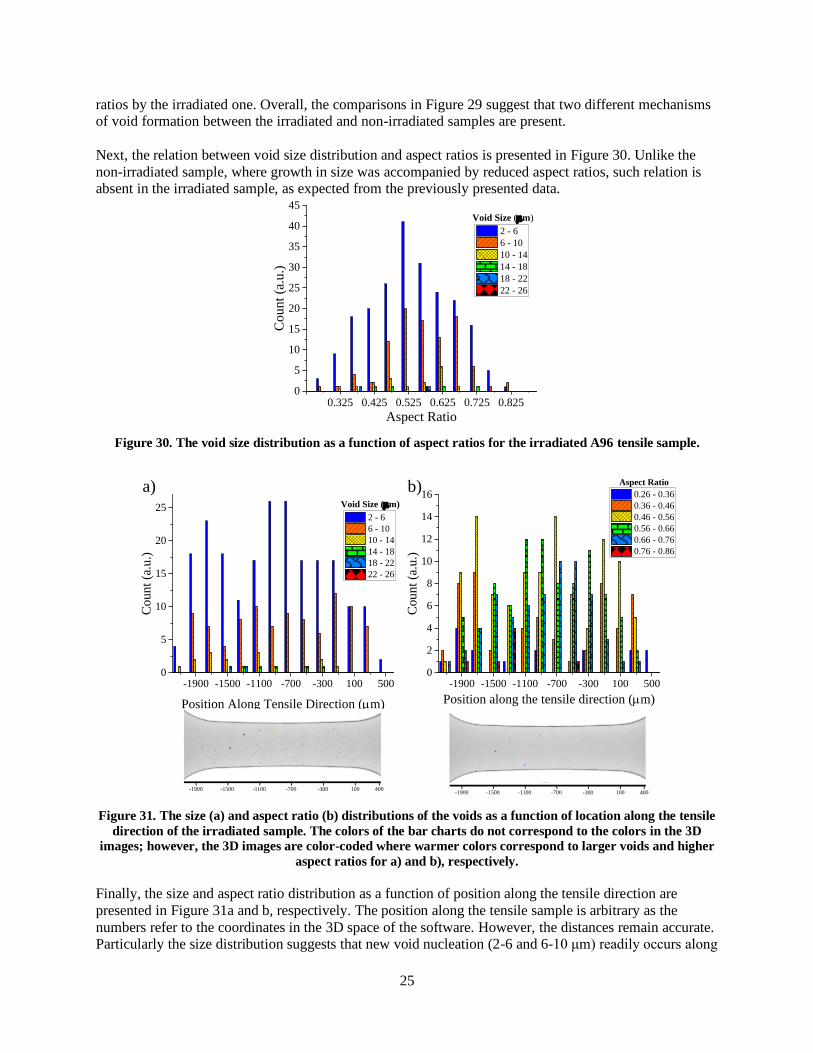
Next, the relation between void size distribution and aspect ratios is presented in Figure 30. Unlike the
non-irradiated sample, where growth in size was accompanied by reduced aspect ratios, such relation is absent in the irradiated sample, as expected from the previously presented data.
Figure 30. The void size distribution as a function of aspect ratios for the irradiated A96 tensile sample.
Figure 31. The size (a) and aspect ratio (b) distributions of the voids as a function of location along the tensile
direction of the irradiated sample. The colors of the bar charts do not correspond to the colors in the 3D
images; however, the 3D images are color-coded where warmer colors correspond to larger voids and higher
aspect ratios for a) and b), respectively.
Finally, the size and aspect ratio distribution as a function of position along the tensile direction are
presented in Figure 31a and b, respectively. The position along the tensile sample is arbitrary as the
numbers refer to the coordinates in the 3D space of the software. However, the distances remain accurate. Particularly the size distribution suggests that new void nucleation (2-6 and 6-10 μm) readily occurs along
0.325 0.425 0.525 0.625 0.725 0.8250
5
10
15
20
25
30
35
40
45
Co
un
t (a
.u.)
Aspect Ratio
2 - 6
6 - 10
10 - 14
14 - 18
18 - 22
22 - 26
Void Size (mm)
-1900 -1500 -1100 -700 -300 100 5000
5
10
15
20
25
Co
un
t (a
.u.)
Position Along Tensile Direction (mm)
2 - 6
6 - 10
10 - 14
14 - 18
18 - 22
22 - 26
Void Size (mm)
-1900 -1500 -1100 -700 -300 100 5000
2
4
6
8
10
12
14
16
Co
un
t (a
.u.)
Position along the tensile direction (mm)
0.26 - 0.36
0.36 - 0.46
0.46 - 0.56
0.56 - 0.66
0.66 - 0.76
0.76 - 0.86
Aspect Ratio
-1900 -1500 -1100 -700 -300 100 400-1900 -1500 -1100 -700 -300 100 400
a) b)

26
the entire gauge section without an obvious concentration. A clear trend in the aspect ratio distribution along the tensile direction appears to be absent (Figure 31b).
5. SUMMARY AND CONCLUSIONS
The report documents new experimental results on in situ mechanical tests performed, for the first time,
with high-dose (i.e., up to 95 dpa) specimens of austenitic 304L steel—common materials of in-core
components for LWRs. Authentic archive material was retrieved and included in the test program. The
work heavily relied on the experimental capabilities of the ORNL’s LAMDA facility, which provides a
full research chain, from irradiated specimen manufacturing and preparation to testing, post-test analysis,
long-term storage, and utilization, if necessary. A significant portion of this chain was created with the
LWRS program as one of the key contributors.
The high-dose specimen datasets described in the document cover mechanical behavior, necking,
microstructure evolution, appearance and development of in-grain misorientation gradients, acting
deformation mechanisms, and additional aspects. The datasets include several hundred SEM images,
more than 100 EBSD scans, a few terabytes of HR-EBSD scans, EDS data to analyze nonmetallic
inclusions and second phases, and digital tensile curves. The present work particularly focused on
analyzing microfracture events; the XRT approach was employed to check the dimensions and density of
the in-volume discontinuities.
Being descriptive and brief enough in its nature, this report discusses key results and achievements. As
believed, the present work results are beneficial for understanding deformation mechanisms in materials
irradiated to high-damage doses after long-term in-service life or for the case of reactor lifetime
extension.
6. ACKNOWLEDGMENTS
The research was supported by the US Department of Energy, Office of Nuclear Energy, for the LWRS
program research and development effort. The authors would like to thank the French Alternative Energies and Atomic Energy Commission and Électricité de France S.A., and to personally thank Dr. B.
Tanguy (CEA) for providing archive material. Additionally, the authors would like to thank Dr. A.
Nelson (ORNL) and Dr. X. Chen (ORNL) for reviewing the report and providing valuable comments and
suggestions, and L. Varma (ORNL) for help with document preparation.
REFERENCES
[1] R.W. Bosch, M. Vankeerberghen, R. Gérard, and F. Somville, “Crack initiation testing of thimble
tube material under PWR conditions to determine a stress threshold for IASCC,” Journal ofNuclear Materials, vol. 461, 2015, pp. 112–121.
[2] D.C. Johnson, B. Kuhr, D. Farkas, and G.S. Was, “Quantitative linkage between the stress at
dislocation channel – Grain boundary interaction sites and irradiation assisted stress corrosion crackinitiation,” Acta Materialia, vol. 170, 2019, pp. 166–175.
[3] D. Johnson, B. Kuhr, D. Farkas, and G. Was, “Quantitative analysis of localized stresses in
irradiated stainless steels using high resolution electron backscatter diffraction and moleculardynamics modeling,” Scripta Materialia, vol. 116, 2016, pp. 87–90.
[4] K. Fukuya, “Current understanding of radiation-induced degradation in light water reactor
structural materials,” Journal of Nuclear Science and Technology, vol. 50, 2013, pp. 213–254.

27
[5] K. Fukuya, M. Nakano, K. Fujii, and T. Torimaru, “IASCC susceptibility and slow tensile properties of highly-irradiated 316 stainless steels,” Journal of Nuclear Science and Technology,
vol. 41, 2004, pp. 673–681.
[6] K. Fukuya, H. Nishioka, K. Fujii, T. Miura, and Y. Kitsunai, “Local strain distribution near grain
boundaries under tensile stresses in highly irradiated SUS316 stainless steel,” Journal of Nuclear Materials, vol. 432, 2013, pp. 67–71.
[7] M. Sauzay, K. Bavard, and W. Karlsen, “TEM observations and finite element modelling of
channel deformation in pre-irradiated austenitic stainless steels–Interactions with free surfaces and grain boundaries,” Journal of Nuclear Materials, vol. 406, 2010, pp. 152–165.
[8] M. Sauzay and M.O. Moussa, “Prediction of grain boundary stress fields and microcrack initiation
induced by slip band impingement,” Fracture Phenomena in Nature and Technology, Springer, 2014, pp. 215–240.
[9] Z. Jiao and G. Was, “Impact of localized deformation on IASCC in austenitic stainless steels,”
Journal of Nuclear Materials, vol. 408, 2011, pp. 246–256.
[10] M.N. Gussev, S.R. Clark, J.T. Dixon, and K.J. Leonard, “Preparation and Analysis of Austenitic Stainless Steel Samples Irradiated at Very High Damage Doses,” ORNL/TM-2018/113792, 2018.
[11] Localized Deformation Investigation in Irradiated Materials via Electron Microscopy and In Situ
Testing, ORNL/TM-2017/507, 2017. [12] M.N. Gussev and K.J. Leonard, “In situ SEM-EBSD analysis of plastic deformation mechanisms in
neutron-irradiated austenitic steel,” Journal of Nuclear Materials, vol. 517, 2019, pp. 45–56.
[13] J. Massoud, P. Dubuisson, P. Scott, and V. Chamardine, “CIR II program: description of the Boris 6 and 7 experiments in the BOR-60 fast breeder reactor,” EPRI Report, vol. 1011787, 2005.
[14] P. Scott, “Materials reliability program: a review of the cooperative irradiation assisted stress
corrosion cracking research program (MRP-98),” EPRI Report, vol. 1002807, 2003.
[15] J. Jiang, T.B. Britton, and A.J. Wilkinson, “Accumulation of geometrically necessary dislocations near grain boundaries in deformed copper,” Philosophical Magazine Letters, vol. 92, 2012,
pp. 580–588.
[16] P.S. Karamched and A.J. Wilkinson, “High resolution electron back-scatter diffraction analysis of thermally and mechanically induced strains near carbide inclusions in a superalloy,” Acta
Materialia, vol. 59, 2011, pp. 263–272.