Embed Size (px)
Citation preview

Understanding Energy
Conservation in Swine Production
Jay D. Harmon, Ph.D., P.E.Interim Associate Dean for ANR Extension
Professor & Extension Ag EngineerAgricultural and Biosystems Engineering
Iowa State University4333 Elings HallAmes, IA 50011
Midwest Farm Energy ConferenceJune 14, 2017

• Sow Farm
– Fuel, Oil, Utilities $20.39 per liter produced
– 5.1% of total expenses
– 8.4% of non-feed expenses
• Wean-Finish Farm
– Fuel, Oil, Utilities $1.98 per head
– 1.7% of total expenses
– 6.4% of non-feed expenses
Why is Energy Important?
2
2013-16 median from: www.finbin.umn.edu

• Energy is a significant part of expenditures
that you CAN do something about
• Many energy savings can be implemented
with very little expense and some with NO
additional expense.
Energy is Important
3

1st Rule of Energy Conservation
If you don’t keep track of what you use,
it’s hard to tell if you’re doing great or
have a great opportunity to improve!
4
Customize the spreadsheet to reflect your farming operation
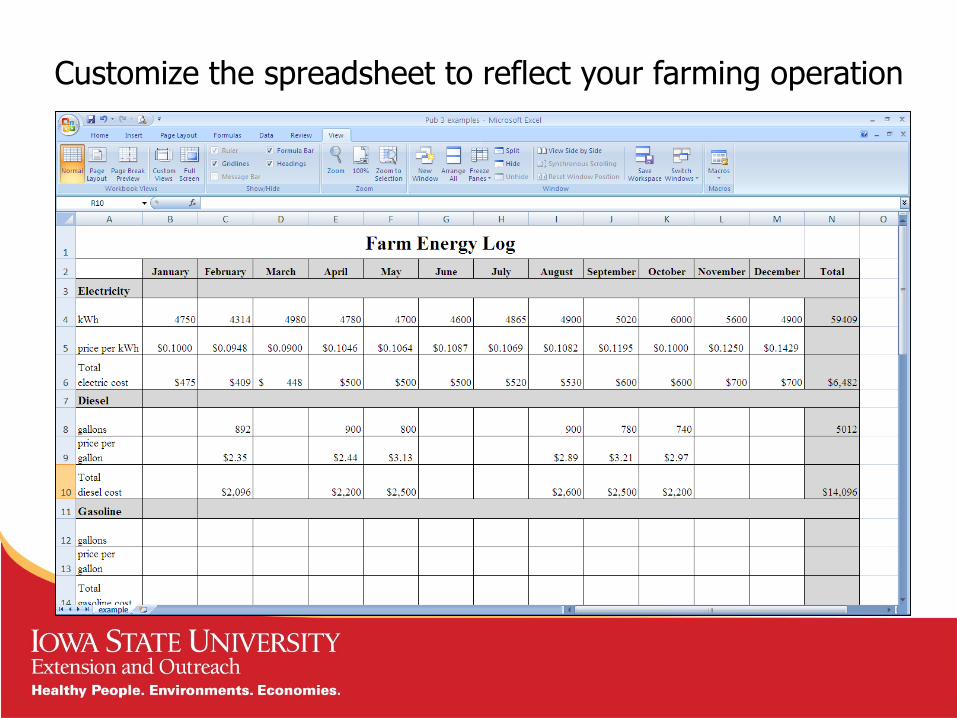
Data Summary
Description Electric/yr Range Propane/yr Range
kWh/pig space Gal/pig space
Finishing
Curtain barn 22.6 19.0-26.8 <0.67 0.5-1.0
Tunnel barn 25.9 20.5-30.7 <0.67 0.5-1.3
Wean-Finish
Tunnel barn 31.3 27.5-35.1 2.6 1.8-3.3
Sow farms 240 282-225 6.1 1.2-12.3
6
Based on small data set from cooperators.
From: Benchmarking energy usage for swine producers. PM3063E. ISU Extension publication

Where do you start?
• Insulation?
• Lighting?
• Ventilation?
• Heating system?
7

• FAR and AWAY the biggest potential for
wasted energy
• 80 to 90% of heating energy lost through
ventilation when done properly
• Controller setting and fan selection have a
big influence on energy
Ventilation
8
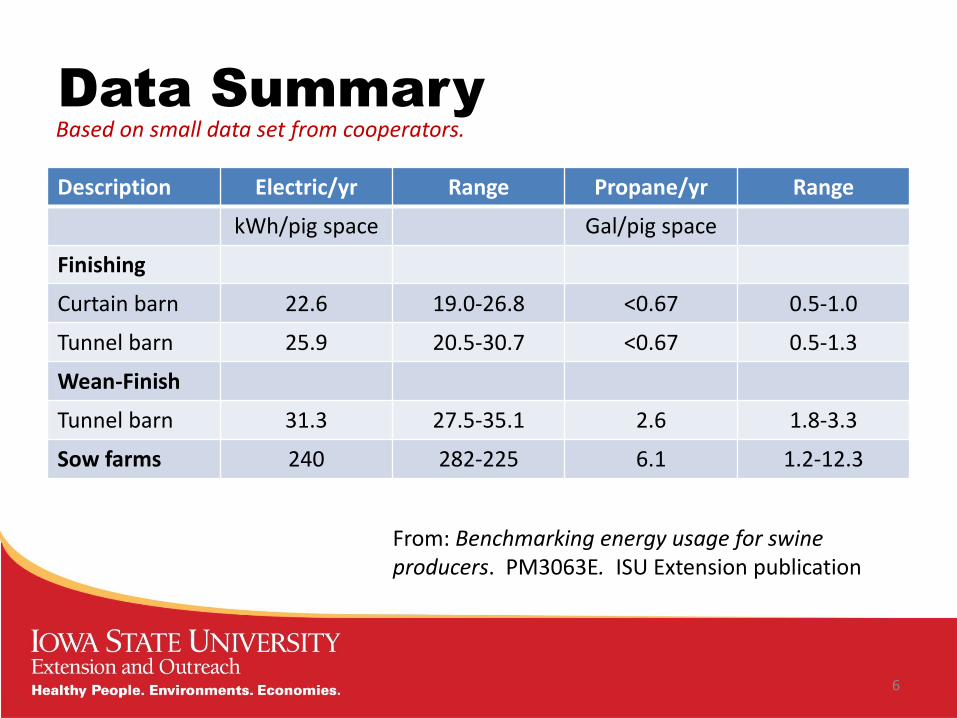
• Sample: 1000 head barn, 41 x 200
– Assume:
• 50 lb pigs @ 3 cfm/head & 68 F setpoint
• Mason City, IA
– Questions:
• How much does over-ventilating cost?
Proper Ventilation Rate?
9

0
1,000
2,000
3,000
4,000
5,000
6,000
Ventilation Rate
Proper
10% Over
20% Over
30% Over
40% Over
50% Over
59% Over
Annual LP Usage Estimate
Wean-to-Finish (annualized)
10
1-2
4”
@ 5
1%
1-2
4”
@ 5
6%
1-2
4”
@ 6
1%
1-2
4”
@ 6
6%
1-2
4”
@ 7
1%
1-2
4”
@ 7
6%
2-2
4”
@ 4
0%
Ga
llons L
P/1
000 p
ig s
paces p
er
year

• Variable speed fans make delivering a
prescribed minimum rate difficult.
– Too much ventilation = excess LP
– Too little ventilation = poor air quality
• Proper rate should be based on air quality
& moisture, not “rule of thumb”
– Example: 2 cfm
Why is Proper Rate so
Difficult?
11

Fan Selection –
Example 24” Fan Data
Static PressureInches of water
SpeedRPM
Airflowcfm
Efficiencycfm/W
0.00 1101 6490 16.1
0.05 1094 6090 14.7
0.10 1089 5740 13.4
0.15 1083 5250 12.2
0.20 1082 4760 10.8
0.25 1082 3950 9.0
0.30 1082 2330 5.6
Source: BESS (2009) – www.bess.illinois.edu
12

How Efficient Should You
Choose?
Diameter of fan (in) Efficiency Rating (cfm/W) @ 0.1 inches of water
Median Rating Top ¼ Rating
<16 7.9 8.7
16 to 20 10.3 11.2
22 to 35 13.0 14.6
36 to 46 15.9 17.2
48 to 56 18.9 20.4
>56 20.1 21.5
Source: BESS (2009)
Look for rebates from your electricity provider
13

Fan Efficiency Comparison
Highest Efficiency
• Uses 33,400 kWh/yr
• ~ $3300 @ 10 cents/kWh
Lowest Efficiency
• Uses 60,000 kWh/yr
• ~ $6000 @ 10 cents/kWh
1000 Head Tunnel B&G (250 cfm/head)• 8 fans – 24” ~ 7000 cfm• X fans – 50” or 51” – enough to reach 250 cfm/sow
Savings of ~ $2700/yr (~44%)
14
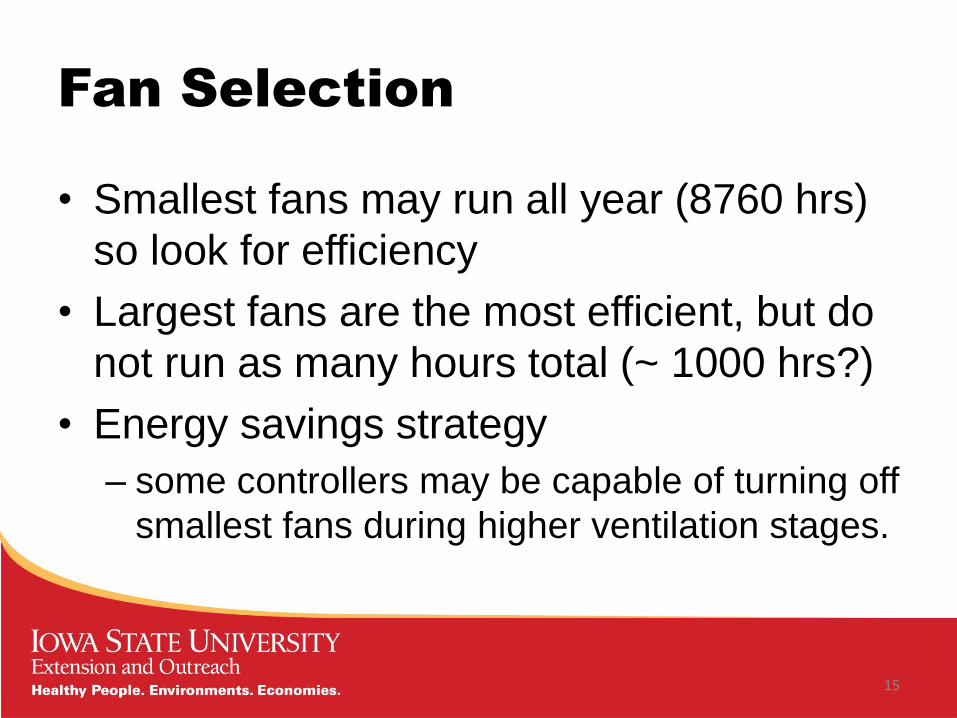
Fan Selection
• Smallest fans may run all year (8760 hrs)
so look for efficiency
• Largest fans are the most efficient, but do
not run as many hours total (~ 1000 hrs?)
• Energy savings strategy
– some controllers may be capable of turning off
smallest fans during higher ventilation stages.
15

Heaters & Brooders

Fan Control
• Setpoint – Temperature that divides the
heating and cooling phases
Minimum Ventilation Rate (X %)
Temperature
Setpoint
Bandwidth
Fan @ 100%
68 F 70 F
2 F
Cooling

Space Heater Control
Temperature
Setpoint
68 F
Cooling
Hea
ter
On
Hea
ter
Off
Differential
Room temperature continues to increase after heater turns off
Heater Offset
65.5 F 66.5 F
1 F
1.5 F
Heating

Space Heater Control
Temperature
Setpoint
68 F
Cooling
Hea
ter
On
Hea
ter
Off
Overshooting the setpoint causes fan to increase ventilation, exhausting heat that was just added.
66.5 F 67.5 F
1 F
0.5 F
Heating
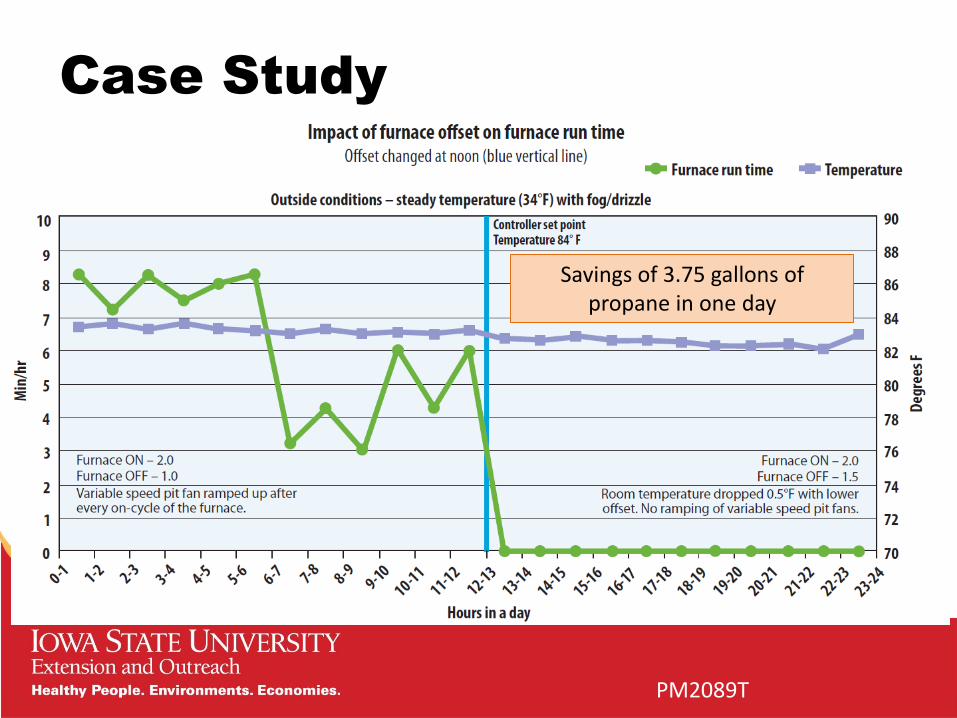
Case Study
Savings of 3.75 gallons of propane in one day
PM2089T

Heater Modulation
Heating is most effective and efficient running longer at lower settings

Guidelines
• Initially set offset to 1.5 to 2 F below the setpoint.
• Offset needs to be larger in rooms where the furnace is large for the room size.
• Use modulation valves to turn the heater down when the full capacity is not needed. More constant operation keeps a more steady environment.
• LISTEN!
– If the furnace runs, and then the minimum ventilation fans begin to increase speed after it has shut off, the offset needs to be larger!

Heater Control – Using Brooders
Temperature
Setpoint
86 F
CoolingH
eate
r O
n
Hea
ter
Off
Setpoint is set to slightly above the brooder temperature
Heater Offset
70 F 72 F
14 F
Heating
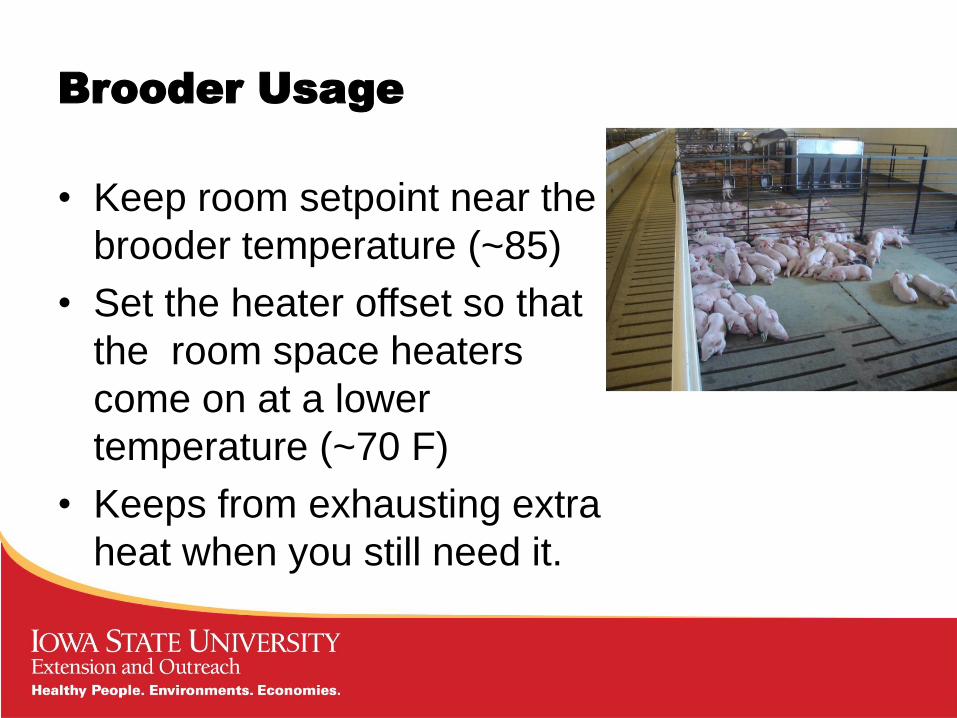
Brooder Usage
• Keep room setpoint near the
brooder temperature (~85)
• Set the heater offset so that
the room space heaters
come on at a lower
temperature (~70 F)
• Keeps from exhausting extra
heat when you still need it.

Dirty Fans and Shutters
• 1/8 inch of dirt/dust
can cause up to a
40% reduction in fan
and shutter air flow.
– Triggers next
ventilation stage
sooner costing more
energy.
25

How Does this Impact
Performance?
Air Short-Circuits
Air is lazy and follows the easiest path… therefore air comes from here instead of the room.
Result is poorer air quality and possibly sicker pigs.
26

Loose fitting pit covers and fan shrouds allow short-circuiting and loss of ventilation
27

28
Effect of Drive Belt Tension
48-inch Fan
0
5000
10000
15000
20000
25000
0 20 40 60
Air
flo
w
(cfm
)
Static Pressure (inches of water)
BESS lab
Airflow before belt adj.
Airflow after belt adj.
Linear (Airflow beforebelt adj.)
Linear (Airflow after beltadj.)
0.08 0.16 0.24
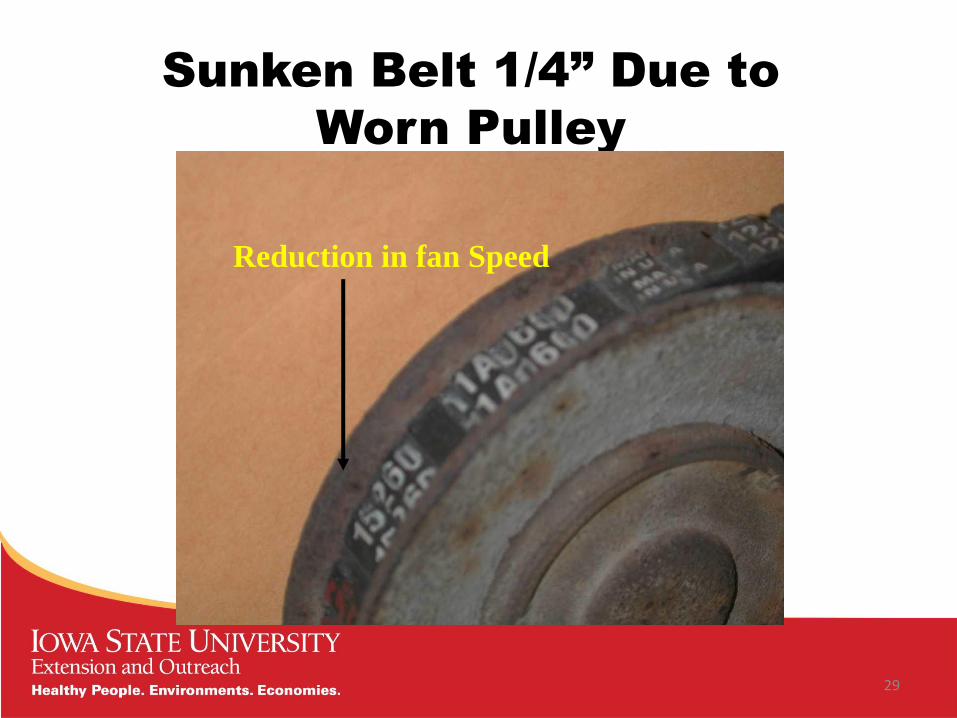
Sunken Belt 1/4” Due to
Worn Pulley
Reduction in fan Speed
29

Preventing Belt and Pulley
Wear
University of GA
30

Check Electrical Systems
• At the fan and in the electrical panel.
• Connections tend to loosen over time with heating and cooling.

Poorly Maintained Fans:
• Reduce air quality in winter
• Cause higher stages to run earlier and use
more electricity
• Cause curtains to drop when it is colder
outside
• Reduce the ability to cool animals in summer
32

• Begin by tracking your energy usage
• Ventilation Management is critical to
energy management
• Controller Settings are an important part of
efficient operation.
– No investment in many cases .. Only
management
Summary
33
What questions do you
have?
34
ISU Extension Farm Energy InitiativeFarmenergy.exnet.iastate.edu