Embed Size (px)
Citation preview

School of BusinessUpper Montclair, New Jersey 07043
Understanding East Asia’s Financial Crisis:Insights from Agency Theory
InEconomic Liberalization in India:
Challenges and OpportunitiesInternational Conference, Chennai, India August 8-12, 1998
(New Delhi: Macmillan Publishing Company, 1998)
Phillip LeBel, Ph.D.Professor of Economics
Department of Economics and FinanceSchool of Business
Montclair State UniversityUpper Montclair, New Jersey 07043
Telephone: (973) [email protected]

- 2 -
AbstractUnderstanding East Asia’s Financial Crisis:
Insights from Agency Theory
For some time, India has been under pressure to adopt the “East Asian” model of growthand development. As developed initially with great success by Japan, this modelemphasizes the use of targeted market prices to achieve accelerated rates of saving andinvestment, a strong role for the rapid growth of manufacturing, and a major reliance onhigh-technology export-led growth to achieve sustained high rates of increases in per capitaincome. Indeed, it is precisely this model that characterized the economic policies amongthe Asian “tiger” economies. Its apparent success also has been a driving force behindproposed economic reforms in China and India.
The “East Asian” model of economic growth now raises fundamental questions.Beginning with the crash of the Hong Kong stock market crash in late summer of 1997,South Korea became the first of the Asian “tiger” economies to experience both financialand economic collapse. With South Korea’s appeal to the International Monetary Fund toprovide emergency stabilization funding, what has been viewed as the “East Asian” modelof growth and development is now in doubt.
For the past several years, India has begun a process of economic reform built along thelines of the East Asian model. Since this is now open to question, a key question iswhether Indian economic reforms now under way can proceed in continued emulation ofthe East Asian model or whether an alternative approach may be more appropriate. What isclear is that India seems thus far to have escaped some of the more extreme consequencesof the financial and economic turmoil of the East Asian countries, as measured by relativechanges in stock market prices and foreign exchange rates.
Standard approaches to adjustment emphasize the role of restoring credit and liquiditybalances to the banking sector. As promulgated by the IMF package put forth in SouthKorea and in Indonesia, this includes not only the immediate transfer of funds to meetshort-term credit obligations, but also an emphasis on banking and corporate liberalization,and on currency devaluation. While these measures seem to have had some successelsewhere, as in the resolution of the Mexican crisis in the early 1980’s, the longer termchallenge is to develop institutional rules that provide a more accurate measure of risk toeconomic agents.
In this paper, I propose an agency model to argue that longer term solutions to financialcrises such as what we now see in East Asia can only be devised through the adoption ofaccounting rules that provide measurable transparency in financial and productive decision-making. In so doing, I plan to shed light on the kinds of economic reforms that Indianauthorities may need to consider in light of the East Asian financial and economic crisis,and how these reforms may be compared with and contrast to past and current policies inIndia.
IntroductionWhen one looks for successful models for economic growth and development over the
past twenty-five years, the region most often cited is East Asia. If one considers theexperience of Japan, South Korea, Hong Kong, Singapore, Malaysia, Taiwan, Thailand,and Indonesia, it is clear that these countries have achieved extraordinary rates of growth inper capita income. Indeed, the apparent success of the “Asian” model has generatedincreasing favor in China, India, and in other developing countries outside the region.What has dramatically changed this image is the East Asian financial crisis that began in thelatter half of 1997 and continues to unfold.

- 3 -
The East Asian financial crisis appears to have turned the “Asian” model upside down.Beginning first with the collapse of foreign exchange and equity markets in South Korea,Hong Kong, and Indonesia, East Asia’s financial crisis has led to economic contraction,rising inflation and unemployment, and has spread to other regions of the global economy.Since the “Asian” model is now open to doubt, it is instructive to ask why this turn ofevents has come about and what corrective policy measures are appropriate. With this basicquestion in mind, this paper examines the common and distinctive features of key EastAsian economies, and the reasons for both their success and recent crisis.
How significant is the East Asian financial crisis and on what basis is economic reformnow proceeding? We can take stock of the events of 1997 in several steps. We look lookfirst at the relative importance of the East Asian region to the global economy. Second, weidentify what policy elements the successful economies in East Asia share in common.Third, we examine benchmark indicators of the financial crisis of 1997. Fourth, we presenta critical examination of standard approaches to economic and financial reform. Finally, wepresent a framework for policy reform based on a model in the presence of imperfectinformation. As will become clear, contract incentives designed to improve the level anddistribution of market information are essential if policy reforms are to succeed in restoringEast Asian countries to sustainable economic growth.
The Global Economic Importance of East AsiaHow important is East Asia to the global economy? Figure 1 illustrates the role of East
Asian economies to global trade and investment. Until recently, almost all of the economiesin East Asia were growing at rates well above their historical trends, and above those ofmost other regions of the world. Were these rates to continue, East Asia seemed destined tobecome the economic leader in the 21st century. Indeed, books on the East Asian economic“miracle” have become a near cottage industry serving policymakers and the internationalbusiness community.1
By 1990, East Asian countries net of Japan, China, and India already accounted forthe third largest grouping of countries after NAFTA and the European Community. AddingChina and Japan made the region the second largest as of 1990, while the addition of Indiawould make it the largest single grouping as of that date. At these rates, inclusive of Japan,
1 See, for example, Edmund T. Gomez and J.S. Jomo, Malaysia’s Political Economy (Cambridge:Cambridge University Press, 1998); Paul Krugman, Pop Internationalism. (Cambridge: MIT Press,1996); ; Hal Hill, The Indonesian Economy Since 1966. (Cambridge: Cambridge University press, 1996);Ezra Vogel, Japan as Number One in Asia. (New York: Columbia University Press, 1994); Laurad’Andrea Tyson, Who’s Bashing Whom? Trade Conflict in High-Technology Industries (Washington,D.C.: Institute for International Economics, 1993); Hiroyuki Odagiri, Growth Through Competition,Competition Through Growth: Strategic Management and the Economy in Japan. (New York: OxfordUniversity Press, 1992); Paul Krugman, editor. Trade with Japan: Has the Door Opened Wider? (Chicago:University of Chicago Press, 1991); Kozo Yamamura, editor. Japan’s Economic Structure: Should ItChange? (Seattle: Society for Japanese Studies, 1990); Akio Morita, International Economic Cooperationand Domestic Realities: International Business as a Partner in Trialogue. (New York: The TrilateralCommission, 1990); A. Amsden, Asia’s Next Giant: South Korea and Late Industrialization. (New York:Oxford University Press 1989); Clyde Prestowitz, Trading Places: How We Allowed Japan to Take theLead. (New York: Basic Books, 1988); Lester C. Thurow, “The Case for Industrial Policies in America”,in Toshio Shishido and Ryuzo Sato, editors, Economic Policy and Development: New Perspectives.(Dover, Mass.: Auburn House, 1985), pp. 225-59; Richard Schonberger, Japanese ManufacturingTechniques. (New York: The Free Press, 1982); Ira Magaziner and Robert Reich, Minding America’sBusiness. (New York: Harcourt Brace Jovanovich, 1982). Ezra Vogel, Japan as Number One (Cambridge:MIT Press, 1979). Krugman’s 1996 book takes much of the U.S.-Asia literature to task for embracingmisguided industrial policies to counter Japan’s success in mercantile trade.

- 4 -
South Korea, and China, the East Asian share of global GDP would account for almost athird of projected global GDP by 2020.
Figure 1
Relative Shares of Global GDP (with projections based on 1980-1990 growth rates)
0%
10%
20%
30%
40%
50%
60%
70%
80%
90%
100%
1950 1960 1970 1980 1990 2000 2010 2020
Japan S.Korea R.Asia China India NAFTA W.Europe L.Am&Carib. Africa&M.East
Source: The World Bank, World Development Indicators 1997, World Tables, selected years, and author’sprojections.
As impressive as East Asia’s historical growth has been, as long as the financial crisisthat unfolded in 1997 remains serious and unexplained, the appeal of East Asia’s economicpolicies will be a qualified one. Moroever, there are significant structural and policydifferences among the economies of East Asia that need to be taken into account. Thesedifferences help to explain why the financial crisis has not struck uniformly in allcountries.2 We add also the fact that since East Asia also is the most populous region of the
2 For measures of regional economic integration, see Imbad A. Moosa and Razzaque H. Bhatti, “Are AsianMarkets Integrated? Evidence for Six Countries Via-a-Vis Japan”, International Economic Journal 11(1)(Spring 1997), pp. 51-67; Lin Show Chen and Lin Jyh Wu, “Sources of Real Exchange Rate Fluctuartions:Empirical Evidence from Four Pacific Basin Countries” Southern Economic Journal 63(3) (January 1997),pp.776-87; Imad A. Moosa and Razzaque H. Bhatti, “Does Real Interest Parity Hold? Emprirical Evidencefrom Asia”, Keio Economic Studies 33(2), (1996), pp. 63-70; Ramkishen Rajan, “Singapore’s BilateralMerchandise Trade Linkages with Japan and the United States: Trends, Patterns, and Comparisons”, AsianEconomic Journal 10(2) (July 1996), pp. 133-63; Suzanne Berger and Ronald Dore, editors, NationalDiversity and Global Capitalism. (Ithaca, New York: Cornell University Press, 1996); William E. James,“International Finance and Domestic Financial Market Development: The Case of Indonesia”, AsianDevelopment Review 14(1) (1996), pp. 131-61; Raj Aggarwal and Mbodja Mougoué, “CointegrationAmong Asian Currencies: Evidence of the Increasing Influence of the Japanese Yen”, Japan and the WorldEconomy 8(3) (September 1996),pp. 291-308; Sung Hee Jwa, “Capital Mobility in Korea Since the Early1980’s: Comparisons with Japan and Taiwan”, in Takatoshi Ito and Anne O. Krueger, editors,Macroeconomic Linkage: Savings, Exchange Rates, and Capital Flows (Chicago: University of ChicagoPress, NBER-East Asia Seminar on Economics, vol. 3, 1994), pp. 123-64; Sung Yeung Kwack, “TheRates of Return on Capital in the United States, Japan, and Korea, 1972-1990”, in The Korean EconomyAt A Crossroad. (Westport, Connecticut: Greenwood Press, 1994), pp. 57-71; David T. Mason, “TheImpact of Trade Blocs on the Future of Japan’s Relations with China”, in David T. Mason and Abdul M.Turay, editors, Japan, NAFTA, and Europe: Trilateral Cooperation or Confrontation? (New York: St.Martin’s Press, 1994), pp. 195-218. While many East Asian countries have pursued export strategies
- 5 -
globe, even with impressive rates of growth, per capita income in countries such as Chinaand India still have a long way to go before they reach the levels of Japan, Singapore,Western Europe and North America. As such, the data in Figure 1 can serve only as a firstorder indication of the growing importance of East Asia to the global economy.
Common Elements in Macroeconomic Policy in East Asian EconomiesWhile there are differences in economic policies among East Asian countries, let us
look first what common elements that they share and how they have contributed to theirregional success. There are five key ingredients in the “Asian” model, each of which maybe viewed in relation to economic policies in other regions of the world: 1. fostering highrates of domestic saving and investment; 2. emphasis on export led growth; 3. keeping taxand government spending rates relatively low; 4. keeping inflation and unemployment ratesfairly low; and 5. fostering the transfer of technology from developed economies todeveloping countries in the region. As such, this model emphasizes a minimal dependenceon international public aid, and on international direct and portfolio investment in theregion. What it has required, is periodic domestic intervention in various stages oftransition, either by government incentives, or through the selection of key industries tomanage the restructuring of economies to globally competitive standards.
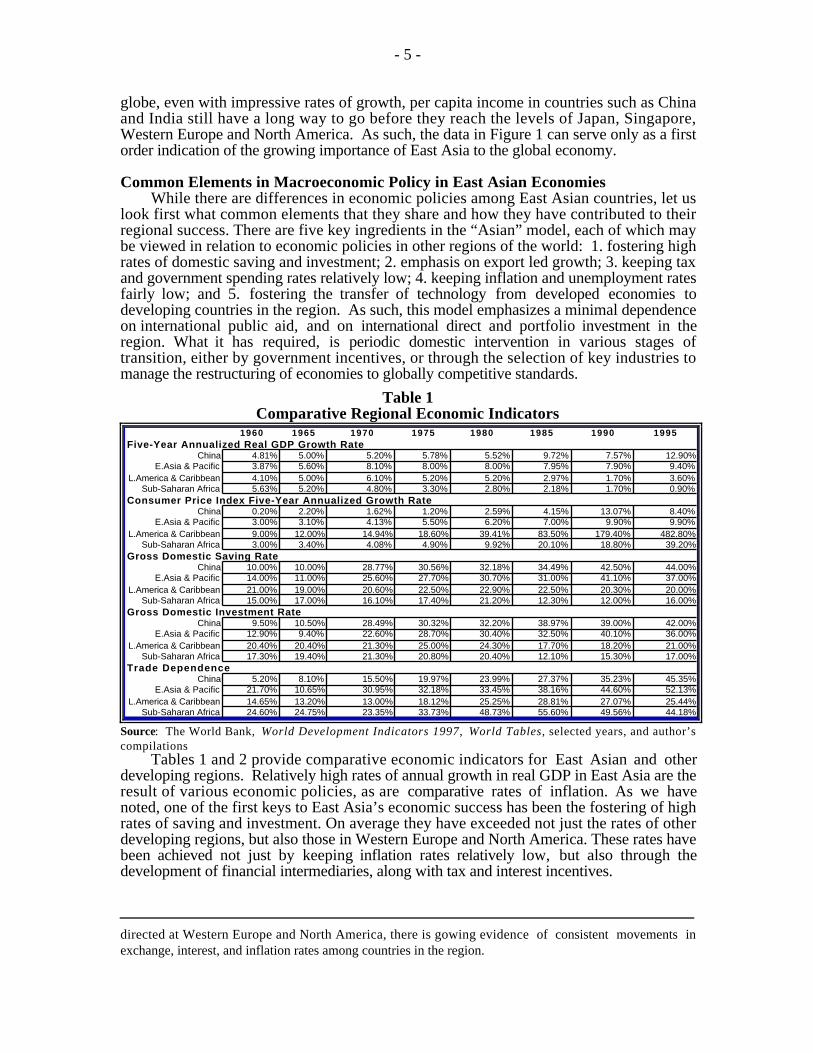
Table 1Comparative Regional Economic Indicators
1960 1965 1970 1975 1980 1985 1990 1995Five-Year Annualized Real GDP Growth Rate
China 4.81% 5.00% 5.20% 5.78% 5.52% 9.72% 7.57% 12.90%E.Asia & Pacific 3.87% 5.60% 8.10% 8.00% 8.00% 7.95% 7.90% 9.40%
L.America & Caribbean 4.10% 5.00% 6.10% 5.20% 5.20% 2.97% 1.70% 3.60%Sub-Saharan Africa 5.63% 5.20% 4.80% 3.30% 2.80% 2.18% 1.70% 0.90%
Consumer Price Index Five-Year Annualized Growth RateChina 0.20% 2.20% 1.62% 1.20% 2.59% 4.15% 13.07% 8.40%
E.Asia & Pacific 3.00% 3.10% 4.13% 5.50% 6.20% 7.00% 9.90% 9.90%L.America & Caribbean 9.00% 12.00% 14.94% 18.60% 39.41% 83.50% 179.40% 482.80%
Sub-Saharan Africa 3.00% 3.40% 4.08% 4.90% 9.92% 20.10% 18.80% 39.20%Gross Domestic Saving Rate
China 10.00% 10.00% 28.77% 30.56% 32.18% 34.49% 42.50% 44.00%E.Asia & Pacific 14.00% 11.00% 25.60% 27.70% 30.70% 31.00% 41.10% 37.00%
L.America & Caribbean 21.00% 19.00% 20.60% 22.50% 22.90% 22.50% 20.30% 20.00%Sub-Saharan Africa 15.00% 17.00% 16.10% 17.40% 21.20% 12.30% 12.00% 16.00%
Gross Domestic Investment RateChina 9.50% 10.50% 28.49% 30.32% 32.20% 38.97% 39.00% 42.00%
E.Asia & Pacific 12.90% 9.40% 22.60% 28.70% 30.40% 32.50% 40.10% 36.00%L.America & Caribbean 20.40% 20.40% 21.30% 25.00% 24.30% 17.70% 18.20% 21.00%
Sub-Saharan Africa 17.30% 19.40% 21.30% 20.80% 20.40% 12.10% 15.30% 17.00%Trade Dependence
China 5.20% 8.10% 15.50% 19.97% 23.99% 27.37% 35.23% 45.35%E.Asia & Pacific 21.70% 10.65% 30.95% 32.18% 33.45% 38.16% 44.60% 52.13%
L.America & Caribbean 14.65% 13.20% 13.00% 18.12% 25.25% 28.81% 27.07% 25.44%Sub-Saharan Africa 24.60% 24.75% 23.35% 33.73% 48.73% 55.60% 49.56% 44.18%
Source: The World Bank, World Development Indicators 1997, World Tables, selected years, and author’scompilations
Tables 1 and 2 provide comparative economic indicators for East Asian and otherdeveloping regions. Relatively high rates of annual growth in real GDP in East Asia are theresult of various economic policies, as are comparative rates of inflation. As we havenoted, one of the first keys to East Asia’s economic success has been the fostering of highrates of saving and investment. On average they have exceeded not just the rates of otherdeveloping regions, but also those in Western Europe and North America. These rates havebeen achieved not just by keeping inflation rates relatively low, but also through thedevelopment of financial intermediaries, along with tax and interest incentives.
directed at Western Europe and North America, there is gowing evidence of consistent movements inexchange, interest, and inflation rates among countries in the region.

- 6 -
Table 1 also illustrates the emphasis on export-led growth. Trade dependence amongEast Asian and Pacific countries is among the highest in the world. With few exceptions,economies that are more open to international trade generally have higher rates of growth inGDP, reflecting the gains that accrue from comparative advantage.3
Table 2Economic Indicators for Selected Asian Countries
China Australia Japan Korea Hong Kong Indonesia Malaysia Singapore Taiwan ThailandGDP (U.S.$Bill.) $691 $347 $4,871 $415 $144 $197 $82 $84 $256 $165
Population (mill.) 1,210 18 125.4 45.3 6.2 195.3 19.9 3 21.3 60.3GDP per capita $571 $19,294 $38,844 $9,159 $23,161 $1,007 $4,131 $27,900 $12,005 $2,730
PPP GNP, 1994 $2,510 $18,120 $21,140 $10,330 $19,210 $3,600 $8,440 $21,900 $10,875 $6,970GDP Growth rate 10.00% 3.20% 0.90% 9.30% 4.60% 7.50% 9.60% 8.90% 6.10% 8.60%
Inflation Rate 10.00% 4.70% -0.10% 4.70% 8.70% 8.90% 3.40% 1.70% 4.70% 5.80%Unemployment Rate 3.20% 8.60% 3.40% 2.30% 3.50% 2.30% 2.80% 3.00% 1.80% 2.30%
Gross Domestic Saving Rate 44.00% 19.80% 30.70% 35.40% 32.60% 34.10% 33.90% 62.60% 25.90% 34.10%Gross Domestic Investment Rate 42.00% 21.40% 28.30% 36.90% 29.00% 36.00% 42.80% 46.10% 24.20% 41.00%
Govt. Spending to GDP ratio 15.00% 27.40% 15.00% 12.10% 14.90% 8.10% 21.40% 13.40% 17.40% 16.10%Govt. Surplus to GDP ratio -2.10% -0.40% -1.60% -0.30% -0.20% 0.60% 3.70% 15.70% -4.10% 2.80%
Monetary Growth Rate 23.70% 6.40% 3.20% 15.50% 14.50% 24.80% 13.20% 12.80% 10.10% 17.40%GDP Composition:
Agriculture 21.00% 3.00% 2.10% 7.00% 0.00% 17.00% 14.50% 0.20% 3.60% 10.30%Industry & Mining 47.00% 27.10% 37.70% 43.00% 18.00% 41.00% 43.50% 39.20% 36.30% 40.30%
of which Manufacturing: 37.00% 14.10% 28.00% 29.00% 11.00% 24.00% 32.00% 29.70% 28.20% 30.20%Services 32.00% 69.90% 60.20% 50.00% 82.00% 42.00% 42.00% 60.60% 60.10% 49.40%
Total 100.00% 100.00% 100.00% 100.00% 100.00% 100.00% 100.00% 100.00% 100.00% 100.00%Export Share of GDP 24.00% 19.00% 9.00% 36.00% 139.00% 25.00% 90.00% 177.00% 120.00% 39.00%
Export Concentration Index(1992): 0.076 0.196 0.140 0.109 0.152 0.194 0.156 0.183 0.123 0.090Gini inequality index: 37.60% 22.50% 11.46% 41.20% 22.41% 31.70% 48.40% 24.69% 42.20% 46.20%
Source: The World Bank, Asia-Pacific Profiles, 1996. Data are for 1995.
Table 2 provides additional data on economic indicators for selected countries in EastAsia. In addition to the emphasis on saving, investment, and export-led growth, thesecountries generally have emphasized policies to keep government taxation and spendingrates relatively low, as well as efforts to restrain both inflationary and unemploymentpressure. For the most part, East Asian governments have not only lower ratios ofgovernment spending to GDP than for most other regions, but also have either surpluses ormodest deficit to GDP ratios. They thus have had relatively small levels of external publicdebt, small debt to GDP ratios, and small debt service ratios, as measured by debt servicepayments as a percentage of exports of goods and services. In short, by most measures,countries in East Asia appear to have adopted prudent economic policies consistent with therates of economic growth they have been able to achieve.
3 Sub-Saharan Africa is one of the exceptions, though for reasons that can be explained more by the effectsof adverse domestic policies than by the degree of participation in international trade. See, for example,Zelealem Yiheyis, “Output Growth and Inflation Adjustment ot Devaluation Episodes in Sub-SaharanAfrica”, Canadian Journal of Development Studies. 18(1), 1997, pp. 93-117; Ishrat Husain, “StructuralAdjustment and the Long-Term Development of Africa”, in Rolph van der Hoeven and Fred van der Kraaij,editors, Structural Adjustment and Beyond in Sub-Saharan Africa (Portsmouth, N.H.: Heinemann, 1994),pp. 150-71; Ernest Aryeetey, et.al., “Financial Liberalisation and Financial Markets in Sub-SaharanAfrica”, Journal of African Economies, 6(1), March 1997, pp. 1-28; Angus Deaton and Ron Miller,“International Commodity Prices, Macroeconomic Performance and Politics in Sub-Saharan Africa, Journalof African Economies 5(3), Supplement Part 1, October 1996, pp. 99-191; and Phillip LeBel, editor,Privatization Strategies in Africa (Montclair, N.J.: Center for Economic Research on Africa, 1992).Economic reform policies in Sub-Saharan Africa with stuctural adjustment funding support from the WorldBank now emphasize export-led growth and the promotion of private market incentives, much as has beenthe experience in East Asia.

- 7 -
If there is an exception to the positive side of East Asia’s economic policies, it hasbeen most focused on policies involving the transfer of technology.4 Most countries in EastAsia have only recently moved to encourage international direct and portfolio investmentwhile at the same time seeking ways to accelerate the transfer of technology. Sinceinternational investment usually serves as the vehicle for technology transfer, limitingexternal flows often has been seen as an Asian version of mercantilism.
The question of economic mercantilism has become most concentrated in tradenegotiations regarding property right conventions, especially intellectual property rights ininformation technology. For example, China’s bid to achieve full-member status in theWorld Trade Organization has been subject to ongoing review in terms of the willingness tosupport international property rights conventions, and has historical roots in U.S.-Japantrade negotiations.
The technology policy issue is straightforward. Where chronic trade imbalances existeven in the face of periodic currency re-alignments, negotiations on creating mutuallyacceptable rules on upholding property rights conventions will be necessary if trade-basedeconomic growth is to continue. Because progress in these negotiations has continued toevolve, even this distinctive feature of East Asian economic policy is not perceived as acritical factor in the financial crisis that began in 1997.
Benchmarks of the East Asian Financial CrisisHow significant is East Asia’s financial crisis? The short answer is simple enough:
serious enough to stall regional growth, serious enough to increase the risk of regionalpolitical instability, and serious enough to consider major reforms in East Asian economicinstitutions. The role of the IMF in providing funding assistance to South Korea andIndonesia also provides a tangible symbol of the magnitude of East Asia’s financial crisis,even though its restructuring initiatives may not be able to address the underlyingfundamentals that gave rise to the events of 1997.5
What measures do we have of the magnitude of East Asia’s financial crisis? Capitaland foreign exchange markets provide two immediate benchmarks. Sharp and significantdeclines have taken place in both markets, which in turn have led to rising rates of inflationand unemployment, declines in rates of economic growth, and growing social and politicaltensions.
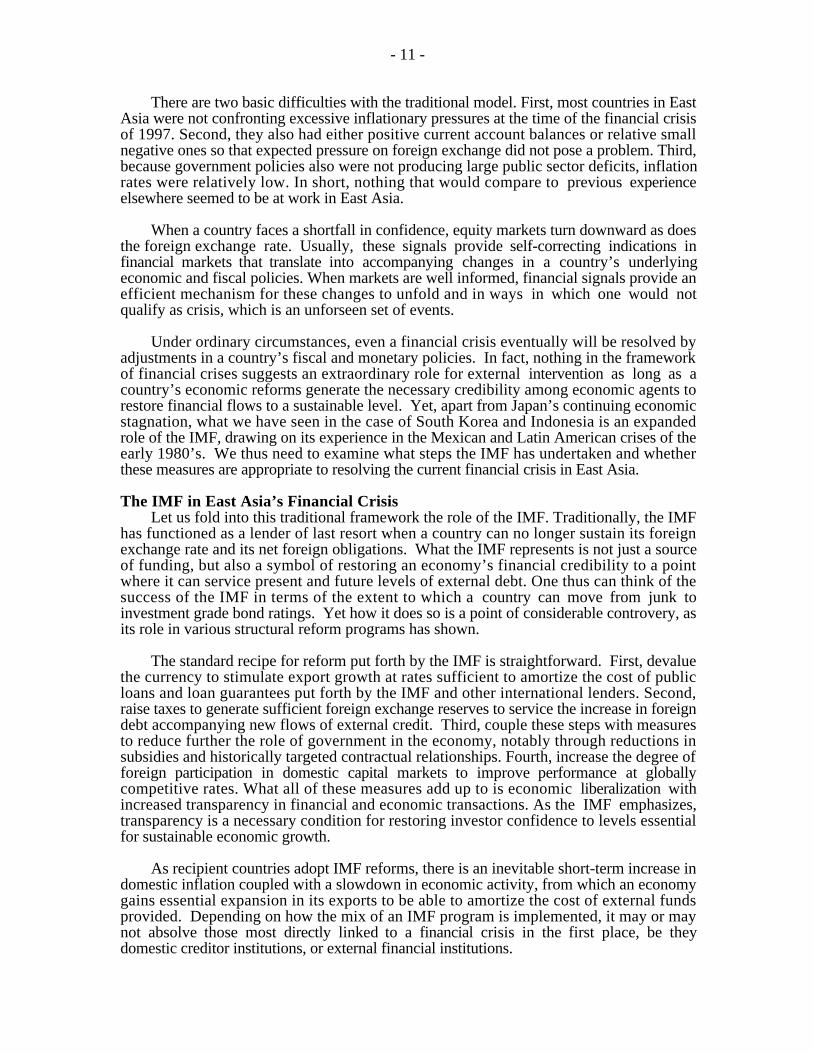
Figures 3 and 4 illustrate the change in East Asian capital and foreign exchangemarkets between April 1997 and March 1998. Beginning in the summer of 1997, equitymarket indexes began to decline by as much as 80 percent from their April 1997 levels.Relative changes from April 1997 to April 1998 were as follows: Taiwan (-1.95%); China(-4.48%); Singapore (-18.10%); Japan (-20.42%); Hong Kong (-22.17%); Philippines (-22.17%); South Korea (-52%); Malaysia (-55.17%); Thailand (-60%); and Indonesia (-75.68%). For all of these countries, the GDP weighted relative decline in East Asianequity indices over the same period was 23.67 percent, largely because of the importanceof Japan’s GDP in the region.
Figure 3
4 Paul Krugman, “The Myth of Asia’s Miracle”, Foreign Affairs 73(6) (November-December 1994), pp. 2-78; and “Competitivenesss: A Dangerous Obsession”, Foreign Affairs 73(2) (March-April, 1994), pp. 28-44.5 Martin Feldstein, “Asian Fallout: The IMF’s Errors”, Foreign Affairs 77(2) (March-April 1998), pp. 20-31.

- 8 -
East Asia Stock Market Relative Performance
0.00
20.00
40.00
60.00
80.00
100.00
120.00
140.00
Ap
r-9
7
Ma
y-9
7
Ju
n-9
7
Ju
l-9
7
Au
g-9
7
Se
p-9
7
Oc
t-9
7
No
v-9
7
De
c-9
7
Ja
n-9
8
Fe
b-9
8
Ma
r-9
8
Ap
r-9
8
Taiwan China Singapore Japan Hong KongPhilippines South Korea Malaysia Thailand Indonesia
Source: Datastream International., and author’s compilations.
As a relative comparison, the worst annual changes in the U.S. Dow Jones index werein 1931 (-52.67%), 1907 (-37.73%), and 1930 (-33.77%), with comparable rates takingplace in Western European markets during similar periods. Thus, even taking into accountthe somewhat lower relative importance of equity markets in East Asian economies, thereare few parallels to the relative declines in South Korea, Malaysia, Thailand, andIndonesia, and it is in these countries that the sharpest reverses in economic performancehave since unfolded.
Figure 4
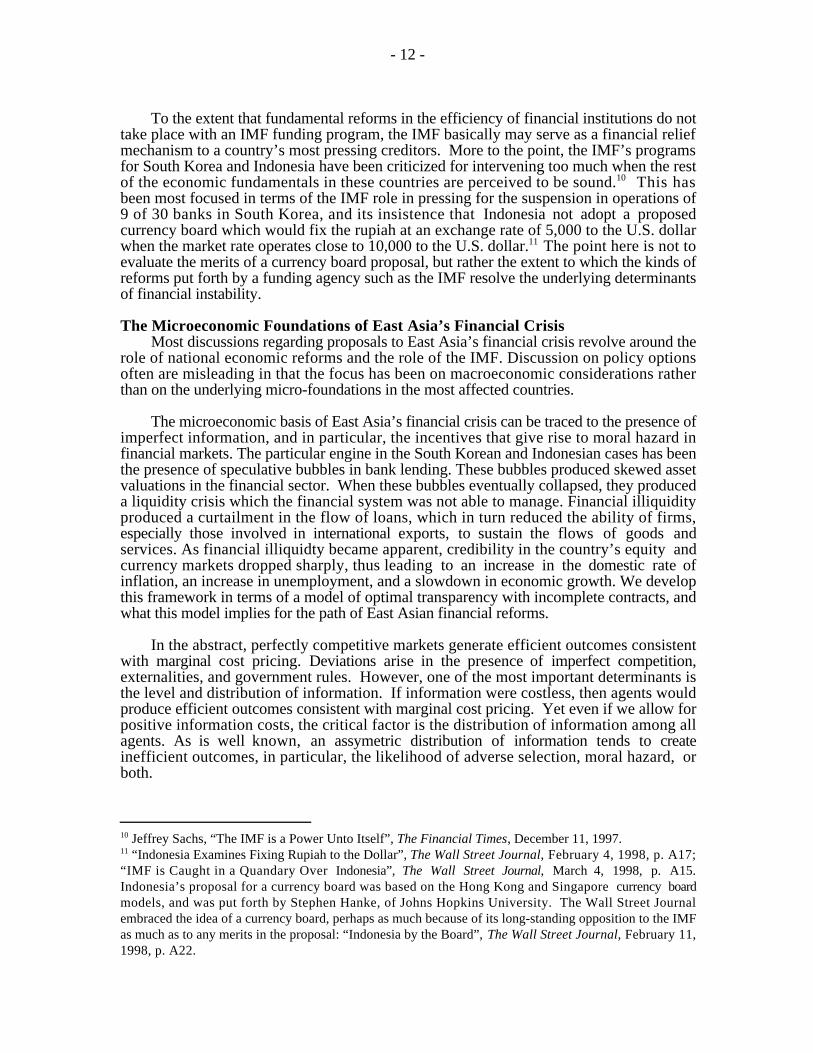
Relative Change in Equity and Foreign Exchange Markets(April 1997-April 1998)
Philippines
Philippines
Malaysia
Thailand
Taiwan
China
JapanSingapore
ThailandMalaysia
South Korea
Indonesia
Hong KongSouth Korea
Taiwan
China JapanSingapore
Hong Kong
Indonesia
-80%
-70%
-60%
-50%
-40%
-30%
-20%
-10%
0%
10%
0 2 4 6 8 10
Stock Exchange Relative Change Foreign Exchange Relative Change
Source: Datastream International, and author’s compilations.
As declines in East Asian capital markets have taken place, so too have there beendeclines in foreign exchange markets. Figure 4 illustrates the relative change in foreignexchange and equity markets during the past year. There is a positive correlation (.893)between relative changes in equity and foreign exchange markets, largely because of theemphasis that East Asian countries have placed on export-led growth. As can be seen in

- 9 -
Table 3, there also is a positive correlation among regional currencies, based on the degreeof regional trade interdependence that has developed.
Table 3East Asia Currency Correlations, 1993-1997
Philippines Taiwan Thailand Japan Malaysia Singapore China Indonesia KoreaPhilippines 1.00
Taiwan 0.19 1.00Thailand 0.70 0.37 1.00
Japan 0.03 0.46 0.28 1.00Malaysia 0.58 0.06 0.45 0.15 1.00
Singapore 0.47 0.43 0.63 0.58 0.59 1.00China 0.00 0.01 -0.03 -0.13 0.13 -0.07 1.00
Indonesia 0.75 0.14 0.60 0.08 0.84 0.56 -0.02 1.00Korea 0.14 0.27 0.11 0.53 0.24 0.57 -0.03 0.20 1.00
Source: Ibbotson Associates, Chicago, as reported in Brown, Goetzmann,and Park (1998). The mean currencycorrelation is .302
It is logical to ask whether the East Asian Financial crisis was magnified by the degreeof regional stock market and currency correlation. While there have been some suggestionsthat these correlations may have played a role, the evidence thus far is not compelling.6
Because relative changes in East Asian financial and currency markets have not beenuniform in space or time, ultimately the roots of East Asia’s financial crisis depend muchmore on the degree of efficiency, or lack of it, in local market institutions. To see why thisis so, we need to look at how standard models of international financial adjustment workand what limitations they present in the context of East Asia’s recent experience.
East Asia Inflation Rate Correlations, 1989-1997Hong Kong Singapore Korea Taiwan Thailand Malaysia Philippines Indonesia China Japan
Hong Kong 1.00Singapore 0.60 1.00Korea 0.74 0.83 1.00Taiwan 0.72 0.20 0.45 1.00Thailand -0.40 0.00 -0.01 -0.58 1.00Malaysia 0.45 0.14 0.38 0.49 -0.57 1.00Philippines 0.77 0.71 0.94 0.39 0.07 0.32 1.00Indonesia -0.29 0.03 -0.18 -0.64 0.17 0.00 -0.11 1.00China 0.12 -0.13 -0.33 0.42 -0.42 -0.09 -0.32 -0.21 1.00Japan 0.77 0.63 0.77 0.45 -0.14 0.08 0.77 -0.50 -0.24 1.00
Source: World Bank, Netsource Asia, and author’s compilations. The mean inflation correlation is .161.
6 Although East Asian stock and currency markets began to collapse within a similar time period, thus farthe evidence that these events were mutually reinforcing is not strong. OLS regressions on the relativedecline in stock and foreign exchange indices as a function of mean regional currency correlations andindividual country trade dependency were not significant. This finding is consistent with tests undertakenby Brown, Goetzmann and Park on the extent to which Hedge Funds contributed to the Asian currencycrisis. Brown et.al. developed estimates of changing positions of the largest ten currency funds in theMalaysian ringgit and to a basket of Asian currencies. They find net long or short positions in the ringgitor its correlates fluctuated dramatically over the previous four years, but that these fluctuations were notassociated with moves in the exchange rate. Estimated net positions of the major funds were not unusualduring the crash period, not were profits of the funds during the crisis. See, Stephen J. Brown, William N.Goetzmann and James Park,”Hedge Funds and the Asian Currency Crisis of 1997”, NBER Working PaperNo. 6427, February 1998. This evidence stands in contrast to the position put forth by Malaysian PrimeMinister, Mohamad Mahathir Mohamad, in “Highwaymen of the Global Economy”, The Wall StreetJournal, September 23, 1997, in which he suggested that the currency crisis was due to foreign exchangespeculation by hedge fund managers such as George Soros.

- 10 -
Standard Models of International Financial AdjustmentIn a world of perfect information, there are clear warning signs that a country’s
economic policies are unsustainable, and market forces can lead to self-correctingoutcomes. Even under a fixed exchange rate system, for example, there still can besufficient market signals to generate adjustments along a sustainable growth path.
Traditional explanations of East Asia’s financial crisis have been built around currencyadjustment models.7 Usually, these models have been developed to explain a country’smonetary and fiscal policies in an inflationary environment that produces adjustmentpressure on the economy’s foreign exchange rate. When a country’s relative inflation rate ispositive and increasing, equity markets adjust down in proportion to inflation ratedifferentials, as does a country’s foreign exchange rate. Moreover, they tend to do soroughly in proportion to a country’s inflation rate differentials. If in the face of inflationarypressure, a country seeks to maintain a pegged exchange rate, its ability to do so is dictatedby its foreign exchange reserves.
In a traditional model, as long as a country’s current account balance is positive, acountry can maintain some relative fixity in its foreign exchange rate through itsaccumulation of net foreign exchange reserves. Ultimately, however, inflationary cyclestend to undermine a country’s relative competitive position, and the current account balancedeclines, thus leading to pressures to lower domestic spending through a slowdown inmonetary expansion and a corresponding increase in the real rate of interest.
The scenario described above reflects many of the elements in the European exchangerate mechanism crisis of 1992, the debt crisis in Sub-Saharan Africa in the mid-1980’s, andthe Latin American debt crisis of the early 1980’s, and more recently, the Mexican crisis of1994.8 What those regions shared in common were policies built around unsustainablecommitments to relatively fixed exchange rates, among others. When foreign exchangerates eventually were adjusted, as with the IMF’s funding program in Mexico, and with thedevaluation of the CFA franc in Central and West Africa, these economies graduallyregained fiscal and financial equilibrium.9
7 See, Paul Krugman, “A Model of Balance of Payments Crises”, Journal of Money, Credit, and Banking11 (1979), pp. 311-325; R. Flood and P. Garber, “Collapsing Exchange Rate Regimes: Some LinearExamples”, Journal of International Economics 17 (1984), pp. 1-13; and more recently, Maurice Obstfeld,“The Logic of Currency Crises”, Cahiers Economiques et Monétaires, 43 (1994), pp. 189-213. Krugmandraws a distinction between “first” and “second generation” models, with the former characterized by effortsto maintain fixed exchange rates against limited foreign exchange reserves, and the latter in which whichpolicymakers make a trade-off between short-run macroeconomic flexibility and long-term credibility.8 See Roland Vaubel, “The Breakdown of the ERM and the Future of the EMU”, in David Cobham, editor,European Monetary Upheavals. (Manchester: Manchester University Press, 1994); Michele Fratianni andMichael J. Artis, “The Lira and the Pound in the 1992 Currency Crisis: Fundamentals or Speculation?”,Open Economies Review 7((0) Supplement 1 (1996), pp. 573-89; Sebastian Edwards, Crisis and Reform inLatin America (New York: Oxford University Press for the World Bank, 1995); Sridhar Sundaram andIndudeep Chhachhi, “ Valuation Effects of the Mexican Debt Crisis”, Applied Financial Economics 7(1),(February 1997), pp. 97-106;9 Africa’s debt crises have been affected to some extent by the prolonged commitment to a CFA fixedexchange rate, and which was changed only in 1994. Useful sources include: Ishrat Husain and IshacDiwan, Dealing with the Debt Crisis, a World Bank Symposium (Washington, D.C.: The Wold Bank,1989); E. Wayne Nafziger, The Debt Crisis in Africa (Baltimore: Johns Hopkins University Press, 1993);See, for example, Phillip LeBel, editor, New Initiatives for Africa’s Debt (Montclair, N.J.: Center forEconomic Research on Africa, 1989).
- 11 -
There are two basic difficulties with the traditional model. First, most countries in EastAsia were not confronting excessive inflationary pressures at the time of the financial crisisof 1997. Second, they also had either positive current account balances or relative smallnegative ones so that expected pressure on foreign exchange did not pose a problem. Third,because government policies also were not producing large public sector deficits, inflationrates were relatively low. In short, nothing that would compare to previous experienceelsewhere seemed to be at work in East Asia.
When a country faces a shortfall in confidence, equity markets turn downward as doesthe foreign exchange rate. Usually, these signals provide self-correcting indications infinancial markets that translate into accompanying changes in a country’s underlyingeconomic and fiscal policies. When markets are well informed, financial signals provide anefficient mechanism for these changes to unfold and in ways in which one would notqualify as crisis, which is an unforseen set of events.
Under ordinary circumstances, even a financial crisis eventually will be resolved byadjustments in a country’s fiscal and monetary policies. In fact, nothing in the frameworkof financial crises suggests an extraordinary role for external intervention as long as acountry’s economic reforms generate the necessary credibility among economic agents torestore financial flows to a sustainable level. Yet, apart from Japan’s continuing economicstagnation, what we have seen in the case of South Korea and Indonesia is an expandedrole of the IMF, drawing on its experience in the Mexican and Latin American crises of theearly 1980’s. We thus need to examine what steps the IMF has undertaken and whetherthese measures are appropriate to resolving the current financial crisis in East Asia.
The IMF in East Asia’s Financial CrisisLet us fold into this traditional framework the role of the IMF. Traditionally, the IMF
has functioned as a lender of last resort when a country can no longer sustain its foreignexchange rate and its net foreign obligations. What the IMF represents is not just a sourceof funding, but also a symbol of restoring an economy’s financial credibility to a pointwhere it can service present and future levels of external debt. One thus can think of thesuccess of the IMF in terms of the extent to which a country can move from junk toinvestment grade bond ratings. Yet how it does so is a point of considerable controvery, asits role in various structural reform programs has shown.
The standard recipe for reform put forth by the IMF is straightforward. First, devaluethe currency to stimulate export growth at rates sufficient to amortize the cost of publicloans and loan guarantees put forth by the IMF and other international lenders. Second,raise taxes to generate sufficient foreign exchange reserves to service the increase in foreigndebt accompanying new flows of external credit. Third, couple these steps with measuresto reduce further the role of government in the economy, notably through reductions insubsidies and historically targeted contractual relationships. Fourth, increase the degree offoreign participation in domestic capital markets to improve performance at globallycompetitive rates. What all of these measures add up to is economic liberalization withincreased transparency in financial and economic transactions. As the IMF emphasizes,transparency is a necessary condition for restoring investor confidence to levels essentialfor sustainable economic growth.
As recipient countries adopt IMF reforms, there is an inevitable short-term increase indomestic inflation coupled with a slowdown in economic activity, from which an economygains essential expansion in its exports to be able to amortize the cost of external fundsprovided. Depending on how the mix of an IMF program is implemented, it may or maynot absolve those most directly linked to a financial crisis in the first place, be theydomestic creditor institutions, or external financial institutions.
- 12 -
To the extent that fundamental reforms in the efficiency of financial institutions do nottake place with an IMF funding program, the IMF basically may serve as a financial reliefmechanism to a country’s most pressing creditors. More to the point, the IMF’s programsfor South Korea and Indonesia have been criticized for intervening too much when the restof the economic fundamentals in these countries are perceived to be sound.10 This hasbeen most focused in terms of the IMF role in pressing for the suspension in operations of9 of 30 banks in South Korea, and its insistence that Indonesia not adopt a proposedcurrency board which would fix the rupiah at an exchange rate of 5,000 to the U.S. dollarwhen the market rate operates close to 10,000 to the U.S. dollar.11 The point here is not toevaluate the merits of a currency board proposal, but rather the extent to which the kinds ofreforms put forth by a funding agency such as the IMF resolve the underlying determinantsof financial instability.
The Microeconomic Foundations of East Asia’s Financial CrisisMost discussions regarding proposals to East Asia’s financial crisis revolve around the
role of national economic reforms and the role of the IMF. Discussion on policy optionsoften are misleading in that the focus has been on macroeconomic considerations ratherthan on the underlying micro-foundations in the most affected countries.
The microeconomic basis of East Asia’s financial crisis can be traced to the presence ofimperfect information, and in particular, the incentives that give rise to moral hazard infinancial markets. The particular engine in the South Korean and Indonesian cases has beenthe presence of speculative bubbles in bank lending. These bubbles produced skewed assetvaluations in the financial sector. When these bubbles eventually collapsed, they produceda liquidity crisis which the financial system was not able to manage. Financial illiquidityproduced a curtailment in the flow of loans, which in turn reduced the ability of firms,especially those involved in international exports, to sustain the flows of goods andservices. As financial illiquidty became apparent, credibility in the country’s equity andcurrency markets dropped sharply, thus leading to an increase in the domestic rate ofinflation, an increase in unemployment, and a slowdown in economic growth. We developthis framework in terms of a model of optimal transparency with incomplete contracts, andwhat this model implies for the path of East Asian financial reforms.
In the abstract, perfectly competitive markets generate efficient outcomes consistentwith marginal cost pricing. Deviations arise in the presence of imperfect competition,externalities, and government rules. However, one of the most important determinants isthe level and distribution of information. If information were costless, then agents wouldproduce efficient outcomes consistent with marginal cost pricing. Yet even if we allow forpositive information costs, the critical factor is the distribution of information among allagents. As is well known, an assymetric distribution of information tends to createinefficient outcomes, in particular, the likelihood of adverse selection, moral hazard, orboth.
10 Jeffrey Sachs, “The IMF is a Power Unto Itself”, The Financial Times, December 11, 1997.11 “Indonesia Examines Fixing Rupiah to the Dollar”, The Wall Street Journal, February 4, 1998, p. A17;“IMF is Caught in a Quandary Over Indonesia”, The Wall Street Journal, March 4, 1998, p. A15.Indonesia’s proposal for a currency board was based on the Hong Kong and Singapore currency boardmodels, and was put forth by Stephen Hanke, of Johns Hopkins University. The Wall Street Journalembraced the idea of a currency board, perhaps as much because of its long-standing opposition to the IMFas much as to any merits in the proposal: “Indonesia by the Board”, The Wall Street Journal, February 11,1998, p. A22.

- 13 -
Markets usually address informational assymetry in terms of the relevant costs andbenefits in the contracting process. Since the marginal cost of perfect information tendstoward infinity, all markets tend to adopt proxy measures for the level and distribution ofinformation, and the resulting prices. However, if financial markets are sufficiently broad,they provide suitable pricing options that can diversify a prevailing degree of risk. Thegreater is the range of contingent market valuation alternatives, the lower will be theprobability of a particular financial crisis. It is the absence of sufficiently rich pricingoptions in East Asian financial markets that led to the crisis that began in 1997.
Markets with Incomplete ContractsLet us now consider East Asia’s financial crisis as an agency problem for banks and
firms. Agents and principals each can be thought to be utility maximizing with some degreeof risk aversion. If we express these preferences in terms of an Arrow-Pratt constantrelative risk-aversion expected utility function , we have:
(1) EU(X,Y), where
X represents a random variable for which the agent must make a choice for the controlvariable Y before Y is observed. For an infinite time horizon, the first and second orderconditions for maximization are:
(2) EUY (X, Y* ) ≡ UY (x, Y* )dF (x) = 0∫ ,
(3) EUYY ( X, Y* ) ≡ UYY (x,Y *)dF(x) p 0∫
Let us now place the expected utility framework in terms of a principal-agentinvestment framework. Figure 5 illustrates the risk-return relationship for a principal-agentdecision. In a static environment, investment alternatives are rank ordered according to twocriteria: the expected rate of return and the underlying degree of risk. R1 represents the setof investment alternatives at time t that yield the same expected rate of return. Its convexityis a positive function of the degree of relative risk among all investment alternatives.

- 14 -
Figure 5
Agent(firms)
Principal(banks)
A
B
R1
'
'
The opportunity cost of capital defines a constraint, ρρ, which embodies the prevailingdegree of institutional risk. In a world of symmetric information, the slope of the riskconstraint will be 45 degrees, and the optimal investment mix will be that which maximizesthe expected rate of return for the prevailing degree of institutional risk, shown here at pointA, with iso-risk levels of ρ1 and ρ1, respectively, for both principal and agent.
Along ρρ, any other combination will involve not only an assymetric distribution of riskbut also a lower expected rate of return.
When contracting is implicit, as in the provision of continuing credit to borrowers,principals and agents may share differing degrees of risk, based on the level of guaranteesthat may be put in place. An agent who perceives that losses will be covered in the event ofdefault, thus perceives the prevailing degree of risk to be along the ρ’ρ’ line rather than
along ρρ. In this case, with a lower degree of risk, an agent will be indifferent betweenchoices A and B, and will be willing to adopt B since losses are covered by guarantees.
Under a regime of implicit contracting, the principal, however, does not perceive B tobe risker than A since both A and B carry the same expected rate of return. For theunwitting principal, ρ2 represents a relatively higher level of risk, while for the agent, it isrelatively lower under the implicit set of guarantees. In effect, the agent is adopting a levelof moral hazard that would not be sustainable in the presence of transparent accountingpractices.

- 15 -
Although Figure 5 represents one level of moral hazard, we add that there can beseveral layers operating at once. For example, while firms may adopt morally hazardousbehavior, financial guarantees are what makes it possible for banks to adopt an assymetriclevel of risk. Why would banks do so? The answer is that they in turn adopt morallyhazardous behavior because government makes an implicit guarantee to them for the loansthat they make. In turn, when foreign capital inflows expand into the financial system,local financial institutions, and by extension, local governments, often extend implicitguarantees on the repatriation of capital such that the chain of moral hazard is extendedfurther. The temporal and spatial extension of moral hazard in one market will continueacross markets up to the point where transparency becomes sufficient where conditions canno longer be sustained.
To return to our primary example in figure 5, banks make lending choices partly on thevalue of collateralized assets. Collateral serves as the principal means of getting agencycompliance, since they serve as insurance in the event of default. Two considerations affectthe extent to which any such lending pattern will be efficient. First, the higher the collateralrequirements, the lower will be the level of lending, since borrowers will not commitcollateral more than the equivalent underlying degree of risk that they confront. In terms ofFigure 5, this means that borrowing with collateral requirements serves to return agencyborrowing to levels consistent with the base level position A, but not completely as long asthe marginal cost of collateral exceeds the expected rate of return and as long as theprincipal provides implicit loan guarantees.
The second consideration is the extent to which collateral assets are traded in efficientmarkets. If the range of assets is limited by institutional considerations, then banks maydevelop excess reliance on a limited number of assets such as real estate. Real estate valuesthus become subject to a speculative bubble, which in turn artificially expands a principal’sexcess reserve ratio. When real estate values are increased further with periodicinternational capital inflows, banks principals expand their lending accordingly. Eventually,the speculative bubble in real estate collapses, thus creating a liquidity crisis in banking,which eventually generates a credit shortfall, thus leading to a rise in insolvency amongbanks and agency firms.
What makes possible the magnitude of a crisis is that implicit guarantees do notprovide any market signals until the level of risk has reached the limits of default.Transparent accounting rules and the provision of contingent pricing of assets would haveprovided earlier warning signals of an imbalance in the degree and distribution of riskbearing between agent and principal, and adjustments in portfolios would have occurredmuch earlier in the process.
Although hindsight is always perfect, let us extend the principal-agent framework toincorporate the impact of asset bubbles that eventually lead to collapse. We do so in termsof a simple model of asset bubbles.12 Given some positive level of risk tolerance by anagent, with future utility discounted at a constant rate, r, assets would have a constantexpected real return in equilibrium. The price of asset share, qt, which is the opportunitycost of the asset, equals the expected discounted present value of the return accruing toownership of the asset during the ownership period, dt+1, plus the price at which the sharecan be sold at the end of the ownership period, qt+1. The benefits of asset ownership thusare defined as:
12 Much of this formulation is adapted from Robert P. Flood and Robert J.Hodrick, “On Testing forSpeculative Bubbles,” Journal of Economic Perspectives 4(2), Spring 1990, pp. 85-101.

- 16 -
(4) qt = Et (dt +1 + qt+1 )/(1 + r) ,
where:Et (dt +1 + qt +1 ) represents the expected value of the future gain and the futureprice conditional on information available to people at time t.
From equation (4), one can derive the optimal pricing formula by a recursive process.To do so, update equation (4) by one time period and substitute the resulting expression forqt+1 into the original equation. This yields:
(5) qt = Et dt +1 + Et +1(dt + 2 + qt + 2)/(1 + r)[ ] /(1 + r ) .
From this substitution, one can update equation (4) again, and substitute for qt+2 in equation(5). From this process, one derives an expression for future expectations,Et (Et +1(dt +2 )) = Et (dt + 2) ) , which states that the expected value today of what one expects inthe future when more information becomes available. Equivalently, this expression statesthat what we expect about the future today minus the information available tomorrow.
If one extends the substitution process to infinity, the current price then equals theexpected present value of all future returns:
(6) qtf = 1/(1 + r)[ ]
i=1
∞
∑i
Et (dt +i )
Equation (6) defines the market fundamentals price in that over an infinite time horizon, thediscounted value of the price is zero. This expression also determines the basis of defininga speculative bubble.
If one assumes that expectations are rational, a speculative bubble represents a value ofan asset that deviates above the underlying market fundamental price.13 The bubble, Bt,can be factored into equation (6) as:
(7) qt = qtf + Bt .
If the market price in equation (7) is to satisfy the condition in equation (4), then the currentvalue of the bubble must equal the expected discounted value of the future bubble in thenext time period:
(8) Bt = Et (Bt +1) )/(1 + r)
Equation (8) states that a bubble can be possible as long as the bubble represents anexpectation that the bubble will continue. If we restate equation (8) for time t+1 we have:
(9) Bt +1 = Bt (1 + r) + bt +1, where: bt +1 = Bt +1 − Et (Bt +1 )
If bubbles exist, equation (9) implies that they will grow at the real rate of interest.
13 Behzad Diba and Herschel Grossman, “On the Inception of Rational Bubbles,” Quarterly Journal ofEconomics, 102, August 1987, 697-700, note that rational expectations rules out negative bubble values.Note that estimation of the fundamental price becomes critical in direct proportion to the length of theunderlying time horizon.

- 17 -
William Brock (1982) made the common sense observation that since economic agentsdo not adopt infinite time horizons for investment decisions, then rational bubbles can notexist.14 As a counterfactual proposition, if a representative agent were to adopt an infinitetime horizon, buying the asset and holding it forever would generate a marginal gain at timet equal to the expected discounted value of all future returns, which is the marketfundamentals price. If the actual price were less than the fundamentals price, arepresentative agent could increase utility by buying the asset and planning to hold itforever. This increased in demand would increase the market price, thus eliminating thebubble. In contrast, if the price of the asset exceeded the market fundamental price, anagent should sell the asset because the utility gain would exceed the utility lost fromexpecting to hold it forever. This decrease in demand would cause the market price to fall.
Tests for bubbles have been done for various assets, notably, money (Flood andGarber, 1980), and equities (Shiller, 1981, Grossman and Schiller, 1981, Romer andShapiro, 1985, West, 1987).15 Following Flood and Garber, we can state an asset bubbletest as:
(10) m t − pt = − Et (pt +1) − pt[ ] + vt ,
where the left hand side represents the logarithm of the value of the real asset in whichmt is the nominal value and pt is the price level at time t. The right-hand side states that thedemand for real assets deviates from a constant level β when there is expected inflation,which decreases the nominal demand for the asset when other determinants in the randomerror term change. The parameter α measures the sensitivity of the demand for the assetwith respect to expectations of inflation.
To obtain a market fundamentals solution one solves equation (10) for pt. In turn, onecan define the increase in asset value at time t as kt = (mt − − vt )/(1 + ). The present worthfactor can be defined from equation (7) as /(1 + ) . The fundamental solution to equation(10) thus becomes:
(11) ptf = /(1 + )[ ]
i= 0
∞
∑i
Et (kt +1 )
The price level at any given time is determined by discounted expected values offactors affecting the supply of the asset relative to the demand. Following Flood andGarber (1980), we can restate a test for rational bubbles as:
(12) pt − pt −1 = 0 + 1 t −1 + ... + k t −k + 0 1 + (1/ )[ ]t + t ,
where µt is the asset growth rate and νt=νt-1 + εt. .
14 William Brock, “Money and Growth: The Cae of Long-run Perfect Foresight,” International EconomicReview, October 1974, 15, 750-777.15 Robert Shiller, “Do Stock Prices Move By Too Much to be Justified by Subsequent Changes inDividends?” American Economic Review, 71, June 1981, pp. 421-36; Sanford Grossman and RobertShiller, “The Determinants of the Variability of Stock Market Prices,” American Economic Review, 71,May 1981, pp. 222-27; Kenneth West, “A Specification Test for Speculative Bubbles,” Quarterly Journalof Economics, 101, August 1987, pp. 553-580.

- 18 -
The problem with most models of asset bubbles is that they do not provide a clearbasis of why bubbles exist. As Flood and Hodrick also noted, most models are based ondeterministic processes, and they do not satisfy the conditions for an asymptoticdistribution characteristic of classical econometric tests. This latter problem is found in thefact that regressor values become explosive. An exploding regressor means that any timeseries sample is always a small sample, and thus do not satisfy the standard central limittheorems. Such models thus represent first approximations of bubble tests. What ismissing is an institutional constraint in the form of asset choices, and which becomescentral to understanding East Asia’s financial crisis.
Let us now consider a principal-agent model of the financial system. This system canoperate either with implicit or explicit guarantees in the form of reserve funding to satisfycreditors in the event of a liquidity crunch. To the extent that these guarantees are implicitrather than explicit means that there is not a periodic market valuation of asset values thatdrive lending patterns in the financial system, and which seems to have been widespread ina number of East Asian economies. When agents borrow funds with implicit guarantees,they adopt a higher level of risk than they would in the absence of such implicit guarantees.To this picture, we now add the question of asset diversification.
In many East Asian economies, because equity markets have emerged relativelyrecently, asset lending collateral has been biased in favor of real estate. Banks would lendmoney on the basis of perceived values of real estate, and, it appears, somewhatindependent of underlying trends. In turn real estate values were driven by a speculativebubble process that exaggerated the lending capacity of the banking system. As creditbecame more readily available, borrowing agents undertook investments with higherrelative risk, and banks were willing to make these loans on the basis of implicit guaranteesof repayment by governments in the event of defaults. What helped to produce the crisiswas the very economic liberalization that these countries undertook in support of export-driven growth. When equity markets provided an alternative investment asset to real estate,real estate values adjusted to an underlying fundamental price level, which in turnprecipitated a credit shortfall in the banking system. As banks adjusted their reserve ratiosto the lower value of real estate assets, firms that had undertaken riskier investments foundthat they no longer had access to credit at previous rates.
One might ask why a real estate bubble did not show up in East Asian inflation rates ata level that would have warranted earlier intervention by central banks. The answer is thatif asset choices were relatively limited to real estate, then this represents but one componentin the overall price index, even though it may be a crucial one to the determination ofbanking lending practices. To the extent that there is an inverse relationship between thechoice of collateral assets in lending and components in an overall price index, then there isno obvious linkage between the underlying degree of risk and the prevailing rate ofinflation.
- 19 -
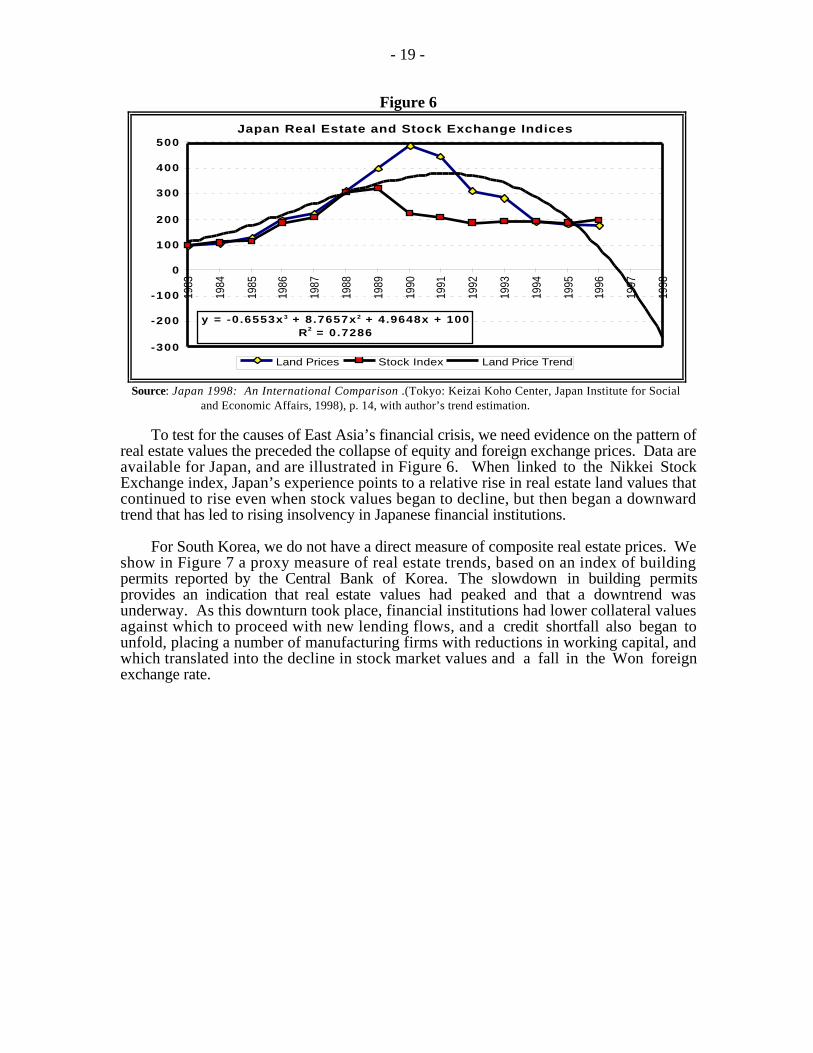
Figure 6
Japan Real Estate and Stock Exchange Indices
y = -0.6553x 3 + 8.7657x 2 + 4.9648x + 100R2 = 0.7286
-300
-200
-100
0
100
200
300
400
500
1983
1984
1985
1986
1987
1988
1989
1990
1991
1992
1993
1994
1995
1996
1997
1998
Land Prices Stock Index Land Price Trend
Source: Japan 1998: An International Comparison .(Tokyo: Keizai Koho Center, Japan Institute for Social and Economic Affairs, 1998), p. 14, with author’s trend estimation.
To test for the causes of East Asia’s financial crisis, we need evidence on the pattern ofreal estate values the preceded the collapse of equity and foreign exchange prices. Data areavailable for Japan, and are illustrated in Figure 6. When linked to the Nikkei StockExchange index, Japan’s experience points to a relative rise in real estate land values thatcontinued to rise even when stock values began to decline, but then began a downwardtrend that has led to rising insolvency in Japanese financial institutions.
For South Korea, we do not have a direct measure of composite real estate prices. Weshow in Figure 7 a proxy measure of real estate trends, based on an index of buildingpermits reported by the Central Bank of Korea. The slowdown in building permitsprovides an indication that real estate values had peaked and that a downtrend wasunderway. As this downturn took place, financial institutions had lower collateral valuesagainst which to proceed with new lending flows, and a credit shortfall also began tounfold, placing a number of manufacturing firms with reductions in working capital, andwhich translated into the decline in stock market values and a fall in the Won foreignexchange rate.

- 20 -
Figure 7
South Korea Building Permit Index
y = -0.2562x 3 + 6.7421x 2 - 19.797x + 100R2 = 0.9396
0
50
100
150
200
250
300
350
400
450
500
1980
1981
1982
1983
1984
1985
1986
1987
1988
1989
1990
1991
1992
1993
1994
1995
1996
1997
1998
Actual Building Permit Trend
Source: Central Bank of Korea, Economic Indicators.
Data for Indonesian real estate composite prices also have not been readily available.We report here a proxy measure, using the price of housing relative to the compositeinflation rate of 27 provincial capital cities. While this measure does not show a real estateprice bubble and collapse, it does indicate that the relative price of housing began to declineseveral years before the financial crisis of 1997, and this may have contributed to therelative decline in real estate collateral leading to Indonesia’s financial crisis.
Figure 8
Indonesia Housing Relative Inflation Rate
0.00
0 .20
0 .40
0 .60
0 .80
1 .00
1 .20
1 .40
1 .60
1986
1987
1988
1989
1990
1991
1992
1993
1994
1995
1996
1997
1998
Actual Estimated
Y = -82422.26 -0.0208t+82.7726t 2
R2=0.5340
Source: Government of Indonesia, Economic Statistics Bureau.
Indian Economic Reforms In PerspectiveUnlike most of the East Asian countries we have examined, India, like China, seems
to have avoided a sharp downturn in its financial and foreign exchange markets. There arefour key reasons why this has been so. First, India has thus far relied less on export drivengrowth than have the East Asian tiger economies. Second, India has pursued domestic

- 21 -
monetary and fiscal policies with a lower growth trajectory than for the most affectedcountries in East Asia. Third, India has had a far smaller share of foreign investment thanin some of the more affected East Asian economies. And Finally, India has a moretransparent system of accounting practices in comparison to its East Asian neighbors,though not on a level with West European or North American standards. While none ofthese factors alone or in combination with others precludes the kind of asymmetric decisionproblem we have put forth to explain East Asia’s crisis, as economic reforms in East Asiaunfold, these factors do hold policy lessons for India as the process of economicliberalization moves forward.
Let us look briefly at each of the four factors that distinguish India’s economic policiesfrom those of its East Asian neighbors.
Optimal TransparencyIf East Asia’s financial crisis has been driven by agency problems, the question is
what kinds of institutional reforms can be implemented to prevent a repeat of the events of1997. The short answer is that greater transparency in institutional accounting will lead tomarket signals that enable agents to undertake corrective action before a crisis unfolds.Implementation of bank and firm accounting standards similar to those found elsewhere inthe world is one example. In addition, while greater transparency in accounting may be anecessary step, another is to open financial markets to greater competition, and to allow thecreation and operation of financial products to improve the efficiency of markets.
Opening financial markets means not just allowing greater foreign capital inflows,which has already been the case in many East Asian economies, but rather options formultinational ownership. To do so would represent a major change in ownership policiesin many East Asian economies, and it may be a sufficient basis for improving marketefficiency. However, what is necessary is that regardless of ownership, unless marketsignals can bring about a reduction in the presence of moral hazard, the prospects for arenewed financial crisis will still be in place.
One way to address the issue of moral hazard is in terms of optimal transparency. Wecan think of any increase in the level of information as improving the estimate of theunderlying degree of risk in any investment decision. Increases in the level of informationcan be determined by the quantity of information that is generated at a given moment intime, and by the frequency with which it is disseminated for decisions by economic agents.Both measures involve transactions costs and since the marginal cost of perfect informationapproaches infinity, there will be a natural upper limit as to how much and how frequentlyinformation needs to be generated in order to reduce the level of moral hazard.
Policy Implications Several policy implications derive from the framework presented here. First is that tothe extent that markets continue to function on implicit guarantees, the absence of markettesting will not provide the necessary periodic valuation that can enable economic agents tomake rational choices. It is instructive to note that depositor insurance may actually increaserather than reduce the problem of moral hazard.16 A prudent approach would be to adopt asliding scale of depositor insurance, with higher levels of deposits more subject to theunderlying level of market risk.
Second, one way to avoid speculative bubbles and the problem of moral hazard is toincrease the range of asset choices to the financial system. This means the adoption of 16 Deposit insurance coverage levels were an important factor in the savings and loan institution financialcrisis in the United States, where a similar problem of moral hazard arose.
- 22 -
mechanisms to strengthen rather than to reduce the efficiency of East Asia’s equity markets.To do so also implies increasing the range of pricing options, including a richer array offutures and options contracts. As these products become available, they provide importantsignals to agents throughout the economy, and can help to guide monetary policy even inthe presence of nominal inflation rates.
Third, greater transparency in accounting practices also is an important condition forthe efficient operation of equity markets. As long as independent auditing practices can besustained, the issue will turn less on the prevailing degree of cronyism than on howinstitutional assets are periodically re-valued to reflect underlying economic conditions.
What about the role of international capital inflows? To the extent that they havemagnified the level of East Asia’s financial crisis, some have called for expanded regulationas a means of control.17 Regulation could include measures to stem excessive capitalmovements, while at the same time establishing incentives at the local banking level toadopt reasonable risk averse measures in the management of local and foreign exchangemovements. The assumption behind such regulations is that adoption of universaltransparency rules is not likely to happen overnight or automatically and there is a need toconsider interim solutions along the path of financial market rules harmonization. Thepractical basis for considering such proposals can be seen in terms of the fact that SouthKorea, Indonesia, Thailand, Malaysia and the Philippines received $93 billion in privatecapital inflows in 1996, and an outflow of $12 billion in 1997. This $105 billion in oneyear represented the equivalent of 11 percent of their combined GDP.18
As the events in East Asia have made clear, what was once viewed as a group of“Asian Tiger” economies now seems threatened, much as the species after which they havebeen named. This does not mean that the fundamentals of East Asia’s growth potential havedisappeared. What it does suggest is that there is a value to avoiding future financial crisesand that the key to doing so is to adopt the kind of transparent practices and flexible assetchoices put forth here. Since other countries have adopted similar open practices, there isevery reason to expect that East Asian countries eventually will do likewise.
17 Joseph Stiglitz, “Boats, Planes and Capital Flows”, The Financial Times, March 25, 1998, p. 14.Stiglitz, who is chief economist at the World Bank, proposes the elimination of tax, regulatory and policydistortions that lead to excessive capital inflows. In addition, he argues for the adoption of bank regulationsto limit local bank currency exposure, notably incentives to induce a prudent mix of short and long-termdebt obligations that could reduce both currency and bank earnings fluctuations. Further, he suggests thatone should consider limits on the extent of tax deductibility for interest in debt denominated or linked toforeign currencies. 18 The Perils of Global Capital,” The Economist, April 11, 1998, p. 52.

Bibliography
Aoki, Masahiko, 1990. “Toward an Economic Model of the Japanese Firm.” Journal ofEconomic Literature, 28, number 1: 1-27.
Barzel, Yoram, 1982. “Measurement Cost and the Organization of Markets.” Journal ofLaw and Economics 25, no. 1: 27-48.
Barzel, Yoram, 1997. Economic Analysis of Property Rights, second edition. Cambridge,U.K: Cambridge University Press.
Coase, Ronald, 1937. “The Nature of the Firm.” Economica 4, no. 3: 386-405.Dyer, Jeffrey H. and Ouchi, William G., 1993 “Japanese-Style Partnerships: Giving
Companies a Competitive Edge.” Sloan Management Review 35, number 1: 51-63.Frankel, Allen B. and Morgan, Paul B., 1992. “Deregulation and Competition in Japanese
Banking.” Federal Reserve Bulletin 78, number 8: 579-93.French, Kenneth R. and Poterba, James M., 1991. “Were Japanese Stock Prices Too
High?” Journal of Financial Economics 68, number 3: 333-63.Holmstrom, Bengt and Paul Milgrom, 1994. “The Firm as an Incentive Systems.“
American Economic Review 84, number 4: 972-91.Hoshi, Takeo; Kashyap, Anil; and Scharfstein, David, 1990. “The Role of Banks in
Reducing the Costs of Financial Distress in Japan.” Journal of Financial Economics27, number 1: 67-88.
Hoshi, Takeo; Scharfstein, David; and Singln, Kenneth J., 1993. “Japanese CorporateInvestment and Bank of Japan Guidance of Commercial Bank Lending,” in Kenneth J.Singleton, editor, Japanese Monetary Policy. Chicago: University of Chicago Press,1993.
Klein, Benjamin and Leffler, Keith B., 1981. “The Role of Market Forces in AssuringContractual Performance.” Journal of Political Economy 89, number 4: 615-41.
Krueger, Anne O., 1974 “The Political Economy of the Rent-Seeking Society.” AmericanEconomic Review 66, no. 3: 291-303.
Monteverde, Kirk and Teece, David J., 1982 “Supplier Switching Costs and VerticalIntegration in the Automobile Industry.” Bell Journal of Economics 13, number 1:206-13.
Milgrom, Paul, and John Roberts, 1990. “The Economics of Modern Manufacturing:TechnologyStrategy and Organization.” American Economic Review 890, no. 3: 511-28.
Peek, Joe and Eric S. Rosengren, 1997. “The International Transmission of FinancialShocks: The Case of Japan.” American Economic Review 87, no. 4: 495-505.
Ross, Stephen A., 1973. “The Economic Theory of Agency: The Principal’s Problem”American Economic Review 63, no. 2: 134-39.
Samuel, Cherian, 1998. “Forms of Ownership and Liquidity Constraints: The IndianEvidence.” Working paper presented at the ASSA annual meeting, Chicago, Illinois,January 3-5, 1998.
Schonberger, Richard, 1982. Japanese Manufacturing Techniques. New York: The FreePress.
Sinha, Tapen and Jayavel Sounderpandian, 1997. Pride and Prejudice: A Political Theoryof Links between the Nominal Exchange Rates of Indian and Pakistani Currencies.”Working paper presented at the ASSA annual meeting, Chicago, Illinois, January 3-5,1998.
Slovin, Myron B.: Sushka, Marie E.; and Polonchek, John A., 1993 “The Value of BankDurability: Borrowers as Bank Stakeholders.” Journal of Finance 48, number 1:247-66.
Spence, A. Michael, 1973l “Job Market Signaling.” Quarterly Journal of Economics 87,no. 4: 355-79.

- 24 -
Taylor, Curtis R. and Steven N. Wiggins, 1997. “Competition of Compensation:Supplier Incentives Under the American and Japanese Subcontracting Systems.”American Economic Review 87, number 4: 598-618.
Waghmare, Tushar and Subir Gokarn, 1998. “Entry Conditions and Price Behavior ofInitial Public Offerings: A Study of the Indian Primary Market 1990 to 1995.”Working paper presented at the ASSA annual meeting, Chicago, Illinois, January 3-5,1998.
Williamson, Oliver. Markets and Hierarchies: Analysis and Antitrust Implications.(New York: The Free Press, 1975).