Embed Size (px)
Citation preview
Graduate Theses and Dissertations Iowa State University Capstones, Theses andDissertations
2016
Understanding customer perception of restaurantinnovativeness and customer value co-creationbehaviorEojina KimIowa State University
Follow this and additional works at: https://lib.dr.iastate.edu/etd
Part of the Advertising and Promotion Management Commons, Business Administration,Management, and Operations Commons, Management Sciences and Quantitative MethodsCommons, and the Marketing Commons
This Dissertation is brought to you for free and open access by the Iowa State University Capstones, Theses and Dissertations at Iowa State UniversityDigital Repository. It has been accepted for inclusion in Graduate Theses and Dissertations by an authorized administrator of Iowa State UniversityDigital Repository. For more information, please contact [email protected].
Recommended CitationKim, Eojina, "Understanding customer perception of restaurant innovativeness and customer value co-creation behavior" (2016).Graduate Theses and Dissertations. 15006.https://lib.dr.iastate.edu/etd/15006
Understanding customer perception of restaurant innovativeness and
customer value co-creation behavior
by
Eojina Kim
A dissertation submitted to the graduate faculty
in partial fulfillment of the requirements for the degree of
DOCTOR OF PHILOSOPHY
Major: Hospitality Management
Program of Study Committee: Robert Bosselman, Co-Major Professor
Rebecca (Liang) Tang, Co-Major Professor Russell N. Laczniak
Stephen G. Sapp Eric D. Olson
Iowa State University
Ames, Iowa
2016
Copyright © Eojina Kim, 2016. All rights reserved.
ii
TABLE OF CONTENTS
Page
LIST OF FIGURES ................................................................................................... iv
LIST OF TABLES ..................................................................................................... v
NOMENCLATURE .................................................................................................. vii
ACKNOWLEDGMENTS ......................................................................................... viii
ABSTRACT………………………………. .............................................................. vi
CHAPTER 1 INTRODUCTION .......................................................................... 1
CHAPTER 2 LITERATURE REVIEW AND HYPOTHESES DEVELOPMENT ........................................................................... 14
Research of Service-Dominant Logic and Value Co-Creation ............................ 14 Customer Value Co-Creation Behavior Research ............................................... 20 Relationship Between Customer Value Co-Creation and Other Constructs ....... 29 Antecedents of Customer Value Co-Creation Research of Perceived Innovativeness from Customer perspective ......................................................... 30 Relationship Between Perceived Innovativeness and Customer Value Co-Creation Behavior ............................................................... 38 Consequences of Customer Value Co-Creation .................................................. 40 Research Framework and Hypotheses ................................................................. 47
CHAPTER 3 METHODS ..................................................................................... 49
Use of Human Subjects ........................................................................................ 50 Phase 1: Scale Development and Preliminary Assessment ................................. 52 Study 1: Scale Development for CPRI: Theme Identification and Item Generation ..................................................................................... 52 Study 2: Preliminary Assessment: Scale Purification and Refinement ............... 56 Phase 2: Scale Validation and Research Model Test ........................................... 59 Study 3: Scale Validation & Research Model and Hypotheses Test ................... 59 CHAPTER 4 RESULTS ....................................................................................... 67
Phase 1: Scale Development and Preliminary Assessment ................................. 67
iii
Study 1: Scale Development for CPRI: Theme Identification and Item Generation ..................................................................................... 67 Study 2: Preliminary Assessment: Scale Purification and Refinement ............... 74 Phase 2: Scale Validation and Research Model Test ........................................... 74 Study 3: Scale Validation & Research Model and Hypotheses Test ................... 84
CHAPTER 5 DISCUSSION ................................................................................. 107
Discussion of Results ........................................................................................... 107 Implications.......................................................................................................... 113 Limitations and Future Research Directions ........................................................ 123
REFERENCES .......................................................................................................... 126
APPENDIX A HUMAN SUBJECT INSTITIONAL REVIEW BOARD APPROVAL ........................................................................................................... 146
APPENDIX B COVER LETTER AND QUESTIONNAIRE FOR STUDY 2 ...... 147
APPENDIX C COVER LETTER AND QUESTIONNAIRE FOR STUDY 3 ...... 156
iv
LIST OF FIGURES
Page Figure 2.1. The conceptual model.............................................................................. 48 Figure 3.1. Research Process ..................................................................................... 51 Figure 4.1. Word cloud regarding innovative restaurants .......................................... 68 Figure 4.2. Number of coding references using NVivo ............................................. 69 Figure 4.3. Model 1: One first-order factor model .................................................... 94
Figure 4.4. Model 2: Four first-order factor model without correlation .................... 95
Figure 4.5. Model 3: Four first-order factor model with correlation ......................... 96
Figure 4.6. Model 4: One second-factor model with four first-order factors ............ 97
Figure 4.7. Structural path model with parameter estimates ..................................... 101
v
LIST OF TABLES
Page
Table 2.1. Foundational premises of service-dominant logic .................................... 17
Table 2.2. Summary of service-dominant logic research in the hospitality and tourism literature .................................................... 19
Table 2.3. Customer value co-creation behavior in the literature .............................. 23
Table 2.4. Definitions of firm innovativeness and consumer innovativeness ........... 32
Table 2.5. Summary of innovativeness research in hospitality literature .................. 35
Table 2.6. Summary of empirical research in satisfaction ......................................... 41
Table 2.7. Summary of empirical research in loyalty dimensions ............................. 43
Table 2.8. The consequences of customer satisfaction .............................................. 46
Table 3.1. Measurement items for customer value co-creation behavior .................. 61
Table 4.1. Themes of customer perception of restaurant innovativeness .................. 69
Table 4.2. Initial pool of items for customer perception of restaurant innovativeness (42 items) ......................................................... 71
Table 4.3. Proposed pool of scales for customer perception of restaurant innovativeness (26 items) ......................................................... 73
Table 4.4. Description of the respondents (Study 2: n = 1,465) ................................ 75
Table 4.5. Exploratory factor analysis results for initial measurement items for CPRI (Study 2) .................................................................................... 79
Table 4.6. Exploratory factor analysis results after purification for CPRI (Study 2) .................................................................................... 81
Table 4.7. Exploratory factor analysis results for CVCB (Study 2) .......................... 83
Table 4.8. Description of the respondents (Study 3: n = 514) ................................... 86
Table 4.9. Reliability and convergent validity properties .......................................... 90
vi
Table 4.10. Squared correlations matrix among the latent constructs ....................... 92
Table 4.11. Alternative measurement models of CPRI ............................................. 98
Table 4.12. Standardized parameter estimates ........................................................... 100
Table 4.13. Total effect, direct effect and indirect effect: CPB and CCB as a mediating variable ............................................................................... 104
Table 4.14. Total effect, direct effect and indirect effect: CS as a mediating variable ............................................................................... 106
vii
NOMENCLATURE
S-D Logic Service-Dominant Logic
CPRI Customer Perception of Restaurant Innovativeness
CVCB Customer Value Co-Creation Behavior
CPB Customer Participation Behavior
CCB Customer Citizenship Behavior
CS Customer Satisfaction
CCB Customer Conative Behavior
viii
ACKNOWLEDGMENTS
It would have not been possible for me to finish the Ph.D. program without the
ongoing support of my committee members, family, co-workers, and friends. First and
foremost, and I wish to express my sincere gratitude to Dr. Robert Bosselman and Dr.
Rebecca (Liang) Tang who supervised my Doctorate, for their intellectual support,
encouragement and scientific insight throughout my academic study. I hope to emulate their
work ethic and dedication to the academic discipline in my own professional life.
I also wish to thank all of my committee members, Dr. Russell Laczniak, Dr. Stephen
Sapp, and Dr. Eric Olson, for their valuable time and remarkable insights. They encouraged
me in my work, provided me with many details and tireless advice in the completion of my
dissertation, and my academic development as well.
Finally, I would like to dedicate this dissertation to my wonderful, loving family: my
father, my mother, my brothers, Hana & Boram, my sister-in-law, Sunyoung, and my only
niece, Sunha. As always, my family has been there for me, providing all sorts of tangible and
intangible support. Their underlying unconditional love and support provided a foundation
during my collegiate career and beyond. I want to especially mention my father who is in
heaven now. My father passed away while I was working on my Ph.D., and it was a difficult
time. I would not have been able to complete my Ph.D. without my family’s emotional
support. My parents have assisted me in innumerable ways; whatever I might say here cannot
do full justice to the extent and the value of their contributions.
Last, a very special acknowledgement to my life partner, Bryan Cheng, for his love,
care, and sacrifice through my journey.
Thanks to all.
ix
ABSTRACT
Foodservice businesses delight customers and engage them as collaborators in the
value creation process by creating and maximizing value through the satisfactory delivery of
products and services. While the role of the customer in value creation has become a key
concept in service marketing, questions remain for supporting customer value creation,
techniques of firm innovativeness to affect the customer’s value creation behavior, and the
mechanism for integrating customers into the co-creation processes.
The primary purpose of this study is to examine the role of customer value co-
creation behavior at casual dining restaurants. To achieve this goal, the study applies
conceptual Service-Dominant logic emphasizing the role of customer co-creation behavior.
In addition to this important behavioral role, the study investigates the potential antecedents
(i.e., customer perception of restaurant innovativeness) of customer co-creation behavior and
its consequences (i.e., customer satisfaction and customer conative loyalty).
First, the present study aims to identify customer perceptions underlying restaurant
innovativeness and to develop a set of innovativeness scales useful to the foodservice
industry. Study 1 analyzes qualitative data from 47 written interviews, using NVivo, and the
26-item customer perception of restaurant innovativeness (CPRI) scale with four dimensions
was purified. In Study 2, exploratory factor analysis using students’ data (n = 1,465) purified
and refined scales. Study 3 (n = 514), using confirmatory factor analysis, provides empirical
support for construct validity of the CPRI scale of the one-factor second-order with four
constructs model, embracing menu innovativeness, technology related service
innovativeness- experience related service innovativeness, and promotion innovativeness.
x
Therefore, CPRI scales successfully capture aggregate restaurant innovativeness from a
customer perspective and deliver a contextually insightful conceptualization of customer
perception of innovativeness within a foodservice context.
Second, the present study aims to validate customer value co-creation behavior
(CVCB) and evaluate the applicability of the scale in a foodservice context. Study 2 (n =
1,465) provides empirical support for the eight dimensions of CVCB by exploring the
possible underlying structure of a set of 29 scales. Study 3 (n = 514) demonstrates construct
validity of the four dimensions of each customer participation behavior (CPB) and customer
citizenship behavior (CCB) underlying the CVCB construct. This study assesses two
dimensions, CPB and CCB with four factors, respectively, to capture customer value co-
creation behavior. Customer participation behavior embraces information seeking,
information sharing, responsible behavior, and personal interaction. Similarly, customer
citizenship behavior comprises feedback, advocacy, helping, and tolerance. Thus, CVCB
scales successfully capture customer value co-creation using two distinct constructs: CPB
and CCB, and delivers contextually insightful conceptualizations of customer behavior in
creating value in a foodservice context.
Last, Study 3 (n = 514) tests the conceptual research model that delineates the
relationship between restaurant innovativeness, customer value co-creation behavior,
customer satisfaction, and customer conative loyalty. In sum, restaurant innovativeness
increases customer satisfaction through customer value creation behavior. This study
empirically confirms the relationship among latent variables underlying conceptual
framework: linking customer value co-creation behavior to its antecedent (i.e., CPRI) and
consequences (i.e., customer satisfaction and customer conative loyalty).
xi
Understanding customer behavior in the co-creation process is critical regardless of
the type of industry, since service-dominant logic has emerged as a pervasive phenomenon in
business domains. This study confirms a holistic concept of innovativeness as the key
predictor of customer value co-creation behavior, which in turn leads to customer satisfaction
and conative loyalty. This study is meaningful to academically evolving innovativeness and
value co-creation research and benefits the foodservice industry by offering implications for
establishing effective marketing strategies to improve customer perceptions of restaurant
innovativeness and to create value with customers.
1
CHAPTER 1
INTRODUCTION
Statement of the Problem
The primary goal of any business entity is to delight customers by creating and
maximizing value through satisfactory delivery of products and service. This goal leads to
customer satisfaction and loyalty: an essential attribute of business performance. Consequently,
understanding techniques for creating value from a customer-centric perspective and avenues for
developing customers’ willingness to become involved in the value creation process is critical.
Interaction between customers and firms creates value (Vargo & Lusch, 2004; 2008a;
2008b). In the value co-creation process, customers and employees create value together, with
customers primarily in charge of the entire creation of value in a co-creator process (Grönroos &
Ravald, 2011). Thus, successful value co-creation between customers and firms is a critical
indicator of firm performance (Yi, 2014). The notion of value co-creation in emerging businesses
has garnered attention (Vargo &Lusch 2004; 2008a). Service-Dominant logic (S-D logic), as a
marketing and innovation paradigm, has highlighted value co-creation. Therefore, academic
researchers as well as practitioners recognize the need to discover the drivers or mechanisms for
customer value co-creation behavior and the consequences; thus, developing strategies to
enhance customers’ behavior for formation of value creation becomes possible.
The most prominent current issue emerging in the business market is the customer’s vital
role when working with firms to create value together (Vargo & Lusch 2004, 2008a). Most
research studies on value creation focused exclusively on employees rather than customers (Yi,
2
2014), despite the fact that both customers and employees play critical roles in a value creation
process. A few research studies (e.g., Yi & Gong, 2013) investigated customers’ active roles in
value-creation processes. During the past several decades, researchers in marketing and
management disciplines focused on customers’ behavior from a psychological perspective while
investigating customers’ decision-making processes. Customary consideration attributes
passivity to customers rather than as active individuals in an effort to explain psychological
mechanism (Yi, 2014). However, contemporary researchers asserted that customers are active
partners rather than passive respondents, and that firms serve as facilitators in the process of
value creation (e.g., Payne, Storbacka, & Frow, 2008; Vargo & Lusch, 2004). Therefore,
researchers must focus on customers’ actual behavior rather than consequential purchasing
behavior during the process of value co-creation (Xie, Bagozzi, & Troye, 2008). Few studies
have systematically examined customer value-creation behavior from theoretical and empirical
perspectives, despite the behavior’s importance in service-marketing research (Yi, 2014).
Need for innovative research in the service industry from a customer’s perspective
Innovation has broad acceptance as a key component in competitive business
environments at both national and company levels (Organisation for Economic and Cooperative
Development (OECD), 2012). Capability for innovation provides a strong foundation for
businesses to attain a competitive advantage in the marketplace (Barney, 1991; Day, 1994).
Previous studies predominantly investigated high-technology and manufacturing industries rather
than service industries despite the acknowledged significance of innovativeness in all types of
business (Ettlie & Rosenthal, 2011; Hogan, Soutar, McColl-Kennedy, & Sweeney, 2011). Hipp
and Grupp (2005, p. 517) asserted that despite establishing the notion of innovation in the
3
manufacturing sector, simple transposition into the service sector is inappropriate. An
understanding of the role of innovation in the hospitality industry has advanced very little (e.g.,
Ariffin & Aziz, 2012; Nasution & Mavondo, 2008), although a number of recent studies
addressed the importance of service innovation (e.g., Agarwal & Selen, 2009; Arnold, Fang, &
Palmatier, 2011; Ettlie & Rosenthal, 2011; Prahalad & Ramaswamy, 2003).
The meaning of innovation for firms is different from that of innovation for customers
(Danneels & Kleinschmidt, 2001; Rogers, 1962). Innovativeness research has focused mainly
from the firm’s perspective (Atuahene-Gima, 2005; Chandy & Tellis, 2000; Zhou, Yim, & Tse,
2005); few research studies focused on customers’ perceptions (Hoeffler, 2003; Kunz, Schmitt,
& Meyer, 2011; Lin, Marshall, & Dawson, 2013). Therefore, understanding the mechanisms for
innovativeness experience affecting patronage from the customers’ perspective, rather than the
employees’ perspective has become important.
Furthermore, measurement scales for innovativeness constructed in previous studies have
a basis in narrow product conceptualizations (e.g. Alegre, Lapiedra, & Chiva, 2006), or
development from the firm’s perspective (e.g. Hogan et al., 2011; Knowles, Hansen, & Dibrell,
2008), or have not followed rigorous scale development procedures (e.g. Jin, Goh, Huffman, &
Yuan, 2015). Therefore, an exploration of the role of innovativeness in service delivery and the
conceptualization of the innovativeness construct from a customer-centric perspective seem to be
critical research agendas.
Importance of customer experience in service industry: Relation to innovativeness and
value co-creation
Customers’ experiences are vital to the service industry because the quality of
interpersonal interactions between customers and service providers is influential. Generating
4
customer-oriented mindsets and tailored services are accepted avenues for innovatively
integrating resources for value creation. Customers’ expectations for services are continuously
changing, offering service organizations opportunities to provide unique and impressive
experiences for future development (Walls, Okumus, Wang, & Kwun, 2011). Since the service
industry has unique characteristics, including intangibility, inseparability, and heterogeneity of
services (Parasuraman, Zeithaml, & Berry, 1985), a customer-oriented strategy has a more
significant role for service firms than for many other industries (Kelley, 1992), and customers’
perceptions of a firm are highly dependent on the service process used by firms and irontline
employees (Hartline, Maxham III, & Mckee, 2000). Interest in value co-creation associated with
customers’ experiences began to appear in the hospitality literature with discussions of
customer/firm interactions along with specific idiosyncratic needs (Bharwani & Jauhari, 2013;
Chathoth, Altinay, Harrington, Okumus, & Chan, 2013). From a customer-grounded view, value-
in-use appears as a function of customers’ experiences (Heinonen et al., 2010; Strandvik,
Holmlund, & Edvardsson, 2012, Voima, Heinonen, Strandvik, Mickelsson, & Arantola-Hattab,
2011). Earlier literature on value co-creation emphasized the need to adopt service-dominant
logic (S-D logic) to support innovative service and create a memorable experience (Grönroos,
2008; Lusch, Vargo, & O’Brien, 2007; Matthing, Sandén, & Edvardsson, 2004). The attributes
of co-creation arise from the premise that co-creation, as a process, is a combination of customer,
supplier, and encounter processes (Payne et al., 2008).
While the role of the customer in value creation has become a key concept in service
marketing, questions remain for mechanisms for supporting customer value creation, for firms’
innovativeness effect on customers’ value creation behavior, and for integrating customers into
the co-creation processes.
5
Need for research on customer value co-creation in the hospitality context
A major challenge facing researchers in marketing and management disciplines is
conceptualizing the relationship between firm innovativeness and customer value co-creation
behaviors (e.g. Möller, Rajala, & Westerlund, 2008; Prahalad & Ramaswamy, 2003; 2004).
Further studies, providing theroetical support, are necessary to identify the roles of customers
and firms in building co-creation service climates. To overcome this theoretical gap,
development of a new holistic concept of customer value co-creation and firm innovativeness
requires exploration.
The necessity for more highly integrated attempts to understand the value co-creation
framework has recently risen to prominence in the hospitality discipline as well as business
discipline. Researchers investigated the role of customer value co-creation, both conceptually
and theoretically, within the contexts of co-creation in hospitality and tourism (e.g. Chathoth et
al.,2013; Martín-Ruiz, Barroso-Castro, & Rosa-Díaz, 2012; Navarro, Andreu, & Cervera, 2014;
See Table 2.2 for details). However, little research to date explored the specific nature of
customers’ value creation behavior and customers’ actual behavior when creating value in a
hospitality context. Therefore, an S-D logic approach emphasizing the role of customers in the
hospitality industry should focus on engagement, interaction, and collaboration between a firm
and its customers, as well as customers’ perceptions of innovativeness in the service interaction
processes during formation of value co-creation.
6
Purpose of the Study
The primary purpose of this study is to examine the role of customer value co-creation
behavior at casual dining restaurants. To achieve this, the study applies conceptual Service-
Dominant logic emphasizing the role of customer co-creation behavior. In addition to this
important behavioral role, the study also investigates the potential antecedents of customer co-
creation behavior and its consequences. The study had threefold aspects. The first is to present a
reconceptualization of an innovation construct in a foodservice context. In addition to the
literature research, qualitative and quantitative analyses explore dimensions of innovativeness s
and corresponding measurement items. The second purpose of the study is to validate customer
value co-creation behavior and evaluate the applicability of the scale of this construct in a
foodservice context. Third, this study develops and seeks to empirically test a theoretical model
relating customer value co-creation behavior to antecedents and consequential behavior, such as
customer perception of restaurant innovativeness, customer satisfaction, and customer conative
loyalty.
Research objectives
The specific objectives of this study are to:
1) develop scales for restaurant innovativeness from customers’ perspective;
2) investigate the impact of customers’ perception of restaurants’ innovativeness during
customer value co-creation behavior;
3) explore the impact of customer value co-creation behavior on customer satisfaction;
7
4) examine the influences of customer value co-creation behavior on customer conative
loyalty behavior; and
5) observe the relationship between customer satisfaction and customer conative loyalty
behavior.
Proposed research questions
Understanding the aspects and importance of the manner for strengthening customer co-
creation behavior can be strengthened is a valuable reasearch challenge because questions remain
for identifying the factors and processes and dynamics of value co-creation from customers’
perspectives by applying conceptual Service-Dominant logic in a foodservice context. Therefore,
the current research explores the role of customers’ perceptions and behavior in building value
co-creation. The specific research questions guide the research process:
RQ1: What is an innovative restaurant from a customer’s perspective?
RQ2: How is “innovativeness” conceptualized in the context of the food service industry?
RQ3: What is value co-creation behavior in customers’ restaurant experiences?
RQ4: How does customer value co-creation behavior relate to restaurant innovativeness and
the outcomes of customers’ behavior?
RQ5: How should the restaurant industry approach co-creation?
RQ6: What are the benefits of applying co-creation?
8
Significance of the Study
Comprehension of customer co-creation behavior is still emerging despite the importance
of value co-creation formation. Empirical investigations are scarce and knowledge of the nature
of restaurants’ innovativeness, customer value co-creation, and, methods for measuring the
concept are very limited. In the absence of such knowledge, both academic researchers and
industry practitioners have an incomplete understanding of how customers perceive
innovativeness, and how customer value co-creation relates to outcomes of customers’ behavior.
In the absence of such information assessing methods restaurants use to create value for
customers and achieve management effectiveness is difficult. Hence, this study provides a
foundation for future hospitality research by investigating customer value creation behavior and
linking customer value creation theory to actual customer value creation phenomena. The study
contributes to the literature with respect to customer value co-creation behavior by linking
customers’ perceptions of restaurants’ innovation and customers’ behaviors resulting from
delivered services. Discovering the links facilitates empirical research and supports developing
strategies regarding customer value creation for practitioners:
This study’s findings:
(1) Contribute to accumulated research that examines the influence of customer value co-
creation behavior within the context of foodservice by addressing the research gaps identified in
the literature review.
(2) Assess and improve understanding of previous studies that examined consumer
perception of restaurant innovativeness. The developed and validated measurement scales for
9
customer perception of restaurant innovativeness employed three separate qualitative and
quantitative studies. The results of this study, therefore extends knowledge of innovation.
(3) Identifies, through a pioneering study of customer value creation behavior in the
hospitality context, a range of dimensions within this context and provides valuable insights into
the way customers behave toward creating value with restaurants. In other words, this study
conceptualizes and empirically tests a comprehensive model of customer value co-creation
behavior in the hospitality context.
(4) Provides unique contributions and academic significance to practitioners for creating
effective strategies for use in the restaurant industry. From a practical perspective, the
development of a scale to capture restaurant innovativeness assists restaurateurs assess marketing
innovativeness strategies and the degree to which restaurants accommodate customer value
creation. Furthermore, practitioners can utilize insights gained from the study to better
understand the role of customers’ behavior in the formation of value creation to effectively
allocate resources or target specific market opportunities. Customers who base their levels of
satisfaction on service participation and engagement may generate higher potential profits when
acting a “partial employees.”
In summary, this study anticipates delivering theoretical contributions not only by
providing valid scales and sub-dimensions for restaurant innovativeness and customer co-
creation behavior, but also by developing a framework that reflects the impact of customer co-
creation behavior on the outcomes from customers’ behavior as relating to business performance.
This study may also provide practical contributions in the form of guidelines for restaurants for
implementing effective service strategies through appropriate levels of customers’ participation.
10
Definition of Terms
Definitions of key terms used in the study are listed below to facilitate comprehension of
the conceptual framework used in the study:
A casual dining restaurant - a restaurant that serves moderately priced food in an informal
atmosphere, where the server takes customer orders tableside and then serves food to
seated customers. Examples of casual dining restaurants include Applebee's
Neighborhood Grill & Bar, Buffalo Wild Wings Grill & Bar, Denny’s, Olive Garden,
Outback Steakhouse, and Texas Roadhouse.
Service-dominant logic (S-D logic) - refers to service as the basis of economic and social
exchange to create value through customer and firm involvement in interaction processes
(Vargo & Lusch, 2004, 2008a, 2008b; Yi & Gong, 2013).
Value co-creation - refers to an emerging business, and a marketing and innovation paradigm
describing how customers could be involved as active participants in the design and
development of personalized products, services, and experiences (Prahalad &
Ramaswamy, 2004a; Etgar, 2008; Payne et al., 2008).
Customer value-co-creation behavior - refers to customer participation behavior and customer
citizenship behavior in the value-creation process (Yi & Gong, 2012).
Customer participation behavior - enforceable or explicitly-required in-role behavior (Gruen,
1995) comprised of information seeking, information sharing, responsible behavior, and
personal interaction.
Information seeking - refers to customer pursuit of information to clarify service requirements
and satisfy other cognitive needs (Kellogg, Youngdahl, & Bowen, 1997). In this study,
11
information seeking is described as customer behavior that seeks information from other
customers such as friends, family, relatives, and social communities that have
experienced service at a given restaurant, observed other customers’ behavior, or
consulted social media and/or the restaurant website.
Information sharing - refers to customers sharing information to reduce customer uncertainty
about what to expect during a dining experience, and whether employees provide services
that meet specific customer needs (Ennew & Binks, 1999). In this study, information
sharing is described as customer behavior leading to shared information with restaurant
servers, chefs, or servers about flavor, taste, ingredients, specific needed services, or
allergies.
Responsible behavior - refers to recognition of customer responsibilities as partial employees of
the firm (Yi & Gong, 2013). In this study, responsible behavior is described as customer
behavior such as appearing promptly for a reservation unless it has been cancelled or
rescheduled, and exhibiting appropriate restaurant dining manners--both for themselves
and their children.
Personal interaction - refers to interaction with employees, including courtesy, friendliness, and
respect (Ennew & Binks, 1999). In this study, personal interaction refers to customer’s
interaction with frontline employees, servers, or chefs at restaurants.
Customer citizenship behavior - refers to voluntary or discretionary extra-role behaviors that
benefit the firm and go beyond the normal customer expectations (Gruen, 1995),
comprised of feedback, advocacy, helping, and tolerance behaviors.
Feedback - is defined as customers offering guidance and suggestions to employees after the
customers achieve a considerable amount of experience with the service (Groth, Mertens,
12
& Murphy, 2004). In this study, feedback can be described as customer behavior related
to sharing feedback either on-site or online.
Advocacy - is defined as recommending a firm or its employees to other people such as friends
or family (Groth et al., 2004). In this study, advocacy refers to value creation instituted
by customers when they voluntarily share detailed information or write thorough reviews
about restaurant services, qualities, or promotions that extend beyond simple
recommendation.
Helping - is defined as assisting other customers who might be experiencing difficulties with
services (Yi & Gong, 2013). In this study, helping describes customer behavior aimed at
assisting other customers at restaurants (e.g., giving information/writing reviews in online
or offline social communities.)
Tolerance - refers to a willingness to be patient even when service expectations are not met
(Lengnick-Hall, Claycomb, & Inks, 2000). In this study, tolerance describes customer
willingness to be patient when restaurant service/delivery does not meet expectations.
Perceived innovativeness - is defined as firm willingness to be open to new ideas and work
toward finding new solutions (Crawford & Di Benedetto, 2003). In this study, perceived
innovativeness is described as a restaurant’s broad activity that suggests a capability and
willingness to consider and institute “new” and “meaningfully different” ideas, services,
and promotions from a customer perspective when selected from alternatives.
Customer satisfaction - refers to the degree to which a customer believes that service evokes
positive feelings (Rust & Oliver, 1993). In this study, customer satisfaction is defined as
a customer’s evaluation of a restaurant’s regard for customer needs and expectations.
13
Customer patronage behavior or conative loyalty - describes a customer’s behavioral intention to
re-visit a restaurant in the future.
Dissertation Organization
This dissertation is organized into five parts as follows: 1) introduction, 2) review of
literature, 3) methods, 4) results, and 5) discussions and limitations. Reference lists are presented
at the end of the last chapter, followed by appendices. Chapter 1 introduces a brief overview of
customer value co-creation behavior and perceived innovativeness and emphasizes the necessity
to investigate customer behavior with respect to the topic. Chapter 2 examines various theoretical
foundations of customer value co-creation behavior, customer perception of restaurant
innovativeness, customer satisfaction, and customer conative loyalty. In this chapter the
conceptual framework of the current study and its hypotheses are presented. Chapter 3 explores
the chosen research methodology by applying and examining mixed methods used in three
studies. Study 1 explores qualitative inquiry that guided scale development; Study 2 examines
preliminary quantitative inquiry to validate the measurement; Study 3 describes the quantitative
inquiry used to test the research hypotheses and the conceptual model. The research design
employed in the study is included, including the data collection method and data analysis
techniques. Chapter 4 provides data analysis and empirical results from Study 1, Study 2, and
Study 3. Chapter 5 discusses the results from the previous chapter by presenting implications for
use by academia and practitioners, and it includes limitations and makes suggestions for future
research.
14
CHAPTER 2
LITERATURE REVIEW AND HYPOTHESES DEVELOPMENT
Chapter 2 delivers both a general background and a theoretical foundation for the
conceptual model. The general background section begins with an overview of service-dominant
logic and customer value co-creation. The theoretical foundation section reviews theoretical
frameworks and constructs constituting the conceptual model of the study. Based on a review of
the literature, a conceptual framework is proposed that integrates customer value co-creation,
perceived innovativeness, and consequences of customer value co-creation behavior. This
research framework examines how innovativeness and customers’ behaviors maximize value
with respect to customer satisfaction and conative loyalty behavior. Related hypotheses are also
addressed.
Research of Service-Dominant Logic and Value Co-Creation
Trends in service marketing: Attention to Service-Dominant logic
Service marketing research has been impacted by environmental changes, technological
developments, and the nature of marketing and market debates. Consequently, the conceptual
development of service marketing has led to subtle but significant changes in nomenclature
(Baron, Warnaby, & Hunter‐Jones, 2014). Baron et al. (2014) discussed research development in
the service marketing domain over the last 50 years, emphasizing the need for a broader network
perspective in service research rather than focusing on a supplier–customer dyad. Their advice
was to accentuate the evolution of Service-Dominant logic (S-D logic) in future service-
15
marketing research and to focus primarily on value co-creation from a consumer-centric
perspective.
Vargo and Lusch (2004) were the first to propose S-D logic, offering opportunities for
service marketing research and highlighting the customer’s role as co-creator of value during the
service delivery process. Value co-creation is associated with emerging business and is a
marketing and innovation paradigm that delineates how customers can become active
participants in the creation of personalized experiences as well as personalized products and
services (Payne et al., 2008; Prahalad & Ramaswamy, 2004b). Hence, value co-creation is a
collaborative activity between service providers and customers during a service delivery process
(Prahalad & Ramaswamy, 2004a). Encouraging customers to be “value co-creators” is the next
frontier in competitive effectiveness and reflects a major marketing domain shift from goods-
centered, to service-centered logic (Bendapudi & Leone, 2003; Vargo & Lusch, 2004).
Service-Dominant logic and value co-creation
The conceptualization of co-creation and value-in-use has been introduced in the service
marketing perspective as part of S-D logic in marketing (Vargo & Lusch, 2004, 2008b). S-D
logic describes a situation where service is the basis of economic and social exchange that
creates value through customers’ and firms’ involvement in the interaction processes (Vargo &
Lusch, 2004, 2008a, 2008b; Yi & Gong, 2013). S-D logic is an alternative to Good-Dominant
logic (G-D logic) that centers on a co-product concept, and emphasizes a firm-centric view in the
traditional goods-centered paradigm. In traditional G-D logic, goods are the fundamental unit of
exchange while in S-D logic specialized competence (knowledge and skills) or service is the
primary operand resource (Constantin & Lusch, 1994). The service-centered approach relies on
16
value co-creation in service transactions (Lusch et al., 2007; Spohrer & Maglio, 2008). S-D logic
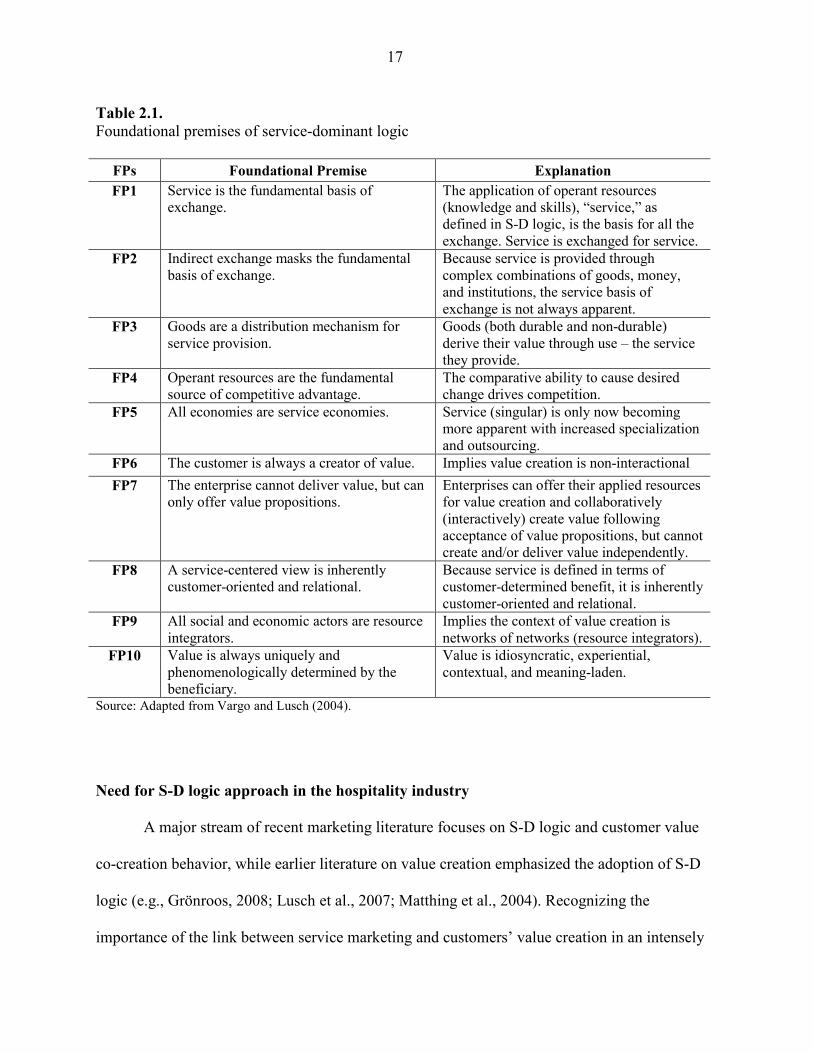
is comprised of ten foundational premises advanced by Vargo and Lusch (2004), details of which
are shown in Table 2.1. They focus on value co-creation rather than value embedded in
products/services, interactions and relationships rather than transactions, and operant rather than
operand resources. Operant resources are intangible such as knowledge and skills, while operand
refers to tangible and physical resources (Vargo & Lusch, 2004).
The core concept of S-D logic is that the customer is always a value co-creator; the
supplier is a value facilitator and value co-creator (Grönroos, 2008; Grönroos & Voima, 2013).
The firm supplies the necessary resources for customers’ own value-creating processes while
interacting with them, thus, interaction within the consumption process is critical. In S-D logic,
customers determine value known as value-in-use because it is perceived only when the service
is consumed; value is created when a customer consumes goods or services and perceives there
is value embedded in them (Vargo & Lusch, 2004). During value-in-use the customer is not
merely a receiver, but rather a collaborative partner who “creates value for the firm” (Lusch et
al., 2007, p. 6); the supplier provides a platform for improving customer experience (Rowley,
2007) and drives the innovation process toward new service development (Edvardsson,
Kristensson, Magnusson, & Sundström, 2012; Matthing et al., 2004). Therefore, theoretical
views of S-D logic highlight the notion that customers must experience ultimate service (Vargo
& Lusch, 2008a), and represent a drive for value co-creation.
17
Table 2.1.
Foundational premises of service-dominant logic
FPs Foundational Premise Explanation
FP1 Service is the fundamental basis of exchange.
The application of operant resources (knowledge and skills), “service,” as defined in S-D logic, is the basis for all the exchange. Service is exchanged for service.
FP2 Indirect exchange masks the fundamental basis of exchange.
Because service is provided through complex combinations of goods, money, and institutions, the service basis of exchange is not always apparent.
FP3 Goods are a distribution mechanism for service provision.
Goods (both durable and non-durable) derive their value through use – the service they provide.
FP4 Operant resources are the fundamental source of competitive advantage.
The comparative ability to cause desired change drives competition.
FP5 All economies are service economies. Service (singular) is only now becoming more apparent with increased specialization and outsourcing.
FP6 The customer is always a creator of value. Implies value creation is non-interactional
FP7 The enterprise cannot deliver value, but can only offer value propositions.
Enterprises can offer their applied resources for value creation and collaboratively (interactively) create value following acceptance of value propositions, but cannot create and/or deliver value independently.
FP8 A service-centered view is inherently customer-oriented and relational.
Because service is defined in terms of customer-determined benefit, it is inherently customer-oriented and relational.
FP9 All social and economic actors are resource integrators.
Implies the context of value creation is networks of networks (resource integrators).
FP10 Value is always uniquely and phenomenologically determined by the beneficiary.
Value is idiosyncratic, experiential, contextual, and meaning-laden.
Source: Adapted from Vargo and Lusch (2004).
Need for S-D logic approach in the hospitality industry
A major stream of recent marketing literature focuses on S-D logic and customer value
co-creation behavior, while earlier literature on value creation emphasized the adoption of S-D
logic (e.g., Grönroos, 2008; Lusch et al., 2007; Matthing et al., 2004). Recognizing the
importance of the link between service marketing and customers’ value creation in an intensely
18
competitive market, few studies, especially those within the hospitality context, have
investigated the role of customer behavior in creating value within a firm and a firm’s innovative
role during the value process. In recent times the notion of S-D logic and value co-creation has
been increasingly acknowledged in tourism contexts (e.g., Binkhorst & Den Dekker, 2009;
Cabiddu, Lui, & Piccoli, 2013; Chathoth et al., 2014; Grissemann & Stokburger-Sauer, 2012;
Hjalager, & Konu, 2011; Prebensen & Foss, 2011; Prebensen, Vittersø, & Dahl, 2013; Rihova,
Buhalis, Moital, & Gouthro, 2015). Not much is known about how S-D logic is incorporated
within the context of hospitality.
A novel conceptual paper by Chathoth et al. (2013) discussed co-creation in hospitality
and introduced the notion of how hotel industries can move from co-production to co-creation.
Kandampully, Keating, Kim, Mattila, and Solnet (2014) conducted a Delphi analysis to
determine the level of service topic integration in major hospitality literature over a fifteen-year
period. The study suggested that co-creation had been at the core of hospitality service, and that
future studies should examine service designed to encourage value co-creation in customer
participation. Xie, Peng, and Huan (2014) conducted an early empirical study using the
quantitative method to examine how employee-perceived organizational support invites
employees’ brand citizenship and eventually affects customers’ perceived brand trust. Chen,
Raab, and Tanford (2015) also integrated the S-D- logic approach in a hospitality context by
investigating the relationship between mandatory customer participation and service outcomes.
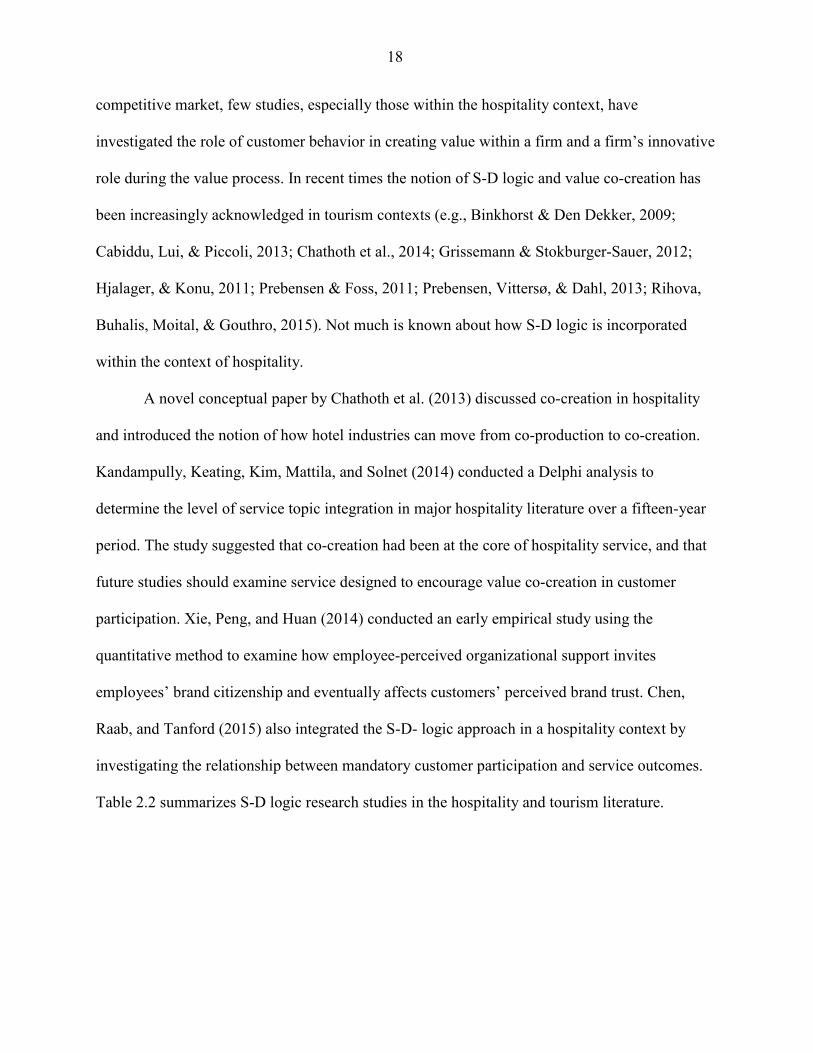
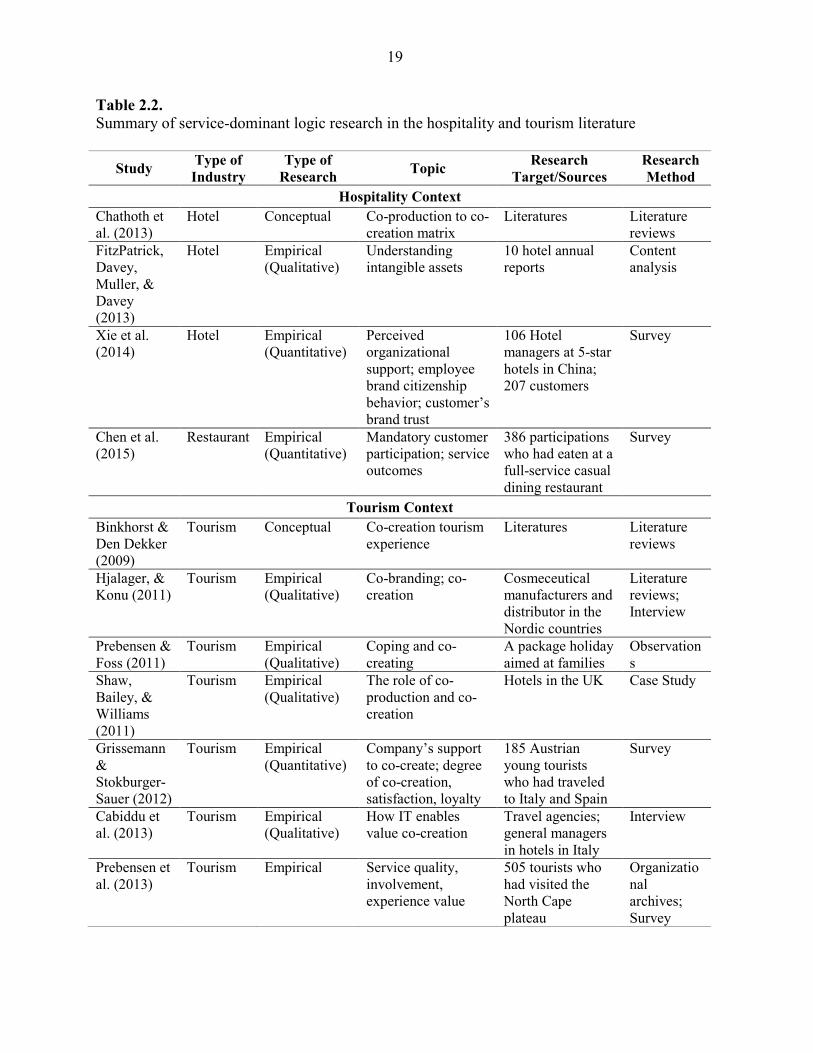
Table 2.2 summarizes S-D logic research studies in the hospitality and tourism literature.
19
Table 2.2.
Summary of service-dominant logic research in the hospitality and tourism literature
Study Type of
Industry
Type of
Research Topic
Research
Target/Sources
Research
Method
Hospitality Context
Chathoth et al. (2013)
Hotel Conceptual Co-production to co-creation matrix
Literatures Literature reviews
FitzPatrick, Davey, Muller, & Davey (2013)
Hotel Empirical (Qualitative)
Understanding intangible assets
10 hotel annual reports
Content analysis
Xie et al. (2014)
Hotel Empirical (Quantitative)
Perceived organizational support; employee brand citizenship behavior; customer’s brand trust
106 Hotel managers at 5-star hotels in China; 207 customers
Survey
Chen et al. (2015)
Restaurant Empirical (Quantitative)
Mandatory customer participation; service outcomes
386 participations who had eaten at a full-service casual dining restaurant
Survey
Tourism Context
Binkhorst & Den Dekker (2009)
Tourism Conceptual Co-creation tourism experience
Literatures Literature reviews
Hjalager, & Konu (2011)
Tourism Empirical (Qualitative)
Co-branding; co-creation
Cosmeceutical manufacturers and distributor in the Nordic countries
Literature reviews; Interview
Prebensen & Foss (2011)
Tourism Empirical (Qualitative)
Coping and co-creating
A package holiday aimed at families
Observations
Shaw, Bailey, & Williams (2011)
Tourism Empirical (Qualitative)
The role of co-production and co-creation
Hotels in the UK Case Study
Grissemann & Stokburger-Sauer (2012)
Tourism Empirical (Quantitative)
Company’s support to co-create; degree of co-creation, satisfaction, loyalty
185 Austrian young tourists who had traveled to Italy and Spain
Survey
Cabiddu et al. (2013)
Tourism Empirical (Qualitative)
How IT enables value co-creation
Travel agencies; general managers in hotels in Italy
Interview
Prebensen et al. (2013)
Tourism Empirical Service quality, involvement, experience value
505 tourists who had visited the North Cape plateau
Organizational archives; Survey
20
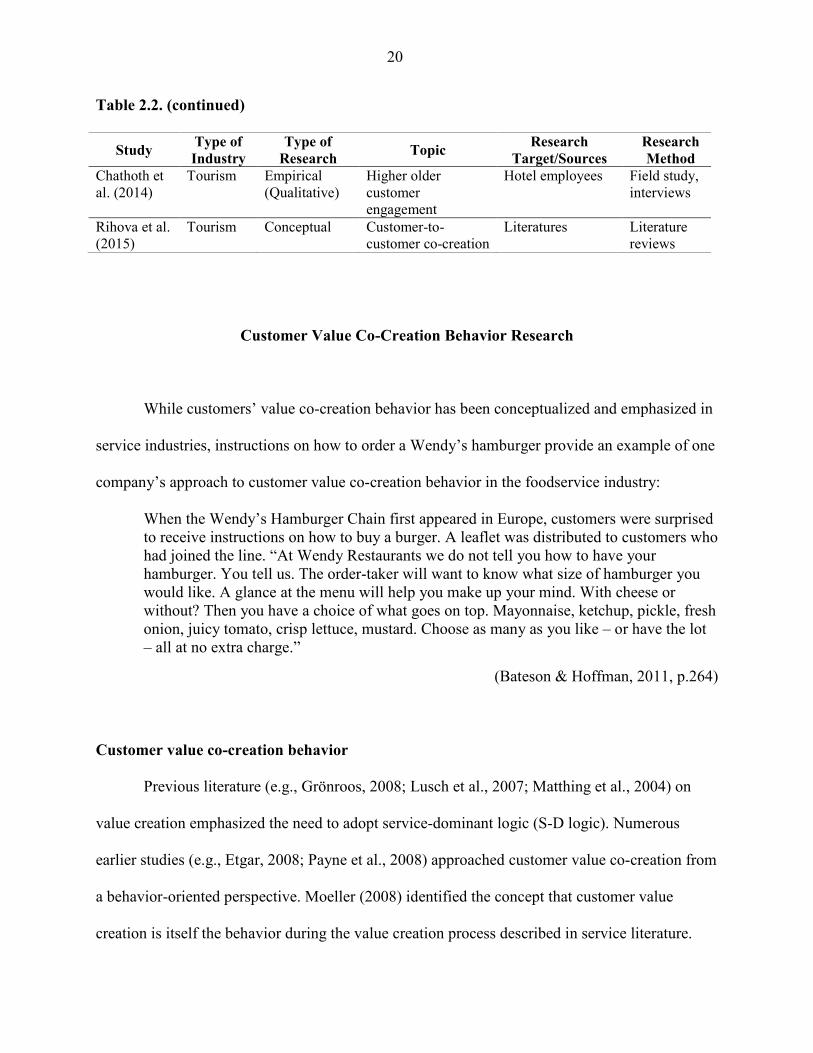
Table 2.2. (continued)
Study Type of
Industry
Type of
Research Topic
Research
Target/Sources
Research
Method
Chathoth et al. (2014)
Tourism Empirical (Qualitative)
Higher older customer engagement
Hotel employees Field study, interviews
Rihova et al. (2015)
Tourism Conceptual Customer-to-customer co-creation
Literatures Literature reviews
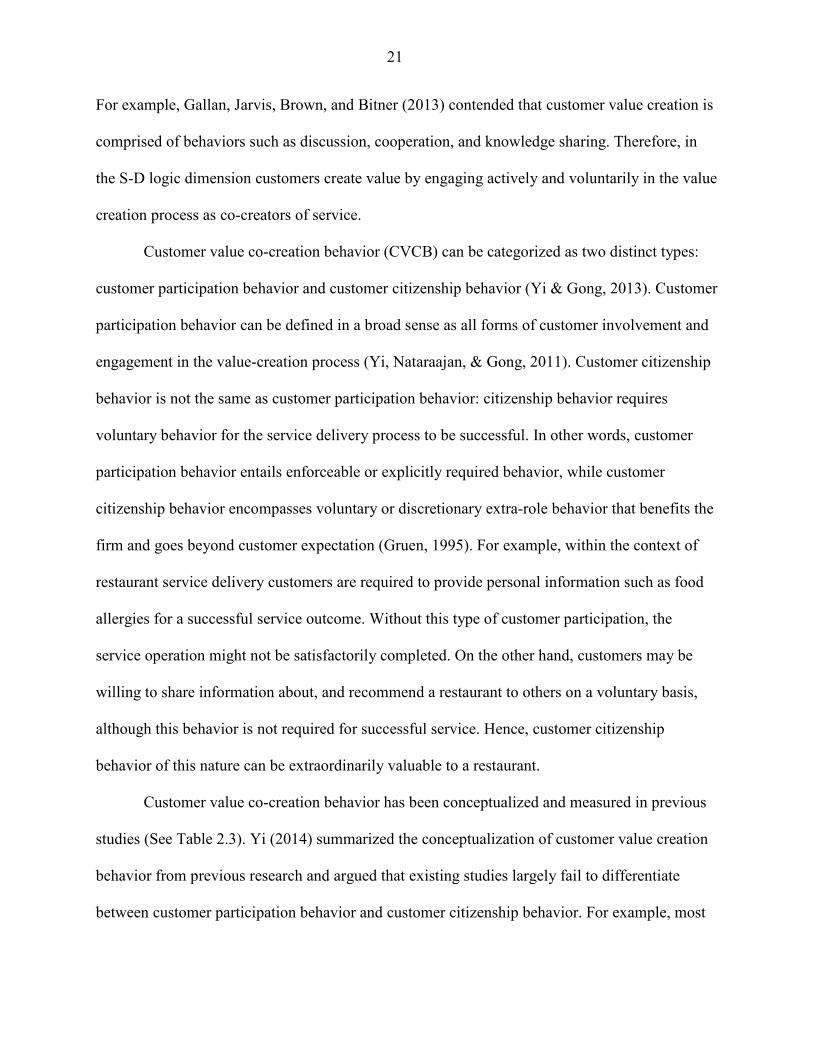
Customer Value Co-Creation Behavior Research
While customers’ value co-creation behavior has been conceptualized and emphasized in
service industries, instructions on how to order a Wendy’s hamburger provide an example of one
company’s approach to customer value co-creation behavior in the foodservice industry:
When the Wendy’s Hamburger Chain first appeared in Europe, customers were surprised to receive instructions on how to buy a burger. A leaflet was distributed to customers who had joined the line. “At Wendy Restaurants we do not tell you how to have your hamburger. You tell us. The order-taker will want to know what size of hamburger you would like. A glance at the menu will help you make up your mind. With cheese or without? Then you have a choice of what goes on top. Mayonnaise, ketchup, pickle, fresh onion, juicy tomato, crisp lettuce, mustard. Choose as many as you like – or have the lot – all at no extra charge.”
(Bateson & Hoffman, 2011, p.264)
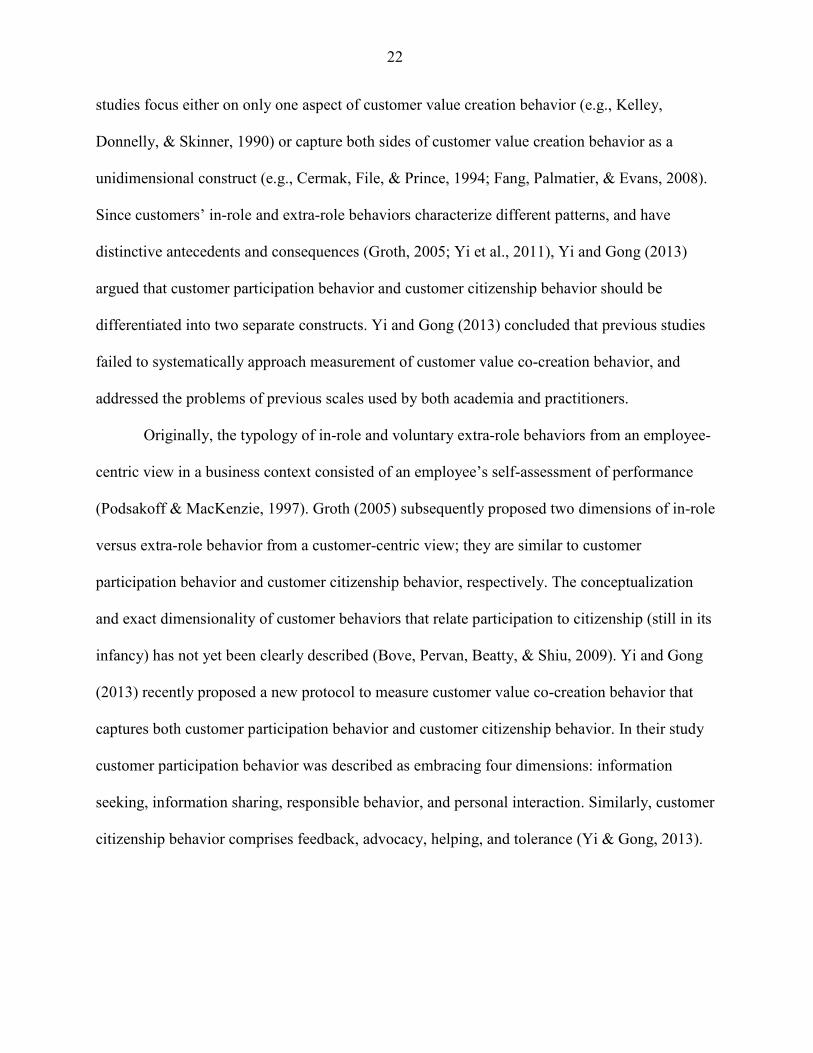
Customer value co-creation behavior
Previous literature (e.g., Grönroos, 2008; Lusch et al., 2007; Matthing et al., 2004) on
value creation emphasized the need to adopt service-dominant logic (S-D logic). Numerous
earlier studies (e.g., Etgar, 2008; Payne et al., 2008) approached customer value co-creation from
a behavior-oriented perspective. Moeller (2008) identified the concept that customer value
creation is itself the behavior during the value creation process described in service literature.
21
For example, Gallan, Jarvis, Brown, and Bitner (2013) contended that customer value creation is
comprised of behaviors such as discussion, cooperation, and knowledge sharing. Therefore, in
the S-D logic dimension customers create value by engaging actively and voluntarily in the value
creation process as co-creators of service.
Customer value co-creation behavior (CVCB) can be categorized as two distinct types:
customer participation behavior and customer citizenship behavior (Yi & Gong, 2013). Customer
participation behavior can be defined in a broad sense as all forms of customer involvement and
engagement in the value-creation process (Yi, Nataraajan, & Gong, 2011). Customer citizenship
behavior is not the same as customer participation behavior: citizenship behavior requires
voluntary behavior for the service delivery process to be successful. In other words, customer
participation behavior entails enforceable or explicitly required behavior, while customer
citizenship behavior encompasses voluntary or discretionary extra-role behavior that benefits the
firm and goes beyond customer expectation (Gruen, 1995). For example, within the context of
restaurant service delivery customers are required to provide personal information such as food
allergies for a successful service outcome. Without this type of customer participation, the
service operation might not be satisfactorily completed. On the other hand, customers may be
willing to share information about, and recommend a restaurant to others on a voluntary basis,
although this behavior is not required for successful service. Hence, customer citizenship
behavior of this nature can be extraordinarily valuable to a restaurant.
Customer value co-creation behavior has been conceptualized and measured in previous
studies (See Table 2.3). Yi (2014) summarized the conceptualization of customer value creation
behavior from previous research and argued that existing studies largely fail to differentiate
between customer participation behavior and customer citizenship behavior. For example, most
22
studies focus either on only one aspect of customer value creation behavior (e.g., Kelley,
Donnelly, & Skinner, 1990) or capture both sides of customer value creation behavior as a
unidimensional construct (e.g., Cermak, File, & Prince, 1994; Fang, Palmatier, & Evans, 2008).
Since customers’ in-role and extra-role behaviors characterize different patterns, and have
distinctive antecedents and consequences (Groth, 2005; Yi et al., 2011), Yi and Gong (2013)
argued that customer participation behavior and customer citizenship behavior should be
differentiated into two separate constructs. Yi and Gong (2013) concluded that previous studies
failed to systematically approach measurement of customer value co-creation behavior, and
addressed the problems of previous scales used by both academia and practitioners.
Originally, the typology of in-role and voluntary extra-role behaviors from an employee-
centric view in a business context consisted of an employee’s self-assessment of performance
(Podsakoff & MacKenzie, 1997). Groth (2005) subsequently proposed two dimensions of in-role
versus extra-role behavior from a customer-centric view; they are similar to customer
participation behavior and customer citizenship behavior, respectively. The conceptualization
and exact dimensionality of customer behaviors that relate participation to citizenship (still in its
infancy) has not yet been clearly described (Bove, Pervan, Beatty, & Shiu, 2009). Yi and Gong
(2013) recently proposed a new protocol to measure customer value co-creation behavior that
captures both customer participation behavior and customer citizenship behavior. In their study
customer participation behavior was described as embracing four dimensions: information
seeking, information sharing, responsible behavior, and personal interaction. Similarly, customer
citizenship behavior comprises feedback, advocacy, helping, and tolerance (Yi & Gong, 2013).
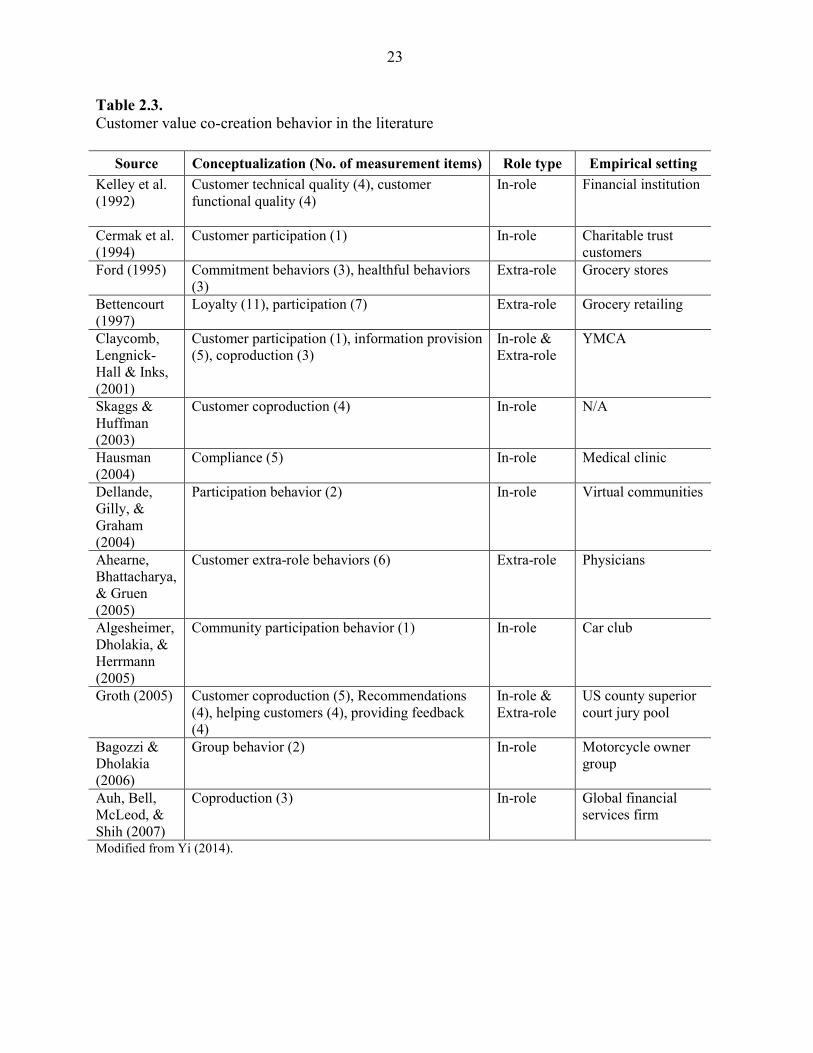
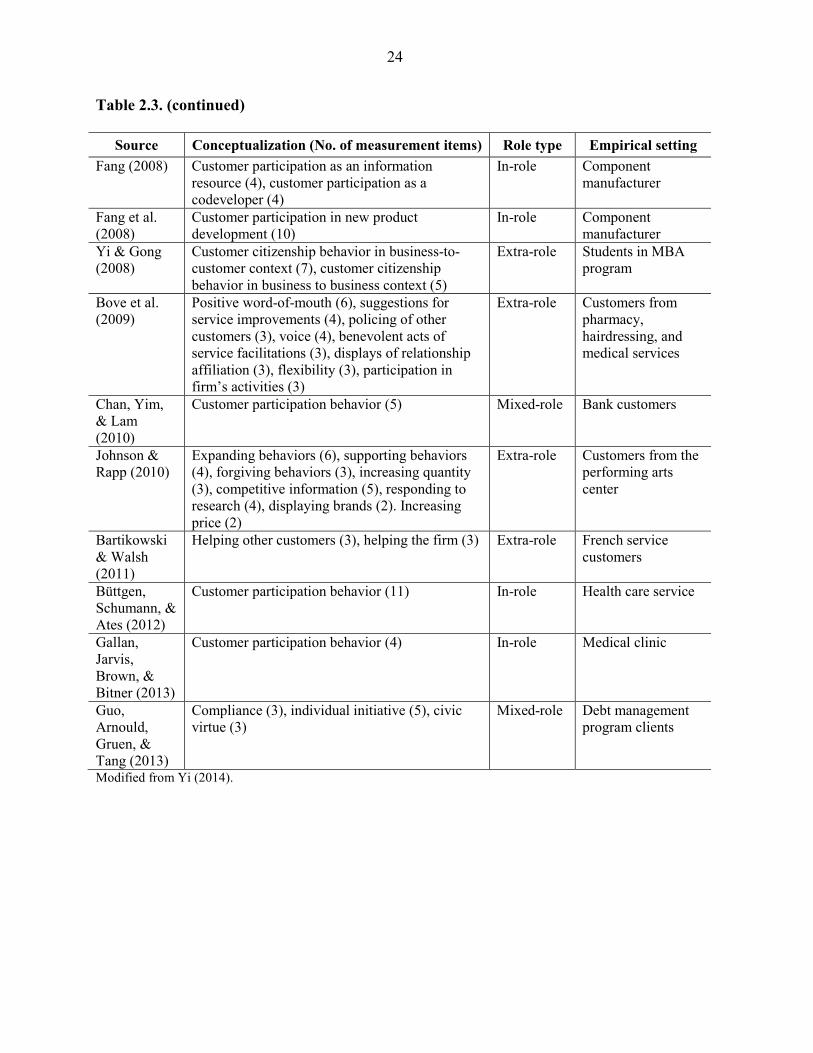
23
Table 2.3.
Customer value co-creation behavior in the literature
Source Conceptualization (No. of measurement items) Role type Empirical setting
Kelley et al. (1992)
Customer technical quality (4), customer functional quality (4)
In-role Financial institution
Cermak et al. (1994)
Customer participation (1) In-role Charitable trust customers
Ford (1995) Commitment behaviors (3), healthful behaviors (3)
Extra-role Grocery stores
Bettencourt (1997)
Loyalty (11), participation (7) Extra-role Grocery retailing
Claycomb, Lengnick-Hall & Inks, (2001)
Customer participation (1), information provision (5), coproduction (3)
In-role & Extra-role
YMCA
Skaggs & Huffman (2003)
Customer coproduction (4) In-role N/A
Hausman (2004)
Compliance (5) In-role Medical clinic
Dellande, Gilly, & Graham (2004)
Participation behavior (2) In-role Virtual communities
Ahearne, Bhattacharya, & Gruen (2005)
Customer extra-role behaviors (6) Extra-role Physicians
Algesheimer, Dholakia, & Herrmann (2005)
Community participation behavior (1) In-role Car club
Groth (2005) Customer coproduction (5), Recommendations (4), helping customers (4), providing feedback (4)
In-role & Extra-role
US county superior court jury pool
Bagozzi & Dholakia (2006)
Group behavior (2) In-role Motorcycle owner group
Auh, Bell, McLeod, & Shih (2007)
Coproduction (3) In-role Global financial services firm
Modified from Yi (2014).
24
Table 2.3. (continued)
Source Conceptualization (No. of measurement items) Role type Empirical setting
Fang (2008) Customer participation as an information resource (4), customer participation as a codeveloper (4)
In-role Component manufacturer
Fang et al. (2008)
Customer participation in new product development (10)
In-role Component manufacturer
Yi & Gong (2008)
Customer citizenship behavior in business-to-customer context (7), customer citizenship behavior in business to business context (5)
Extra-role Students in MBA program
Bove et al. (2009)
Positive word-of-mouth (6), suggestions for service improvements (4), policing of other customers (3), voice (4), benevolent acts of service facilitations (3), displays of relationship affiliation (3), flexibility (3), participation in firm’s activities (3)
Extra-role Customers from pharmacy, hairdressing, and medical services
Chan, Yim, & Lam (2010)
Customer participation behavior (5) Mixed-role Bank customers
Johnson & Rapp (2010)
Expanding behaviors (6), supporting behaviors (4), forgiving behaviors (3), increasing quantity (3), competitive information (5), responding to research (4), displaying brands (2). Increasing price (2)
Extra-role Customers from the performing arts center
Bartikowski & Walsh (2011)
Helping other customers (3), helping the firm (3) Extra-role French service customers
Büttgen, Schumann, & Ates (2012)
Customer participation behavior (11) In-role Health care service
Gallan, Jarvis, Brown, & Bitner (2013)
Customer participation behavior (4) In-role Medical clinic
Guo, Arnould, Gruen, & Tang (2013)
Compliance (3), individual initiative (5), civic virtue (3)
Mixed-role Debt management program clients
Modified from Yi (2014).
25
Customer participation behavior
From the perspective of customer participation behavior, customers pursue information to
clarify service requirements, satisfy other cognitive needs (information seeking) (Kellogg, et al.,
1997), and share information to reduce customer uncertainty, while employees provide the
services that meet customers’ particular needs (information sharing) (Ennew & Binks, 1999).
Customers also recognize their responsibilities as partial employees of that firm (responsible
behavior) (Yi & Gong, 2013), and interact with employees who might provide characteristics
such as courtesy, friendliness, cooperation, commitment, and respect (personal interaction)
(Ennew & Binks, 1999; Yi & Gong, 2013).
Information seeking
During information seeking, customers engage in information exchange to clarify service
status or parameters and satisfy other cognitive needs (Kellogg et al., 1997). Customers should
understand the nature of service and their own roles in the value co-creation process to obtain
information about how to perform their tasks as value creators--reducing uncertainty and
enabling them to control service-creation environments (Kellogg et al., 1997; Yi & Gong, 2013).
For example, information seeking occurs when customers request information from other
customers such as friends, family, relatives, and social communities that have experienced
service at the restaurant or observed other customers’ behavior, and social media and/or the
restaurant’s website.
26
Information sharing
Customers share information to ensure that the service offered by employees is
commensurate with individual needs (Ennew & Binks, 1999). In other words, customers need to
provide information for the value co-creation process to be effective (Lengnick-Hall, 1996);
employees cannot facilitate customer value co-creation without information from customers
(Grönroos & Voima, 2013). For example, customers should share information with restaurant
servers, chefs, or servers about flavor, taste, ingredients, specific needed services, or allergies.
Armed with this information the restaurant can adequately provide services and facilitate value
co-creation to meet customers’ needs.
Responsible behavior
Customers must demonstrate responsible behavior to support a successful value co-
creation process as partial employees of the firm (Yi & Gong, 2013). To successfully create
value, customers must observe rules and policies during the service encounter and follow the
business’s directives--the value facilitator (Guo et al., 2013). For example, customers should
appear promptly for their reservation unless they cancel or reschedule, and should exhibit
appropriate restaurant dining manners, both from themselves and their children. Value co-
creation cannot occur in a service encounter if a customer does not engage in responsible
behavior.
Personal interaction
Positive interpersonal relationships with employees are necessary if customers are to
engage in successful value co-creation (Ennew & Binks, 1999). Customers- employee
27
interactions must involve behaviors such as courtesy, friendliness, cooperation, commitment, and
respect (Ennew & Binks, 1999; Yi & Gong, 2013). The more pleasant and positive an
environment, the more likely customers will engage in value co-creation and the likely
employees will be inclined to be better value facilitators (Lengnick-Hall et al, 2000). A large
number of positive interactions between customers and employees can be thought of as a value
co-creation process, particularly in restaurant settings since the relationship with employees can
be as critical as the relationship with the organization as a whole (Barnes, 1994).
Customer citizenship behavior
Customer citizenship behavior is a dimension wherein customers offer guidance and
suggestions to employees about the service, particularly if they have a considerable amount of
experience with the service (feedback) (Groth et al, 2004), if they recommend the firm or its
employees to other people such as friends or family (advocacy) (Groth et al., 2004), if they assist
other customers who might be experiencing difficulties with such services (helping) (Yi & Gong,
2013), and if they are willing to remain patient even when the service is disappointing (tolerance)
(Lengnick-Hall, et al., 2000).
Feedback
Customers may offer guidance and suggestions to employees if they have extensive
experience with a particular service (Bettencourt, 1997). Customer feedback can greatly enhance
the value co-creation process by facilitating co-creation with employees (Groth et al., 2004). This
feedback behavior is discretionary and not required for successful service delivery. For example,
28
customers can engage in value co-creation by providing menu suggestions or restaurant location
(Yi, 20014) either on-site or through online access.
Advocacy
Advocacy behavior in a value creation process refers to the recommendation of a firm or
its employees to others such as friends or family members (Groth et al., 2004). Advocacy can
represent customer loyalty (Groth et al., 2004) and be classified as extra-role behavior in the
context of value creation (Yi & Gong, 2008) since it shows commitment to a firm, and
promotion of the firm’s interests beyond individual interests from customers (Bettencourt, 1997).
Yi and Gong (2008) argued that advocacy is a voluntary and discretionary behavior that helps a
firm: it provides unsolicited and unrewarded information about employees. Customers perform
the main value of co-creation and creation of value through word-of-mouth communication in
both online and offline social communities (Yi & Hur, 2007).
Helping
Helping behavior in a value creation process can be described as assisting other
customers (Yi & Gong, 2013). Within the service context, experienced customers might show
empathy for other customers’ issues and an attempt to help them, whether they attend to the
needs of new customers, or someone experiencing difficulty obtaining service (Rosenbaum &
Massiah, 2007) -recalling their own difficult experiences and acting out of a sense of social
responsibility (Yi, 2014). For example, customers sometimes institute value creation by
voluntarily sharing detailed information, or writing thorough reviews about restaurant services,
qualities, or promotions that extend beyond simple recommendation.
29
Tolerance
Tolerance behavior is exhibited when customers are patient even when their expectation
of adequate services is not being met (Lengnick-Hall et al., 2000). Service failure is sometimes
impossible to avoid in the restaurant industry, and customers are often intolerant of poor service
(Kim & Tang, 2016). Nevertheless, if customers create value with a firm and generate extra-role
behavior as customer citizenship behavior, they may be patient when service failures occur (Yi
& Gong, 2013).
Relationship Between Customer Value Co-Creation and Other Constructs
Researchers have created antecedent and value co-creation outcome concepts to better
understand customer value co-creation behavior. Empirical evidence for establishing a clear
understanding of the connection between these relationships is lacking, despite its importance as
an academic discipline concept. Hence, the development of integrated models of value co-
creation and service outcome formation requires a systematic approach in order to determine the
associations between key components in the model.
The conceptual foundation of antecedents and consequences of customer value co-
creation behavior is rooted in theory addressed by service-dominant logic (Vargo & Lusch, 2004;
Grönroos, 2008; Grönroos & Voima, 2013). The role of a service provider as value facilitator is
to provide customers with necessary resources, and accordingly, the nature of customer
perceptions of a firm’s resources is vital and must be identified in value co-creation research
(e.g., Michel, Brown, & Gallan, 2008; O’hern, & Rindfleisch, 2010; Prahalad & Ramaswamy,
2003; Sawhney, Verona & Prandelli, 2005; Tanev et al., 2011). The conceptual relationships
30
between a firm’s innovativeness and co-creation behavior has been proposed in several reports
(e.g., Chathoth et al., 2014; Spohrer & Maglio, 2009; Vargo & Lusch, 2004), and a relationship
between service outcomes such as customer satisfaction and conative loyalty with co-creation
behavior is suggested in relationship marketing literature (e.g., See-To & Ho, 2014). The
following section discusses each construct in greater detail.
Antecedents of Customer Value Co-Creation:
Research of Perceived Innovativeness from Customer Perspective
Innovation and innovativeness
Innovation is both a survival and competitive necessity for firms; dynamic markets
constantly shake out organizations that lack the capability to explore new market opportunities
(Luo & Bhattacharya, 2006; Schumpeter, 1934). The key issue of innovativeness from a
managerial perspective is its impact on customer retention. Diffusion of innovation, which has a
long history in sociology, focuses on how the use of innovation disseminates throughout society
(Mahajan, Mueller, & Bass, 1990; Rogers, 1962). Innovativeness affects attitude, yet early
researchers investigated the perceived characteristics of innovations (e.g. Gatignon & Robertson
1985) rather than systematically examining its characteristics. Rogers (1962), in his discussion of
innovation diffusion theory, provided a precise definition of innovation: it is an idea, thing,
procedure, or system perceived to be new by whomever adopts it. The theory suggests that the
characteristics of an innovation, including relative advantage, compatibility, complexity,
trialability, and observability, help in its diffusion or adoption (Rogers, 1962).
For an extended period innovation research has taken a very myopic view of innovation,
focusing on specific technologies or new products while neglecting business concept innovation
31
(Sawhney, Wolcott, & Arroniz, 2006; Vilà & MacGregor, 2007). As the nature of innovation has
changed, its scope has been broadened and stretched beyond technological innovation. Business
innovation is defined as “the successful implementation of creative ideas within an organization”
(Amabile, Conti, Coon, Lazenby, & Herron, 1996, p. 1155). More recently, Sawhney et al.
(2006) defined innovation from a business perspective as “the creation of substantial new value
for customers and the firm by creatively changing one or more dimensions of the business
system,” and suggested four “business anchors:” offerings, customers, processes, and presence.
Innovativeness is the bottom-line behavioral type in the diffusion process (Rogers, 1995).
The terms “innovation” and “innovativeness” significantly differ, although they are frequently
used interchangeably in business literature. Innovation focuses on the outcomes of new elements
or new combinations of old elements from firm activity (Schumpeter, 1934), while
innovativeness refers to a broader outcome of firm activity and denotes the capability of a firm to
be open to new ideas, services, and promotions (Crawford & Di Benedetto, 2003; Kunz et al.,
2011).
Firm innovativeness from customer-centric perspective
The meaning of the term innovativeness is rooted in the domains of businesses and
consumers. In marketing and management literature firm innovativeness is defined as “a firm's
ability to develop and launch new products at a fast rate” (Hurley & Hult, 1998), while consumer
innovativeness refers to “the tendency to buy new products more often and more quickly than
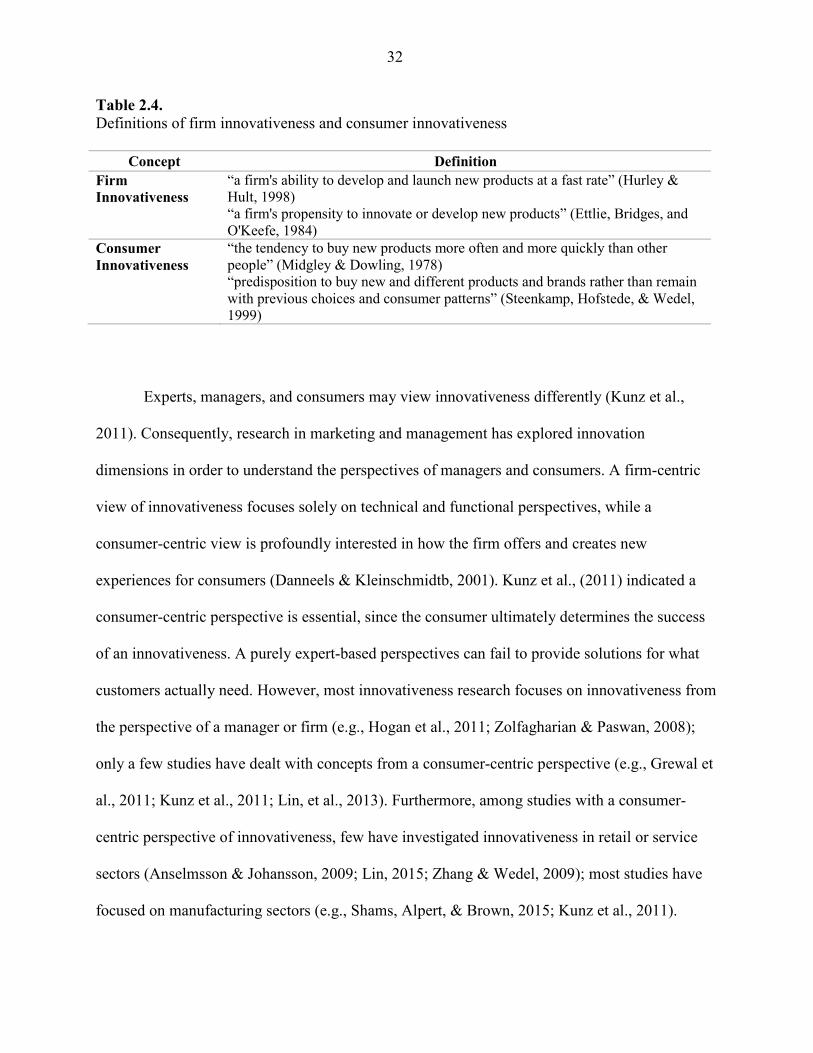
other people” (Midgley & Dowling, 1978) (See Table 2.4). In the present paper, the concept of
innovativeness will focus solely on firm innovativeness.
32
Table 2.4.
Definitions of firm innovativeness and consumer innovativeness
Concept Definition
Firm
Innovativeness
“a firm's ability to develop and launch new products at a fast rate” (Hurley & Hult, 1998) “a firm's propensity to innovate or develop new products” (Ettlie, Bridges, and O'Keefe, 1984)
Consumer
Innovativeness
“the tendency to buy new products more often and more quickly than other people” (Midgley & Dowling, 1978) “predisposition to buy new and different products and brands rather than remain with previous choices and consumer patterns” (Steenkamp, Hofstede, & Wedel, 1999)
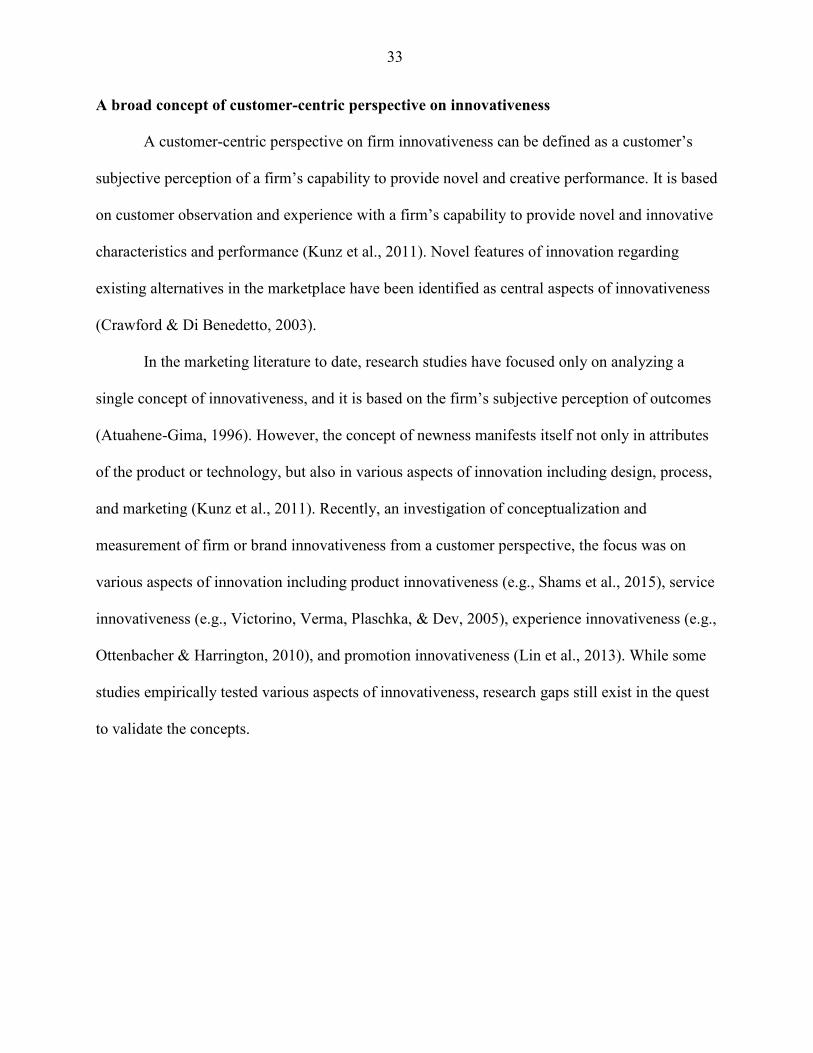
Experts, managers, and consumers may view innovativeness differently (Kunz et al.,
2011). Consequently, research in marketing and management has explored innovation
dimensions in order to understand the perspectives of managers and consumers. A firm-centric
view of innovativeness focuses solely on technical and functional perspectives, while a
consumer-centric view is profoundly interested in how the firm offers and creates new
experiences for consumers (Danneels & Kleinschmidtb, 2001). Kunz et al., (2011) indicated a
consumer-centric perspective is essential, since the consumer ultimately determines the success
of an innovativeness. A purely expert-based perspectives can fail to provide solutions for what
customers actually need. However, most innovativeness research focuses on innovativeness from
the perspective of a manager or firm (e.g., Hogan et al., 2011; Zolfagharian & Paswan, 2008);
only a few studies have dealt with concepts from a consumer-centric perspective (e.g., Grewal et
al., 2011; Kunz et al., 2011; Lin, et al., 2013). Furthermore, among studies with a consumer-
centric perspective of innovativeness, few have investigated innovativeness in retail or service
sectors (Anselmsson & Johansson, 2009; Lin, 2015; Zhang & Wedel, 2009); most studies have
focused on manufacturing sectors (e.g., Shams, Alpert, & Brown, 2015; Kunz et al., 2011).
33
A broad concept of customer-centric perspective on innovativeness
A customer-centric perspective on firm innovativeness can be defined as a customer’s
subjective perception of a firm’s capability to provide novel and creative performance. It is based
on customer observation and experience with a firm’s capability to provide novel and innovative
characteristics and performance (Kunz et al., 2011). Novel features of innovation regarding
existing alternatives in the marketplace have been identified as central aspects of innovativeness
(Crawford & Di Benedetto, 2003).
In the marketing literature to date, research studies have focused only on analyzing a
single concept of innovativeness, and it is based on the firm’s subjective perception of outcomes
(Atuahene-Gima, 1996). However, the concept of newness manifests itself not only in attributes
of the product or technology, but also in various aspects of innovation including design, process,
and marketing (Kunz et al., 2011). Recently, an investigation of conceptualization and
measurement of firm or brand innovativeness from a customer perspective, the focus was on
various aspects of innovation including product innovativeness (e.g., Shams et al., 2015), service
innovativeness (e.g., Victorino, Verma, Plaschka, & Dev, 2005), experience innovativeness (e.g.,
Ottenbacher & Harrington, 2010), and promotion innovativeness (Lin et al., 2013). While some
studies empirically tested various aspects of innovativeness, research gaps still exist in the quest
to validate the concepts.
34
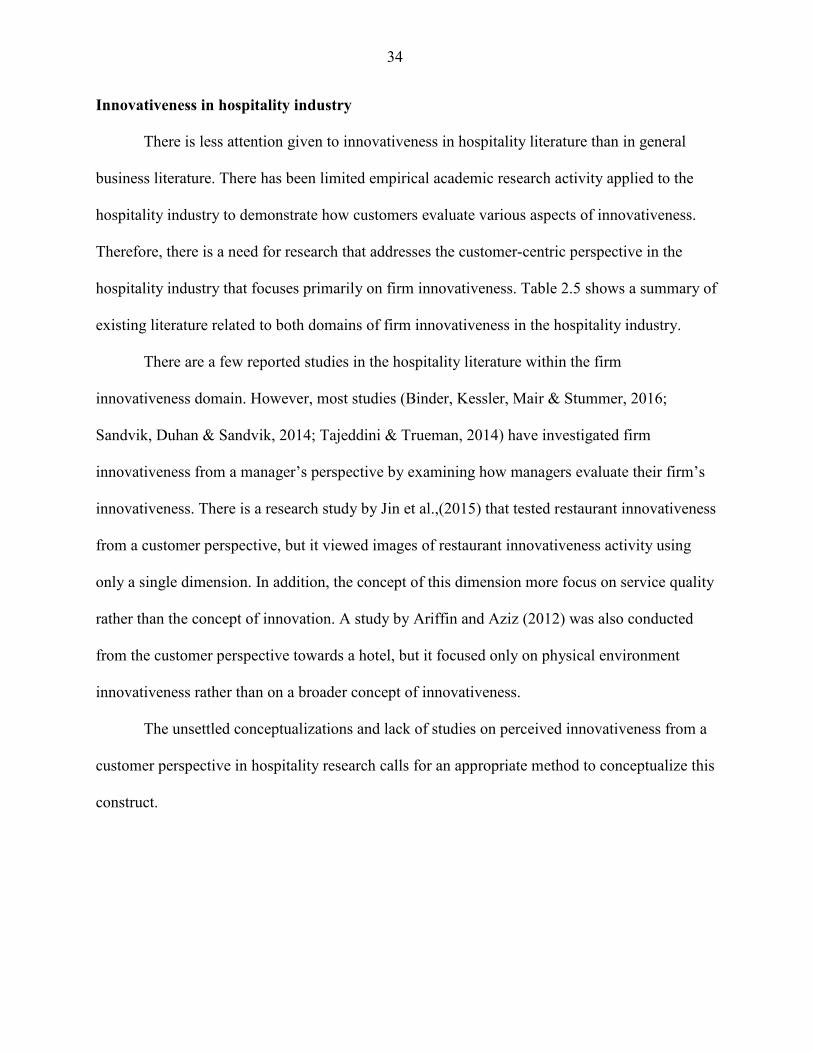
Innovativeness in hospitality industry
There is less attention given to innovativeness in hospitality literature than in general
business literature. There has been limited empirical academic research activity applied to the
hospitality industry to demonstrate how customers evaluate various aspects of innovativeness.
Therefore, there is a need for research that addresses the customer-centric perspective in the
hospitality industry that focuses primarily on firm innovativeness. Table 2.5 shows a summary of
existing literature related to both domains of firm innovativeness in the hospitality industry.
There are a few reported studies in the hospitality literature within the firm
innovativeness domain. However, most studies (Binder, Kessler, Mair & Stummer, 2016;
Sandvik, Duhan & Sandvik, 2014; Tajeddini & Trueman, 2014) have investigated firm
innovativeness from a manager’s perspective by examining how managers evaluate their firm’s
innovativeness. There is a research study by Jin et al.,(2015) that tested restaurant innovativeness
from a customer perspective, but it viewed images of restaurant innovativeness activity using
only a single dimension. In addition, the concept of this dimension more focus on service quality
rather than the concept of innovation. A study by Ariffin and Aziz (2012) was also conducted
from the customer perspective towards a hotel, but it focused only on physical environment
innovativeness rather than on a broader concept of innovativeness.
The unsettled conceptualizations and lack of studies on perceived innovativeness from a
customer perspective in hospitality research calls for an appropriate method to conceptualize this
construct.
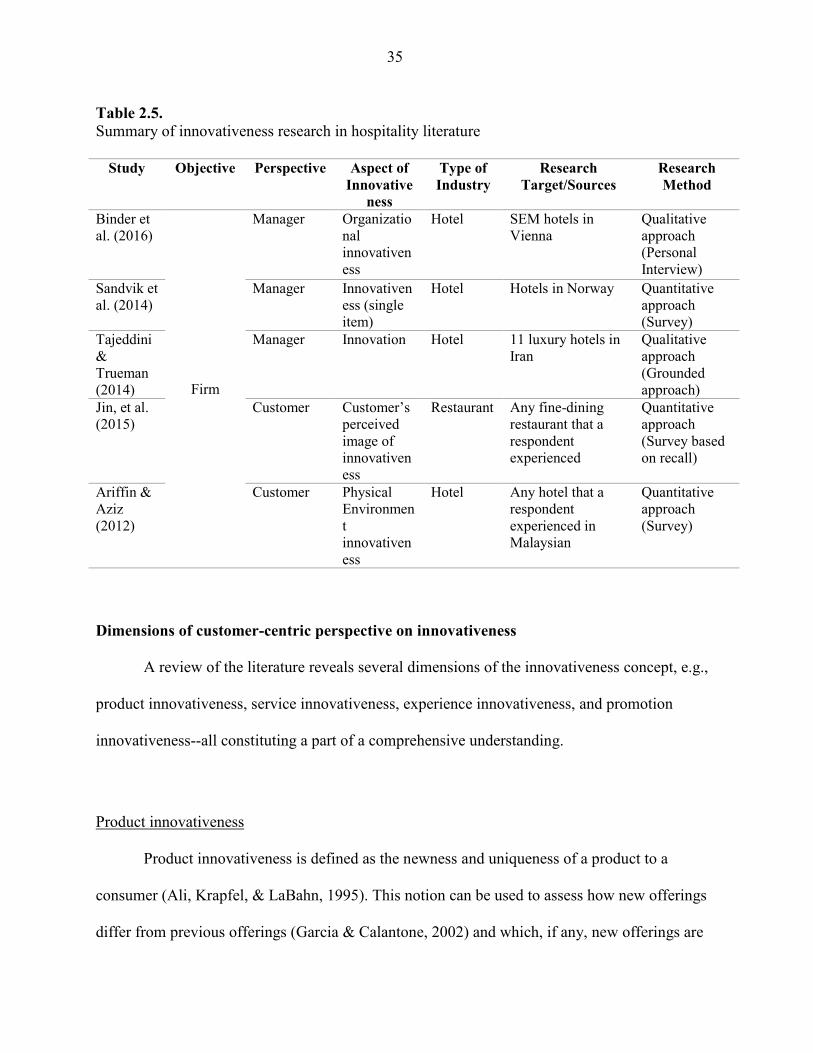
35
Table 2.5. Summary of innovativeness research in hospitality literature
Study Objective Perspective Aspect of
Innovative
ness
Type of
Industry
Research
Target/Sources
Research
Method
Binder et al. (2016)
Firm
Manager Organizational innovativeness
Hotel SEM hotels in Vienna
Qualitative approach (Personal Interview)
Sandvik et al. (2014)
Manager Innovativeness (single item)
Hotel Hotels in Norway Quantitative approach (Survey)
Tajeddini & Trueman (2014)
Manager Innovation Hotel 11 luxury hotels in Iran
Qualitative approach (Grounded approach)
Jin, et al. (2015)
Customer Customer’s perceived image of innovativeness
Restaurant Any fine-dining restaurant that a respondent experienced
Quantitative approach (Survey based on recall)
Ariffin & Aziz (2012)
Customer Physical Environment innovativeness
Hotel Any hotel that a respondent experienced in Malaysian
Quantitative approach (Survey)
Dimensions of customer-centric perspective on innovativeness
A review of the literature reveals several dimensions of the innovativeness concept, e.g.,
product innovativeness, service innovativeness, experience innovativeness, and promotion
innovativeness--all constituting a part of a comprehensive understanding.
Product innovativeness
Product innovativeness is defined as the newness and uniqueness of a product to a
consumer (Ali, Krapfel, & LaBahn, 1995). This notion can be used to assess how new offerings
differ from previous offerings (Garcia & Calantone, 2002) and which, if any, new offerings are
36
perceived as valuable, useful, and meaningful to consumers (Rubera, Ordanini, & Griffith,
2011). The majority of research on product innovativeness (e.g., Calantone, Chan, & Cui, 2006;
Danneels & Kleinschmidt, 2001) describes the notion of this concept based on the firm
perspective of innovativeness, dependent upon the interaction between marketing and technical
functions of the organization (Calantone et al., 2006), while acknowledging the necessity of
taking a consumer perspective. Shams et al. (2015) subsequently emphasized the role of
consumer perception in product innovativeness. The conceptualization and operationalization of
consumer-perceived innovativeness at the product level has typically focused on technological
innovation found in product features and functionality (Danneels & Kleinschmidt, 2001;
Atuahene-Gima, 1995; Lee & Colarelli O’Connor, 2003; McNally, Cavusgil, & Calantone,
2010). In foodservice research, Feltenstein (1986) provided a framework for the product
innovation process related to newly added menu items in an attempt to expand a restaurant's
market share. Ottenbacher and Harrington, (2009) introduced an outline approach to innovation
process activities in a quick-service restaurant setting.
Service innovativeness
Service innovativeness is defined as “an idea for a performance enhancement that
customers perceive as offering a new benefit of sufficient appeal that it dramatically influences
their behavior, as well as the behavior of competing companies” (Berry, Shankar, Parish,
Cadwallader, & Dotzel, 2006, p 56). Driven by a service-dominant logic (Vargo & Lusch, 2004),
the notion of service innovativeness has become an essential and obvious construct in marketing
literature to create new market benefits (Berry et al., 2006; Kim & Mauborgne, 1999; Kleijnen,
de Ruyter, & Andreassen, 2005; Meuter, Bitner, Ostrom, & Brown, 2005), and service
37
innovativeness can explain how a firm offers intangible services and creates an advantage for the
consumer through new service performance or delivery processes. Knowledge of customer needs
and wants regarding service innovativeness from their centric view is critical since the use of
information technology can be viewed as an example of service innovation (Reid & Sandler,
1992). Therefore, service innovativeness in this study focuses on technology-based service
innovativeness.
Experience innovativeness
Another view of innovativeness involving intangible products is experience innovation
based on co-creation of value with customers. Experience innovativeness is defined as the
innovation of an experience environment that uses the firm’s capability to create personalized
and lifestyle-based experiences for individual consumers (Prahalad & Ramaswamy, 2003). In the
experience economy, firms search for new ways to distinguish themselves and attract customer
attention (Binkhorst & Den Dekker, 2009). The unique characteristics of food-service
management promote relationships between customers and providers, and become the focal point
of engagement platforms (Sashi, 2012) within the foodservice environment. Hence, experience
innovations may require using employees who influence consumer satisfaction as the ultimate
moderators for differentiating services (Ottenbacher & Harrington, 2010; Zeithaml & Bitner,
2006). The emphasis in the present study will be to create an experience environment in which
customers will interact with employees in innovative ways, and thus build long-term
relationships with the restaurant.
38
Promotion innovativeness
Promotion is an important tool for firms to use when targeting customers (Grewal et al.,
2011). Innovation can exist in both product development and promotion (Chang & Dawson,
2006). Lin et al., (2013) argued that even though promotion techniques and products are not new,
promotion innovativeness such as new advertising for a new product mix gives customers a fresh
perspective on a firm. Therefore, promotion innovations offer multiple opportunities to
effectively target a firm’s customers (Grewal et al., 2011), and the ability of a firm to generate
promotion innovations is likely to attract customer attention and increase store purchase
behaviors (Lin, 2015).
Relationship Between Perceived Innovativeness and
Customer Value Co-Creation Behavior
Customer perceptions of innovativeness in value co-creation
Innovation emphasizes the value co-creation paradigm with its focus on customer
engagement platforms, multiple stakeholder interactions, customer-driven business models, and
virtual customer personalized experience environments (Prahalad & Krishnan, 2008). The
development of value co-creation platforms has been increasingly acknowledged as a promising
innovation strategy related to ongoing changes in the nature of innovation itself (Prahalad &
Ramaswamy, 2003, 2004a, 2004b; Romero & Molina, 2009; Bowonder, Dambal, Kumar, &
Shirodkar, 2010).
Theoretical support for the relationship between innovativeness and value co-creation
behavior is based on an assumption derived from S-D logic (Vargo & Lusch, 2004). From the S-
39
D logic perspective, service innovation has become an increasingly significant and essential
construct in marketing literature (Berry et al., 2006; Kleijnen et al. , 2005; Meuter et al., 2005),
since innovation facilitates the flow of information and knowledge between employees and
customers, and thus boosts the collaboration for value co-creation (Cabiddu et al., 2013; Lusch et
al., 2007). Vargo and Lusch (2004) conceptualized a strong relationship between innovation and
value co-creation processes, and addressed the pressing need for innovations, or new ways of
creating value with dynamic and intangible resources within the context of value co-creation.
Spohrer and Maglio (2009) also reported that service innovations have accelerated co-creation
value in current service section growth. Co-creation experiences are the basis of value and a firm
need to focus on innovative experience environments for unique value creation (Prahalad and
Ramaswamy, 2004). Based on this notion, Prahalad and Ramaswamy (2004, p. 6) suggested the
co-creation process be built through four key blocks, which are “dialogue, access, risk
assessment, and transparency” – the DART model of value co-creation.
The relationship between innovativeness and value co-creation has received marked
attention in studies, however, the impact of customer perception on innovativeness is primarily
conceptual and without empirical support. Studies of service innovation in the hospitality
industry (Chathoth et al., 2014) addressed the concept that innovation management is the key
strategy for affecting high consumer engagement in the value co-creation process. To empirically
confirm the validity of this concept the current study will explore the importance of
innovativeness in co-creation and the relationship between them. Based on the foregoing
discussion, the following hypotheses are proposed:
Hypothesis 1: Customer perception of restaurant innovativeness has a positive effect on
customer value co-creation behavior at restaurants.
40
Hypothesis 1a: Customer perception of restaurant innovativeness has a positive
effect on customer participation behavior at restaurants.
Hypothesis 1b: Customer perception of restaurant innovativeness has a positive
effect on customer citizenship behavior at restaurants.
Consequences of Customer Value Co-Creation
Research on customer satisfaction
Customer satisfaction refers to the degree to which a customer believes that service
evokes positive feelings (Rust & Oliver, 1993). In business-related fields, from both academic
and practical perspectives, consumer satisfaction has been acknowledged as a key element in
decreasing customer defection and increasing customer retention (Bolton & Lemon, 1999;
Oliver, 1999). Despite the wide, frequent use and acceptance of the term “satisfaction” in
academic literature, there has been no consensus about the meaning of the satisfaction concept.
Most early studies consider satisfaction to be a cognitive construct (e.g., Maxham III &
Netemeyer, 2003; Oliver, 1980; Olson & Dover, 1979; Verhoef, 2003), while more recent
studies see satisfaction as an affective construct that recognizes an emotional response to
consumption (Brady et al., 2005; Crosby, Evans, & Cowles, 1990; Seiders, Voss, Grewal, &
Godfrey, 2005; Spreng, MacKenzie, & Olshavsky, 1996). Even though such studies differentiate
between cognitive response and affective reaction, the notion of satisfaction based on a
combination of a consumer’s cognitive and affective responses has also been generated (Brady,
Cronin, Fox, & Roehm, 2008; Cronin, Brady, & Hult, 2000; Gotlieb, Grewal, & Brown, 1994;
Oliver, 1980). Westbrook and Reilly (1983) explained the various aspects of consumer
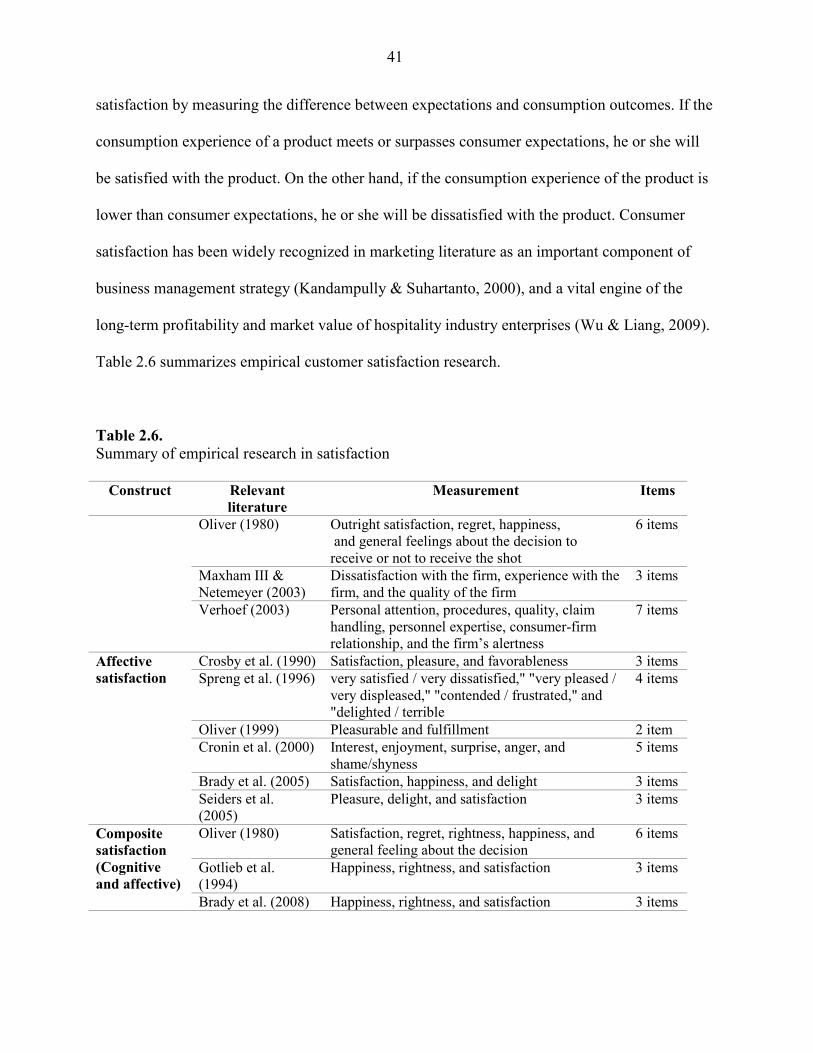
41
satisfaction by measuring the difference between expectations and consumption outcomes. If the
consumption experience of a product meets or surpasses consumer expectations, he or she will
be satisfied with the product. On the other hand, if the consumption experience of the product is
lower than consumer expectations, he or she will be dissatisfied with the product. Consumer
satisfaction has been widely recognized in marketing literature as an important component of
business management strategy (Kandampully & Suhartanto, 2000), and a vital engine of the
long-term profitability and market value of hospitality industry enterprises (Wu & Liang, 2009).
Table 2.6 summarizes empirical customer satisfaction research.
Table 2.6.
Summary of empirical research in satisfaction
Construct Relevant
literature
Measurement Items
Oliver (1980) Outright satisfaction, regret, happiness, and general feelings about the decision to receive or not to receive the shot
6 items
Maxham III & Netemeyer (2003)
Dissatisfaction with the firm, experience with the firm, and the quality of the firm
3 items
Verhoef (2003) Personal attention, procedures, quality, claim handling, personnel expertise, consumer-firm relationship, and the firm’s alertness
7 items
Affective
satisfaction
Crosby et al. (1990) Satisfaction, pleasure, and favorableness 3 items
Spreng et al. (1996) very satisfied / very dissatisfied," "very pleased / very displeased," "contended / frustrated," and "delighted / terrible
4 items
Oliver (1999) Pleasurable and fulfillment 2 item
Cronin et al. (2000) Interest, enjoyment, surprise, anger, and shame/shyness
5 items
Brady et al. (2005) Satisfaction, happiness, and delight 3 items
Seiders et al. (2005)
Pleasure, delight, and satisfaction 3 items
Composite
satisfaction
(Cognitive
and affective)
Oliver (1980) Satisfaction, regret, rightness, happiness, and general feeling about the decision
6 items
Gotlieb et al. (1994)
Happiness, rightness, and satisfaction 3 items
Brady et al. (2008) Happiness, rightness, and satisfaction 3 items
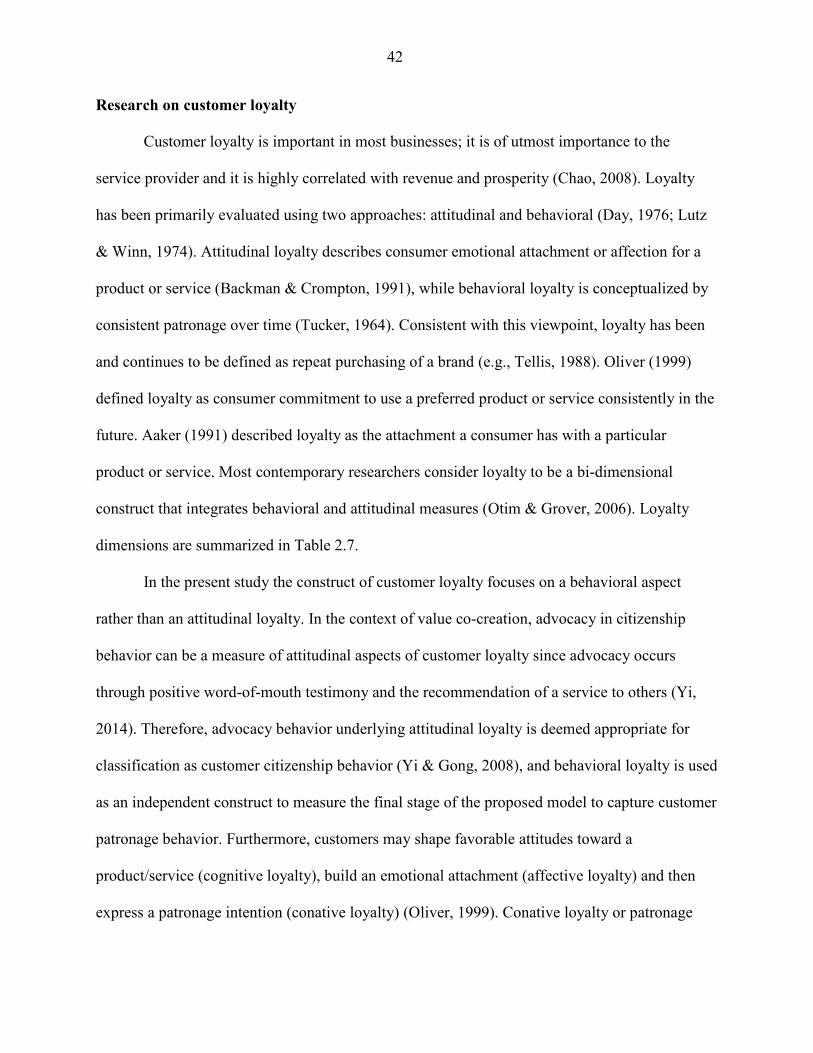
42
Research on customer loyalty
Customer loyalty is important in most businesses; it is of utmost importance to the
service provider and it is highly correlated with revenue and prosperity (Chao, 2008). Loyalty
has been primarily evaluated using two approaches: attitudinal and behavioral (Day, 1976; Lutz
& Winn, 1974). Attitudinal loyalty describes consumer emotional attachment or affection for a
product or service (Backman & Crompton, 1991), while behavioral loyalty is conceptualized by
consistent patronage over time (Tucker, 1964). Consistent with this viewpoint, loyalty has been
and continues to be defined as repeat purchasing of a brand (e.g., Tellis, 1988). Oliver (1999)
defined loyalty as consumer commitment to use a preferred product or service consistently in the
future. Aaker (1991) described loyalty as the attachment a consumer has with a particular
product or service. Most contemporary researchers consider loyalty to be a bi-dimensional
construct that integrates behavioral and attitudinal measures (Otim & Grover, 2006). Loyalty
dimensions are summarized in Table 2.7.
In the present study the construct of customer loyalty focuses on a behavioral aspect
rather than an attitudinal loyalty. In the context of value co-creation, advocacy in citizenship
behavior can be a measure of attitudinal aspects of customer loyalty since advocacy occurs
through positive word-of-mouth testimony and the recommendation of a service to others (Yi,
2014). Therefore, advocacy behavior underlying attitudinal loyalty is deemed appropriate for
classification as customer citizenship behavior (Yi & Gong, 2008), and behavioral loyalty is used
as an independent construct to measure the final stage of the proposed model to capture customer
patronage behavior. Furthermore, customers may shape favorable attitudes toward a
product/service (cognitive loyalty), build an emotional attachment (affective loyalty) and then
express a patronage intention (conative loyalty) (Oliver, 1999). Conative loyalty or patronage
43
behavioral intention is manifested by customer behavioral intentions to re-visit a firm in the
future (Olive, 1999), and it has been considered to be the strongest predictor of behavioral
loyalty when compared to cognitive and affective loyalty (Pedersen & Nysveen, 2001).
Moreover, it is difficult to observe and measure actual behavioral loyalty that converts customer
intention into real action; behavioral intention is usually considered a substitute indicator for
actual behavior in marketing literature (Fishbein & Ajzen, 1975).
Table 2.7.
Summary of empirical research in loyalty dimensions
Construct Characteristics Relevant literature
Cognitive-
Affective-
Conative-Action
Phase
• A brand specific commitment based on “prior or vicarious knowledge or recent experience-based information”
• A brand specific commitment on the basis of “cumulatively satisfying usage occasions”
• A brand specific commitment to the deeply hold “intention to rebuy the brand”
Oliver (1999, p 35)
Attitudinal
loyalty
• Consumers’ psychological elements toward the same brand or store and involves the measurement of consumer attitudes
• Distinguish brand loyalty from repeat buying
Andreassen & Lindestad (1998); Bennett & Rundle-Thiele (2002); Bettencourt & Brown (1997)
Behavioral
loyalty
• Repeated purchases prompted by strong • Internal dispositions • Based on actual behavior over a certain period
Tellis (1988); Tucker (1964)
Composite
loyalty
• A merger of behavioral and attitudinal loyalty Day (1976); Chaudhuri & Holbrook (2001); Dick & Basu (1994); Jacoby (1971); Jacoby & Chestnut (1978); Jacoby & Kyner (1973); Otim & Grover (2006)
44
Relation between customer value co-creation behavior, customer satisfaction, and customer
loyalty
The outcome of CVCB (Customer Value Co-Creation Behavior) depends on customer
participation behavior (Ennew & Blinks, 1999) and customer citizenship behavior (Yi & Gong,
2006). Predictions based on CVCB outcomes can derive from a body of research by Yi (2014).
He provided an integrative summary of CVCB outcomes that can be categorized into three
groups: customer-related outcomes, employee-related outcomes, and firm-related outcomes.
From a customer-related outcomes perspective, outcomes can be derived from attitudinal aspects
(e.g. service quality, customer satisfaction), cognitive aspects (e.g., goal attainment, customer
benefits), and behavioral aspects (e.g., customer loyalty, repurchase behavior, and switching
behavior).
Consistent with other findings reported in the literature, the present study predicts that
CVCB will be an important antecedent of customer satisfaction and loyalty. A positive
relationship between customer participation behavior and customer citizenship behavior has
received extensive support in several studies (Cermak et al., 1994; Chan et al., 2010; Dellande et
al., 2004; Dong, Evans, & Zou, 2008; Ennew & Blinks, 1999; Kellogg et al., 1997; Yim, Chan,
& Lam, 2012). The logic behind its importance rests on the fact that when customers perform
their in-role and extra-role behavior in the formation of value co-creation, they are satisfied and
continue the relationship to express their conative loyalty. Accordingly, the following hypothesis
is proposed:
45
Hypothesis 2: Customer value co-creation behavior has a positive effect on customer
satisfaction at restaurants.
Hypothesis 2a Customer participation behavior has a positive effect on customer
satisfaction at restaurants.
Hypothesis 2b: Customer citizenship behavior has a positive effect on customer
satisfaction at restaurants.
Hypothesis 3: Customer value co-creation behavior has a positive effect on customer
conative loyalty to restaurants.
Hypothesis 3a: Customer participation behavior has a positive effect on customer
conative loyalty to restaurants.
Hypothesis 3b: Customer citizenship behavior has a positive effect on customer
conative loyalty to restaurants.
Relation between customer satisfaction and customer conative loyalty
Satisfaction is one of the most important components influencing customer behavior. For
satisfaction to affect behavioral outcomes, “frequent or cumulative satisfaction is required so that
individual satisfaction episodes become aggregated or blended” (Oliver, 1999, p. 34). In
addition, for determined loyalty, more than cumulative satisfaction is needed (Oliver, 1999).
Satisfaction can be thought of as an important determinant of behavioral outcomes including
brand equity (Anderson, Fornell, & Lehmann, 1994; Torres & Tribó, 2011), brand trust (Ha &
Perks, 2005; Tax, Brown, & Chandrashekaran, 1998), and brand loyalty (Bloemer & Lemmink,
1992, Bloemer & Kasper, 1995; Caruana, 2002). As shown in Table 2.8, customer satisfaction
has been deemed a critical factor for behavioral outcomes across various disciplines.
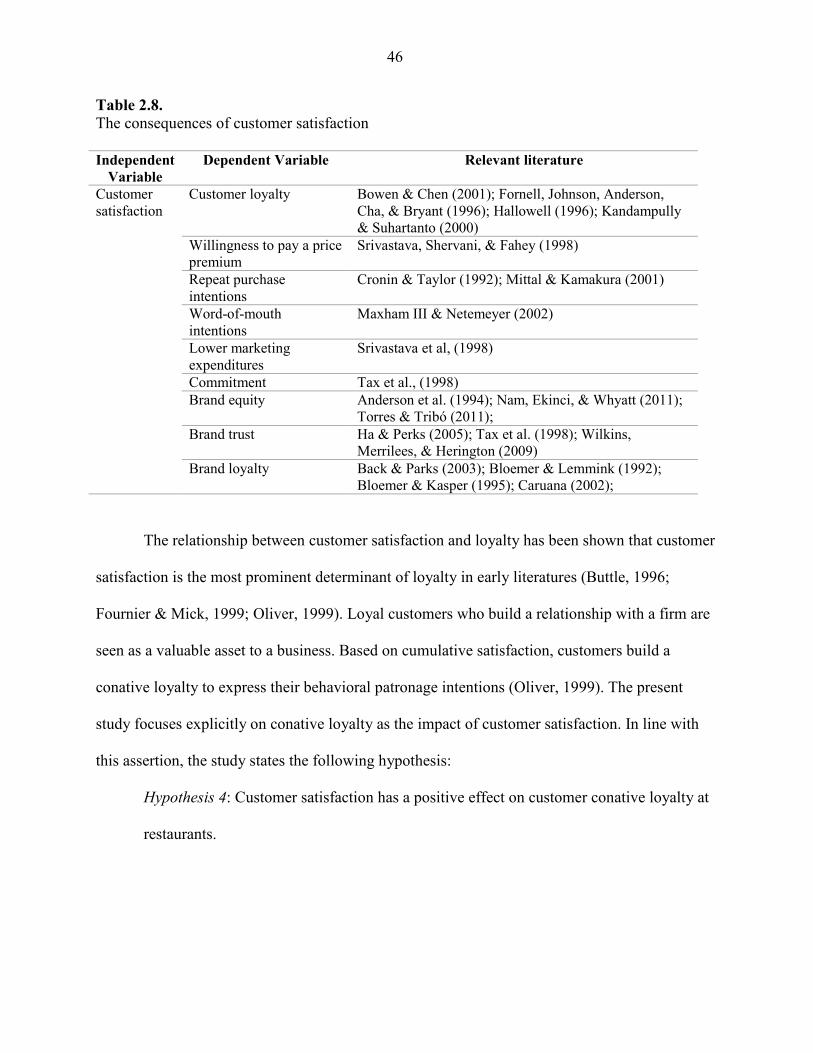
46
Table 2.8.
The consequences of customer satisfaction
Independent
Variable
Dependent Variable Relevant literature
Customer satisfaction
Customer loyalty Bowen & Chen (2001); Fornell, Johnson, Anderson, Cha, & Bryant (1996); Hallowell (1996); Kandampully & Suhartanto (2000)
Willingness to pay a price premium
Srivastava, Shervani, & Fahey (1998)
Repeat purchase intentions
Cronin & Taylor (1992); Mittal & Kamakura (2001)
Word-of-mouth intentions
Maxham III & Netemeyer (2002)
Lower marketing expenditures
Srivastava et al, (1998)
Commitment Tax et al., (1998)
Brand equity Anderson et al. (1994); Nam, Ekinci, & Whyatt (2011); Torres & Tribó (2011);
Brand trust Ha & Perks (2005); Tax et al. (1998); Wilkins, Merrilees, & Herington (2009)
Brand loyalty Back & Parks (2003); Bloemer & Lemmink (1992); Bloemer & Kasper (1995); Caruana (2002);
The relationship between customer satisfaction and loyalty has been shown that customer
satisfaction is the most prominent determinant of loyalty in early literatures (Buttle, 1996;
Fournier & Mick, 1999; Oliver, 1999). Loyal customers who build a relationship with a firm are
seen as a valuable asset to a business. Based on cumulative satisfaction, customers build a
conative loyalty to express their behavioral patronage intentions (Oliver, 1999). The present
study focuses explicitly on conative loyalty as the impact of customer satisfaction. In line with
this assertion, the study states the following hypothesis:
Hypothesis 4: Customer satisfaction has a positive effect on customer conative loyalty at
restaurants.
47
Research Framework and Hypotheses
This study applied S-D logic and derived research hypotheses to theorize the
relationships between proposed constructs. The following conceptual model was developed
based on the proposed hypotheses (See Figure 2.1). The proposed conceptual model and
hypotheses provide the theoretical relationships that address customer perception with respect to
restaurant innovativeness, two sub-constructs of customer value co-creation behavior, and
attitudinal and behavioral aspects (customer satisfaction and conative loyalty) of outcomes in the
formation of value creation. The measures and methodology used to test this conceptual
framework are discussed in chapter three.
The following is a summary of the hypotheses:
Hypothesis 1: Customer perception of restaurant innovativeness has a positive effect on
customer value co-creation behavior at restaurants.
Hypothesis 1a: Customer perception of restaurant innovativeness has a positive
effect on customer participation behavior at restaurants.
Hypothesis 1b: Customer perception of restaurant innovativeness has a positive
effect on customer citizenship behavior at restaurants.
Hypothesis 2: Customer value co-creation behavior has a positive effect on customer
satisfaction at restaurants.
Hypothesis 2a: Customer participation behavior has a positive effect on customer
satisfaction at restaurants.
Hypothesis 2b: Customer citizenship behavior has a positive effect on customer
satisfaction at restaurants.
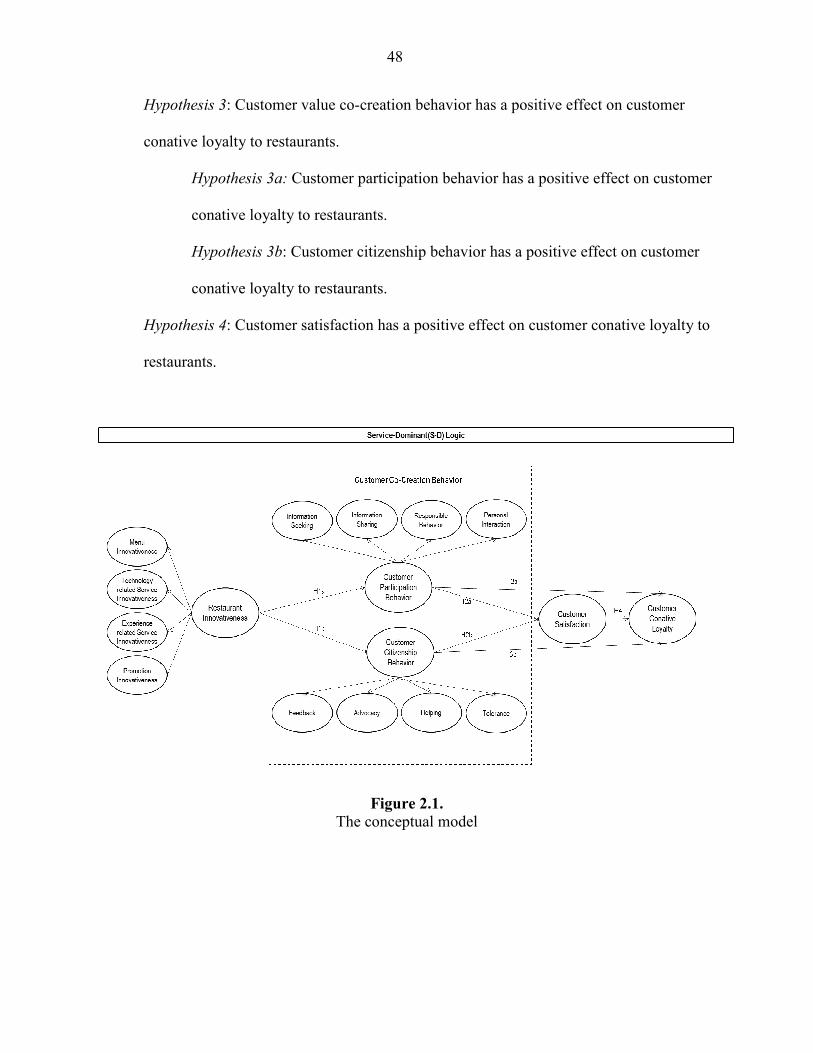
48
Hypothesis 3: Customer value co-creation behavior has a positive effect on customer
conative loyalty to restaurants.
Hypothesis 3a: Customer participation behavior has a positive effect on customer
conative loyalty to restaurants.
Hypothesis 3b: Customer citizenship behavior has a positive effect on customer
conative loyalty to restaurants.
Hypothesis 4: Customer satisfaction has a positive effect on customer conative loyalty to
restaurants.
Figure 2.1.
The conceptual model
49
CHAPTER 3
METHODS
Chapter 2 describes the conceptual model used in this study and develops seven
hypotheses with four constructs based on previous studies. The study uses a sequential mixed-
methods approach comprised of both qualitative and quantitative techniques in order to
effectively address research questions developed through an extensive literature review. This
chapter describes the use of human subjects, design of the study, instrument development, survey
procedures, and data analysis used. Four underlying constructs are used to understand the
relationships among customer perception of restaurant innovativeness (CPRI), customer value
creation behavior (CVCB), customer satisfaction (CS), and customer conative loyalty (CCL).
The chapter is divided into two phases: 1) scale development and preliminary assessment, and 2)
scale development and research model test. For phase one, construct scales were developed
(study 1) and assessed (study 2) since the measuring of innovativeness from the customer
perspective was limited (e.g., Kunz et al., 2011; Zolfagharian & Paswan, 2008) and no scale for
CPRI has been developed. With respect to the scales for customer behavior in formation of co-
creation, Yi and Gong (2013) first conceptualized and empirically verified scales for customer
value creation behavior in a multidimensional concept, consisting of two higher-order factors,
each with multiple dimensions. However, this scale was developed in Korea using a translated
version of a scale initially developed in English. To address this problem in subsequent studies,
Yi and Gong (2013) suggested the needs of validation of the dimensional structure of customer
value creation behavior across diverse cultures. Measurement items for CVCB were modified to
50
consistently reflect the needs of the restaurant industry, and were further assessed for their
applicability (study 2). A proposed research model was then tested (study 3) in phase 2.
The scale for CPRI, “a critical element in the evolution of fundamental knowledge”
(Churchill, 1974, p.64), was developed in the first phase of this chapter. The objectives of this
phase were to establish the content for each construct and to validate the scale both
psychometrically and theoretically. In the second phase, study 3 was conducted to confirm the
proposed research model and to establish its convergent, discriminant, nomological, and
predictive validity. A brief orientation to the statistical procedures with confirmatory factor
analysis and structural equation model was included.
Figure 3.1 depicts an outline of how scale development, preliminary assessment, and the
main study were performed.
Use of Human Subjects
Approval of Iowa State University’s Human Subjects Institutional Review Board was
obtained prior to data collection (Appendix A). All researchers involved in this study completed
the Human Subjects Research Assurance Training authorized by Iowa State University.
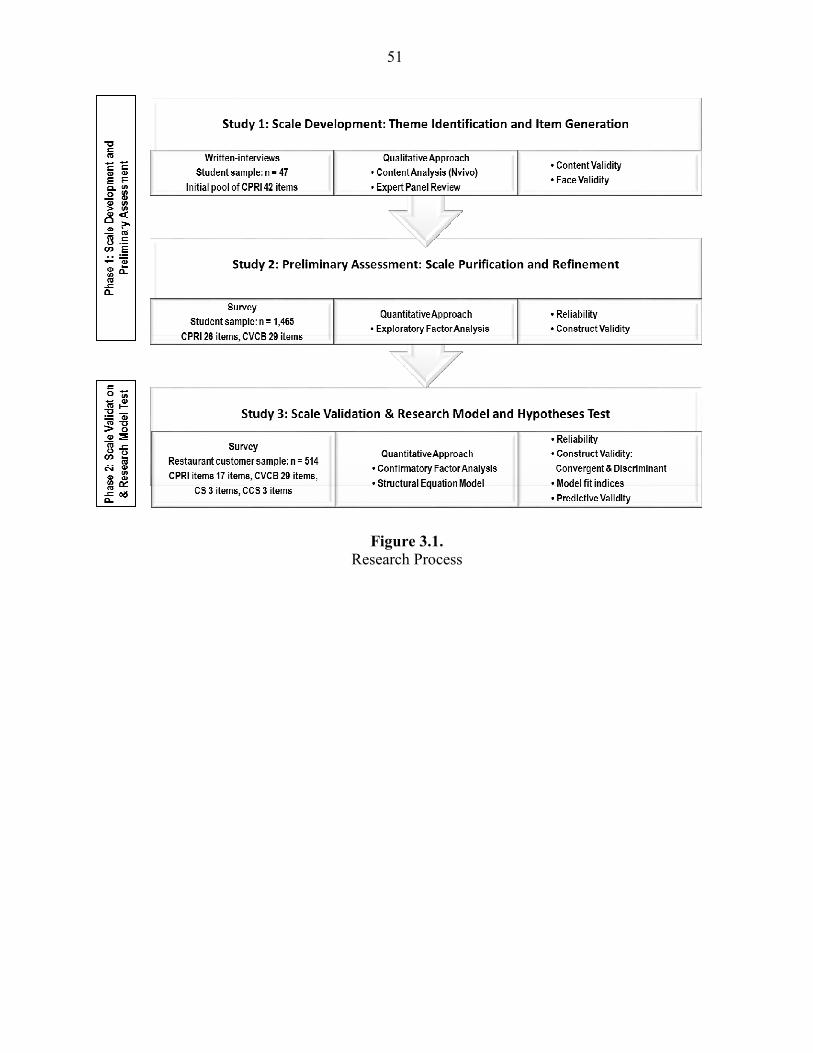
51
Figure 3.1.
Research Process
Figure 3.1.
Research Process
52
Phase 1: Scale Development and Preliminary Assessment
Sound measurement must exhibit content validity, criterion-related validity, construct
validity, and internal consistency (The American Psychological Association, 1985). To ensure
strong validation and clear linkages with theoretical domains, the present study developed
measurement items for CPRI by building face and content validity into the measures through
domain identification, item generation, and expert validation (DeVellis, 1991; Hinkin, 1995).
The following sections outline study 1 (scale development for CPRI) and study 2
(preliminary assessment for CPRI and CVCB) as undertaken in this study, the methodologies
used and results derived are sequentially elaborated.
Study 1: Scale Development for CPRI: Theme Identification and Item Generation
In Study 1, the scale of CPRI was developed. A qualitative content analysis was
conducted to identify theme and generated the initial pool to 42 items. An expert review was
conducted for content and face validity and then 26 items were retained for the next step: item
purification and refinement.
Content analysis using NVivo
Written interviews
Item generation is the most vital element that constitutes proper measures (Hinkin, 1995).
To establish content validity at this stage, content analysis of written-interview data and existing
literature were analyzed as guides to distinguish recurring themes (Grant & Davis,1997) that
53
exhibit patterns across data sets. In-depth interviewing is an effective approach for attaining
insights into phenomena of interest because respondents offer thorough contextual information
that cannot be acquired from survey approaches (Malhotra, Hall, Shaw, & Oppenheim, 2006). In
this study, group discussions and in-depth, open-ended personal written interviews were
conducted with a form obtained from AESHM340, a course taught in Hospitality and Apparel
Marketing Strategies at Iowa State University. The description of this course is as follow:
“Application of marketing principles to the hospitality-, events-, and apparel-related industries.
Emphasis on the role of marketing in an organization's overall strategic planning. Development
and evaluation techniques available to hospitality, events, apparel, and related businesses,
including advertising, sales promotion, packaging, and public relations”. The qualitative data
helped generate themes and develop more substantive insights with respect to CPRI. The open-
ended nature of the questions allowed respondents to describe their understanding of the term
“innovative restaurant.” The interview questions were:
1. In your opinion, which brand is the most innovative in the foodservice industry?
2. Please give examples to explain the reason you think that this restaurant provides
higher innovation than other competitors do.
3. Does the restaurant offer innovative services and products, in your opinion, that
influence your decision to visit the restaurant?
Procedures and coding
A qualitative content analysis was applied to analyze the written-interview data. The
technique identifies theme importance rather than word and category quantification (Flick,
2014). Written-interview transcripts were content analyzed using QSR's NVivo 11 software, a
54
widely accepted analysis tool for qualitative research (Malhotra et al., 2006) and one that was
useful in identifying themes and codes pertinent to CPRI in the present study. Written-interview
records generated approximately 47 transcript pages that were checked for accuracy and
imported into NVivo 11. The text associated with each code was printed, revisited and refined to
identify key themes.
Thematic analysis allowed the author to develop an initial coding set and a coding
manual. “Thematic analysis is a method for identifying, analyzing, and reporting patterns
(themes) within data” (Braun & Clarke, 2006, p. 76). This analysis process was in line with the
six phases of thematic analysis outlined by Braun and Clarke (2006): becoming familiar with the
data, generating initial codes, searching for themes, reviewing themes, defining and naming
themes, and producing a report. More specific analysis procedures followed the Nvivo 11
guidelines (QSR International, 2015).
Ongoing comparison analysis was used to synthesize themes from the NVivo 11 codes
after identifying nodes from written words, phrases, and sentences. Highest-level nodes were
selected through a process of linking or deleting similar nodes while analyzing nodes were
created from the initial coding. Final nodes resulted from repeated analysis of written interview
transcripts: the coding and refinement of combining themes.
A qualitative content analysis was conducted and resulted in four observed dimensions
and 16 themes believed to be associated with CPRI. The themes were cross-checked, based on a
review of literature related to consumer perceived innovativeness: e.g., product (Dell'Era &
Verganti, 2011), firm (Kunz et al., 2011), retail, (Lin, 2015), brand levels (Eisingerich & Rubera,
2010), and consumer innovativeness (Goldsmith & Hofacker, 1991) as part of the item
generation process. Dimensions for the present study were developed a priori and based on a
55
report by Lin (2015), and slightly modified. The initial priori codes were refined and modified
by including transcribed interview data (King, 1994; Crabtree & Miller, 1999). The above-
described procedure for scale development was instrumental in generating the initial pool of 56
primary items. Subsequent editing of redundant statements reduced the initial pool to 42 items.
Not all redundant items were eliminated since the goal was to maximize the content validity of
the scale; a degree of redundancy should ensure internal consistency at this stage of scale
development (Churchill, 1979; DeVellis, 1991).
Expert review for content and face validity
Face validity reflecting the intention of measure and content validity to represent a proper
sample of construct domains was assessed at this stage of item generation. Item refinement was
conducted through expert review (DeVellis, 1991; Grant & Davis, 1997) to select appropriate
items and to prevent subjectivity in analyzing qualitative data. The panel of experts comprised
eleven experts: six professors, three Ph.D. students in the hospitality field, and two professionals
in English communication. The panel represented “a judgment sample of persons who can offer
some ideas and insights into the phenomenon” (Churchill, 1979, p67).
Face validity is a subjective assessment defined as the extent to which a concept
measures what it is intended to measure (Nunnally & Bernstein, 1994). Social scientists cannot
assess content validity with empirical observation because most concepts examined are abstract
rather than concrete. Thus, face validity can be evaluated only by examining the opinions
expressed by a community of scholars and its measurements made with a high level of validity.
In the present study, expert review enabled the author to generate and judge measurement items
and ensure the face validity of constructs. Forty-two items were subjected to expert review in a
56
sorting process to identify and delete theoretically incoherent items. This review process ensured
that items demonstrated content adequacy essential for valid measurement (Hinkin, 1995;
Schriesheim, Powers, Scandura, Gardiner, & Lankau, 1993). The panel of experts, following the
instructions suggested by Grant and Davis (1997), were asked to consider three elements when
evaluating the CPRI instrument: representativeness, comprehensiveness, and clarity. Expert
opinions addressed item elimination, focused on redundancy, un-correlation, content ambiguity
(Hardesty & Bearden 2004), and construct scale representation (Zaichkowsky, 1985). The initial
scale for CPRI was modified, revised, and improved to enhance clarity and face validity based
on feedback from the review panel; 16 items from the initial pool were eliminated in this
process, and 26 were retained.
Study 2: Preliminary Assessment: Scale Purification and Refinement
Regarding the scale of CPRI, a subsequent stage of scale development involving the
preliminary test of randomized items followed the selection of an appropriate 26-item pool.
Initial assessment trimmed the number of original pool items to a manageable size through the
removal of items not meeting certain psychometric criteria or consistently delivering initial
reliability and validity (Netemeyer, Bearden, & Sharma, 2003). A total of 9 items were excluded
by exploratory factor analysis (EFA), retaining a 17-item pool to measure CPRI during further
analysis.
The scale of CVCB with 29-item pool was modified to fit the restaurant industry and
preliminary test was conducted by EPA, retaining a 29-item pool to measure CVCB during
further analysis.
57
Respondents and data collection
An empirical testing of items was conducted during the data-collection stage using a
convenience sample comprised of Iowa State University students. Students older than eighteen
who had experienced a branded casual dining restaurant during the past six months were
included in the survey. This ensured that sample units constituted the principal part of the
relevant population of interest. Netemeyer et al. (2003) suggested that measurement items
sampled from a relevant population are better-suited candidates for subsequent samples.
Therefore, study 1 adopted a sample of university students. The data was collected and
administered through an online survey system called Qualtrics. An invitational e-mail message
with a click-through link to the survey was distributed to potential respondent, and a drawing for
one of ten $20 Caribou gift certificates was used as an incentive for participation. A total of
31,601 university students enrolled at Iowa State University were invited to participate in the
survey. Returned responses totaled 2,004, 76 of which were not eligible for respondent
qualification based on two screening questions, and 248 returned questionnaires were
incomplete. From 1,680 completed data sets, 215 responses completed in 4 minutes were
eliminated due to low reliance, leaving 1,465 usable responses for further data analysis.
Statistical analysis
Data analysis for EFA with maximum likelihood was used to validate the scale and its
structure, and as a quantitative method for exploring the underlying structure of the measurement
scale (Bearden, Hardesty, & Rose, 2001). Maximum likelihood is a method of estimating the
parameters of a statistical model. When applied to a dataset and a given statistical model,
58
maximum-likelihood estimation offers estimates of the model's parameters. SPSS 21 was the
statistical package used for the analysis.
Validity and reliability
Construct validity
The main goal of scale development is to create a valid measure of an underlying
construct (Clark & Watson, 1995). Accordingly, assessment of construct validity was evaluated.
Reliability
The most common method of estimating internal consistency reliability of a measure is
Cronbach’s alpha, calculated by estimating the average inter-correlation between a set of items
and any other set of items drawn from the same measure (Cronbach, 1951; Cronbach &
Shavelson, 2004). The value of alpha ranges from zero to one, with a value of zero representing
complete unreliability and a value of one representing complete reliability. Cronbach’s alpha
should be at least 0.70 or higher to justify retaining an item in an adequate scale (Nunnally,
1978; Nunnally & Bernsteinm 1994). A cut-off value of 0.80 reflects a good scale (Garson,
2011; Hair, Anderson, Tatham, & Black, 1998), and a value greater than 0.90 is considered to be
excellent.
59
Phase 2: Scale Validation and Research Model Test
Study 3: Scale Validation & Research Model and Hypotheses Test
In Study 3, a conceptual model that addressed how constructs relate to value creation
behavior, including perceived innovativeness, customer satisfaction, and customer conative
loyalty was empirically tested.
Survey instrument
Measurement of customer perception of restaurant innovativeness
The first survey section asked respondents to rate their perceptions using a seven-point
Likert scale of restaurant innovativeness relative to the casual dining restaurant they chose.
Measurement items were developed by the author based on Studies 1 and 2 to assess the CPRI of
the proposed model. The 17 items in this construct were measured on a seven-point Likert scale,
with responses ranging from “strongly disagree” (1) to “strongly agree” (7).
Measurement of customer value creation behavior
Measurement items were modified from a prior study (Yi & Gong, 2013) based on Study
2 to assess the CVCB. The 29 items had to be adapted and modified to fit this study because the
CVCB studied by Yi and Gong (2013) focused on general business. The modified scale items,
along with the original scale items, are illustrated in Table 3.1. All items were assessed using a
seven-point Likert scale, with responses ranging from “strongly disagree” (1) to “strongly agree”
(7).
60
Measurement of customer satisfaction
The customer satisfaction measurement was adapted from Oliver (1999). Three items
were measured using a seven-point Likert scale, with responses ranging from “strongly disagree”
(1) to “strongly agree” (7). Higher scores indicated greater satisfaction with the restaurant.
Measurement of customer conative loyalty
Intention for customer conative loyalty was measured with three items generated by
Blodgett, Hill, & Tax, (1997). The three items in this construct were measured with the 7-point
Likert scale, with responses ranging from “strongly disagree” (1) to “strongly agree” (7).
Other questionnaire
The questionnaire also included a set of demographic (e.g., age, gender, education, and
ethnicity) and restaurant visiting behavior questions (e.g., frequency of dining out). The
questionnaire used in this survey is attached as Appendix B.
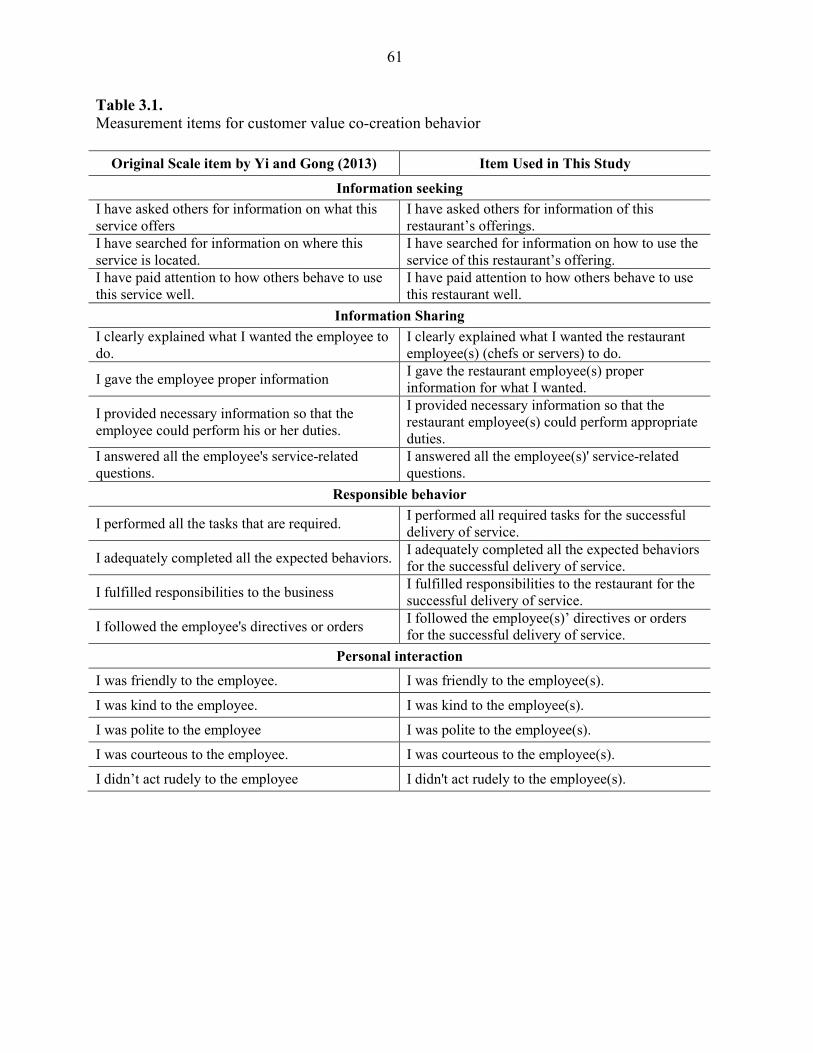
61
Table 3.1.
Measurement items for customer value co-creation behavior
Original Scale item by Yi and Gong (2013) Item Used in This Study
Information seeking
I have asked others for information on what this service offers
I have asked others for information of this restaurant’s offerings.
I have searched for information on where this service is located.
I have searched for information on how to use the service of this restaurant’s offering.
I have paid attention to how others behave to use this service well.
I have paid attention to how others behave to use this restaurant well.
Information Sharing
I clearly explained what I wanted the employee to do.
I clearly explained what I wanted the restaurant employee(s) (chefs or servers) to do.
I gave the employee proper information I gave the restaurant employee(s) proper information for what I wanted.
I provided necessary information so that the employee could perform his or her duties.
I provided necessary information so that the restaurant employee(s) could perform appropriate duties.
I answered all the employee's service-related questions.
I answered all the employee(s)' service-related questions.
Responsible behavior
I performed all the tasks that are required. I performed all required tasks for the successful delivery of service.
I adequately completed all the expected behaviors. I adequately completed all the expected behaviors for the successful delivery of service.
I fulfilled responsibilities to the business I fulfilled responsibilities to the restaurant for the successful delivery of service.
I followed the employee's directives or orders I followed the employee(s)’ directives or orders for the successful delivery of service.
Personal interaction
I was friendly to the employee. I was friendly to the employee(s).
I was kind to the employee. I was kind to the employee(s).
I was polite to the employee I was polite to the employee(s).
I was courteous to the employee. I was courteous to the employee(s).
I didn’t act rudely to the employee I didn't act rudely to the employee(s).
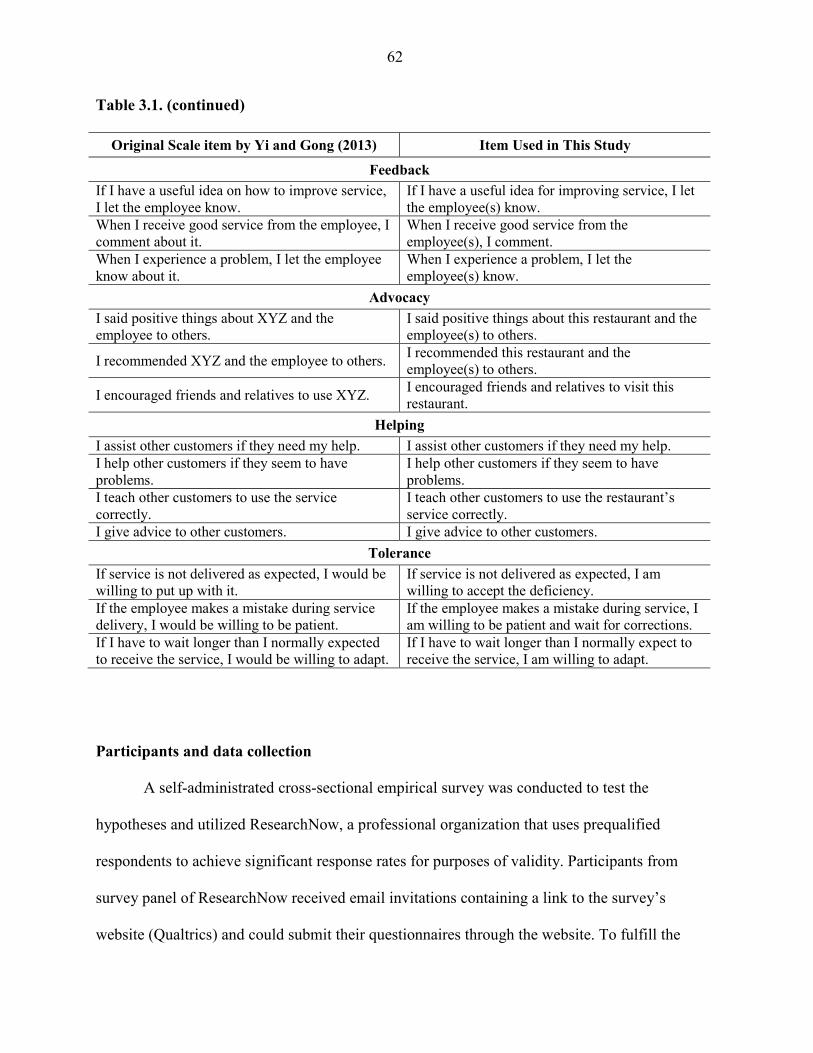
62
Table 3.1. (continued)
Original Scale item by Yi and Gong (2013) Item Used in This Study
Feedback
If I have a useful idea on how to improve service, I let the employee know.
If I have a useful idea for improving service, I let the employee(s) know.
When I receive good service from the employee, I comment about it.
When I receive good service from the employee(s), I comment.
When I experience a problem, I let the employee know about it.
When I experience a problem, I let the employee(s) know.
Advocacy
I said positive things about XYZ and the employee to others.
I said positive things about this restaurant and the employee(s) to others.
I recommended XYZ and the employee to others. I recommended this restaurant and the employee(s) to others.
I encouraged friends and relatives to use XYZ. I encouraged friends and relatives to visit this restaurant.
Helping
I assist other customers if they need my help. I assist other customers if they need my help.
I help other customers if they seem to have problems.
I help other customers if they seem to have problems.
I teach other customers to use the service correctly.
I teach other customers to use the restaurant’s service correctly.
I give advice to other customers. I give advice to other customers.
Tolerance
If service is not delivered as expected, I would be willing to put up with it.
If service is not delivered as expected, I am willing to accept the deficiency.
If the employee makes a mistake during service delivery, I would be willing to be patient.
If the employee makes a mistake during service, I am willing to be patient and wait for corrections.
If I have to wait longer than I normally expected to receive the service, I would be willing to adapt.
If I have to wait longer than I normally expect to receive the service, I am willing to adapt.
Participants and data collection
A self-administrated cross-sectional empirical survey was conducted to test the
hypotheses and utilized ResearchNow, a professional organization that uses prequalified
respondents to achieve significant response rates for purposes of validity. Participants from
survey panel of ResearchNow received email invitations containing a link to the survey’s
website (Qualtrics) and could submit their questionnaires through the website. To fulfill the
63
objectives of the study (the inclusion criteria), experience in dining at a branded casual dining
restaurant within the past six months was a condition with which participants had to comply. A
list of the top fifteen branded chain casual-dining restaurants based on Top 100 Chains: U.S.
Sales (Restaurant News, 2015) was provided, and participants were required to choose the one
restaurant with which they were most familiar and answer questions based on their experience
with that chosen restaurant brand. A list of the top fifteen branded chain casual-dining
restaurants includes: Applebee's Neighborhood Grill & Bar, Buffalo Wild Wings Grill & Bar,
Chili's Grill & Bar, Cracker Barrel Old Country Store, Denny’s, IHOP, Olive Garden, Outback
Steakhouse, Red Lobster, Red Robin Gourmet Burgers & Spirits, Ruby Tuesday, T.G.I. Friday's,
Texas Roadhouse, The Cheesecake Factory, and Waffle House.
Participants were selected by means of quota sampling to create representative samples
based on U.S. representative samples along four demographic census-based dimensions: gender,
age, region, and ethnicity. A total of 765 surveys were obtained, and of these 207 responses,
which were incomplete or unqualified, were eliminated. From 558 completed data sets, 44
responses completed in 4 minutes were eliminated due to low reliance, leaving 514 usable
responses for further data analysis.
Statistical analysis
As a type of deductive study that relies on quantitative methodology, confirmatory factor
analysis (CFA) and structural equation modeling (SEM) were selected as appropriate statistical
methodologies because of their superior advantages over regression modeling: 1) the usage of
multiple indicators per each latent variable to reduce measurement error, 2) the desirability of
testing a model overall rather than coefficients independently, 3) the capacity to a test model
64
with multiple dependent variables, 4) the capability to model mediating variables rather than
being restricted to an additive model as in regression, and 5) the desirability of its strategy for
comparing alternative models to evaluate relative model fit (Garson, 2011).
The two-step approach suggested by Anderson and Gerbing (1988), Burt (1976), and
Kline (1998) offers the same unique advantages of separating the two phases into measurement
and structural models. The first step involved CFA with maximum likelihood of estimating the
measurement component of the constructs, determining the relationships of the indicators with
their posited underlying constructs. In CFA, an a priori model is investigated that outlines a set
of relationships between observed indicators and the underlying unobserved constructs (Byrne,
2001; Schumacker & Lomax, 2004). The measurement model describes constructs utilized by
the model, assigns observed variables to each, and uses factor analysis to assess the degree to
which the observed variables load their latent constructs. The measurement model estimates how
closely the model reflects the relationships actually observed in the collected data, a process
referred to as model fitting. Comparative fit indexes compare the hypothetical model to a null
model, confirming that there are no common factors, and that sampling error alone can describe
the items’ covariance (Tanaka, 1993).
Structural models were assessed using structural equation modeling (SEM) as the second
part of the two-step approach. SEM estimates the hypothesized casual and covariance linear
relationships among exogenous and endogenous latent constructs, item loading, and
measurement error for each observed item, and tests for best-fitting model. Measurement error
shows both inaccuracy in participant responses and their measurement, as well as imprecision in
the theoretical conceptual representation by the observed variances (Hair et al., 1998; Jöreskog &
Sörbom, 1996). While maximum-likelihood estimates for both of these models can be generated,
65
the measurement model was first assessed and fixed prior to assessment of the structural model
(Anderson & Gerbing, 1988; Burt, 1976). The rationale for this approach is that the prevention of
possible interaction between measurement and structural models resulting from high levels of
reliability and factor loadings of indicators can be achieved when the potential does not exist for
within-construct versus between-construct effects in estimation (Adams, Nelson, & Todd, 1992;
Burt, 1976; Hair et al., 1998). A latent variable assessment is based on multiple observed
variables, but the SEM permits the use of constructs represented by single items. SPSS 21.0 and
AMOS 21.0 were statistical packages used for the analysis performed in this study.
Validity and reliability
Reliability of the measurement instruments
In the internal consistency procedure, the traditional method of reliability estimates is
given by Cronbach’s alpha (Cronbach, 1951) since it has the same logical status as coefficients
arising from other reliability assessment methods (Carmines & Zeller, 1979).
Convergent validity
Convergent validity refers to assessment by pattern coefficients, composite reliability,
and average variance extracted. Convergent validity is validated by showing that indicators for
latent variables correlate with each other to an acceptable degree. Acceptable goodness-of-fit
measures for a model indicate convergent validity when it is also the case that pattern
coefficients are at least 0.60 for all indicators using a common rule of thumb (Bagozzi & Yi,
1988; Hair et al., 1998; Segars, 1997). Composite reliability should be equal to or greater than
66
0.70 (Nunnally & Bernstein, 1994). The AVE above 0.50 is treated as an indicator of convergent
validity (Fornell & Larcker, 1981).
Discriminant validity
Discriminant validity is assessed by statistically testing the difference between two
constructs: checking the AVE (Average Variance Extracted) of each construct. Each construct
AVE value should be greater than its correlation with other constructs, and each item in this
respect should have a greater effect on itself than on other constructs (Fornell, & Larcker, 1981).
Model fit indices tests
Model fit indices tests assess whether the model being tested should be accepted or
rejected. The overall fit tests do not establish that particular paths within the model are
significant. If the model is accepted, it then interprets the path coefficient in the model. Several
fit indices such as Chi-square, Root Mean Square Error of Approximation (RMSEA),
Comparative Fit Index (CFI), Normed Fit Index (NFI), Tucker-Lewis Index (TLI), and
Incremental Fit Index (IFI) were chosen to evaluate the fit of the data to the hypothesized models
in the present study (Kline, 1998).
67
CHAPTER 4
RESULTS
This chapter presents the results of Study 1 and Study 2 at the first phase (scale
development and preliminary assessment) and the result of Study 3 at the second phase (scale
development & research model and hypothesis test). First, the result of Study 1 describes the
scale development for customer perception of restaurant innovativeness (CPRI). Second, the
result of Study 2 presents preliminary assessment for scale purification and refinement for CPRI
from Study 1 and customer value co-creation behavior (CVCB). The result of exploratory factor
analysis (EFA) is presented. Last, the result of Study 3 provides the statistical analysis of
confirmatory factor analysis (CFA) for the measurement model and the structural equation
modeling (SEM) for the structural model.
Phase 1: Scale Development and Preliminary Assessment
Study 1: Scale Development for CPRI: Theme Identification and Item Generation
Content analysis using NVivo
As described in Chapter 3, written interviews regarding restaurant innovativeness were
conducted using a forty-seven participant student sample, and a qualitative content analysis was
performed using QSR's NVivo 11 software. Ongoing comparison analysis was used to synthesize
themes from the NVivo 11 codes after identifying nodes from written words, phrases, and
sentences. Final nodes were generated from repeated analysis of the written interview transcripts
as well as the coding and refinement of combined themes.
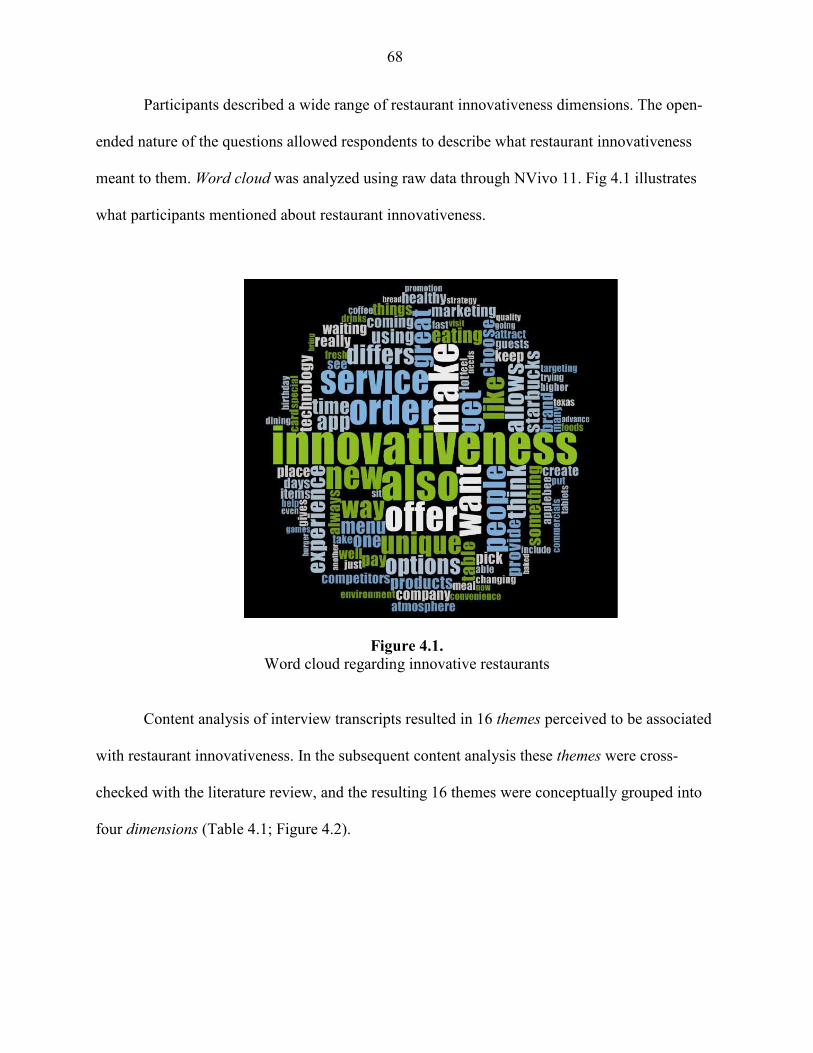
68
Participants described a wide range of restaurant innovativeness dimensions. The open-
ended nature of the questions allowed respondents to describe what restaurant innovativeness
meant to them. Word cloud was analyzed using raw data through NVivo 11. Fig 4.1 illustrates
what participants mentioned about restaurant innovativeness.
Figure 4.1.
Word cloud regarding innovative restaurants
Content analysis of interview transcripts resulted in 16 themes perceived to be associated
with restaurant innovativeness. In the subsequent content analysis these themes were cross-
checked with the literature review, and the resulting 16 themes were conceptually grouped into
four dimensions (Table 4.1; Figure 4.2).
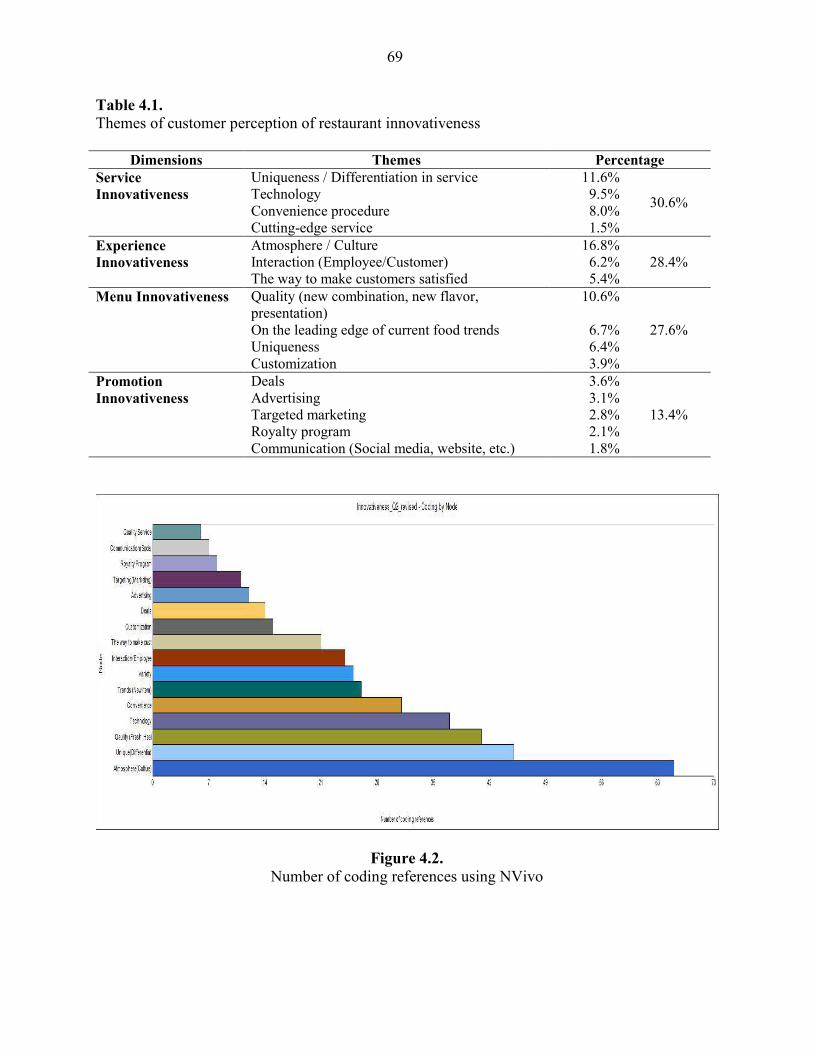
69
Table 4.1.
Themes of customer perception of restaurant innovativeness
Dimensions Themes Percentage
Service
Innovativeness
Uniqueness / Differentiation in service 11.6%
30.6% Technology 9.5% Convenience procedure 8.0% Cutting-edge service 1.5%
Experience
Innovativeness
Atmosphere / Culture 16.8% 28.4% Interaction (Employee/Customer) 6.2%
The way to make customers satisfied 5.4%
Menu Innovativeness Quality (new combination, new flavor, presentation)
10.6%
27.6% On the leading edge of current food trends 6.7% Uniqueness 6.4% Customization 3.9%
Promotion
Innovativeness
Deals 3.6%
13.4% Advertising 3.1% Targeted marketing 2.8% Royalty program 2.1% Communication (Social media, website, etc.) 1.8%
Figure 4.2.
Number of coding references using NVivo
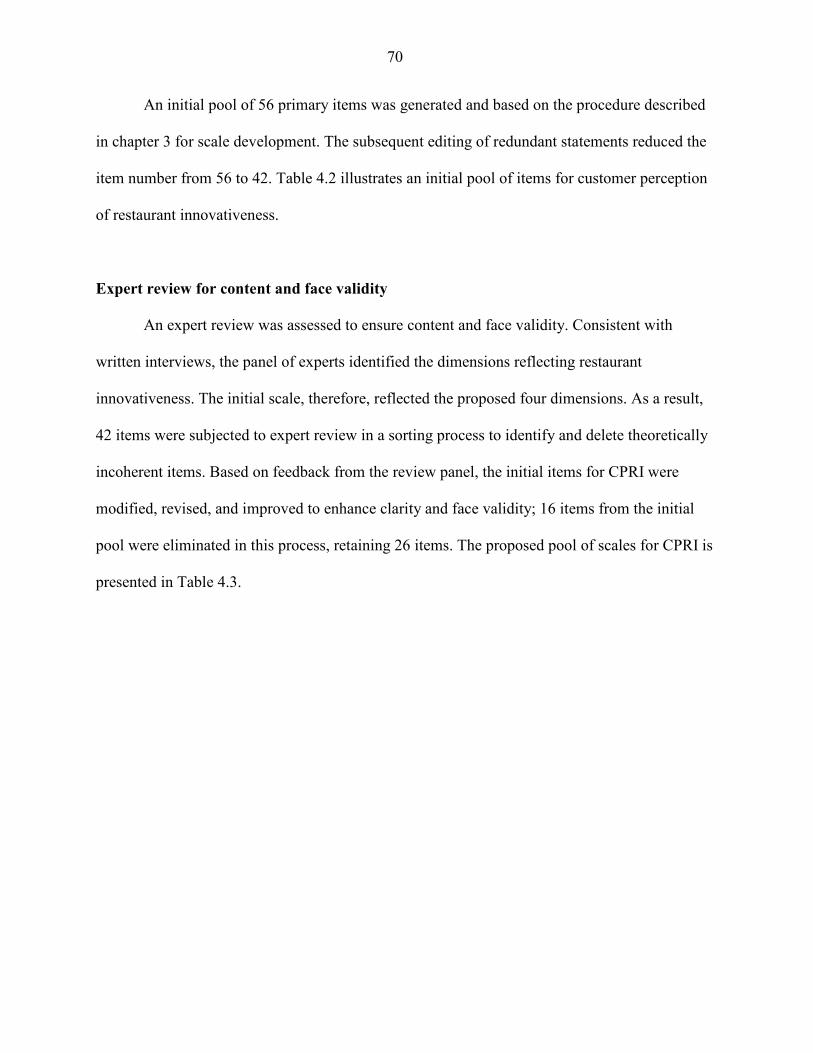
70
An initial pool of 56 primary items was generated and based on the procedure described
in chapter 3 for scale development. The subsequent editing of redundant statements reduced the
item number from 56 to 42. Table 4.2 illustrates an initial pool of items for customer perception
of restaurant innovativeness.
Expert review for content and face validity
An expert review was assessed to ensure content and face validity. Consistent with
written interviews, the panel of experts identified the dimensions reflecting restaurant
innovativeness. The initial scale, therefore, reflected the proposed four dimensions. As a result,
42 items were subjected to expert review in a sorting process to identify and delete theoretically
incoherent items. Based on feedback from the review panel, the initial items for CPRI were
modified, revised, and improved to enhance clarity and face validity; 16 items from the initial
pool were eliminated in this process, retaining 26 items. The proposed pool of scales for CPRI is
presented in Table 4.3.
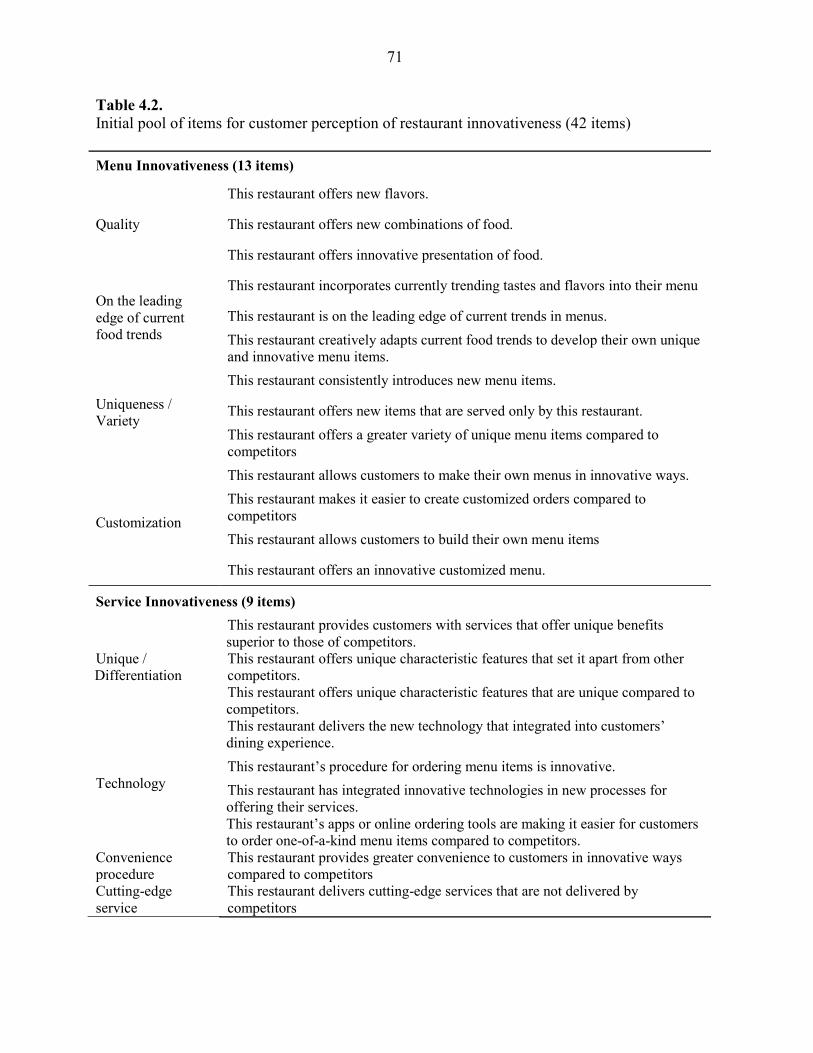
71
Table 4.2.
Initial pool of items for customer perception of restaurant innovativeness (42 items)
Menu Innovativeness (13 items)
Quality
This restaurant offers new flavors.
This restaurant offers new combinations of food.
This restaurant offers innovative presentation of food.
On the leading edge of current food trends
This restaurant incorporates currently trending tastes and flavors into their menu
This restaurant is on the leading edge of current trends in menus.
This restaurant creatively adapts current food trends to develop their own unique and innovative menu items.
Uniqueness / Variety
This restaurant consistently introduces new menu items.
This restaurant offers new items that are served only by this restaurant.
This restaurant offers a greater variety of unique menu items compared to competitors
Customization
This restaurant allows customers to make their own menus in innovative ways.
This restaurant makes it easier to create customized orders compared to competitors
This restaurant allows customers to build their own menu items
This restaurant offers an innovative customized menu.
Service Innovativeness (9 items)
Unique / Differentiation
This restaurant provides customers with services that offer unique benefits superior to those of competitors. This restaurant offers unique characteristic features that set it apart from other competitors. This restaurant offers unique characteristic features that are unique compared to competitors.
Technology
This restaurant delivers the new technology that integrated into customers’ dining experience.
This restaurant’s procedure for ordering menu items is innovative.
This restaurant has integrated innovative technologies in new processes for offering their services. This restaurant’s apps or online ordering tools are making it easier for customers to order one-of-a-kind menu items compared to competitors.
Convenience procedure
This restaurant provides greater convenience to customers in innovative ways compared to competitors
Cutting-edge service
This restaurant delivers cutting-edge services that are not delivered by competitors
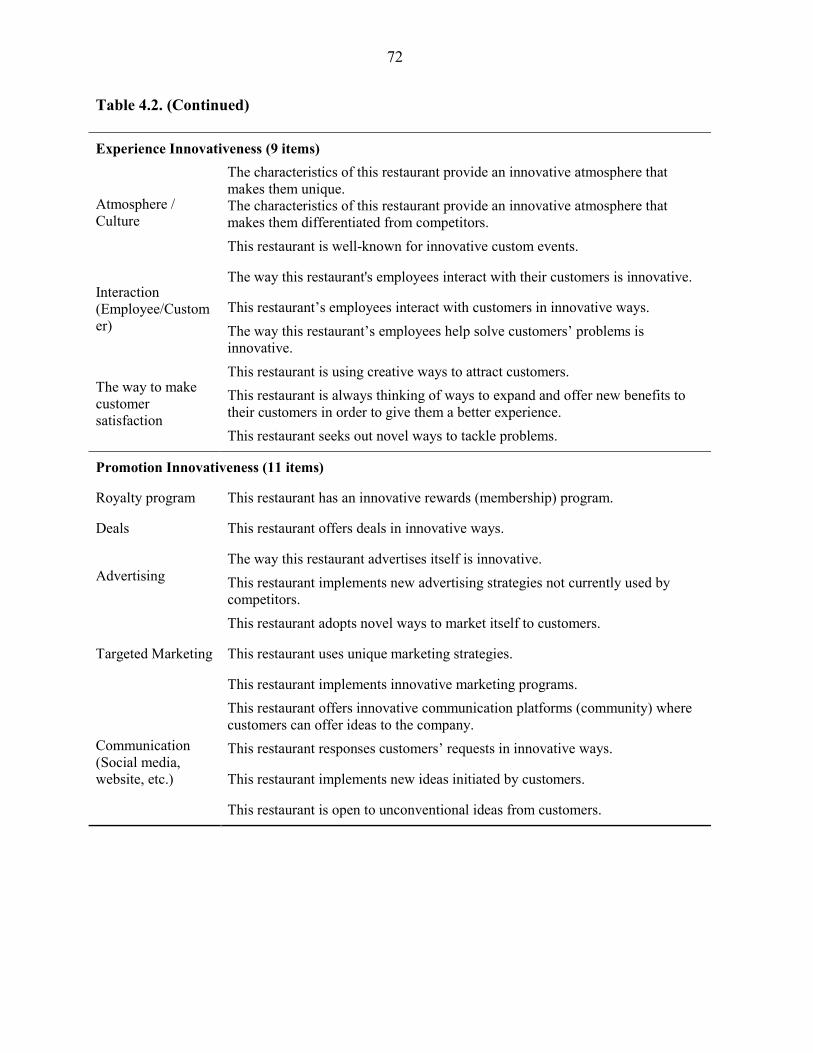
72
Table 4.2. (Continued)
Experience Innovativeness (9 items)
Atmosphere / Culture
The characteristics of this restaurant provide an innovative atmosphere that makes them unique. The characteristics of this restaurant provide an innovative atmosphere that makes them differentiated from competitors.
This restaurant is well-known for innovative custom events.
Interaction (Employee/Customer)
The way this restaurant's employees interact with their customers is innovative.
This restaurant’s employees interact with customers in innovative ways.
The way this restaurant’s employees help solve customers’ problems is innovative.
The way to make customer satisfaction
This restaurant is using creative ways to attract customers.
This restaurant is always thinking of ways to expand and offer new benefits to their customers in order to give them a better experience.
This restaurant seeks out novel ways to tackle problems.
Promotion Innovativeness (11 items)
Royalty program This restaurant has an innovative rewards (membership) program.
Deals This restaurant offers deals in innovative ways.
Advertising The way this restaurant advertises itself is innovative.
This restaurant implements new advertising strategies not currently used by competitors.
Targeted Marketing
This restaurant adopts novel ways to market itself to customers.
This restaurant uses unique marketing strategies.
This restaurant implements innovative marketing programs.
Communication (Social media, website, etc.)
This restaurant offers innovative communication platforms (community) where customers can offer ideas to the company.
This restaurant responses customers’ requests in innovative ways.
This restaurant implements new ideas initiated by customers.
This restaurant is open to unconventional ideas from customers.
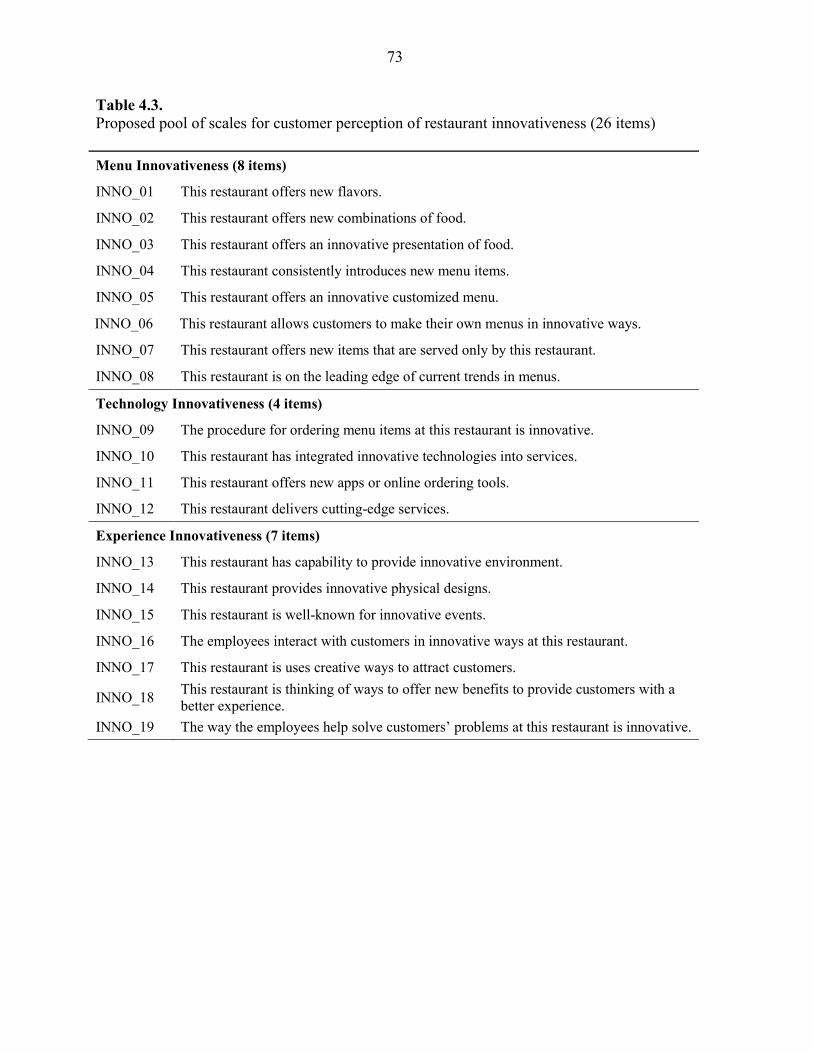
73
Table 4.3.
Proposed pool of scales for customer perception of restaurant innovativeness (26 items)
Menu Innovativeness (8 items)
INNO_01 This restaurant offers new flavors.
INNO_02 This restaurant offers new combinations of food.
INNO_03 This restaurant offers an innovative presentation of food.
INNO_04 This restaurant consistently introduces new menu items.
INNO_05 This restaurant offers an innovative customized menu.
INNO_06 This restaurant allows customers to make their own menus in innovative ways.
INNO_07 This restaurant offers new items that are served only by this restaurant.
INNO_08 This restaurant is on the leading edge of current trends in menus.
Technology Innovativeness (4 items)
INNO_09 The procedure for ordering menu items at this restaurant is innovative.
INNO_10 This restaurant has integrated innovative technologies into services.
INNO_11 This restaurant offers new apps or online ordering tools.
INNO_12 This restaurant delivers cutting-edge services.
Experience Innovativeness (7 items)
INNO_13 This restaurant has capability to provide innovative environment.
INNO_14 This restaurant provides innovative physical designs.
INNO_15 This restaurant is well-known for innovative events.
INNO_16 The employees interact with customers in innovative ways at this restaurant.
INNO_17 This restaurant is uses creative ways to attract customers.
INNO_18 This restaurant is thinking of ways to offer new benefits to provide customers with a better experience.
INNO_19 The way the employees help solve customers’ problems at this restaurant is innovative.
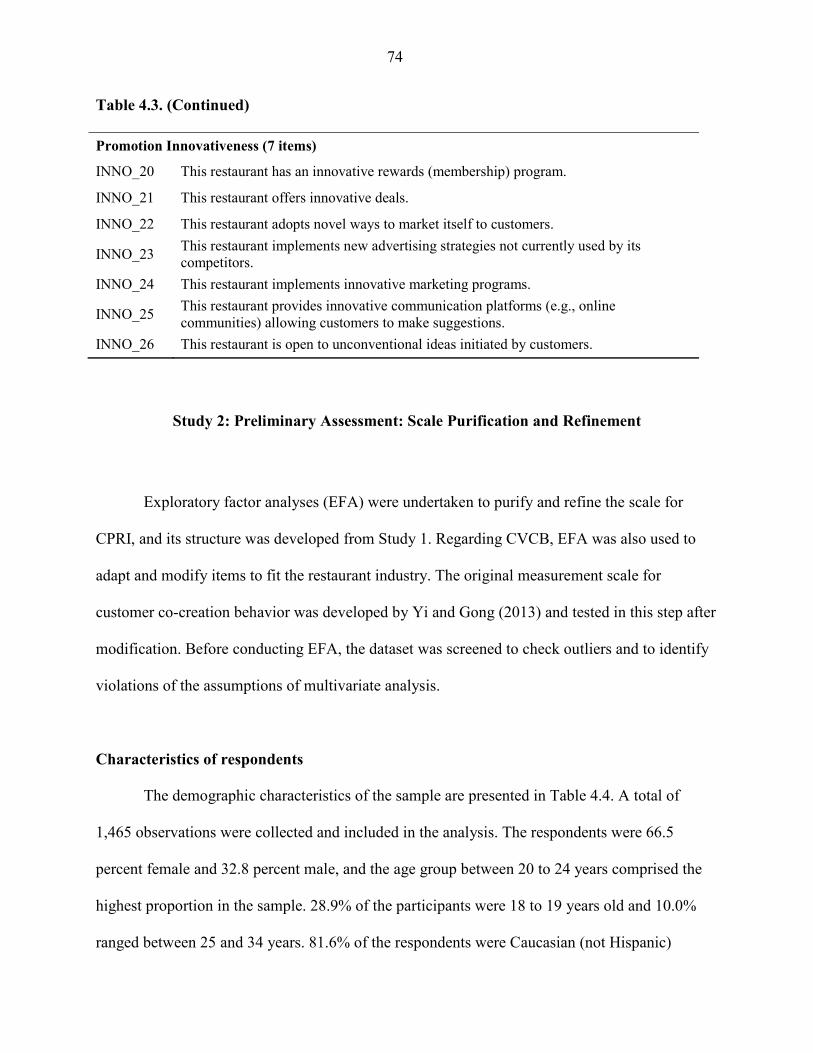
74
Table 4.3. (Continued)
Promotion Innovativeness (7 items)
INNO_20 This restaurant has an innovative rewards (membership) program.
INNO_21 This restaurant offers innovative deals.
INNO_22 This restaurant adopts novel ways to market itself to customers.
INNO_23 This restaurant implements new advertising strategies not currently used by its competitors.
INNO_24 This restaurant implements innovative marketing programs.
INNO_25 This restaurant provides innovative communication platforms (e.g., online communities) allowing customers to make suggestions.
INNO_26 This restaurant is open to unconventional ideas initiated by customers.
Study 2: Preliminary Assessment: Scale Purification and Refinement
Exploratory factor analyses (EFA) were undertaken to purify and refine the scale for
CPRI, and its structure was developed from Study 1. Regarding CVCB, EFA was also used to
adapt and modify items to fit the restaurant industry. The original measurement scale for
customer co-creation behavior was developed by Yi and Gong (2013) and tested in this step after
modification. Before conducting EFA, the dataset was screened to check outliers and to identify
violations of the assumptions of multivariate analysis.
Characteristics of respondents
The demographic characteristics of the sample are presented in Table 4.4. A total of
1,465 observations were collected and included in the analysis. The respondents were 66.5
percent female and 32.8 percent male, and the age group between 20 to 24 years comprised the
highest proportion in the sample. 28.9% of the participants were 18 to 19 years old and 10.0%
ranged between 25 and 34 years. 81.6% of the respondents were Caucasian (not Hispanic)
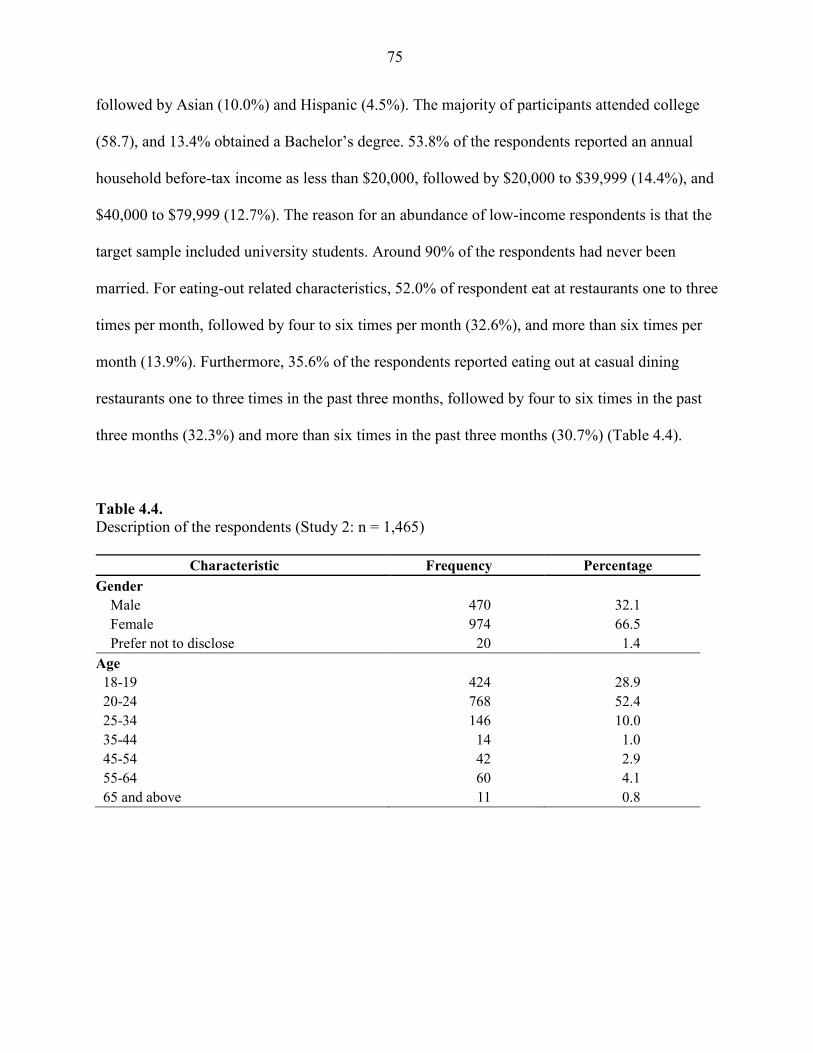
75
followed by Asian (10.0%) and Hispanic (4.5%). The majority of participants attended college
(58.7), and 13.4% obtained a Bachelor’s degree. 53.8% of the respondents reported an annual
household before-tax income as less than $20,000, followed by $20,000 to $39,999 (14.4%), and
$40,000 to $79,999 (12.7%). The reason for an abundance of low-income respondents is that the
target sample included university students. Around 90% of the respondents had never been
married. For eating-out related characteristics, 52.0% of respondent eat at restaurants one to three
times per month, followed by four to six times per month (32.6%), and more than six times per
month (13.9%). Furthermore, 35.6% of the respondents reported eating out at casual dining
restaurants one to three times in the past three months, followed by four to six times in the past
three months (32.3%) and more than six times in the past three months (30.7%) (Table 4.4).
Table 4.4.
Description of the respondents (Study 2: n = 1,465)
Characteristic Frequency Percentage
Gender
Male 470 32.1
Female 974 66.5
Prefer not to disclose 20 1.4
Age
18-19 424 28.9
20-24 768 52.4
25-34 146 10.0
35-44 14 1.0
45-54 42 2.9
55-64 60 4.1
65 and above 11 0.8
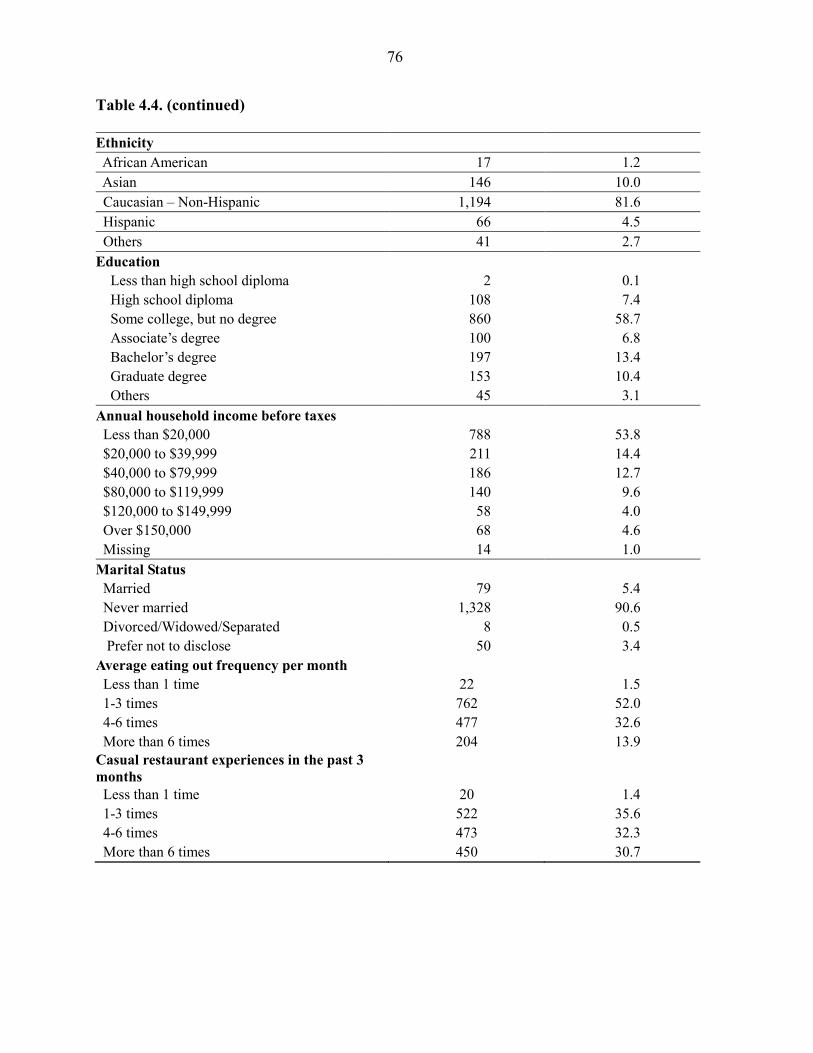
76
Table 4.4. (continued)
Ethnicity
African American 17 1.2
Asian 146 10.0
Caucasian – Non-Hispanic 1,194 81.6
Hispanic 66 4.5
Others 41 2.7
Education
Less than high school diploma 2 0.1
High school diploma 108 7.4
Some college, but no degree 860 58.7
Associate’s degree 100 6.8
Bachelor’s degree 197 13.4
Graduate degree 153 10.4
Others 45 3.1
Annual household income before taxes
Less than $20,000 788 53.8
$20,000 to $39,999 211 14.4
$40,000 to $79,999 186 12.7
$80,000 to $119,999 140 9.6
$120,000 to $149,999 58 4.0
Over $150,000 68 4.6
Missing 14 1.0
Marital Status
Married 79 5.4
Never married 1,328 90.6
Divorced/Widowed/Separated 8 0.5
Prefer not to disclose 50 3.4
Average eating out frequency per month
Less than 1 time 22 1.5
1-3 times 762 52.0
4-6 times 477 32.6
More than 6 times 204 13.9
Casual restaurant experiences in the past 3
months
Less than 1 time 20 1.4
1-3 times 522 35.6
4-6 times 473 32.3
More than 6 times 450 30.7
77
Preliminary data analysis of measurement items: CPRI and CVCB
Normality assumptions
The multivariate normality test showed the skewness and kurtosis values of each
indicator. As a rule of thumb, data may be assumed to be normal if skewness and kurtosis are
within the range of ± 5.0 (Schumacker & Lomax, 2004; Yuan & Bentler, 2006). For 52 variables
under 14 constructs, values of skewness and kurtosis did not exceed the criteria of normality
except two variables (PI1 and PI2): Skewness ranges from 0.42 to 0.26 and Kurtosis ranges from
1.03 to 6.05.
Table 4.5 illustrates the means and standard deviations of each item for 12 constructs,
providing the overview of each of the variables.
Exploratory factor analysis
Statistical analysis: CPRI
The EFA was initially undertaken for the pool of 26 items using principal component
analysis with varimax rotation. The Kaiser-Meyer-Olkin Measure of sampling adequacy was
0.96, and the Bartlett’s Test of Sphericity was 25993.30 (p < .001), indicating the sample was
appropriate for factor analysis before moving on to the remainder of reliability and validity. The
four factors with 26 items each were identified since no items with low loadings were found.
Cronbach alphas for the four dimensions ranged from 0.87 to 0.92, well above the recommended
level of 0.70 (Hair et al., 2006), and showed internal scale consistency. The initial EFA identified
four factors with eigenvalues above one that together explained 65.1% of the total variance.
Overall, the resolved factor structure represented consistency with the conceptual model. Results
of the EFA for initial measurement items are reported in Table 4.5.
78
The purpose of Study 2 was to purify and trim the original pool of items. Items
considered for deletion were based on careful review. An examination of factor loadings
suggested that the first factor was related promotion such as providing customers with new
advertising strategies, innovativeness deals, and communication platforms. This first factor was
labeled promotion innovativeness and included items initially classified by the dimension of
promotion innovativeness from Study 1. Three items were reduncant and deleted (i.e., INNO_22,
INNO_23 and INNO_26). One item (INNO_18) was discarded because its loading onto a factor
did not show appropriate theoretical justification. The second dimension measured menu
innovativeness. Three items were similar and deleted (i.e., INNO_06 and INNO_07) and one
other one was considered a broad concept rather than product innovativeness (i.e., INNO_08).
The third dimension reflected experience related service innovativeness. One item (INNO_17)
was discarded due to double loadings, and could be confused with promotion innovativeness.
The fourth dimension replicated technology related service innovativeness. One item (i.e.,
INNO_13) was discarded because its loading onto a factor did not show appropriate theoretical
justification.
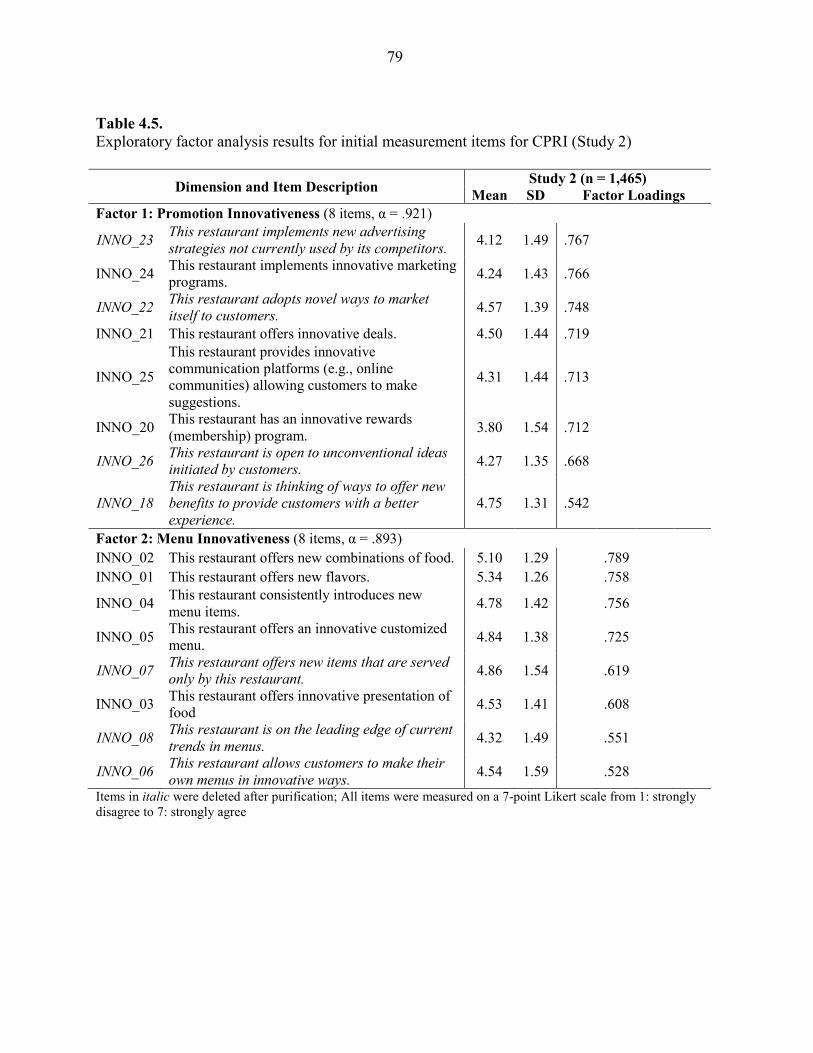
79
Table 4.5.
Exploratory factor analysis results for initial measurement items for CPRI (Study 2)
Dimension and Item Description Study 2 (n = 1,465)
Mean SD Factor Loadings
Factor 1: Promotion Innovativeness (8 items, α = .921)
INNO_23 This restaurant implements new advertising
strategies not currently used by its competitors. 4.12 1.49 .767
INNO_24 This restaurant implements innovative marketing programs.
4.24 1.43 .766
INNO_22 This restaurant adopts novel ways to market
itself to customers. 4.57 1.39 .748
INNO_21 This restaurant offers innovative deals. 4.50 1.44 .719
INNO_25
This restaurant provides innovative communication platforms (e.g., online communities) allowing customers to make suggestions.
4.31 1.44 .713
INNO_20 This restaurant has an innovative rewards (membership) program.
3.80 1.54 .712
INNO_26 This restaurant is open to unconventional ideas
initiated by customers. 4.27 1.35 .668
INNO_18
This restaurant is thinking of ways to offer new
benefits to provide customers with a better
experience.
4.75 1.31 .542
Factor 2: Menu Innovativeness (8 items, α = .893)
INNO_02 This restaurant offers new combinations of food. 5.10 1.29 .789
INNO_01 This restaurant offers new flavors. 5.34 1.26 .758
INNO_04 This restaurant consistently introduces new menu items.
4.78 1.42 .756
INNO_05 This restaurant offers an innovative customized menu.
4.84 1.38 .725
INNO_07 This restaurant offers new items that are served
only by this restaurant. 4.86 1.54 .619
INNO_03 This restaurant offers innovative presentation of food
4.53 1.41 .608
INNO_08 This restaurant is on the leading edge of current
trends in menus. 4.32 1.49 .551
INNO_06 This restaurant allows customers to make their
own menus in innovative ways. 4.54 1.59 .528
Items in italic were deleted after purification; All items were measured on a 7-point Likert scale from 1: strongly disagree to 7: strongly agree
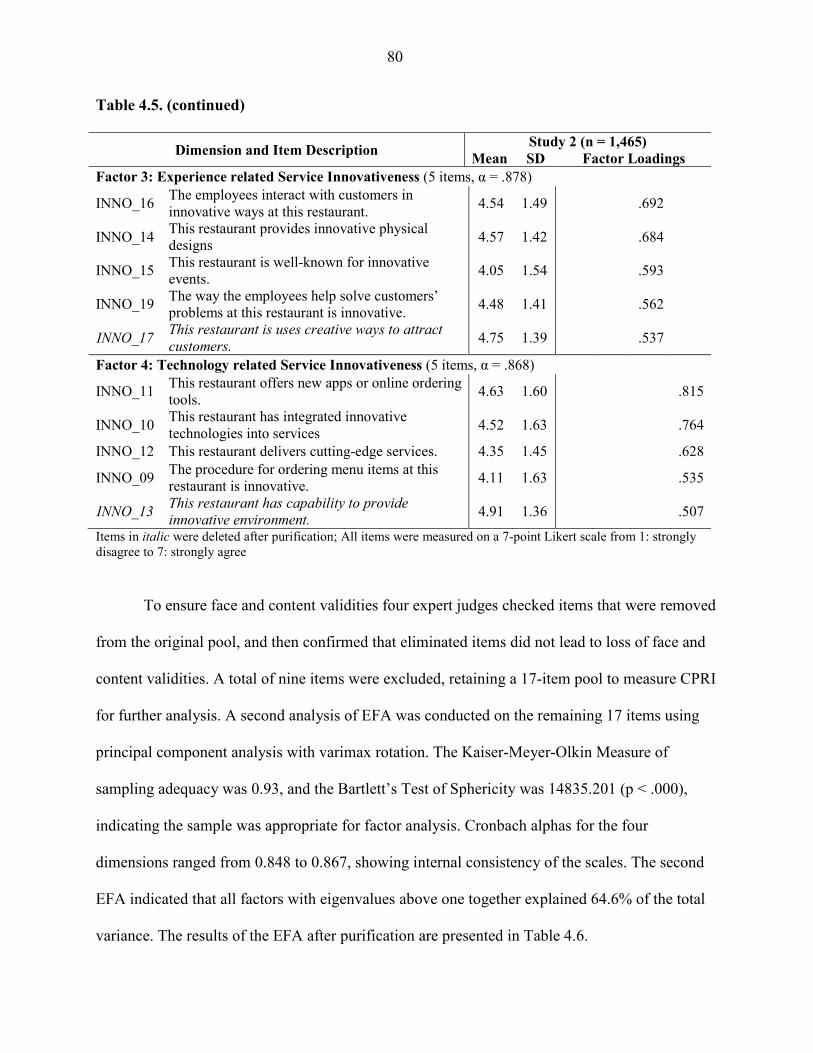
80
Table 4.5. (continued)
Dimension and Item Description Study 2 (n = 1,465)
Mean SD Factor Loadings
Factor 3: Experience related Service Innovativeness (5 items, α = .878)
INNO_16 The employees interact with customers in innovative ways at this restaurant.
4.54 1.49 .692
INNO_14 This restaurant provides innovative physical designs
4.57 1.42 .684
INNO_15 This restaurant is well-known for innovative events.
4.05 1.54 .593
INNO_19 The way the employees help solve customers’ problems at this restaurant is innovative.
4.48 1.41 .562
INNO_17 This restaurant is uses creative ways to attract
customers. 4.75 1.39 .537
Factor 4: Technology related Service Innovativeness (5 items, α = .868)
INNO_11 This restaurant offers new apps or online ordering tools.
4.63 1.60 .815
INNO_10 This restaurant has integrated innovative technologies into services
4.52 1.63 .764
INNO_12 This restaurant delivers cutting-edge services. 4.35 1.45 .628
INNO_09 The procedure for ordering menu items at this restaurant is innovative.
4.11 1.63 .535
INNO_13 This restaurant has capability to provide
innovative environment. 4.91 1.36 .507
Items in italic were deleted after purification; All items were measured on a 7-point Likert scale from 1: strongly disagree to 7: strongly agree
To ensure face and content validities four expert judges checked items that were removed
from the original pool, and then confirmed that eliminated items did not lead to loss of face and
content validities. A total of nine items were excluded, retaining a 17-item pool to measure CPRI
for further analysis. A second analysis of EFA was conducted on the remaining 17 items using
principal component analysis with varimax rotation. The Kaiser-Meyer-Olkin Measure of
sampling adequacy was 0.93, and the Bartlett’s Test of Sphericity was 14835.201 (p < .000),
indicating the sample was appropriate for factor analysis. Cronbach alphas for the four
dimensions ranged from 0.848 to 0.867, showing internal consistency of the scales. The second
EFA indicated that all factors with eigenvalues above one together explained 64.6% of the total
variance. The results of the EFA after purification are presented in Table 4.6.
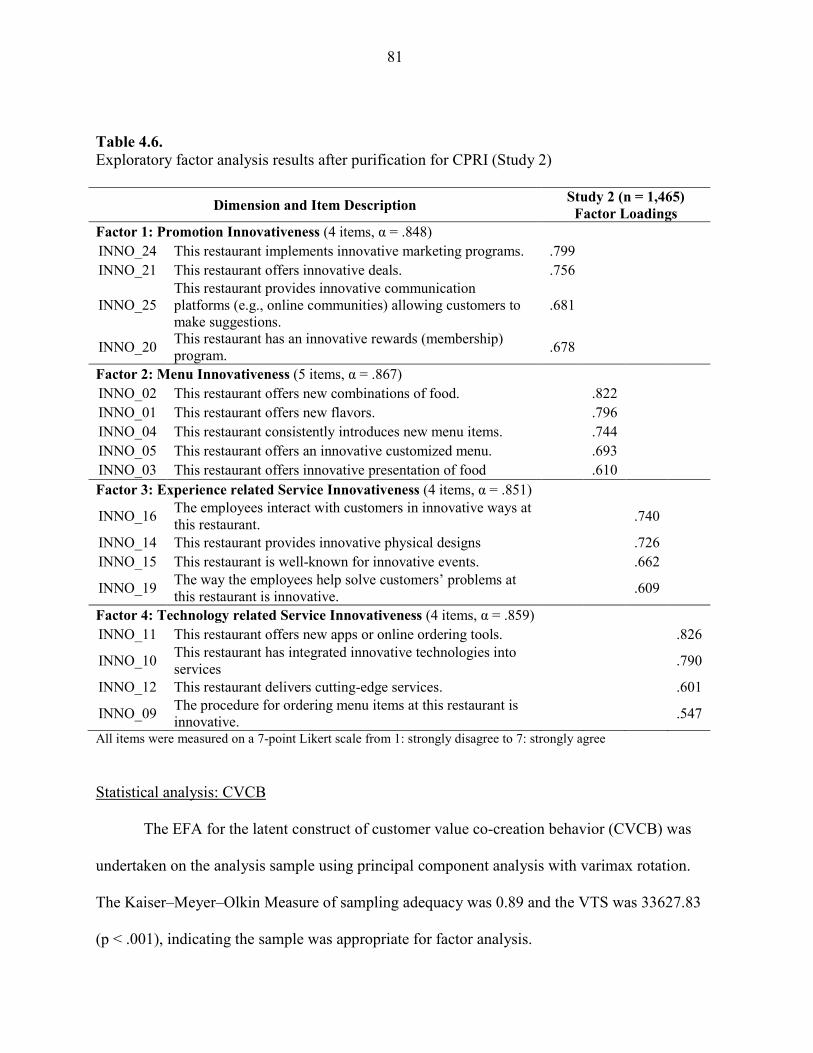
81
Table 4.6.
Exploratory factor analysis results after purification for CPRI (Study 2)
Dimension and Item Description Study 2 (n = 1,465)
Factor Loadings
Factor 1: Promotion Innovativeness (4 items, α = .848)
INNO_24 This restaurant implements innovative marketing programs. .799
INNO_21 This restaurant offers innovative deals. .756
INNO_25 This restaurant provides innovative communication platforms (e.g., online communities) allowing customers to make suggestions.
.681
INNO_20 This restaurant has an innovative rewards (membership) program.
.678
Factor 2: Menu Innovativeness (5 items, α = .867)
INNO_02 This restaurant offers new combinations of food. .822
INNO_01 This restaurant offers new flavors. .796
INNO_04 This restaurant consistently introduces new menu items. .744
INNO_05 This restaurant offers an innovative customized menu. .693
INNO_03 This restaurant offers innovative presentation of food .610
Factor 3: Experience related Service Innovativeness (4 items, α = .851)
INNO_16 The employees interact with customers in innovative ways at this restaurant.
.740
INNO_14 This restaurant provides innovative physical designs .726
INNO_15 This restaurant is well-known for innovative events. .662
INNO_19 The way the employees help solve customers’ problems at this restaurant is innovative.
.609
Factor 4: Technology related Service Innovativeness (4 items, α = .859)
INNO_11 This restaurant offers new apps or online ordering tools. .826
INNO_10 This restaurant has integrated innovative technologies into services
.790
INNO_12 This restaurant delivers cutting-edge services. .601
INNO_09 The procedure for ordering menu items at this restaurant is innovative.
.547
All items were measured on a 7-point Likert scale from 1: strongly disagree to 7: strongly agree
Statistical analysis: CVCB
The EFA for the latent construct of customer value co-creation behavior (CVCB) was
undertaken on the analysis sample using principal component analysis with varimax rotation.
The Kaiser–Meyer–Olkin Measure of sampling adequacy was 0.89 and the VTS was 33627.83
(p < .001), indicating the sample was appropriate for factor analysis.
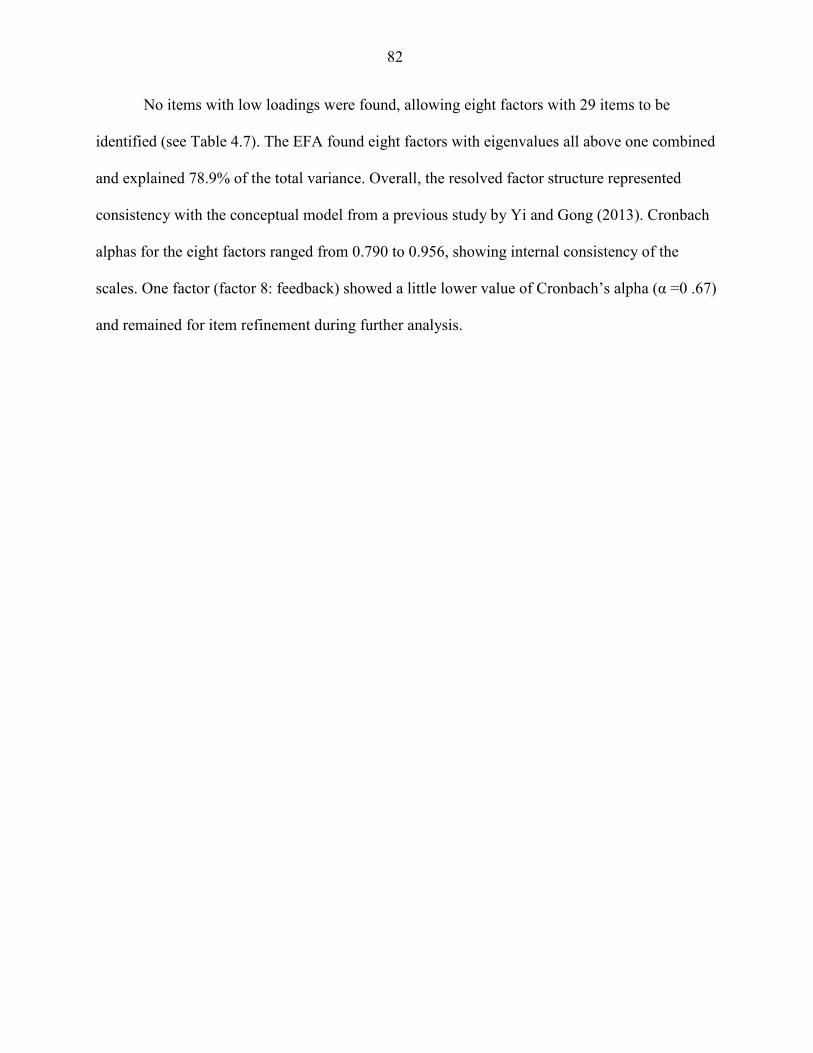
82
No items with low loadings were found, allowing eight factors with 29 items to be
identified (see Table 4.7). The EFA found eight factors with eigenvalues all above one combined
and explained 78.9% of the total variance. Overall, the resolved factor structure represented
consistency with the conceptual model from a previous study by Yi and Gong (2013). Cronbach
alphas for the eight factors ranged from 0.790 to 0.956, showing internal consistency of the
scales. One factor (factor 8: feedback) showed a little lower value of Cronbach’s alpha (α =0 .67)
and remained for item refinement during further analysis.
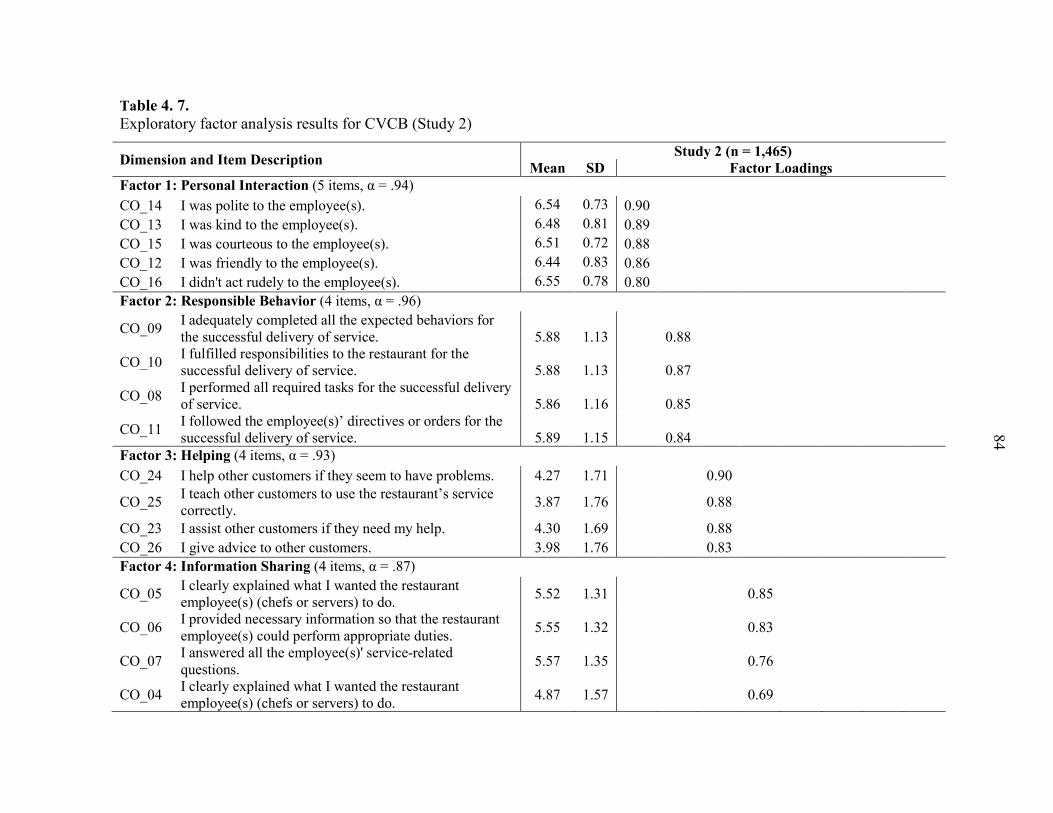
83
Table 4. 7.
Exploratory factor analysis results for CVCB (Study 2)
Dimension and Item Description Study 2 (n = 1,465)
Mean SD Factor Loadings
Factor 1: Personal Interaction (5 items, α = .94)
CO_14 I was polite to the employee(s). 6.54 0.73 0.90
CO_13 I was kind to the employee(s). 6.48 0.81 0.89
CO_15 I was courteous to the employee(s). 6.51 0.72 0.88
CO_12 I was friendly to the employee(s). 6.44 0.83 0.86
CO_16 I didn't act rudely to the employee(s). 6.55 0.78 0.80
Factor 2: Responsible Behavior (4 items, α = .96)
CO_09 I adequately completed all the expected behaviors for the successful delivery of service. 5.88 1.13 0.88
CO_10 I fulfilled responsibilities to the restaurant for the successful delivery of service. 5.88 1.13 0.87
CO_08 I performed all required tasks for the successful delivery of service. 5.86 1.16 0.85
CO_11 I followed the employee(s)’ directives or orders for the successful delivery of service. 5.89 1.15 0.84
Factor 3: Helping (4 items, α = .93)
CO_24 I help other customers if they seem to have problems. 4.27 1.71 0.90
CO_25 I teach other customers to use the restaurant’s service correctly.
3.87 1.76 0.88
CO_23 I assist other customers if they need my help. 4.30 1.69 0.88
CO_26 I give advice to other customers. 3.98 1.76 0.83
Factor 4: Information Sharing (4 items, α = .87)
CO_05 I clearly explained what I wanted the restaurant employee(s) (chefs or servers) to do.
5.52 1.31 0.85
CO_06 I provided necessary information so that the restaurant employee(s) could perform appropriate duties.
5.55 1.32 0.83
CO_07 I answered all the employee(s)' service-related questions.
5.57 1.35 0.76
CO_04 I clearly explained what I wanted the restaurant employee(s) (chefs or servers) to do.
4.87 1.57 0.69
84
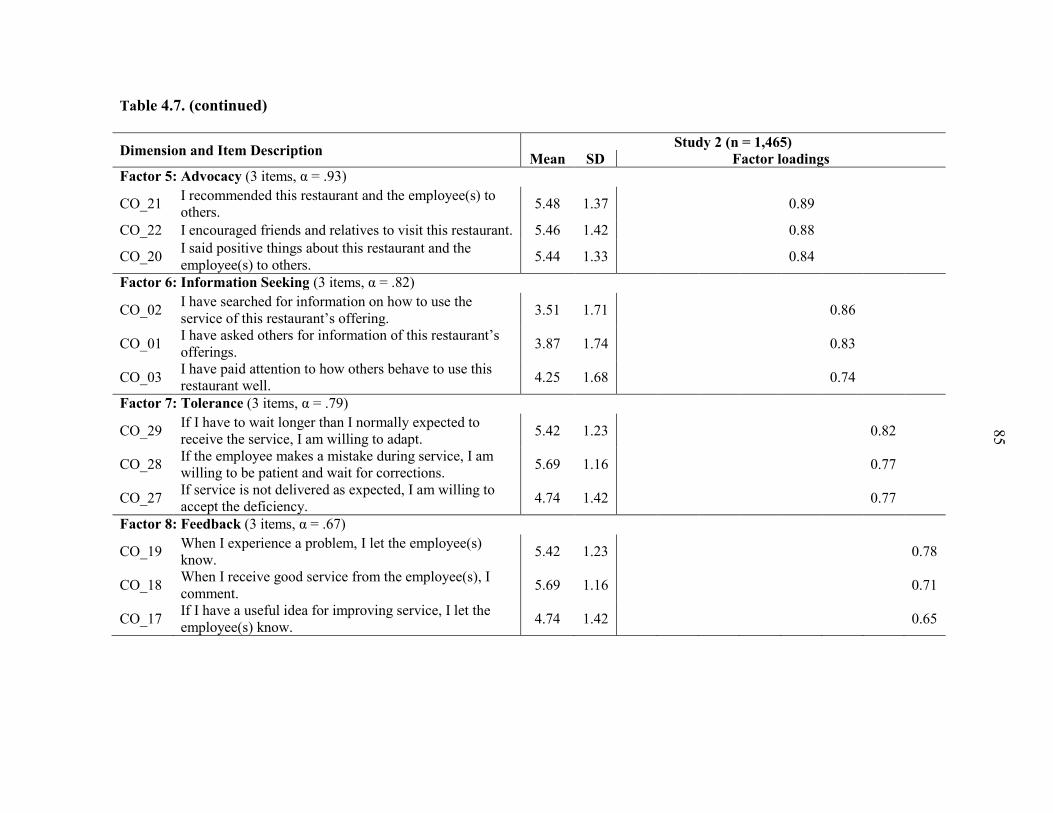
84
Table 4.7. (continued)
Dimension and Item Description Study 2 (n = 1,465)
Mean SD Factor loadings
Factor 5: Advocacy (3 items, α = .93)
CO_21 I recommended this restaurant and the employee(s) to others.
5.48 1.37 0.89
CO_22 I encouraged friends and relatives to visit this restaurant. 5.46 1.42 0.88
CO_20 I said positive things about this restaurant and the employee(s) to others.
5.44 1.33 0.84
Factor 6: Information Seeking (3 items, α = .82)
CO_02 I have searched for information on how to use the service of this restaurant’s offering.
3.51 1.71 0.86
CO_01 I have asked others for information of this restaurant’s offerings.
3.87 1.74 0.83
CO_03 I have paid attention to how others behave to use this restaurant well.
4.25 1.68 0.74
Factor 7: Tolerance (3 items, α = .79)
CO_29 If I have to wait longer than I normally expected to receive the service, I am willing to adapt.
5.42 1.23 0.82
CO_28 If the employee makes a mistake during service, I am willing to be patient and wait for corrections.
5.69 1.16 0.77
CO_27 If service is not delivered as expected, I am willing to accept the deficiency.
4.74 1.42 0.77
Factor 8: Feedback (3 items, α = .67)
CO_19 When I experience a problem, I let the employee(s) know.
5.42 1.23 0.78
CO_18 When I receive good service from the employee(s), I comment.
5.69 1.16 0.71
CO_17 If I have a useful idea for improving service, I let the employee(s) know.
4.74 1.42 0.65
85
85
Phase 2: Scale Validation & Research Model Test
Study 3: Scale Validation & Research Model and Hypotheses Test
Descriptive statistical of the sample
The demographic characteristics of the sample are presented in Table 4.8. A total of 514
observations were collected and included in the analysis. 56.8 percent of the respondents were
female and 43.2 percent were male. The age group between 35 to 44 comprised the highest
proportion (22.0%) of the total sample. 21.0% of the participants were 25 to 34 years old, and
19.1% ranged between 45 to 54 years. 77.8% of the respondents were Caucasian (including
Hispanic), followed by African American (11.1%) and Asian (4.5%). 34.4% of the respondents
resided in the South, while 24.9% and 22.2% of the respondents resided in the Midwest and
Northeast, respectively. 26.7% of the respondents obtained a Bachelor’s degree, while 18.3 %
held high school diplomas. 31.3% of the respondents reported an annual household income
before taxes in a range from $25,000 to $49,999, 24.7% reported $50,000 to $74,999, and 13.4%
reported $75,000 to $99,999. 58.0% of the respondents were married. For eating-out related
characteristics, 46.7% of respondent ate at restaurants one to three times per month, 36.8% ate
out four to six times per month, and 16.5% ate out more than six times per month. Furthermore,
35.4% of the respondents reported eating out at casual dining restaurant four to six times in the
past three months, followed by one to three times in the past three months (33.1%) and more
than six times in the past three months (31.5%) (Table 4.8).
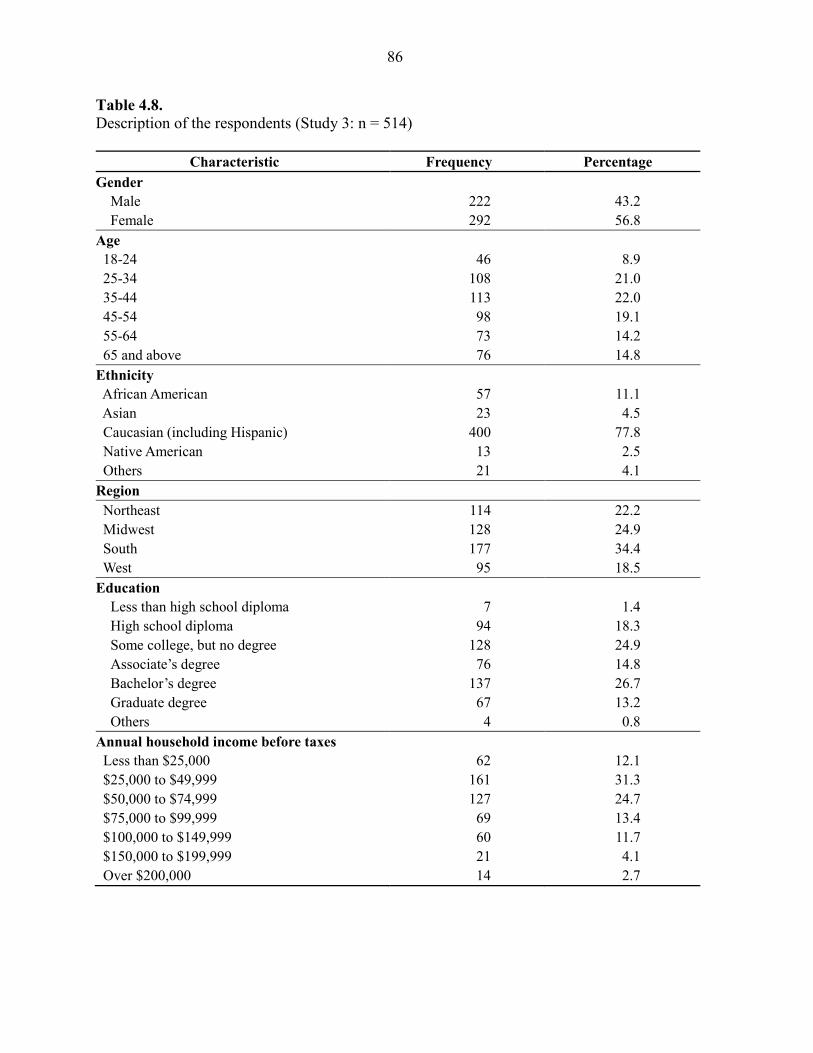
86
Table 4.8.
Description of the respondents (Study 3: n = 514)
Characteristic Frequency Percentage
Gender
Male 222 43.2
Female 292 56.8
Age
18-24 46 8.9
25-34 108 21.0
35-44 113 22.0
45-54 98 19.1
55-64 73 14.2
65 and above 76 14.8
Ethnicity
African American 57 11.1
Asian 23 4.5
Caucasian (including Hispanic) 400 77.8
Native American 13 2.5
Others 21 4.1
Region
Northeast 114 22.2
Midwest 128 24.9
South 177 34.4
West 95 18.5
Education
Less than high school diploma 7 1.4
High school diploma 94 18.3
Some college, but no degree 128 24.9
Associate’s degree 76 14.8
Bachelor’s degree 137 26.7
Graduate degree 67 13.2
Others 4 0.8
Annual household income before taxes
Less than $25,000 62 12.1
$25,000 to $49,999 161 31.3
$50,000 to $74,999 127 24.7
$75,000 to $99,999 69 13.4
$100,000 to $149,999 60 11.7
$150,000 to $199,999 21 4.1
Over $200,000 14 2.7
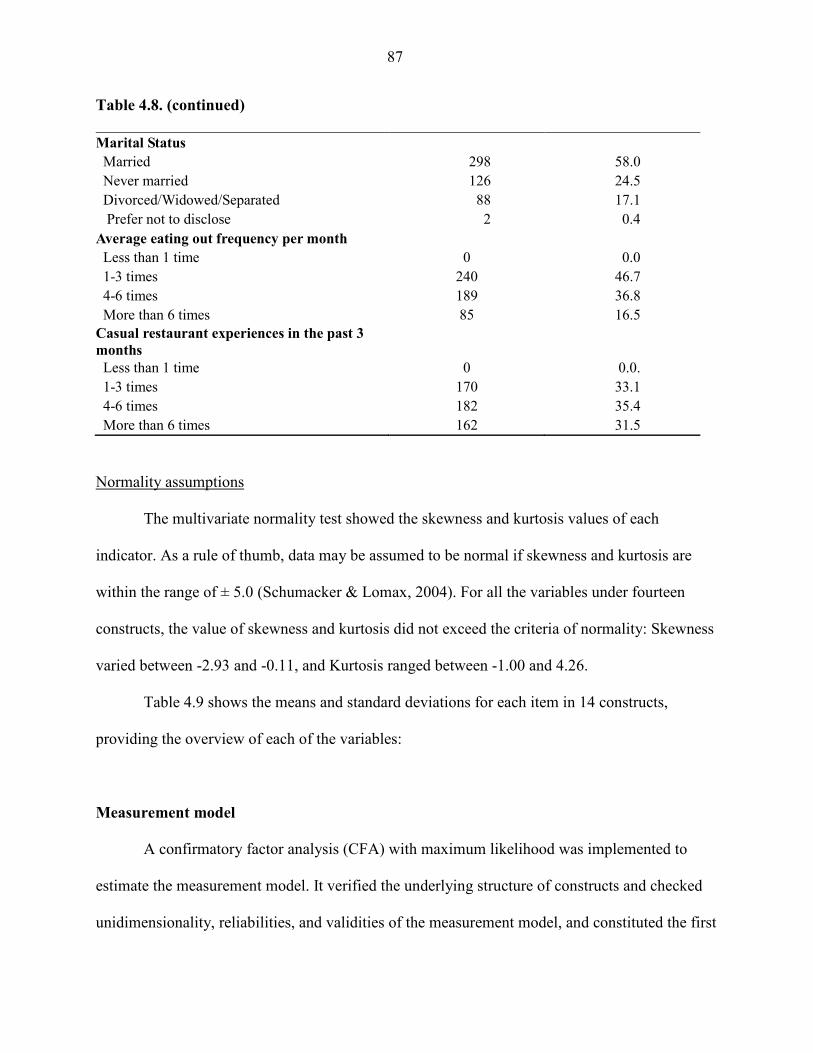
87
Table 4.8. (continued)
Marital Status
Married 298 58.0
Never married 126 24.5
Divorced/Widowed/Separated 88 17.1
Prefer not to disclose 2 0.4
Average eating out frequency per month
Less than 1 time 0 0.0
1-3 times 240 46.7
4-6 times 189 36.8
More than 6 times 85 16.5
Casual restaurant experiences in the past 3
months
Less than 1 time 0 0.0.
1-3 times 170 33.1
4-6 times 182 35.4
More than 6 times 162 31.5
Normality assumptions
The multivariate normality test showed the skewness and kurtosis values of each
indicator. As a rule of thumb, data may be assumed to be normal if skewness and kurtosis are
within the range of ± 5.0 (Schumacker & Lomax, 2004). For all the variables under fourteen
constructs, the value of skewness and kurtosis did not exceed the criteria of normality: Skewness
varied between -2.93 and -0.11, and Kurtosis ranged between -1.00 and 4.26.
Table 4.9 shows the means and standard deviations for each item in 14 constructs,
providing the overview of each of the variables:
Measurement model
A confirmatory factor analysis (CFA) with maximum likelihood was implemented to
estimate the measurement model. It verified the underlying structure of constructs and checked
unidimensionality, reliabilities, and validities of the measurement model, and constituted the first
88
part of a two-step approach recommended by Anderson and Gerbing (1988). Internal consistency
of scales was assessed using Cronbach alpha, and construct validity was measured with
convergent and discriminant validities. Second-order factor analysis was also performed to find a
better fit of structures in the proposed model.
The CFA evaluated the measurement of overall model fit and assessed goodness-fit-
indices before identifying convergent and discriminant validities of the 14 constructs. The results
indicated a good model fit (χ2(1178) = 2552.824, p < 0.001; χ2/df = 2.167; root mean squared
error of approximation [RMSEA] = 0.048; confirmatory fit index [CFI] = 0.949; [NFI] = 0.910;
tucker-lewis index [TLI] = 0.943; and incremental fit index [IFI] = .0.949). All of these indices
indicated an adequate model fit (Table 4.9) (Bollen, 1989; Schumacker & Lomax, 2004). The
chi-square statistic p-value was significant. However, in large samples and large number of items
even minor differences between the observed model and the perfect-fit-model were significant
(Hair et al., 1998; Jöreskog & Sörbom, 1996). Consequently, the normed chi-square statistic and
the chi-square fit index divided by the degree of freedom were assessed; this norming made the
chi-square less dependent on sample size. The normed chi-square statistic for the measurement
model indicated χ2/df = 2.167, meeting criteria of less than three (Kline, 1998) or less than five
(Schumacker & Lomax, 2004).
Internal reliability
To test internal consistency of items a reliability analysis was assessed using Cronbach’s
alpha, producing values ranging from 0.72 to 0.97 and indicating an acceptable level of
reliability (α = 0.70) as suggested by Nunnally (1978) (Table 4.9).
89
Construct validity
Convergent validity. Evaluation of convergent validity followed three criteria suggested
by Fornell and Larcker (1981) and Anderson and Gerbing (1988). First, the standardized factor
loadings ranged from 0.57 to 0.96 and were statistically significant (Bagozzi & Yi, 1988); only
two items (TOL01 and FB03) were under 0.70. Second, composite reliabilities (CR) ranging
from 0.76 to 0.97 exceeded the recommended 0.70 threshold level (Nunnally, 1978). Third, the
average variance extracted (AVE) estimates ranging from 0.52 to 0.88 exceeded the
recommended 0.50 threshold level of acceptance (Fornell & Lacker, 1981). Consequently,
convergent validity was achieved showing each factor to be a unidimensional construct (Table
4.9).
Discriminant validity. Evaluation of discriminant validity was confirmed by comparing
the average variance extracted (AVE) from each construct with the squared correlation
coefficients found for other constructs. The factor correlation matrix indicated that AVE of each
construct was greater than the squared correlation coefficients between constructs (Fornell &
Larcker (1981), thereby achieving discriminant validity (Table 4.10).
In summary, the measures of the proposed 14 constructs attained convergent and
discriminant validities as well as high reliability.
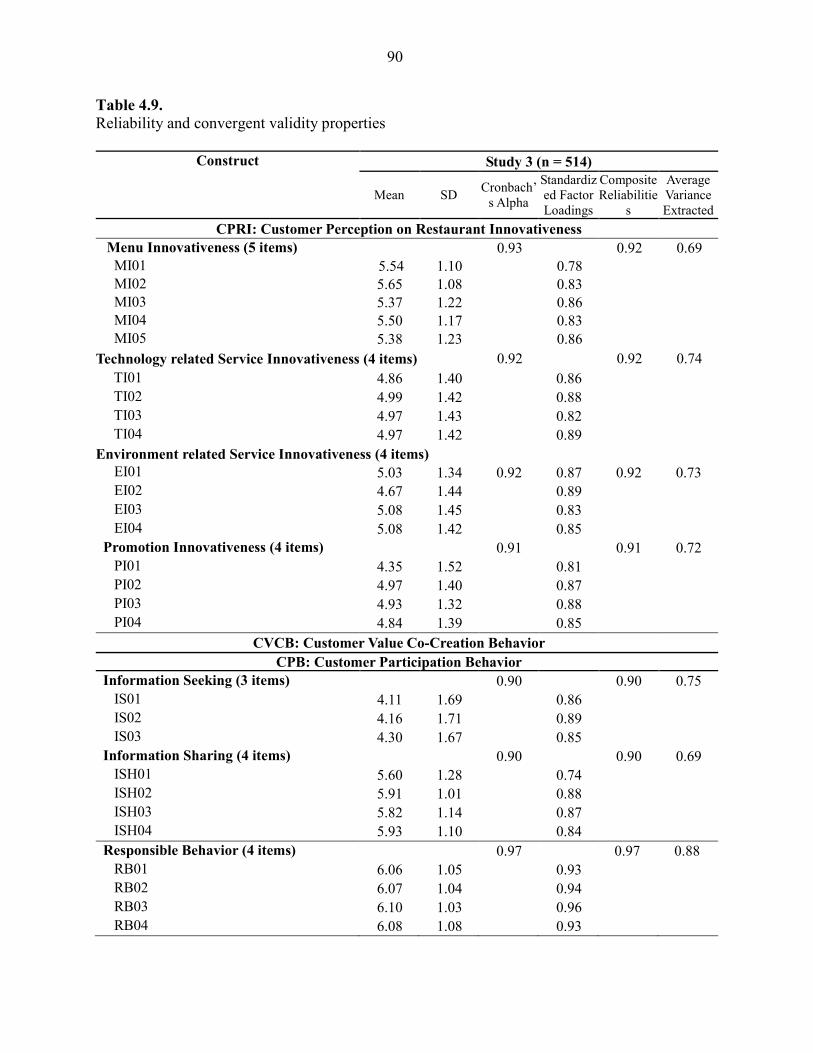
90
Table 4.9.
Reliability and convergent validity properties
Construct Study 3 (n = 514)
Mean SD Cronbach’
s Alpha
Standardized Factor Loadings
Composite Reliabilitie
s
Average Variance Extracted
CPRI: Customer Perception on Restaurant Innovativeness
Menu Innovativeness (5 items) 0.93 0.92 0.69
MI01 5.54 1.10 0.78
MI02 5.65 1.08 0.83
MI03 5.37 1.22 0.86
MI04 5.50 1.17 0.83
MI05 5.38 1.23 0.86
Technology related Service Innovativeness (4 items) 0.92 0.92 0.74
TI01 4.86 1.40 0.86
TI02 4.99 1.42 0.88
TI03 4.97 1.43 0.82
TI04 4.97 1.42 0.89
Environment related Service Innovativeness (4 items)
EI01 5.03 1.34 0.92 0.87 0.92 0.73
EI02 4.67 1.44 0.89
EI03 5.08 1.45 0.83
EI04 5.08 1.42 0.85
Promotion Innovativeness (4 items) 0.91 0.91 0.72
PI01 4.35 1.52 0.81
PI02 4.97 1.40 0.87
PI03 4.93 1.32 0.88
PI04 4.84 1.39 0.85
CVCB: Customer Value Co-Creation Behavior
CPB: Customer Participation Behavior
Information Seeking (3 items) 0.90 0.90 0.75
IS01 4.11 1.69 0.86
IS02 4.16 1.71 0.89
IS03 4.30 1.67 0.85
Information Sharing (4 items) 0.90 0.90 0.69
ISH01 5.60 1.28 0.74
ISH02 5.91 1.01 0.88
ISH03 5.82 1.14 0.87
ISH04 5.93 1.10 0.84
Responsible Behavior (4 items) 0.97 0.97 0.88
RB01 6.06 1.05 0.93
RB02 6.07 1.04 0.94
RB03 6.10 1.03 0.96
RB04 6.08 1.08 0.93
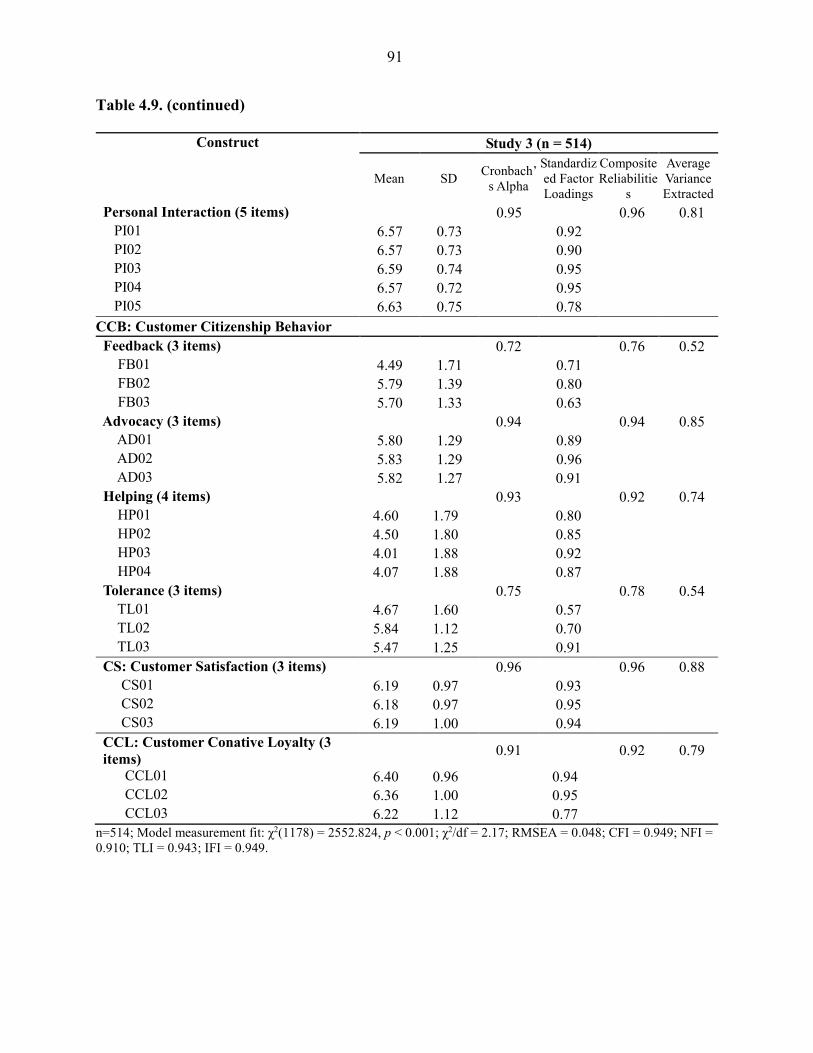
91
Table 4.9. (continued)
Construct Study 3 (n = 514)
Mean SD Cronbach’
s Alpha
Standardized Factor Loadings
Composite Reliabilitie
s
Average Variance Extracted
Personal Interaction (5 items) 0.95 0.96 0.81
PI01 6.57 0.73 0.92
PI02 6.57 0.73 0.90
PI03 6.59 0.74 0.95
PI04 6.57 0.72 0.95
PI05 6.63 0.75 0.78
CCB: Customer Citizenship Behavior
Feedback (3 items) 0.72 0.76 0.52
FB01 4.49 1.71 0.71
FB02 5.79 1.39 0.80
FB03 5.70 1.33 0.63
Advocacy (3 items) 0.94 0.94 0.85
AD01 5.80 1.29 0.89
AD02 5.83 1.29 0.96
AD03 5.82 1.27 0.91
Helping (4 items) 0.93 0.92 0.74
HP01 4.60 1.79 0.80
HP02 4.50 1.80 0.85
HP03 4.01 1.88 0.92
HP04 4.07 1.88 0.87
Tolerance (3 items) 0.75 0.78 0.54
TL01 4.67 1.60 0.57
TL02 5.84 1.12 0.70
TL03 5.47 1.25 0.91
CS: Customer Satisfaction (3 items) 0.96 0.96 0.88
CS01 6.19 0.97 0.93
CS02 6.18 0.97 0.95
CS03 6.19 1.00 0.94
CCL: Customer Conative Loyalty (3
items) 0.91 0.92 0.79
CCL01 6.40 0.96 0.94
CCL02 6.36 1.00 0.95
CCL03 6.22 1.12 0.77
n=514; Model measurement fit: χ2(1178) = 2552.824, p < 0.001; χ2/df = 2.17; RMSEA = 0.048; CFI = 0.949; NFI = 0.910; TLI = 0.943; IFI = 0.949.
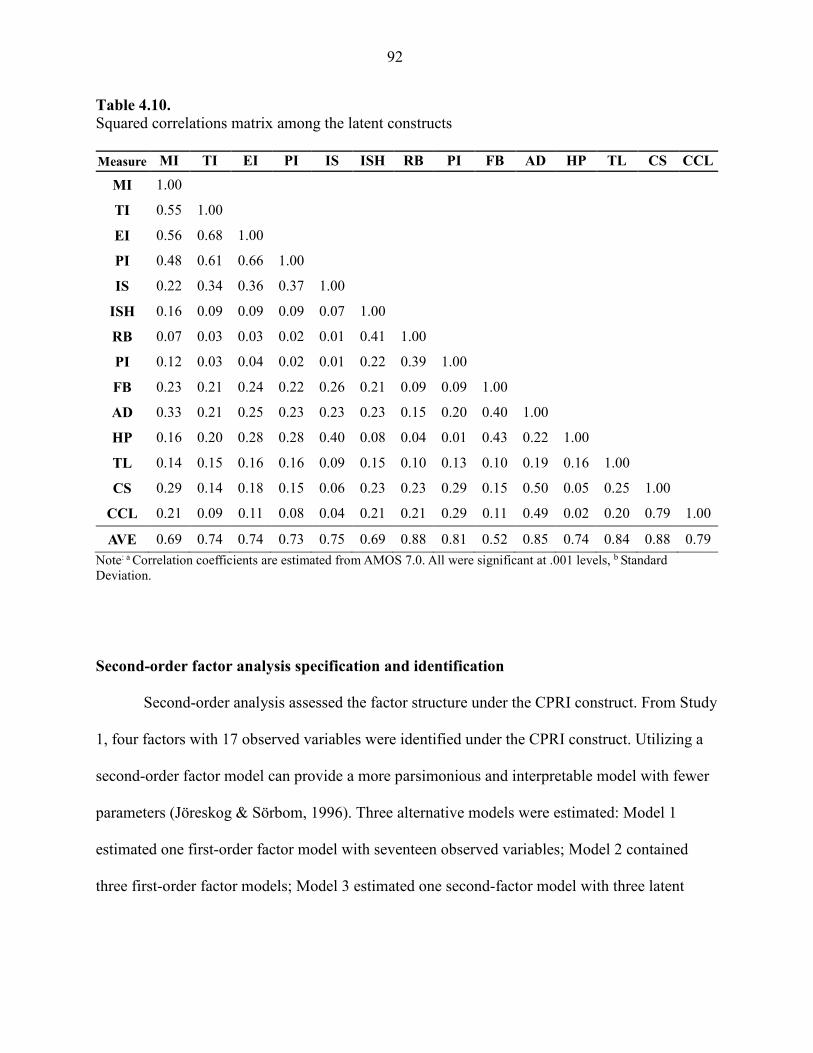
92
Table 4.10.
Squared correlations matrix among the latent constructs
Measure MI TI EI PI IS ISH RB PI FB AD HP TL CS CCL
MI 1.00
TI 0.55 1.00
EI 0.56 0.68 1.00
PI 0.48 0.61 0.66 1.00
IS 0.22 0.34 0.36 0.37 1.00
ISH 0.16 0.09 0.09 0.09 0.07 1.00
RB 0.07 0.03 0.03 0.02 0.01 0.41 1.00
PI 0.12 0.03 0.04 0.02 0.01 0.22 0.39 1.00
FB 0.23 0.21 0.24 0.22 0.26 0.21 0.09 0.09 1.00
AD 0.33 0.21 0.25 0.23 0.23 0.23 0.15 0.20 0.40 1.00
HP 0.16 0.20 0.28 0.28 0.40 0.08 0.04 0.01 0.43 0.22 1.00
TL 0.14 0.15 0.16 0.16 0.09 0.15 0.10 0.13 0.10 0.19 0.16 1.00
CS 0.29 0.14 0.18 0.15 0.06 0.23 0.23 0.29 0.15 0.50 0.05 0.25 1.00
CCL 0.21 0.09 0.11 0.08 0.04 0.21 0.21 0.29 0.11 0.49 0.02 0.20 0.79 1.00
AVE 0.69 0.74 0.74 0.73 0.75 0.69 0.88 0.81 0.52 0.85 0.74 0.84 0.88 0.79
Note: a Correlation coefficients are estimated from AMOS 7.0. All were significant at .001 levels, b Standard Deviation.
Second-order factor analysis specification and identification
Second-order analysis assessed the factor structure under the CPRI construct. From Study
1, four factors with 17 observed variables were identified under the CPRI construct. Utilizing a
second-order factor model can provide a more parsimonious and interpretable model with fewer
parameters (Jöreskog & Sörbom, 1996). Three alternative models were estimated: Model 1
estimated one first-order factor model with seventeen observed variables; Model 2 contained
three first-order factor models; Model 3 estimated one second-factor model with three latent
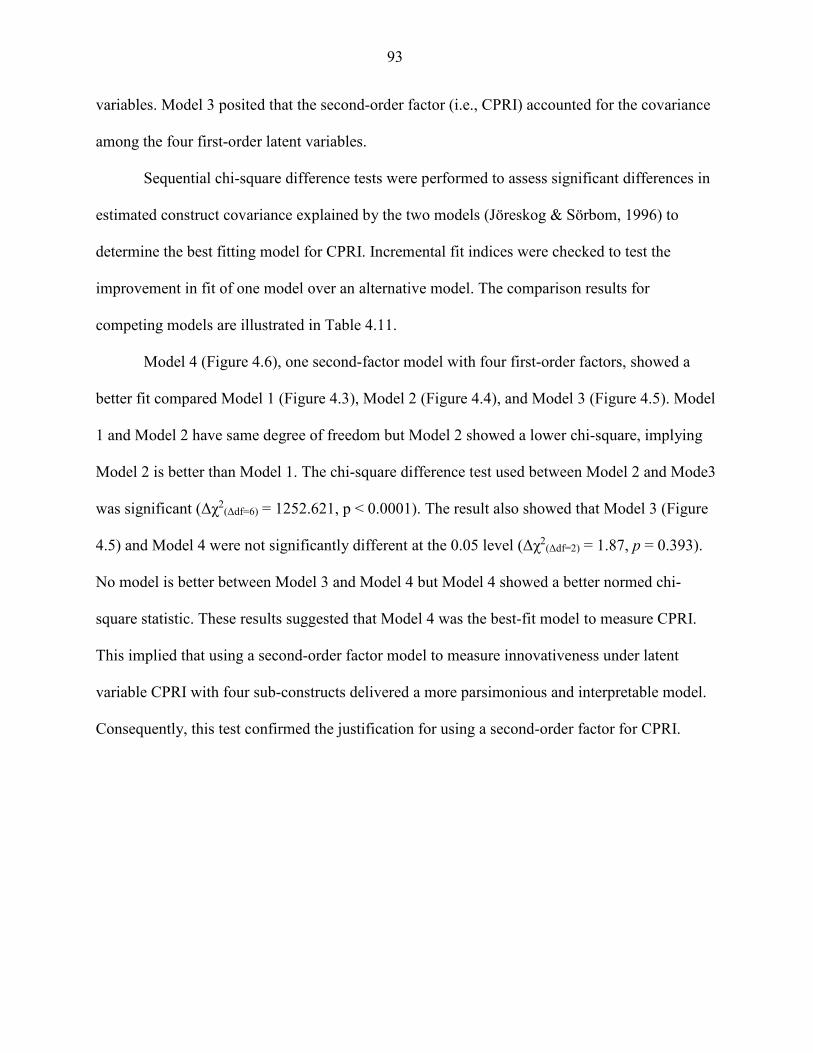
93
variables. Model 3 posited that the second-order factor (i.e., CPRI) accounted for the covariance
among the four first-order latent variables.
Sequential chi-square difference tests were performed to assess significant differences in
estimated construct covariance explained by the two models (Jöreskog & Sörbom, 1996) to
determine the best fitting model for CPRI. Incremental fit indices were checked to test the
improvement in fit of one model over an alternative model. The comparison results for
competing models are illustrated in Table 4.11.
Model 4 (Figure 4.6), one second-factor model with four first-order factors, showed a
better fit compared Model 1 (Figure 4.3), Model 2 (Figure 4.4), and Model 3 (Figure 4.5). Model
1 and Model 2 have same degree of freedom but Model 2 showed a lower chi-square, implying
Model 2 is better than Model 1. The chi-square difference test used between Model 2 and Mode3
was significant (Δχ2(Δdf=6) = 1252.621, p < 0.0001). The result also showed that Model 3 (Figure
4.5) and Model 4 were not significantly different at the 0.05 level (Δχ2(Δdf=2) = 1.87, p = 0.393).
No model is better between Model 3 and Model 4 but Model 4 showed a better normed chi-
square statistic. These results suggested that Model 4 was the best-fit model to measure CPRI.
This implied that using a second-order factor model to measure innovativeness under latent
variable CPRI with four sub-constructs delivered a more parsimonious and interpretable model.
Consequently, this test confirmed the justification for using a second-order factor for CPRI.
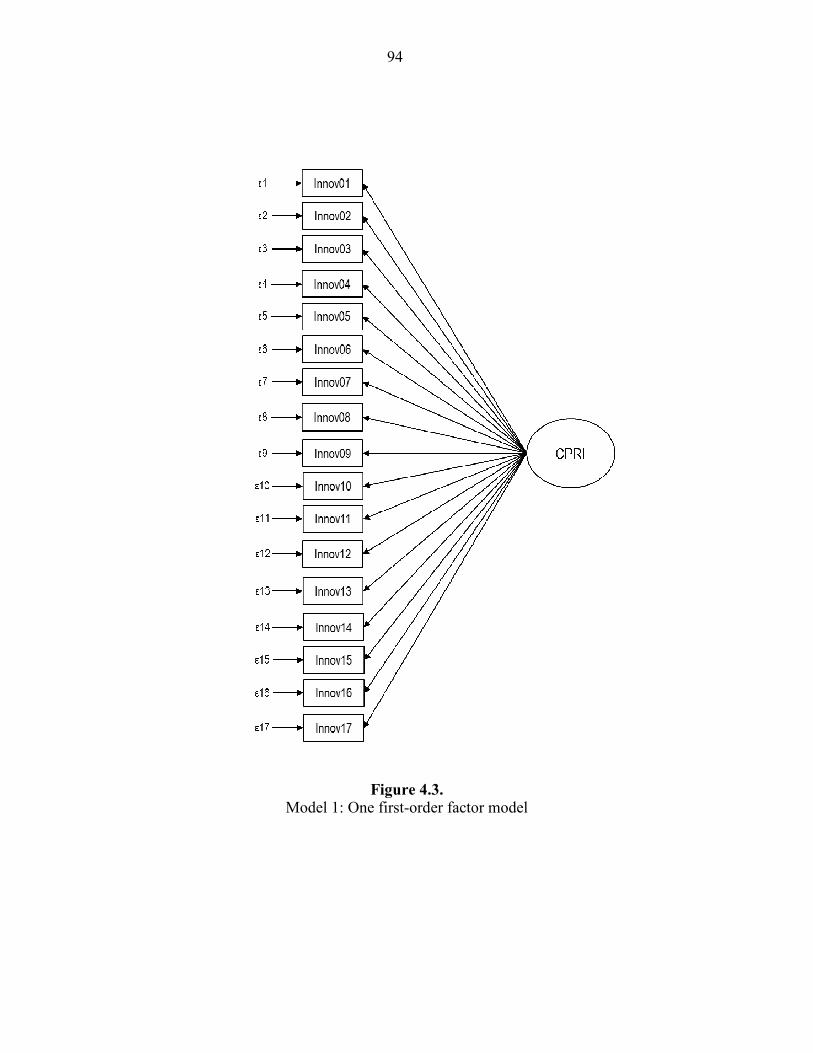
94
Figure 4.3.
Model 1: One first-order factor model
95
Figure 4.4.
Model 2: Four first-order factor model without correlation
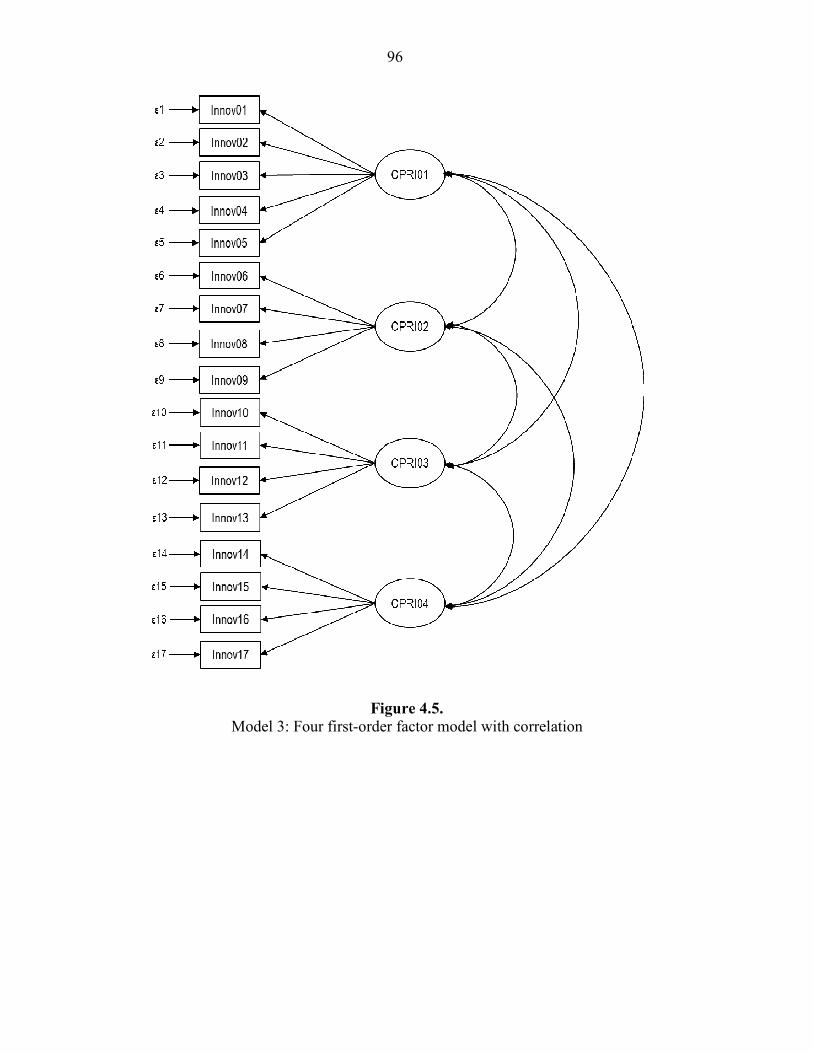
96
Figure 4.5.
Model 3: Four first-order factor model with correlation
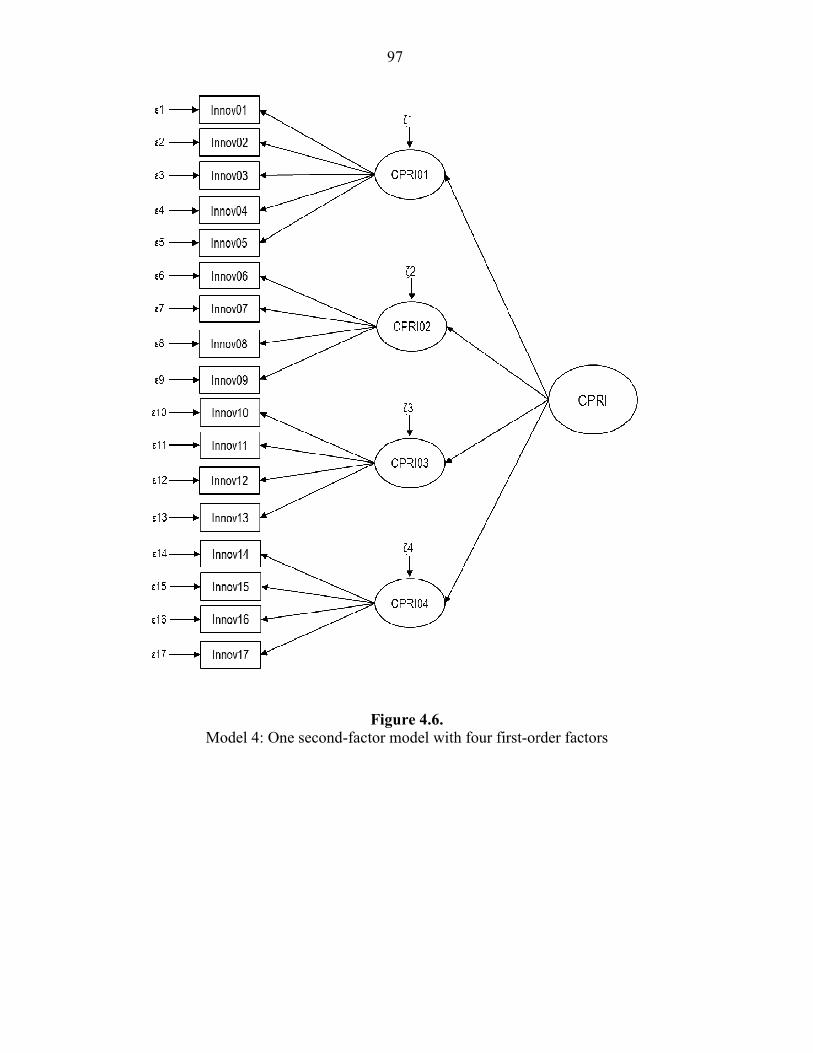
97
Figure 4.6.
Model 4: One second-factor model with four first-order factors
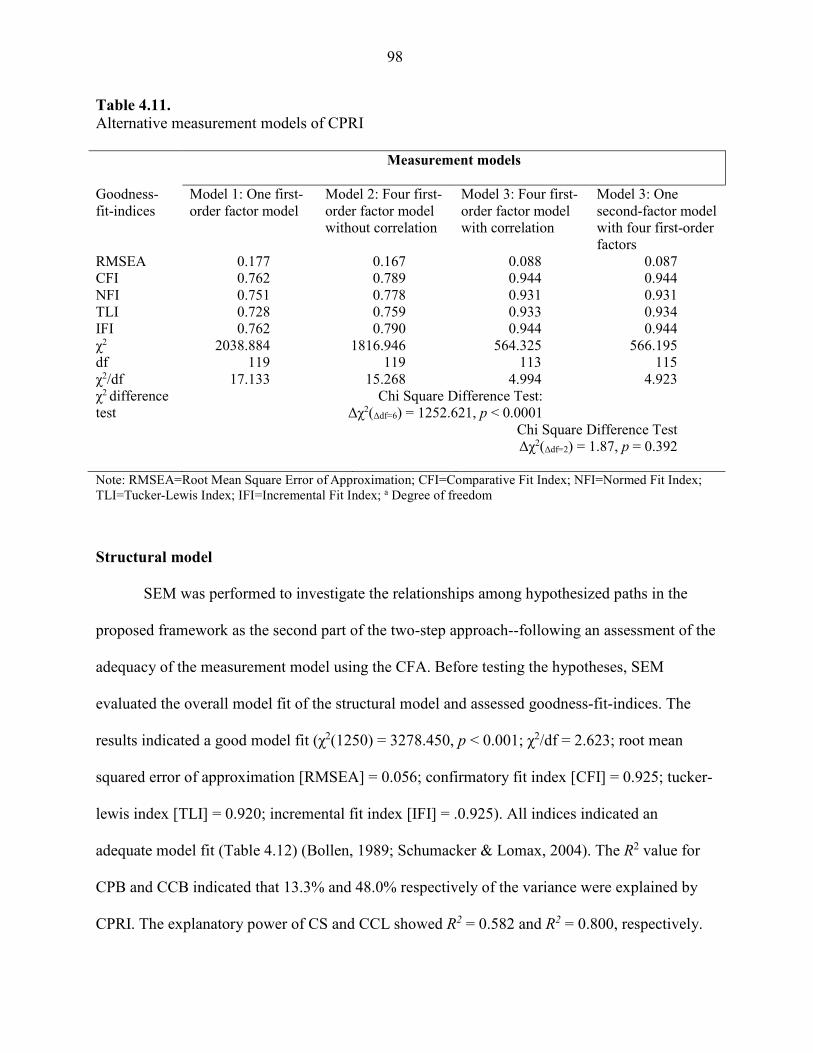
98
Table 4.11.
Alternative measurement models of CPRI
Measurement models
Goodness- fit-indices
Model 1: One first-order factor model
Model 2: Four first-order factor model without correlation
Model 3: Four first-order factor model with correlation
Model 3: One second-factor model with four first-order factors
RMSEA 0.177 0.167 0.088 0.087 CFI 0.762 0.789 0.944 0.944 NFI 0.751 0.778 0.931 0.931 TLI 0.728 0.759 0.933 0.934 IFI 0.762 0.790 0.944 0.944 χ2 2038.884 1816.946 564.325 566.195 df 119 119 113 115 χ2/df 17.133 15.268 4.994 4.923 χ2 difference test
Chi Square Difference Test: Δχ2(Δdf=6) = 1252.621, p < 0.0001
Chi Square Difference Test Δχ2(Δdf=2) = 1.87, p = 0.392
Note: RMSEA=Root Mean Square Error of Approximation; CFI=Comparative Fit Index; NFI=Normed Fit Index; TLI=Tucker-Lewis Index; IFI=Incremental Fit Index; a Degree of freedom
Structural model
SEM was performed to investigate the relationships among hypothesized paths in the
proposed framework as the second part of the two-step approach--following an assessment of the
adequacy of the measurement model using the CFA. Before testing the hypotheses, SEM
evaluated the overall model fit of the structural model and assessed goodness-fit-indices. The
results indicated a good model fit (χ2(1250) = 3278.450, p < 0.001; χ2/df = 2.623; root mean
squared error of approximation [RMSEA] = 0.056; confirmatory fit index [CFI] = 0.925; tucker-
lewis index [TLI] = 0.920; incremental fit index [IFI] = .0.925). All indices indicated an
adequate model fit (Table 4.12) (Bollen, 1989; Schumacker & Lomax, 2004). The R2 value for
CPB and CCB indicated that 13.3% and 48.0% respectively of the variance were explained by
CPRI. The explanatory power of CS and CCL showed R2 = 0.582 and R2 = 0.800, respectively.
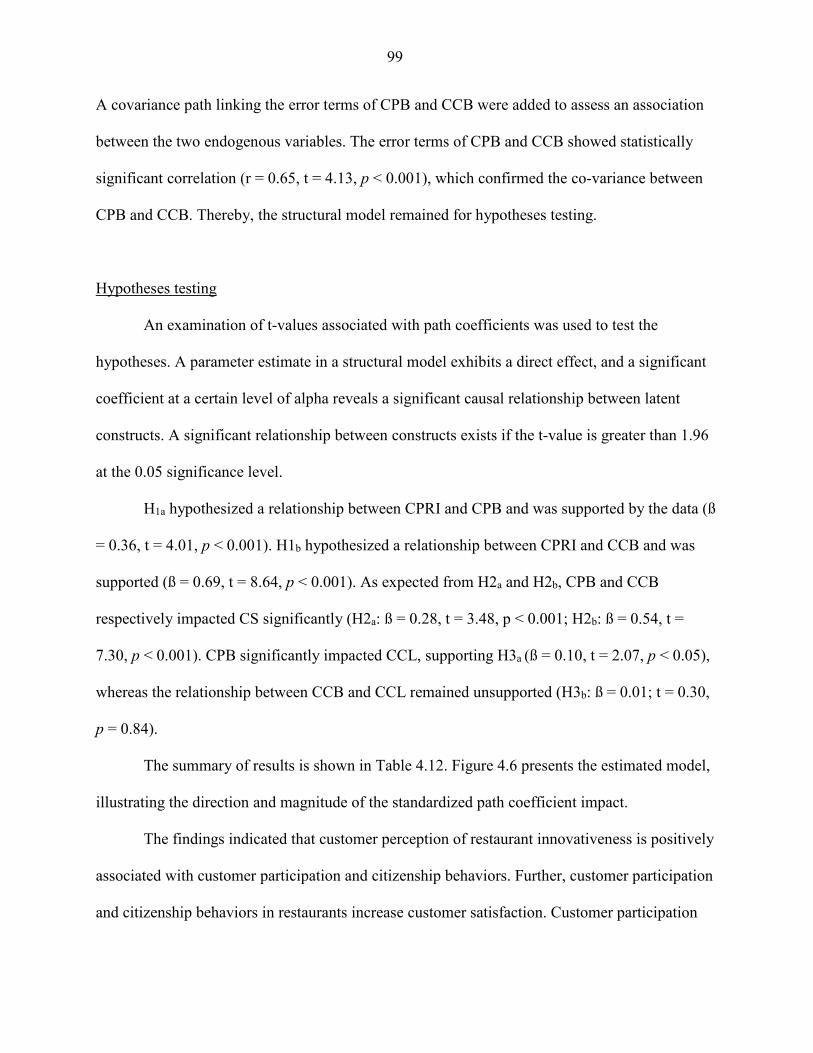
99
A covariance path linking the error terms of CPB and CCB were added to assess an association
between the two endogenous variables. The error terms of CPB and CCB showed statistically
significant correlation (r = 0.65, t = 4.13, p < 0.001), which confirmed the co-variance between
CPB and CCB. Thereby, the structural model remained for hypotheses testing.
Hypotheses testing
An examination of t-values associated with path coefficients was used to test the
hypotheses. A parameter estimate in a structural model exhibits a direct effect, and a significant
coefficient at a certain level of alpha reveals a significant causal relationship between latent
constructs. A significant relationship between constructs exists if the t-value is greater than 1.96
at the 0.05 significance level.
H1a hypothesized a relationship between CPRI and CPB and was supported by the data (ß
= 0.36, t = 4.01, p < 0.001). H1b hypothesized a relationship between CPRI and CCB and was
supported (ß = 0.69, t = 8.64, p < 0.001). As expected from H2a and H2b, CPB and CCB
respectively impacted CS significantly (H2a: ß = 0.28, t = 3.48, p < 0.001; H2b: ß = 0.54, t =
7.30, p < 0.001). CPB significantly impacted CCL, supporting H3a (ß = 0.10, t = 2.07, p < 0.05),
whereas the relationship between CCB and CCL remained unsupported (H3b: ß = 0.01; t = 0.30,
p = 0.84).
The summary of results is shown in Table 4.12. Figure 4.6 presents the estimated model,
illustrating the direction and magnitude of the standardized path coefficient impact.
The findings indicated that customer perception of restaurant innovativeness is positively
associated with customer participation and citizenship behaviors. Further, customer participation
and citizenship behaviors in restaurants increase customer satisfaction. Customer participation
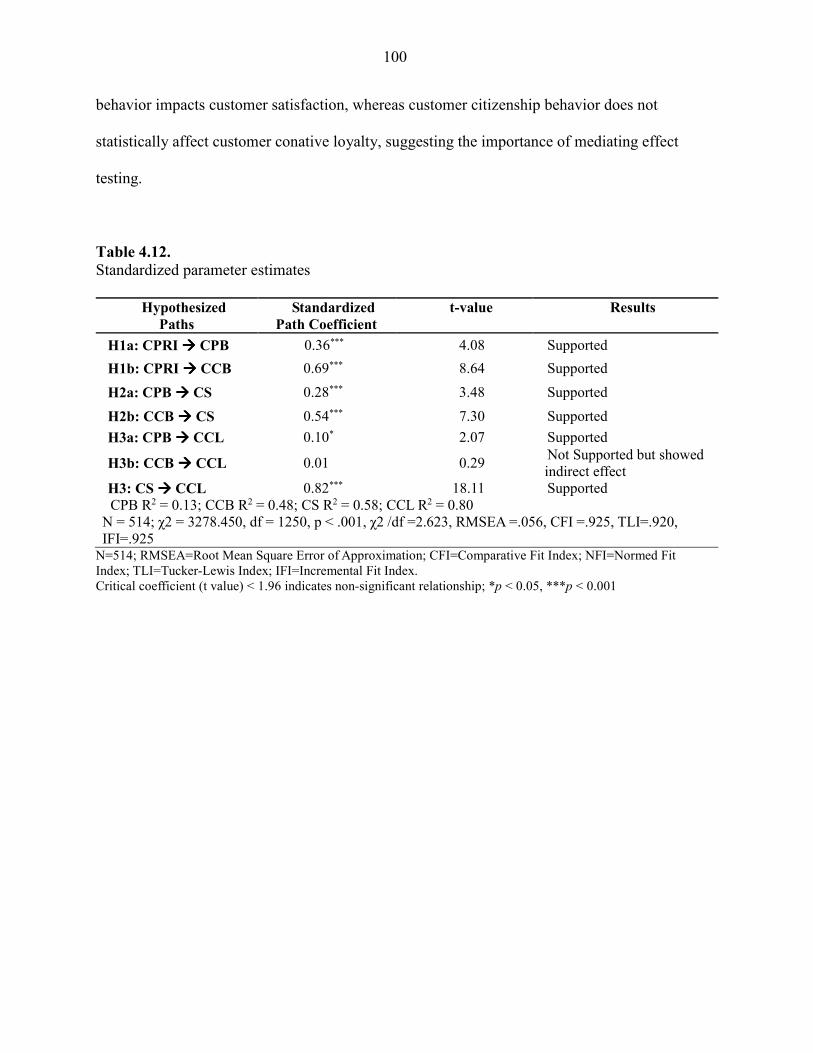
100
behavior impacts customer satisfaction, whereas customer citizenship behavior does not
statistically affect customer conative loyalty, suggesting the importance of mediating effect
testing.
Table 4.12.
Standardized parameter estimates
Hypothesized
Paths
Standardized
Path Coefficient
t-value Results
H1a: CPRI ���� CPB 0.36*** 4.08 Supported
H1b: CPRI ���� CCB 0.69*** 8.64 Supported
H2a: CPB ���� CS 0.28*** 3.48 Supported
H2b: CCB ���� CS 0.54*** 7.30 Supported
H3a: CPB ���� CCL 0.10* 2.07 Supported
H3b: CCB ���� CCL 0.01 0.29 Not Supported but showed indirect effect
H3: CS ���� CCL 0.82*** 18.11 Supported CPB R2 = 0.13; CCB R2 = 0.48; CS R2 = 0.58; CCL R2 = 0.80
N = 514; χ2 = 3278.450, df = 1250, p < .001, χ2 /df =2.623, RMSEA =.056, CFI =.925, TLI=.920, IFI=.925
N=514; RMSEA=Root Mean Square Error of Approximation; CFI=Comparative Fit Index; NFI=Normed Fit Index; TLI=Tucker-Lewis Index; IFI=Incremental Fit Index. Critical coefficient (t value) < 1.96 indicates non-significant relationship; *p < 0.05, ***p < 0.001
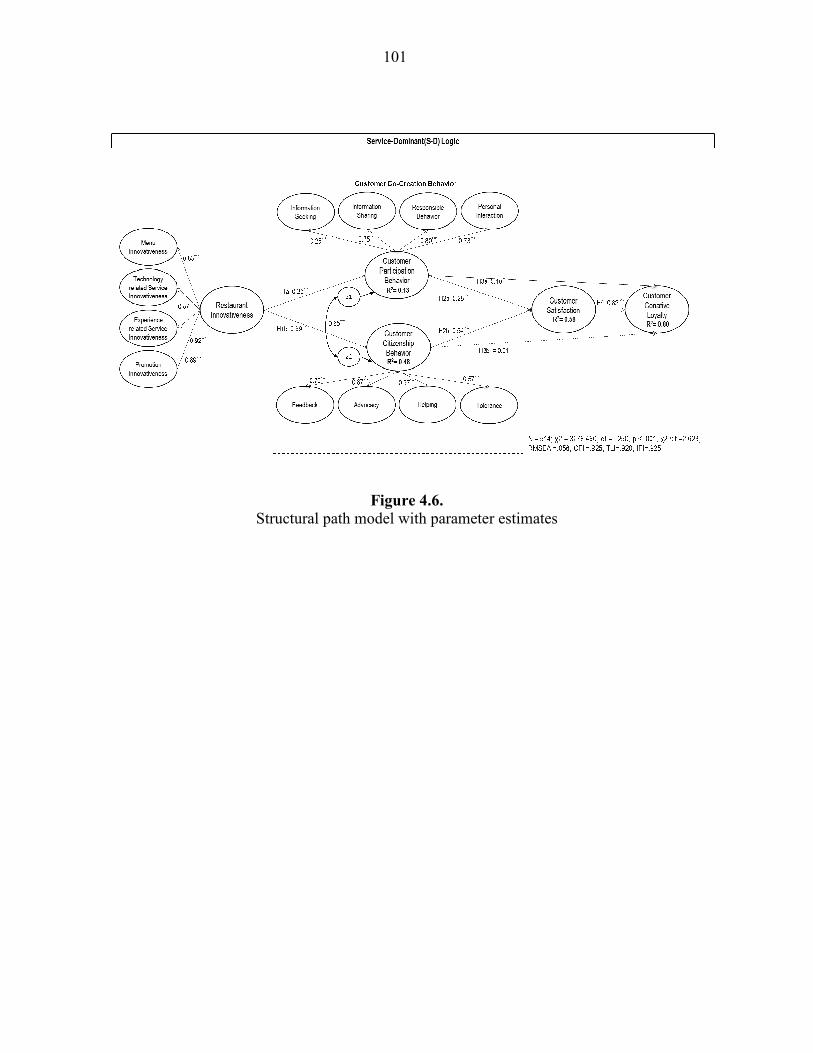
101
Figure 4.6.
Structural path model with parameter estimates
102
Mediating effects
Matrices estimates for total, direct, and indirect effects were tested to further investigate
the mediating effect. A direct effect shows an impact on a variable, an indirect effect comprises
of the paths from one variable to another mediated by an additional variable, and the total effect
is the sum of direct and indirect effects (Brown, 1997). In other words, the test of mediating
effect evaluates whether a mediating variable significantly carries the influence of an
independent variable on a dependent variable.
Sobel’s test (1982) and Preacher & Hayes bootstrapping method (2004) were used
together to test the significance of indirect effect as both of them have merit. The Sobel test is
more precise and very conservative, so it has low statistical power due to the assumption of
normality (MacKinnon, Warsi, & Dwyer, 1995). On the other hand, the Preacher & Hayes
bootstrapping method is a non-parametric test and does not violate assumptions of normality and
generates a more accurate estimate of standard error, thus increasing statistical power (Preacher
& Hayes, 2004). The bootstrap function is an empirical method to determine the significance of
statistical estimates and minimize the violation of normality (Byrne, 2010). As the first step,
indirect effects were calculated using the maximum likelihood bootstrap procedures with the
bias-corrected bootstrap function based on 5,000 samples via AMOS 21.0. Moreover, Sobel test
was used to obtain the Z value to examine the significance of mediating effect.
103
The mediating role of CPB and CCB
Mediating effect tested the influence of CPRI on CS through CPB and CCB, respectively.
Direct, indirect and total effects are presented in Table 4.13 and depict the partial mediating role
of CPB between CPRI and CS, and the full mediating role of CCB between CPRI and CS.
For the mediating effect of CPB between CPRI and CS, bootstrapping revealed that the
total effect, direct effect and indirect effect were all significant (total effect: ß = 0.48, p < 0.001;
direct effect: ß = 0.29, p < 0.001; indirect effect: ß = 0.19, p < 0.01). The result of the Sobel test
also confirmed the indirect effect (z = 2.46, p < 0.01). Thus, CPB significantly mediated the
effect of CPRI on CS. For the mediating effect of CCB between CPRI and CS, bootstrapping
showed the total effect and indirect effect were significant (total effect: ß = 0.48, p < 0.001;
indirect effect: ß = 0.53, p < 0.001), while the direct effect was not significant (direct effect: ß = -
0.05, p = 0.49). The indirect effect was also confirmed by a Sobel test (z = 5.84, p < 0.001).
Thus, the fully mediating effects of CCB suggested that customer perception of restaurant
innovativeness produces favorable customer satisfaction only through customer citizenship
behavior.
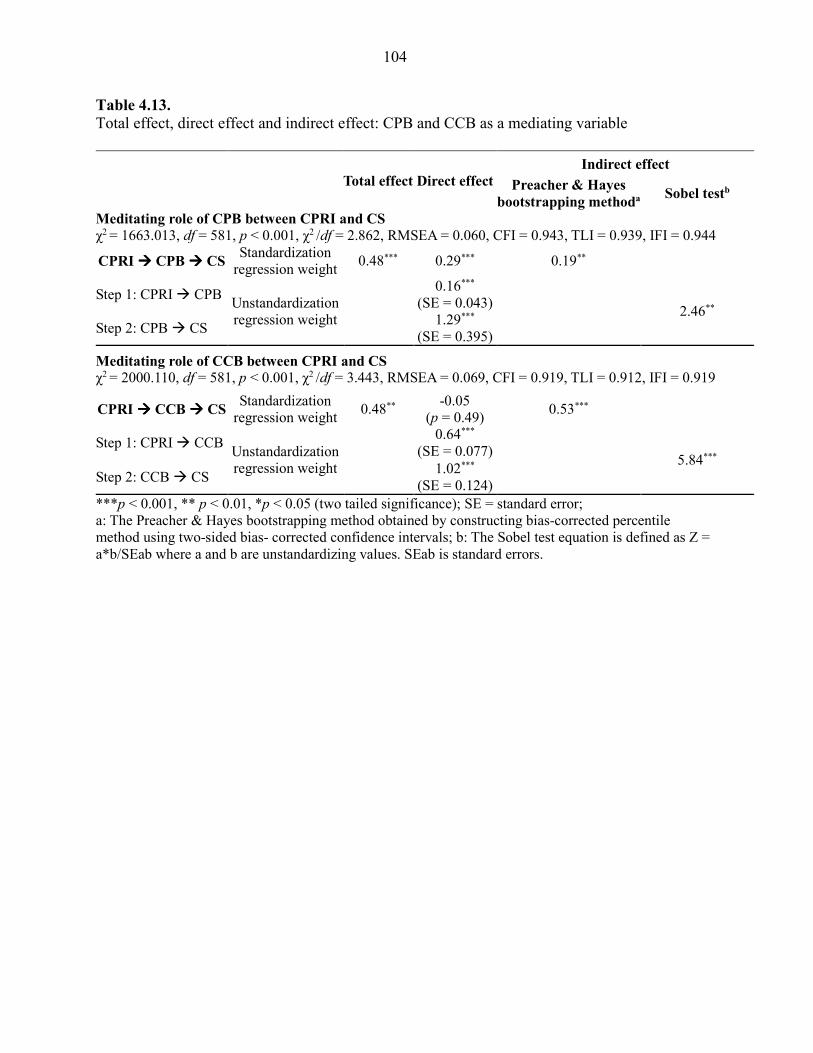
104
Table 4.13.
Total effect, direct effect and indirect effect: CPB and CCB as a mediating variable
Total effect Direct effect
Indirect effect
Preacher & Hayes
bootstrapping methoda Sobel testb
Meditating role of CPB between CPRI and CS
χ2 = 1663.013, df = 581, p < 0.001, χ2 /df = 2.862, RMSEA = 0.060, CFI = 0.943, TLI = 0.939, IFI = 0.944
CPRI ���� CPB ���� CS Standardization
regression weight 0.48*** 0.29*** 0.19**
Step 1: CPRI � CPB Unstandardization regression weight
0.16***
(SE = 0.043) 2.46**
Step 2: CPB � CS 1.29***
(SE = 0.395)
Meditating role of CCB between CPRI and CS
χ2 = 2000.110, df = 581, p < 0.001, χ2 /df = 3.443, RMSEA = 0.069, CFI = 0.919, TLI = 0.912, IFI = 0.919
CPRI ���� CCB ���� CS Standardization
regression weight 0.48**
-0.05 (p = 0.49)
0.53***
Step 1: CPRI � CCB Unstandardization regression weight
0.64***
(SE = 0.077)
5.84*** Step 2: CCB � CS
1.02***
(SE = 0.124)
***p < 0.001, ** p < 0.01, *p < 0.05 (two tailed significance); SE = standard error; a: The Preacher & Hayes bootstrapping method obtained by constructing bias-corrected percentile method using two-sided bias- corrected confidence intervals; b: The Sobel test equation is defined as Z = a*b/SEab where a and b are unstandardizing values. SEab is standard errors.
105
The mediating role of CS
The mediating effect tested the influence of CPB and CCB on CCL through CS. Direct,
indirect and total effects are presented in Table 4.14 and depict the full mediating role of CS
between CPB and CCL, and the partial mediating role of CS between CCB and CCL. As shown
in Table 4.14, bootstrapping showed that the total effect, direct effect and indirect effect were all
significant (total effect: ß = 0.63, p < 0.01; indirect effect: ß = 0.54, p < 0.001), while the direct
effect was not significant (direct effect: ß = 0.09, p = 0.058). The Sobel test also showed
mediation effect of CS between CPB and CCL (z = 3.74, p < 0.001). Thus, this finding suggested
that customer participation behavior can generate customer conative loyalty fully mediated by
customer satisfaction.
Mediating effects tested the mediating role of CS between CCB and CCL. As shown in
4.14, significant direct effect appeared from CCB on CCL (direct effect: ß = 0.13, p < 0.01),
while the indirect effect was significant (total effect: ß = 0.71, p < 0.001; indirect effect: ß =
0.58, p < 0.001. Moreover, the Z score from the Sobel test for the effect of CCB on CCL via CS
(z = 8.16, p < 0.01) indicated the mediating effect of CS for the influence of CCB on CCL was
significant. Thus, the partial mediating effects of customer satisfaction suggested that customer
citizenship behavior produces favorable customer conative loyalty. This result implied that
customer citizenship behavior impacts customer conative loyalty through customer satisfaction.
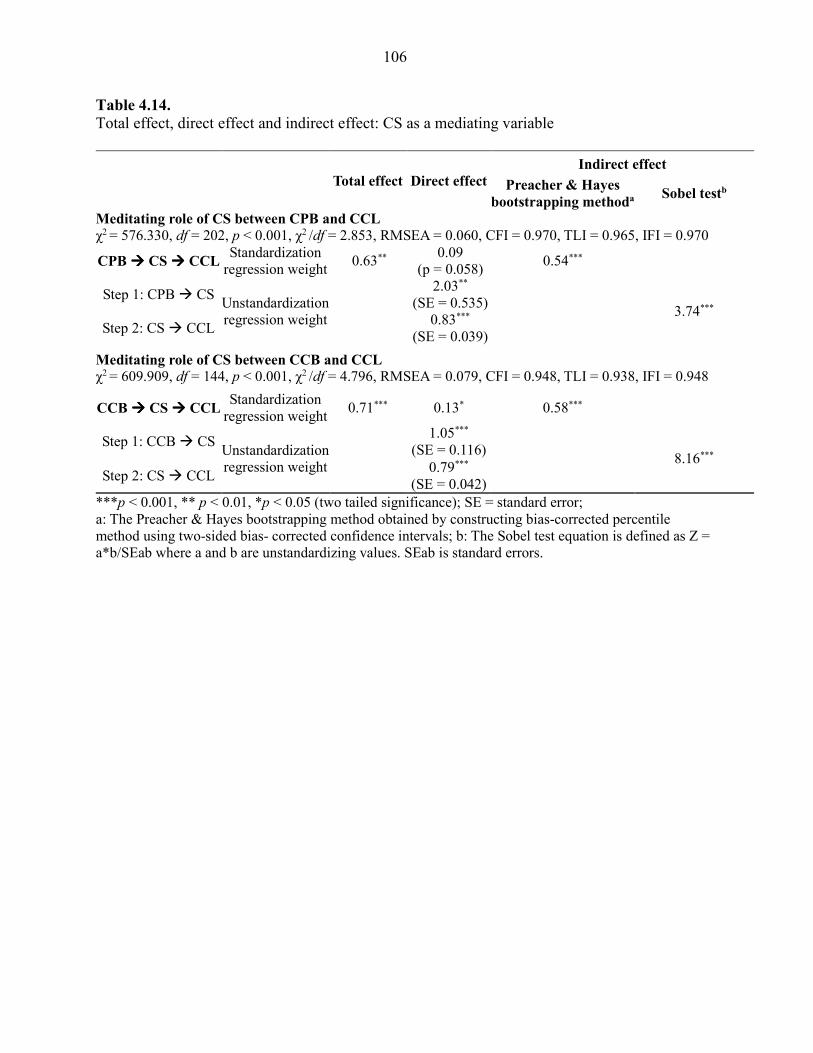
106
Table 4.14.
Total effect, direct effect and indirect effect: CS as a mediating variable
Total effect Direct effect
Indirect effect
Preacher & Hayes
bootstrapping methoda Sobel testb
Meditating role of CS between CPB and CCL
χ2 = 576.330, df = 202, p < 0.001, χ2 /df = 2.853, RMSEA = 0.060, CFI = 0.970, TLI = 0.965, IFI = 0.970
CPB ���� CS ���� CCL Standardization
regression weight 0.63**
0.09
(p = 0.058) 0.54***
Step 1: CPB � CS Unstandardization regression weight
2.03**
(SE = 0.535) 3.74***
Step 2: CS � CCL 0.83***
(SE = 0.039)
Meditating role of CS between CCB and CCL
χ2 = 609.909, df = 144, p < 0.001, χ2 /df = 4.796, RMSEA = 0.079, CFI = 0.948, TLI = 0.938, IFI = 0.948
CCB ���� CS ���� CCL Standardization
regression weight 0.71*** 0.13* 0.58***
Step 1: CCB � CS Unstandardization regression weight
1.05***
(SE = 0.116) 8.16***
Step 2: CS � CCL 0.79***
(SE = 0.042)
***p < 0.001, ** p < 0.01, *p < 0.05 (two tailed significance); SE = standard error; a: The Preacher & Hayes bootstrapping method obtained by constructing bias-corrected percentile method using two-sided bias- corrected confidence intervals; b: The Sobel test equation is defined as Z = a*b/SEab where a and b are unstandardizing values. SEab is standard errors.
107
CHAPTER 5
DISCUSSION
Chapter 4, Results, provides empirical evidence supporting the conceptual framework’s
five latent variables of restaurant innovativeness, customer value co-creation behavior, and its
consequences in the context of casual dining restaurants. Chapter 5 addresses interpretation of
the findings from the three studies, theoretical and managerial implications, study’s limitations,
and suggestions for future research. In sum, results suggested that customer perception of
restaurant innovativeness has a significant effect on customer value co-creation behavior, which
in turn, affects customer satisfaction and loyalty to a restaurant. The bases for further discussion
of implications of results of the study are from theoretical and managerial perspectives.
Discussion of Results
Scale development of CPRI
First, the design of the present study identifies customer perceptions underlying
restaurant innovativeness and to develop a set of innovativeness scales applicable to the
foodservice industry. Results that emerged from studies, 1-3, reveal internal reliability, construct
validity, nomological validity, and identified four dimensions within the 29-item customer
perception of restaurant innovativeness (CPRI) scale. The four dimensions consist of menu,
technology related service, experience related service, and promotion. Study 1 incorporated data
from 47 written interviews and generated an initial pool of restaurant innovativeness from a
customer-centric perspective. Based on the literature review and results from Study 1, the
108
construct of innovativeness represents a multidimensional phenomenon rather than a
unidimensional one; therefore, the construct of CPRI requires conceptualization and
measurement from several dimensions. Panels of experts further purified the initial pool of data
for creating the scale. Results of Study 2, based on data from 1,465 students, provided empirical
support for the four dimensions of CPRI. Results of Study 3, based on data from 514 restaurant
customers, further demonstrated nomological and construct validities for the four dimensions
underlying the CPRI construct. The results also reveal that CPRI scales of the one-factor second-
order with four constructs model perform better than the first-order with four constructs model,
or a unidimensional construct model. In sum, results of the three studies support empirical
evidence that the CPRI scale developed during this research exhibited reliable and valid
measurement.
A multidimensional concept of restaurant innovativeness adopted for this study allowed
observing customer perceptions of a restaurant’s innovative performances. These performances
embrace different aspects of innovativeness including menu and technology discussed in
previous studies, as well as experience related services and promotions covered sporadically in
earlier investigations. The multidimensional approach of innovation adopted for the present
study is consistent with that used in other recent studies (Kunz et al., 2011; Lin, 2015).
The menu innovativeness dimension can find inclusion as a part of product
innovativeness, widely discussed in previous studies, since food is the main offering of
restaurants. Thus, this dimension plays an important role in the CPRI construct: customers
especially value menu items within the context of foodservice. Menu innovation reflects
customer assessment of the degree of newness and uniqueness a restaurant’s menu appears,
109
including the restaurant’s capability to offer new flavors, new food combinations, new menu
items, innovative food presentations, and an innovative, customized menu.
The dimension of technology related to service innovativeness shows how a restaurant
offers technologically innovative service and creates an advantage for customers through the
delivery process. This dimension includes customer judgment of restaurant activities such as
offering new apps or online ordering tools, delivering cutting-edge services, and the restaurant’s
integration of innovative technologies into services.
The dimension of experience related to service innovativeness reflects intangible items
and assesses a restaurant’s creating an innovative experience for customers. For example, this
dimension embraces employees’ interactions with customers in innovative ways, employees’
solving customer problems, and the extent a restaurant has the capability to provide innovative
physical designs and innovative events.
Promotion innovativeness explicates customer perception of a restaurant’s generating
innovative marketing strategies to attract customer attention and communicates with customers.
For instance, promotion innovativeness encompasses innovative rewards (membership)
programs, deals, marketing programs, and communication platforms that allow customers to
make suggestions.
In sum, scales of customer perception of restaurant innovativeness demonstrate a
multidimensional concept, reflecting the perspectives of menu innovativeness, technology
related service innovativeness, experiences related to service innovativeness, and promotion
innovativeness. Among the four dimensions, experience related service innovativeness appears
to be the most prominent dimension in CPRI; whereas, menu innovativeness and technological
related service innovativeness has a relatively weak affect on CPRI. As Prahalad and
110
Ramaswamy (2003) contended, experience innovation is a new frontier that induces values based
on co-creation experiences; whereas, technology can represent a facilitator of experiences. In a
similar vein, previous studies (e.g., Kunz et al., 2011, Lin, 2015) suggested manifestation of
innovativeness appears not only in attributes of technology, but also in various aspects of
innovation, including experience innovativeness. Hence, CPRI scales successfully capture
aggregate concepts of restaurant innovativeness from a customer perspective, and delivers a
contextually insightful conceptualization of customer perception of innovativeness within the
context of foodservice.
Applicability of CVCB scale
A goal of the present study is to validate customer value co-creation behavior (CVCB)
and evaluate applicability of the scale within a foodservice context. Results from Studies 1-3
show internal reliability and construct validity. Customer value co-creation consists of two
dimensions: customer participation behavior (CPB) and customer citizenship behavior (CCB).
Results confirm the 16 items in customer participation behavior and the 13 items in customer
citizenship behavior. The results of Study 2 (n = 1,465) provide empirical support for the eight
dimensions of CVCB by exploring the possible underlying structure of a set of 29 scales. The
results of Study 3 (n = 514) demonstrate the validity of the construct encompassing the four
dimensions for each CPB and CCB underlying the CVCB construct. Consequently, the scale
appears to be conceptually sound and applicable to the foodservice context. Thus, the present
study validates the dimensional structure of customer value co-creation behavior within a
foodservice context.
111
In the present study, assessment of two dimensions, CPB and CCB with four aspects,
respectively, captures customer value co-creation behavior. Customer participation behavior
embraces information seeking, information sharing, responsible behavior, and personal
interaction. Similarly, customer citizenship behavior comprises feedback, advocacy, helping, and
tolerance.
Customer participation behavior entails customer in-role behaviors, referring to
enforceable or explicitly required behaviors. For example, this study required customer
participation through providing personal information, such as food allergies, for a successful
service outcome. Without this type of customer participation, a service operation might not reach
satisfactory completion. Information seeking refers to customers’ querying input from others
such as family, friends, and relatives who have experienced service at a restaurant of interest,
observing other customers’ behaviors, or consulting social media and/or a restaurant’s website.
Dimension of information refers to customer communication with restaurants’ servers or chefs
for information relevant to flavor, taste, ingredients, specifically needed services, and allergies.
Responsible behavior explicates customers’ behavior such as attending to phone calls when
delaying a scheduled appointment, avoiding no-show reservations, and displaying appropriate
manners at restaurants (such as requiring children to be well-behaved while dining out).
Dimension of personal interaction reflects customers’ reciprocal behavior with restaurants’
frontline employees, servers, or chefs.
Customer citizenship behavior explicates voluntary or discretionary extra-role behaviors
of benefit to restaurants and beyond normal customer expectations. Customer citizenship
behavior consists of four dimensions: feedback, advocacy, helping, and tolerance. The feedback
dimension explains customers’ behavior related to shared feedback, either on-site or online. The
112
advocacy dimension describes creating value, instituted by customers who voluntarily share
detailed information or write thorough reviews of restaurants’ services, qualities, or promotions
that extend beyond simple recommendation. The helping dimension refers to customers’
behavior for the purpose of assisting other restaurant customers such as providing information
and posting reviews in online or offline social communities. The tolerance dimension describes
customers’ willingness to be patient when restaurant service/delivery does not meet expectations.
Among the four CPB dimensions, the dimension of responsible behavior appears to be
the most prominent; whereas information seeking appears to be least prominent. Within the four
CCB dimensions, advocacy appears to be the most prominent dimension; whereas, tolerance
appears to be least prominent. Thus, CVBC scales successfully capture customer value co-
creation using two distinct constructs of CPB and CCB, and deliver contextually insightful
conceptualizations about customers’ behavior in creating value within a foodservice context.
Assessment of conceptual research model
This study develops and empirically supports a conceptual research model that delineates
the relationship between restaurant innovativeness, customer value co-creation behavior,
customer satisfaction, and customer coactive loyalty. Results of Study 3 represent data from 514
restaurant customers who demonstrated predictive validity of the five latent variables with a
three second-factor model. Linking customer value co-creation behavior to its antecedent (i.e.,
CPRI) and consequences (i.e., customer satisfaction and customer coactive loyalty) demonstrates
predictive validity of the proposed model.
Findings of this study show that CPRI affects CPB and CCB, implying that customer
perception of restaurant innovativeness motivates engagement in value co-creation behavior. In
113
addition, CPRI shows a stronger association with CPB than CCB. This result implies that when
customers perceive a higher level of restaurant innovativeness, the likelihood of their
collaborating with the restaurant increases, despite the voluntary or discretionary nature of their
behavior and extends beyond customers’ sense of responsibility to use the service.
CPB directly influences customer satisfaction and customer coactive loyalty; whereas,
CCB directly affects customer satisfaction but indirectly affects coactive loyalty. This finding
indicates that customers’ behavior to engage in value creation at restaurants relates positively
with their satisfaction in patronizing the restaurant. The result of the mediating effect also
demonstrates that customer satisfaction plays a mediating role between CCB and customer
coactive loyalty. This result implies that the reason customers collaborate voluntarily in
restaurants’ service delivery is that CCB increases their satisfaction and results in willingness to
patronize the restaurant.
In sum, restaurant innovativeness increases customer satisfaction through customer value
creation behavior. Results from Study 3 empirically confirm the relationship among latent
variables underlying the conceptual framework.
Implications
Since service-dominant logic has become a pervasive phenomenon in business domains,
understanding customer behavior in the co-creation process is extremely important regardless of
the type of industry. This study confirms a holistic concept of innovativeness as the key predictor
of customer value co-creation behavior, which in turn leads to customer satisfaction and coactive
loyalty. Hence, findings from the present study provide theoretical and managerial implications
for academia and practitioners. These implications may be beneficial to academic scholars for
114
evolving innovativeness and value co-creation research, and to practitioners, particularly
restaurateurs, when developing useful strategies to create value with customers.
Theoretical implications
Findings of the present study provide theoretical contributions to the literature of
innovativeness and value co-creation. This study develops and validates a multidimensional scale
of restaurant innovativeness from a customer-centric view, and examines applicability of a
customer value co-creation behavior scale within the context of foodservice through qualitative
and empirical study. This research also contributes to academia by examining the conceptual
framework that elucidates the relationship between restaurant innovativeness and customer
behaviors. In sum, the present study provides new theoretical insights into factors that create
value in the foodservice industry.
First, the present study conceptualizes restaurant innovativeness from a customer-centric
view through a comprehensive assessment of innovativeness. Less attention accrues to firm
innovativeness from a customer perspective in hospitality literature when compared with general
business literature. Only occasional studies in recent years examined customers’ or travelers’
innovativeness within the context of hospitality (e.g., Beldona, Lin, & Yoo, 2012; Hyun & Han,
2012; Ribeiro, Amaro, Seabra, & Luís Abrantes, 2014; Wang, 2014). Particularly, a limited
number of studies (i.e., Ariffin & Aziz, 2012; Jin et al., 2015) focused on firm innovativeness
from a customer perspective, measuring it only as one domain (service innovation or
environmental innovation) or a unidimensional concept. The importance of measuring firm
innovativeness from a multidimensional concept has had rare attention; studies in other domains
have assessed innovativeness from multiple dimensions such as product, service, technology,
promotions, and brand innovativeness (Kunz et al., 2013; Lin, 2015). Thus, the present research
115
empirically underscores the importance of addressing broad concepts on dimensions of
restaurant innovativeness. Specifically, customer perception of restaurant innovativeness not
only relating to menus (product) and technological aspects of service innovativeness, widely
investigated in previous studies, but also relating to experiential service and promotional
innovativeness which are relatively new. Therefore, the empirical test of CPRI conceptualization
provides support for application of a valid scale to understand restaurant innovativeness from a
customer perspective.
Second, a limited number of studies considered customer value co-creation behavior
within the context of hospitality. Customer value co-creation behavior theory in the hospitality
industry highlights the importance of customers’ roles in creating value during service delivery.
The present study is one of only a few attempts to investigate customer co-creation behavior
using two distinct factors of the second-order model: CPB and CCB of the higher-order scale of
customer value co-creation behavior, originally developed by Yi and Gong (2013), suggested
applicability of the scale among distinct countries and other business domains. Thus, results of
the present study support strong corroboration for applicability of customer value co-creation
behavior scales within the context of hospitality: the findings support a substantial theoretical
basis for studying value co-creation. The present study offers an essential theoretical contribution
by describing customer behaviors that create value at restaurants. The scalability and versatility
of the CVCB scale exhibits a theoretically useful and applicable foundation for future research
into value co-creation behavior from a customer perspective.
Third, the present study empirically assesses causal relationships between restaurant
innovativeness, customer co-creation behavior, and behavioral outcomes through S-D logic.
Particularly, the present study integrates the innovativeness notion into customer co-creation
116
behavior. Previous research (e.g., Prahalad & Krishnan, 2008; Prahalad & Ramaswamy, 2003;
Spohrer & Maglio, 2008; Vargo & Lusch, 2004) conceptually addressed the relationship between
innovativeness and value co-creation. However, absence of empirical evidence provides an
incomplete understanding of customers’ perceptions of innovativeness, and customer value co-
creation relating to customers’ behavioral outcomes. Findings from this study extend an
empirical understanding of relationships, and contribute to the theoretical foundation of
antecedents and consequences of customer co-creation behavior rooted in theory addressed by S-
D logic. This linkage facilitates empirical research and supports developing strategies regarding
customer value creation for practitioners, discussed further in the Practical Implications section.
Fourth, the present study establishes that CPB and CCB mediates the relationship
between CPRI and CS. Moreover, CS mediates the relationship between CPB and CCL, and also
between CCB and CCL, respectively. More specifically, the result of this study explains the
methods and rationales for customer engagement of CPB and CCB are important for contribution
of customer perception of restaurant innovativeness to customer satisfaction. This finding
implies that customers’ higher engagement in restaurant activities can be a facilitator between
restaurant innovation and customer satisfaction. In addition, customer satisfaction is a key
mediator for increasing customer conative loyalty. The findings of this study emphasize that
customer participation and citizenship behavior affects customer conative loyalty through
customer satisfaction. In other words, customer satisfaction is crucial to customer conative
loyalty, implying customers’ higher levels of engagement are more likely to make customers
remain loyal through customer satisfaction. Despite emphasis on customer participation and
citizenship behaviors, customers remain concerned with satisfaction of a restaurant’s offerings.
117
These findings theoretically support the important role of customer participation, citizenship
behaviors and customer satisfaction in the value co-creation process.
Practical implications
This study provides unique contributions to practitioners and will help create effective
marketing strategies for the restaurant industry, in addition to academic significance. From a
practical perspective, development of a scale to capture restaurant innovativeness will help
restaurateurs assess marketing innovativeness strategies and assess how well their restaurants
accommodate customer value creation. Furthermore, practitioners can utilize insights gained
from the study to better understand the role of customer behavior in formation of value creation,
and thus more effectively allocate resources or target specific marketing opportunities.
Restaurant innovativeness, as a phenomenon, has arisen as a widely discussed topic. The
notion of innovativeness has received considerable attention in the foodservice industry;
however, only a limited number of studies have had academic focus. For example, the National
Restaurant Association (2015) held a “restaurant innovation summit,” and several major
restaurant magazines published articles regarding innovative restaurants and ideas. Restaurant
Business (2015) published “50 great restaurant ideas” that introduced innovative ideas for food,
menus, technology, and design, and Full-Service Restaurants (2013) published an article entitled,
“7 innovations of highly imaginative restaurants.” Innovativeness no doubt creates values, but
practitioners can face increased pressure to create value and differentiation through innovation in
competitive markets. As the restaurant industry attempts to become more innovative it may
question whether customers truly recognize innovative service, and if so, the nature of the exact
perception. Such efforts are in vain if lacking customers’ discern. Furthermore, when a restaurant
118
positions itself as innovative in customers’ minds, broad conceptualization of innovation is
critical. To this end, the present study focuses on a broad concept of restaurant innovativeness
from a customer-centric view. The CPRI scale can assist restaurateurs’ developing effective
marketing strategies to create customer perception of innovativeness, rather than firm
perspective. In addition, tracking relevant periodic or longitudinal information may provide
worthy information in development of strategies, over time. Tracking will enable practitioners to
determine customer perception and behavior, longitudinally, and magnify customer value co-
creation through innovative services.
Knowledge of the most prominent dimension of innovativeness can be beneficial for
practitioners when developing managerial strategies. Although all four dimensions of CPRI are
important for understanding customer perceptions of innovativeness in foodservice businesses,
outcomes suggest that experience related to service innovativeness may have the strongest
influence. Therefore, managers should consider offering innovative, value-added services to
enhance customer experience, creating an increase in customers’ willingness to engage in value
creation. Previous research focusing on innovativeness from a firm perspective concentrated on
technology innovativeness. However, results of the present study imply that according to
customer perception, customers are more likely to discern innovative service through experience:
Practitioners should not overlook the importance of experiential innovativeness. Prahalad and
Ramaswarmy (2003) argued that movement toward experiential innovation is inevitable due to
the emerging drive of value co-creation. Naturally, practitioners should not overlook technology
and should consider its potential effect on experiential innovation. Technology has already
played a role in innovation and affected customer experience, but technology is meaningful only
when implemented to improve customer experience (Prahalad & Ramaswarmy, 2003). Leading
119
foodservice companies have introduced apps using high-end technology. The restaurant business
needs to consider the methods by which technology actually affects customer experience and
creates value, rather than just what functions and features to provide. Thus, managers must
understand that emerging technologies do not serve as enhancers of service, but as facilitators of
experience. The use of innovativeness to facilitate customer experience is a key success factor in
operating an innovative restaurant.
The foodservice industry has abundant options for adding innovations to its service
delivery. For instance, restaurateurs may embed menu and experience innovation to inject
novelty and culinary interest for customers. City Grit in New York City provides both a specific
example and a useful metaphor. The restaurant plays host to chefs, invited from around the
country, to establish showcases in the kitchen and prepare multicourse dinners, creating one-of-a
-kind experiences for customers, while traditional restaurants provide permanent or semi-
permanent menus by in-house chefs. City Grit also creates a unique experience by providing
communal tables that encourage an interactive atmosphere for customers. Another example of
combining innovations is unique QR codes by Taranta in Boston. This restaurant uniquely
garnishes plates, using squid ink to provide QR codes that trace sources of ingredients. The
combination of menu, technology, and experiential innovativeness offers an extraordinary
experience for customers, making the experience more entertaining and informative. Moreover,
IBM introduced cognitive computing features that restaurateurs may use for service recovery
management. Cognitive computing functions are able to develop “personality insights” based on
a snippet of text. Computers can analyze texts to create customer profiles and provide
restaurateurs better ideas for effective responds. While food is the most marketed offering in the
foodservice industry, innovativeness addressing other factors could differentiate a restaurant
120
from competitors. For successfully evolving experience innovations, practitioners should also
remember the need for “continuity (the blocks are the same as they always been) and
transformability (functions, features, and capabilities can change continuously)” (Prahalad &
Ramaswarmy, 2003; p15).
Understanding value co-creation is essential in today’s economy in which consumption
of services is, but the service delivery process is becoming progressively more complex (Vargo,
Maglio, & Akaka, 2008). The outcome of the present study provides some suggestions to
facilitate value co-creation in the foodservice industry. Foodservice industry operators need to
fully understand how value co-creation generates a relationship between restaurant
innovativeness and customer behavioral outcomes. Restaurateurs should consider what
customers can do with the restaurant rather than what to do for customers to encourage active
value creators. Consequently, practitioners should collaborate with customers and meet
expectations in order to create value.
Customer perception of restaurant innovativeness exercises a stronger effect on customer
citizenship behaviors than customer participation behaviors and strongly effects satisfaction. In
other words, when customers perceive that a restaurant is innovative, they demonstrate more
customer citizenship behavior, a voluntary role. Customers generally exhibit favorable
participation behavior so they receive good service in a restaurant, while manifestation of
citizenship behavior appears beyond the service transaction. Therefore, encouraging citizenship
behavior might be more difficult than encouraging participation behavior. Results of this study
imply that inculcating innovative perceptions into customer minds may increase customer
engagement in value co-creation. Thus, when customers perceive greater restaurant
121
innovativeness, they are more likely to become value co-creators, thereby increasing satisfaction
and coactive loyalty.
Restaurant operators should implement strategies for customer value co-creation to
innovate new services. Prahalad and Ramaswamy (2004b) proposed the DART (dialogue,
access, risk assessment, and transparency) model of value creation that enhances interaction
between customers and a firm. Dialogue refers to “interactivity, engagement, and a propensity to
act – on both sides,” highlighting the importance of communication between two parties. For
example, service failures are inevitable in the foodservice industry, but managing the
communication platform might lead to a successful service recovery (Kim & Tang, 2016). In
order to increase customer value co-creation behavior from a communication strategy
perspective, restaurants need to provide innovative promotional strategies, including an effective
communication platform for listening to customers’ opinions and ideas that, in turn, encourage
customer collaboration. An open communication platform enables customers to interact with the
restaurant, thereby creating value between customers and the restaurant. Customers exhibit not
only participation behavior such as information sharing, but also citizenship behavior such as
sharing feedback and helping behaviors. Assess begins with tools and information; risk
assessment means probability of harm to a customer; and transparency refers to avoidance of
information asymmetry (Prahalad & Ramaswarmy, 2004). Active co-creator customers
increasingly participate in value co-creation, insisting that companies inform them of potential
risks, and expecting transparency and accessible information (Prahalad & Ramaswarmy, 2004).
For example, many restaurant customers want to know ingredients, or the origin of food offered,
in order to guard against food allergies or to garner nutritional information. Further, labeling
food is the most useful means to alleviate asymmetric information problems (Golan, Kuchler,
122
Mitchell, Greene, & Jessup, 2001), and to provide information that corrects asymmetric
information (Drichoutis, Lazaridis, & Nayga Jr, 2006; Pearce, 1999). Saarijärvi, Kannan, and
Kuusela (2013) explained value co-creation by using nutritional codes. Nutritional advice
provides customers with information relevant to a healthy-eating lifestyle, and creates customer
value that is utilitarian or hedonic. Furthermore, refined data from customers provides a firm
resource that engages customers in their own value creating process, a process leading to
company value creation supported by increased customer loyalty (Saarijärvi et al., 2013).
Consequently, customers share information as part of value co-creation behavior, and restaurant
operators who provide customers’ with desired information in advance can increase value for
both customers and restaurants.
Restaurateurs need to recognize that interaction between customers and firm is critical in
value creation for both sides given the significant impact of co-creation behavior and behavioral
outcomes. Practitioners need to encourage employees to create a friendly organizational culture
where customers interact with staff. Lusch et al. (2007) stressed importance for an organizational
culture by stating that service dominant logic should be well embedded within the entire
organizational environment. In this case, employees are the primary source of innovation and
value creation. Top management, as leaders of service businesses, can support employees and
facilitate employee attempts to develop and create new ways of providing service; the manager’s
role is servant leader (Lusch et al., 2007, p15). Top management in the foodservice industry also
needs to consider proper employee training; employees may not have the skills and knowledge to
collaborate in value-creating activities (Plé & Chumpitaz Cáceres, 2010).
To conclude, the present study explores and identifies the market phenomenon of
innovativeness and value co-creation within the context of foodservice. The present study
123
theoretically confirms the research model that accounts for the dynamics of the phenomenon and
assesses the phenomenon to provide significant managerial contributions. Further related
suggestions will be discussed below.
Limitations and Future Research Directions
This section discusses the limitations associated with the present research’s design and
methodology. Despite theoretical and managerial implications, interpretation of this study’s
results must recognize several limitations requiring further examination and research. Although
the present study is pioneering designed to identify customer perception of innovativeness and
behavior creating value in the restaurant industry, the study is an initial step toward
understanding and predicting relationships between customer perception of restaurant
innovativeness and customer value co-creation behavior. Thereby, future research needs to
achieve a more complete picture of restaurant innovativeness and customer co-creation behavior.
First, results of the present study may fall short of generalizability due to limitations of
sampling in only one country, despite attempting to avoid bias in sampling characteristics by
restricting quotas based on gender, region, and U.S.A. census report data of ethnicity.
Additionally, the set of scales employed in this study and designed for the restaurant industry,
needs extension to other business contexts and a variety of other hospitality contexts. Therefore,
future research may focus on testing generalizability for, and applicability of, a set of scales for
the proposed model.
Second, this study investigates casual dining restaurants. Restaurateurs should be aware
that customers may place emphasis differently on restaurant innovativeness according to type of
restaurant, and behavior to create customers’ participation can vary as well. For example, this
124
study targeted casual-dining restaurants, and results show that experience related to service
innovativeness has greater importance than does technology related service innovativeness.
Future research may focus on different settings useful in overcoming possible problems related
to generalizability of findings and specific implications.
Third, this study argues for the importance of value co-creation behavior from a customer
perspective. However, investigating employee’s behavior related to value co-creation in the
context of foodservice would be of interest. Service in the restaurant industry heavily relies on
front-line employees, and employees’ behavior to create value with the customer may have an
impact on customer value co-creation behavior. Previous research (i.e., Yi & Gong, 2008) based
on social learning theory argued that employee value facilitating behavior induces and affects
customer citizenship behavior. Therefore, future research can extend the scope of this study to
employees’ behaviors, further clarifying the holistic notion of the value creation processes
resulting from interactions between customers and employees.
Last, the current study tested behavioral outcomes (i.e., customer satisfaction and
customer coactive loyalty) consequent to CVCB. Exploring behavioral outcomes from CVCB
can benefit practitioners by providing empirical evidence relevant to the importance of customer
engagement in the value co-creation process. This study encourages future research to identify
the consequences of CVCB from customers’ perspectives. An investigation of the rationale for
customers’ collaboration in the value creation process would be enlightening, along with the
techniques of engagement in the value creation process affects subsequent generated value. For
example, an exploration of the impact of value co-creation customer behavior on perceived value
from customers’ perspectives would be helpful. Revelations of this factor would allow future
125
researchers to explore detailed aspects and dimensions of the value creation process from
customers’ perspectives.
126
REFERENCES
Aaker, D. (1991). Brand equity. La gestione del valore della marca.
Adams, D. A., Nelson, R. R., & Todd, P. A. (1992). Perceived usefulness, ease of use, and usage of information technology: A replication. MIS Quarterly, 16(2)., 227-247.
Agarwal, R., & Selen, W. (2009). Dynamic capability building in service value networks for achieving service innovation. Decision Sciences, 40(3), 431-475.
Ahearne, M., Bhattacharya, C. B., & Gruen, T. (2005). Antecedents and consequences of customer-company identification: expanding the role of relationship marketing. Journal
of Applied Psychology, 90(3), 574.
Alegre, J., Lapiedra, R., & Chiva, R. (2006). A measurement scale for product innovation performance. European Journal of Innovation Management, 9(4), 333-346.
Algesheimer, R., Dholakia, U. M., & Herrmann, A. (2005). The social influence of brand community: Evidence from European car clubs. Journal of Marketing, 69(3), 19-34.
Ali, A., Krapfel, R., & LaBahn, D. (1995). Product innovativeness and entry strategy: impact on
cycle time and break‐even time. Journal of Product Innovation Management, 12(1), 54-69.
Amabile, T. M., Conti, R., Coon, H., Lazenby, J., & Herron, M. (1996). Assessing the work environment for creativity. Academy of Management Journal, 39(5), 1154-1184.
American Psychological Association. (1985). Standards for educational and psychological
testing. Washington, DC: American Psychological Association
Anderson, E. W., Fornell, C., & Lehmann, D. R. (1994). Customer satisfaction, market share, and profitability: Findings from Sweden. The Journal of Marketing, 58(3), 53-66.
Anderson, J. C., & Gerbing, D. W. (1988). Structural equation modeling in practice: A review and recommended two-step approach. Psychological Bulletin, 103(3), 411-423.
Andreassen, T. W., & Lindestad, B. (1998). Customer loyalty and complex services: The impact of corporate image on quality, customer satisfaction and loyalty for customers with varying degrees of service expertise. International Journal of Service Industry
Management, 9(1), 7-23.
Anselmsson, J., & Johansson, U. (2009). Retailer brands and the impact on innovativeness in the grocery market. Journal of Marketing Management, 25(1-2), 75-95.
127
Ariffin, A. A. M., & Aziz, N. A. (2012). The Effect of Physical Environment's Innovativeness onthe Relationship between Hosting Quality and Satisfaction in Hotel Services. International Journal of Trade, Economics and Finance, 3(5), 337-342.
Arnold, T. J., Fang, E. E., & Palmatier, R. W. (2011). The effects of customer acquisition and retention orientations on a firm’s radical and incremental innovation performance. Journal of the Academy of Marketing Science, 39(2), 234-251.
Atuahene‐Gima, K. (1995). An exploratory analysis of the impact of market orientation on new product performance. Journal of Product Innovation Management, 12(4), 275-293.
Atuahene-Gima, K. (1996). Market orientation and innovation. Journal of Business
Research, 35(2), 93-103.
Atuahene-Gima, K. (2005). Resolving the capability—rigidity paradox in new product innovation. Journal of Marketing, 69(4), 61-83.
Auh, S., Bell, S. J., McLeod, C. S., & Shih, E. (2007). Co-production and customer loyalty in financial services. Journal of Retailing, 83(3), 359-370.
Back, K. J., & Parks, S. C. (2003). A brand loyalty model involving cognitive, affective, and conative brand loyalty and customer satisfaction. Journal of Hospitality & Tourism
Research, 27(4), 419-435.
Backman, S. J., & Crompton, J. L. (1991). The usefulness of selected variables for predicting activity loyalty. Leisure Sciences, 13(3), 205-220.
Bagozzi, R. P., & Dholakia, U. M. (2006). Antecedents and purchase consequences of customer participation in small group brand communities. International Journal of Research in
Marketing, 23(1), 45-61.
Bagozzi, R. P., & Yi, Y. (1988). On the evaluation of structural equation models. Journal of the
Academy of Marketing Science, 16(1), 74-94.
Barnes, J. G. (1994). Close to the customer: but is it really a relationship? Journal of Marketing
Management, 10(7), 561-570.
Barney, J. (1991). Firm resources and sustained competitive advantage. Journal of
Management, 17(1), 99-120.
Baron, S., Warnaby, G., & Hunter‐Jones, P. (2014). Service (s) marketing research: developments and directions. International Journal of Management Reviews, 16(2), 150-171.
Bartikowski, B., & Walsh, G. (2011). Investigating mediators between corporate reputation and customer citizenship behaviors. Journal of Business Research, 64(1), 39-44.
128
Bateson, J. E. G., & Hoffman, K. D. (2011). Services marketing (4th edition). Asia: SouthWestern Cengage Learning.
Bearden, W. O., Hardesty, D. M., & Rose, R. L. (2001). Consumer self‐confidence: refinements in conceptualization and measurement. Journal of Consumer Research, 28(1), 121-134.
Beldona, S., Lin, K., & Yoo, J. (2012). The roles of personal innovativeness and push vs pull delivery methods in travel-oriented location-based marketing services. Journal of
Hospitality and Tourism Technology, 3(2), 86-95.
Bendapudi, N., & Leone, R. P. (2003). Psychological implications of customer participation in co-production. Journal of Marketing, 67(1), 14-28.
Bennett, R., & Rundle-Thiele, S. (2002). A comparison of attitudinal loyalty measurement approaches. The Journal of Brand Management, 9(3), 193-209.
Berry, L. L., Shankar, V., Parish, J. T., Cadwallader, S., & Dotzel, T. (2006). Creating new markets through service innovation. MIT Sloan Management Review, 47(2), 56.
Bettencourt, L. A. (1997). Customer voluntary performance: customers as partners in service delivery. Journal of Retailing, 73(3), 383-406.
Bettencourt, L. A., & Brown, S. W. (1997). Contact employees: Relationships among workplace fairness, job satisfaction and prosocial service behaviors. Journal of Retailing, 73(1), 39-61.
Bharwani, S., & Jauhari, V. (2013). An exploratory study of competencies required to co-create memorable customer experiences in the hospitality industry. International Journal of
Contemporary Hospitality Management, 25(6), 823-843.
Binder, P., Kessler, A., Mair, M., & Stummer, K. (2016). Organizational Innovativeness and its Results: a Qualitative analysis of SME Hotels in Vienna. Journal of Hospitality &
Tourism Research, 40(3), 339-363.
Binkhorst, E., & Den Dekker, T. (2009). Agenda for co-creation tourism experience research. Journal of Hospitality Marketing & Management, 18(2-3), 311-327.
Blodgett, J. G., Hill, D. J., & Tax, S. S. (1997). The effects of distributive, procedural, and interactional justice on postcomplaint behavior. Journal of Retailing, 73(2), 185-210.
Bloemer, J. M., & Kasper, H. D. (1995). The complex relationship between consumer satisfaction and brand loyalty. Journal of Economic Psychology,16(2), 311-329.
Bloemer, J. M., & Lemmink, J. G. (1992). The importance of customer satisfaction in explaining brand and dealer loyalty. Journal of Marketing Management, 8(4), 351-363.
Bollen, K. A. (1989). Structural equations with latent variables. New York, N.Y.: John Wiley.
129
Bolton, R. N., & Lemon, K. N. (1999). A dynamic model of customers' usage of services: Usage as an antecedent and consequence of satisfaction. Journal of Marketing Research, 36(2), 171-186.
Bove, L. L., Pervan, S. J., Beatty, S. E., & Shiu, E. (2009). Service worker role in encouraging customer organizational citizenship behaviors. Journal of Business Research, 62(7), 698-705.
Bowen, J. T., & Chen, S. L. (2001). The relationship between customer loyalty and customer satisfaction. International Journal of Contemporary Hospitality Management, 13(5), 213-217.
Bowonder, B., Dambal, A., Kumar, S., & Shirodkar, A. (2010). Innovation strategies for creating competitive advantage. Research-Technology Management, 53(3), 19-32.
Brady, M. K., Cronin, J. J., Fox, G. L., & Roehm, M. L. (2008). Strategies to offset performance failures: The role of brand equity. Journal of Retailing, 84(2), 151-164.
Brady, M. K., Knight, G. A., Cronin, J. J., Tomas, G., Hult, M., & Keillor, B. D. (2005). Removing the contextual lens: A multinational, multi-setting comparison of service evaluation models. Journal of Retailing, 81(3), 215-230.
Braun, V., & Clarke, V. (2006). Using thematic analysis in psychology. Qualitative Research in
Psychology, 3(2), 77-101.
Brown, R. (1997). Assessing specific mediational effects in complex theoretical models. Structural Equation Modeling, 4(2), 142-156.
Burt, R. S. (1976). Interpretational confounding of unobserved variables in structural equation models. Sociological Methods Research, 5(1), 3-52.
Büttgen, M., Schumann, J. H., & Ates, Z. (2012). Service locus of control and customer coproduction the role of prior service experience and organizational socialization. Journal of Service Research, 15(2), 166-181.
Buttle, F. (1996). SERVQUAL: review, critique, research agenda. European Journal of
Marketing, 30(1), 8-32.
Byrne, B. M. (2001). Structural equation modeling: Perspectives on the present and the future. International Journal of Testing, 1(3), 327.
Byrne, B. M. (2010). Structural equation modeling with AMOS: Basics concepts, applications,
and programming (2nd ed.). Routledge: Taylor & Francis Group, New York, N.Y.
Cabiddu, F., Lui, T. W., & Piccoli, G. (2013). Managing value co-creation in the tourism industry. Annals of Tourism Research, 42, 86-107.
130
Calantone, R. J., Chan, K., & Cui, A. S. (2006). Decomposing product innovativeness and its effects on new product success. Journal of Product Innovation Management, 23(5), 408-421.
Carmines, E. G., & Zeller, R. A. (1979). Reliability and validity assessment (Vol. 17). Sage publications.
Caruana, A. (2002). Service loyalty: The effects of service quality and the mediating role of customer satisfaction. European Journal of Marketing, 36(7/8), 811-828.
Cermak, D. S., File, K. M., & Prince, R. A. (1994). Customer participation in service specification and delivery. Journal of Applied Business Research, 10(2), 90.
Chan, K. W., Yim, C. K., & Lam, S. S. (2010). Is customer participation in value creation a double-edged sword? Evidence from professional financial services across cultures. Journal of Marketing, 74(3), 48-64.
Chandy, R. K., & Tellis, G. J. (2000). The incumbent’s curse? Incumbency, size, and radical product innovation. Journal of Marketing, 64(3), 1-17.
Chang, F. Y. H., & Dawson, J. (2006). The acceptance and adaptation of a foreign retail format: the case of the convenience store in Taiwan in the 1980s and 1990s. International
Journal of Entrepreneurship and Small Business, 4(1), 17-40.
Chao, P. (2008). Exploring the nature of the relationships between service quality and customer loyalty: an attribute-level analysis. The Service Industries Journal, 28(1), 95-116.
Chathoth, P. K., Ungson, G. R., Altinay, L., Chan, E. S., Harrington, R., & Okumus, F. (2014). Barriers affecting organisational adoption of higher order customer engagement in tourism service interactions. Tourism Management, 42, 181-193.
Chathoth, P., Altinay, L., Harrington, R. J., Okumus, F., & Chan, E. S. (2013). Co-production versus co-creation: A process based continuum in the hotel service context. International
Journal of Hospitality Management, 32, 11-20.
Chaudhuri, A., & Holbrook, M. B. (2001). The chain of effects from brand trust and brand affect to brand performance: the role of brand loyalty. Journal of Marketing, 65(2), 81-93.
Chen, S. C., Raab, C., & Tanford, S. (2015). Antecedents of mandatory customer participation in service encounters: An empirical study. International Journal of Hospitality
Management, 46, 65-75.
Churchill Jr, G. A. (1979). A paradigm for developing better measures of marketing constructs. Journal of Marketing Research, 16(1), 64-73.
City Grit. (n.d). Retrieved from http://citygritnyc.com/
131
Clark, L. A., & Watson, D. (1995). Constructing validity: Basic issues in objective scale development. Psychological Assessment, 7(3), 309-319.
Claycomb, C., Lengnick-Hall, C. A., & Inks, L. W. (2001). The customer as a productive resource: a pilot study and strategic implications. Journal of Business Strategies, 18(1), 47-69.
Constantin, J. A., & Lusch, R. F. (1994). Understanding resource management: How to deploy
your people, products, and processes for maximum productivity. Irwin Professional Pub.
Crabtree, B., & Miller, W. (1999). Using codes and code manuals: A template organizing style of interpretation. In B. F. Crabtree & W. L. Miller (Eds.), Doing qualitative research (2nd ed.) (pp. 163-177). Thousand Oaks, CA: Sage Publications
Crawford, C. M., & Di Benedetto, C. A. (2008). New products management. Tata McGraw-Hill Education.
Cronbach, L. J. (1951). Coefficient alpha and the internal structure of tests. Psychometrika, 16(3), 297-334.
Cronbach, L. J., & Shavelson, R. J. (2004). My current thoughts on coefficient alpha and successor procedures. Educational and Psychological Measurement, 64(3), 391-418.
Cronin Jr, J. J., & Taylor, S. A. (1992). Measuring service quality: a reexamination and extension. The Journal of Marketing, 54(3), 55-68.
Cronin, J. J., Brady, M. K., & Hult, G. T. M. (2000). Assessing the effects of quality, value, and customer satisfaction on consumer behavioral intentions in service environments. Journal
of Retailing, 76(2), 193-218.
Crosby, L. A., Evans, K. R., & Cowles, D. (1990). Relationship quality in services selling: an interpersonal influence perspective. The Journal of Marketing, 68-81.
Danneels, E., & Kleinschmidtb, E. J. (2001). Product innovativeness from the firm's perspective: its dimensions and their relation with project selection and performance. Journal of
Product Innovation Management,18(6), 357-373.
Day, G. S. (1976). A two-dimensional concept of brand loyalty. In Mathematical Models in
Marketing (pp. 89-89). Springer Berlin Heidelberg.
Day, G. S. (1994). The capabilities of market-driven organizations. the Journal of Marketing, 58(4), 37-52.
Dellande, S., Gilly, M. C., & Graham, J. L. (2004). Gaining compliance and losing weight: The role of the service provider in health care services. Journal of Marketing, 68(3), 78-91.
132
Dell'Era, C., & Verganti, R. (2011). Diffusion Processes of Product Meanings in
Design‐Intensive Industries: Determinants and Dynamics. Journal of Product Innovation
Management, 28(6), 881-895.
DeVellis, R. F. (1991). Scale development: Theory and applications. Newbury Park, CA: Sage Publications.
Dholakia, U. M., Bagozzi, R. P., & Pearo, L. K. (2004). A social influence model of consumer participation in network-and small-group-based virtual communities. International
Journal of Research in Marketing, 21(3), 241-263.
Dick, A. S., & Basu, K. (1994). Customer loyalty: toward an integrated conceptual framework. Journal of the Academy of Marketing Science, 22(2), 99-113.
Dong, B., Evans, K. R., & Zou, S. (2008). The effects of customer participation in co-created service recovery. Journal of the Academy of Marketing Science, 36(1), 123-137.
Drichoutis, A. C., Lazaridis, P., & Nayga Jr, R. M. (2006). Consumers' use of nutritional labels: a review of research studies and issues. Academy of Marketing Science Review, 2006, 1.
Edvardsson, B., Kristensson, P., Magnusson, P., & Sundström, E. (2012). Customer integration within service development—A review of methods and an analysis of insitu and exsitu contributions. Technovation, 32(7), 419-429.
Eisingerich, A. B., & Rubera, G. (2010). Drivers of brand commitment: A cross-national investigation. Journal of International Marketing, 18(2), 64-79.
Ennew, C. T., & Binks, M. R. (1999). Impact of participative service relationships on quality, satisfaction and retention: an exploratory study. Journal of Business Research, 46(2), 121-132.
Etgar, M. (2008). A descriptive model of the consumer co-production process. Journal of the
Academy of Marketing Science, 36(1), 97-108.
Ettlie, J. E., & Rosenthal, S. R. (2011). Service versus Manufacturing Innovation*. Journal of
Product Innovation Management, 28(2), 285-299.
Ettlie, J. E., Bridges, W. P., & O'keefe, R. D. (1984). Organization strategy and structural differences for radical versus incremental innovation. Management Science, 30(6), 682-695.
Fang, E. (2008). Customer participation and the trade-off between new product innovativeness and speed to market. Journal of Marketing, 72(4), 90-104.
Fang, E., Palmatier, R. W., & Evans, K. R. (2008). Influence of customer participation on creating and sharing of new product value. Journal of the Academy of Marketing
Science, 36(3), 322-336.
133
Feltenstein, A. (1986). An intertemporal general equilibrium analysis of financial crowding out: A policy model and an application to Australia. Journal of Public Economics, 31(1), 79-104.
Fishbein, M., & Ajzen, I. (1975). Belief, attitudes, intention, and behavior. An introduction to
theory and research. Massachusetts: Addison-Wesley.
FitzPatrick, M., Davey, J., Muller, L., & Davey, H. (2013). Value-creating assets in tourism management: Applying marketing's service-dominant logic in the hotel industry. Tourism
Management, 36, 86-98.
Flick, U. (2014). An introduction to qualitative research (5th ed.) SAGE Publications Ltd.
Ford, W. S. Z. (1995). Evaluation of the indirect influence of courteous service on customer discretionary behavior. Human Communication Research, 22(1), 65-89.
Fornell, C., & Larcker, D. F. (1981). Evaluating structural equation models with unobservable variables and measurement error. Journal of Marketing Research, 18(1), 39-50.
Fornell, C., Johnson, M. D., Anderson, E. W., Cha, J., & Bryant, B. E. (1996). The American customer satisfaction index: nature, purpose, and findings. the Journal of Marketing, 60(4), 7-18.
Fournier, S., & Mick, D. G. (1999). Rediscovering satisfaction. the Journal of Marketing, 63(4), 5-23.
Full-Service Restaurants. (2013 March). Retrieved from https://www.fsrmagazine.com/new-concepts/7-innovations-highly-imaginative-restaurants
Gallan, A. S., Jarvis, C. B., Brown, S. W., & Bitner, M. J. (2013). Customer positivity and participation in services: an empirical test in a health care context. Journal of the
Academy of Marketing Science, 41(3), 338-356.
Garcia, R., & Calantone, R. (2002). A critical look at technological innovation typology and innovativeness terminology: a literature review. Journal of Product Innovation
Management, 19(2), 110-132.
Garson, D. (2011) Reliability Analysis. Statnotes from North Carolina State University Public Administration Program.
Gatignon, H., & Robertson, T. S. (1985). A propositional inventory for new diffusion research. Journal of Consumer Research, 11(4), 849-867.
Golan, E., Kuchler, F., Mitchell, L., Greene, C., & Jessup, A. (2001). Economics of food labeling. Journal of Consumer Policy, 24(2), 117-184.
Goldsmith, R. E., & Hofacker, C. F. (1991). Measuring consumer innovativeness. Journal of the
Academy of Marketing Science, 19(3), 209-221.
134
Gotlieb, J. B., Grewal, D., & Brown, S. W. (1994). Consumer satisfaction and perceived quality: complementary or divergent constructs? Journal of Applied Psychology, 79(6), 875.
Grant, J. S., & Davis, L. L. (1997). Selection and use of content experts for instrument development. Research in Nursing & Health, 20(3), 269-274.
Grewal, D., Ailawadi, K. L., Gauri, D., Hall, K., Kopalle, P., & Robertson, J. R. (2011). Innovations in retail pricing and promotions. Journal of Retailing, 87, S43-S52.
Grissemann, U. S., & Stokburger-Sauer, N. E. (2012). Customer co-creation of travel services: The role of company support and customer satisfaction with the co-creation performance. Tourism Management, 33(6), 1483-1492.
Grönroos, C. (2008). Service logic revisited: who creates value? And who co-creates? European
Business Review, 20(4), 298-314.
Grönroos, C., & Ravald, A. (2011). Service as business logic: implications for value creation and marketing. Journal of Service Management, 22(1), 5-22.
Grönroos, C., & Voima, P. (2013). Critical service logic: making sense of value creation and co-creation. Journal of the Academy of Marketing Science, 41(2), 133-150.
Groth, M. (2005). Customers as good soldiers: examining citizenship behaviors in internet service deliveries. Journal of Management, 31(1), 7-27.
Groth, M., Mertens, D. P., & Murphy, R. O. (2004). Customers as good solidiers: Extending organizational citizenship behavior research to the customer domain. In: D. L. Turnipseed (Ed.), Handbook of organizational citizenship behavior (pp. 411-430). Hauppauge, NY: Nova Science Publishers.
Gruen, T. W. (1995). The outcome set of relationship marketing in consumer markets. International Business Review, 4(4), 447-469.
Guo, L., Arnould, E. J., Gruen, T. W., & Tang, C. (2013). Socializing to Co-Produce Pathways to Consumers’ Financial Well-Being. Journal of Service Research, 1094670513483904.
Ha, H. Y., & Perks, H. (2005). Effects of consumer perceptions of brand experience on the web: Brand familiarity, satisfaction and brand trust. Journal of Consumer Behaviour, 4(6), 438-452.
Hair, J. F., Anderson, R. E., Tatham, R. L., & Black, W. C. Multivariate data analysis with
readings (5th ed.). Englewood Cliffs, N.J.: Prentice-Hall.
Hallowell, R. (1996). The relationships of customer satisfaction, customer loyalty, and profitability: an empirical study. International Journal of Service Industry
Management, 7(4), 27-42.
135
Hardesty, D. M., & Bearden, W. O. (2004). The use of expert judges in scale development: Implications for improving face validity of measures of unobservable constructs. Journal
of Business Research, 57(2), 98-107.
Hartline, M. D., Maxham III, J. G., & McKee, D. O. (2000). Corridors of influence in the dissemination of customer-oriented strategy to customer contact service employees. Journal of Marketing, 64(2), 35-50.
Hausman, A. (2004). Modeling the patient-physician service encounter: improving patient outcomes. Journal of the Academy of Marketing Science,32(4), 403-417.
Heinonen, K., Strandvik, T., Mickelsson, K. J., Edvardsson, B., Sundström, E., & Andersson, P. (2010). A customer-dominant logic of service. Journal of Service Management, 21(4), 531-548.
Hinkin, T. R. (1995). A review of scale development practices in the study of organizations. Journal of Management, 21(5), 967-988.
Hipp, C., & Grupp, H. (2005). Innovation in the service sector: The demand for service-specific innovation measurement concepts and typologies. Research Policy, 34(4), 517-535.
Hjalager, A. M., & Konu, H. (2011). Co-branding and co-creation in wellness tourism: The role of cosmeceuticals. Journal of Hospitality Marketing & Management, 20(8), 879-901.
Hoeffler, S. (2003). Measuring preferences for really new products. Journal of Marketing
Research, 40(4), 406-420.
Hogan, S. J., Soutar, G. N., McColl-Kennedy, J. R., & Sweeney, J. C. (2011). Reconceptualizing professional service firm innovation capability: Scale development. Industrial Marketing
Management, 40(8), 1264-1273.
Hurley, R. F., & Hult, G. T. M. (1998). Innovation, market orientation, and organizational learning: an integration and empirical examination. The Journal of Marketing, 62(3), 42-54.
Hyun, S., & Han, H. (2012). A model of a patron's innovativeness formation toward a chain restaurant brand. International Journal of Contemporary Hospitality Management, 24(2), 175-199.
IBM. (n.d). Retrieved from http://www.ibm.com/smarterplanet/us/en/ibmwatson/developercloud/personality-insights.html
Jacoby, J. (1971). Model of multi-brand loyalty. Journal of Advertising Research, 11(3), 25-31.
Jacoby, J., & Chestnut, R. W. (1978). Brand loyalty: Measurement and management. New York, NY: Wiley.
136
Jacoby, J., & Kyner, D. B. (1973). Brand loyalty vs. repeat purchasing behavior. Journal of
Marketing Research, 10(1), 1-9.
Jin, N., Goh, B., Huffman, L., & Yuan, J. J. (2015). Predictors and outcomes of perceived image of restaurant innovativeness in fine-dining restaurants. Journal of Hospitality Marketing
& Management, 24(5), 457-485.
Johnson, J. W., & Rapp, A. (2010). A more comprehensive understanding and measure of customer helping behavior. Journal of Business Research, 63(8), 787-792.
Jöreskog, K. G., & Sörbom, D. (1996). LISREL 8 user's reference guide. Lincolnwood, IL: Scientific Software International.
Kandampully, J., & Suhartanto, D. (2000). Customer loyalty in the hotel industry: the role of customer satisfaction and image. International Journal of Contemporary Hospitality
Management, 12(6), 346-351.
Kandampully, J., Keating, B. W., Kim, B. P., Mattila, A. S., & Solnet, D. (2014). Service research in the hospitality literature insights from a systematic review. Cornell
Hospitality Quarterly, 55(3), 287-299.
Kelley, S. W. (1992). Developing customer orientation among service employees. Journal of the
academy of Marketing Science, 20(1), 27-36.
Kelley, S. W., Donnelly, J. H., & Skinner, S. J. (1990). Customer participation in service production and delivery. Journal of Retailing, 66(3), 315-335.
Kellogg, D. L., Youngdahl, W. E., & Bowen, D. E. (1997). On the relationship between customer participation and satisfaction: two frameworks. International Journal of Service
Industry Management, 8(3), 206-219.
Kim, E., & Tang, R. L. (2016). Rectifying Failure of Service: How Customer Perceptions of Justice Affect Their Emotional Response and Social Media Testimonial. Journal of
Hospitality Marketing & Management. DOI:10.1080/19368623.2016.1149537
Kim, W. C., & Mauborgne, R. (1999). Strategy, value innovation, and the knowledge economy. MIT Sloan Management Review, 40(3), 41.
King, N. (1994). The Qualitative Research Interview, In Cassel C. & Symon G. (Eds). Qualitative methods in organizational research: A practical guide. London, Sage Publications.
Kleijnen, M., De Ruyter, K., & Andreassen, T. W. (2005). Image congruence and the adoption of service innovations. Journal of Service Research, 7(4), 343-359.
Kline, R. B. (1998). Principles and practice of structural equation modeling. New York, N.Y.: Guilford Press.
137
Knowles, C., Hansen, E., & Dibrell, C. (2008). Measuring firm innovativeness: Development and refinement of a new scale. Journal of Forest Products Business Research, 5(5), 1-24.
Kunz, W., Schmitt, B., & Meyer, A. (2011). How does perceived firm innovativeness affect the consumer? Journal of Business Research, 64(8), 816-822.
Lee, Y., & Colarelli O'Connor, G. (2003). The impact of communication strategy on launching new products: The moderating role of product innovativeness. Journal of Product
Innovation Management, 20(1), 4-21.
Lengnick-Hall, C. A. (1996). Customer contributions to quality: A different view of the customer-oriented firm. Academy of Management Review, 21(3), 791-824.
Lengnick-Hall, C. A., Claycomb, V. C., & Inks, L. W. (2000). From recipient to contributor: examining customer roles and experienced outcomes. European Journal of Marketing, 34(3/4), 359-383.
Lin, C. Y. (2015). Conceptualizing and measuring consumer perceptions of retailer innovativeness in Taiwan. Journal of Retailing and Consumer Services, 24, 33-41.
Lin, C. Y., Marshall, D., & Dawson, J. (2013). How Does Perceived Convenience Retailer Innovativeness Create Value for the Customer? International Journal of Business and
Economics, 12(2), 171.
Luo, X., & Bhattacharya, C. B. (2006). Corporate social responsibility, customer satisfaction, and market value. Journal of Marketing, 70(4), 1-18.
Lusch, R. F., Vargo, S. L., & O’Brien, M. (2007). Competing through service: insights from service-dominant logic. Journal of Retailing, 83(1), 5-18.
Lutz, R. J., & Winn, P. R. (1974). Developing a Bayesian measure of brand loyalty: A preliminary report. In Combined proceedings (pp. 104-108). Chicago, pp. 104-8.: American Marketing Association.
MacKinnon, D. P., Warsi, G., & Dwyer, J. H. (1995). A simulation study of mediated effect measures. Multivariate Behavioral Research, 30(1), 41-62.
Mahajan, V., Muller, E., & Bass, F. M. (1990). New product diffusion models in marketing: A review and directions for research. The Journal of Marketing, 54(1), 1-26.
Malhotra, N. K., Hall, J., Shaw, M., & Oppenheim, P. (2006). Marketing research: an applied
orientation 3rd ed, Pearson Education Australia, French Forest. NSW: Prentice Hall.
Martín-Ruiz, D., Barroso-Castro, C., & Rosa-Díaz, I. M. (2012). Creating customer value through service experiences: An empirical study in the hotel industry. Tourism and
Hospitality Management, 18(1), 37-53.
138
Matthing, J., Sandén, B., & Edvardsson, B. (2004). New service development: learning from and with customers. International Journal of Service Industry Management, 15(5), 479-498.
Maxham III, J. G., & Netemeyer, R. G. (2002). Modeling customer perceptions of complaint handling over time: the effects of perceived justice on satisfaction and intent. Journal of
Retailing, 78(4), 239-252.
Maxham III, J. G., & Netemeyer, R. G. (2003). Firms reap what they sow: the effects of shared values and perceived organizational justice on customers’ evaluations of complaint handling. Journal of Marketing, 67(1), 46-62.
McNally, R. C., Cavusgil, E., & Calantone, R. J. (2010). Product innovativeness dimensions and their relationships with product advantage, product financial performance, and project protocol. Journal of Product Innovation Management, 27(7), 991-1006.
Meuter, M. L., Bitner, M. J., Ostrom, A. L., & Brown, S. W. (2005). Choosing among alternative service delivery modes: An investigation of customer trial of self-service technologies. Journal of Marketing, 69(2), 61-83.
Michel, S., Brown, S. W., & Gallan, A. S. (2008). An expanded and strategic view of discontinuous innovations: deploying a service-dominant logic. Journal of the Academy
of Marketing Science, 36(1), 54-66.
Midgley, D. F., & Dowling, G. R. (1978). Innovativeness: The concept and its measurement. Journal of Consumer Research, 4(4)229-242.
Mittal, V., & Kamakura, W. A. (2001). Satisfaction, repurchase intent, and repurchase behavior: Investigating the moderating effect of customer characteristics. Journal of Marketing
Research, 38(1), 131-142.
Moeller, S. (2008). Customer integration—a key to an implementation perspective of service provision. Journal of Service Research, 11(2), 197-210.
Möller, K., Rajala, R., & Westerlund, M. (2008). Service innovation myopia? A new recipe for client-provider value creation. California Management Review, 50(3), 31-48.
Nam, J., Ekinci, Y., & Whyatt, G. (2011). Brand equity, brand loyalty and consumer satisfaction. Annals of Tourism Research, 38(3), 1009-1030.
Nasution, H. N., & Mavondo, F. T. (2008). Customer value in the hotel industry: What managers believe they deliver and what customer experience. International Journal of Hospitality
Management, 27(2), 204-213.
National Restaurant Association. (2015 October). Retrieved from http://www.restaurant.org/Events-Networking/Restaurant-Innovation-Summit
Navarro, S., Andreu, L., & Cervera, A. (2014). Value co-creation among hotels and disabled customers: An exploratory study. Journal of Business Research, 67(5), 813-818.
139
Netemeyer, R. G., Bearden, W. O., & Sharma, S. (2003). Scaling procedures: Issues and
applications. Sage.
Nunnally, J. C., & Bernstein, I. H. (1994). The assessment of reliability. Psychometric
Theory, 3(1), 248-292.
Nunnally, J.C. (1978). Psychometric Theory. McGraw-Hill, New York, N.Y.
O’hern, M., & Rindfleisch, A. (2010). Customer co-creation. In Malhotra N. K. (Ed), Review of
Marketing Research (Review of Marketing Research, volume 6), Emerald Group Publishing Limited, 84-106.
OECD (Organisation for Economic and Co-operative Development). (2012 May). Innovation for
development. Paris: Organisation for Economic and Co-operative Development.
Oliver, R. L. (1980). A cognitive model of the antecedents and consequences of satisfaction decisions. Journal of Marketing Research, 17(4), 460-469.
Oliver, R. L. (1999). Whence consumer loyalty? the Journal of Marketing, 63(S), 33-44.
Olson, J. C., & Dover, P. A. (1979). Disconfirmation of consumer expectations through product trial. Journal of Applied Psychology, 64(2), 179.
Otim, S., & Grover, V. (2006). An empirical study on web-based services and customer loyalty. European Journal of Information Systems, 15(6), 527-541.
Ottenbacher, M. C., & Harrington, R. J. (2009). The product innovation process of quick-service restaurant chains. International Journal of Contemporary Hospitality
Management, 21(5), 523-541.
Ottenbacher, M. C., & Harrington, R. J. (2010). Strategies for achieving success for innovative versus incremental new services. Journal of Services Marketing, 24(1), 3-15.
Parasuraman, A., Zeithaml, V. A., & Berry, L. L. (1985). A conceptual model of service quality and its implications for future research. the Journal of Marketing, 49(4)41-50.
Payne, A. F., Storbacka, K., & Frow, P. (2008). Managing the co-creation of value. Journal of
the Academy of Marketing Science, 36(1), 83-96.
Pearce, R. (1999). Social responsibility in the marketplace: asymmetric information in food labelling. Business Ethics: A European Review, 8(1), 26-36.
Pedersen, P. E., & Nysveen, H. (2001). Shopbot banking: An exploratory study of customer loyalty effects. International Journal of Bank Marketing, 19(4), 146-155.
Plé, L., & Chumpitaz Cáceres, R. (2010). Not always co-creation: introducing interactional co-destruction of value in service-dominant logic. Journal of Services Marketing, 24(6), 430-437.
140
Podsakoff, P. M., & MacKenzie, S. B. (1997). Impact of organizational citizenship behavior on organizational performance: A review and suggestion for future research. Human
Performance, 10(2), 133-151.
Prahalad, C. K., & Krishnan, M. S. (2008). The new age of innovation: Driving cocreated value
through global networks (Vol. 1). New York: McGraw-Hill.
Prahalad, C. K., & Ramaswamy, V. (2003). The new frontier of experience innovation. MIT
Sloan Management Review, 44(4), 12-18.
Prahalad, C. K., & Ramaswamy, V. (2004a). Co-creation experiences: The next practice in value creation. Journal of Interactive Marketing, 18(3), 5-14.
Prahalad, C. K., & Ramaswamy, V. (2004b). Co-creating unique value with customers. Strategy
& Leadership, 32(3), 4-9.
Preacher, K. J., & Hayes, A. F. (2004). SPSS and SAS procedures for estimating indirect effects in simple mediation models. Behavior Research Methods, Instruments, & Computers, 36(4), 717-731.
Prebensen, N. K., & Foss, L. (2011). Coping and co‐creating in tourist experiences. International
Journal of Tourism Research, 13(1), 54-67.
Prebensen, N. K., Vittersø, J., & Dahl, T. I. (2013). Value co-creation significance of tourist resources. Annals of Tourism Research, 42, 240-261.
QSR International (2015) Guideline: QSR International: QSR - NVivo Data Analysis Software
Reid, R. D., & Sandler, M. (1992). The use of technology to improve service quality. The
Cornell Hotel and Restaurant Administration Quarterly, 33(3), 68-73.
Restaurant Business. (2015 November). Retrieved from http://www.restaurantbusinessonline.com/ideas/50-great-ideas
Restaurant News (2015), Top 100 Chains: U.S. Sales.
Ribeiro, H., Fonseca Amaro, S., Seabra, C., & Luís Abrantes, J. (2014). Travel content creation: The influence of travelers’ innovativeness, involvement and use of social media. Journal
of Hospitality and Tourism Technology, 5(3), 245-260.
Rihova, I., Buhalis, D., Moital, M., & Gouthro, M. B. (2015). Conceptualising
Customer‐to‐customer Value Co‐creation in Tourism. International Journal of Tourism
Research, 17(4), 356-363.
Rogers, E. M. (1962). Diffusion of innovations. 1st ed. Simon and Schuster. NY: New York.
141
Rogers, E. M. (1995) Diffusion of Innovations: modifications of a model for telecommunications." Die Diffusion von Innovationen in der Telekommunikation 17: 25-38.
Romero, D., & Molina, A. (2009). Value co-creation and co-innovation: Linking networked organisations and customer communities. In Leveraging Knowledge for Innovation in
Collaborative Networks (pp. 401-412). Springer Berlin Heidelberg.
Rosenbaum, M. S., & Massiah, C. A. (2007). When customers receive support from other customers: exploring the influence of intercustomer social support on customer voluntary performance. Journal of Service Research, 9(3), 257-270.
Rowley, J. (2007). Reconceptualising the strategic role of loyalty schemes. Journal of Consumer
Marketing, 24(6), 366-374.
Rubera, G., Ordanini, A., & Griffith, D. A. (2011). Incorporating cultural values for understanding the influence of perceived product creativity on intention to buy: An examination in Italy and the US. Journal of International Business Studies, 42(4), 459-476.
Rust, R. T., & Oliver, R. L. (Eds.). (1993). Service quality: New directions in theory and
practice. New Delhi: India, Sage Publications.
Saarijärvi, H., Kannan, P. K., & Kuusela, H. (2013). Value co-creation: theoretical approaches and practical implications. European Business Review, 25(1), 6-19.
Sandvik, I. L., Duhan, D. F., & Sandvik, K. (2014). Innovativeness and Profitability An Empirical Investigation in the Norwegian Hotel Industry. Cornell Hospitality
Quarterly, 55(2), 165-185.
Sashi, C. M. (2012). Customer engagement, buyer-seller relationships, and social media. Management Decision, 50(2), 253-272.
Sawhney, M., Verona, G., & Prandelli, E. (2005). Collaborating to create: The Internet as a platform for customer engagement in product innovation. Journal of Interactive
Marketing, 19(4), 4-17.
Sawhney, M., Wolcott, R. C., & Arroniz, I. (2006). The 12 different ways for companies to innovate. MIT Sloan Management Review, 47(3), 75.
Schriesheim, C. A., Powers, K. J., Scandura, T. A., Gardiner, C. C., & Lankau, M. J. (1993). Improving construct measurement in management research: Comments and a quantitative approach for assessing the theoretical content adequacy of paper-and-pencil survey-type instruments. Journal of Management, 19(2), 385-417.
Schumacker, R. E., & Lomax, R. G. (2004). A beginner's guide to structural equation modeling. Mahwah, NJ: Lawrence Earlboum.
142
Schumpeter, J. A. (1934). The theory of economic development: An inquiry into profits, capital,
credit, interest, and the business cycle (Vol. 55). Transaction publishers.
See-To, E. W., & Ho, K. K. (2014). Value co-creation and purchase intention in social network sites: The role of electronic Word-of-Mouth and trust–A theoretical analysis. Computers
in Human Behavior, 31, 182-189.
Segars, A. H. (1997). Assessing the unidimensionality of measurement: A paradigm and illustration within the context of information systems research. Omega, 25(1), 107-121.
Seiders, K., Voss, G. B., Grewal, D., & Godfrey, A. L. (2005). Do satisfied customers buy more? Examining moderating influences in a retailing context. Journal of Marketing, 69(4), 26-43.
Shams, R., Alpert, F., & Brown, M. (2015). Consumer perceived brand innovativeness: Conceptualization and operationalization. European Journal of Marketing, 49(9/10), 1589-1615.
Shaw, G., Bailey, A., & Williams, A. (2011). Aspects of service-dominant logic and its implications for tourism management: Examples from the hotel industry. Tourism
Management, 32(2), 207-214.
Skaggs, B. C., & Huffman, T. R. (2003). A customer interaction approach to strategy and production complexity alignment in service firms. Academy of Management
Journal, 46(6), 775-786.
Sobel, M. E. (1982). Asymptotic intervals for indirect effects in structural equations models. In S. Leinhart (Ed.), Sociological Methodology, 13(1982), 290-312. San Francisco: Jossey-Bass.
Spohrer, J., & Maglio, P. P. (2008). The emergence of service science: Toward systematic
service innovations to accelerate co‐creation of value. Production and Operations
Management, 17(3), 238-246.
Spreng, R. A., MacKenzie, S. B., & Olshavsky, R. W. (1996). A reexamination of the determinants of consumer satisfaction. The Journal of Marketing, 60(3), 15-32.
Srivastava, R. K., Shervani, T. A., & Fahey, L. (1998). Market-based assets and shareholder value: A framework for analysis. The Journal of Marketing, 62(1), 2-18.
Steenkamp, J. B. E., Hofstede, F. T., & Wedel, M. (1999). A cross-national investigation into the individual and national cultural antecedents of consumer innovativeness. The Journal of
Marketing, 63(2), 55-69.
Strandvik, T., Holmlund, M., & Edvardsson, B. (2012). Customer needing: a challenge for the seller offering. Journal of Business & Industrial Marketing, 27(2), 132-141.
143
Tajeddini, K., & Trueman, M. (2014). Perceptions of innovativeness among Iranian hotel managers. Journal of Hospitality and Tourism Technology, 5(1), 62-77.
Tanaka, J. S. (1993). Multifaceted conceptions of fit in structural equation models. In Bollen. K. A. & Long S. (Eds.), Testing Structural Equation Models. Sage focus editions. 154, 10-39.
Tanev, S., Bailetti, T., Allen, S., Milyakov, H., Durchev, P., & Ruskov, P. (2011). How do value co-creation activities relate to the perception of firms' innovativeness? Journal of
Innovation Economics & Management, (1), 131-159.
Taranta. (n.d). Retrieved from http://www.tarantarist.com/
Tax, S. S., Brown, S. W., & Chandrashekaran, M. (1998). Customer evaluations of service complaint experiences: implications for relationship marketing. The Journal of
Marketing, 60-76.
Tellis, G. J. (1988). Advertising exposure, loyalty, and brand purchase: A two-stage model of choice. Journal of Marketing Research, 1(3), 134-144.
Torres, A., & Tribó, J. A. (2011). Customer satisfaction and brand equity. Journal of Business
Research, 64(10), 1089-1096.
Tucker, W. T. (1964). The development of brand loyalty. Journal of Marketing Research, 32-35.
Vargo, S. L., & Lusch, R. F. (2004). Evolving to a new dominant logic for marketing. Journal of
Marketing, 68(1), 1-17.
Vargo, S. L., & Lusch, R. F. (2008a). Service-dominant logic: continuing the evolution. Journal
of the Academy of Marketing Science, 36(1), 1-10.
Vargo, S. L., & Lusch, R. F. (2008b). From goods to service (s): Divergences and convergences of logics. Industrial Marketing Management, 37(3), 254-259.
Verhoef, P. C. (2003). Understanding the effect of customer relationship management efforts on customer retention and customer share development. Journal of Marketing, 67(4), 30-45.
Victorino, L., Verma, R., Plaschka, G., & Dev, C. (2005). Service innovation and customer choices in the hospitality industry. Managing Service Quality: An International
Journal, 15(6), 555-576.
Vilà, J., & MacGregor, S. P. (2007). Business Innovation: What it brings, what it takes. IESE
Alumni Magazine, 8, 24-36.
Voima, P., Heinonen, K., Strandvik, T., Mickelsson, K. J., & Arantola-Hattab, J. (2011). A customer ecosystem perspective on service. QUIS 12: Advances in Service Quality,
Innovation and Excellence, 1015-1024.
144
Walls, A., Okumus, F., Wang, Y., & Kwun, D. J. W. (2011). Understanding the consumer experience: An exploratory study of luxury hotels. Journal of Hospitality Marketing &
Management, 20(2), 166-197.
Wang, C. J. (2014). Do ethical and sustainable practices matter? Effects of corporate citizenship on business performance in the hospitality industry. International Journal of
Contemporary Hospitality Management, 26(6), 930-947.
Westbrook, R. A., & Reilly, M. D. (1983). Value-percept disparity: an alternative to the disconfirmation of expectations theory of consumer satisfaction. Advances in Consumer
Research, 10(1).
Wilkins, H., Merrilees, B., & Herington, C. (2009). The determinants of loyalty in hotels. Journal of Hospitality Marketing & Management, 19(1), 1-21.
Wu, C. H. J., & Liang, R. D. (2009). Effect of experiential value on customer satisfaction with service encounters in luxury-hotel restaurants. International Journal of Hospitality
Management, 28(4), 586-593.
Xie, C., Bagozzi, R. P., & Troye, S. V. (2008). Trying to prosume: toward a theory of consumers as co-creators of value. Journal of the Academy of Marketing Science, 36(1), 109-122.
Xie, L. S., Peng, J. M., & Huan, T. C. (2014). Crafting and testing a central precept in service-dominant logic: Hotel employees’ brand-citizenship behavior and customers’ brand trust. International Journal of Hospitality Management, 42, 1-8.
Yi, Y. & Hur, T. (2007). Manage Customer Value, Seoul, South Korea: Books 21.
Yi, Y. (2014). Customer Value Creation Behavior, Routledge, NY: New York.
Yi, Y., & Gong, T. (2006). The antecedents and consequences of service customer citizenship and badness behavior. Seoul Journal of Business, 12(2), 145-176.
Yi, Y., & Gong, T. (2008). The effects of customer justice perception and affect on customer citizenship behavior and customer dysfunctional behavior. Industrial Marketing
Management, 37(7), 767-783.
Yi, Y., & Gong, T. (2013). Customer value co-creation behavior: Scale development and validation. Journal of Business Research, 66(9), 1279-1284.
Yi, Y., Nataraajan, R., & Gong, T. (2011). Customer participation and citizenship behavioral influences on employee performance, satisfaction, commitment, and turnover intention. Journal of Business Research, 64(1), 87-95.
Yim, C. K., Chan, K. W., & Lam, S. S. (2012). Do customers and employees enjoy service participation? Synergistic effects of self-and other-efficacy. Journal of Marketing, 76(6), 121-140.
145
Yuan, K. H., & Bentler, P. M. (2006). Structural Equation Modeling1.Handbook of statistics:
Psychometrics, 26, 297.
Zaichkowsky, J. L. (1985). Measuring the involvement construct. Journal of consumer research, 341-352.
Zeithaml, V. A., Bitner, M. J., & Gremler, D. D. (2006). Services Marketing: Integrating Customer Focus Across the Firm 4th. McGraw Hill.
Zhang, J., & Wedel, M. (2009). The effectiveness of customized promotions in online and offline stores. Journal of Marketing Research, 46(2), 190-206.
Zhou, K. Z., Yim, C. K., & Tse, D. K. (2005). The effects of strategic orientations on technology-and market-based breakthrough innovations. Journal of Marketing, 69(2), 42-60.
Zolfagharian, M., & Paswan, A. (2008). Do consumers discern innovations in service elements? Journal of Services Marketing, 22(5), 338-352.
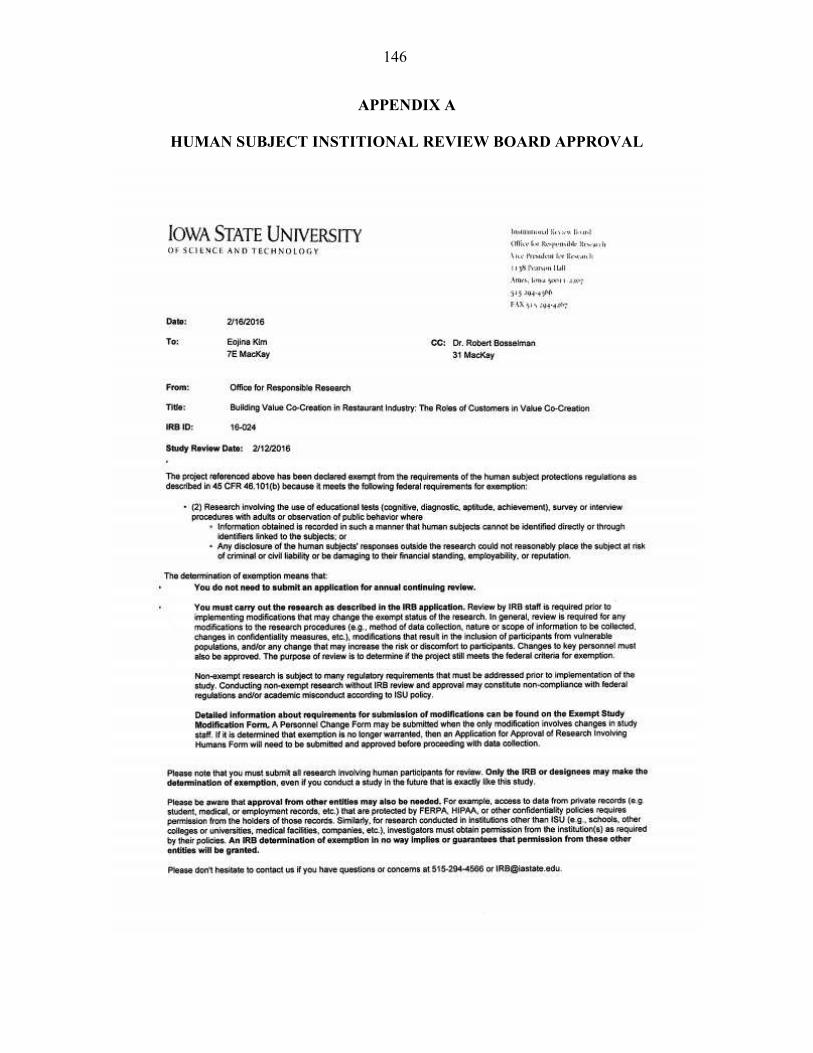
146
APPENDIX A
HUMAN SUBJECT INSTITIONAL REVIEW BOARD APPROVAL
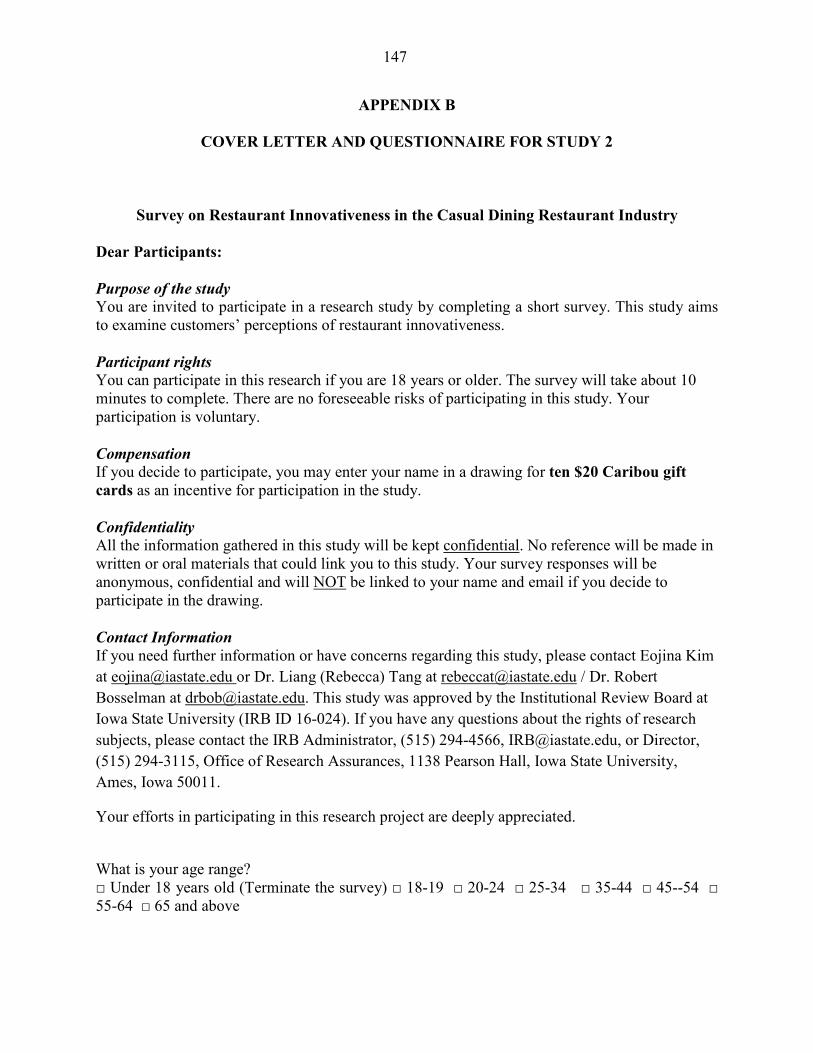
147
APPENDIX B
COVER LETTER AND QUESTIONNAIRE FOR STUDY 2
Survey on Restaurant Innovativeness in the Casual Dining Restaurant Industry
Dear Participants:
Purpose of the study
You are invited to participate in a research study by completing a short survey. This study aims to examine customers’ perceptions of restaurant innovativeness.
Participant rights
You can participate in this research if you are 18 years or older. The survey will take about 10 minutes to complete. There are no foreseeable risks of participating in this study. Your participation is voluntary.
Compensation
If you decide to participate, you may enter your name in a drawing for ten $20 Caribou gift
cards as an incentive for participation in the study.
Confidentiality
All the information gathered in this study will be kept confidential. No reference will be made in written or oral materials that could link you to this study. Your survey responses will be anonymous, confidential and will NOT be linked to your name and email if you decide to participate in the drawing.
Contact Information
If you need further information or have concerns regarding this study, please contact Eojina Kim
at [email protected] or Dr. Liang (Rebecca) Tang at [email protected] / Dr. Robert
Bosselman at [email protected]. This study was approved by the Institutional Review Board at
Iowa State University (IRB ID 16-024). If you have any questions about the rights of research
subjects, please contact the IRB Administrator, (515) 294-4566, [email protected], or Director,
(515) 294-3115, Office of Research Assurances, 1138 Pearson Hall, Iowa State University,
Ames, Iowa 50011.
Your efforts in participating in this research project are deeply appreciated.
What is your age range? □ Under 18 years old (Terminate the survey) □ 18-19 □ 20-24 □ 25-34 □ 35-44 □ 45--54 □ 55-64 □ 65 and above
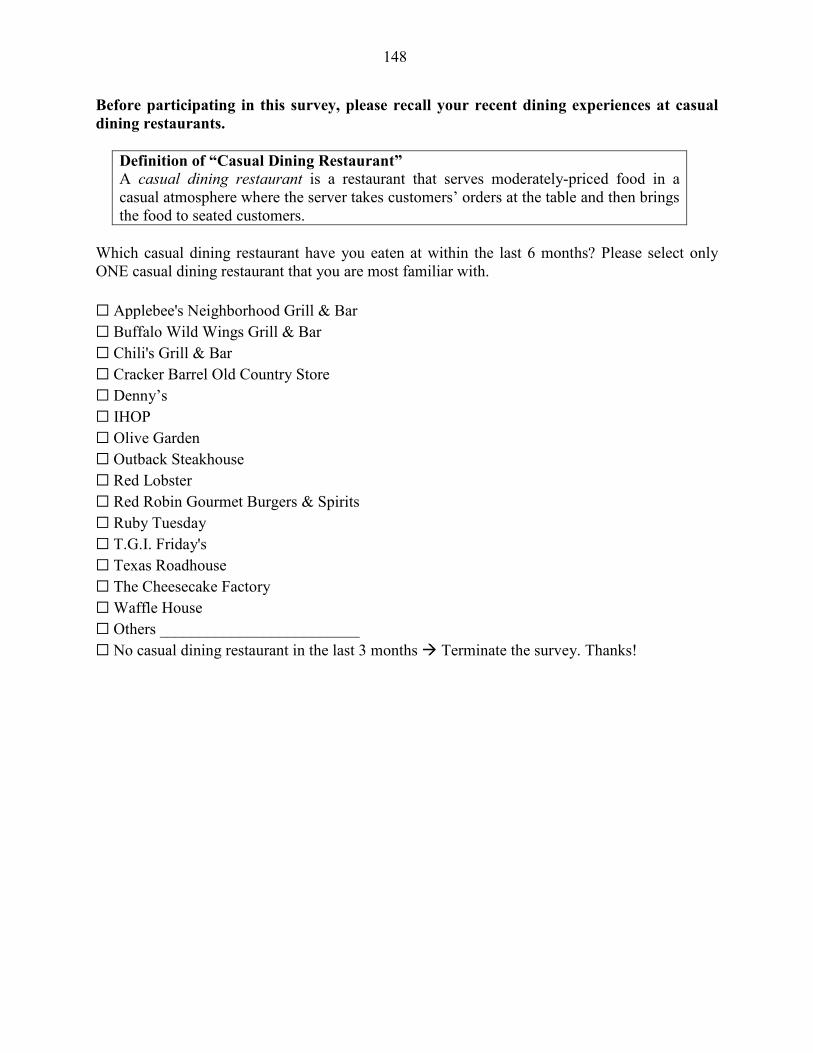
148
Before participating in this survey, please recall your recent dining experiences at casual
dining restaurants.
Definition of “Casual Dining Restaurant”
A casual dining restaurant is a restaurant that serves moderately-priced food in a casual atmosphere where the server takes customers’ orders at the table and then brings the food to seated customers.
Which casual dining restaurant have you eaten at within the last 6 months? Please select only ONE casual dining restaurant that you are most familiar with.
☐ Applebee's Neighborhood Grill & Bar
☐ Buffalo Wild Wings Grill & Bar
☐ Chili's Grill & Bar
☐ Cracker Barrel Old Country Store
☐ Denny’s
☐ IHOP
☐ Olive Garden
☐ Outback Steakhouse
☐ Red Lobster
☐ Red Robin Gourmet Burgers & Spirits
☐ Ruby Tuesday
☐ T.G.I. Friday's
☐ Texas Roadhouse
☐ The Cheesecake Factory
☐ Waffle House
☐ Others _________________________
☐ No casual dining restaurant in the last 3 months � Terminate the survey. Thanks!
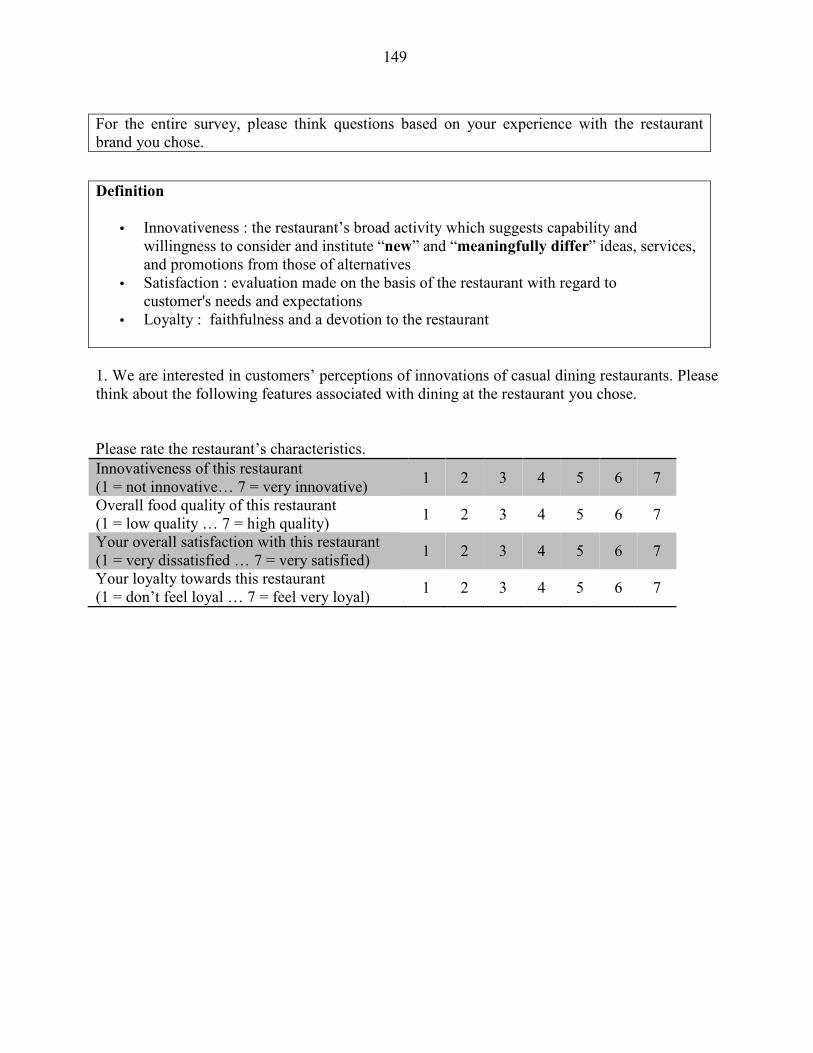
149
For the entire survey, please think questions based on your experience with the restaurant brand you chose.
1. We are interested in customers’ perceptions of innovations of casual dining restaurants. Please think about the following features associated with dining at the restaurant you chose.
Please rate the restaurant’s characteristics.
Innovativeness of this restaurant (1 = not innovative… 7 = very innovative)
1 2 3 4 5 6 7
Overall food quality of this restaurant (1 = low quality … 7 = high quality)
1 2 3 4 5 6 7
Your overall satisfaction with this restaurant (1 = very dissatisfied … 7 = very satisfied)
1 2 3 4 5 6 7
Your loyalty towards this restaurant (1 = don’t feel loyal … 7 = feel very loyal)
1 2 3 4 5 6 7
Definition
• Innovativeness : the restaurant’s broad activity which suggests capability and willingness to consider and institute “new” and “meaningfully differ” ideas, services, and promotions from those of alternatives
• Satisfaction : evaluation made on the basis of the restaurant with regard to customer's needs and expectations
• Loyalty : faithfulness and a devotion to the restaurant
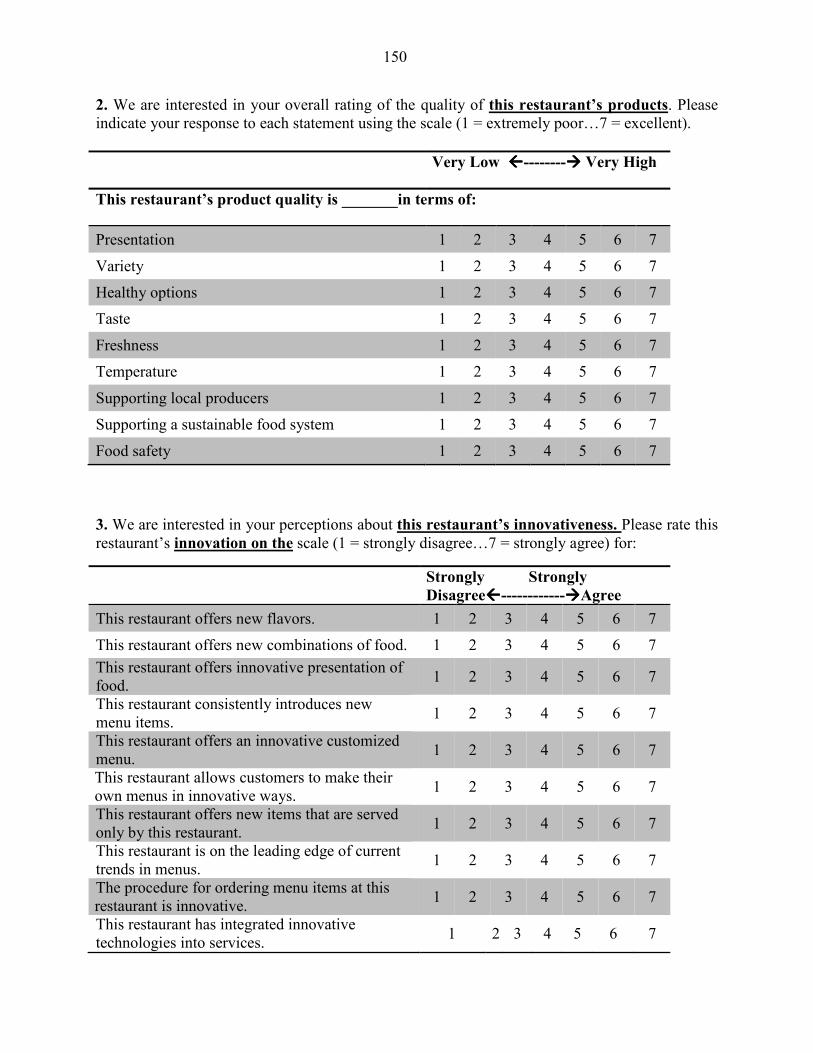
150
2. We are interested in your overall rating of the quality of this restaurant’s products. Please indicate your response to each statement using the scale (1 = extremely poor…7 = excellent).
Very Low --------���� Very High
This restaurant’s product quality is _______in terms of:
Presentation 1 2 3 4 5 6 7
Variety 1 2 3 4 5 6 7
Healthy options 1 2 3 4 5 6 7
Taste 1 2 3 4 5 6 7
Freshness 1 2 3 4 5 6 7
Temperature 1 2 3 4 5 6 7
Supporting local producers 1 2 3 4 5 6 7
Supporting a sustainable food system 1 2 3 4 5 6 7
Food safety 1 2 3 4 5 6 7
3. We are interested in your perceptions about this restaurant’s innovativeness. Please rate this restaurant’s innovation on the scale (1 = strongly disagree…7 = strongly agree) for:
Strongly Strongly
Disagree------------����Agree
This restaurant offers new flavors. 1 2 3 4 5 6 7
This restaurant offers new combinations of food. 1 2 3 4 5 6 7
This restaurant offers innovative presentation of food.
1 2 3 4 5 6 7
This restaurant consistently introduces new menu items.
1 2 3 4 5 6 7
This restaurant offers an innovative customized menu.
1 2 3 4 5 6 7
This restaurant allows customers to make their own menus in innovative ways.
1 2 3 4 5 6 7
This restaurant offers new items that are served only by this restaurant.
1 2 3 4 5 6 7
This restaurant is on the leading edge of current trends in menus.
1 2 3 4 5 6 7
The procedure for ordering menu items at this restaurant is innovative.
1 2 3 4 5 6 7
This restaurant has integrated innovative technologies into services.
1 2 3 4 5 6 7
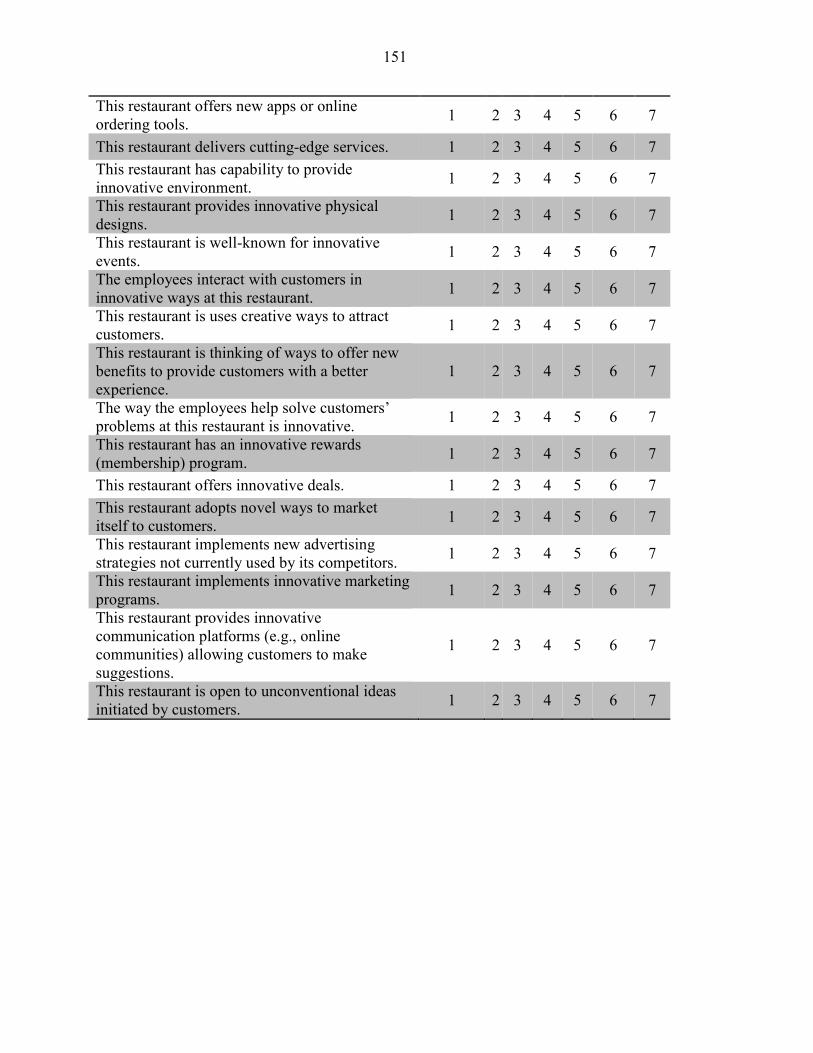
151
This restaurant offers new apps or online ordering tools.
1 2 3 4 5 6 7
This restaurant delivers cutting-edge services. 1 2 3 4 5 6 7
This restaurant has capability to provide innovative environment.
1 2 3 4 5 6 7
This restaurant provides innovative physical designs.
1 2 3 4 5 6 7
This restaurant is well-known for innovative events.
1 2 3 4 5 6 7
The employees interact with customers in innovative ways at this restaurant.
1 2 3 4 5 6 7
This restaurant is uses creative ways to attract customers.
1 2 3 4 5 6 7
This restaurant is thinking of ways to offer new benefits to provide customers with a better experience.
1 2 3 4 5 6 7
The way the employees help solve customers’ problems at this restaurant is innovative.
1 2 3 4 5 6 7
This restaurant has an innovative rewards (membership) program.
1 2 3 4 5 6 7
This restaurant offers innovative deals. 1 2 3 4 5 6 7
This restaurant adopts novel ways to market itself to customers.
1 2 3 4 5 6 7
This restaurant implements new advertising strategies not currently used by its competitors.
1 2 3 4 5 6 7
This restaurant implements innovative marketing programs.
1 2 3 4 5 6 7
This restaurant provides innovative communication platforms (e.g., online communities) allowing customers to make suggestions.
1 2 3 4 5 6 7
This restaurant is open to unconventional ideas initiated by customers.
1 2 3 4 5 6 7
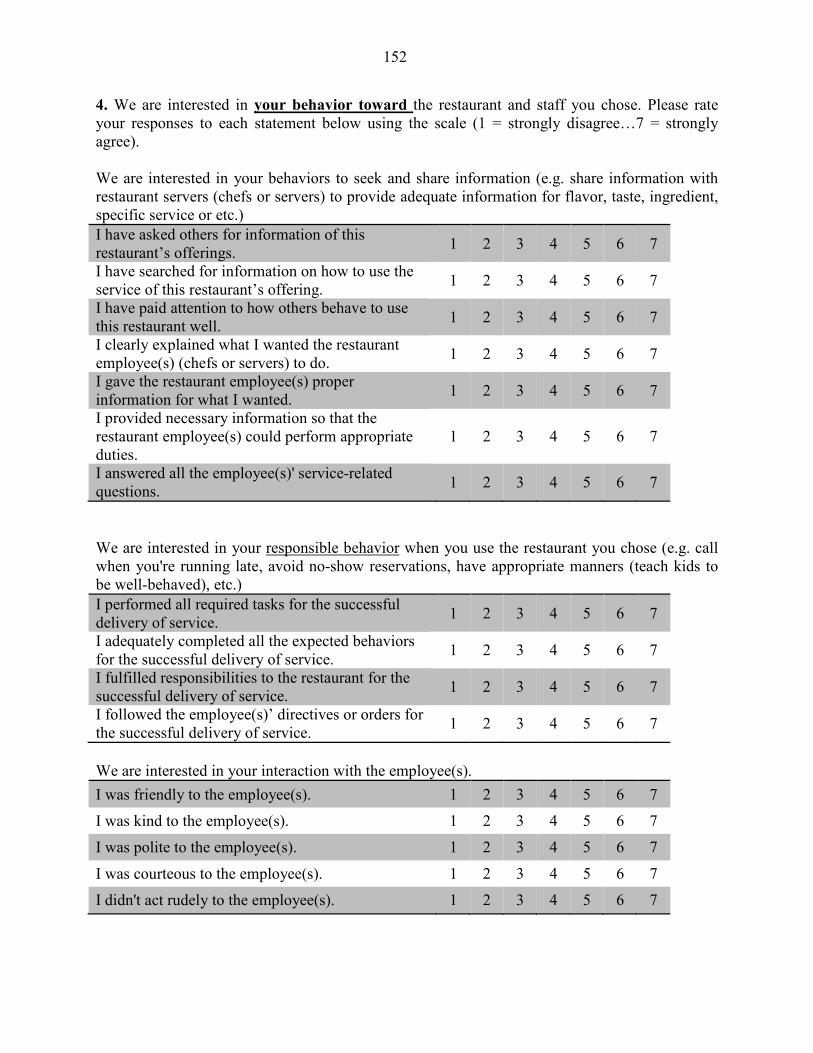
152
4. We are interested in your behavior toward the restaurant and staff you chose. Please rate your responses to each statement below using the scale (1 = strongly disagree…7 = strongly agree). We are interested in your behaviors to seek and share information (e.g. share information with restaurant servers (chefs or servers) to provide adequate information for flavor, taste, ingredient, specific service or etc.)
I have asked others for information of this restaurant’s offerings.
1 2 3 4 5 6 7
I have searched for information on how to use the service of this restaurant’s offering.
1 2 3 4 5 6 7
I have paid attention to how others behave to use this restaurant well.
1 2 3 4 5 6 7
I clearly explained what I wanted the restaurant employee(s) (chefs or servers) to do.
1 2 3 4 5 6 7
I gave the restaurant employee(s) proper information for what I wanted.
1 2 3 4 5 6 7
I provided necessary information so that the restaurant employee(s) could perform appropriate duties.
1 2 3 4 5 6 7
I answered all the employee(s)' service-related questions.
1 2 3 4 5 6 7
We are interested in your responsible behavior when you use the restaurant you chose (e.g. call when you're running late, avoid no-show reservations, have appropriate manners (teach kids to be well-behaved), etc.)
I performed all required tasks for the successful delivery of service.
1 2 3 4 5 6 7
I adequately completed all the expected behaviors for the successful delivery of service.
1 2 3 4 5 6 7
I fulfilled responsibilities to the restaurant for the successful delivery of service.
1 2 3 4 5 6 7
I followed the employee(s)’ directives or orders for the successful delivery of service.
1 2 3 4 5 6 7
We are interested in your interaction with the employee(s).
I was friendly to the employee(s). 1 2 3 4 5 6 7
I was kind to the employee(s). 1 2 3 4 5 6 7
I was polite to the employee(s). 1 2 3 4 5 6 7
I was courteous to the employee(s). 1 2 3 4 5 6 7
I didn't act rudely to the employee(s). 1 2 3 4 5 6 7
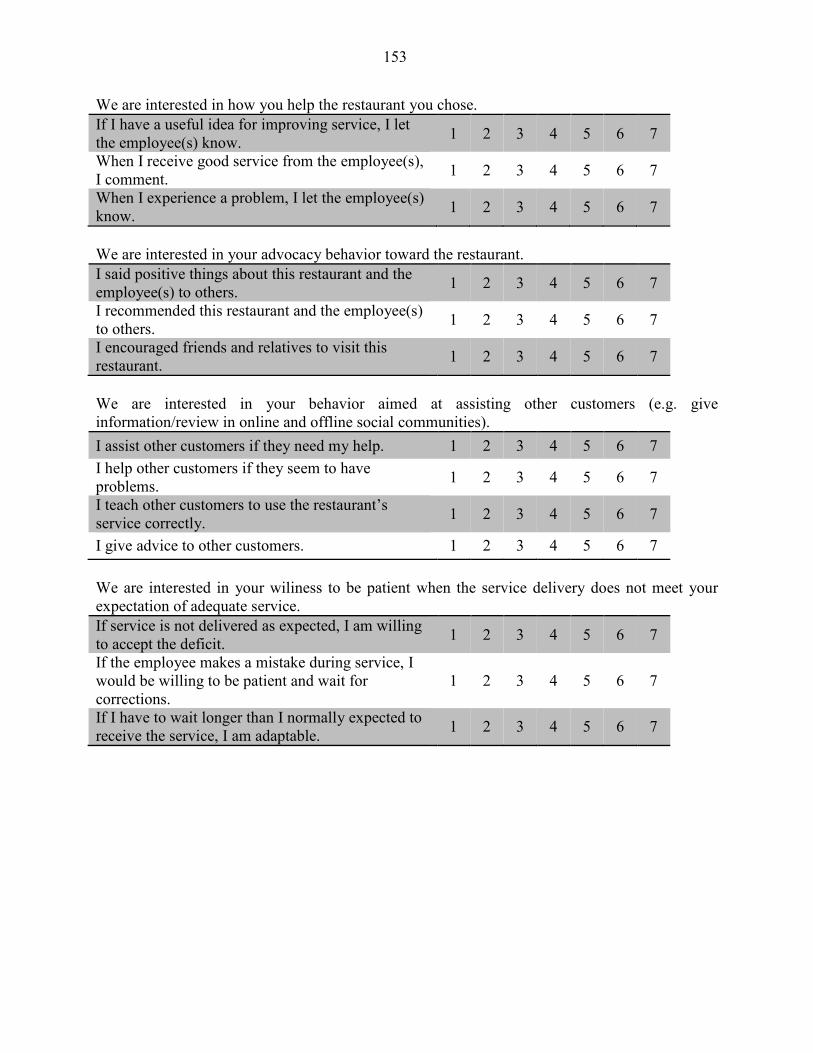
153
We are interested in how you help the restaurant you chose.
If I have a useful idea for improving service, I let the employee(s) know.
1 2 3 4 5 6 7
When I receive good service from the employee(s), I comment.
1 2 3 4 5 6 7
When I experience a problem, I let the employee(s) know.
1 2 3 4 5 6 7
We are interested in your advocacy behavior toward the restaurant.
I said positive things about this restaurant and the employee(s) to others.
1 2 3 4 5 6 7
I recommended this restaurant and the employee(s) to others.
1 2 3 4 5 6 7
I encouraged friends and relatives to visit this restaurant.
1 2 3 4 5 6 7
We are interested in your behavior aimed at assisting other customers (e.g. give information/review in online and offline social communities).
I assist other customers if they need my help. 1 2 3 4 5 6 7
I help other customers if they seem to have problems.
1 2 3 4 5 6 7
I teach other customers to use the restaurant’s service correctly.
1 2 3 4 5 6 7
I give advice to other customers. 1 2 3 4 5 6 7
We are interested in your wiliness to be patient when the service delivery does not meet your expectation of adequate service.
If service is not delivered as expected, I am willing to accept the deficit.
1 2 3 4 5 6 7
If the employee makes a mistake during service, I would be willing to be patient and wait for corrections.
1 2 3 4 5 6 7
If I have to wait longer than I normally expected to receive the service, I am adaptable.
1 2 3 4 5 6 7
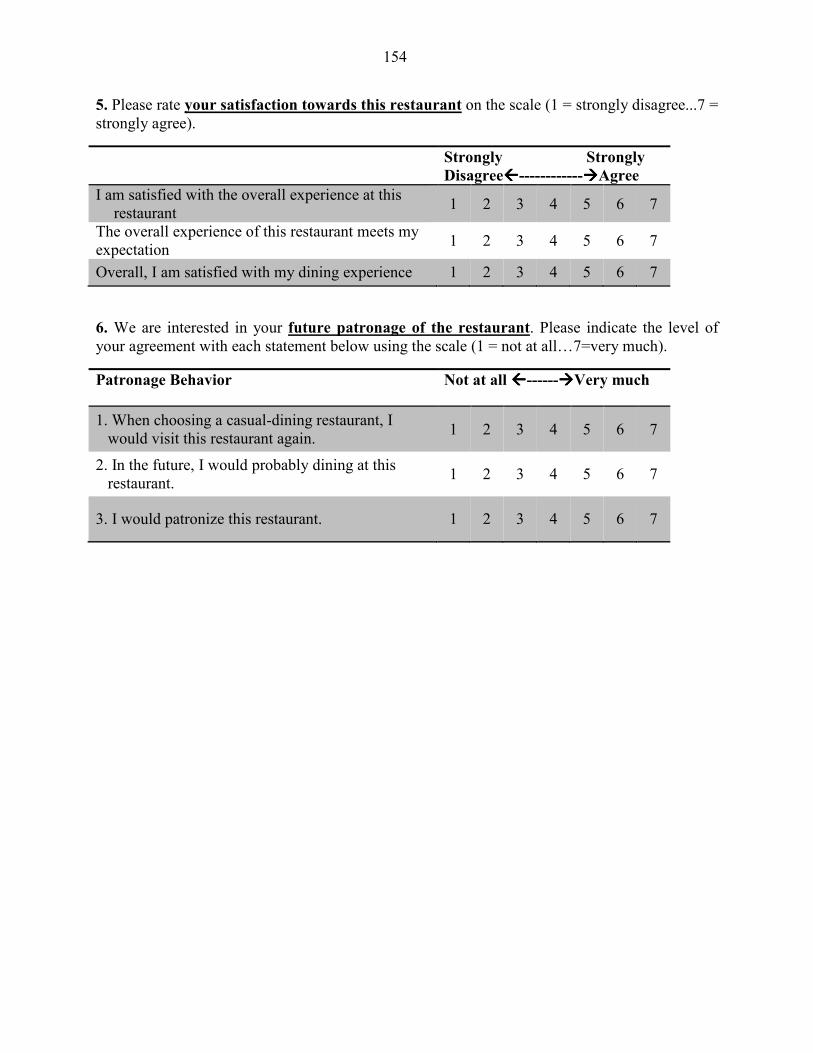
154
5. Please rate your satisfaction towards this restaurant on the scale (1 = strongly disagree...7 = strongly agree).
Strongly Strongly
Disagree------------����Agree
I am satisfied with the overall experience at this restaurant
1 2 3 4 5 6 7
The overall experience of this restaurant meets my expectation
1 2 3 4 5 6 7
Overall, I am satisfied with my dining experience 1 2 3 4 5 6 7
6. We are interested in your future patronage of the restaurant. Please indicate the level of your agreement with each statement below using the scale (1 = not at all…7=very much).
Patronage Behavior Not at all ------����Very much
1. When choosing a casual-dining restaurant, I would visit this restaurant again.
1 2 3 4 5 6 7
2. In the future, I would probably dining at this restaurant.
1 2 3 4 5 6 7
3. I would patronize this restaurant. 1 2 3 4 5 6 7
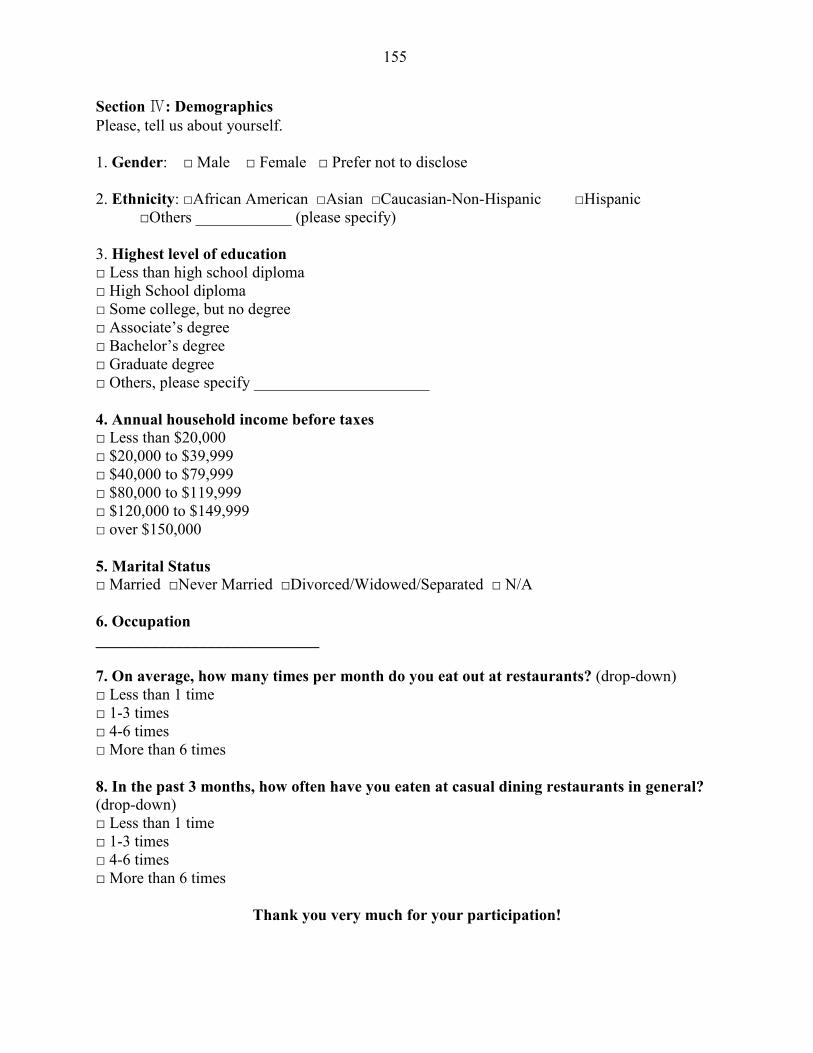
155
Section Ⅳ: Demographics
Please, tell us about yourself. 1. Gender: □ Male □ Female □ Prefer not to disclose 2. Ethnicity: □African American □Asian □Caucasian-Non-Hispanic □Hispanic □Others ____________ (please specify) 3. Highest level of education □ Less than high school diploma □ High School diploma □ Some college, but no degree □ Associate’s degree □ Bachelor’s degree □ Graduate degree □ Others, please specify ______________________
4. Annual household income before taxes
□ Less than $20,000 □ $20,000 to $39,999 □ $40,000 to $79,999 □ $80,000 to $119,999 □ $120,000 to $149,999 □ over $150,000
5. Marital Status
□ Married □Never Married □Divorced/Widowed/Separated □ N/A
6. Occupation
____________________________
7. On average, how many times per month do you eat out at restaurants? (drop-down) □ Less than 1 time □ 1-3 times □ 4-6 times □ More than 6 times
8. In the past 3 months, how often have you eaten at casual dining restaurants in general? (drop-down) □ Less than 1 time □ 1-3 times □ 4-6 times □ More than 6 times
Thank you very much for your participation!
156
APPENDIX C
COVER LETTER AND QUESTIONNAIRE FOR STUDY 3
Survey on Restaurant Innovativeness in the Casual Dining Restaurant Industry
Dear Participants:
Purpose of the study
You are invited to participate in a research study by completing this short survey. This study aims to examine customers’ perceptions of restaurant innovativeness.
Participant rights
You can participate in this research if you are 18 years or older. The survey will take about 10 minutes to complete. There are no foreseeable risks of participating in this study. Your participation is voluntary.
Confidentiality
All the information gathered in this study will be kept confidential. No reference will be made in written or oral materials that could link you to this study. Your survey responses will be anonymous, confidential and will NOT be linked to your name and email if you decide to participate in the drawing.
Contact Information
If you need further information or have concerns regarding this study, please contact Eojina Kim at [email protected] or Dr. Liang (Rebecca) Tang at [email protected] / Dr. Robert Bosselman at [email protected]. This study was approved by the Institutional Review Board at Iowa State University (IRB ID 16-024). If you have any questions about the rights of research subjects, please contact the IRB Administrator, (515) 294-4566, [email protected], or Director, (515) 294-3115, Office of Research Assurances, 1138 Pearson Hall, Iowa State University, Ames, Iowa 50011. Your efforts in participating in this research project are deeply appreciated. Are you living in the United States? □Yes □No (Terminate the survey) Are you over 18 years old? □Yes □No (Terminate the survey)
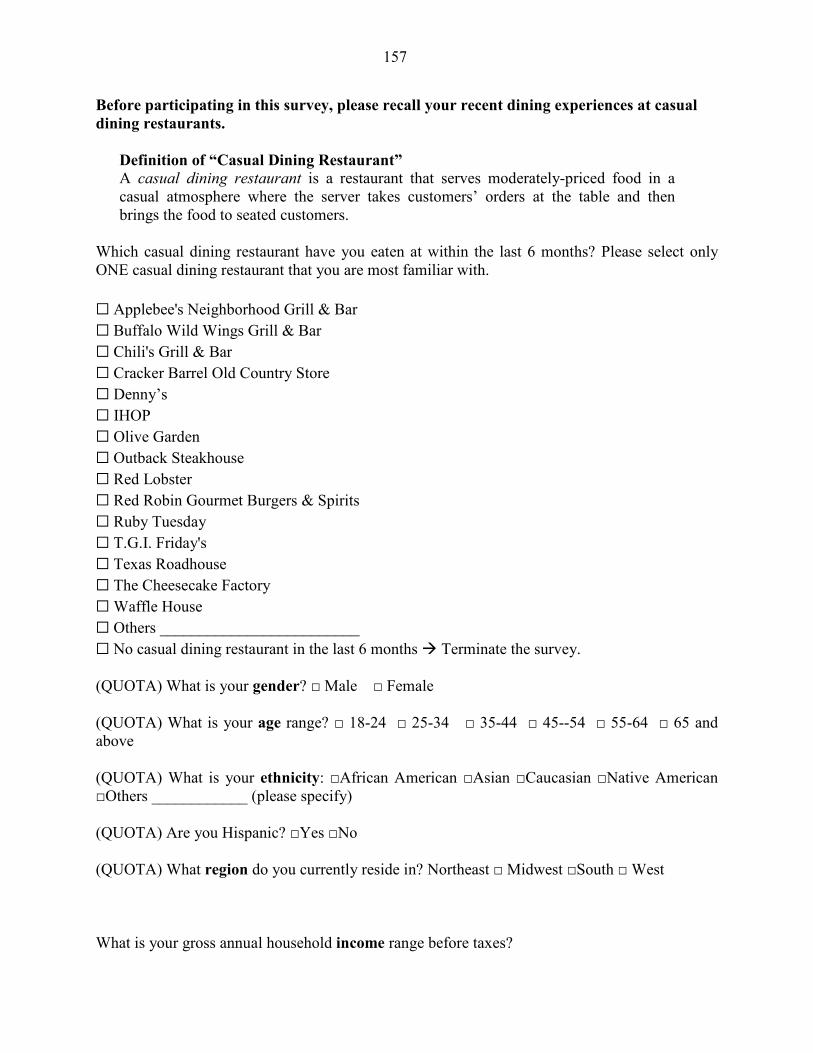
157
Before participating in this survey, please recall your recent dining experiences at casual
dining restaurants.
Definition of “Casual Dining Restaurant”
A casual dining restaurant is a restaurant that serves moderately-priced food in a casual atmosphere where the server takes customers’ orders at the table and then brings the food to seated customers.
Which casual dining restaurant have you eaten at within the last 6 months? Please select only ONE casual dining restaurant that you are most familiar with.
☐ Applebee's Neighborhood Grill & Bar
☐ Buffalo Wild Wings Grill & Bar
☐ Chili's Grill & Bar
☐ Cracker Barrel Old Country Store
☐ Denny’s
☐ IHOP
☐ Olive Garden
☐ Outback Steakhouse
☐ Red Lobster
☐ Red Robin Gourmet Burgers & Spirits
☐ Ruby Tuesday
☐ T.G.I. Friday's
☐ Texas Roadhouse
☐ The Cheesecake Factory
☐ Waffle House
☐ Others _________________________
☐ No casual dining restaurant in the last 6 months � Terminate the survey. (QUOTA) What is your gender? □ Male □ Female (QUOTA) What is your age range? □ 18-24 □ 25-34 □ 35-44 □ 45--54 □ 55-64 □ 65 and above (QUOTA) What is your ethnicity: □African American □Asian □Caucasian □Native American □Others ____________ (please specify) (QUOTA) Are you Hispanic? □Yes □No (QUOTA) What region do you currently reside in? Northeast □ Midwest □South □ West What is your gross annual household income range before taxes?
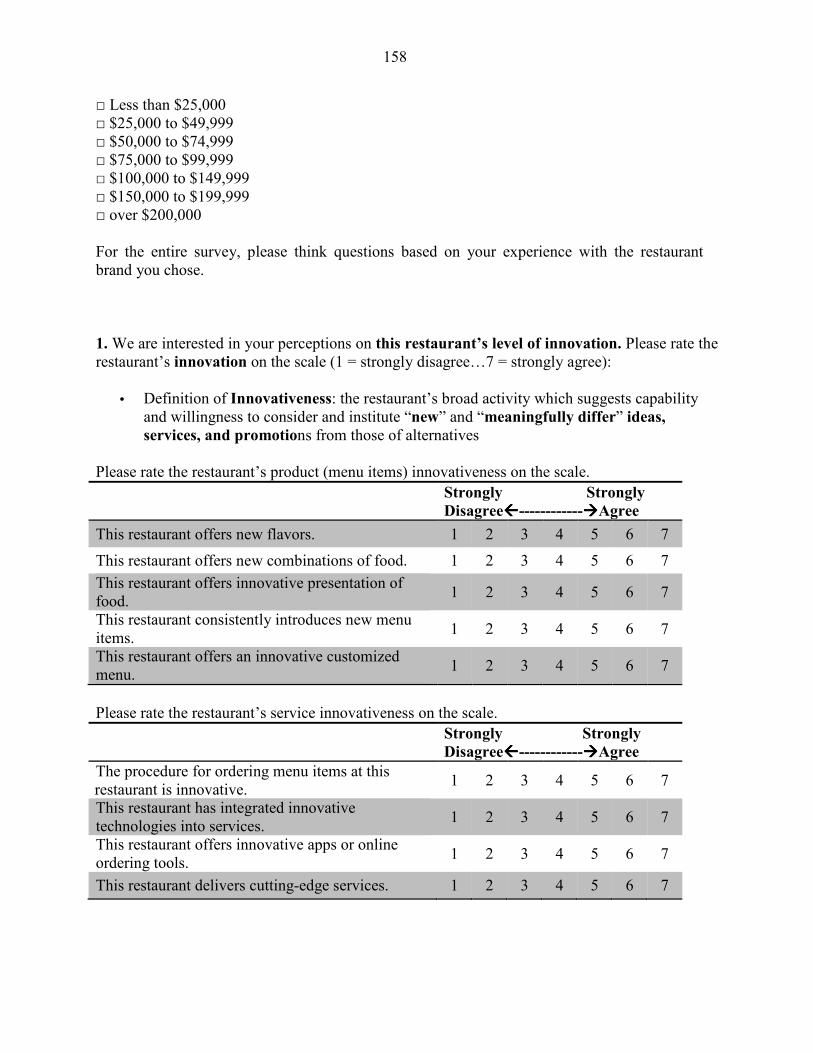
158
□ Less than $25,000 □ $25,000 to $49,999 □ $50,000 to $74,999 □ $75,000 to $99,999 □ $100,000 to $149,999 □ $150,000 to $199,999 □ over $200,000 For the entire survey, please think questions based on your experience with the restaurant brand you chose.
1. We are interested in your perceptions on this restaurant’s level of innovation. Please rate the restaurant’s innovation on the scale (1 = strongly disagree…7 = strongly agree):
• Definition of Innovativeness: the restaurant’s broad activity which suggests capability and willingness to consider and institute “new” and “meaningfully differ” ideas,
services, and promotions from those of alternatives
Please rate the restaurant’s product (menu items) innovativeness on the scale.
Strongly Strongly
Disagree------------����Agree
This restaurant offers new flavors. 1 2 3 4 5 6 7
This restaurant offers new combinations of food. 1 2 3 4 5 6 7
This restaurant offers innovative presentation of food.
1 2 3 4 5 6 7
This restaurant consistently introduces new menu items.
1 2 3 4 5 6 7
This restaurant offers an innovative customized menu.
1 2 3 4 5 6 7
Please rate the restaurant’s service innovativeness on the scale.
Strongly Strongly
Disagree------------����Agree
The procedure for ordering menu items at this restaurant is innovative.
1 2 3 4 5 6 7
This restaurant has integrated innovative technologies into services.
1 2 3 4 5 6 7
This restaurant offers innovative apps or online ordering tools.
1 2 3 4 5 6 7
This restaurant delivers cutting-edge services. 1 2 3 4 5 6 7
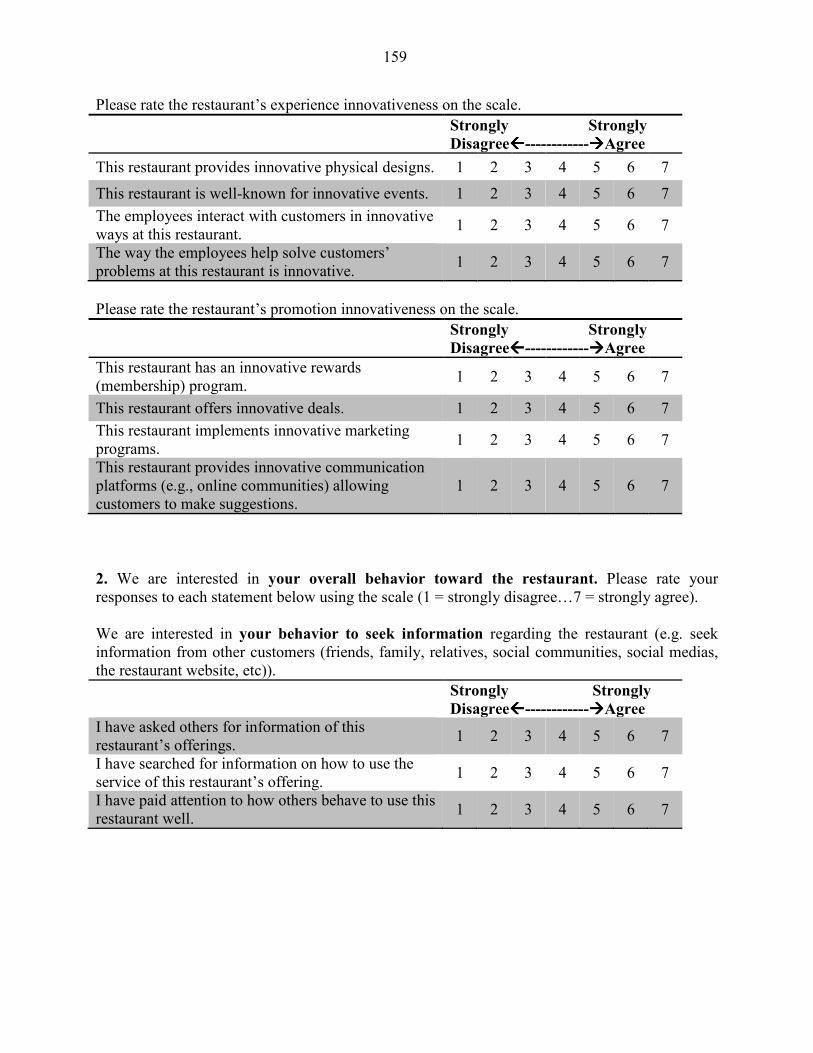
159
Please rate the restaurant’s experience innovativeness on the scale.
Strongly Strongly
Disagree------------����Agree
This restaurant provides innovative physical designs. 1 2 3 4 5 6 7
This restaurant is well-known for innovative events. 1 2 3 4 5 6 7
The employees interact with customers in innovative ways at this restaurant.
1 2 3 4 5 6 7
The way the employees help solve customers’ problems at this restaurant is innovative.
1 2 3 4 5 6 7
Please rate the restaurant’s promotion innovativeness on the scale.
Strongly Strongly
Disagree------------����Agree
This restaurant has an innovative rewards (membership) program.
1 2 3 4 5 6 7
This restaurant offers innovative deals. 1 2 3 4 5 6 7
This restaurant implements innovative marketing programs.
1 2 3 4 5 6 7
This restaurant provides innovative communication platforms (e.g., online communities) allowing customers to make suggestions.
1 2 3 4 5 6 7
2. We are interested in your overall behavior toward the restaurant. Please rate your responses to each statement below using the scale (1 = strongly disagree…7 = strongly agree). We are interested in your behavior to seek information regarding the restaurant (e.g. seek information from other customers (friends, family, relatives, social communities, social medias, the restaurant website, etc)).
Strongly Strongly
Disagree------------����Agree I have asked others for information of this restaurant’s offerings.
1 2 3 4 5 6 7
I have searched for information on how to use the service of this restaurant’s offering.
1 2 3 4 5 6 7
I have paid attention to how others behave to use this restaurant well.
1 2 3 4 5 6 7
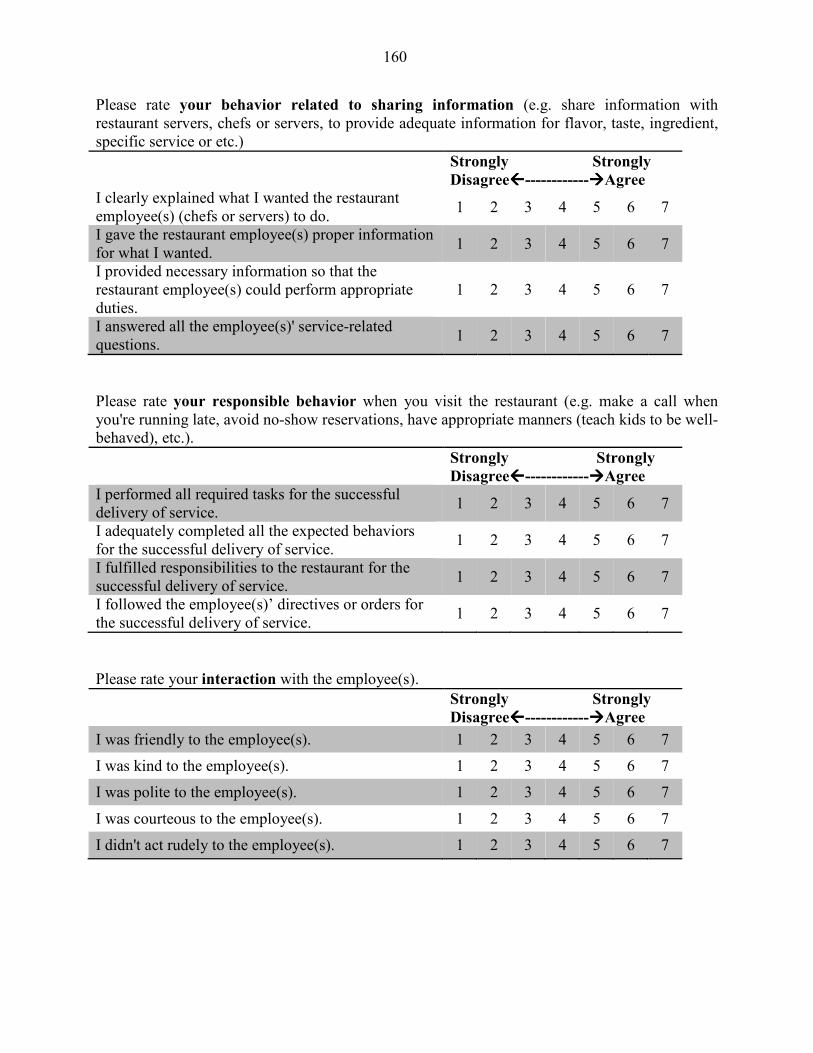
160
Please rate your behavior related to sharing information (e.g. share information with restaurant servers, chefs or servers, to provide adequate information for flavor, taste, ingredient, specific service or etc.)
Strongly Strongly
Disagree------------����Agree I clearly explained what I wanted the restaurant employee(s) (chefs or servers) to do.
1 2 3 4 5 6 7
I gave the restaurant employee(s) proper information for what I wanted.
1 2 3 4 5 6 7
I provided necessary information so that the restaurant employee(s) could perform appropriate duties.
1 2 3 4 5 6 7
I answered all the employee(s)' service-related questions.
1 2 3 4 5 6 7
Please rate your responsible behavior when you visit the restaurant (e.g. make a call when you're running late, avoid no-show reservations, have appropriate manners (teach kids to be well-behaved), etc.).
Strongly Strongly
Disagree------------����Agree I performed all required tasks for the successful delivery of service.
1 2 3 4 5 6 7
I adequately completed all the expected behaviors for the successful delivery of service.
1 2 3 4 5 6 7
I fulfilled responsibilities to the restaurant for the successful delivery of service.
1 2 3 4 5 6 7
I followed the employee(s)’ directives or orders for the successful delivery of service.
1 2 3 4 5 6 7
Please rate your interaction with the employee(s).
Strongly Strongly
Disagree------------����Agree
I was friendly to the employee(s). 1 2 3 4 5 6 7
I was kind to the employee(s). 1 2 3 4 5 6 7
I was polite to the employee(s). 1 2 3 4 5 6 7
I was courteous to the employee(s). 1 2 3 4 5 6 7
I didn't act rudely to the employee(s). 1 2 3 4 5 6 7
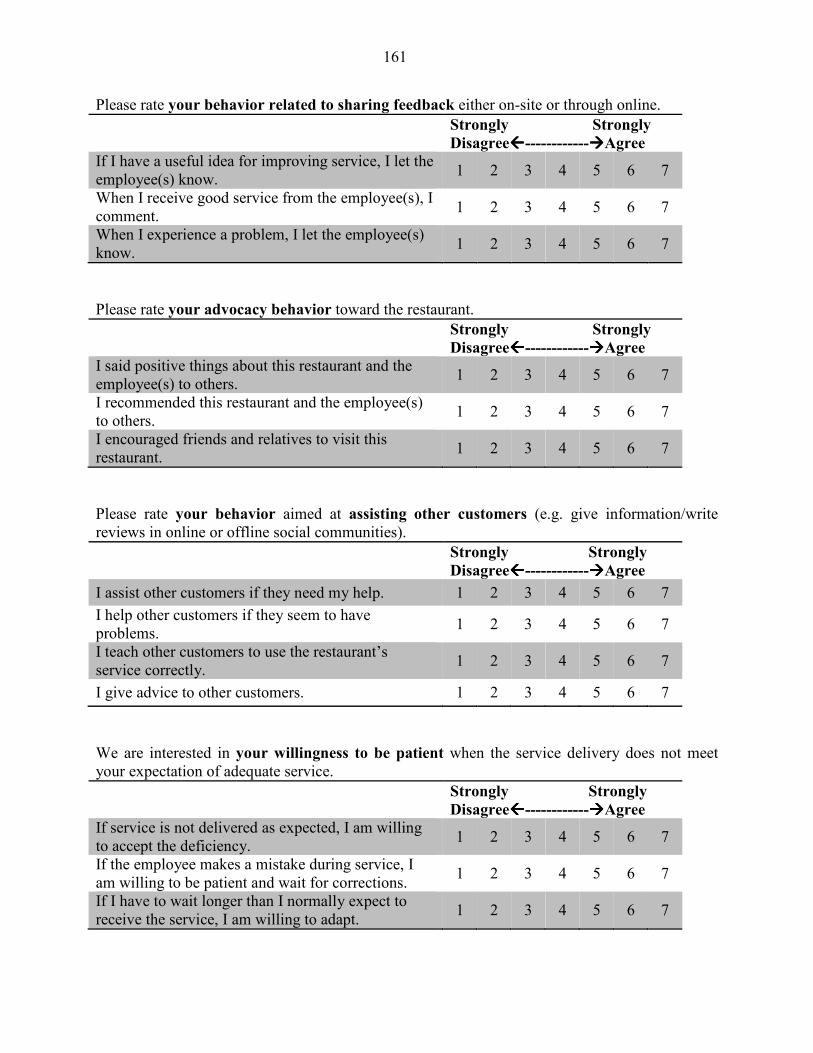
161
Please rate your behavior related to sharing feedback either on-site or through online.
Strongly Strongly
Disagree------------����Agree If I have a useful idea for improving service, I let the employee(s) know.
1 2 3 4 5 6 7
When I receive good service from the employee(s), I comment.
1 2 3 4 5 6 7
When I experience a problem, I let the employee(s) know.
1 2 3 4 5 6 7
Please rate your advocacy behavior toward the restaurant.
Strongly Strongly
Disagree------------����Agree I said positive things about this restaurant and the employee(s) to others.
1 2 3 4 5 6 7
I recommended this restaurant and the employee(s) to others.
1 2 3 4 5 6 7
I encouraged friends and relatives to visit this restaurant.
1 2 3 4 5 6 7
Please rate your behavior aimed at assisting other customers (e.g. give information/write reviews in online or offline social communities).
Strongly Strongly
Disagree------------����Agree
I assist other customers if they need my help. 1 2 3 4 5 6 7
I help other customers if they seem to have problems.
1 2 3 4 5 6 7
I teach other customers to use the restaurant’s service correctly.
1 2 3 4 5 6 7
I give advice to other customers. 1 2 3 4 5 6 7
We are interested in your willingness to be patient when the service delivery does not meet your expectation of adequate service.
Strongly Strongly
Disagree------------����Agree If service is not delivered as expected, I am willing to accept the deficiency.
1 2 3 4 5 6 7
If the employee makes a mistake during service, I am willing to be patient and wait for corrections.
1 2 3 4 5 6 7
If I have to wait longer than I normally expect to receive the service, I am willing to adapt.
1 2 3 4 5 6 7
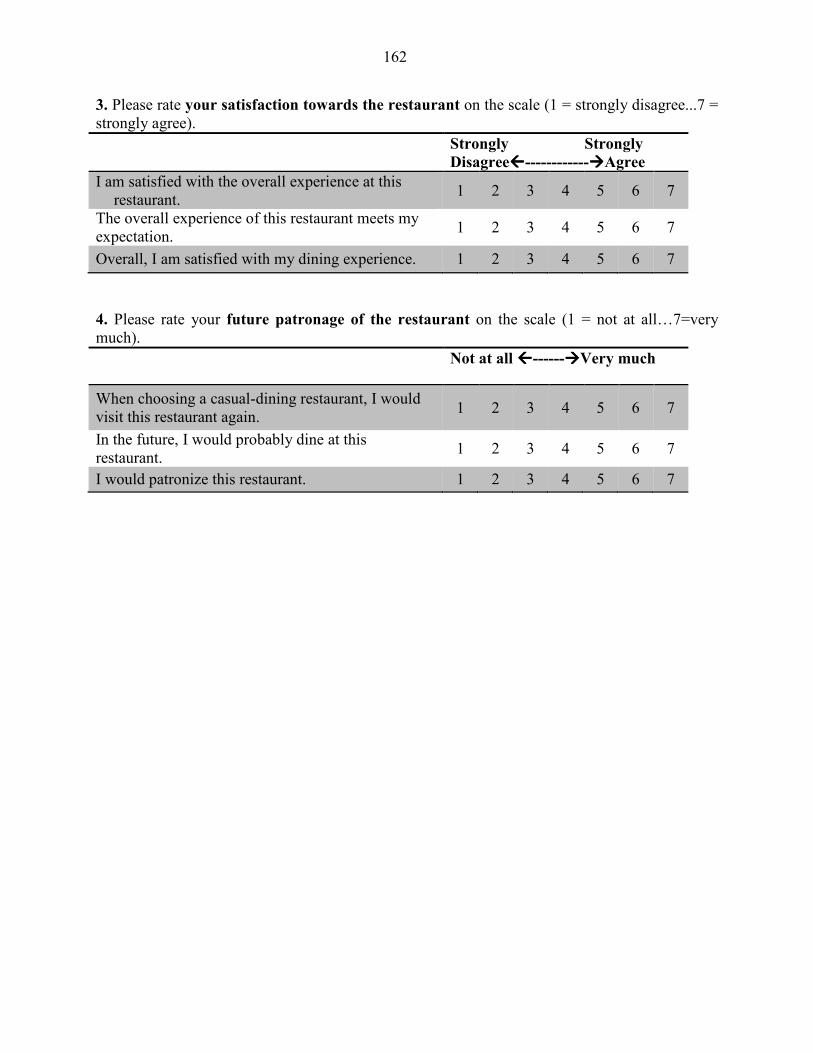
162
3. Please rate your satisfaction towards the restaurant on the scale (1 = strongly disagree...7 = strongly agree).
Strongly Strongly
Disagree------------����Agree
I am satisfied with the overall experience at this restaurant.
1 2 3 4 5 6 7
The overall experience of this restaurant meets my expectation.
1 2 3 4 5 6 7
Overall, I am satisfied with my dining experience. 1 2 3 4 5 6 7
4. Please rate your future patronage of the restaurant on the scale (1 = not at all…7=very much).
Not at all ------����Very much
When choosing a casual-dining restaurant, I would visit this restaurant again.
1 2 3 4 5 6 7
In the future, I would probably dine at this restaurant.
1 2 3 4 5 6 7
I would patronize this restaurant. 1 2 3 4 5 6 7
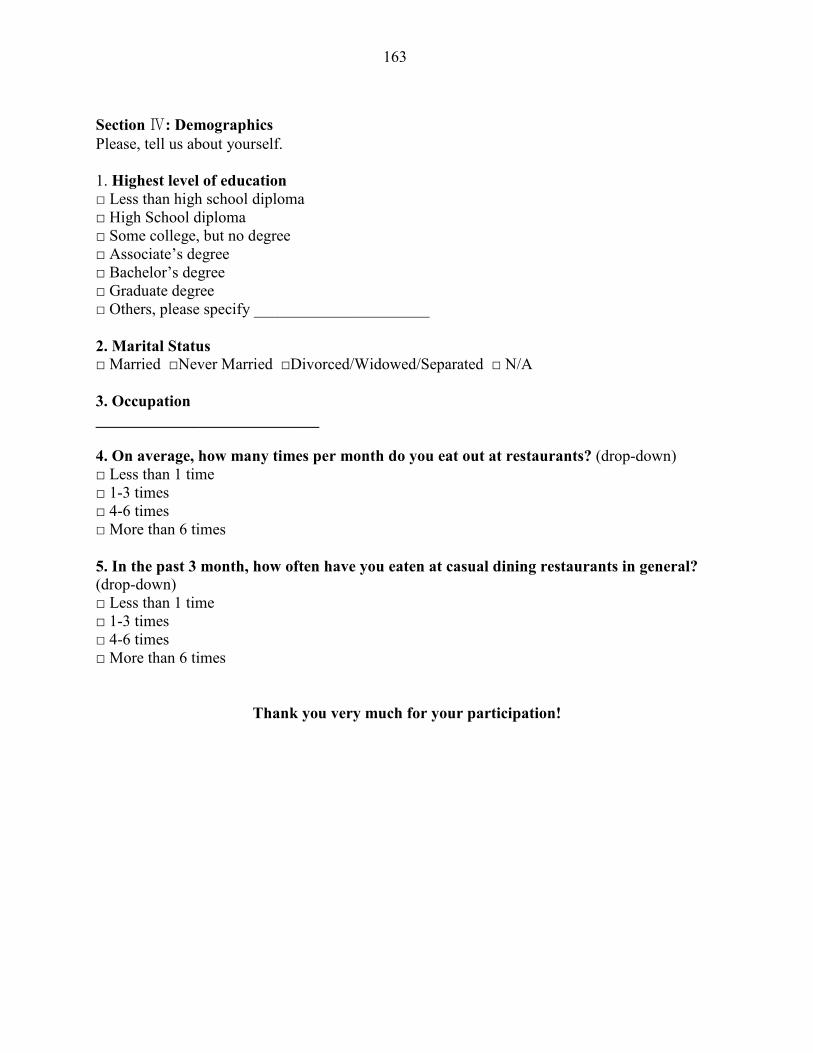
163
Section Ⅳ: Demographics
Please, tell us about yourself. 1. Highest level of education □ Less than high school diploma □ High School diploma □ Some college, but no degree □ Associate’s degree □ Bachelor’s degree □ Graduate degree □ Others, please specify ______________________
2. Marital Status
□ Married □Never Married □Divorced/Widowed/Separated □ N/A
3. Occupation
____________________________
4. On average, how many times per month do you eat out at restaurants? (drop-down) □ Less than 1 time □ 1-3 times □ 4-6 times □ More than 6 times
5. In the past 3 month, how often have you eaten at casual dining restaurants in general? (drop-down) □ Less than 1 time □ 1-3 times □ 4-6 times □ More than 6 times
Thank you very much for your participation!