Embed Size (px)
Citation preview

Understanding Business Process Models:The Costs and Benefits of Structuredness
Marlon Dumas1, Marcello La Rosa2,3, Jan Mendling4, Raul Maesalu1,Hajo A. Reijers5, and Nataliia Semenenko1
1 University of Tartu, Estonia{marlon.dumas, maekas, nataliia}@ut.ee
2 Queensland University of Technology, [email protected]
3 NICTA Queensland Research Lab, Australia4 Vienna University of Business and Economics, Austria
[email protected] Eindhoven University of Technology, The Netherlands
Abstract. Previous research has put forward various metrics of businessprocess models that are correlated with understandability. Two such met-rics are size and degree of (block-)structuredness. What has not been suf-ficiently appreciated at this point is that these desirable properties maybe at odds with one another. This paper presents the results of a two-pronged study aimed at exploring the trade-off between size and struc-turedness of process models. The first prong of the study is a comparativeanalysis of the complexity of a set of unstructured process models fromindustrial practice and of their corresponding structured versions. Thesecond prong is an experiment wherein a cohort of students was exposedto semantically equivalent unstructured and structured process models.The key finding is that structuredness is not an absolute desideratumvis-a-vis for process model understandability. Instead, subtle trade-offsbetween structuredness and other model properties are at play.
1 Introduction
In many contexts where information systems are developed and used, conceptualmodels are employed to inform stakeholders on the business processes supportedby such systems. Sometimes, hundreds or thousands of process models are cre-ated and maintained in order to document large information systems. Given thatsuch model collections are consulted, validated and updated by a wide range ofstakeholders with various levels of expertise, ensuring the understandability ofprocess models is a key concern in such settings.
In this respect, a central guideline for business process modeling is to usestructured building blocks as much as possible [19]. This insight has triggereda stream of research on transforming unstructured process models into struc-tured ones. The approach in [25] provides a formal foundation for determining

2 M. Dumas et al.
when and how such a transformation is possible. However, it turns out thatin some cases structuredness can only be achieved at the expense of increasedsize. Specifically, there are situations where nodes must be duplicated in orderto transform an unstructured model into a structured one. Importantly, thisnode duplication is not a limitation of the technique proposed in [25], but anunavoidable constraint that has been studied in the field of compiler theory [23].
While both structuredness and conciseness are recognized as basic designprinciples for process models [19], to the best of our knowledge the tradeoff be-tween these two principles has not been studied so far. In this context, this pa-per examines whether or not the benefits of structuring an unstructured processmodel outweigh the costs of duplication from the perspective of understandabil-ity. Specifically, the following research question is addressed:
If an unstructured process model U is transformed into a structured oneS, is S more understandable than U?
To tackle this question, we adopt a two-pronged approach. First, by usinga collection of industrial process models, we compare the relative complexityof unstructured process models and of their corresponding structured versions.This study is based on a collection of complexity metrics that have been shownto be negatively correlated with understandability [19], that is, higher complex-ity is associated with lower understandability. The results of this comparativecomplexity study are inconclusive with respect to the hypothesis. In this sense,they confirm the existence of a tradeoff between structured and unstructuredprocess models. Second, we conducted an experiment with structured and un-structured models as a treatment, and measured the understanding performanceof a cohort of process modeling students. The results show that in some casesit is preferable to leave a process model unstructured from the perspective ofunderstandability.
The paper is structured as follows. Section 2 introduces background notions,including that of structuredness and some complexity metrics, and motivates ourwork against the state of the art. Section 3 presents the comparative complexitystudy, which is followed by the design of the conducted experiment (Section 4)and its results (Section 5). Section 6 concludes the paper.
2 Background
This section provides the background knowledge for understanding the rest ofthis paper. It introduces the notions of structuredness, complexity metrics andunderstandability of process models. It also summarizes previous research onstructuring process models and empirical studies on the importance of struc-turedness for model understanding and correctness.
2.1 The Notion of Structuredness
Although process models captured in graph-oriented languages such as BPMNor EPCs may have almost any topology, it is often preferable that they adhere to
3
a2UBL
EDI 856(ASN)
EDI 810(Invoice)
handle
despatch-advice
handle invoice
EDIsend
payment request
send fulfillment-notice
a1
a4
a3
a5
a6
update accounts
database
a7
(a) unstructured version
a2UBL
EDI 856(ASN)
EDI 810(Invoice)
handle
despatch-advice
handle invoice
EDI
send
payment request
send fulfillment-notice
a1
a4
a3
a5
a6
update accounts
database
a7
send
payment request
a5
’
Start/End event Parallel split/join Exclusive split/joinTask
(b) structured version
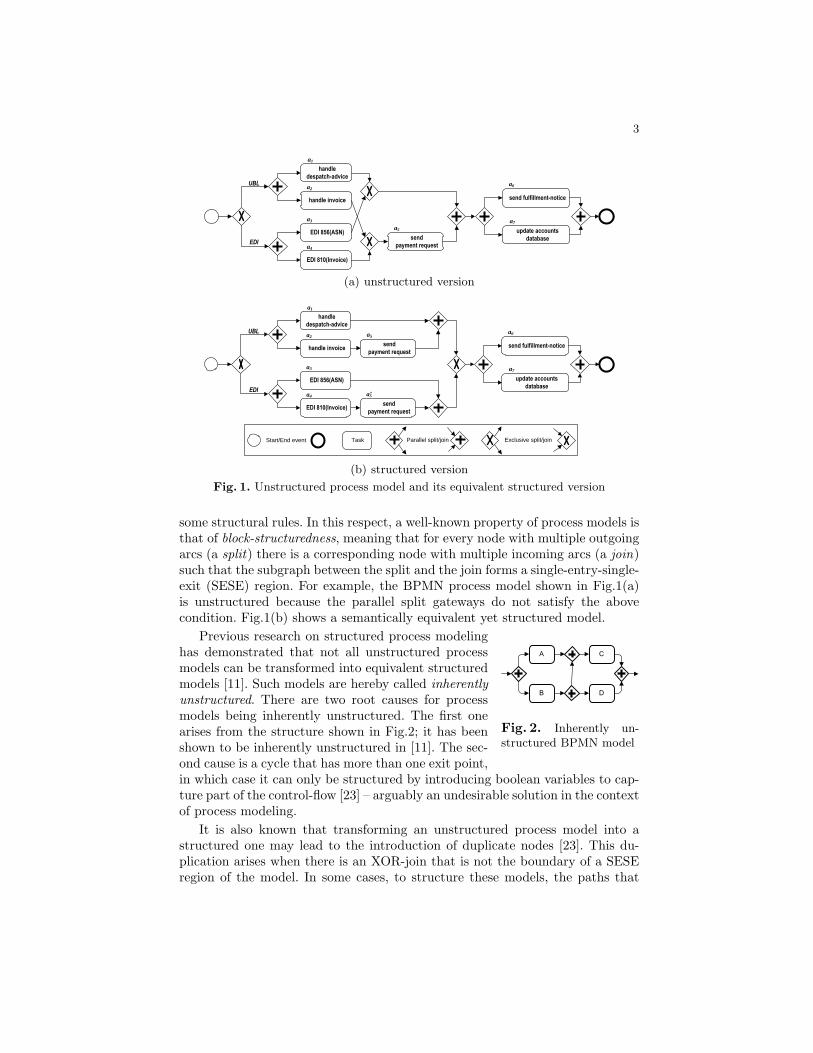
Fig. 1. Unstructured process model and its equivalent structured version
some structural rules. In this respect, a well-known property of process models isthat of block-structuredness, meaning that for every node with multiple outgoingarcs (a split) there is a corresponding node with multiple incoming arcs (a join)such that the subgraph between the split and the join forms a single-entry-single-exit (SESE) region. For example, the BPMN process model shown in Fig.1(a)is unstructured because the parallel split gateways do not satisfy the abovecondition. Fig.1(b) shows a semantically equivalent yet structured model.
A
B
C
D
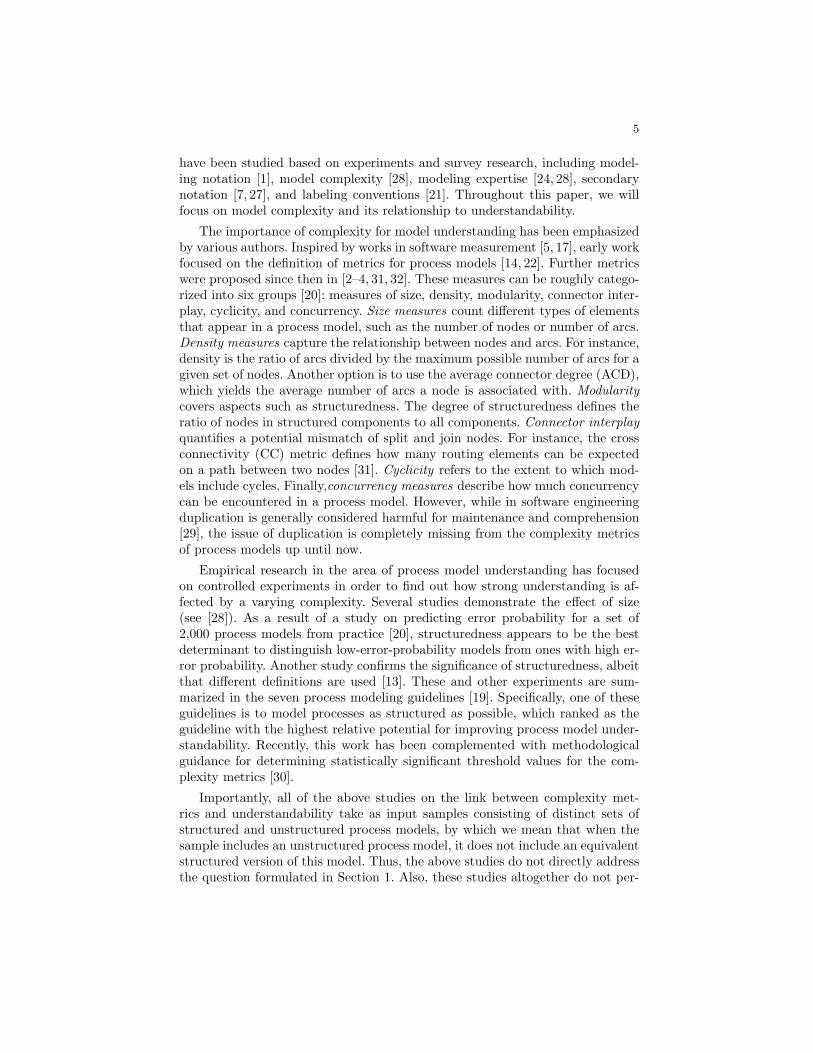
Fig. 2. Inherently un-structured BPMN model
Previous research on structured process modelinghas demonstrated that not all unstructured processmodels can be transformed into equivalent structuredmodels [11]. Such models are hereby called inherentlyunstructured. There are two root causes for processmodels being inherently unstructured. The first onearises from the structure shown in Fig.2; it has beenshown to be inherently unstructured in [11]. The sec-ond cause is a cycle that has more than one exit point,in which case it can only be structured by introducing boolean variables to cap-ture part of the control-flow [23] – arguably an undesirable solution in the contextof process modeling.
It is also known that transforming an unstructured process model into astructured one may lead to the introduction of duplicate nodes [23]. This du-plication arises when there is an XOR-join that is not the boundary of a SESEregion of the model. In some cases, to structure these models, the paths that

4 M. Dumas et al.
A B
C D
(a) unstructured version
A
B
CD
B
(b) structured version
Fig. 3. Unstructuredmodel with less gatewaysthan structured version.
follow the XOR-join need to be duplicated until theexit point of the smallest enclosing SESE region isreached. For example, in the structured model inFig.1(b), the “send payment-request” task is dupli-cated. In cases where loops have multiple entries, thepaths between the entry of the loop and the XOR-joinneed to be duplicated [23]. A direct effect of this du-plication is that when transforming an unstructuredprocess model into a structured one, the size of theresulting model is typically higher. In a study basedon the SAP R/3 reference model collection, convertingunstructured process models into structured ones ledto an average size increase of 22% and a maximum sizeincrease of 63% [25]. This size increase is attributableto an increase in the number of task/event nodes. Thenumber of gateways increases marginally and, in somecases, even decreases due to consolidation. This is illustrated in Figure 3.
2.2 Structuring process models
The problem of structuring process models has been extensively studied sincethe early 2000s. It has its roots in compiler theory [23] and code refactoring [35].Kiepuszewski et al. [11] made a first attempt at classifying unstructured processmodels that can be transformed to structured equivalents. They showed thatunstructured process models cannot always be replaced with structured modelsthat are behavior-equivalent. Later, Liu and Kumar [15] presented an alternativetaxonomy of unstructured process models and sketched a method to transformsome types of unstructured models into structured versions. Different transfor-mation strategies were also illustrated in [18] and an alternative classificationof (unstructured) process models was proposed in [9]. A method specificallytailored to untangling unstructured cyclic models and transforming them intostructured BPEL models is presented in [10, 12]. Finally, Polyvyanyy et al. [25]provide a complete characterization of unstructured acyclic process models thatare inherently unstructured, based on the RPST decomposition developed byVanhatalo et al. [33].
Previous research on structuring process models has been consolidated ina tool called BPStruct6. BPStruct tries to structure a model to the maximumpossible extent. The resulting model is then said to be maximally-structured.
2.3 Complexity Metrics and Understandability
In addition to formal work on structuring process models, there is a growingbody of research on how the understandability of a process model can be eval-uated from an empirical perspective. Different factors of model understanding6 http://code.google.com/p/bpstruct/.
5
have been studied based on experiments and survey research, including model-ing notation [1], model complexity [28], modeling expertise [24, 28], secondarynotation [7, 27], and labeling conventions [21]. Throughout this paper, we willfocus on model complexity and its relationship to understandability.
The importance of complexity for model understanding has been emphasizedby various authors. Inspired by works in software measurement [5, 17], early workfocused on the definition of metrics for process models [14, 22]. Further metricswere proposed since then in [2–4, 31, 32]. These measures can be roughly catego-rized into six groups [20]: measures of size, density, modularity, connector inter-play, cyclicity, and concurrency. Size measures count different types of elementsthat appear in a process model, such as the number of nodes or number of arcs.Density measures capture the relationship between nodes and arcs. For instance,density is the ratio of arcs divided by the maximum possible number of arcs for agiven set of nodes. Another option is to use the average connector degree (ACD),which yields the average number of arcs a node is associated with. Modularitycovers aspects such as structuredness. The degree of structuredness defines theratio of nodes in structured components to all components. Connector interplayquantifies a potential mismatch of split and join nodes. For instance, the crossconnectivity (CC) metric defines how many routing elements can be expectedon a path between two nodes [31]. Cyclicity refers to the extent to which mod-els include cycles. Finally,concurrency measures describe how much concurrencycan be encountered in a process model. However, while in software engineeringduplication is generally considered harmful for maintenance and comprehension[29], the issue of duplication is completely missing from the complexity metricsof process models up until now.
Empirical research in the area of process model understanding has focusedon controlled experiments in order to find out how strong understanding is af-fected by a varying complexity. Several studies demonstrate the effect of size(see [28]). As a result of a study on predicting error probability for a set of2,000 process models from practice [20], structuredness appears to be the bestdeterminant to distinguish low-error-probability models from ones with high er-ror probability. Another study confirms the significance of structuredness, albeitthat different definitions are used [13]. These and other experiments are sum-marized in the seven process modeling guidelines [19]. Specifically, one of theseguidelines is to model processes as structured as possible, which ranked as theguideline with the highest relative potential for improving process model under-standability. Recently, this work has been complemented with methodologicalguidance for determining statistically significant threshold values for the com-plexity metrics [30].
Importantly, all of the above studies on the link between complexity met-rics and understandability take as input samples consisting of distinct sets ofstructured and unstructured process models, by which we mean that when thesample includes an unstructured process model, it does not include an equivalentstructured version of this model. Thus, the above studies do not directly addressthe question formulated in Section 1. Also, these studies altogether do not per-

6 M. Dumas et al.
mit one to draw any conclusions on the trade-off between structuredness andduplication. A process model with small size and high structuredness appearsto be preferable from a perspective of model comprehension. Yet, it is not clearwhether a structured model should be preferred in case it implies duplicating aspecific amount of nodes and gateways. While an increase in size is consideredas harmful, duplication might even be worse. The negative effect of duplica-tion when structuring a process model has been briefly considered in [8]. Herethe authors point out that when structuring leads to unwanted duplications, itmight be preferable to leave a process model unstructured. However, they donot validate these intuitions empirically.
3 Complexity Comparison
In this section, we present a comparative complexity study aimed at testingthe hypothesis formulated in Section 1. For this study, we relied on the IBMBusiness Integration Technology (BIT) library: a publicly-available collection ofprocess models gathered from IBM’s consultancy practice [6]. The BIT library isdivided into three collections, namely A, B3 and C.7 After removing semanticallyincorrect models, these collections contain 269, 247 and 17 models respectively.
In order to test the hypothesis, we are interested in comparing the complexityof unstructured models against the complexity of the corresponding structuredmodels (or the maximally-structured models in case of inherently-unstructuredmodels). Accordingly, we extracted all 59 correct and unstructured models fromthe BIT library (41 in collection A, 15 in B3 and 3 in C). Each of these modelswas structured using BPStruct. The output was manually checked to ensurethat no errors had been introduced by the tool. 11 models with cycles werefound to be inherently unstructured (cycles with multiple exit points), in whichcase we took the maximally-structured model produced by BPStruct as beingthe “structured version”. None of the correct, acyclic models in the library wasfound to be inherently unstructured.
For each of the 59 resulting pairs of models (one structured, one unstruc-tured), we computed seven metrics: number of arcs, number of gateways, num-ber of tasks, size (number of nodes), Average Connector Degree (ACD), Cross-Connectivity (CC), and Density as introduced in Section 2. The average values ofthese metrics for the unstructured models and for the corresponding structuredmodels are shown in Table 1.
As expected, the average size of the structured models is higher. This in-crease in size is entirely due to node duplication introduced when structuring amodel, as discussed in Section 2. On average, the increase in size is in the orderof 50%, which is consistent with previous findings reported in [25]. On the otherhand, we observe a notable decrease in CC and density when the models becomestructured. The decrease in density reflects the intuition that structured processmodels are less “cluttered” while the decrease in CC supports the intuition that7 There are also two other collections (B1 and B2) containing earlier versions of the
models in B3, but for the purposes of this study these collections are redundant.

7
Table 1. Complexity of unstructured models vs. corresponding structured models
Metric Avg. unstructured Avg. structured Increase/decrease (%)
# arcs 30.02 44.76 49.12%
# gateways 8.41 12.31 46.37%
# tasks 16.81 25.76 53.23%
Size 25.22 38.07 46.53%
ACD 3.41590 3.29957 -3.04%
CC 0.05118 0.04455 -11.44%
Density 0.16096 0.12376 -22.5%
the control-flow relations between pairs of tasks in structured models are cogni-tively simpler. We also note a marginal decrease in ACD because of structuring,attributable to gateway reshuffling.
The differential in size, which is entirely attributable to duplication, entailsthat the structured process models are likely to be less understandable than theunstructured ones [19]. On the other hand, lower ACD, CC and density suggestthat structured models are less complex and, based on the same empirical study,we expect that the structured process models are more understandable thanthe unstructured ones. Therefore, the comparative complexity study shows thatthere is a tradeoff between different complexity indices when the unstructuredmodels in the dataset are transformed into structured ones. In other words, thecomparative complexity analysis neither supports nor refutes the hypothesis thatstructuring an unstructured process model leads to a higher understandability.
4 Controlled Experiment
Considering the ambivalent outcomes produced by the comparative complexitystudy, we decided to approach the research question with a questionnaire-based,controlled experiment. In this section, we describe its design.
Subjects: The experiment was run at Queensland University of Technology inearly October 2011. The population consisted of 110 students from two businessprocess modeling courses. The students were in their tenth week of training, suchthat they had acquired the requisite background to read BPMN process models.Participation in the study was voluntary.
Objects: We took 8 models from the IBM dataset (cf. Section 3) as the objects ofour experimental investigation. The models were selected on the basis of their sizeand whether they had cycles or not. Based on these two factors, four categoriesof models were created:
1. Acyclic unstructured models whose equivalent structured models are at least25% larger than the unstructured versions.
2. Cyclic unstructured models whose equivalent structured models are at least25% larger than the unstructured versions.

8 M. Dumas et al.
3. Acyclic unstructured models whose equivalent structured models are lessthan 10% larger than the unstructured versions.
4. Cyclic unstructured models whose equivalent structured models are less than10% larger than the unstructured versions.
For each of these four categories, two models were selected. When selectingmodels in a given category, we sought models with heterogeneous values for size,CC, ACD and density. The sizes of each original unstructured model and thedifferential in size and other complexity metrics between the unstructured andstructured versions are given in Section 5 (Table 3).
Factor and Factor Levels: The main factor manipulated in our experiment isthe structuredness of each process model, as presented to the respondents. Giventhe binomial character of this factor, it has structured and unstructured as itslevels for each of the used models.
Response Variables: As response variable we used a composite measure toreflect a respondent’s understanding of a process model – in a structured orunstructured form – as determined by the sum of correct answers to a set of sixquestions asked for each model.
Hypothesis Formulation: The goal of the experiment was to investigatewhether the level of structuredness of process model influences a respondent’sunderstanding of a process model. While we would expect a beneficial effectof structuring a process model, we appreciate the potential drawback of usingduplicate nodes. Accordingly, we postulate the following hypotheses:
– Hypothesis: Structured models yield a greater amount of correct answersthan unstructured models.
– Alternative Hypothesis: Unstructured models yield a greater amount ofcorrect answers than structured models.
Instrumentation: The participants conducted the experiment by observing theselected process models on paper, as part of a work-book. On a single page, oneprocess model along with a set of six questions to test the respondent’s compre-hension of that model were presented. All models were presented in the BPMNnotation. The questions used were designed in a similar fashion to the questionsof earlier experiments into process model understanding [28]. An example ques-tion from the questionnaire is: “If J is executed for a case, can F be executedfor the same case?” Additionally, subjects were asked to subjectively rate thecomplexity of each model on a 5-point Likert scale. Besides these understandingquestions, the questionnaire recorded personal characteristics of the participants,including their theoretical knowledge on process modeling as well as the amountof process modeling training they had received in the past.
Experimental Design: The experimental setup was based on literature pro-viding guidelines for designing experiments [34]. Following these guidelines arandomized balanced single factor experiment was conducted with a single mea-surement. The experiment is called randomized because subjects are randomly

9
assigned to two different groups. We denote the experiment as balanced as eachfactor level is used by each subject, i.e., each student is confronted to bothstructured and unstructured process models. As only a single factor is manip-ulated (i.e., the level of structuredness of each process model), the design iscalled single factor. Due to the balanced nature of the experiment, each subjectgenerates data for both factor levels. To avoid learning effects, each subject seeseach process model only once: either in its structured or unstructured form. Thisis achieved by having two versions of the questionnaire: one per group. In theversion of the questionnaire for the first group, all odd-numbered models werestructured while in the version for the second group all even-numbered modelswere structured. Thus, each subject evaluates four structured and four unstruc-tured models and none of the models a subject evaluates is equivalent to anyother model evaluated by the same subject. The questionnaires are available athttp://dl.dropbox.com/u/15565756/questionnaires.zip.
In separate work [16], we reported on a similar experiment with two groupsof students: one group only seeing structured models in their questionnaire andthe other group only seeing unstructured models. The results of this experimentwere similar to the ones reported below.
Another alternative experimental design would be to include unstructuredand structured versions of the same model in the same questionnaire (with re-labelling in order to minimize learning effects). In this case, it would be possibleto ask each subject to compare the models relative to one another in termsof understandability. The design of such experiment would however be ratherdifferent from the one reported in this paper, and thus deserves a separate study.
5 Results
In this section, we present the results of the experiment described in the previoussection. First, we explain the data cleansing steps we conducted. The resultingsample serves us for testing the research hypothesis.
5.1 Data Cleansing and Demographics
To avoid bias in terms of modeling expertise, we decided to filter out the re-sponses of those respondents who were highly familiar with process modelingand who had experience with process modeling in practice. Furthermore, we fil-tered out some potentially meaningless answers (e.g. training of more than 20work days on process modeling in the last year). The resulting analysis sam-ple includes the responses from 55 students who can all be classified as educatednovices in process modeling. On average, these participants got 6.07 out of twelvetheory questions right (std. deviation of 2.209) and 4.35 of the six understand-ing questions for each of the eight models (std. deviation 1.701). By having 55students evaluating eight models each, we received 440 model understanding ob-servations. 27 and 28 participants account for each version of the questionnaire.

10 M. Dumas et al.
5.2 Hypothesis Testing
By splitting the 440 observations into structured versus unstructured models, wedid not find an aggregated effect. Therefore, we run a univariate ANOVA for eachof the eight models by taking theory and structuredness as independent variablesinto account. In this way, we can analyze the hypothesis that participants mightunderstand structured process models better than unstructured ones.
Table 2. Results of ANOVA analysis for all eight models
Model Structure Mean (Std.D.) Estim. Intercept Struct. Struct. Theory Theory R2 betterCorrect Mean Sig. Eff.Size Sig. Eff.Size Sig.
1 struct. 4.29 (1.21) 4.213unstruct. 4.26 (1.63) 4.211 .001 .002 .776 .303 .115 .375 struct.
2 struct. 4.85 (1.13) 4.823unstruct. 4.64 (1.31) 4.611 .001 .001 .853 .165 .628 .257 struct.
3 struct. 3.32 (1.28) 3.264unstruct. 3.85 (1.46) 4.263 .001 .122* .032 .245 .271 .342 unstruct.
4 struct. 5.07 (1.64) 4.955unstruct. 4.46 (1.35) 4.278 .001 .176* .009 .396* .019 .495 struct.
5 struct. 4.43 (1.89) 3.866unstruct. 4.70 (1.71) 4.600 .001 .136* .023 .420* .011 .494 unstruct.
6 struct. 4.89 (1.79) 4.786unstruct. 4.32 (2.16) 3.694 .001 .168* .011 .355* .045 .446 struct.
7 struct. 4.18 (2.28) 3.676unstruct. 4.56 (1.78) 4.140 .001 .066 .121 .454* .005 .518 unstruct.
8 struct. 4.30 (1.71) 3.711unstruct. 3.57 (1.89) 3.273 .001 .065 .122 .395* .020 .485 struct.
The results of the ANOVA analysis are summarized in Table 2. The table liststhe mean sum of correct answers along with standard deviation and estimatedmarginal means for both the structured and the unstructured version of eachmodel. From these mean values, it can be seen that the effect of structuring hasa different orientation for the models. Models 3, 5, and 7 yield better under-standing in their unstructured version while for the other models the structuredversion is better. The columns following the estimated mean shows the signifi-cance of the ANOVA model coefficients. The intercept is significant in all cases.The effect of structure is only significant for models 3 to 6. Notably, the direc-tion for these four models is leaning towards the structured version in two cases,and also two cases towards the unstructured model. The effect size is between0.122 and 0.176. For models 4 to 8, there is a significant effect of theory rangingbetween 0.355 to 0.454. The R2 values range from 0.257 to 0.518. These statis-tical results demonstrate that a considerable share of variance can be explainedby structuredness and theoretical knowledge. They also point to the fact thatstructuredness and theory alone cannot explain the direction of the structur-ing effect on understanding. In the following, we will investigate which furthercharacteristics might help to explain these diverging effects.

11
5.3 Qualitative Analysis
In order to analyze the factors that may determine whether structured modelsare preferred over unstructured ones, we summarize in Table 3 the characteristicsof each model, the aggregate scores for perceived complexity, and the number ofcorrect answers broken down by model. Columns 1-2 indicate the model num-ber and a label indicating whether the model is the structured (s) version orthe unstructured (u) one. For example, the first row corresponds to model 1,structured version. Columns 3-9 provide the following properties for each model:number of nodes, number of gateways, whether or not the model contains cycles,and the increase in size, CC, ACD and Density between the structured versionof the model and the unstructured one. Column 10 provides the mean score forperceived complexity. This score was obtained by asking the following questionfor each model: “Please rate the difficulty of the model on a 5-point scale” with1 mapping to “very simple” and 5 mapping to “very difficult”. Finally, column12 provides the mean number of correct answers – copied here for the sake ofconvenience from Table 2.
Table 3. Model characteristics versus dependent variables
Model # # Cycles? Size CC ACD Density Perceived Meannodes gateways Increase Increase Increase Increase complexity correct
1s 30 5
no 1.43 2.07 14.55 -17.442.22 4.29
u 21 7 2.84 4.26
2s 24 5
no 1.50 -7.63 8.00 -21.432.66 4.85
u 16 6 2.66 4.64
3s 21 8
yes 1.31 -21.60 0.00 -11.113.21 3.32
u 16 6 3.04 3.85
4s 33 14
yes 1.65 -41.10 -12.50 -44.753.52 5.07
u 20 7 3.75 4.46
5s 32 10
no 1.23 2.62 -9.33 -26.003.60 4.43
u 26 8 3.13 4.70
6s 27 8
no 1.13 11.37 5.00 0.003.04 4.89
u 24 9 3.49 3.32
7s 21 8
yes 1.17 -9.97 -4.55 -18.753.51 4.18
u 18 7 3.18 4.56
8s 25 7
yes 1.04 30.60 4.76 6.062.85 4.30
u 24 8 3.60 3.57
From this table, we observe the following:
– Expectedly, an increase in perceived complexity is accompanied in all casesby a decrease in the number of correct answers and vice-versa (except forModel 2 for which the perceived complexity is identical for both versions).
– Increases in the four complexity metrics (size, CC, ACD and Density) donot explain why some unstructured models are preferred over the structuredcounterparts or vice-versa. For example, for Model 3 there is a decrease inCC and yet the unstructured version is preferred. Meanwhile, for Model 1and Model 8 there is an increase in CC and yet the structured version ispreferred. The same can be said for the density metrics. More striking isthe fact that for the models with the highest increase in size (Models 1,

12 M. Dumas et al.
2 and 4), the structured version was preferred. Thus, subjects sometimesprefer the structured model even when duplication is high, while other timesthey prefer the unstructured model despite low duplication in the structuredmodel.
– In all three cases where the unstructured version is preferred, the number ofgateways is higher in the structured version than in the unstructured one.Similarly, in 4 of the 5 instances where the structured model is preferred, thenumber of gateways is lower in the structured versions. The sole exceptionis Model 4.
With reference to the last two observations, Fig. 4 shows the unstructured andstructured versions of Model 4. This model has the highest increase in size afterrestructuring. It also has a higher number of gateways in the structured version.Still, this version is perceived to be less complex and the number of correct an-swers is higher in the structured version. Interestingly, this is the model withthe strongest decrease in CC and in density. Thus, whilst these two complex-ity metrics cannot predict in the general case whether subjects would prefer thestructured or the unstructured version of a model, it appears that the predictionsmade by these metrics are accurate in cases where the differentials in complexityare clear-cut. This observation suggests that there might be thresholds beyondwhich a decrease in CC or density when structuring an unstructured model doimply an increase in understandability. Previous research has identified thresh-olds beyond which complexity metrics (including density) are significant [30].Unfortunately, this previous study does not consider the case where an unstruc-tured process model is pitched against its corresponding structured version.
Although the number of models in the experiment is too small to draw astatistically significant conclusion, it appears that structuring leads to more un-derstandable models if it does not increase the number of gateways. This is nota general rule as we have found one instance where a clear increase in under-standability is achieved despite an increase in the number of gateways.
5.4 Threats to validity
The controlled experiment was conducted with a cohort of students. In thisrespect, it might be argued that the results may be biased by the fact thatstudents may tend to do more mistakes than more experienced analysts. Whilethis is indeed a limitation of the study, it is worth noting that previous workhas shown that students can be treated as proxies for early-career analysts insimilar experiments [26].
The students in the experimental cohort had heterogeneous levels of exper-tise. Answers given by subjects with higher level of expertise were filtered outduring analysis since dealing with multiple levels of expertise would require asubstantially larger group or, better still, multiple groups with different back-grounds. Thus, a possible extension of this work is to conduct similar experimentswith cohorts of different expertise levels.

13
a) b) b)
Fig. 4. Structured (a) and unstructured (b) versions of Model 4 used in the experiment.
The number of models (8) is insufficient to make definite conclusions regard-ing the factors that affect whether or not the structured model is preferred overthe unstructured one. This is why the discussion in Section 5.3 is qualitative innature. A separate study would be needed to zoom into this question.
The fact that all models in the study came from the same source, i.e. the IBMBIT library, can also be seen as a limitation. While this library contains processmodels from industrial practice and encompasses three collections of models(from different origins), it is possible that taking process models from othersources might impact our insights. Also, in this library, the labels in the processmodel were anonymized into labels of the form “s00000982” or “s00001088”prior to the public release of the library [6]. For our controlled experiment, wereplaced these anonymized labels with single symbols (“A”, “B”, “C”, ...) inorder to more easily refer to them in the questionnaire. It is possible that thelack of node labels referring to a real-world application domain might have aneffect on the results of the study. The latter limitation is shared with severalother studies on complexity and understandability [13, 28, 30].

14 M. Dumas et al.
6 Conclusion
This study has exposed the subtlety of tradeoffs involved when attempting toimprove the understandability of process models by applying guidelines. Specifi-cally, we have shown that while structuring an unstructured process model is inline with existing guidelines for ensuring process model understandability, theexpected benefits of this guideline may be thwarted by its side-effects.
The comparative complexity study based on a set of industrial models pro-vided no conclusive insights into the relative tradeoff between structuredness anda variety of complexity measures. The controlled experiment involving a cohortof process modeling novices confirmed the equivocal nature of the research issueat hand by showing that in certain cases a unstructured version of a processmodel is more easily interpreted than its corresponding structured equivalent,while in other cases the opposite holds.
The contribution of this paper is that it provides a first insight into an im-portant factor that mediates the noted effect, i.e. the number of gateways in thestructured version of an unstructured process model. The results suggest thatif structuring a process model does not increase the number of gateways, thestructured model would be preferred over presenting the unstructured version ofthat model. While we are the first to report on this specific relation and accom-panying suggestion, it is congruent with earlier work that has pointed at specificproperties of gateways in a process model as a source of mental strain [28].
We believe that this work contributes to the further development and fine-tuning of guidelines that will help to optimize the use of business process models.Considering the interest from research and praxis into such guidelines, it makessense to push further towards a more complete understanding of the conditionsunder which refactoring an unstructured process model into a structure one isbeneficial. In future work, we aim to analyze the observed mediating effect ofgateways identified in this work. To this end, we need to conduct experimentswith a larger set of process models. A specific challenge will be to find a researchdesign that circumvents fatigue effects with participants. Showing eight modelscan still be considered acceptable, but this is not so for a set of 30 or 40 models.
Another avenue for future work is to investigate in more depth the tradeoffsbetween understandability, structuredness and other complexity metrics. Thecomparative complexity analysis reported in this paper shows that structuring anunstructured process model has different effects on different complexity metrics.Also, no complexity metric alone seems to be able to predict whether or notthe structured model will be preferred over the unstructured one. However, itis possible that if we aggregated the effects of structuring a process model onmultiple complexity metrics, we could obtain a combined measure that couldserve as a predictor of whether structuring an unstructured process model wouldimprove its understandability.
Acknowledgments This work is partly funded by the Estonian Science Foun-dation (Dumas), the ERDF via the Estonian Centre of Excellence in ComputerScience (Dumas), and by the ARC Linkage project LP110100252 (La Rosa).

15
References
1. R. Agarwal, P. De, and AP Sinha. Comprehending object and process models:An empirical study. IEEE Transactions on Software Engineering, 25(4):541–556,1999.
2. E. Rolon Aguilar, F. Garcıa, F. Ruiz, and M. Piattini. An exploratory experimentto validate measures for business process models. In First International Conferenceon Research Challenges in Information Science (RCIS), 2007.
3. G. Canfora, F. Garcıa, M. Piattini, F. Ruiz, and C.A. Visaggio. A family ofexperiments to validate metrics for software process models. Journal of Systemsand Software, 77(2):113–129, 2005.
4. J. Cardoso. Evaluating workflows and web process complexity. In Layna Fischer,editor, Workflow Handbook 2005, pages 284–290. Future Strategies, Inc., Light-house Point, FL, USA, 2005.
5. S.R. Chidamber and C.F. Kemerer. A metrics suite for object oriented design.IEEE Transaction on Software Engineering, 20(6):476–493, 1994.
6. Dirk Fahland, Cedric Favre, Barbara Jobstmann, Jana Koehler, Niels Lohmann,Hagen Volzer, and Karsten Wolf. Instantaneous soundness checking of industrialbusiness process models. In Proc. of BPM, volume 5701 of LNCS, pages 278–293.Springer, 2009.
7. T.R.G. Green and M. Petre. Usability analysis of visual programming environ-ments: A ’cognitive dimensions’ framework. J. Vis. Lang. Comput., 7(2):131–174,1996.
8. V. Gruhn and R. Laue. Good and bad excuses for unstructured business pro-cess models. In Proc. of EuroPLoP, pages 279–292. UVK - UniversitaetsverlagKonstanz, 2008.
9. R. Hauser, M. Friess, J.M. Kuster, and J. Vanhatalo. An Incremental Approach tothe Analysis and Transformation of Workflows Using Region Trees. IEEE Trans-actions on Systems, Man, and Cybernetics, Part C, 38(3):347–359, 2008.
10. R. Hauser and J. Koehler. Compiling Process Graphs into Executable Code. InGPCE, volume 3286 of LNCS, pages 317–336, 2004.
11. B. Kiepuszewski, A.H.M ter Hofstede, and C. Bussler. On Structured WorkflowModelling. In Advanced Information Systems Engineering, volume 1789 of LNCS,pages 431–445. Springer, 2000.
12. J. Koehler and R. Hauser. Untangling Unstructured Cyclic Flows – A SolutionBased on Continuations. In OTM, volume 3290 of LNCS, pages 121–138, 2004.
13. R. Laue and J. Mendling. Structuredness and its significance for correctness ofprocess models. Inf. Syst. E-Business Management, 8(3):287–307, 2010.
14. G.S. Lee and J.-M. Yoon. An empirical study on the complexity metrics of petrinets. Microelectronics and Reliability, 32(3):323–329, 1992.
15. R. Liu and A. Kumar. An Analysis and Taxonomy of Unstructured Workflows. InProc. of BPM, volume 3649, pages 268–284, 2005.
16. R. Maesalu. Complexity and Understandability Comparison between Unstructuredand Structured Business Process Models. Master’s thesis, University of Tartu, June2011. http://tinyurl.com/75gfnuz.
17. T.J. McCabe. A complexity measure. IEEE Transaction on Software Engineering,2(4):308–320, 1976.
18. J. Mendling, K.B. Lassen, and U. Zdun. On the transformation of control flowbetween block-oriented and graph-oriented process modelling languages. Inter-national Journal of Business Process Integration and Management, 3(2):96–108,2008.

16 M. Dumas et al.
19. J. Mendling, H.A. Reijers, and W.M.P. van der Aalst. Seven Process ModelingGuidelines (7PMG). Information and Software Technology, 52(2):127–136, 2010.
20. Jan Mendling. Metrics for Process Models: Empirical Foundations of Verification,Error Prediction, and Guidelines for Correctness, volume 6 of Lecture Notes inBusiness Information Processing. Springer, 2008.
21. Jan Mendling, Hajo A. Reijers, and Jan Recker. Activity labeling in process mod-eling: Empirical insights and recommendations. Inf. Syst., 35(4):467–482, 2010.
22. M.E. Nissen. Redesigning reengineering through measurement-driven inference.MIS Quarterly, 22(4):509–534, 1998.
23. G. Oulsnam. Unravelling unstructured programs. Comput. J., 25(3):379–387, 1982.24. Marian Petre. Why looking isn’t always seeing: Readership skills and graphical
programming. Commun. ACM, 38(6):33–44, 1995.25. A. Polyvyanyy, L. Garcıa-Banuelos, and M. Dumas. Structuring Acyclic Process
Models. Information Systems, 2012 (to appear).26. H.A. Reijers and J. Mendling. A Study into the Factors that Influence the Under-
standability of Business Process Models. IEEE Transactions on Systems Man andCybernetics, Part A, page In Press, 2010.
27. Hajo A. Reijers, Thomas Freytag, Jan Mendling, and Andreas Eckleder. Syntaxhighlighting in business process models. Decision Support Systems, 51(3):339–349,2011.
28. Hajo A. Reijers and Jan Mendling. A study into the factors that influence theunderstandability of business process models. IEEE Transactions on Systems,Man, and Cybernetics, Part A, 41(3):449–462, 2011.
29. M. Rieger, S. Ducasse, and M. Lanza. Insights into system-wide code duplication.In 11th Working Conference on Reverse Engineering, 2004. Proceedings., pages100–109. IEEE, 2004.
30. Laura Sanchez-Gonzalez, Felix Garcıa, Jan Mendling, and Francisco Ruiz. Qualityassessment of business process models based on thresholds. In Robert Meersman,Tharam S. Dillon, and Pilar Herrero, editors, OTM Conferences (1), volume 6426of Lecture Notes in Computer Science, pages 78–95. Springer, 2010.
31. I. Vanderfeesten, H.A. Reijers, J. Mendling, W.M.P. Aalst, and J. Cardoso. On aQuest for Good Process Models: The Cross-Connectivity Metric. Lecture Notes inComputer Science, 5074:480–494, 2008.
32. J. Vanhatalo, H. Volzer, and F. Leymann. Faster and more focused control-flowanalysis for business process models through sese decomposition. In B.J. Kramer,K.-J. Lin, and P. Narasimhan, editors, Service-Oriented Computing - ICSOC 2007,Fifth International Conference, Vienna, Austria, September 17-20, 2007, Proceed-ings, volume 4749 of Lecture Notes in Computer Science, pages 43–55. Springer,2007.
33. J. Vanhatalo, J. Volzer, and J. Kohler. The Refined Process Structure Tree. DKE,68(9):793–818, 2009.
34. C. Wohlin. Experimentation in software engineering: an introduction, volume 6.Springer, 2000.
35. F. Zhang and E.H. D’Hollander. Using Hammock Graphs to Structure Programs.IEEE Transactions on Software Engineering, 30(4):231–245, 2004.