Embed Size (px)
Citation preview
1979 1983 1987 1991 1995 1999 2003 2007 20110
2
4
6
8
10Percentage of the Labor Force
All Unemployed
Unemployed forMore Than 26 Weeks
CONGRESS OF THE UNITED STATESCONGRESSIONAL BUDGET OFFICE
CBOUnderstanding and
Responding to Persistently High Unemployment
FEBRUARY 2012

Pub. No. 4287
A
S T U D Y
CBO
Understanding and Responding to Persistently High Unemployment
February 2012
The Congress of the United States O Congressional Budget Office

CBO
Note
The numbers in the text and tables may not add up to totals because of rounding.

Preface
This Congressional Budget Office (CBO) study, which examines the state of the labor market and a broad array of policy approaches designed to reduce unemployment, was prepared at the request of the Ranking Member of the House Committee on Ways and Means. In keeping with CBO’s mandate to provide objective, impartial analysis, this study makes no recommendations.
Gregory Acs and William Carrington of CBO’s Health and Human Resources Division wrote the study under the supervision of Linda Bilheimer. David Brauer and Benjamin Page con-tributed significantly to the analysis. Christi Hawley Anthony, Molly Dahl, Wendy Edelberg, Matt Goldberg, Heidi Golding, Michael Levine, Joyce Manchester, and Jonathan Schwabish of CBO provided helpful comments on the report. Jimmy Jin provided valuable research and production assistance.
Diana Furchtgott-Roth of the Manhattan Institute for Policy Research, Harry Holzer of Georgetown University, and Betsey Stevenson of the University of Pennsylvania also reviewed the report. The assistance of external reviewers implies no responsibility for the final product, which rests solely with CBO.
Loretta Lettner edited the study. Maureen Costantino prepared the report for publication and designed the cover. An electronic version is available on CBO’s Web site (www.cbo.gov).
Douglas W. ElmendorfDirector
February 2012
CBO

Contents
Summary vii
Unemployment and Its Consequences 1
Characteristics of the Unemployed 2
Effects of Job Loss and Unemployment on Workers and Their Families 3
Factors Causing High Unemployment 8
Weak Demand for Goods and Services 9
Mismatches Between Employers’ Needs and the Skills and Location of Workers 9
Incentives from Extensions of Unemployment Insurance 11
“Stigma” and the Erosion of Skills 12
Policies to Increase Demand for Workers 14
Fiscal Policies 14
Other Types of Legislative Actions 16
Other Policies to Reduce Unemployment 17
Improving Workers’ Skills 18
Modifying Unemployment Insurance 21
Facilitating Transitions to Employment 24
CBO
VI UNDERSTANDING AND RESPONDING TO PERSISTENTLY HIGH UNEMPLOYMENT
CBO
Tables
1.
Characteristics of the Labor Force and the Unemployed, March 2011 52.
Employment, by Industry, 2007 to 2011 103.
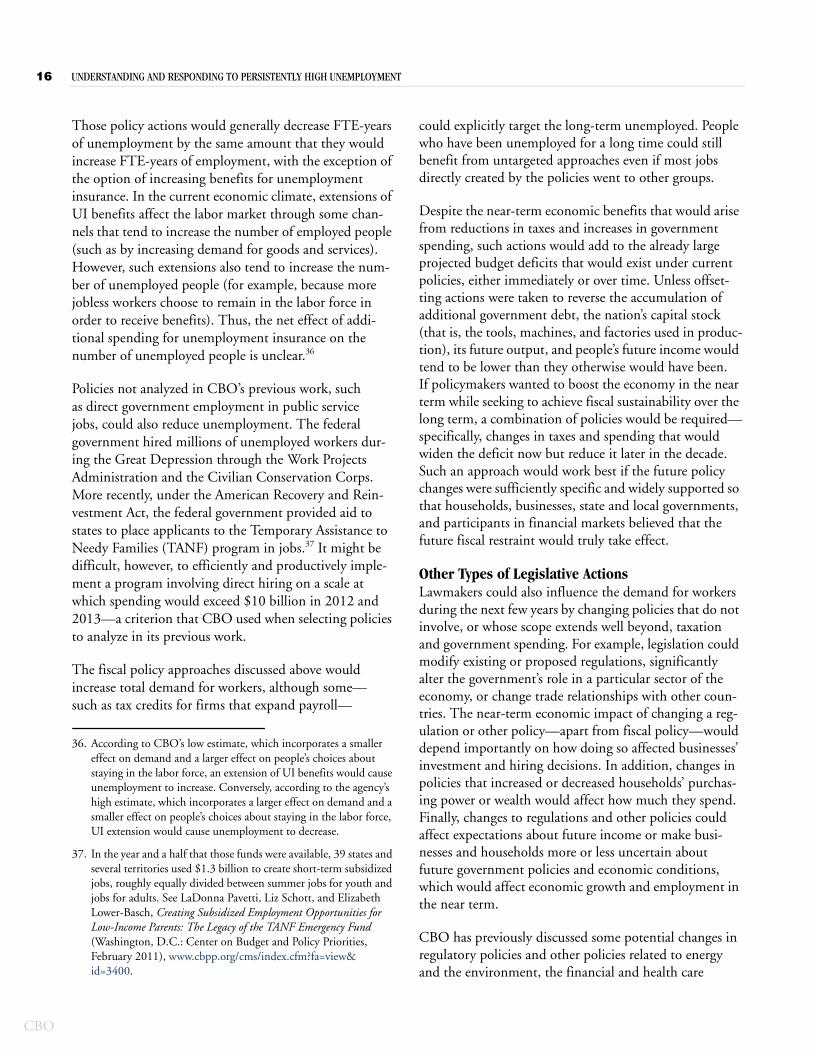
Funding for Training Under the Workforce Investment Act (Title I), Fiscal Year 2012 17Figures
1.
The Unemployment Rate and the Long-Term Unemployed as a Share of All Unemployed, 1982 to 2011 22.
Relationship Between the Unemployment Rate and the Long-Term Unemployed as a Share of All Unemployed, 1982 to 2011 43.
Long-Term Unemployment During and Immediately Following Three Recent Recessions, by Reason for Unemployment 134.
Ranges of Cumulative Effects of Policy Options on Employment in 2012 and 2013 15Boxes
1.
Defining Unemployment 32.
Programs That May Aid Unemployed People 63.
Funding Mechanisms 19
Summary
The rate of unemployment in the United States has exceeded 8 percent since February 2009, making the past three years the longest stretch of high unemployment in this country since the Great Depression. Moreover, the Congressional Budget Office (CBO) projects that the unemployment rate will remain above 8 percent until 2014. The official unemployment rate excludes those individuals who would like to work but have not searched for a job in the past four weeks as well as those who are working part-time but would prefer full-time work; if those people were counted among the unemployed, the unemployment rate in January 2012 would have been about 15 percent. Compounding the problem of high unemployment, the share of unemployed people looking for work for more than six months—referred to as the long-term unemployed—topped 40 percent in December 2009 for the first time since 1948, when such data began to be collected; it has remained above that level ever since.
Such persistently high unemployment has wide-ranging repercussions: It places financial, psychological, and even physical strains on people who are unable to find work and on their families as well; it places budgetary pressures on the federal government and on state and local govern-ments, as tax revenues decline and expenditures increase; and it results in a long-term erosion of skills that will reduce the nation’s productivity and people’s income in the future.
In this study, CBO examines a broad array of policy approaches designed to reduce unemployment. Some of those policies would aim to boost the economy and demand for goods and services, reflecting the fact that the increase in unemployment in general and long-term unemployment in particular is primarily attributable to weak demand for labor, which, in turn, is the result of weak aggregate demand. Policies to increase demand for workers could reduce unemployment substantially in
2012 and 2013, although those policies could be costly to the federal government and would vary greatly in their effectiveness per dollar of budgetary cost. Other policies that CBO examined, including worker training, changes to the unemployment insurance (UI) system, and helping the unemployed transition to new jobs, would probably not have a significant effect on the overall unemployment rate during the next two years, primarily because of their limited scope, but they could provide support to certain groups and have longer-run positive effects.
Unemployment and Its ConsequencesHouseholds with unemployed workers are adversely affected by joblessness in many ways. For workers who have been displaced through no fault of their own—specifically, who lost or left a job because their plant or company closed or moved, because there was insufficient work for them to do or because their position or shift was abolished—the drop in earnings associated with losing a job during a recession may persist for many years, even when these workers eventually find a new job. Older workers and those with long tenure in their previous job are especially vulnerable because new jobs for those work-ers typically pay less and offer less potential for earnings growth. Other types of unemployed workers—for exam-ple, people entering the labor market for the first time (typically after completing school)—are also adversely affected by a weak economy. People who start their career in times of high unemployment tend to have persistently lower earnings than their counterparts who begin seeking work under better economic circumstances.
In addition to its immediate and lasting effects on earn-ings and family finances, unemployment is also correlated with deteriorating mental and physical health and with increased mortality. A parent’s job loss can lead to worse schooling outcomes for children and, ultimately, to worse labor market outcomes for those children once they
CBO
VIII UNDERSTANDING AND RESPONDING TO PERSISTENTLY HIGH UNEMPLOYMENT
CBO
become adults. In those and other ways, unemployment is costly for many households, and the adverse effects are probably worse for those unemployed for an extended period.
Factors Causing High UnemploymentMany factors are responsible for the rise in unemploy-ment in general and in long-term unemployment in particular. Explanations include the following:
Weak demand for goods and services, as a result of the recession and its aftermath, which results in weak demand for workers;
Mismatches between would-be employers’ needs and the skills or location of the unemployed;
Incentives from extensions of unemployment insur-ance for people to stay in the labor force and continue searching for work; and
The erosion of unemployed workers’ skills and the belief held by some employers that people who have been unemployed for a long time would be low-quality workers (a phenomenon sometimes called stigma).
Slack demand for goods and services (that is, slack aggre-gate demand) is the primary reason for the persistently high levels of unemployment and long-term unemploy-ment observed today, in CBO’s judgment; other factors appear to play smaller roles. However, when aggregate demand ultimately picks up, as it eventually will, so-called structural factors—specifically, employer-employee mismatches, the erosion of skills, and stigma—may con-tinue to keep unemployment and long-term unemploy-ment higher than normal.
Policies to Increase Demand for WorkersIn previous work, CBO examined the possible effects of a number of policies designed to increase output and employment in 2012 and 2013.1 Those fiscal policy actions were intended to increase demand for goods and
services and raise employment in three key ways: by boosting households’ disposable income, by providing support to businesses, and by increasing aid to state governments or government spending on infrastructure. Initiatives that would reduce the marginal cost to busi-nesses of adding employees or that would target people most likely to spend the additional income (generally, people with lower income) would have the largest effects on employment per dollar of budgetary cost in 2012 and 2013, CBO found. Policies primarily affecting businesses’ cash flow would have little impact on their marginal incentives to hire or invest and, therefore, would have only small effects on employment per dollar of budgetary cost.
Despite the near-term economic benefits, such actions would add to the already large projected budget deficits that would exist under current policies, either immedi-ately or over time. Unless other actions were taken to reverse the accumulation of government debt, the nation’s output and people’s income would ultimately be lower than they otherwise would have been. To boost the economy in the near term while seeking to achieve long-term fiscal sustainability, a combination of policies would be required: changes in taxes and spending that would increase the deficit now but reduce it later in the decade.
Lawmakers could also influence employment—and unemployment—during the next few years by changing policies that do not involve, or whose scope extends well beyond, taxation and government spending. In its previ-ous work, CBO considered some potential changes in regulatory and other policies related to energy and the environment, the financial and health care sectors, and international trade. In CBO’s judgment, the economic effects of the changes in regulatory policies or other types of policies that the agency examined—apart from fiscal policies—probably would be too small, or would occur too slowly, to significantly alter overall output or employ-ment in the next two years.
1. See the statement of Douglas W. Elmendorf, Director, Congressional Budget Office, before the Senate Committee on the Budget, Policies for Increasing Economic Growth and Employment in 2012 and 2013 (November 15, 2011).
SUMMARY UNDERSTANDING AND RESPONDING TO PERSISTENTLY HIGH UNEMPLOYMENT IX
Other Policies to Reduce UnemploymentLawmakers could aim to reduce unemployment by addressing factors other than weak demand for goods and services. In this report, CBO examines initiatives that would take the following approaches:
Improving workers’ skills,
Modifying the unemployment insurance program, or
Facilitating transitions to work.
Examples include training programs (perhaps targeted at specific vocations, geographic areas, or age groups);
changes to unemployment insurance to encourage unemployed people to return to work quickly, keep the unemployed connected to the workplace, or forestall job losses; and programs such as job-search assistance and housing-mobility assistance that help the unemployed transition to new jobs and locations. Such policies could be implemented using mechanisms ranging from provid-ing funding through block grants to direct federal opera-tion. But such policies would probably not have a signifi-cant effect on unemployment over the next two years, primarily because the policies the agency examined could probably not be implemented on a sufficiently large scale during that time. However, by reducing the extent of unemployment and long-term unemployment in the future, they might have longer-term benefits.
CBO

Understanding and Responding to Persistently High Unemployment
Unemployment and Its ConsequencesThe effects of the recent recession, which began in December 2007 and ended in June 2009, have combined to make the years since 2007 the worst period of unem-ployment in the United States since the 1930s. Contrib-uting factors include the following:
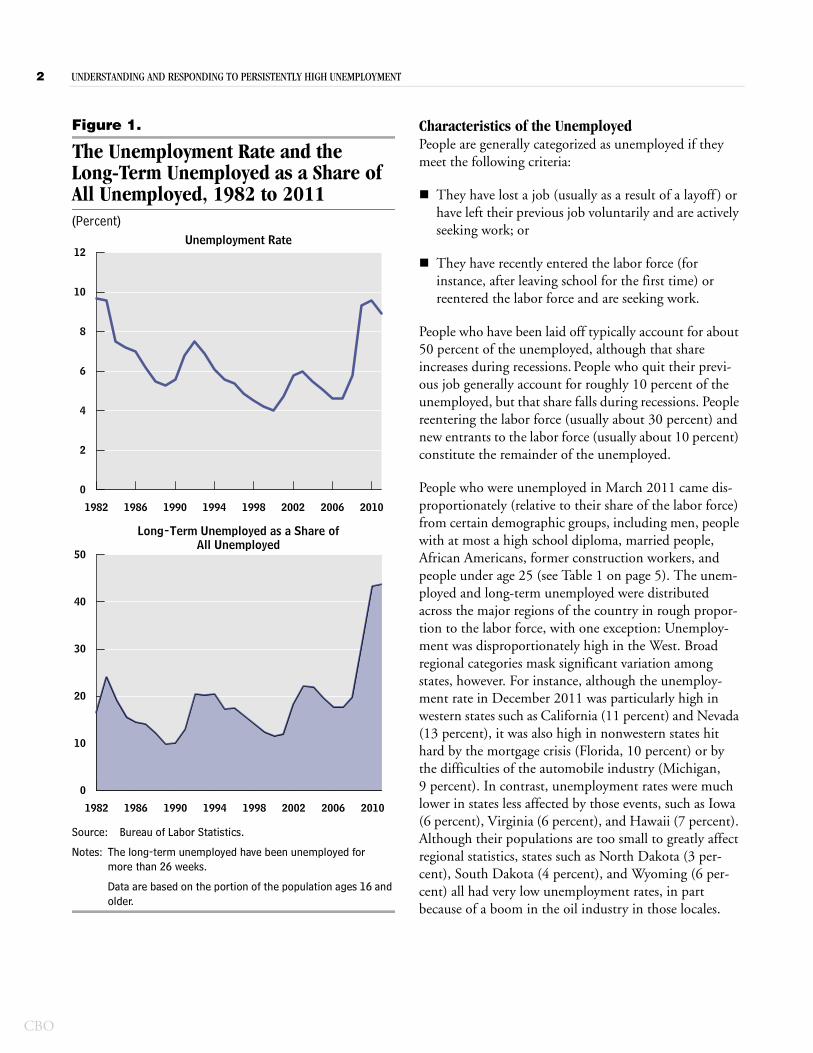
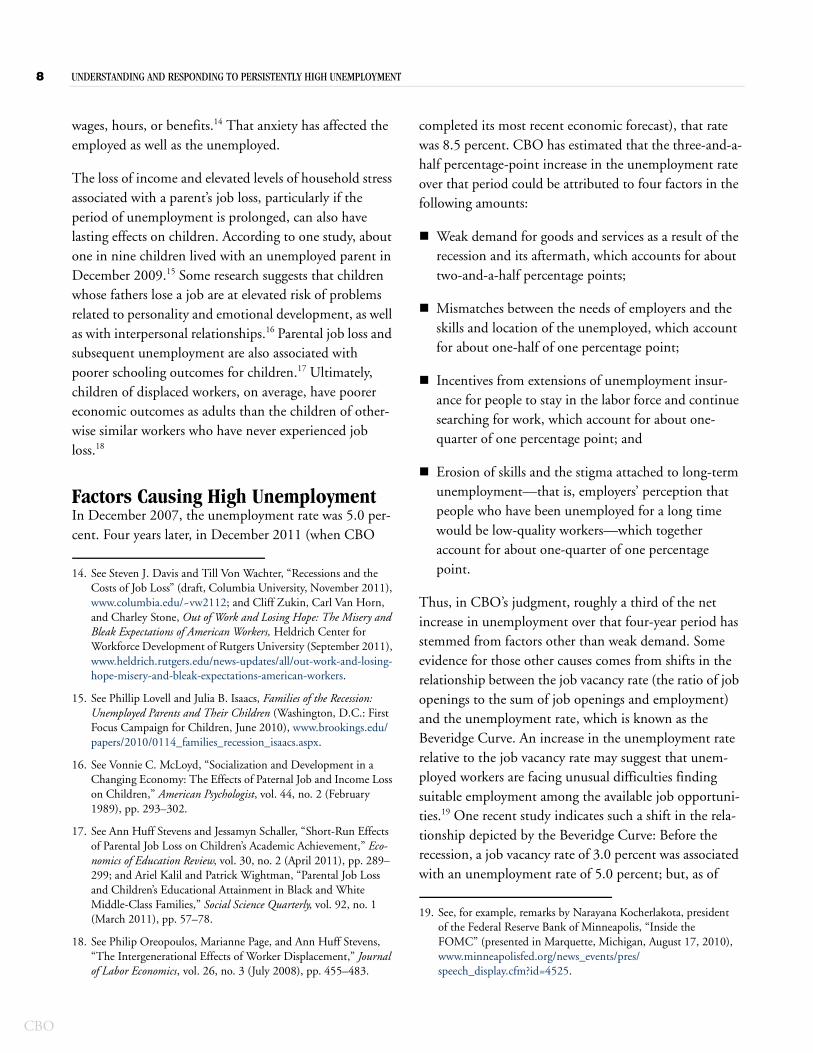
The unemployment rate reached a very high level, peaking at 10.0 percent in October 2009. That rate has been topped in the post–World War II period only once before—during the severe 1981–1982 recession (see the upper panel of Figure 1). From the end of 2007 to October 2009, the number of unemployed people rose by almost 8 million. (For details about how unemployment is defined and measured, see Box 1.)
Unemployment has been high for an extended period. As of January 2012, the unemployment rate had been above 8 percent for 36 months and at or above 9 percent for 28 of the preceding 36 months. In con-trast, the unemployment rate exceeded 8 percent for 26 months and was at or above 9 percent for 19 months during the recession of the early 1980s.
Many people would like to work but have not searched for a job in the past four weeks, or are work-ing part-time but would prefer full-time work. If those people were counted among the unemployed, the unemployment rate in January 2012 would have been about 15 percent.
The share of unemployment accounted for by the long-term unemployed (people who have been seeking work for more than 26 weeks) has been at an all-time high. Over 40 percent of people who are currently unemployed have been out of work for more than half a year, as compared with about one-quarter during the
1981–1982 recession (see the lower panel of Figure 1).1
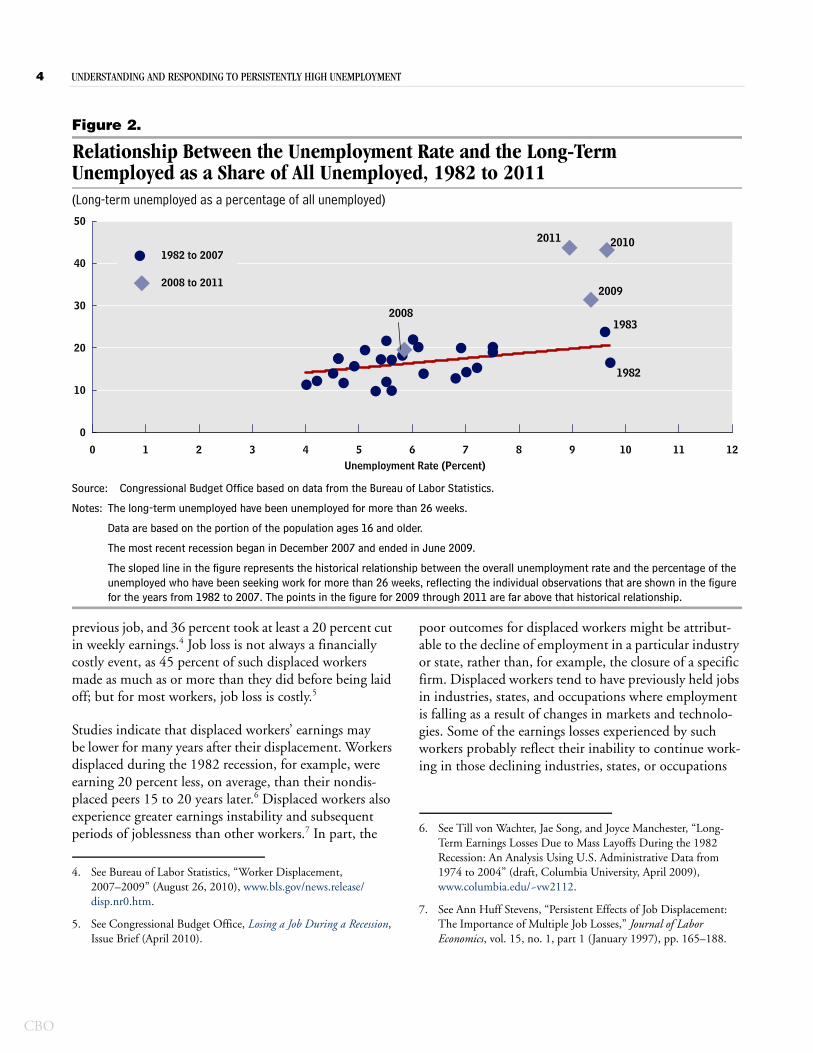
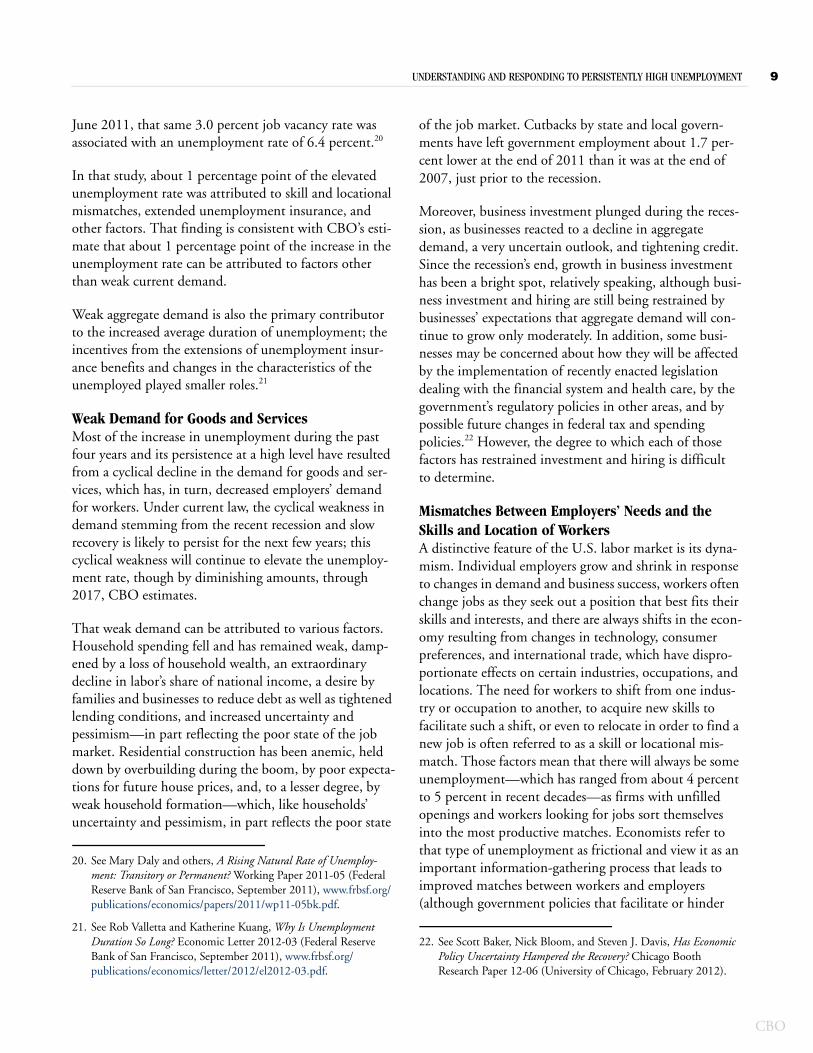
The extent of long-term unemployment is much greater than would be expected on the basis of its historical rela-tionship with the overall unemployment rate (see Figure 2 on page 4). Had long-term unemployment followed its historical pattern, it would have been between 20 percent and 25 percent of total unemploy-ment in 2009 and 2010, rather than over 40 percent. That high share means that many of the same people have been unemployed from month to month and from year to year.2 As a result, much of the impact of unem-ployment has fallen on people who have been unem-ployed for a long time rather than being shared by a wider set of people unemployed for shorter periods.
1. There are two approaches to measuring the duration of unem-ployment in the Current Population Survey, which is the basis for official U.S. unemployment statistics. The first and more widely used method, which the Bureau of Labor Statistics used to pro-duce the figures reported here, relies on respondents’ retrospective characterization of how long they have been unemployed as of the survey date. An alternative approach relies on changes in respon-dents’ characterizations of their labor force status between consec-utive months. That approach yields different measures of the average duration of unemployment. For many respondents, the two approaches yield mutually inconsistent information. For further discussion, see Michael W. L. Elsby, Bart Hobijn, and Aysegul Sahin, The Labor Market in the Great Recession: An Update, Working Paper 2011-29 (Federal Reserve Bank of San Francisco, October 2011), www.frbsf.org/publications/economics/papers/2011/wp11-29bk.pdf.
2. See Michael W. L. Elsby, Bart Hobijn, and Aysegul Sahin, “The Labor Market in the Great Recession,” Brookings Papers on Economic Activity, vol. 41, no. 1 (Spring 2010), pp. 1–65, www.brookings.edu/economics/bpea/past-editions.aspx; and Michael W. L. Elsby, Bart Hobijn, and Aysegul Sahin, “Updates of a Selection of Figures from Elsby, Hobijn, and Sahin (2010)” (March 2011), www.ny.frb.org/research/economists/sahin/pub.html.
CBO
2 UNDERSTANDING AND RESPONDING TO PERSISTENTLY HIGH UNEMPLOYMENT
CBO
Figure 1.
The Unemployment Rate and theLong-Term Unemployed as a Share of All Unemployed, 1982 to 2011(Percent)
Source: Bureau of Labor Statistics.
Notes: The long-term unemployed have been unemployed for more than 26 weeks.
Data are based on the portion of the population ages 16 and older.
1982 1986 1990 1994 1998 2002 2006 2010
0
2
4
6
8
10
12
1982 1986 1990 1994 1998 2002 2006 2010
0
10
20
30
40
50
Long-Term Unemployed as a Share ofAll Unemployed
Unemployment Rate
Characteristics of the UnemployedPeople are generally categorized as unemployed if they meet the following criteria:
They have lost a job (usually as a result of a layoff ) or have left their previous job voluntarily and are actively seeking work; or
They have recently entered the labor force (for instance, after leaving school for the first time) or reentered the labor force and are seeking work.
People who have been laid off typically account for about 50 percent of the unemployed, although that share increases during recessions. People who quit their previ-ous job generally account for roughly 10 percent of the unemployed, but that share falls during recessions. People reentering the labor force (usually about 30 percent) and new entrants to the labor force (usually about 10 percent) constitute the remainder of the unemployed.
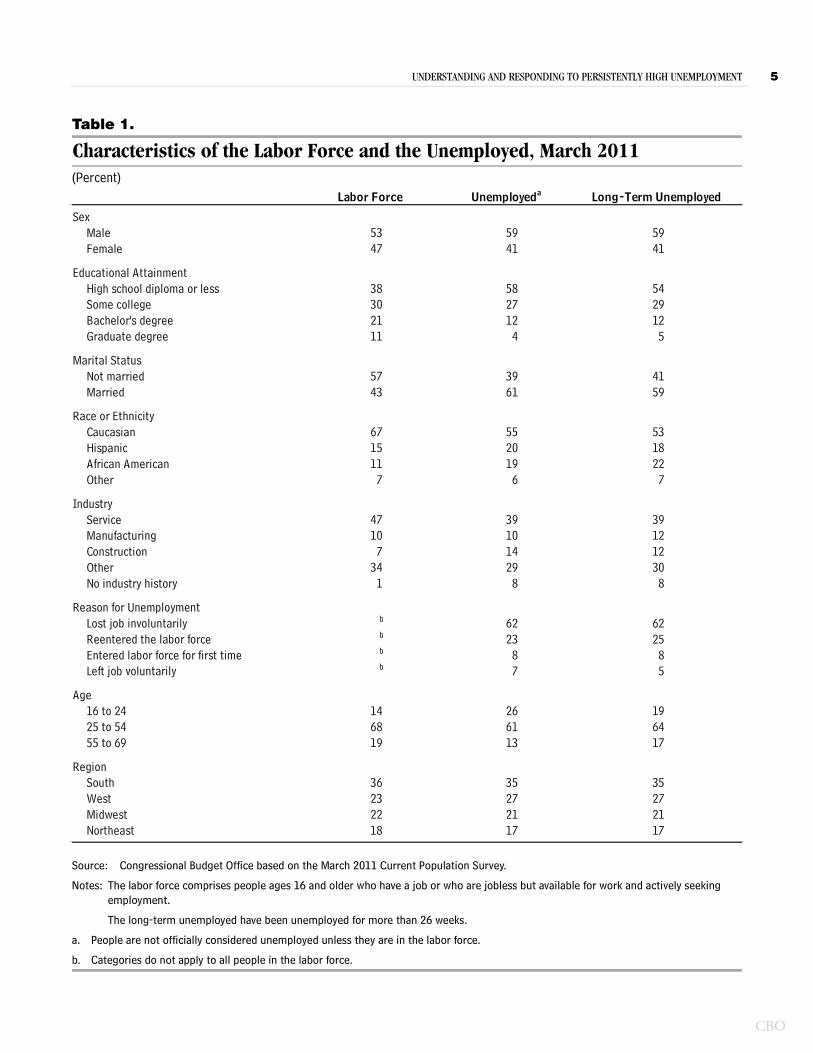
People who were unemployed in March 2011 came dis-proportionately (relative to their share of the labor force) from certain demographic groups, including men, people with at most a high school diploma, married people, African Americans, former construction workers, and people under age 25 (see Table 1 on page 5). The unem-ployed and long-term unemployed were distributed across the major regions of the country in rough propor-tion to the labor force, with one exception: Unemploy-ment was disproportionately high in the West. Broad regional categories mask significant variation among states, however. For instance, although the unemploy-ment rate in December 2011 was particularly high in western states such as California (11 percent) and Nevada (13 percent), it was also high in nonwestern states hit hard by the mortgage crisis (Florida, 10 percent) or by the difficulties of the automobile industry (Michigan, 9 percent). In contrast, unemployment rates were much lower in states less affected by those events, such as Iowa (6 percent), Virginia (6 percent), and Hawaii (7 percent). Although their populations are too small to greatly affect regional statistics, states such as North Dakota (3 per-cent), South Dakota (4 percent), and Wyoming (6 per-cent) all had very low unemployment rates, in part because of a boom in the oil industry in those locales.
UNDERSTANDING AND RESPONDING TO PERSISTENTLY HIGH UNEMPLOYMENT 3
Box 1.
Defining UnemploymentThe Bureau of Labor Statistics (BLS) compiles labor force statistics and computes the unemployment rate using data from the Current Population Survey, a monthly survey of households that is conducted for BLS by the Census Bureau. On the basis of partici-pants’ responses to the survey, adult respondents are assigned to one of three labor force categories:
Respondents are categorized as employed if they have a job or are self-employed at the time of the survey.
They are categorized as unemployed if they do not have a job but would like one and are actively searching for a position. Respondents in both categories—employed and unemployed—are considered to be in the labor force.
Respondents who are neither working nor looking for work are characterized as out of the labor force. People classified as out of the labor force include retirees, full-time students who do not have a job, and full-time, unpaid caregivers.
The unemployment rate is then calculated as the frac-tion of the labor force that is unemployed.
The distinction between people categorized as employed and those in the other two categories is rel-atively clear-cut. Ambiguities sometimes arise for people who are employed but work fewer hours per week than they would like or who are working at jobs that do not fully utilize their skills. Such workers are sometimes described as underemployed, but that des-ignation is not recognized by BLS as a separate cate-gory. The distinction between being unemployed and out of the labor force is less clear-cut. Each group consists of people who are jobless, of course, but questions arise as to how to treat respondents who would like to work if a suitable job was available but who have stopped looking for work. Because they are no longer looking for work, such respondents would not be considered unemployed and would instead be classified as out of the labor force. In some alternative categorizations, used by BLS and by other analysts, such respondents are characterized as discouraged workers and included with the unemployed as a measure of those who would like a job but currently do not have one.
Effects of Job Loss and Unemployment on Workers and Their FamiliesUnemployment, and especially long-term unemploy-ment, often leads to adverse consequences for unem-ployed workers and their families. Various federal pro-grams assist unemployed people by providing income and other support, including some programs that are targeted particularly at those with low family income or disabili-ties (see Box 2 on page 6). Nevertheless, the effects of unemployment may be prolonged and may affect work-ers’ subsequent earnings, their health, and their family’s well-being.3
Reduced Earnings After Job Loss. For many displaced workers—those who permanently lose their job through no fault of their own—the effects on subsequent earnings can be substantial. They initially suffer a decline in earn-
ings when they become unemployed. But displaced work-ers also often suffer longer-term losses in earnings from a combination of factors: reduced rates of employment, fewer hours worked, and lower hourly wages once they find a new job. Data compiled by the Bureau of Labor Statistics (BLS) show that, among workers meeting the following criteria—they lost a full-time job between 2007 and 2009, had three or more years of tenure when they lost that job, and were working again in January 2010—55 percent earned less per week than they had at their
3. Some evidence suggests that average physical health in the popula-tion as a whole may improve during recessionary times, in part because of reduced consumption of alcohol and tobacco. See Christopher J. Ruhm, “Healthy Living in Hard Times,” Journal of Health Economics, vol. 24, no. 2 (March 2005), pp. 341–363; and Christopher J. Ruhm, “Good Times Make You Sick,” Journal of Health Economics, vol. 22, no. 4 (July 2003), pp. 637–658.
CBO
4 UNDERSTANDING AND RESPONDING TO PERSISTENTLY HIGH UNEMPLOYMENT
CBO
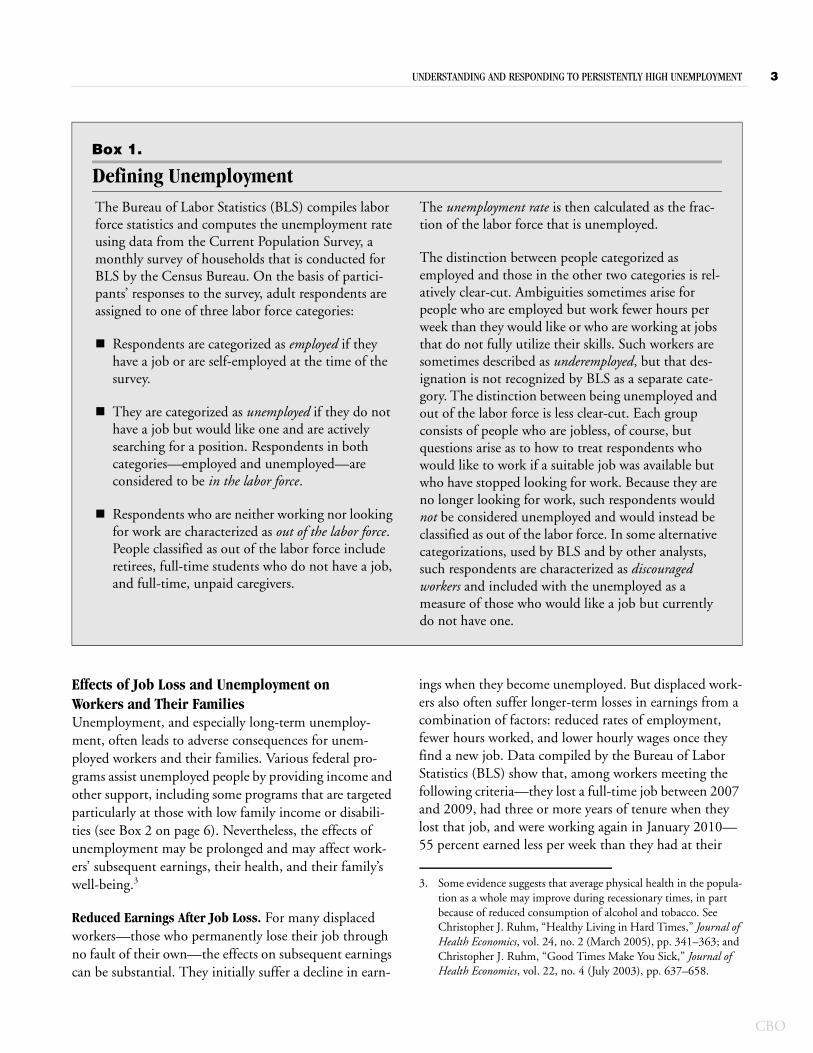
Figure 2.
Relationship Between the Unemployment Rate and the Long-Term Unemployed as a Share of All Unemployed, 1982 to 2011(Long-term unemployed as a percentage of all unemployed)
Source: Congressional Budget Office based on data from the Bureau of Labor Statistics.
Notes: The long-term unemployed have been unemployed for more than 26 weeks.
Data are based on the portion of the population ages 16 and older.
The most recent recession began in December 2007 and ended in June 2009.
The sloped line in the figure represents the historical relationship between the overall unemployment rate and the percentage of the unemployed who have been seeking work for more than 26 weeks, reflecting the individual observations that are shown in the figure for the years from 1982 to 2007. The points in the figure for 2009 through 2011 are far above that historical relationship.
●
●
●●●●
●● ●
●
●●●●●
●●
●● ●
●
●●●
●●◆
◆
◆◆
0
10
20
30
40
50
0 1 2 3 4 5 6 7 8 9 10 11 12Unemployment Rate (Percent)
● 1982 to 2007
◆ 2008 to 2011
2008
2009
2010
1983
1982
2011
previous job, and 36 percent took at least a 20 percent cut in weekly earnings.4 Job loss is not always a financially costly event, as 45 percent of such displaced workers made as much as or more than they did before being laid off; but for most workers, job loss is costly.5
Studies indicate that displaced workers’ earnings may be lower for many years after their displacement. Workers displaced during the 1982 recession, for example, were earning 20 percent less, on average, than their nondis-placed peers 15 to 20 years later.6 Displaced workers also experience greater earnings instability and subsequent periods of joblessness than other workers.7 In part, the
4. See Bureau of Labor Statistics, “Worker Displacement, 2007–2009” (August 26, 2010), www.bls.gov/news.release/disp.nr0.htm.
5. See Congressional Budget Office, Losing a Job During a Recession, Issue Brief (April 2010).
poor outcomes for displaced workers might be attribut-able to the decline of employment in a particular industry or state, rather than, for example, the closure of a specific firm. Displaced workers tend to have previously held jobs in industries, states, and occupations where employment is falling as a result of changes in markets and technolo-gies. Some of the earnings losses experienced by such workers probably reflect their inability to continue work-ing in those declining industries, states, or occupations
6. See Till von Wachter, Jae Song, and Joyce Manchester, “Long-Term Earnings Losses Due to Mass Layoffs During the 1982 Recession: An Analysis Using U.S. Administrative Data from 1974 to 2004” (draft, Columbia University, April 2009), www.columbia.edu/~vw2112.
7. See Ann Huff Stevens, “Persistent Effects of Job Displacement: The Importance of Multiple Job Losses,” Journal of Labor Economics, vol. 15, no. 1, part 1 (January 1997), pp. 165–188.
UNDERSTANDING AND RESPONDING TO PERSISTENTLY HIGH UNEMPLOYMENT 5
Table 1.
Characteristics of the Labor Force and the Unemployed, March 2011(Percent)
Source: Congressional Budget Office based on the March 2011 Current Population Survey.
Notes: The labor force comprises people ages 16 and older who have a job or who are jobless but available for work and actively seeking employment.
The long-term unemployed have been unemployed for more than 26 weeks.
a. People are not officially considered unemployed unless they are in the labor force.
b. Categories do not apply to all people in the labor force.
Sex53 59 5947 41 41
Educational Attainment38 58 5430 27 2921 12 1211 4 5
Marital Status57 39 4143 61 59
Race or Ethnicity67 55 5315 20 1811 19 22
7 6 7
Industry47 39 3910 10 12
7 14 1234 29 30
1 8 8
Reason for Unemploymentb 62 62b 23 25b 8 8b 7 5
Age14 26 1968 61 6419 13 17
Region36 35 3523 27 2722 21 2118 17 17Northeast
25 to 5455 to 69
SouthWestMidwest
Lost job involuntarilyReentered the labor forceEntered labor force for first timeLeft job voluntarily
16 to 24
Service
Other
ManufacturingConstruction
No industry history
Labor Force Unemployeda Long-Term Unemployed
CaucasianHispanicAfrican AmericanOther
MaleFemale
High school diploma or lessSome collegeBachelor's degreeGraduate degree
Not marriedMarried
CBO
6 UNDERSTANDING AND RESPONDING TO PERSISTENTLY HIGH UNEMPLOYMENT
CBO
Continued
Box 2.
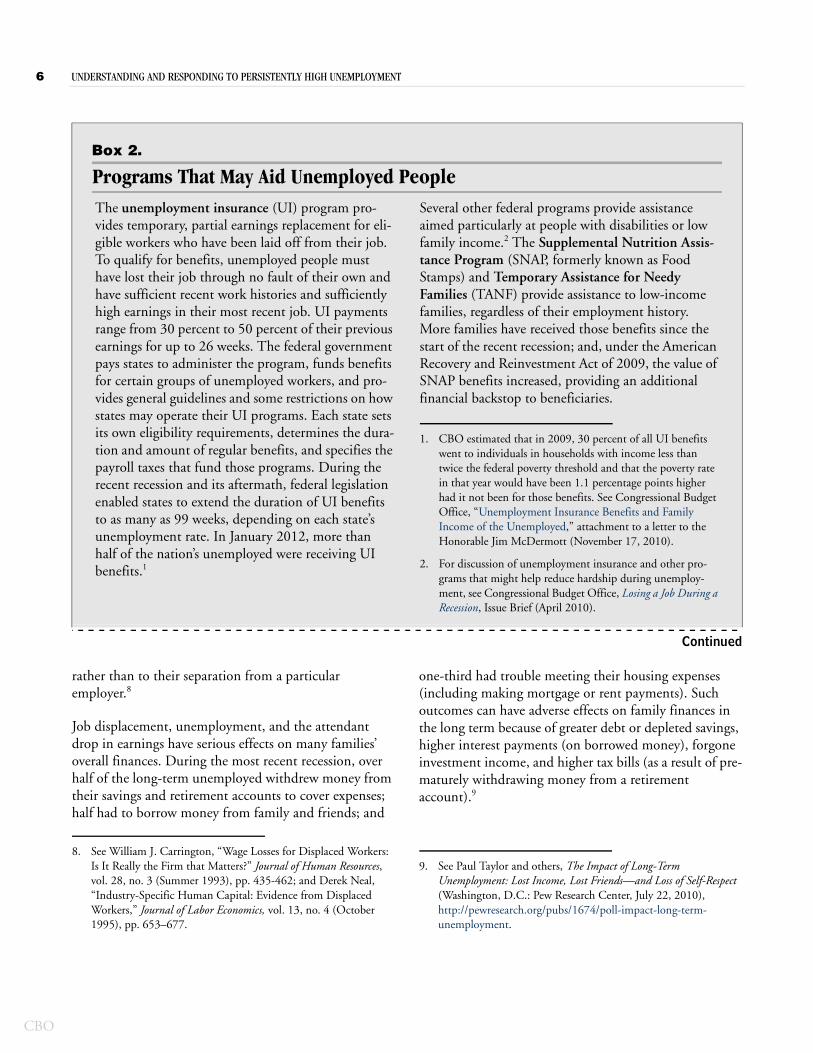
Programs That May Aid Unemployed People The unemployment insurance (UI) program pro-vides temporary, partial earnings replacement for eli-gible workers who have been laid off from their job. To qualify for benefits, unemployed people must have lost their job through no fault of their own and have sufficient recent work histories and sufficiently high earnings in their most recent job. UI payments range from 30 percent to 50 percent of their previous earnings for up to 26 weeks. The federal government pays states to administer the program, funds benefits for certain groups of unemployed workers, and pro-vides general guidelines and some restrictions on how states may operate their UI programs. Each state sets its own eligibility requirements, determines the dura-tion and amount of regular benefits, and specifies the payroll taxes that fund those programs. During the recent recession and its aftermath, federal legislation enabled states to extend the duration of UI benefits to as many as 99 weeks, depending on each state’s unemployment rate. In January 2012, more than half of the nation’s unemployed were receiving UI benefits.1
Several other federal programs provide assistance aimed particularly at people with disabilities or low family income.2 The Supplemental Nutrition Assis-tance Program (SNAP, formerly known as Food Stamps) and Temporary Assistance for Needy Families (TANF) provide assistance to low-income families, regardless of their employment history. More families have received those benefits since the start of the recent recession; and, under the American Recovery and Reinvestment Act of 2009, the value of SNAP benefits increased, providing an additional financial backstop to beneficiaries.
1. CBO estimated that in 2009, 30 percent of all UI benefits went to individuals in households with income less than twice the federal poverty threshold and that the poverty rate in that year would have been 1.1 percentage points higher had it not been for those benefits. See Congressional Budget Office, “Unemployment Insurance Benefits and Family Income of the Unemployed,” attachment to a letter to the Honorable Jim McDermott (November 17, 2010).
2. For discussion of unemployment insurance and other pro-grams that might help reduce hardship during unemploy-ment, see Congressional Budget Office, Losing a Job During a Recession, Issue Brief (April 2010).
rather than to their separation from a particular employer.8
Job displacement, unemployment, and the attendant drop in earnings have serious effects on many families’ overall finances. During the most recent recession, over half of the long-term unemployed withdrew money from their savings and retirement accounts to cover expenses; half had to borrow money from family and friends; and
8. See William J. Carrington, “Wage Losses for Displaced Workers: Is It Really the Firm that Matters?” Journal of Human Resources, vol. 28, no. 3 (Summer 1993), pp. 435-462; and Derek Neal, “Industry-Specific Human Capital: Evidence from Displaced Workers,” Journal of Labor Economics, vol. 13, no. 4 (October 1995), pp. 653–677.
one-third had trouble meeting their housing expenses (including making mortgage or rent payments). Such outcomes can have adverse effects on family finances in the long term because of greater debt or depleted savings, higher interest payments (on borrowed money), forgone investment income, and higher tax bills (as a result of pre-maturely withdrawing money from a retirement account).9
9. See Paul Taylor and others, The Impact of Long-Term Unemployment: Lost Income, Lost Friends—and Loss of Self-Respect (Washington, D.C.: Pew Research Center, July 22, 2010), http://pewresearch.org/pubs/1674/poll-impact-long-term-unemployment.
UNDERSTANDING AND RESPONDING TO PERSISTENTLY HIGH UNEMPLOYMENT 7
Box 2. Continued
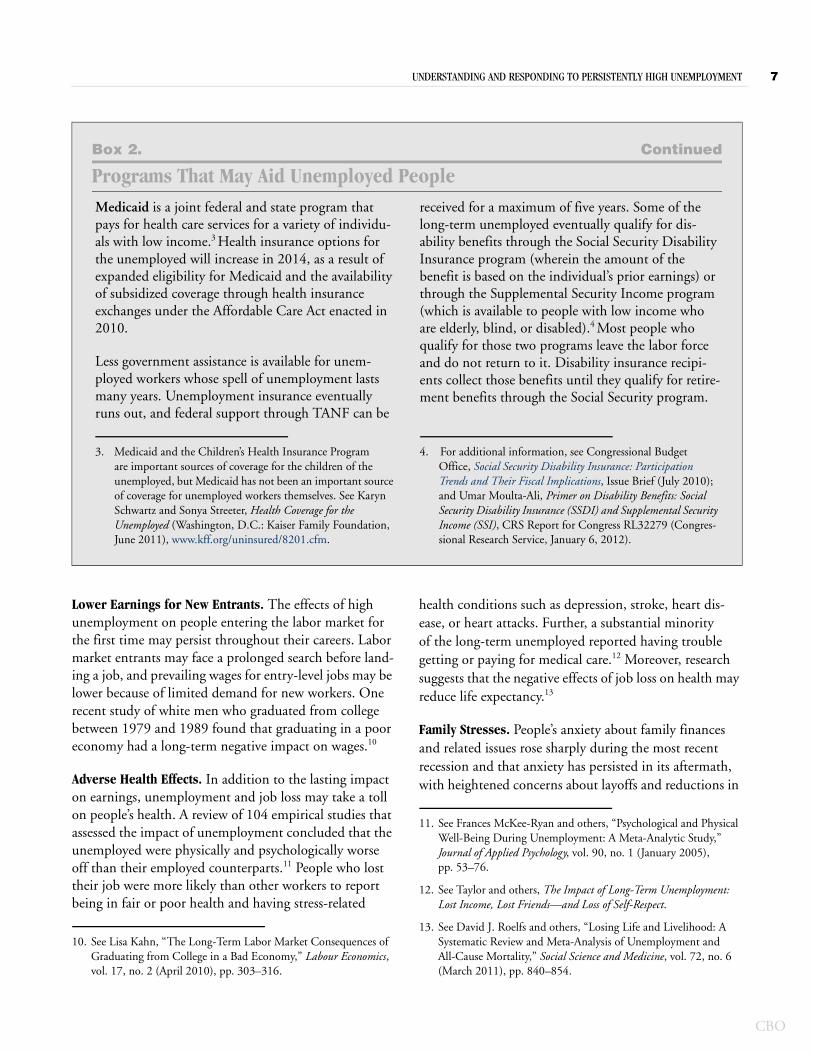
Programs That May Aid Unemployed People Medicaid is a joint federal and state program that pays for health care services for a variety of individu-als with low income.3 Health insurance options for the unemployed will increase in 2014, as a result of expanded eligibility for Medicaid and the availability of subsidized coverage through health insurance exchanges under the Affordable Care Act enacted in 2010.
Less government assistance is available for unem-ployed workers whose spell of unemployment lasts many years. Unemployment insurance eventually runs out, and federal support through TANF can be
received for a maximum of five years. Some of the long-term unemployed eventually qualify for dis-ability benefits through the Social Security Disability Insurance program (wherein the amount of the benefit is based on the individual’s prior earnings) or through the Supplemental Security Income program (which is available to people with low income who are elderly, blind, or disabled).4 Most people who qualify for those two programs leave the labor force and do not return to it. Disability insurance recipi-ents collect those benefits until they qualify for retire-ment benefits through the Social Security program.
3. Medicaid and the Children’s Health Insurance Program are important sources of coverage for the children of the unemployed, but Medicaid has not been an important source of coverage for unemployed workers themselves. See Karyn Schwartz and Sonya Streeter, Health Coverage for the Unemployed (Washington, D.C.: Kaiser Family Foundation, June 2011), www.kff.org/uninsured/8201.cfm.
4. For additional information, see Congressional Budget Office, Social Security Disability Insurance: Participation Trends and Their Fiscal Implications, Issue Brief (July 2010); and Umar Moulta-Ali, Primer on Disability Benefits: Social Security Disability Insurance (SSDI) and Supplemental Security Income (SSI), CRS Report for Congress RL32279 (Congres-sional Research Service, January 6, 2012).
Lower Earnings for New Entrants. The effects of high unemployment on people entering the labor market for the first time may persist throughout their careers. Labor market entrants may face a prolonged search before land-ing a job, and prevailing wages for entry-level jobs may be lower because of limited demand for new workers. One recent study of white men who graduated from college between 1979 and 1989 found that graduating in a poor economy had a long-term negative impact on wages.10
Adverse Health Effects. In addition to the lasting impact on earnings, unemployment and job loss may take a toll on people’s health. A review of 104 empirical studies that assessed the impact of unemployment concluded that the unemployed were physically and psychologically worse off than their employed counterparts.11 People who lost their job were more likely than other workers to report being in fair or poor health and having stress-related
10. See Lisa Kahn, “The Long-Term Labor Market Consequences of Graduating from College in a Bad Economy,” Labour Economics, vol. 17, no. 2 (April 2010), pp. 303–316.
health conditions such as depression, stroke, heart dis-ease, or heart attacks. Further, a substantial minority of the long-term unemployed reported having trouble getting or paying for medical care.12 Moreover, research suggests that the negative effects of job loss on health may reduce life expectancy.13
Family Stresses. People’s anxiety about family finances and related issues rose sharply during the most recent recession and that anxiety has persisted in its aftermath, with heightened concerns about layoffs and reductions in
11. See Frances McKee-Ryan and others, “Psychological and Physical Well-Being During Unemployment: A Meta-Analytic Study,” Journal of Applied Psychology, vol. 90, no. 1 (January 2005), pp. 53–76.
12. See Taylor and others, The Impact of Long-Term Unemployment: Lost Income, Lost Friends—and Loss of Self-Respect.
13. See David J. Roelfs and others, “Losing Life and Livelihood: A Systematic Review and Meta-Analysis of Unemployment and All-Cause Mortality,” Social Science and Medicine, vol. 72, no. 6 (March 2011), pp. 840–854.
CBO
8 UNDERSTANDING AND RESPONDING TO PERSISTENTLY HIGH UNEMPLOYMENT
CBO
wages, hours, or benefits.14 That anxiety has affected the employed as well as the unemployed.
The loss of income and elevated levels of household stress associated with a parent’s job loss, particularly if the period of unemployment is prolonged, can also have lasting effects on children. According to one study, about one in nine children lived with an unemployed parent in December 2009.15 Some research suggests that children whose fathers lose a job are at elevated risk of problems related to personality and emotional development, as well as with interpersonal relationships.16 Parental job loss and subsequent unemployment are also associated with poorer schooling outcomes for children.17 Ultimately, children of displaced workers, on average, have poorer economic outcomes as adults than the children of other-wise similar workers who have never experienced job loss.18
Factors Causing High UnemploymentIn December 2007, the unemployment rate was 5.0 per-cent. Four years later, in December 2011 (when CBO
14. See Steven J. Davis and Till Von Wachter, “Recessions and the Costs of Job Loss” (draft, Columbia University, November 2011), www.columbia.edu/~vw2112; and Cliff Zukin, Carl Van Horn, and Charley Stone, Out of Work and Losing Hope: The Misery and Bleak Expectations of American Workers, Heldrich Center for Workforce Development of Rutgers University (September 2011), www.heldrich.rutgers.edu/news-updates/all/out-work-and-losing-hope-misery-and-bleak-expectations-american-workers.
15. See Phillip Lovell and Julia B. Isaacs, Families of the Recession: Unemployed Parents and Their Children (Washington, D.C.: First Focus Campaign for Children, June 2010), www.brookings.edu/papers/2010/0114_families_recession_isaacs.aspx.
16. See Vonnie C. McLoyd, “Socialization and Development in a Changing Economy: The Effects of Paternal Job and Income Loss on Children,” American Psychologist, vol. 44, no. 2 (February 1989), pp. 293–302.
17. See Ann Huff Stevens and Jessamyn Schaller, “Short-Run Effects of Parental Job Loss on Children’s Academic Achievement,” Eco-nomics of Education Review, vol. 30, no. 2 (April 2011), pp. 289–299; and Ariel Kalil and Patrick Wightman, “Parental Job Loss and Children’s Educational Attainment in Black and White Middle-Class Families,” Social Science Quarterly, vol. 92, no. 1 (March 2011), pp. 57–78.
18. See Philip Oreopoulos, Marianne Page, and Ann Huff Stevens, “The Intergenerational Effects of Worker Displacement,” Journal of Labor Economics, vol. 26, no. 3 (July 2008), pp. 455–483.
completed its most recent economic forecast), that rate was 8.5 percent. CBO has estimated that the three-and-a-half percentage-point increase in the unemployment rate over that period could be attributed to four factors in the following amounts:
Weak demand for goods and services as a result of the recession and its aftermath, which accounts for about two-and-a-half percentage points;
Mismatches between the needs of employers and the skills and location of the unemployed, which account for about one-half of one percentage point;
Incentives from extensions of unemployment insur-ance for people to stay in the labor force and continue searching for work, which account for about one-quarter of one percentage point; and
Erosion of skills and the stigma attached to long-term unemployment—that is, employers’ perception that people who have been unemployed for a long time would be low-quality workers—which together account for about one-quarter of one percentage point.
Thus, in CBO’s judgment, roughly a third of the net increase in unemployment over that four-year period has stemmed from factors other than weak demand. Some evidence for those other causes comes from shifts in the relationship between the job vacancy rate (the ratio of job openings to the sum of job openings and employment) and the unemployment rate, which is known as the Beveridge Curve. An increase in the unemployment rate relative to the job vacancy rate may suggest that unem-ployed workers are facing unusual difficulties finding suitable employment among the available job opportuni-ties.19 One recent study indicates such a shift in the rela-tionship depicted by the Beveridge Curve: Before the recession, a job vacancy rate of 3.0 percent was associated with an unemployment rate of 5.0 percent; but, as of
19. See, for example, remarks by Narayana Kocherlakota, president of the Federal Reserve Bank of Minneapolis, “Inside the FOMC” (presented in Marquette, Michigan, August 17, 2010), www.minneapolisfed.org/news_events/pres/speech_display.cfm?id=4525.
UNDERSTANDING AND RESPONDING TO PERSISTENTLY HIGH UNEMPLOYMENT 9
June 2011, that same 3.0 percent job vacancy rate was associated with an unemployment rate of 6.4 percent.20
In that study, about 1 percentage point of the elevated unemployment rate was attributed to skill and locational mismatches, extended unemployment insurance, and other factors. That finding is consistent with CBO’s esti-mate that about 1 percentage point of the increase in the unemployment rate can be attributed to factors other than weak current demand.
Weak aggregate demand is also the primary contributor to the increased average duration of unemployment; the incentives from the extensions of unemployment insur-ance benefits and changes in the characteristics of the unemployed played smaller roles.21
Weak Demand for Goods and ServicesMost of the increase in unemployment during the past four years and its persistence at a high level have resulted from a cyclical decline in the demand for goods and ser-vices, which has, in turn, decreased employers’ demand for workers. Under current law, the cyclical weakness in demand stemming from the recent recession and slow recovery is likely to persist for the next few years; this cyclical weakness will continue to elevate the unemploy-ment rate, though by diminishing amounts, through 2017, CBO estimates.
That weak demand can be attributed to various factors. Household spending fell and has remained weak, damp-ened by a loss of household wealth, an extraordinary decline in labor’s share of national income, a desire by families and businesses to reduce debt as well as tightened lending conditions, and increased uncertainty and pessimism—in part reflecting the poor state of the job market. Residential construction has been anemic, held down by overbuilding during the boom, by poor expecta-tions for future house prices, and, to a lesser degree, by weak household formation—which, like households’ uncertainty and pessimism, in part reflects the poor state
20. See Mary Daly and others, A Rising Natural Rate of Unemploy-ment: Transitory or Permanent? Working Paper 2011-05 (Federal Reserve Bank of San Francisco, September 2011), www.frbsf.org/publications/economics/papers/2011/wp11-05bk.pdf.
21. See Rob Valletta and Katherine Kuang, Why Is Unemployment Duration So Long? Economic Letter 2012-03 (Federal Reserve Bank of San Francisco, September 2011), www.frbsf.org/publications/economics/letter/2012/el2012-03.pdf.
of the job market. Cutbacks by state and local govern-ments have left government employment about 1.7 per-cent lower at the end of 2011 than it was at the end of 2007, just prior to the recession.
Moreover, business investment plunged during the reces-sion, as businesses reacted to a decline in aggregate demand, a very uncertain outlook, and tightening credit. Since the recession’s end, growth in business investment has been a bright spot, relatively speaking, although busi-ness investment and hiring are still being restrained by businesses’ expectations that aggregate demand will con-tinue to grow only moderately. In addition, some busi-nesses may be concerned about how they will be affected by the implementation of recently enacted legislation dealing with the financial system and health care, by the government’s regulatory policies in other areas, and by possible future changes in federal tax and spending policies.22 However, the degree to which each of those factors has restrained investment and hiring is difficult to determine.
Mismatches Between Employers’ Needs and the Skills and Location of WorkersA distinctive feature of the U.S. labor market is its dyna-mism. Individual employers grow and shrink in response to changes in demand and business success, workers often change jobs as they seek out a position that best fits their skills and interests, and there are always shifts in the econ-omy resulting from changes in technology, consumer preferences, and international trade, which have dispro-portionate effects on certain industries, occupations, and locations. The need for workers to shift from one indus-try or occupation to another, to acquire new skills to facilitate such a shift, or even to relocate in order to find a new job is often referred to as a skill or locational mis-match. Those factors mean that there will always be some unemployment—which has ranged from about 4 percent to 5 percent in recent decades—as firms with unfilled openings and workers looking for jobs sort themselves into the most productive matches. Economists refer to that type of unemployment as frictional and view it as an important information-gathering process that leads to improved matches between workers and employers (although government policies that facilitate or hinder
22. See Scott Baker, Nick Bloom, and Steven J. Davis, Has Economic Policy Uncertainty Hampered the Recovery? Chicago Booth Research Paper 12-06 (University of Chicago, February 2012).
CBO
10 UNDERSTANDING AND RESPONDING TO PERSISTENTLY HIGH UNEMPLOYMENT
CBO
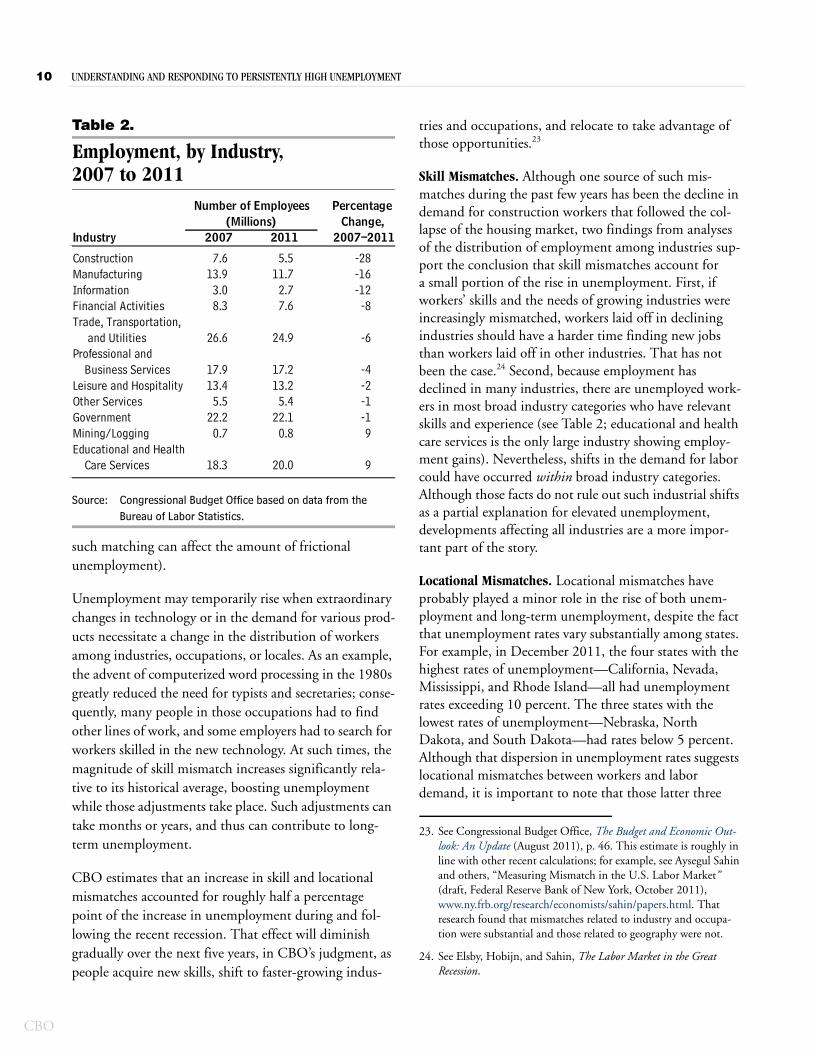
Table 2.
Employment, by Industry, 2007 to 2011
Source: Congressional Budget Office based on data from the Bureau of Labor Statistics.
such matching can affect the amount of frictional unemployment).
Unemployment may temporarily rise when extraordinary changes in technology or in the demand for various prod-ucts necessitate a change in the distribution of workers among industries, occupations, or locales. As an example, the advent of computerized word processing in the 1980s greatly reduced the need for typists and secretaries; conse-quently, many people in those occupations had to find other lines of work, and some employers had to search for workers skilled in the new technology. At such times, the magnitude of skill mismatch increases significantly rela-tive to its historical average, boosting unemployment while those adjustments take place. Such adjustments can take months or years, and thus can contribute to long-term unemployment.
CBO estimates that an increase in skill and locational mismatches accounted for roughly half a percentage point of the increase in unemployment during and fol-lowing the recent recession. That effect will diminish gradually over the next five years, in CBO’s judgment, as people acquire new skills, shift to faster-growing indus-
Industry
Construction 7.6 5.5 -28Manufacturing 13.9 11.7 -16Information 3.0 2.7 -12Financial Activities 8.3 7.6 -8Trade, Transportation,
and Utilities 26.6 24.9 -6Professional and
Business Services 17.9 17.2 -4Leisure and Hospitality 13.4 13.2 -2Other Services 5.5 5.4 -1Government 22.2 22.1 -1Mining/Logging 0.7 0.8 9Educational and Health
Care Services 18.3 20.0 9
Number of Employees Percentage(Millions) Change,
2007 2011 2007–2011
tries and occupations, and relocate to take advantage of those opportunities.23
Skill Mismatches. Although one source of such mis-matches during the past few years has been the decline in demand for construction workers that followed the col-lapse of the housing market, two findings from analyses of the distribution of employment among industries sup-port the conclusion that skill mismatches account for a small portion of the rise in unemployment. First, if workers’ skills and the needs of growing industries were increasingly mismatched, workers laid off in declining industries should have a harder time finding new jobs than workers laid off in other industries. That has not been the case.24 Second, because employment has declined in many industries, there are unemployed work-ers in most broad industry categories who have relevant skills and experience (see Table 2; educational and health care services is the only large industry showing employ-ment gains). Nevertheless, shifts in the demand for labor could have occurred within broad industry categories. Although those facts do not rule out such industrial shifts as a partial explanation for elevated unemployment, developments affecting all industries are a more impor-tant part of the story.
Locational Mismatches. Locational mismatches have probably played a minor role in the rise of both unem-ployment and long-term unemployment, despite the fact that unemployment rates vary substantially among states. For example, in December 2011, the four states with the highest rates of unemployment—California, Nevada, Mississippi, and Rhode Island—all had unemployment rates exceeding 10 percent. The three states with the lowest rates of unemployment—Nebraska, North Dakota, and South Dakota—had rates below 5 percent. Although that dispersion in unemployment rates suggests locational mismatches between workers and labor demand, it is important to note that those latter three
23. See Congressional Budget Office, The Budget and Economic Out-look: An Update (August 2011), p. 46. This estimate is roughly in line with other recent calculations; for example, see Aysegul Sahin and others, “Measuring Mismatch in the U.S. Labor Market” (draft, Federal Reserve Bank of New York, October 2011), www.ny.frb.org/research/economists/sahin/papers.html. That research found that mismatches related to industry and occupa-tion were substantial and those related to geography were not.
24. See Elsby, Hobijn, and Sahin, The Labor Market in the Great Recession.
UNDERSTANDING AND RESPONDING TO PERSISTENTLY HIGH UNEMPLOYMENT 11
states have small populations and a very small share of the nation’s jobs; in contrast, all 10 of the largest states cur-rently have higher unemployment rates. Thus, national unemployment would not decline sharply even if unem-ployed workers flocked to states with the lowest rates of unemployment.
The severity of locational mismatches may be exacerbated if workers cannot relocate because they are unable to sell their houses. In historical terms, a large number of home-owners are “underwater”—that is, their houses are worth less than what they owe on their mortgages. Some ana-lysts suggest that homeowners who are underwater may be unable to move to locales where labor demand is stronger and where they might find work. Whether that is occurring is unclear, however: Three recent studies arrive at disparate conclusions as to whether homeowners with negative equity have been less mobile than other homeowners.25
Incentives from Extensions of Unemployment InsuranceThe UI system helps unemployed workers and their fam-ilies in several ways. Most directly, the system provides income support to people who have lost their job for rea-sons other than poor performance or misconduct. Research has shown that UI helps recipients to maintain their standard of living after losing a job. Research also suggests that UI allows job seekers to take a more entre-preneurial career path—which can be productive but risky—than they would have taken in the absence of such insurance.26
UI also encourages laid-off workers to continue searching for work rather than leaving the labor force, because con-tinued receipt of UI benefits requires them to be actively
25. See Fernando Ferreira, Joseph Gyourko, and Joseph Tracy, “Housing Busts and Household Mobility,” Journal of Urban Economics, vol. 68, no. 1 (July 2010), pp. 34–45; Sam Schulhofer-Wohl, Negative Equity Does Not Reduce Homeowners’ Mobility, Working Paper 682 (Federal Reserve Bank of Minneapolis, December 2010), www.minneapolisfed.org/publications_papers/pub_display.cfm?id=4598; and Fernando Ferreira, Joseph Gyourko, and Joseph Tracy, Housing Busts and Household Mobility: An Update, Staff Report 526 (Federal Reserve Bank of New York, November 2011), http://newyorkfed.org/research/staff_reports/sr526.html.
26. See Daron Acemoglu and Robert Shimer, “Productivity Gains from Unemployment Insurance,” European Economic Review, vol. 44, no. 7 (June 2000), pp. 1195–1224.
looking for work. That requirement to search for work results in some laid-off workers returning to work rather than leaving the workforce altogether. However, the avail-ability of UI also discourages unemployed people from taking a job they might consider unsuitable because those benefits reduce the hardship of being unemployed. Econ-omists have traditionally viewed that effect as significant. One widely cited study from 1990 found that eligibility for five extra weeks of benefits led to, on average, a one-week increase in the length of an unemployment spell.27 More-recent studies have suggested, however, that only about 40 percent of that one-week increase in the dura-tion of unemployment was the result of a diminished incentive to take a job; the remaining 60 percent of that increase represented an expanded search effort, which can ultimately result in better job matches.28
In addition, the availability of UI benefits affects the employment of prospective workers who are ineligible for benefits, such as those who are new entrants or reentrants to the labor force. For example, to the extent that people who are receiving benefits are less likely to accept avail-able jobs, those who are not receiving benefits are more likely to obtain and accept job offers. Moreover, by put-ting money in the hands of people who spend much of it on goods and services, UI benefits increase the demand for workers needed to produce those goods and services, indirectly raising total employment compared with what it otherwise would be. Thus, the effects of UI benefits on overall employment and unemployment differ from their effects on the employment and unemployment of recipi-ents alone.
Because of the various ways that UI benefits affect peo-ple’s incentives and opportunities, analyzing the impact of the extensions of benefits (from the usual 26 weeks up to 99 weeks) during the recession and its aftermath is
27. See Lawrence F. Katz and Bruce D. Meyer, “The Impact of the Potential Duration of Unemployment Benefits on the Duration of Unemployment,” Journal of Public Economics, vol. 41, no. 1 (February 1990), pp. 45–72. For more recent evidence, see David Card and Phillip B. Levine, “Extended Benefits and the Duration of UI Spells: Evidence from the New Jersey Extended Benefit Program,” Journal of Public Economics, vol. 78, no. 1-2 (October 2000), pp. 107–138.
28. For example, see Raj Chetty, “Moral Hazard Versus Liquidity and Optimal Unemployment Insurance,” Journal of Political Economy, vol. 116, no. 2 (April 2008), pp. 173–234.
CBO
12 UNDERSTANDING AND RESPONDING TO PERSISTENTLY HIGH UNEMPLOYMENT
CBO
difficult. The extensions of benefits have had two types of effects:
They have increased recipients’ spending and, thus, the demand for goods and services in the economy as a whole, which has tended to raise employment and reduce unemployment. CBO estimates that the two-and-a-half percentage point increase in unemploy-ment resulting from weak demand would have been greater without the extensions of benefits.
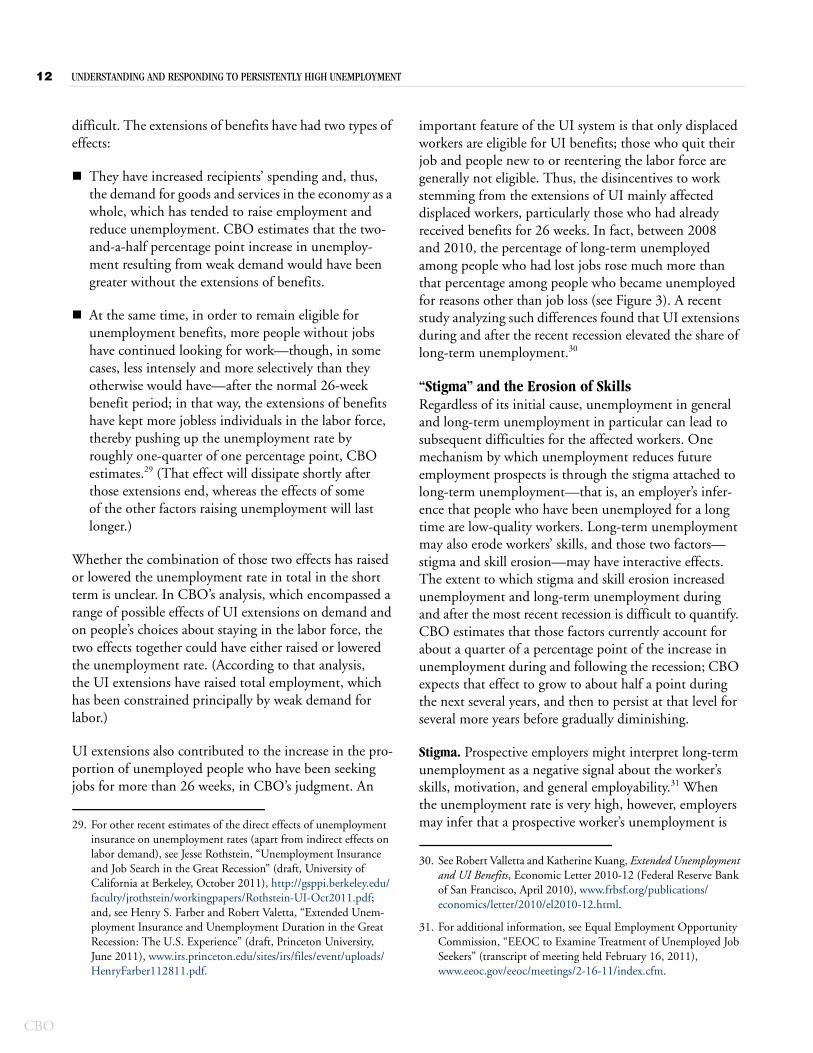
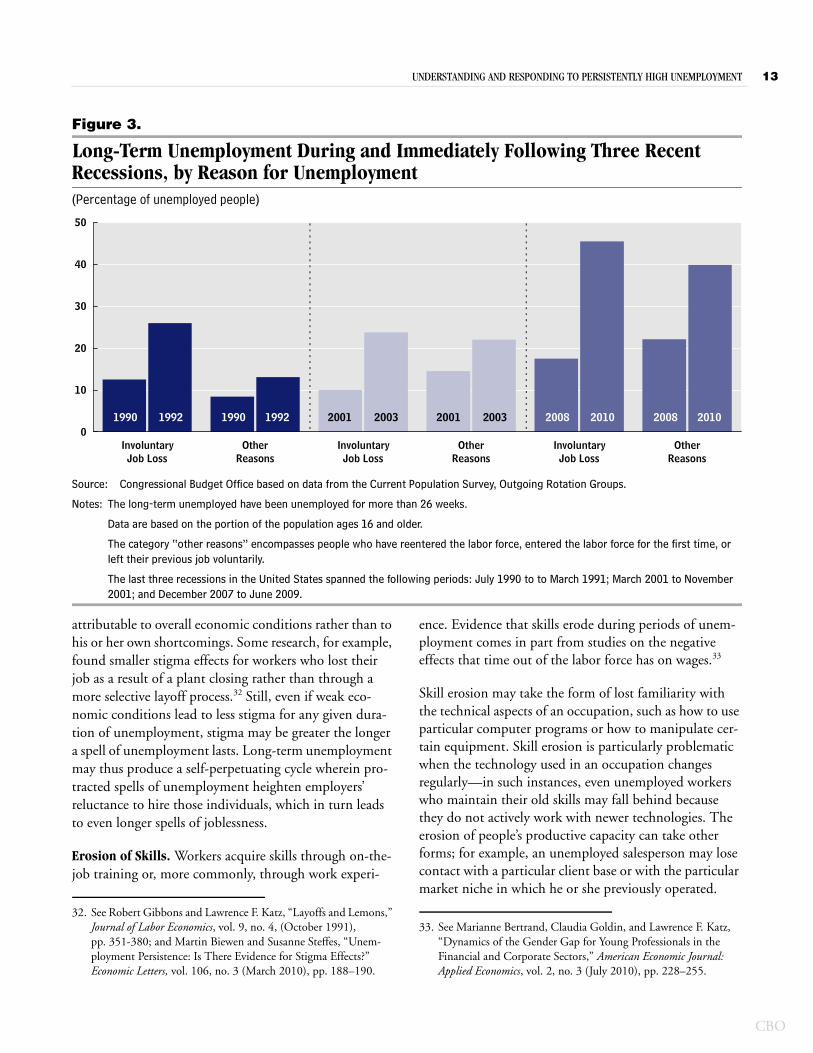
At the same time, in order to remain eligible for unemployment benefits, more people without jobs have continued looking for work—though, in some cases, less intensely and more selectively than they otherwise would have—after the normal 26-week benefit period; in that way, the extensions of benefits have kept more jobless individuals in the labor force, thereby pushing up the unemployment rate by roughly one-quarter of one percentage point, CBO estimates.29 (That effect will dissipate shortly after those extensions end, whereas the effects of some of the other factors raising unemployment will last longer.)
Whether the combination of those two effects has raised or lowered the unemployment rate in total in the short term is unclear. In CBO’s analysis, which encompassed a range of possible effects of UI extensions on demand and on people’s choices about staying in the labor force, the two effects together could have either raised or lowered the unemployment rate. (According to that analysis, the UI extensions have raised total employment, which has been constrained principally by weak demand for labor.)
UI extensions also contributed to the increase in the pro-portion of unemployed people who have been seeking jobs for more than 26 weeks, in CBO’s judgment. An
29. For other recent estimates of the direct effects of unemployment insurance on unemployment rates (apart from indirect effects on labor demand), see Jesse Rothstein, “Unemployment Insurance and Job Search in the Great Recession” (draft, University of California at Berkeley, October 2011), http://gsppi.berkeley.edu/faculty/jrothstein/workingpapers/Rothstein-UI-Oct2011.pdf; and, see Henry S. Farber and Robert Valetta, “Extended Unem-ployment Insurance and Unemployment Duration in the Great Recession: The U.S. Experience” (draft, Princeton University, June 2011), www.irs.princeton.edu/sites/irs/files/event/uploads/HenryFarber112811.pdf.
important feature of the UI system is that only displaced workers are eligible for UI benefits; those who quit their job and people new to or reentering the labor force are generally not eligible. Thus, the disincentives to work stemming from the extensions of UI mainly affected displaced workers, particularly those who had already received benefits for 26 weeks. In fact, between 2008 and 2010, the percentage of long-term unemployed among people who had lost jobs rose much more than that percentage among people who became unemployed for reasons other than job loss (see Figure 3). A recent study analyzing such differences found that UI extensions during and after the recent recession elevated the share of long-term unemployment.30
“Stigma” and the Erosion of SkillsRegardless of its initial cause, unemployment in general and long-term unemployment in particular can lead to subsequent difficulties for the affected workers. One mechanism by which unemployment reduces future employment prospects is through the stigma attached to long-term unemployment—that is, an employer’s infer-ence that people who have been unemployed for a long time are low-quality workers. Long-term unemployment may also erode workers’ skills, and those two factors—stigma and skill erosion—may have interactive effects. The extent to which stigma and skill erosion increased unemployment and long-term unemployment during and after the most recent recession is difficult to quantify. CBO estimates that those factors currently account for about a quarter of a percentage point of the increase in unemployment during and following the recession; CBO expects that effect to grow to about half a point during the next several years, and then to persist at that level for several more years before gradually diminishing.
Stigma. Prospective employers might interpret long-term unemployment as a negative signal about the worker’s skills, motivation, and general employability.31 When the unemployment rate is very high, however, employers may infer that a prospective worker’s unemployment is
30. See Robert Valletta and Katherine Kuang, Extended Unemployment and UI Benefits, Economic Letter 2010-12 (Federal Reserve Bank of San Francisco, April 2010), www.frbsf.org/publications/economics/letter/2010/el2010-12.html.
31. For additional information, see Equal Employment Opportunity Commission, “EEOC to Examine Treatment of Unemployed Job Seekers” (transcript of meeting held February 16, 2011), www.eeoc.gov/eeoc/meetings/2-16-11/index.cfm.
UNDERSTANDING AND RESPONDING TO PERSISTENTLY HIGH UNEMPLOYMENT 13
Figure 3.
Long-Term Unemployment During and Immediately Following Three Recent Recessions, by Reason for Unemployment(Percentage of unemployed people)
Source: Congressional Budget Office based on data from the Current Population Survey, Outgoing Rotation Groups.
Notes: The long-term unemployed have been unemployed for more than 26 weeks.
Data are based on the portion of the population ages 16 and older.
The category “other reasons” encompasses people who have reentered the labor force, entered the labor force for the first time, or left their previous job voluntarily.
The last three recessions in the United States spanned the following periods: July 1990 to to March 1991; March 2001 to November 2001; and December 2007 to June 2009.
InvoluntaryJob Loss
OtherReasons
InvoluntaryJob Loss
OtherReasons
InvoluntaryJob Loss
OtherReasons
0
10
20
30
40
50
1990 19901992 1992 2001 2003 2001 2003 2008 2010 2008 2010
attributable to overall economic conditions rather than to his or her own shortcomings. Some research, for example, found smaller stigma effects for workers who lost their job as a result of a plant closing rather than through a more selective layoff process.32 Still, even if weak eco-nomic conditions lead to less stigma for any given dura-tion of unemployment, stigma may be greater the longer a spell of unemployment lasts. Long-term unemployment may thus produce a self-perpetuating cycle wherein pro-tracted spells of unemployment heighten employers’ reluctance to hire those individuals, which in turn leads to even longer spells of joblessness.
Erosion of Skills. Workers acquire skills through on-the-job training or, more commonly, through work experi-
32. See Robert Gibbons and Lawrence F. Katz, “Layoffs and Lemons,” Journal of Labor Economics, vol. 9, no. 4, (October 1991), pp. 351-380; and Martin Biewen and Susanne Steffes, “Unem-ployment Persistence: Is There Evidence for Stigma Effects?” Economic Letters, vol. 106, no. 3 (March 2010), pp. 188–190.
ence. Evidence that skills erode during periods of unem-ployment comes in part from studies on the negative effects that time out of the labor force has on wages.33
Skill erosion may take the form of lost familiarity with the technical aspects of an occupation, such as how to use particular computer programs or how to manipulate cer-tain equipment. Skill erosion is particularly problematic when the technology used in an occupation changes regularly—in such instances, even unemployed workers who maintain their old skills may fall behind because they do not actively work with newer technologies. The erosion of people’s productive capacity can take other forms; for example, an unemployed salesperson may lose contact with a particular client base or with the particular market niche in which he or she previously operated.
33. See Marianne Bertrand, Claudia Goldin, and Lawrence F. Katz, “Dynamics of the Gender Gap for Young Professionals in the Financial and Corporate Sectors,” American Economic Journal: Applied Economics, vol. 2, no. 3 (July 2010), pp. 228–255.
CBO
14 UNDERSTANDING AND RESPONDING TO PERSISTENTLY HIGH UNEMPLOYMENT
CBO
Although the specific knowledge that is lost or made obsolete varies by industry and occupation, some erosion probably occurs in all but the most low-skilled jobs, and the erosion of skills is a pervasive problem among the long-term unemployed.
Policies to Increase Demand for WorkersPolicies that increase demand for workers address the sin-gle most important factor behind today’s persistently high unemployment rates—weak demand for goods and ser-vices. CBO has previously assessed the potential impact of a variety of temporary fiscal policy actions that might promote economic growth and increase employment in the near term.34 This section summarizes those earlier estimates and the agency’s findings about other options that could affect the demand for workers.
Fiscal PoliciesEach of the policy options that CBO previously analyzed would primarily affect the economy in one of three differ-ent ways:
By boosting households’ disposable income,
By providing support to businesses, or
By increasing aid to state governments or government spending on infrastructure.
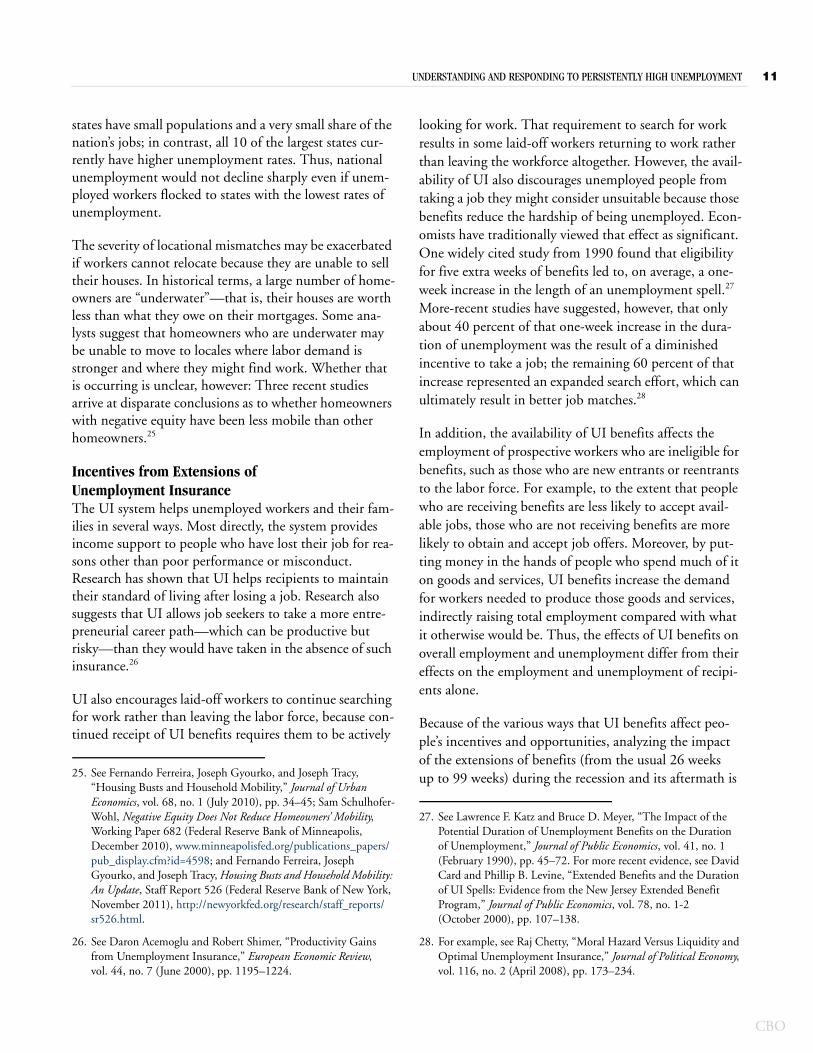
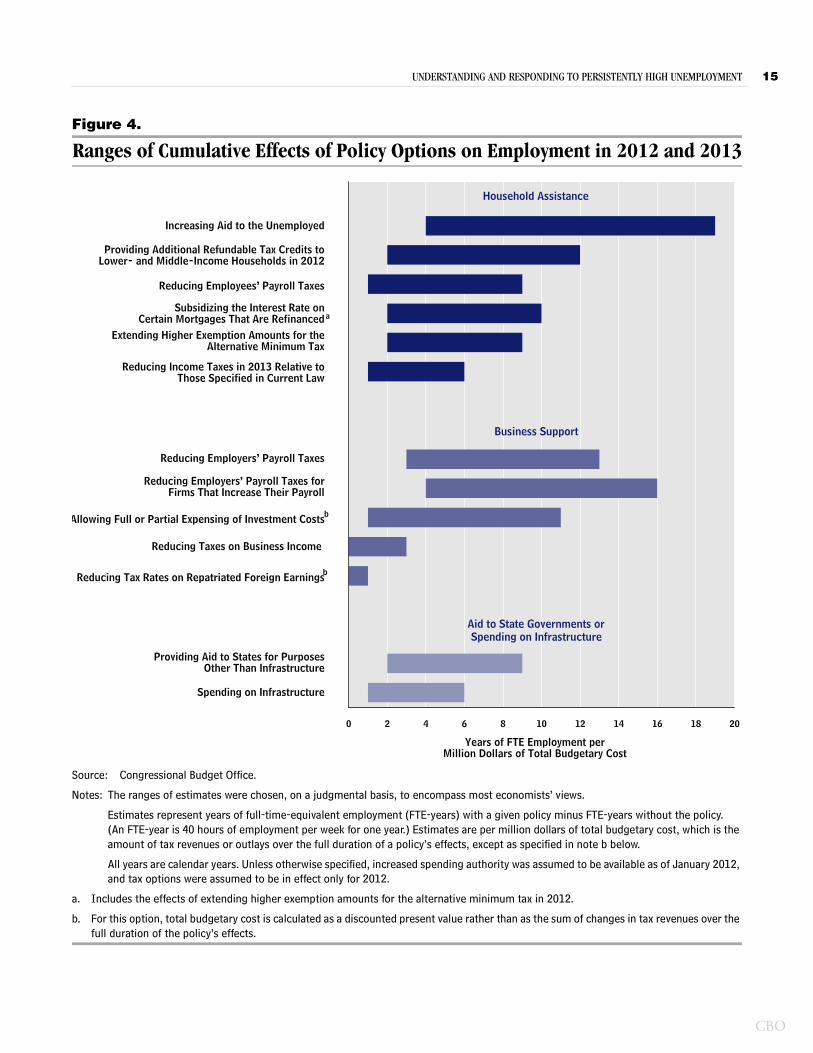
Using evidence from empirical studies and econometric models, CBO assessed the impact of such policies on the nation’s output (GDP) and total employment in 2012 and 2013 per million dollars of total budgetary cost (measured in terms of additional government spending or reduction in taxes). To encompass most economists’ views about the effects of each type of policy, CBO used low and high estimates of the effects on output and employment. By CBO’s estimates, the impact of the poli-cies would range from a very small increase in employ-ment to an increase of as much as 19 years of full-time- equivalent (FTE) employment per million dollars of budgetary cost over that two-year span (see Figure 4).
34. See the statement of Douglas W. Elmendorf, Director, Congres-sional Budget Office, before the Senate Committee on the Budget, Policies for Increasing Economic Growth and Employment in 2012 and 2013 (November 15, 2011).
(An FTE-year is 40 hours of employment per week for one year.)
On the basis of that analysis, CBO concluded the following:
Policies that would have the largest effects on employ-ment per dollar of budgetary cost in 2012 and 2013 are those that would reduce the marginal cost to busi-nesses of adding employees or that would target peo-ple most likely to spend the additional income. Such policies include reducing employers’ payroll taxes (especially if limited to firms that increase their pay-roll), increasing aid to the unemployed, and providing additional refundable tax credits in 2012 for lower- and middle-income households; and
Policies that would primarily affect businesses’ cash flow but would have little impact on their marginal incentives to hire or invest would have only small effects. Such policies include reducing business income taxes and reducing tax rates on repatriated foreign earnings.
All of the options that CBO considered were sufficiently scalable—that is, able to be increased in size in an effi-cient manner—such that they could entail at least $10 billion in spending increases or tax cuts in 2012 and 2013. The estimated effects of the policies on economic output varied from as little as 10 cents per dollar of bud-getary cost to as much as $1.90 per dollar of budgetary cost. A rough rule-of-thumb applicable to the policies shown in Figure 4 would be the following: An additional $30 billion used in 2012 for an option that would boost employment in 2012 and 2013 by about 9 FTE-years per million dollars of total budgetary cost would translate into a reduction in the unemployment rate of one-tenth of one percentage point (say, at the beginning of 2013). Thus, changes in fiscal policy, if appropriately designed and large in scale, could substantially reduce unemploy-ment during the next few years.35
35. A recent example of a large-scale fiscal policy action is the Ameri-can Recovery and Reinvestment Act of 2009 (ARRA), which by CBO’s estimate will ultimately have a budgetary cost of about $825 billion, reduced the unemployment rate in 2010 by between 0.4 and 1.8 percentage points. See Congressional Budget Office, Estimated Impact of the American Recovery and Reinvestment Act on Employment and Economic Output from July 2011 Through Septem-ber 2011 (November 2011).
UNDERSTANDING AND RESPONDING TO PERSISTENTLY HIGH UNEMPLOYMENT 15
Figure 4.
Ranges of Cumulative Effects of Policy Options on Employment in 2012 and 2013
Source: Congressional Budget Office.
Notes: The ranges of estimates were chosen, on a judgmental basis, to encompass most economists’ views.
Estimates represent years of full-time-equivalent employment (FTE-years) with a given policy minus FTE-years without the policy. (An FTE-year is 40 hours of employment per week for one year.) Estimates are per million dollars of total budgetary cost, which is the amount of tax revenues or outlays over the full duration of a policy’s effects, except as specified in note b below.
All years are calendar years. Unless otherwise specified, increased spending authority was assumed to be available as of January 2012, and tax options were assumed to be in effect only for 2012.
a. Includes the effects of extending higher exemption amounts for the alternative minimum tax in 2012.
b. For this option, total budgetary cost is calculated as a discounted present value rather than as the sum of changes in tax revenues over the full duration of the policy’s effects.
Spending on Infrastructure
Providing Aid to States for PurposesOther Than Infrastructure
Reducing Tax Rates on Repatriated Foreign Earningsb
Reducing Taxes on Business Income
Allowing Full or Partial Expensing of Investment Costsb
Reducing Employers’ Payroll Taxes forFirms That Increase Their Payroll
Reducing Employers’ Payroll Taxes
Reducing Income Taxes in 2013 Relative toThose Specified in Current Law
Extending Higher Exemption Amounts for theAlternative Minimum Tax
Subsidizing the Interest Rate onCertain Mortgages That Are Refinanced
Reducing Employees’ Payroll Taxes
Providing Additional Refundable Tax Credits toLower- and Middle-Income Households in 2012
Increasing Aid to the Unemployed
0 2 4 6 8 10 12 14 16 18 20
Household Assistance
Business Support
Years of FTE Employment perMillion Dollars of Total Budgetary Cost
Aid to State Governments orSpending on Infrastructure
a
CBO
16 UNDERSTANDING AND RESPONDING TO PERSISTENTLY HIGH UNEMPLOYMENT
CBO
Those policy actions would generally decrease FTE-years of unemployment by the same amount that they would increase FTE-years of employment, with the exception of the option of increasing benefits for unemployment insurance. In the current economic climate, extensions of UI benefits affect the labor market through some chan-nels that tend to increase the number of employed people (such as by increasing demand for goods and services). However, such extensions also tend to increase the num-ber of unemployed people (for example, because more jobless workers choose to remain in the labor force in order to receive benefits). Thus, the net effect of addi-tional spending for unemployment insurance on the number of unemployed people is unclear.36
Policies not analyzed in CBO’s previous work, such as direct government employment in public service jobs, could also reduce unemployment. The federal government hired millions of unemployed workers dur-ing the Great Depression through the Work Projects Administration and the Civilian Conservation Corps. More recently, under the American Recovery and Rein-vestment Act, the federal government provided aid to states to place applicants to the Temporary Assistance to Needy Families (TANF) program in jobs.37 It might be difficult, however, to efficiently and productively imple-ment a program involving direct hiring on a scale at which spending would exceed $10 billion in 2012 and 2013—a criterion that CBO used when selecting policies to analyze in its previous work.
The fiscal policy approaches discussed above would increase total demand for workers, although some—such as tax credits for firms that expand payroll—
36. According to CBO’s low estimate, which incorporates a smaller effect on demand and a larger effect on people’s choices about staying in the labor force, an extension of UI benefits would cause unemployment to increase. Conversely, according to the agency’s high estimate, which incorporates a larger effect on demand and a smaller effect on people’s choices about staying in the labor force, UI extension would cause unemployment to decrease.
37. In the year and a half that those funds were available, 39 states and several territories used $1.3 billion to create short-term subsidized jobs, roughly equally divided between summer jobs for youth and jobs for adults. See LaDonna Pavetti, Liz Schott, and Elizabeth Lower-Basch, Creating Subsidized Employment Opportunities for Low-Income Parents: The Legacy of the TANF Emergency Fund (Washington, D.C.: Center on Budget and Policy Priorities, February 2011), www.cbpp.org/cms/index.cfm?fa=view&id=3400.
could explicitly target the long-term unemployed. People who have been unemployed for a long time could still benefit from untargeted approaches even if most jobs directly created by the policies went to other groups.
Despite the near-term economic benefits that would arise from reductions in taxes and increases in government spending, such actions would add to the already large projected budget deficits that would exist under current policies, either immediately or over time. Unless offset-ting actions were taken to reverse the accumulation of additional government debt, the nation’s capital stock (that is, the tools, machines, and factories used in produc-tion), its future output, and people’s future income would tend to be lower than they otherwise would have been. If policymakers wanted to boost the economy in the near term while seeking to achieve fiscal sustainability over the long term, a combination of policies would be required—specifically, changes in taxes and spending that would widen the deficit now but reduce it later in the decade. Such an approach would work best if the future policy changes were sufficiently specific and widely supported so that households, businesses, state and local governments, and participants in financial markets believed that the future fiscal restraint would truly take effect.
Other Types of Legislative ActionsLawmakers could also influence the demand for workers during the next few years by changing policies that do not involve, or whose scope extends well beyond, taxation and government spending. For example, legislation could modify existing or proposed regulations, significantly alter the government’s role in a particular sector of the economy, or change trade relationships with other coun-tries. The near-term economic impact of changing a reg-ulation or other policy—apart from fiscal policy—would depend importantly on how doing so affected businesses’ investment and hiring decisions. In addition, changes in policies that increased or decreased households’ purchas-ing power or wealth would affect how much they spend. Finally, changes to regulations and other policies could affect expectations about future income or make busi-nesses and households more or less uncertain about future government policies and economic conditions, which would affect economic growth and employment in the near term.
CBO has previously discussed some potential changes in regulatory policies and other policies related to energy and the environment, the financial and health care
UNDERSTANDING AND RESPONDING TO PERSISTENTLY HIGH UNEMPLOYMENT 17
Table 3.
Funding for Training Under the Workforce Investment Act (Title I), Fiscal Year 2012
Source: David H. Bradley, The Workforce Investment Act and the One-Stop Delivery System, CRS Report for Congress R41135 (Congressional Research Service, January 13, 2012).
sectors, and international trade.38 But estimating the near-term effects of such policy changes on overall eco-nomic activity is exceedingly difficult, and few analytic tools are available for that purpose. Accordingly, CBO did not attempt to quantify the effects of those potential changes with any precision. (Other types of policy changes that do not require legislation, such as those related to monetary policy or those that can be imple-mented by federal agencies under current law, could also affect economic activity, but they were outside the scope of that analysis.)
Some of the changes in policies that CBO considered in its previous work would probably raise output and employment over the next few years; other changes would probably lower output and employment; and some changes would have effects on economic activity that are difficult to determine. However, in CBO’s judgment, the economic effects of the specific changes in regulatory pol-icies or other policies that the agency discussed in its pre-vious work—apart from those related to fiscal policy—
38. Those policies include the approval process for energy projects, regulations regarding emissions from coal-burning power plants, the Dodd-Frank Wall Street Reform and Consumer Protection Act (Public Law 111-203), the Affordable Care Act (P.L. 111-148), and free-trade agreements. See Congressional Budget Office, Policies for Increasing Economic Growth and Employment in 2012 and 2013, pp. 44–52.
State Formula Grant Programs0.80.81.2
Job Corps 1.7
National Programs 0.4___Total 4.9
Youth Activities Formula GrantsAdult Activities Formula GrantsDislocated Worker Grants
Billions of DollarsFunding in
probably would be too small or would occur too slowly to significantly alter overall unemployment in the next two years. That analysis did not speak to other considerations that are critical when evaluating such policy changes, including their long-term effects on the economy, on people’s health, and on the environment.
The policy changes that CBO examined were illustrative rather than exhaustive; many others, which might have larger or smaller economic effects, are possible. One such policy that CBO did not previously analyze would be a reduction in the minimum wage. Although estimates have varied, the bulk of the evidence indicates that such a reduction would increase employment by a small amount and correspondingly reduce unemployment by a small amount.39 The effects would be largest for teenage and other low-skill workers whose wages are affected by the legal minimum. One factor limiting the potential effec-tiveness of such a policy, however, is that 41 states and the District of Columbia have their own minimum wages that are equal to or higher than the federal minimum (although they differ somewhat in their coverage of work-ers and in their enforcement); lowering the federal mini-mum would have little or no effect in those states. Also, current federal policy already makes some allowance for lower minimum wages for students and youths.
Other Policies to Reduce UnemploymentOther types of policies could aim to reduce unemploy-ment by addressing factors other than weak aggregate demand for goods and services. The United States cur-rently has numerous programs that aim to help job seek-ers in those ways. Some of those programs provide services—including job-search assistance, counseling, and training—through One-Stop Career Centers operated by state and local workforce-development agencies. For fiscal year 2012, the Congress has appropriated $4.9 billion for those services and other training activities under title I of the Workforce Investment Act of 1998, including the Job Corps and a variety of grants to states (see Table 3). In addition to those dedicated funds, the federal govern-ment spends $10 billion to $12 billion per year on other
39. See David Card and Alan B. Krueger, Myth and Measurement: The New Economics of the MinimumWage (Princeton, N.J.: Princeton University Press, 1997); and David Neumark and William L. Wascher, Minimum Wages (Cambridge, Mass.: MIT Press, 2010).
CBO
18 UNDERSTANDING AND RESPONDING TO PERSISTENTLY HIGH UNEMPLOYMENT
CBO
training programs, though there is some overlap and administrative inefficiency in those programs.40
Relative to the size of the workforce, the United States spends far less on formal training programs for the unem-ployed than most other industrialized nations.41 How-ever, a considerable amount of federal financial support is available for individuals pursuing training through com-munity colleges and through certain proprietary educa-tion and training organizations.42 Among existing pro-grams that aim to help job seekers, some appear to have generated high rates of return for some groups, but others have had no impact and may, indeed, have had harmful effects.43
CBO has examined a number of policies that would focus on the unemployed and long-term unemployed in one of the following three ways:
Improving the skills of unemployed workers,
Modifying unemployment insurance to provide con-tinued support to the long-term unemployed or to encourage the unemployed to take new jobs quickly and retain their work skills, or
40. See Government Accountability Office, Multiple Employment and Training Programs: Providing Information on Colocating Services and Consolidating Administrative Structures Could Promote Efficien-cies, GAO-11-92 (February 9, 2011), www.gao.gov/products/GAO-11-92. GAO estimates that the federal government spent about $12 billion on training programs in fiscal year 2010.
41. See Organisation for Economic Co-operation and Development, OECD Employment Outlook: 2011 (Paris: OECD, September 2011), pp. 264–273, www.oecd.org/employment/outlook.
42. For example, the United States spent $30 billion on Pell grants during the 2009–2010 academic year. About $12 billion of that total was spent on independent students attending two-year or proprietary institutions. See Department of Education, Office of Postsecondary Education, 2009–2010 Federal Pell Grant Program End-of-Year Report (undated), www2.ed.gov/finaid/prof/resources/data/pell-2009-10/pell-eoy-2009-10.html.
43. For reviews, see David Card, Jochen Kluve, and Andrea Weber, “Active Labor Market Policy Evaluations: A Meta-Analysis,” Eco-nomic Journal, vol. 120, no. 548 (November 2010), pp. F452–F477; and James J. Heckman, Robert J. LaLonde, and Jeffrey A. Smith, “The Economics and Econometrics of Active Labor Mar-ket Programs,” in Orley Ashenfelter and David Card, eds., Hand-book of Labor Economics (Amsterdam: Elsevier B.V./North Holland, 1999), pp. 1865–2097.
Facilitating transitions to work.
CBO has not estimated the effects on employment of any specific policy. The impact on employment per dollar of budgetary cost for those policies would probably be within the broad range of effects for the fiscal policies dis-cussed earlier. But another important consideration for understanding the effects of such policies involves their potential scale; for many of those activities, spending tens of billions of additional dollars in 2012 and 2013 would be difficult. For that reason, their potential impact on the unemployment rate during the next two years is limited.
Many of the policies that CBO examined for this report would involve collaboration between the federal govern-ment and states or other entities. Key elements of the pol-icies include the funding mechanism, the amount of funding, and the program design. The extent to which federal policymakers would influence the specific design of the programs would depend on the details of the legis-lation and the funding mechanism. (For a discussion of funding mechanisms, see Box 3).
Improving Workers’ SkillsTraining programs—including those designed to develop general workforce skills and programs that target specific industries and occupations in specific locations—could make the long-term unemployed more attractive to employers by addressing skills mismatch, skill erosion, and stigma. The benefits of training programs depend on the skills unemployed workers already have and their work experience. Unemployed high school dropouts might benefit greatly from basic skills training, whereas more-highly skilled workers might be better served by specialized training. The higher earnings from better training for young people accrue for many years and are more likely to exceed the investment cost; investment returns would probably be lower for older workers with fewer years before retirement.
General Workforce Programs. Well-designed training programs improve the employment and earnings out-comes of properly targeted participants, at least in the short run, and can lead to higher output. Training pro-grams funded under the Job Training Partnership Act of 1982 had positive effects on adult participants’ earnings (relative to a control group) for up to four years following
UNDERSTANDING AND RESPONDING TO PERSISTENTLY HIGH UNEMPLOYMENT 19
Box 3.
Funding Mechanisms If federal lawmakers wanted to address unemploy-ment by improving workers’ skills, modifying the unemployment insurance program, or facilitating transitions to work, they could use various types of funding mechanisms to support those efforts.1
Block grants typically give states broad flexibility to use funds to tailor programs to local conditions. For example, the Community Services Block Grant program, which is administered by the Department of Health and Human Services, pro-vides states with funding for local entities that offer services and sponsor activities addressing employment, education, household budgeting, housing, nutrition, emergency services, and health.
Categorical formula grants are directed to speci-fied activities. For example, funding for the train-ing of displaced workers is currently provided to states as a categorical grant; the formula allocating funds depends on states’ shares of overall unem-ployment and long-term unemployment and on other factors. Categorical grants are sometimes structured to require state matching funds or to reimburse states for qualifying activities.
Categorical project grants are generally awarded on the basis of a particular proposal’s perceived merits. For instance, the Trade Adjustment Assis-tance Community College and Career Training Grants Program, which is administered by the Department of Labor, competitively awards grants of this type to institutions of higher learning that provide services to certain displaced workers.
Federal operation of programs typically involves direct federal contact with participating entities, rather than partnership with state and local gov-ernments. The Job Corps, for example, provides training opportunities to low-income youth, and the Department of Labor directly contracts with participating institutions on behalf of eligible clients.
The different funding mechanisms entail different degrees of federal involvement. The role of the federal government in selecting, implementing, and oversee-ing the various programs is typically limited when those programs are funded through block grants and much more extensive for direct operation. That role can vary greatly for programs funded through cate-gorical formula or project grants, depending on how the authorizing legislation is written.2
1. For further discussion of these approaches, see Shama Gamkhar, Federal Intergovernmental Grants and the States: Managing Devolution (United Kingdom: Edward Elgar Publishing, 2002).
2. See Harry J. Holzer, “Raising Job Quality and Skills for American Workers: Creating More-Effective Education and Workforce Development Systems in the States,” Brookings Hamilton Project Discussion Paper 2011-10 (November 2011), www.brookings.edu/papers/2011/11_workforce_holzer.aspx.
CBO
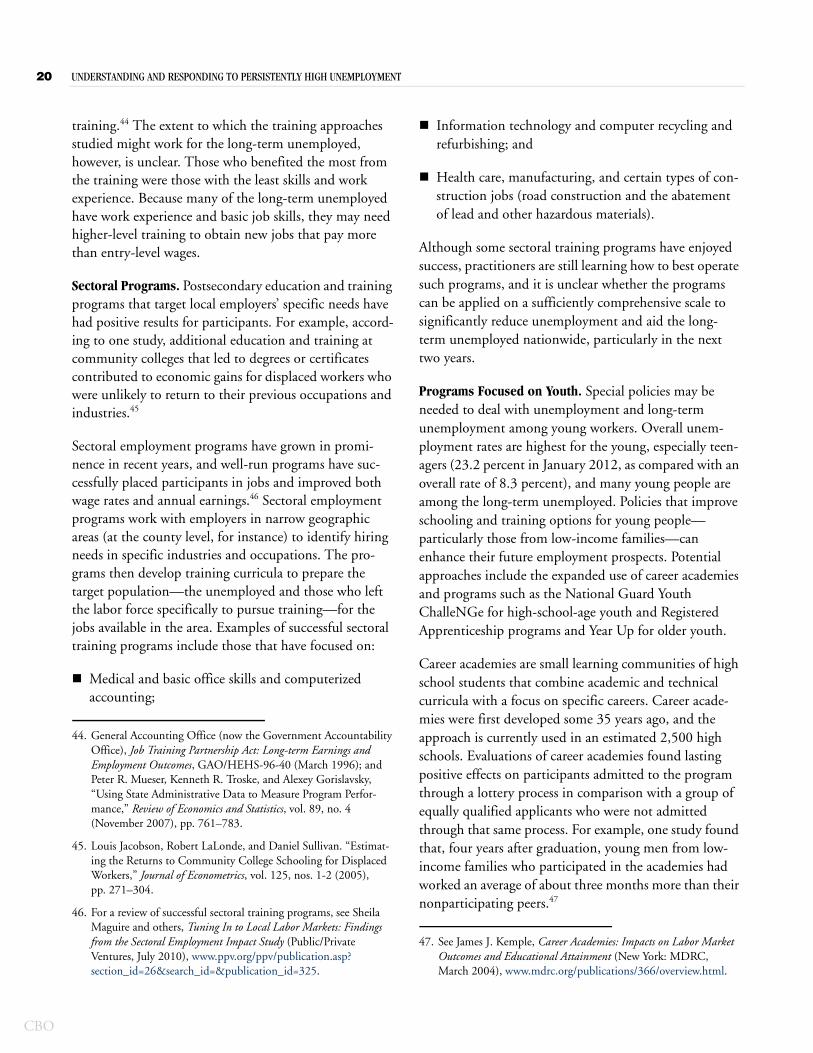
20 UNDERSTANDING AND RESPONDING TO PERSISTENTLY HIGH UNEMPLOYMENT
CBO
training.44 The extent to which the training approaches studied might work for the long-term unemployed, however, is unclear. Those who benefited the most from the training were those with the least skills and work experience. Because many of the long-term unemployed have work experience and basic job skills, they may need higher-level training to obtain new jobs that pay more than entry-level wages.
Sectoral Programs. Postsecondary education and training programs that target local employers’ specific needs have had positive results for participants. For example, accord-ing to one study, additional education and training at community colleges that led to degrees or certificates contributed to economic gains for displaced workers who were unlikely to return to their previous occupations and industries.45
Sectoral employment programs have grown in promi-nence in recent years, and well-run programs have suc-cessfully placed participants in jobs and improved both wage rates and annual earnings.46 Sectoral employment programs work with employers in narrow geographic areas (at the county level, for instance) to identify hiring needs in specific industries and occupations. The pro-grams then develop training curricula to prepare the target population—the unemployed and those who left the labor force specifically to pursue training—for the jobs available in the area. Examples of successful sectoral training programs include those that have focused on:
Medical and basic office skills and computerized accounting;
44. General Accounting Office (now the Government Accountability Office), Job Training Partnership Act: Long-term Earnings and Employment Outcomes, GAO/HEHS-96-40 (March 1996); and Peter R. Mueser, Kenneth R. Troske, and Alexey Gorislavsky, “Using State Administrative Data to Measure Program Perfor-mance,” Review of Economics and Statistics, vol. 89, no. 4 (November 2007), pp. 761–783.
45. Louis Jacobson, Robert LaLonde, and Daniel Sullivan. “Estimat-ing the Returns to Community College Schooling for Displaced Workers,” Journal of Econometrics, vol. 125, nos. 1-2 (2005), pp. 271–304.
46. For a review of successful sectoral training programs, see Sheila Maguire and others, Tuning In to Local Labor Markets: Findings from the Sectoral Employment Impact Study (Public/Private Ventures, July 2010), www.ppv.org/ppv/publication.asp?section_id=26&search_id=&publication_id=325.
Information technology and computer recycling and refurbishing; and
Health care, manufacturing, and certain types of con-struction jobs (road construction and the abatement of lead and other hazardous materials).
Although some sectoral training programs have enjoyed success, practitioners are still learning how to best operate such programs, and it is unclear whether the programs can be applied on a sufficiently comprehensive scale to significantly reduce unemployment and aid the long-term unemployed nationwide, particularly in the next two years.
Programs Focused on Youth. Special policies may be needed to deal with unemployment and long-term unemployment among young workers. Overall unem-ployment rates are highest for the young, especially teen-agers (23.2 percent in January 2012, as compared with an overall rate of 8.3 percent), and many young people are among the long-term unemployed. Policies that improve schooling and training options for young people—particularly those from low-income families—can enhance their future employment prospects. Potential approaches include the expanded use of career academies and programs such as the National Guard Youth ChalleNGe for high-school-age youth and Registered Apprenticeship programs and Year Up for older youth.
Career academies are small learning communities of high school students that combine academic and technical curricula with a focus on specific careers. Career acade-mies were first developed some 35 years ago, and the approach is currently used in an estimated 2,500 high schools. Evaluations of career academies found lasting positive effects on participants admitted to the program through a lottery process in comparison with a group of equally qualified applicants who were not admitted through that same process. For example, one study found that, four years after graduation, young men from low-income families who participated in the academies had worked an average of about three months more than their nonparticipating peers.47
47. See James J. Kemple, Career Academies: Impacts on Labor Market Outcomes and Educational Attainment (New York: MDRC, March 2004), www.mdrc.org/publications/366/overview.html.
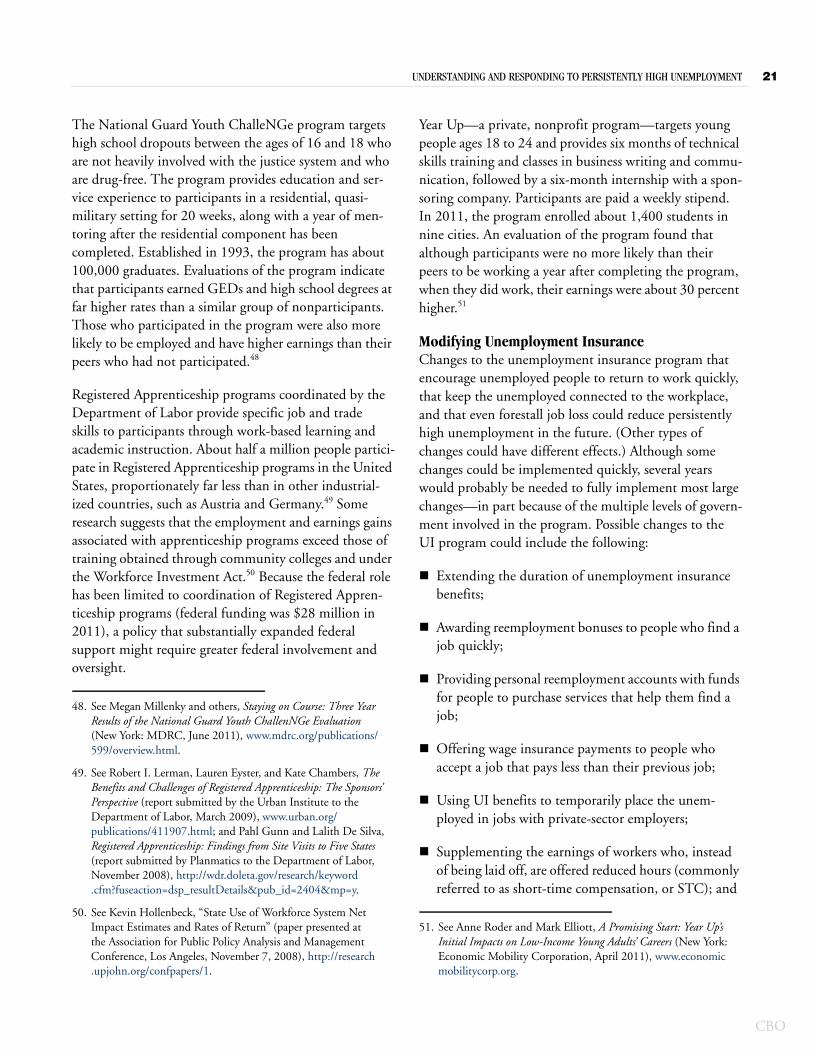
UNDERSTANDING AND RESPONDING TO PERSISTENTLY HIGH UNEMPLOYMENT 21
The National Guard Youth ChalleNGe program targets high school dropouts between the ages of 16 and 18 who are not heavily involved with the justice system and who are drug-free. The program provides education and ser-vice experience to participants in a residential, quasi-military setting for 20 weeks, along with a year of men-toring after the residential component has been completed. Established in 1993, the program has about 100,000 graduates. Evaluations of the program indicate that participants earned GEDs and high school degrees at far higher rates than a similar group of nonparticipants. Those who participated in the program were also more likely to be employed and have higher earnings than their peers who had not participated.48
Registered Apprenticeship programs coordinated by the Department of Labor provide specific job and trade skills to participants through work-based learning and academic instruction. About half a million people partici-pate in Registered Apprenticeship programs in the United States, proportionately far less than in other industrial-ized countries, such as Austria and Germany.49 Some research suggests that the employment and earnings gains associated with apprenticeship programs exceed those of training obtained through community colleges and under the Workforce Investment Act.50 Because the federal role has been limited to coordination of Registered Appren-ticeship programs (federal funding was $28 million in 2011), a policy that substantially expanded federal support might require greater federal involvement and oversight.
48. See Megan Millenky and others, Staying on Course: Three Year Results of the National Guard Youth ChallenNGe Evaluation (New York: MDRC, June 2011), www.mdrc.org/publications/599/overview.html.
49. See Robert I. Lerman, Lauren Eyster, and Kate Chambers, The Benefits and Challenges of Registered Apprenticeship: The Sponsors’ Perspective (report submitted by the Urban Institute to the Department of Labor, March 2009), www.urban.org/publications/411907.html; and Pahl Gunn and Lalith De Silva, Registered Apprenticeship: Findings from Site Visits to Five States (report submitted by Planmatics to the Department of Labor, November 2008), http://wdr.doleta.gov/research/keyword.cfm?fuseaction=dsp_resultDetails&pub_id=2404&mp=y.
50. See Kevin Hollenbeck, “State Use of Workforce System Net Impact Estimates and Rates of Return” (paper presented at the Association for Public Policy Analysis and Management Conference, Los Angeles, November 7, 2008), http://research.upjohn.org/confpapers/1.
Year Up—a private, nonprofit program—targets young people ages 18 to 24 and provides six months of technical skills training and classes in business writing and commu-nication, followed by a six-month internship with a spon-soring company. Participants are paid a weekly stipend. In 2011, the program enrolled about 1,400 students in nine cities. An evaluation of the program found that although participants were no more likely than their peers to be working a year after completing the program, when they did work, their earnings were about 30 percent higher.51
Modifying Unemployment InsuranceChanges to the unemployment insurance program that encourage unemployed people to return to work quickly, that keep the unemployed connected to the workplace, and that even forestall job loss could reduce persistently high unemployment in the future. (Other types of changes could have different effects.) Although some changes could be implemented quickly, several years would probably be needed to fully implement most large changes—in part because of the multiple levels of govern-ment involved in the program. Possible changes to the UI program could include the following:
Extending the duration of unemployment insurance benefits;
Awarding reemployment bonuses to people who find a job quickly;
Providing personal reemployment accounts with funds for people to purchase services that help them find a job;
Offering wage insurance payments to people who accept a job that pays less than their previous job;
Using UI benefits to temporarily place the unem-ployed in jobs with private-sector employers;
Supplementing the earnings of workers who, instead of being laid off, are offered reduced hours (commonly referred to as short-time compensation, or STC); and
51. See Anne Roder and Mark Elliott, A Promising Start: Year Up’s Initial Impacts on Low-Income Young Adults’ Careers (New York: Economic Mobility Corporation, April 2011), www.economicmobilitycorp.org.
CBO
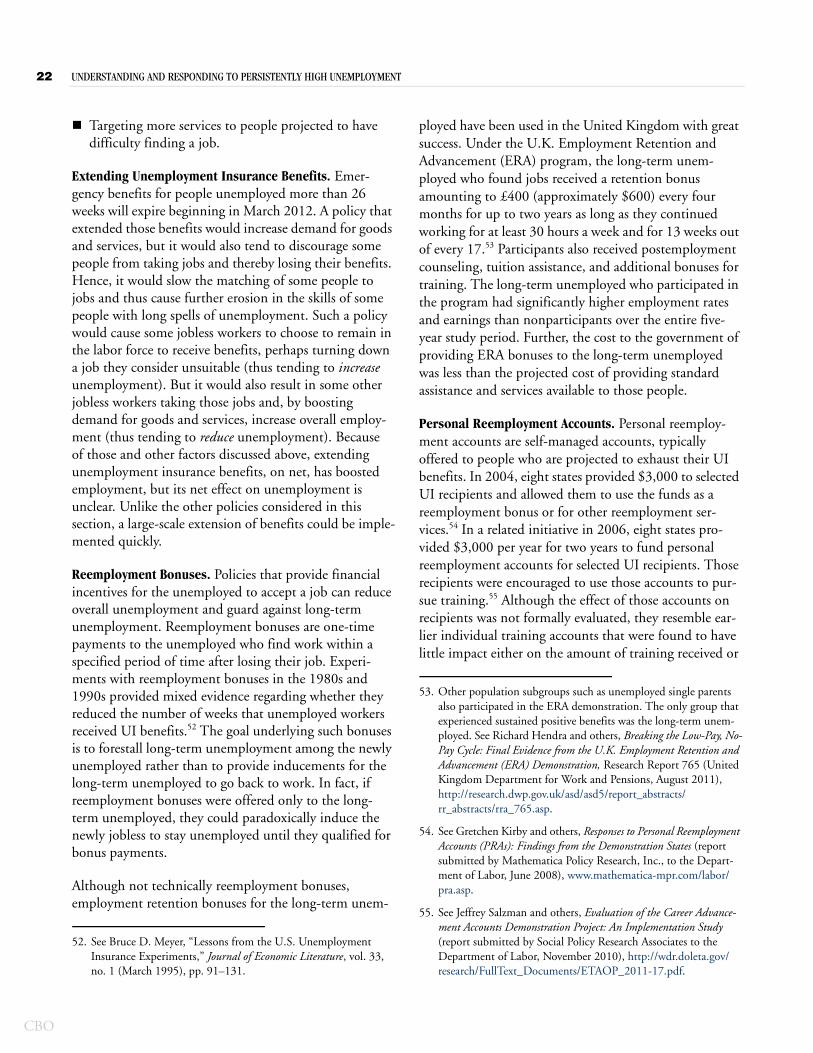
22 UNDERSTANDING AND RESPONDING TO PERSISTENTLY HIGH UNEMPLOYMENT
CBO
Targeting more services to people projected to have difficulty finding a job.
Extending Unemployment Insurance Benefits. Emer-gency benefits for people unemployed more than 26 weeks will expire beginning in March 2012. A policy that extended those benefits would increase demand for goods and services, but it would also tend to discourage some people from taking jobs and thereby losing their benefits. Hence, it would slow the matching of some people to jobs and thus cause further erosion in the skills of some people with long spells of unemployment. Such a policy would cause some jobless workers to choose to remain in the labor force to receive benefits, perhaps turning down a job they consider unsuitable (thus tending to increase unemployment). But it would also result in some other jobless workers taking those jobs and, by boosting demand for goods and services, increase overall employ-ment (thus tending to reduce unemployment). Because of those and other factors discussed above, extending unemployment insurance benefits, on net, has boosted employment, but its net effect on unemployment is unclear. Unlike the other policies considered in this section, a large-scale extension of benefits could be imple-mented quickly.
Reemployment Bonuses. Policies that provide financial incentives for the unemployed to accept a job can reduce overall unemployment and guard against long-term unemployment. Reemployment bonuses are one-time payments to the unemployed who find work within a specified period of time after losing their job. Experi-ments with reemployment bonuses in the 1980s and 1990s provided mixed evidence regarding whether they reduced the number of weeks that unemployed workers received UI benefits.52 The goal underlying such bonuses is to forestall long-term unemployment among the newly unemployed rather than to provide inducements for the long-term unemployed to go back to work. In fact, if reemployment bonuses were offered only to the long-term unemployed, they could paradoxically induce the newly jobless to stay unemployed until they qualified for bonus payments.
Although not technically reemployment bonuses, employment retention bonuses for the long-term unem-
52. See Bruce D. Meyer, “Lessons from the U.S. Unemployment Insurance Experiments,” Journal of Economic Literature, vol. 33, no. 1 (March 1995), pp. 91–131.
ployed have been used in the United Kingdom with great success. Under the U.K. Employment Retention and Advancement (ERA) program, the long-term unem-ployed who found jobs received a retention bonus amounting to £400 (approximately $600) every four months for up to two years as long as they continued working for at least 30 hours a week and for 13 weeks out of every 17.53 Participants also received postemployment counseling, tuition assistance, and additional bonuses for training. The long-term unemployed who participated in the program had significantly higher employment rates and earnings than nonparticipants over the entire five-year study period. Further, the cost to the government of providing ERA bonuses to the long-term unemployed was less than the projected cost of providing standard assistance and services available to those people.
Personal Reemployment Accounts. Personal reemploy-ment accounts are self-managed accounts, typically offered to people who are projected to exhaust their UI benefits. In 2004, eight states provided $3,000 to selected UI recipients and allowed them to use the funds as a reemployment bonus or for other reemployment ser-vices.54 In a related initiative in 2006, eight states pro-vided $3,000 per year for two years to fund personal reemployment accounts for selected UI recipients. Those recipients were encouraged to use those accounts to pur-sue training.55 Although the effect of those accounts on recipients was not formally evaluated, they resemble ear-lier individual training accounts that were found to have little impact either on the amount of training received or
53. Other population subgroups such as unemployed single parents also participated in the ERA demonstration. The only group that experienced sustained positive benefits was the long-term unem-ployed. See Richard Hendra and others, Breaking the Low-Pay, No-Pay Cycle: Final Evidence from the U.K. Employment Retention and Advancement (ERA) Demonstration, Research Report 765 (United Kingdom Department for Work and Pensions, August 2011), http://research.dwp.gov.uk/asd/asd5/report_abstracts/rr_abstracts/rra_765.asp.
54. See Gretchen Kirby and others, Responses to Personal Reemployment Accounts (PRAs): Findings from the Demonstration States (report submitted by Mathematica Policy Research, Inc., to the Depart-ment of Labor, June 2008), www.mathematica-mpr.com/labor/pra.asp.
55. See Jeffrey Salzman and others, Evaluation of the Career Advance-ment Accounts Demonstration Project: An Implementation Study (report submitted by Social Policy Research Associates to the Department of Labor, November 2010), http://wdr.doleta.gov/research/FullText_Documents/ETAOP_2011-17.pdf.
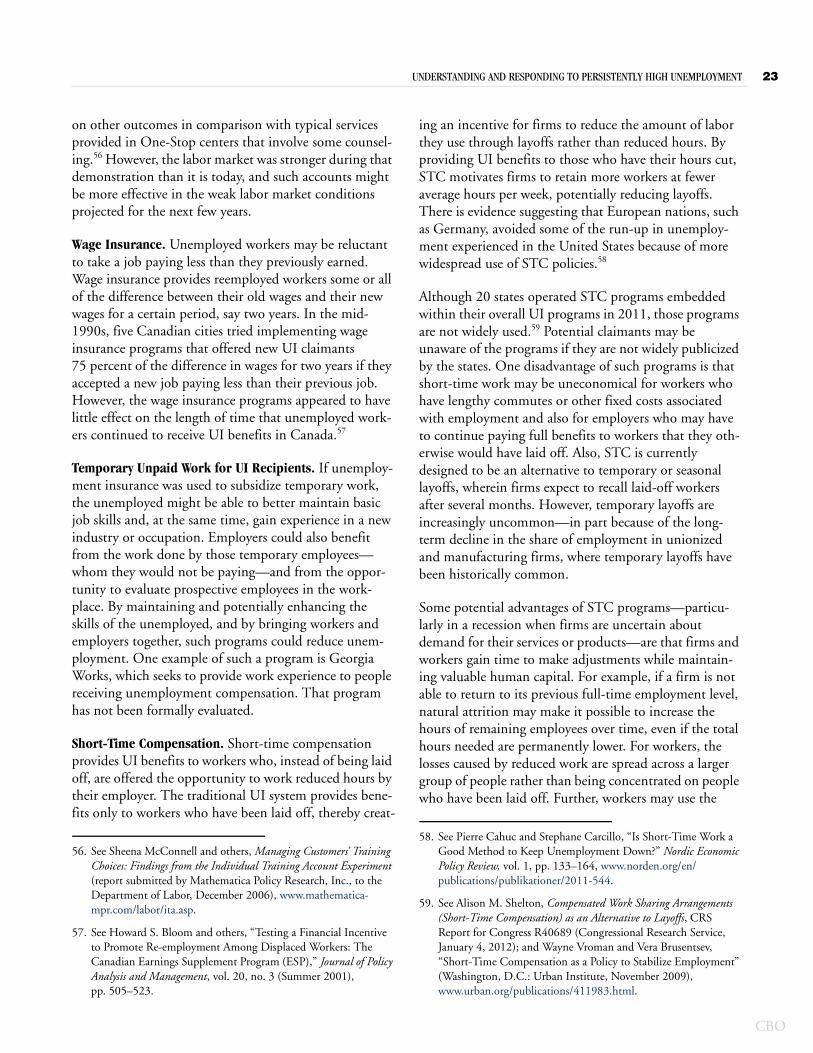
UNDERSTANDING AND RESPONDING TO PERSISTENTLY HIGH UNEMPLOYMENT 23
on other outcomes in comparison with typical services provided in One-Stop centers that involve some counsel-ing.56 However, the labor market was stronger during that demonstration than it is today, and such accounts might be more effective in the weak labor market conditions projected for the next few years.
Wage Insurance. Unemployed workers may be reluctant to take a job paying less than they previously earned. Wage insurance provides reemployed workers some or all of the difference between their old wages and their new wages for a certain period, say two years. In the mid-1990s, five Canadian cities tried implementing wage insurance programs that offered new UI claimants 75 percent of the difference in wages for two years if they accepted a new job paying less than their previous job. However, the wage insurance programs appeared to have little effect on the length of time that unemployed work-ers continued to receive UI benefits in Canada.57
Temporary Unpaid Work for UI Recipients. If unemploy-ment insurance was used to subsidize temporary work, the unemployed might be able to better maintain basic job skills and, at the same time, gain experience in a new industry or occupation. Employers could also benefit from the work done by those temporary employees—whom they would not be paying—and from the oppor-tunity to evaluate prospective employees in the work-place. By maintaining and potentially enhancing the skills of the unemployed, and by bringing workers and employers together, such programs could reduce unem-ployment. One example of such a program is Georgia Works, which seeks to provide work experience to people receiving unemployment compensation. That program has not been formally evaluated.
Short-Time Compensation. Short-time compensation provides UI benefits to workers who, instead of being laid off, are offered the opportunity to work reduced hours by their employer. The traditional UI system provides bene-fits only to workers who have been laid off, thereby creat-
56. See Sheena McConnell and others, Managing Customers’ Training Choices: Findings from the Individual Training Account Experiment (report submitted by Mathematica Policy Research, Inc., to the Department of Labor, December 2006), www.mathematica-mpr.com/labor/ita.asp.
57. See Howard S. Bloom and others, “Testing a Financial Incentive to Promote Re-employment Among Displaced Workers: The Canadian Earnings Supplement Program (ESP),” Journal of Policy Analysis and Management, vol. 20, no. 3 (Summer 2001), pp. 505–523.
ing an incentive for firms to reduce the amount of labor they use through layoffs rather than reduced hours. By providing UI benefits to those who have their hours cut, STC motivates firms to retain more workers at fewer average hours per week, potentially reducing layoffs. There is evidence suggesting that European nations, such as Germany, avoided some of the run-up in unemploy-ment experienced in the United States because of more widespread use of STC policies.58
Although 20 states operated STC programs embedded within their overall UI programs in 2011, those programs are not widely used.59 Potential claimants may be unaware of the programs if they are not widely publicized by the states. One disadvantage of such programs is that short-time work may be uneconomical for workers who have lengthy commutes or other fixed costs associated with employment and also for employers who may have to continue paying full benefits to workers that they oth-erwise would have laid off. Also, STC is currently designed to be an alternative to temporary or seasonal layoffs, wherein firms expect to recall laid-off workers after several months. However, temporary layoffs are increasingly uncommon—in part because of the long-term decline in the share of employment in unionized and manufacturing firms, where temporary layoffs have been historically common.
Some potential advantages of STC programs—particu-larly in a recession when firms are uncertain about demand for their services or products—are that firms and workers gain time to make adjustments while maintain-ing valuable human capital. For example, if a firm is not able to return to its previous full-time employment level, natural attrition may make it possible to increase the hours of remaining employees over time, even if the total hours needed are permanently lower. For workers, the losses caused by reduced work are spread across a larger group of people rather than being concentrated on people who have been laid off. Further, workers may use the
58. See Pierre Cahuc and Stephane Carcillo, “Is Short-Time Work a Good Method to Keep Unemployment Down?” Nordic Economic Policy Review, vol. 1, pp. 133–164, www.norden.org/en/publications/publikationer/2011-544.
59. See Alison M. Shelton, Compensated Work Sharing Arrangements (Short-Time Compensation) as an Alternative to Layoffs, CRS Report for Congress R40689 (Congressional Research Service, January 4, 2012); and Wayne Vroman and Vera Brusentsev, “Short-Time Compensation as a Policy to Stabilize Employment” (Washington, D.C.: Urban Institute, November 2009), www.urban.org/publications/411983.html.
CBO
24 UNDERSTANDING AND RESPONDING TO PERSISTENTLY HIGH UNEMPLOYMENT
CBO
adjustment time to find new work, avoiding some or all of the potential permanent wage losses associated with layoffs.60
Targeted Services. Over the past two decades, states have experimented with policies that provide extra services to those UI recipients projected to be most likely to exhaust their benefits. Under such policies, states use statistical models to predict who is likely to remain unemployed for 26 or more weeks, and they then require those workers to participate in special job-search assistance programs as a condition of receiving UI benefits. Research suggests that such a policy, when well-targeted, can reduce the dura-tion of unemployment, reduce UI expenditures, and improve the postunemployment earnings of UI recipi-ents.61 However, over the past decade, states have increas-ingly allowed UI claimants to make initial and continu-ing claims over the phone and via the Internet, which has reduced the chances that those claimants will receive job-search assistance and other reemployment services.62
Facilitating Transitions to EmploymentSome unemployed people may be unable or unwilling to take advantage of available job opportunities, and certain policies could facilitate the transition to employment. People may not have information about available jobs or the skills to search effectively for them. They may also have to contend with the stigma resulting from long-term unemployment or immobility arising from housing constraints.
Job-Search Assistance. Among the services offered by One-Stop Career Centers are group workshops that focus on job-search techniques and access to computerized job listings. For workers who fail to find a job quickly, those centers may offer additional higher-cost services that
60. For discussion of those wage losses, see Congressional Budget Office, Losing a Job During a Recession.
61. See Dan A. Black, Jose C. Galdo, and Jeffrey A. Smith, “Evaluat-ing the Worker Profiling and Reemployment Services System Using a Regression Discontinuity Approach,” American Economic Review, vol. 97, no. 2 (May 2007), pp.104–107; and Paul T. Decker and others, Assisting Unemployment Insurance Claimants: The Long-Term Impacts of the Job Search Assistance Demonstration (report submitted by Mathematica Policy Research, Inc., to the Department of Labor, February 2000), www.upjohninst.org/erdc/auic.html.
62. See Christopher J. O’Leary, “State UI Job Search Rules and Reem-ployment Services,” Monthly Labor Review, vol. 129, no. 6 (June 2006), pp. 27–37, www.bls.gov/opub/mlr/2006/06/art3abs.htm.
include individualized counseling and, if other methods fail, vouchers for training programs. Findings from five demonstrations indicated that various combinations of job-search assistance and increased emphasis on work-search rules were effective in reducing unemployment.63
Skill Certification Programs. Skill certification programs can allay employers’ concerns about whether the long-term unemployed are capable of being productive employees. Pure skill certification programs provide the unemployed with an opportunity to demonstrate their abilities to employers and thereby reduce the stigma of long-term unemployment.64 That approach, of course, works best if the unemployed have the skills that pro-spective employers need. One example of a certification program for preexisting skills is the WorkKeys Career Readiness Certification used by a variety of states, includ-ing Indiana, North Carolina, and Virginia. WorkKeys offers certification in a variety of areas, including reading, applied math, business writing, and applied technology. Such programs allow the unemployed to obtain skill certification without going through lengthy training programs.
Housing Mobility Assistance. Helping the unemployed relocate might also reduce unemployment. However, recent federal housing policies aimed at helping people stay in their homes, while having various beneficial effects on people’s lives, could result in fewer people moving to areas where jobs might be more plentiful. Numerous efforts have been undertaken since 2008 to assist home-owners who are underwater on their mortgages (that is,
63. Meyer, “Lessons from the U.S. Unemployment Insurance Experi-ments”; and Louis S. Jacobson, “Strengthening One-Stop Career Centers: Helping More Unemployed Workers Find Jobs and Build Skills,” Brookings Hamilton Project Discussion Paper 2009-01 (April 2009), www.brookings.edu/papers/2009/0402_jobs_skills_jacobson.aspx.
64. Many states and localities offer some form of skill or work readi-ness certification. Those programs are generally aimed at less-skilled workers and may require some form of training before cli-ents can take certification exams. Examples include the Workforce Alliance for Growth in the Economy (WAGE) certificate pro-gram, which is conducted by the Arkansas Department of Career Education, and the Workforce Skills Certification System, which was developed by Comprehensive Adult Student Assessment Sys-tems and is used in California, Connecticut, Oregon, and Wash-ington. See Norma Rey-Alicea and Geri Scott, A Survey of Selected Work Readiness Certificates (prepared by Jobs for the Future for Skill Up Rhode Island, January 2007), www.jff.org/publications/workforce/survey-selected-work-readiness-certifica/364.
UNDERSTANDING AND RESPONDING TO PERSISTENTLY HIGH UNEMPLOYMENT 25
who owe more on their mortgages than their homes are currently worth); those efforts have occurred largely through the auspices of the Making Home Affordable (MHA) program. The Emergency Homeowners’ Loan Program provided further loan relief specifically targeted to the unemployed. Those programs have been varied in their goals and, in the case of the largest (the $8 billion Hardest Hit Fund), have varied from state to state in their implementation. But their general goal has been to
keep homeowners in their houses through mortgage modifications or assistance rather than to facilitate their move to a new location. MHA programs designed to facilitate short sales (when a homeowner sells his or her house for less than the mortgage amount owed) probably do make it easier for people to relocate, but those pro-grams are small in relation to the majority of MHA pro-grams that seek to keep homeowners in their homes.
CBO