Embed Size (px)
Citation preview
UNIVERSITY OF CALIFORNIARIVERSIDE
Understanding and Improving the Smartphone Ecosystem:Measurements, Security and Tools
A Dissertation submitted in partial satisfactionof the requirements for the degree of
Doctor of Philosophy
in
Computer Science
by
Xuetao Wei
December 2013
Dissertation Committee:
Dr. Michalis Faloutsos, Co-ChairpersonDr. Iulian Neamtiu, Co-ChairpersonDr. Harsha V. Madhyastha

Copyright byXuetao Wei
2013
The Dissertation of Xuetao Wei is approved:
Committee Co-Chairperson
Committee Co-Chairperson
University of California, Riverside
Acknowledgments
I would like to thank the people who gave me help during my Ph.D. study.
First of all, I would like to sincerely thank my advisor, Prof. Michalis Faloutsos,
for his excellent guidance on research projects throughout my Ph.D. study. He helped
me gain the confidence and enthusiasm to start research, tackle difficult problems and
try to make the real-world impact. His optimism and enthusiasm will be a great model
for me to work in academia.
I am also thankful for all my collaborators Prof. Iulian Neamtiu and Prof.
Harsha V. Madhyastha at University of California, Riverside, Prof. Christos Faloutsos
at Carnegie Mellon University and Prof. B. Aditya Prakash at Virginia Tech. Especially,
I greatly thank Prof. Iulian Neamtiu to give me a nice research topic, which I will
continue to devote myself to after I graduate. I am so fortunate to work with these
diligent, knowledgeable and excellent professors. The meetings and discussions with
them about research ideas and projects are really the fun part of my Ph.D. life. Their
inspiring attitude and insightful feeback help me improve the quality of research and
pave the way for my academia career.
Finally, I greatly want to thank my wife Yuan Li and my parents Kenan Wei
and Qingfang Wang, for their endless love and encouragement throughout the difficult
times during my Ph.D. study. This thesis is dedicated to them.
iv
To my family and my love.
v
ABSTRACT OF THE DISSERTATION
Understanding and Improving the Smartphone Ecosystem:Measurements, Security and Tools
by
Xuetao Wei
Doctor of Philosophy, Graduate Program in Computer ScienceUniversity of California, Riverside, December 2013
Dr. Michalis Faloutsos, Co-ChairpersonDr. Iulian Neamtiu, Co-Chairperson
The smartphone ecosystem encompasses smartphones’ hardware and software platform,
applications (apps) running on top of the platform, as well the infrastructural compo-
nents. As the smartphone ecosystem is becoming an important part of our daily life, it
is essential to profile, understand and, ultimately, secure the devices and the information
they collect and manipulate. To this end, we pave the way for understanding and im-
proving the smartphone ecosystem by designing tools as well as performing measurement
studies and security analyses.
In this dissertation, we describe several key steps that help us understand and
improve the Android smartphone ecosystem. First, we present the results of a long-term
evolution study on how the Android permission system is defined and used in practice;
our results indicate that the Android permission system is becoming less secure over
time. Second, we present a systematic approach and tool, named ProfileDroid, that
enables multi-layer profiling of Android apps. ProfileDroid has a myriad of applications
including behavioral app fingerprinting, enhancing users’ understanding and control of
app behavior, improving user experience, assessing performance and security implica-
vi
tions. Finally, the Bring Your Own Handheld-device (BYOH) phenomenon presents
novel management challenges to network administrators. We propose a systematic ap-
proach, Brofiler, for profiling the behavior of BYOHs along four dimensions: (a) protocol
and control plane, (b) data plane, (c) temporal behavior, and (d) across dimensions us-
ing the H-M-L model by considering the different levels of intensity in each dimension.
Using profiles from Brofiler, a network administrator can develop effective policies for
managing BYOHs.
vii
Contents
List of Figures x
List of Tables xi
1 Introduction 11.1 Motivation . . . . . . . . . . . . . . . . . . . . . . . . . . . . . . . . . . 11.2 Dissertation Overview . . . . . . . . . . . . . . . . . . . . . . . . . . . . 2
1.2.1 Permission Evolution in the Android Ecosystem . . . . . . . . . 21.2.2 Profiling Android Applications . . . . . . . . . . . . . . . . . . . 41.2.3 Enabling BYOH Management via Behavior-aware Profiling . . . 6
1.3 Contributions . . . . . . . . . . . . . . . . . . . . . . . . . . . . . . . . . 81.4 Organization . . . . . . . . . . . . . . . . . . . . . . . . . . . . . . . . . 8
2 The Android Platform Basics 102.1 Android Platform . . . . . . . . . . . . . . . . . . . . . . . . . . . . . . . 102.2 Android Apps . . . . . . . . . . . . . . . . . . . . . . . . . . . . . . . . . 112.3 Android Permissions . . . . . . . . . . . . . . . . . . . . . . . . . . . . . 12
3 Evolution of the Android Permission System 143.1 Dataset Description . . . . . . . . . . . . . . . . . . . . . . . . . . . . . 14
3.1.1 Platform Permissions Dataset . . . . . . . . . . . . . . . . . . . . 143.1.2 Apps Permissions Dataset . . . . . . . . . . . . . . . . . . . . . . 15
3.2 Platform Permission Evolution . . . . . . . . . . . . . . . . . . . . . . . 173.2.1 The List of Permissions is Growing . . . . . . . . . . . . . . . . . 173.2.2 Dangerous Group is Largest and Growing . . . . . . . . . . . . . 183.2.3 Why are Permissions Added or Deleted? . . . . . . . . . . . . . . 193.2.4 No Tendency Toward Finer-grained Permissions . . . . . . . . . 20
3.3 Third-party Apps . . . . . . . . . . . . . . . . . . . . . . . . . . . . . . . 213.3.1 Permission Additions Dominate . . . . . . . . . . . . . . . . . . . 213.3.2 Apps Want More Dangerous Permissions . . . . . . . . . . . . . 253.3.3 Macro and Micro Evolution Patterns . . . . . . . . . . . . . . . . 253.3.4 Apps Are Becoming Overprivileged . . . . . . . . . . . . . . . . . 28
3.4 Pre-installed Apps . . . . . . . . . . . . . . . . . . . . . . . . . . . . . . 29
viii
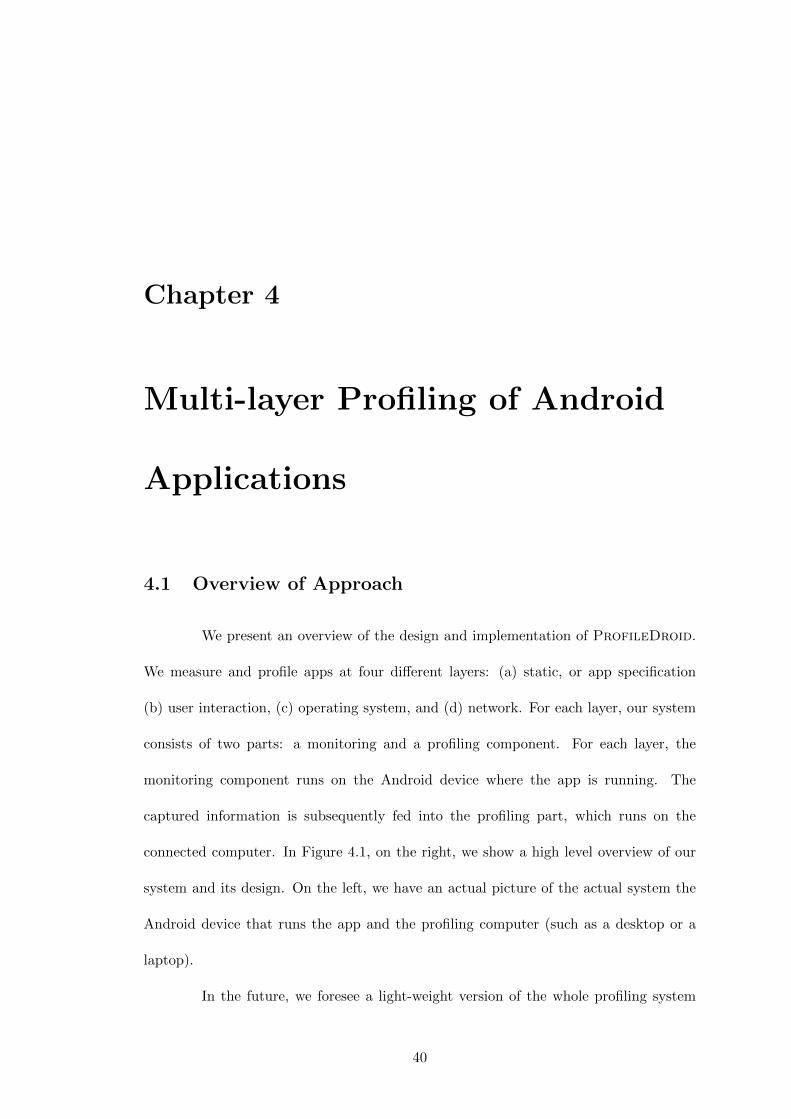
4 Multi-layer Profiling of Android Applications 404.1 Overview of Approach . . . . . . . . . . . . . . . . . . . . . . . . . . . . 40
4.1.1 Implementation and Challenges . . . . . . . . . . . . . . . . . . . 414.1.2 Experimental Setup . . . . . . . . . . . . . . . . . . . . . . . . . 43
4.2 Analyzing Each Layer . . . . . . . . . . . . . . . . . . . . . . . . . . . . 454.2.1 Static Layer . . . . . . . . . . . . . . . . . . . . . . . . . . . . . . 454.2.2 User Layer . . . . . . . . . . . . . . . . . . . . . . . . . . . . . . 474.2.3 Operating System Layer . . . . . . . . . . . . . . . . . . . . . . . 494.2.4 Network Layer . . . . . . . . . . . . . . . . . . . . . . . . . . . . 51
4.3 ProfileDroid: Profiling Apps . . . . . . . . . . . . . . . . . . . . . . . . . 564.3.1 Capturing Multi-layer Intensity . . . . . . . . . . . . . . . . . . . 564.3.2 Cross-layer Analysis . . . . . . . . . . . . . . . . . . . . . . . . . 584.3.3 Free Versions of Apps Could End Up Costing More Than Their
Paid Versions . . . . . . . . . . . . . . . . . . . . . . . . . . . . . 594.3.4 Heavy VM&IPC Usage Reveals a Security-Performance Trade-off 604.3.5 Most Network Traffic is not Encrypted . . . . . . . . . . . . . . . 614.3.6 Apps Talk to Many More Traffic Sources Than One Would Think 624.3.7 How Predominant is Google Traffic in the Overall Network Traffic? 62
4.4 Acknowledgement . . . . . . . . . . . . . . . . . . . . . . . . . . . . . . . 63
5 Enabling BYOH Management via Behavior-aware Profiling 725.1 Brofiler: Systematic Profiling . . . . . . . . . . . . . . . . . . . . . . 72
5.1.1 Datasets and Initial Statistics . . . . . . . . . . . . . . . . . . . . 725.1.2 Our Approach . . . . . . . . . . . . . . . . . . . . . . . . . . . . 745.1.3 The Utility of Our Approach . . . . . . . . . . . . . . . . . . . . 77
5.2 Studying and Profiling BYOHs . . . . . . . . . . . . . . . . . . . . . . . 785.2.1 Protocol and Control Plane . . . . . . . . . . . . . . . . . . . . . 805.2.2 Data Plane . . . . . . . . . . . . . . . . . . . . . . . . . . . . . . 825.2.3 Temporal Behavior . . . . . . . . . . . . . . . . . . . . . . . . . . 845.2.4 Multi-level Profiling and H-M-L Model . . . . . . . . . . . . . . . 87
5.3 Operational Issues and Solutions . . . . . . . . . . . . . . . . . . . . . . 945.3.1 Efficient DHCP Address Allocation . . . . . . . . . . . . . . . . . 955.3.2 Enforcing Data Usage Quotas . . . . . . . . . . . . . . . . . . . . 985.3.3 Towards Setting Access Control Policies . . . . . . . . . . . . . . 100
6 Related Work 1046.1 Android Security . . . . . . . . . . . . . . . . . . . . . . . . . . . . . . . 1046.2 Smartphone Measurements and Profiling . . . . . . . . . . . . . . . . . . 1066.3 Studies on Campus Network . . . . . . . . . . . . . . . . . . . . . . . . . 107
7 Conclusions and Future Work 1097.1 Future Directions . . . . . . . . . . . . . . . . . . . . . . . . . . . . . . . 110
Bibliography 112
ix
List of Figures
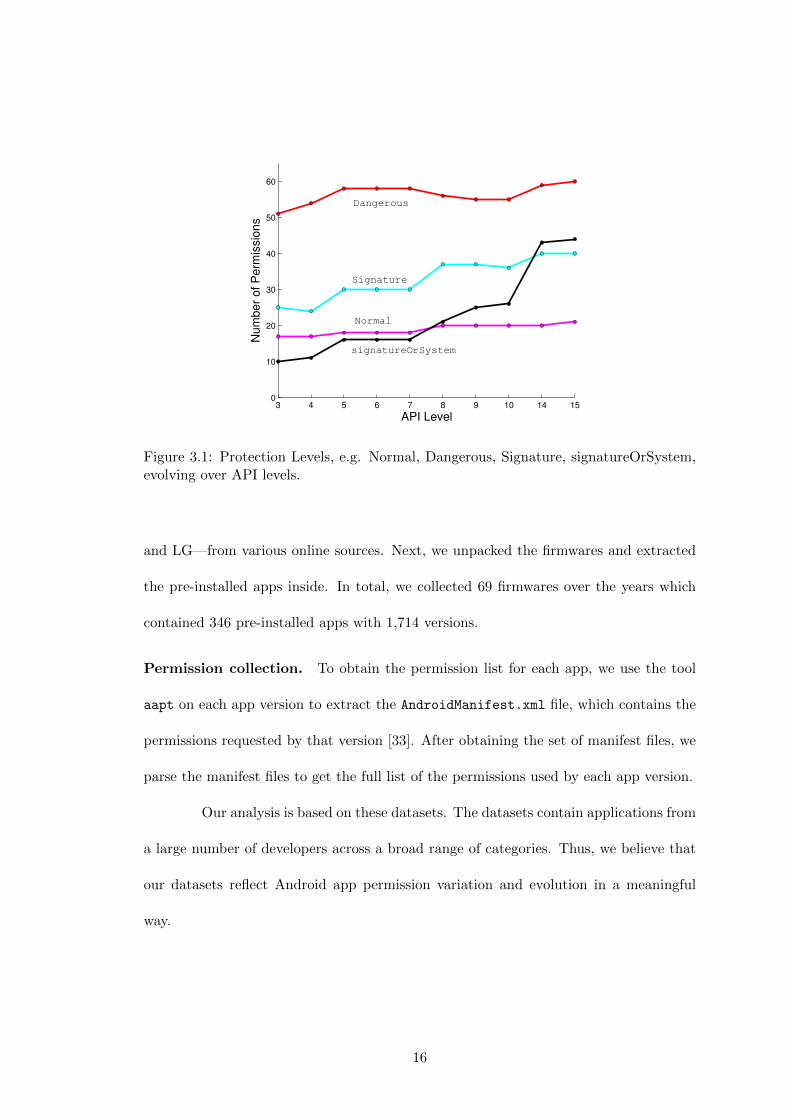
3.1 Protection Levels, e.g. Normal, Dangerous, Signature, signatureOrSys-tem, evolving over API levels. . . . . . . . . . . . . . . . . . . . . . . . . 16
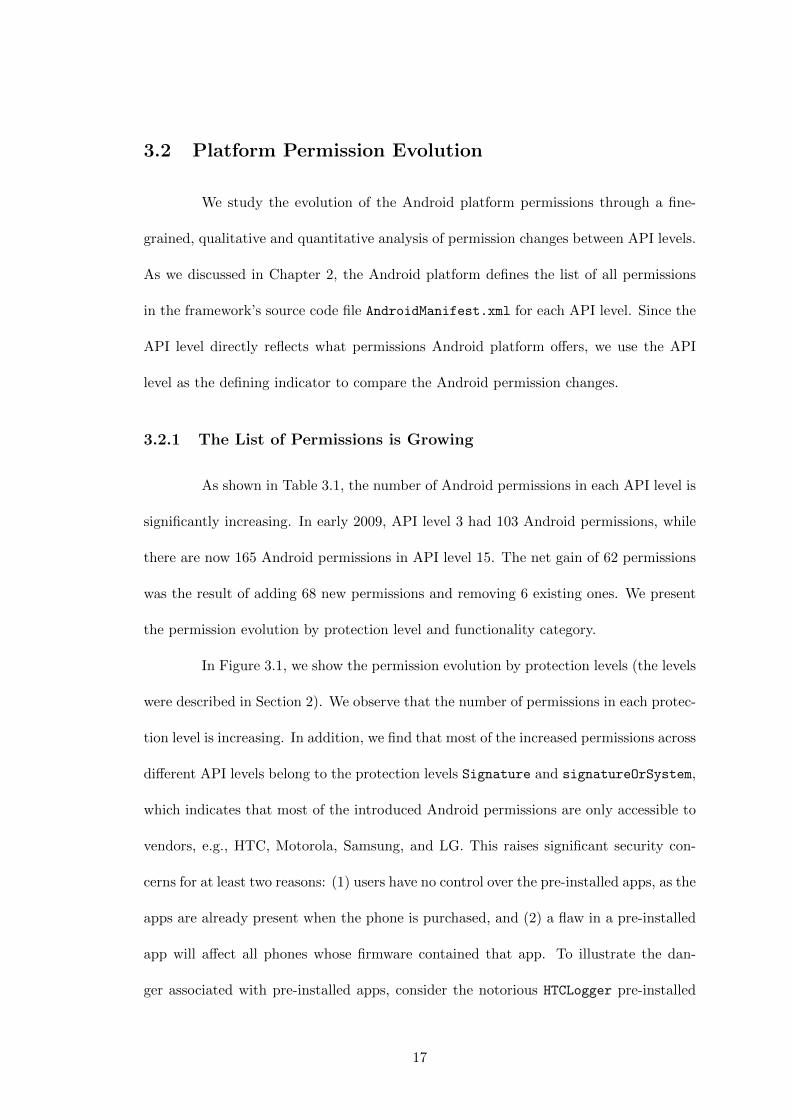
3.2 Functionally-similar permissions added and deleted between API levels. 193.3 Permission and protection level changes in the third-party apps. . . . . 223.4 Permission and protection level changes in the pre-installed apps. . . . . 233.5 Permission trajectories for popular apps. . . . . . . . . . . . . . . . . . . 273.6 Average number of permissions per app, for each protection level, from
stable and pre-installed datasets. . . . . . . . . . . . . . . . . . . . . . . 293.7 Overprivilege status and evolution in the stable dataset. . . . . . . . . . 31
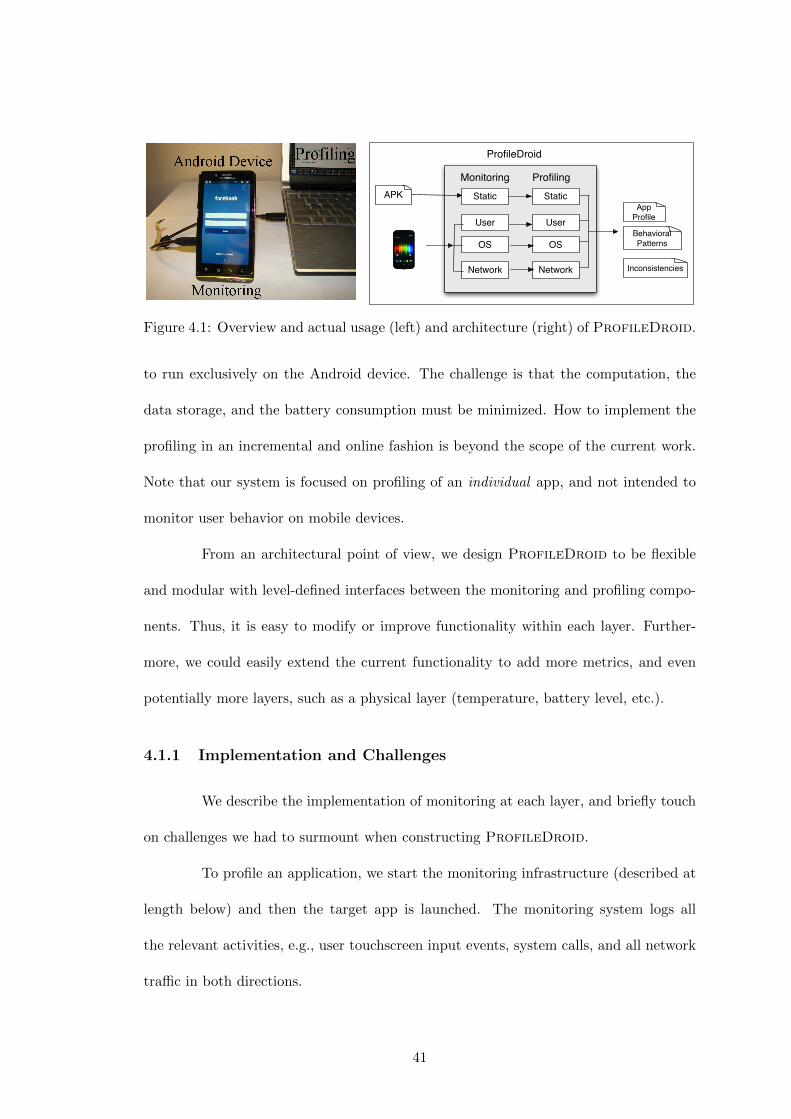
4.1 Overview and actual usage (left) and architecture (right) of ProfileDroid.41
4.2 Profiling results of user layer; note that scales are different. . . . . . . 47
5.1 System architecture of Brofiler. . . . . . . . . . . . . . . . . . . . . . 735.2 A visualization of Brofiler’s classification hierarchy: group designation
and number of BYOHs in each group. We use the H-M-L model to furtherrefine the leaves of the tree. . . . . . . . . . . . . . . . . . . . . . . . . . 77
5.3 Distribution of traffic volume per BYOH. . . . . . . . . . . . . . . . . . 825.4 Ratio of maximum daily traffic volume over total monthly traffic for each
device. . . . . . . . . . . . . . . . . . . . . . . . . . . . . . . . . . . . . . 835.5 Active BYOHs at each hour. . . . . . . . . . . . . . . . . . . . . . . . . 855.6 Distribution of days of appearance. . . . . . . . . . . . . . . . . . . . . . 875.7 Number of BYOHs per calendar day. . . . . . . . . . . . . . . . . . . . . 885.8 Number of IP leases vs. lease time. . . . . . . . . . . . . . . . . . . . . . 905.9 Number of days that each REG and NRE BYOH appears. . . . . . . . . . 915.10 Number of zero-traffic days in REG and NRE non-zero traffic BYOHs. . . 925.11 Coefficient of variance of normalized traffic between REG and NRE BYOHs. 935.12 DHCP traffic, measured as number of DHCP packets per day, before
(Original) and after applying our strategy (Emulation). . . . . . . . . . 965.13 Number of active leases before and after applying our strategy. “Differ-
ence” shows the differences of number of active leases between “Original”and “Emulation-30min.” . . . . . . . . . . . . . . . . . . . . . . . . . . . 97
x
List of Tables
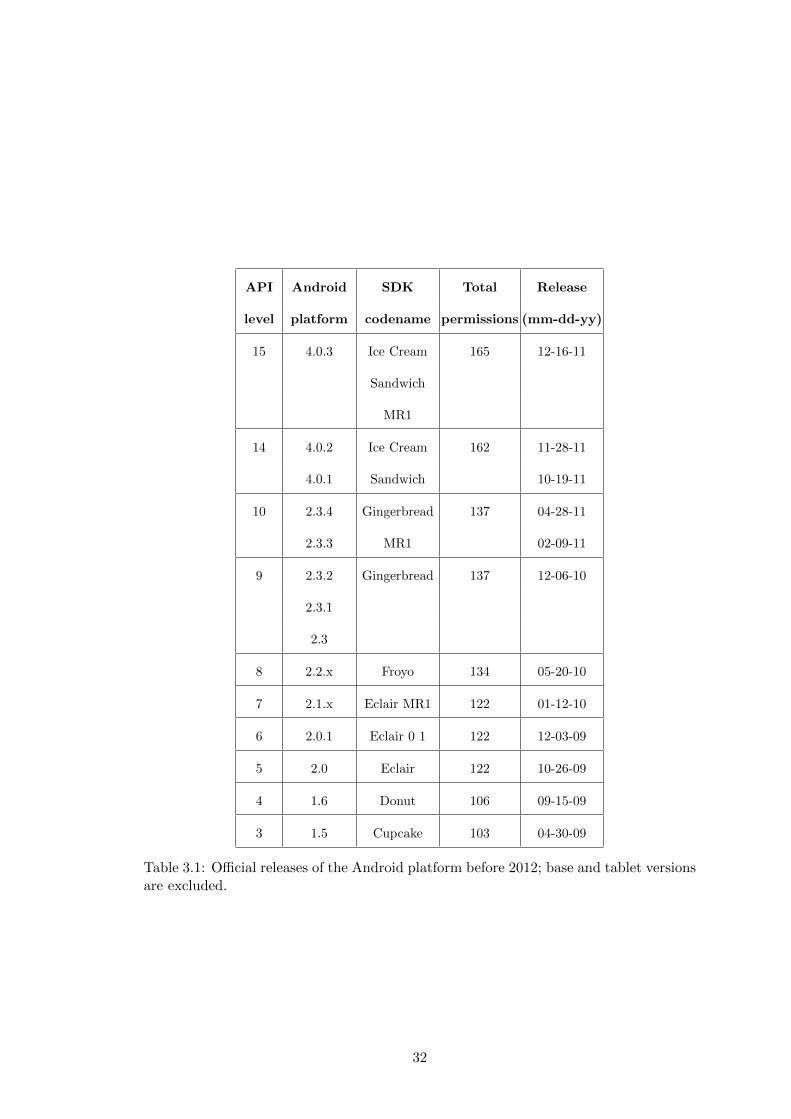
3.1 Official releases of the Android platform before 2012; base and tabletversions are excluded. . . . . . . . . . . . . . . . . . . . . . . . . . . . . 32
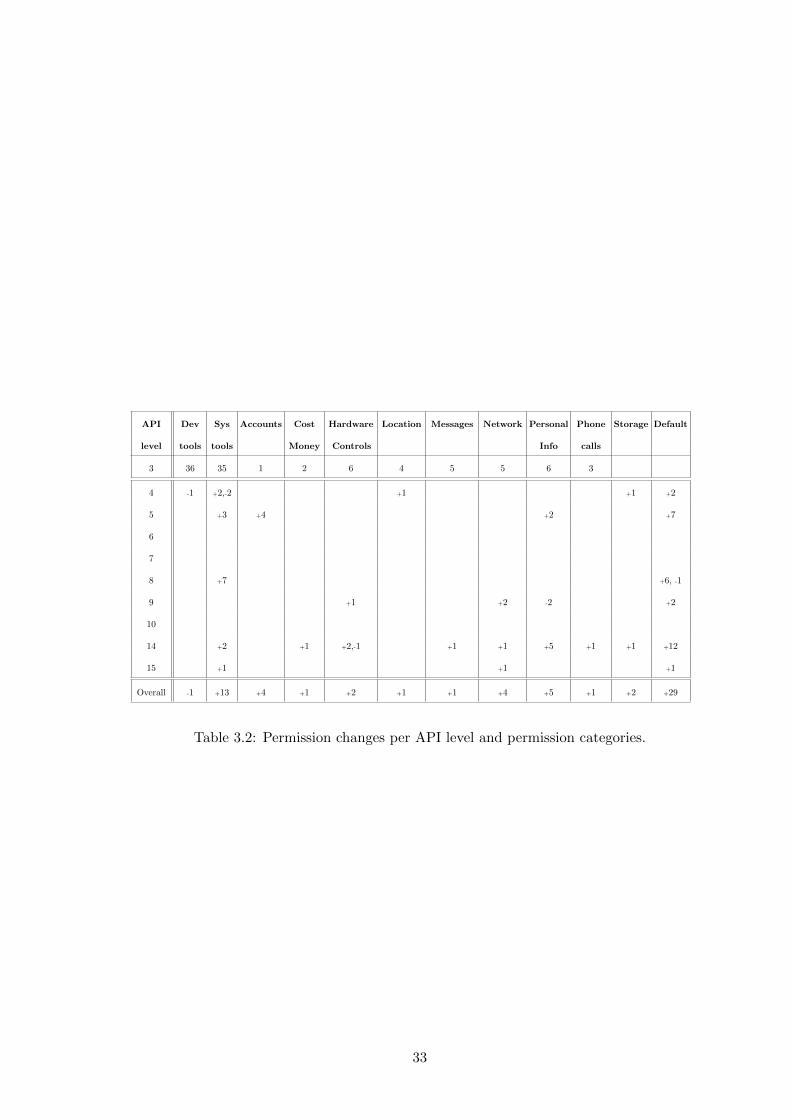
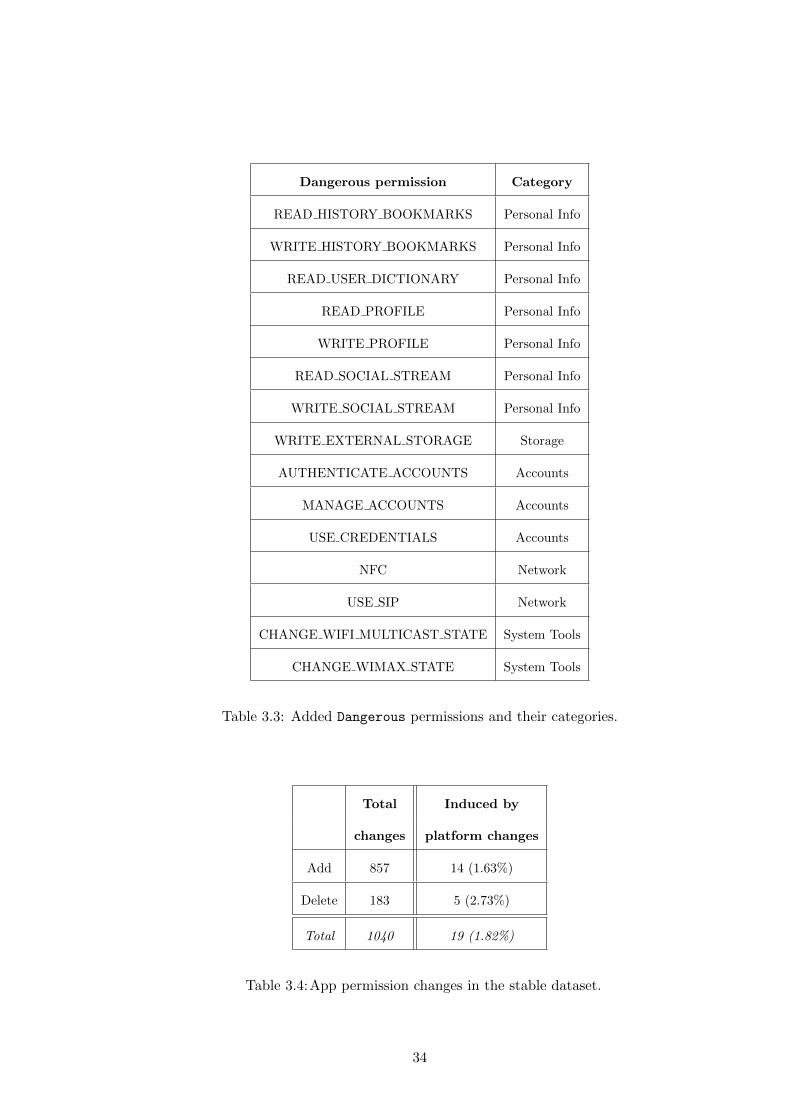
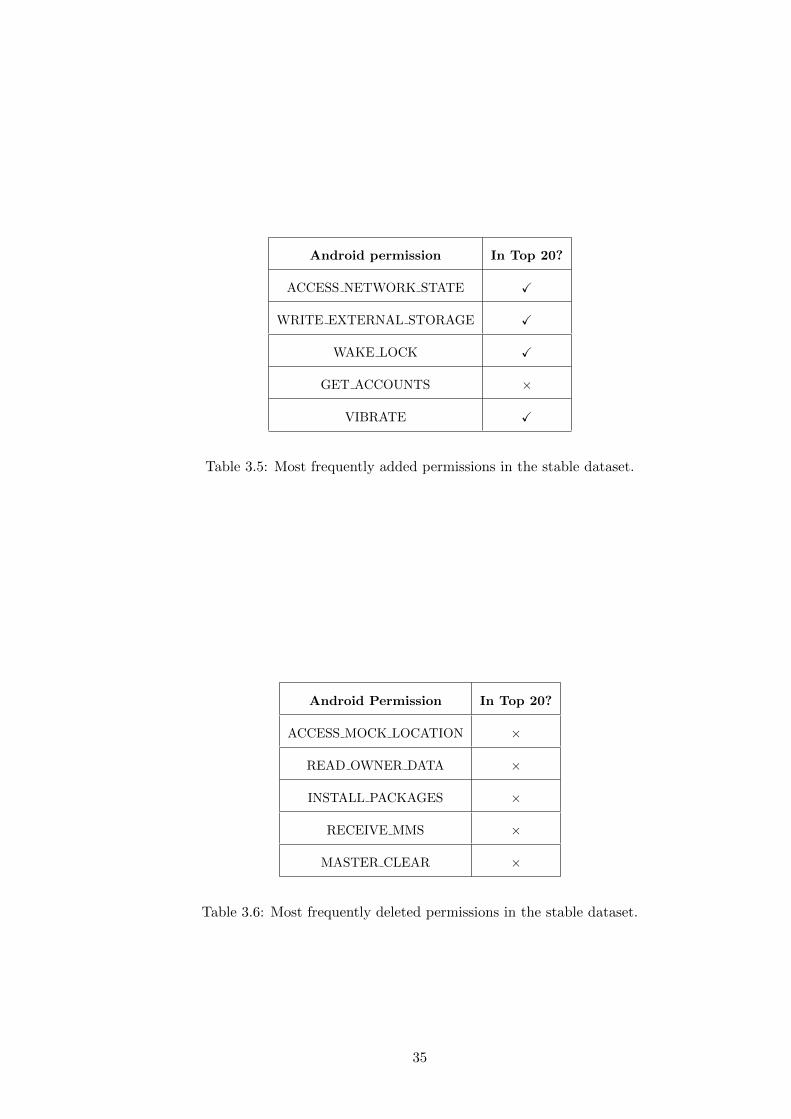
3.2 Permission changes per API level and permission categories. . . . . . . . 333.3 Added Dangerous permissions and their categories. . . . . . . . . . . . . 343.4 App permission changes in the stable dataset.. . . . . . . . . . . . . . . . 343.5 Most frequently added permissions in the stable dataset. . . . . . . . . . 353.6 Most frequently deleted permissions in the stable dataset. . . . . . . . . 353.7 Top-20 most frequent permissions requested by malware. . . . . . . . . . 363.8 Frequently used Dangerous Android permissions of stable dataset. . . . 373.9 Macro evolution patterns of permission usage in the stable dataset. . . . 373.10 Micro evolution patterns for the location permissions; Fine represents
the ACCESS FINE LOCATION permission, Coarse represents the ACCESS
COARSE LOCATION permission, and Both means both Fine and Coarse areused. . . . . . . . . . . . . . . . . . . . . . . . . . . . . . . . . . . . . . . 38
3.11 Evolution patterns of the privilege levels of the stable dataset, whereLegitimate represents legitimate privilege and Over represents overprivilege. 38
3.12 Most added permissions from the Legitimate→Over (58.57%) subset ofapps. . . . . . . . . . . . . . . . . . . . . . . . . . . . . . . . . . . . . . . 39
3.13 Most dropped permissions from the Over→Legitimate (32.14%) subset ofapps. . . . . . . . . . . . . . . . . . . . . . . . . . . . . . . . . . . . . . . 39
4.1 The test apps; app-$$ represents the paid version of an app. . . . . . . . 644.2 Profiling results of static layer; ‘X’ represents use via permissions, while
‘I’ via intents. . . . . . . . . . . . . . . . . . . . . . . . . . . . . . . . . . 654.3 Touch intensity vs. swipe/press ratio . . . . . . . . . . . . . . . . . . . . 664.4 Profiling results: operating system layer. . . . . . . . . . . . . . . . . . . 674.5 Profiling results of network layer; ‘–’ represents no traffic. . . . . . . . . 684.6 Thumbnails of multi-layer intensity in the H-M -L model (H:high, M :medium,
L:low). . . . . . . . . . . . . . . . . . . . . . . . . . . . . . . . . . . . . . 694.7 The ranges for five-number summary . . . . . . . . . . . . . . . . . . . . 704.8 Traffic sources for HTTPS. . . . . . . . . . . . . . . . . . . . . . . . . . 704.9 Number of distinct traffic sources per traffic category, and the ratio of
incoming to outgoing Google traffic; ‘–’ means no Google traffic. . . . . 71
5.1 Distribution of devices in dataset DHCP-366. . . . . . . . . . . . . . . . . 745.2 Top 5 HTTPS domains in our data by percentage of HTTPS traffic. . . 82
xi
5.3 Time regions vs. percentage of devices. . . . . . . . . . . . . . . . . . . . 855.4 Average IP requests per BYOH for each group. . . . . . . . . . . . . . . 895.5 Group definitions in the H-M-L model. . . . . . . . . . . . . . . . . . . . 895.6 Days of appearance v. daily traffic intensity in REG non-zero traffic BYOHs. 905.7 Top 5 domains for HL and LH BYOHs in the REG group (percentage is
the traffic fraction of total traffic from that group of devices). . . . . . . 915.8 Average improvements in DHCP traffic and IP availability under different
lease times. . . . . . . . . . . . . . . . . . . . . . . . . . . . . . . . . . . 975.9 Effect of enforcing a monthly quota. . . . . . . . . . . . . . . . . . . . . 995.10 Effect of enforcing a daily quota. . . . . . . . . . . . . . . . . . . . . . . 1005.11 The number of affected devices after enforcing blocking strategies at a
group level. . . . . . . . . . . . . . . . . . . . . . . . . . . . . . . . . . . 102
xii
Chapter 1
Introduction
1.1 Motivation
Smartphones are becoming the important devices for us in the post-PC era,
which aid in our daily tasks with the useful functionalities such as Internet, GPS, cam-
eras, NFC(Near Field Communication) and accelerometers. In addition, smartphone
applications are available in multiple application stores or markets(e.g., Google Play [4],
Amazon Android App Store [7] and iOS App Store [43]) that further spur the popularity
of smartphones. The smartphone ecosystem encompasses smartphones’ hardware and
software platform, applications (apps) running on top of the platform, as well the infras-
tructural components(e.g., networks and the cloud). In this dissertation, we focus on the
Android platform, which is open-source and the most popular mobile platform in current
market [31]. The popularity of the Android platform is driven by feature-rich Android
devices, as well as the myriad Android apps offered by a large community of developers.
Furthermore, users collect, store, and handle personal data via various Android applica-
tions. Android devices, Android applications and infrastructural components form the
whole “Android ecosystem” that influences our life significantly. However, we are just
1
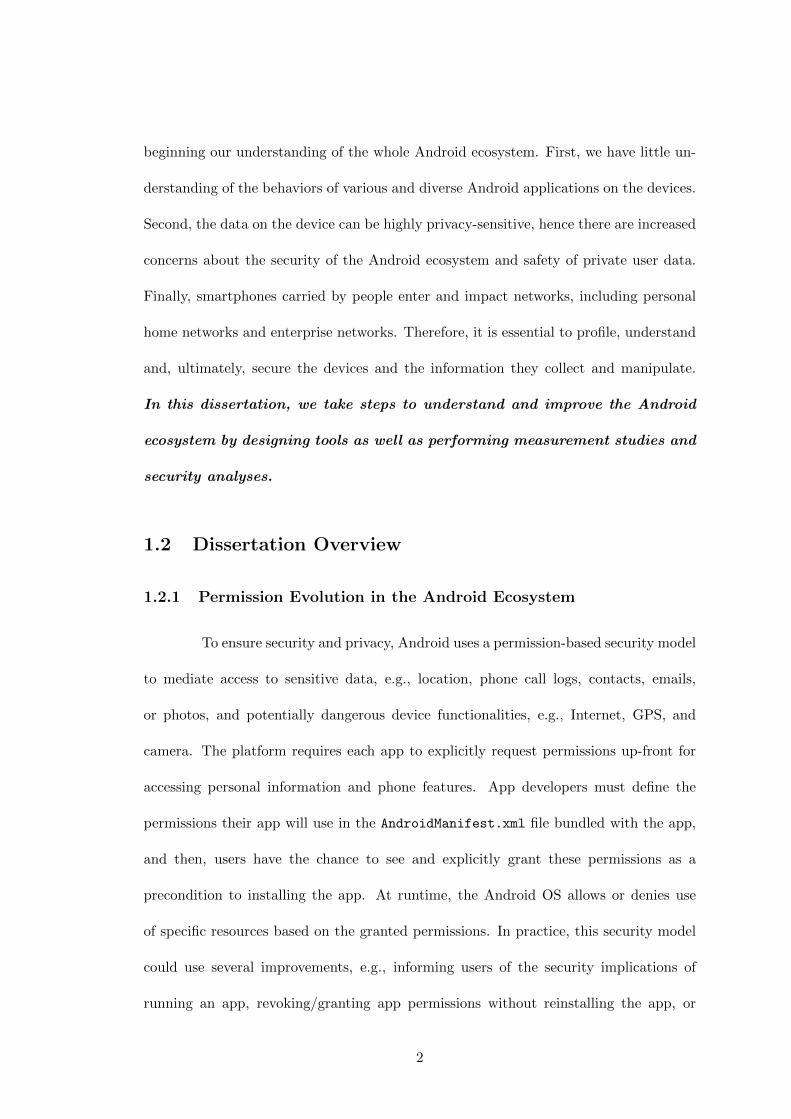
beginning our understanding of the whole Android ecosystem. First, we have little un-
derstanding of the behaviors of various and diverse Android applications on the devices.
Second, the data on the device can be highly privacy-sensitive, hence there are increased
concerns about the security of the Android ecosystem and safety of private user data.
Finally, smartphones carried by people enter and impact networks, including personal
home networks and enterprise networks. Therefore, it is essential to profile, understand
and, ultimately, secure the devices and the information they collect and manipulate.
In this dissertation, we take steps to understand and improve the Android
ecosystem by designing tools as well as performing measurement studies and
security analyses.
1.2 Dissertation Overview
1.2.1 Permission Evolution in the Android Ecosystem
To ensure security and privacy, Android uses a permission-based security model
to mediate access to sensitive data, e.g., location, phone call logs, contacts, emails,
or photos, and potentially dangerous device functionalities, e.g., Internet, GPS, and
camera. The platform requires each app to explicitly request permissions up-front for
accessing personal information and phone features. App developers must define the
permissions their app will use in the AndroidManifest.xml file bundled with the app,
and then, users have the chance to see and explicitly grant these permissions as a
precondition to installing the app. At runtime, the Android OS allows or denies use
of specific resources based on the granted permissions. In practice, this security model
could use several improvements, e.g., informing users of the security implications of
running an app, revoking/granting app permissions without reinstalling the app, or
2
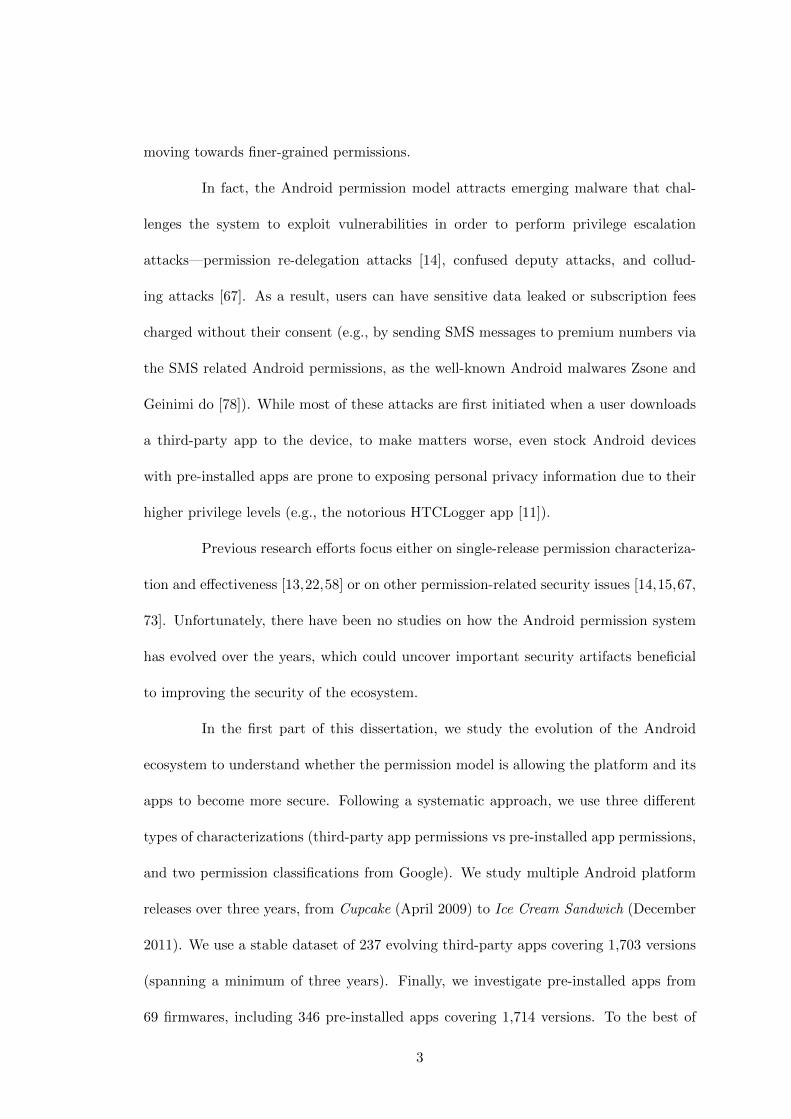
moving towards finer-grained permissions.
In fact, the Android permission model attracts emerging malware that chal-
lenges the system to exploit vulnerabilities in order to perform privilege escalation
attacks—permission re-delegation attacks [14], confused deputy attacks, and collud-
ing attacks [67]. As a result, users can have sensitive data leaked or subscription fees
charged without their consent (e.g., by sending SMS messages to premium numbers via
the SMS related Android permissions, as the well-known Android malwares Zsone and
Geinimi do [78]). While most of these attacks are first initiated when a user downloads
a third-party app to the device, to make matters worse, even stock Android devices
with pre-installed apps are prone to exposing personal privacy information due to their
higher privilege levels (e.g., the notorious HTCLogger app [11]).
Previous research efforts focus either on single-release permission characteriza-
tion and effectiveness [13,22,58] or on other permission-related security issues [14,15,67,
73]. Unfortunately, there have been no studies on how the Android permission system
has evolved over the years, which could uncover important security artifacts beneficial
to improving the security of the ecosystem.
In the first part of this dissertation, we study the evolution of the Android
ecosystem to understand whether the permission model is allowing the platform and its
apps to become more secure. Following a systematic approach, we use three different
types of characterizations (third-party app permissions vs pre-installed app permissions,
and two permission classifications from Google). We study multiple Android platform
releases over three years, from Cupcake (April 2009) to Ice Cream Sandwich (December
2011). We use a stable dataset of 237 evolving third-party apps covering 1,703 versions
(spanning a minimum of three years). Finally, we investigate pre-installed apps from
69 firmwares, including 346 pre-installed apps covering 1,714 versions. To the best of
3
our knowledge, this is the first longitudinal study on Android permissions and the first
study that sheds light on the co-evolution of the whole Android ecosystem: platform,
third-party apps, and pre-installed apps.
Our overall conclusion is that the security and privacy of the ecosystem (plat-
form and apps) do not improve, at least from the user’s point of view. For example,
the evolution moves more and more toward violating the principle of least privilege, a
fundamental security tenet [77].
1.2.2 Profiling Android Applications
Given an Android app, how can we get an informative thumbnail of its be-
havior? This is the problem we set to address here, in light of more than 800,000 apps
currently on Google Play (ex Android Market) [4, 8]. Given this substantial number of
apps, we consider scalability as a key requirement. In particular, we devise a profiling
scheme that works even with limited resources in terms of time, manual effort, and cost.
We define limited resources to mean: a few users with a few minutes of experimentation
per application. At the same time, we want the resulting app profiles to be comprehen-
sive, useful, and intuitive. Therefore, given an app and one or more short executions,
we want a profile that captures succinctly what the app did, and contrast it with: (a)
what it was expected or allowed to do, and (b) other executions of the same app. For
example, an effective profile should provide: (a) how apps use resources, expressed in
terms of network data and system calls, (b) the types of device resources (e.g., camera,
telephony) an app accesses, and whether it is allowed to, and (c) what entities an app
communicates with (e.g., cloud or third-party servers).
Who would be interested in such a capability? We argue that an inexpensive
solution would appeal to everyone who “comes in contact” with the app, including: (a)
4
the app developer, (b) the owner of an Android app market, (c) a system administrator,
and (d) the end user. Effective profiling can help us: (a) enhance user control, (b)
improve user experience, (c) assess performance and security implications, and (d) facil-
itate troubleshooting. We envision our quick and cost-effective thumbnails (profiles) to
be the first step of app profiling, which can then have more involved and resource-intense
steps, potentially based on what the thumbnail has revealed.
Despite the flurry of research activity in this area, there is no approach yet that
focuses on profiling the behavior of an Android app itself in all its complexity. Several
efforts have focused on analyzing the mobile phone traffic and show the protocol related
properties, but they do not study the apps themselves [34, 37]. Others have studied
security issues that reveal the abuse of personal device information [50, 74]. However,
all these works: (a) do not focus on individual apps, but report general trends, or (b)
focus on a single layer, studying, e.g., the network behavior or the app specification
in isolation. For example, some apps have negligible user inputs, such as Pandora, or
negligible network traffic, such as Advanced Task Killer, and thus, by focusing only
on one layer, the most significant aspect of an application could be missed.
We design and implement ProfileDroid, a systematic and comprehensive
system for profiling Android apps. A key novelty is that our profiling spans four layers:
(a) static, i.e., app specification, (b) user interaction, (c) operating system, and (d)
network. To the best of our knowledge, this is the first work that considers all these layers
in profiling individual Android app. Our contributions are twofold. First, designing the
system requires the careful selection of informative and intuitive metrics, which capture
the essence of each layer. Second, implementing the system is a non-trivial task, and we
have to overcome numerous practical challenges.1
1Examples include fine-tuning data collection tools to work on Android, distinguishing between
5
We demonstrate the capabilities of our system through experiments. We profile
19 free apps; for 8 of these, we also profile their paid counterparts, for a total of 27 apps.
For each app, we gather profiling data from 30 runs for several users at different times
of day. Though we use limited testing resources, our results show that our approach can
effectively profile apps, and detect surprising behaviors and inconsistencies. Finally, we
show that cross-layer app analysis can provide insights and detect issues that are not
visible when examining single layers in isolation [76].
1.2.3 Enabling BYOH Management via Behavior-aware Profiling
Smartphones and tablets are becoming ubiquitous in companies and universi-
ties. These devices are used more and more to complement, or even replace, desktops
and laptops for computational needs: Gartner market research indicates that in the sec-
ond quarter of 2013 worldwide PC shipments declined by 10.9%, while smartphone sales
grew by 46.5% [30,32]; hence the Bring Your Own Handheld-device (BYOH) practice is
going to increase. We use the term BYOH to describe only smartphones and tablets,
in accordance with the National Institute of Standards and Technology’s definition [57].
In other words, we consider a device as BYOH if it runs a mobile OS, such as Android,
iOS, or BlackBerry OS.
We argue that BYOHs deserve to be studied as a new breed of devices. First,
every time a new technology or a new killer app emerges, IT departments must re-
evaluate the way they manage their networks. Network administrators must understand
the behavior of BYOHs in order to manage them effectively. Second, it is clear that
BYOHs introduce different technologies and user behaviors: (a) BYOHs join and leave
the network frequently, (b) their form factor enables novel uses compared to desktops and
presses and swipes, and disambiguating app traffic from third-party traffic.
6
laptops, (c) they run different operating systems compared to other computing devices,
and (d) the apps that can run on them introduce a slew of management challenges [27,
42,76,78].
The problem we address here is: what does the network administrator need
to know about BYOHs? Specifically, we identify two key questions: (a) how do these
devices behave? and (b) how can we manage operational concerns, such as the stress
exerted on network resources? Given our interest in the network administrator’s point
of view, we have consulted with administrators of two different large networks, and our
study has been largely shaped by their concerns and feedback. Both administrators
admitted that there is a great need to better understand what BYOHs do, in order to
devise better policies to manage them.
Most prior efforts have focused on studying either the aggregate network traf-
fic incurred by smartphones and tablets, or performance and network protocol issues,
such as TCP and download times or mobility issues [6, 29, 34, 37, 70]. In addition, ex-
isting approaches for managing traffic assume certain software installations on devices
or embed tracking libraries in enterprise architectures. However, in practice, network
administrators usually have no control over the software running on BYOHs, which
makes it difficult to control the behavior of these devices [27]. To the best of our knowl-
edge, no prior work has focused on understanding individual BYOH behavior in campus
networks, with a view towards managing and provisioning network resources on-the-fly.
In this dissertation, we propose ProfileDroid (BYOH profiler), a system-
atic approach to profiling the behavior of BYOHs in a device-centric way. In addition,
we arguably provide the first multi-dimensional study on the behavior of BYOHs from
a network administrator’s point of view.
7
1.3 Contributions
In this dissertation, we describe several key steps that help us understand and
improve the Android smartphone ecosystem.
1. We present the results of a long-term evolution study on Android permission sys-
tem, the basic security mechanism in Android OS, is defined and used in practice;
our results indicate that the Android permission system is becoming less secure
over time.
2. We present a systematic approach and tool, named ProfileDroid, that enables
multi-layer profiling of Android apps. ProfileDroid has a myriad of applications
including behavioral app fingerprinting, enhancing users’ understanding and con-
trol of app behavior, improving user experience, assessing performance and security
implications.
3. The Bring Your Own Handheld-device (BYOH) phenomenon presents novel man-
agement challenges to network administrators. We propose a systematic approach,
Brofiler, for profiling the behavior of BYOHs along four dimensions: (a) protocol
and control plane, (b) data plane, (c) temporal behavior, and (d) across dimen-
sions using the H-M-L model by considering the different levels of intensity in
each dimension. Using profiles from Brofiler, a network administrator can develop
effective policies for managing BYOHs.
1.4 Organization
This dissertation is organized as follows: we present an overview of our disser-
tation(Chapter 1) in the beginning. Then, we present the Android platform in detail in
8
Chapter 2. In the following(Chapters 3, 4, 5), we present our three steps to understand
and improve the smartphone ecosystem. We discuss related work in Chapter 6 and
conclude our dissertation in Chapter 7.
9
Chapter 2
The Android Platform Basics
We now present an overview of the Android platform, Android permission
model and a set of definitions for the concepts used throughout the dissertation.
2.1 Android Platform
Android was launched as an open-source mobile platform in 2008 and is widely
used by smartphone manufacturers, e.g., HTC, Motorola, Samsung [31]. The software
stack consists of a custom Linux system, the Dalvik Virtual Machine (VM), and apps
running on top of the VM. Each app runs in its own copy of the VM with a different user
id, hence apps are protected from each other. A permission model, explained shortly,
protects sensitive resources, e.g., the hardware and stored data. In this model, resources
are protected by permissions, and only apps holding the permission (which is granted
when the app is installed) are given access to the permission-protected resource.
API Levels. To facilitate app construction, the Android platform provides a rich
framework to app developers. The framework consists of Android packages and classes,
attributes for declaring and accessing resources, a set of Intents, and a set of permis-
10
sions that applications can request. This framework is accessible to apps via the Android
application programming interface (API). The Android platform has undergone many
changes since its inception in 2008, and each major release forms a new API level. In
this dissertation, we studied the major API levels, from level 3 (April 2009) to level
15 (December 2011); levels 1 and 2 did not see wide adoption. With each API up-
grade, the older replaced parts are deprecated instead of being removed, so that existing
applications can still use them [10].
2.2 Android Apps
In addition to the platform, the Android ecosystem contains two main app
categories: third-party and pre-installed.
Third-party apps are available for download from Google Play (previously known as
Android Market [4]) and other app stores, such as Amazon. These Android apps are
developed by individual third-party developers, which can include software companies
or individuals around the world. Malicious apps, designed for nefarious purposes, form
a special class of third-party apps.
Pre-installed apps come along with the devices from the vendors; they are developed
and loaded in the devices before the devices ever reach the user in the market. These
apps can be designed and configured exclusively per device model depending on the
needs of particular manufacturers and phone service carriers by the vendor developers.
11
2.3 Android Permissions
The set of all Android permissions is defined in the AndroidManifest.xml
source file of the Android platfrom [33]. To access resources from Android devices, each
Android app, third-party and pre-installed alike, requests permissions for resources by
listing the permissions in the app’s AndroidManifest.xml file. When the user wants
to install an app, this list of permissions is presented and confirmation is requested; if
the user confirms the access, the app will have the requested permissions at all times
(until the app is uninstalled). The platform release of API Level 15 contains a list of
165 permissions; examples of permissions are INTERNET which allows the app to use the
Internet, ACCESS FINE LOCATION which gives an app access to the GPS location, and
NFC which lets the app use near-field communication. Android defines two categories of
Android permissions: Protection Level and Functionality Group, described next.
Protection level. The levels refer to the intended use of a permission, as well as the
consequences of using the permission.
1. Normal permissions present minimal risk to Android apps and will be granted
automatically by the Android platform without the user’s explicit approval.
2. Dangerous permissions provide access to the user’s personal sensitive data and
various device features. Apps requesting dangerous permissions can only be in-
stalled if the user approves the permission request. These are the only permissions
displayed to the user upon installation.
3. Signature permissions signify the highest privilege; they can only be obtained if
the requesting app is signed with the device manufacturer’s certificate.
4. signatureOrSystem permissions are only granted to apps that are in the Android
12
system image or are signed with the same certificate in the system image. Permis-
sions in this category are used for certain special situations where multiple vendors
have apps built into a system image and need to share specific features explicitly
because they are being built together.
Note that the definition of protection level clearly constrains the privilege for each
Android permission: third-party apps can only use Normal and Dangerous permissions.
However, pre-installed apps can use permissions in all four protection levels. When
third-party apps request Signature or signatureOrSystem permissions, the request is
ignored by the platform.
Functionality categories. Android also defines a set of permission categories based
on functionality; in total there are 11 categories, with self-explanatory names: Cost
Money, Message, Personal Info, Location, Network, Accounts, Hardware Controls,
Phone Calls, Storage, System Tools and Development Tools. There is also a Default
category that is used when no category is specified in the definition of an Android per-
mission [9].
13
Chapter 3
Evolution of the Android
Permission System
3.1 Dataset Description
In this section, we describe the process we used to collect the permission
datasets from the Android ecosystem.
3.1.1 Platform Permissions Dataset
Table 3.1 presents the evolution of the platform permissions: for each API level
(column 1) we show the platform release number (column 2), the textual codename of
the release (column 3), the number of permissions defined in that release (column 4),
and the release date (last column). Note that we exclude API levels 1 and 2, as the
platform only gained wide adoption starting with API level 3. Also, we exclude releases
3.x (named Honeycomb, API levels 11–13); Honeycomb can be regarded as a separate
evolutionary branch as it was designed for tablets only, not for smartphones, its source
14
code was not open-source at release, and it was eventually merged into platform version
4.0.
To obtain the permission definitions for each API level, we extracted the file
AndroidManifest.xml from each release [33]. We then analyzed the changes in permis-
sions between successive releases.
3.1.2 Apps Permissions Dataset
Third-party apps. We characterize permission usage evolution in third-party apps
based on a stable set of 237 popular apps with 1,703 versions that span at least three
years. We chose these apps because they are widely-used, have releases associated in
each API level, and have more than one release per year; hence we could observe how
apps evolve and how changes in the platform might lead to changes in apps.
Selecting this stable dataset was far from trivial, and was an involved process.
First, we seeded the dataset with 1,100 apps (Top-50 free apps from each category) [72].
Then we crawled historic versions of apps from online repositories, and then retrieved
their latest versions from Google Play [2,4]; in total, this initial set contained 1,420 apps
with 4,857 versions. Next, we selected only those apps that had at least one version each
year between 2009 and 2012. Finally, after eliminating those apps that did not match
our requirements, we obtained the stable dataset of 237 apps with 1,703 versions, with
each app’s evolution spanning at least three years.
Pre-installed apps. Pre-installed apps are much more difficult to obtain because
they are not distributed online by vendors—they come with the phone; moreover, the
sets of pre-installed apps vary widely among phones and manufacturers. Therefore, to
collect pre-installed apps, we used a different process compared to third-party apps.
First, we gathered the firmwares of multiple phone vendors—HTC, Motorola, Samsung,
15
3 4 5 6 7 8 9 10 14 150
10
20
30
40
50
60
API Level
Nu
mb
er
of
Pe
rmis
sio
ns
signatureOrSystem
Normal
Signature
Dangerous
Figure 3.1: Protection Levels, e.g. Normal, Dangerous, Signature, signatureOrSystem,evolving over API levels.
and LG—from various online sources. Next, we unpacked the firmwares and extracted
the pre-installed apps inside. In total, we collected 69 firmwares over the years which
contained 346 pre-installed apps with 1,714 versions.
Permission collection. To obtain the permission list for each app, we use the tool
aapt on each app version to extract the AndroidManifest.xml file, which contains the
permissions requested by that version [33]. After obtaining the set of manifest files, we
parse the manifest files to get the full list of the permissions used by each app version.
Our analysis is based on these datasets. The datasets contain applications from
a large number of developers across a broad range of categories. Thus, we believe that
our datasets reflect Android app permission variation and evolution in a meaningful
way.
16
3.2 Platform Permission Evolution
We study the evolution of the Android platform permissions through a fine-
grained, qualitative and quantitative analysis of permission changes between API levels.
As we discussed in Chapter 2, the Android platform defines the list of all permissions
in the framework’s source code file AndroidManifest.xml for each API level. Since the
API level directly reflects what permissions Android platform offers, we use the API
level as the defining indicator to compare the Android permission changes.
3.2.1 The List of Permissions is Growing
As shown in Table 3.1, the number of Android permissions in each API level is
significantly increasing. In early 2009, API level 3 had 103 Android permissions, while
there are now 165 Android permissions in API level 15. The net gain of 62 permissions
was the result of adding 68 new permissions and removing 6 existing ones. We present
the permission evolution by protection level and functionality category.
In Figure 3.1, we show the permission evolution by protection levels (the levels
were described in Section 2). We observe that the number of permissions in each protec-
tion level is increasing. In addition, we find that most of the increased permissions across
different API levels belong to the protection levels Signature and signatureOrSystem,
which indicates that most of the introduced Android permissions are only accessible to
vendors, e.g., HTC, Motorola, Samsung, and LG. This raises significant security con-
cerns for at least two reasons: (1) users have no control over the pre-installed apps, as the
apps are already present when the phone is purchased, and (2) a flaw in a pre-installed
app will affect all phones whose firmware contained that app. To illustrate the dan-
ger associated with pre-installed apps, consider the notorious HTCLogger pre-installed
17
app, in which users of certain HTC phones were exposed to a significant security flaw.
HTCLogger was designed to log device information for the development community in
order to debug device-specific issues; as such, the app collects account names, call and
SMS data, GPS location, etc. Unfortunately, the app stored the collected information
without encrypting it and made it available to any application that had the Internet
permission [11].
In Table 3.2, we show the permission evolution by functionality categories:
each column contains a category, each row corresponds to an API level, and cell data
indicates the number of permissions added and deleted in that API level; note that, the
first row shows the number of permissions in each category of API 3. We find that the
number of permissions in nearly all the categories is increasing, with the exception of the
Personal Information category, which yielded a decrease in the number of permissions
from API 8 to 9, as shown in Table 3.2. After grouping the Android permissions into the
11 functionality categories, we find that the Default, System Tools and Development
Tools categories contribute to most of the increases. Newly-added permissions in these
categories allow developers and applications to take advantage of the evolving hardware
capabilities and features of the device. We now proceed to providing observations on
permission evolution at a finer-grained level.
3.2.2 Dangerous Group is Largest and Growing
From Figure 3.1, we can see that the Dangerous permission level vastly out-
numbers all other permission types at all times. Note that the Dangerous permission
set is still growing, even though it is already the largest. We further investigated the
growth of permissions in the Dangerous protection level.
18
.
.API7
API8
API9
API10
API14
API15
READ_OWNER_DATA(Dangerous)
READ_PROFILE(Dangerous)
READ_SOCIAL_STREAM(Dangerous)
SEND_SMS(Dangerous)
SEND_SMS(Dangerous)
SEND_SMS_NO_CONFIRMATION(SignatureOrSystem)
READ_PHONE_STATE(Dangerous)
READ_PHONE_STATE(Dangerous)
READ_PRIVILEGED_PHONE_STATE(SignatureOrSystem)
Figure 3.2: Functionally-similar permissions added and deleted between API levels.
As shown in Table 3.3, Dangerous permissions are added in 5 out of 11 cat-
egories. Most of them are from personal data-related categories, e.g, PERSONAL INFO,
STORAGE and ACCOUNTS. We believe that this evolutionary trend shows that the Android
platform provides more channels to harvest personal information from the device, which
could increase the privacy breach risk if these permissions may be abused by Android
apps.
3.2.3 Why are Permissions Added or Deleted?
To understand the rationale behind permission addition and deletion, we stud-
ied the commit history (log messages and source code diffs) of the Android developer
code repository [33].
We found that, in most cases, permissions are added and deleted to offer access
to more functionality offered by the device. Advances in the hardware strongly motivate
such permission evolution. For instance, in API level 9, new hardware technology for
near-field communication led to the introduction of a permission to access NFC. In API
level 15, a permission to access WiMAX is introduced in order to access 4G networks.
Permissions can also be deleted to accommodate new smartphone features when
19
they are removed and replaced by new permissions. For example, READ OWNER DATA was
deleted after API level 8, but two new, related permissions, READ PROFILE and READ
SOCIAL STREAM were added in level 14.
Interestingly, some permissions were added in the earlier API levels while
deleted later, as the associated functionalities are made available to public without
manifest-declared permissions. For example, BACKUP DATA was added in API level 5,
but deleted in level 8, because the backup/restore function was made available to all
apps by default.
Furthermore, most of the added permissions are permissions categorized as
Default, System Tools and Development Tools, which are mostly used to access sys-
tem level information to function and debug the Android apps. However, as we discussed
before, most of those permissions are in the Signature and signatureOrSystem pro-
tection levels that are only available to vendor developers in pre-installed apps. This
indicates that the added permissions facilitate the development of pre-installed apps by
vendor developers, instead of third-party apps by third-party developers. The extended
aid to vendors is somewhat adverse, since third-party developers are the dominant and
active force in the Android ecosystem.
3.2.4 No Tendency Toward Finer-grained Permissions
Finer-grained permissions in Android, e.g., separating the advertisement code
permissions from host app permissions [60], have been advocated by security groups
from both academia and industry [22, 54, 72]. The basis for finer-grained permissions
is the principle of least privilege, i.e., giving apps the minimum number of permissions
necessary to provide a certain level of service.
We investigated whether Android permissions are becoming more fine-grained
20
over time. After carefully examining the Android permissions from API level 3 to 15,
we observe that the permission changes do not tend to become more fine-grained(We
found only one possible example of a permission splitting in READ OWNER DATA). However,
there is no indication that the two new permissions were specifically designed to replace
the previous one, as shown in the first example of Figure 3.2. Overwhelmingly, the
permission changes indicate that the Android platform is giving more flexibility and
control to the phone vendors. For example, as shown in Figure 3.2, SEND SMS and
PHONE STATE permissions exist in both API level 10 and 14, but the newly added Android
permissions SEND SMS NO CONFIRMATION and READ PRIVILEGED PHONE STATE gives the
app a higher privileged access to the device. Further, those higher privileged permissions
are signatureOrSystem permissions, which can only used by vendor developers. In
summary, we do not observe the evolution of Android permissions that is trending to
provide more fine-grained permissions.
3.3 Third-party Apps
We now change our focus and investigate the variation and evolution of per-
missions from the perspective of the driving force of the Android ecosystem: the apps.
We investigate two types of apps, third-party apps and pre-installed apps; we present
and discuss the permission usage of Android apps across different versions and their
evolution.
3.3.1 Permission Additions Dominate
We analyzed the permissions added and deleted in the 1,703 versions of the
237 third-party apps in our stable dataset. In Figure 3.3(a) we show the distribution of
21
−10 −5 0 5 10 15 200
10
20
30
40
50
60
70
Number of Permission Changes
Pe
rce
nta
ge
of
Da
tase
t
Permission Changes of Stable Dataset
(a)
−3−2−1 0 1 2 3 4 5 6 7 8 9 10 140
10
20
30
40
50
60
70
Number of Permission Changes
Pe
rce
nta
ge
of
Da
tase
t
Dangerous Permission Changes of Stable Dataset
(b)
Normal Dangerous Sig Sig or Sys−100
0
100
200
300
400
500
Protection Level
Nu
mb
er
of
Pro
tectio
n L
evel C
ha
ng
es
Added and Dropped Permissions
(c)
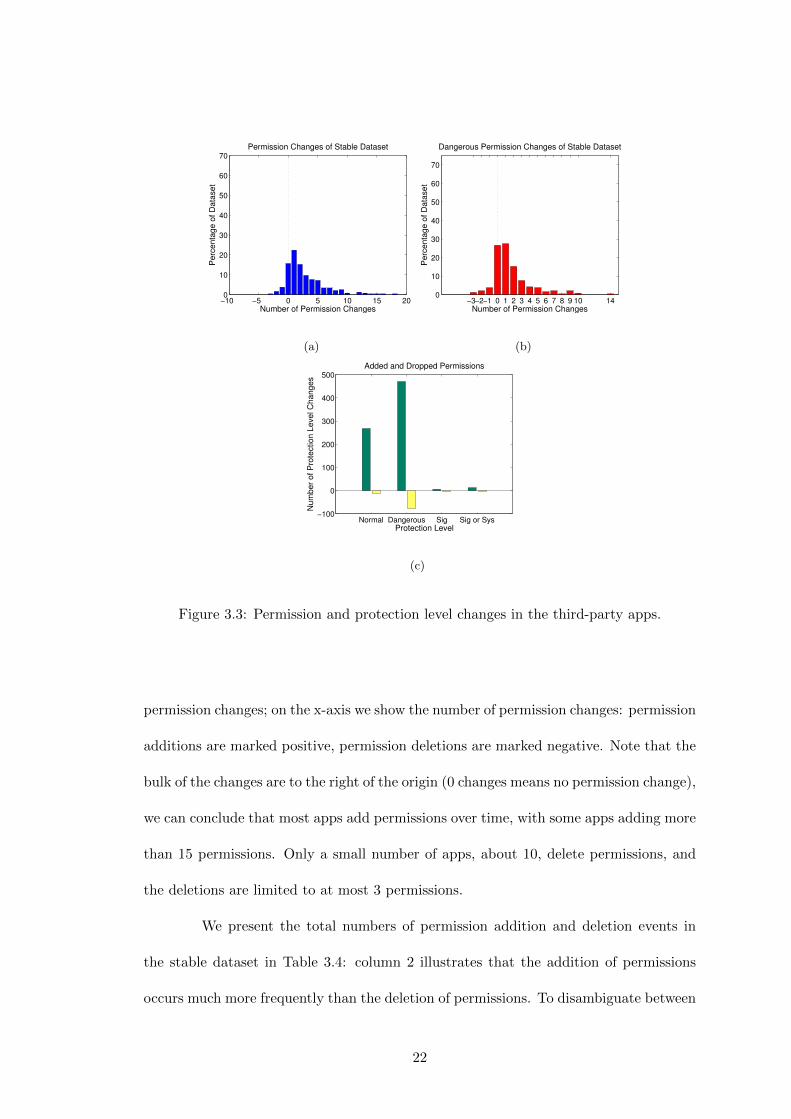
Figure 3.3: Permission and protection level changes in the third-party apps.
permission changes; on the x-axis we show the number of permission changes: permission
additions are marked positive, permission deletions are marked negative. Note that the
bulk of the changes are to the right of the origin (0 changes means no permission change),
we can conclude that most apps add permissions over time, with some apps adding more
than 15 permissions. Only a small number of apps, about 10, delete permissions, and
the deletions are limited to at most 3 permissions.
We present the total numbers of permission addition and deletion events in
the stable dataset in Table 3.4: column 2 illustrates that the addition of permissions
occurs much more frequently than the deletion of permissions. To disambiguate between
22
−10 −5 0 5 10 15 200
10
20
30
40
50
60
70
Number of Permission Changes
Pe
rce
nta
ge
of
Da
tase
t
Permission Changes of Pre−installed Apps
(a)
−6 −3−2−1 0 1 2 3 4 5 6 7 8 9 110
10
20
30
40
50
60
70
Number of Permission Changes
Pe
rce
nta
ge
of
Da
tase
t
Dangerous Permission Changes of Pre−installed Apps
(b)
Normal Dangerous Sig Sig or Sys−100
0
100
200
300
400
500
Protection Level
Nu
mb
er
of
Pro
tectio
n L
evel C
ha
ng
es
Added and Dropped Permissions
(c)
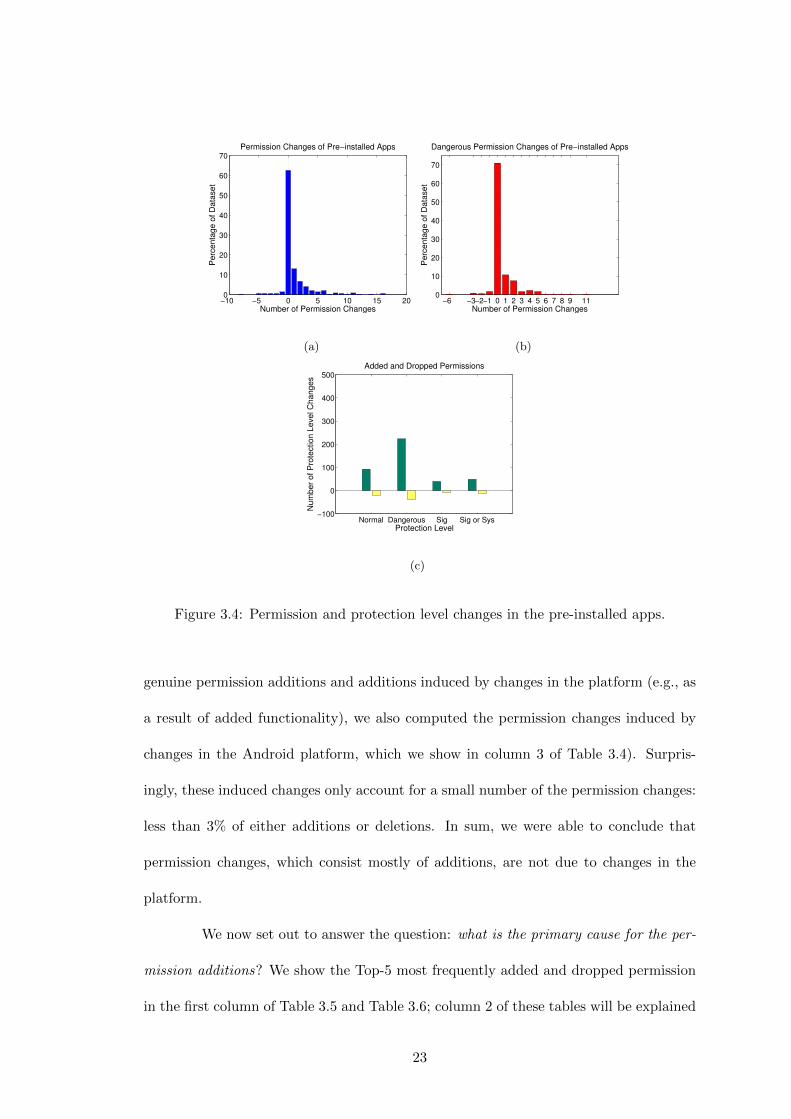
Figure 3.4: Permission and protection level changes in the pre-installed apps.
genuine permission additions and additions induced by changes in the platform (e.g., as
a result of added functionality), we also computed the permission changes induced by
changes in the Android platform, which we show in column 3 of Table 3.4). Surpris-
ingly, these induced changes only account for a small number of the permission changes:
less than 3% of either additions or deletions. In sum, we were able to conclude that
permission changes, which consist mostly of additions, are not due to changes in the
platform.
We now set out to answer the question: what is the primary cause for the per-
mission additions? We show the Top-5 most frequently added and dropped permission
in the first column of Table 3.5 and Table 3.6; column 2 of these tables will be explained
23
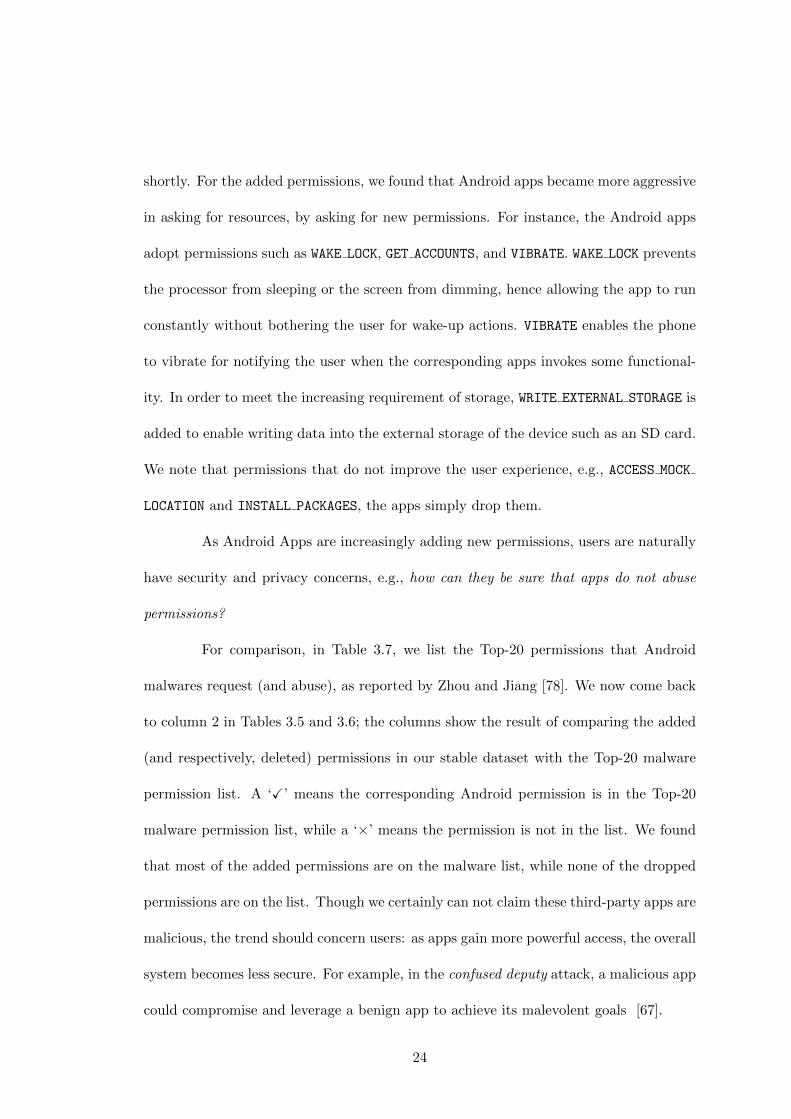
shortly. For the added permissions, we found that Android apps became more aggressive
in asking for resources, by asking for new permissions. For instance, the Android apps
adopt permissions such as WAKE LOCK, GET ACCOUNTS, and VIBRATE. WAKE LOCK prevents
the processor from sleeping or the screen from dimming, hence allowing the app to run
constantly without bothering the user for wake-up actions. VIBRATE enables the phone
to vibrate for notifying the user when the corresponding apps invokes some functional-
ity. In order to meet the increasing requirement of storage, WRITE EXTERNAL STORAGE is
added to enable writing data into the external storage of the device such as an SD card.
We note that permissions that do not improve the user experience, e.g., ACCESS MOCK
LOCATION and INSTALL PACKAGES, the apps simply drop them.
As Android Apps are increasingly adding new permissions, users are naturally
have security and privacy concerns, e.g., how can they be sure that apps do not abuse
permissions?
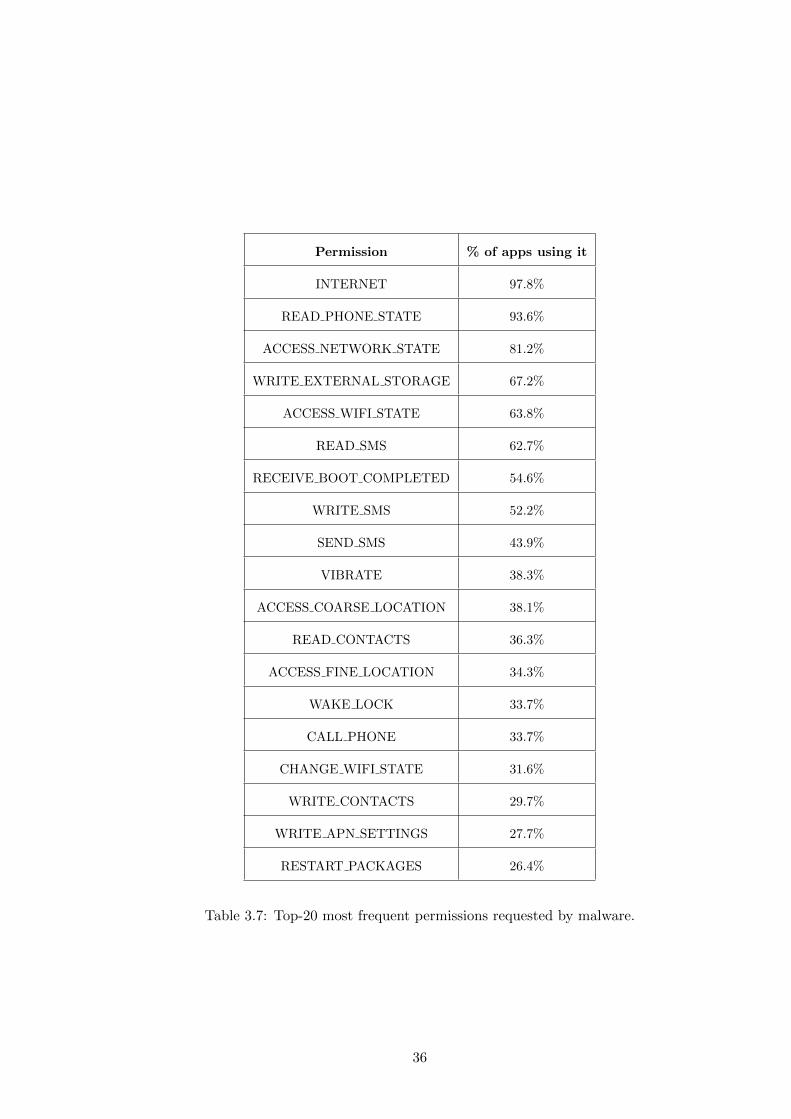
For comparison, in Table 3.7, we list the Top-20 permissions that Android
malwares request (and abuse), as reported by Zhou and Jiang [78]. We now come back
to column 2 in Tables 3.5 and 3.6; the columns show the result of comparing the added
(and respectively, deleted) permissions in our stable dataset with the Top-20 malware
permission list. A ‘X’ means the corresponding Android permission is in the Top-20
malware permission list, while a ‘×’ means the permission is not in the list. We found
that most of the added permissions are on the malware list, while none of the dropped
permissions are on the list. Though we certainly can not claim these third-party apps are
malicious, the trend should concern users: as apps gain more powerful access, the overall
system becomes less secure. For example, in the confused deputy attack, a malicious app
could compromise and leverage a benign app to achieve its malevolent goals [67].
24
3.3.2 Apps Want More Dangerous Permissions
We now proceed to investigate the added permissions in the Dangerous pro-
tection level as they introduce more risks.
Figure 3.3(b) shows that 66.11% of permission increases in apps required at
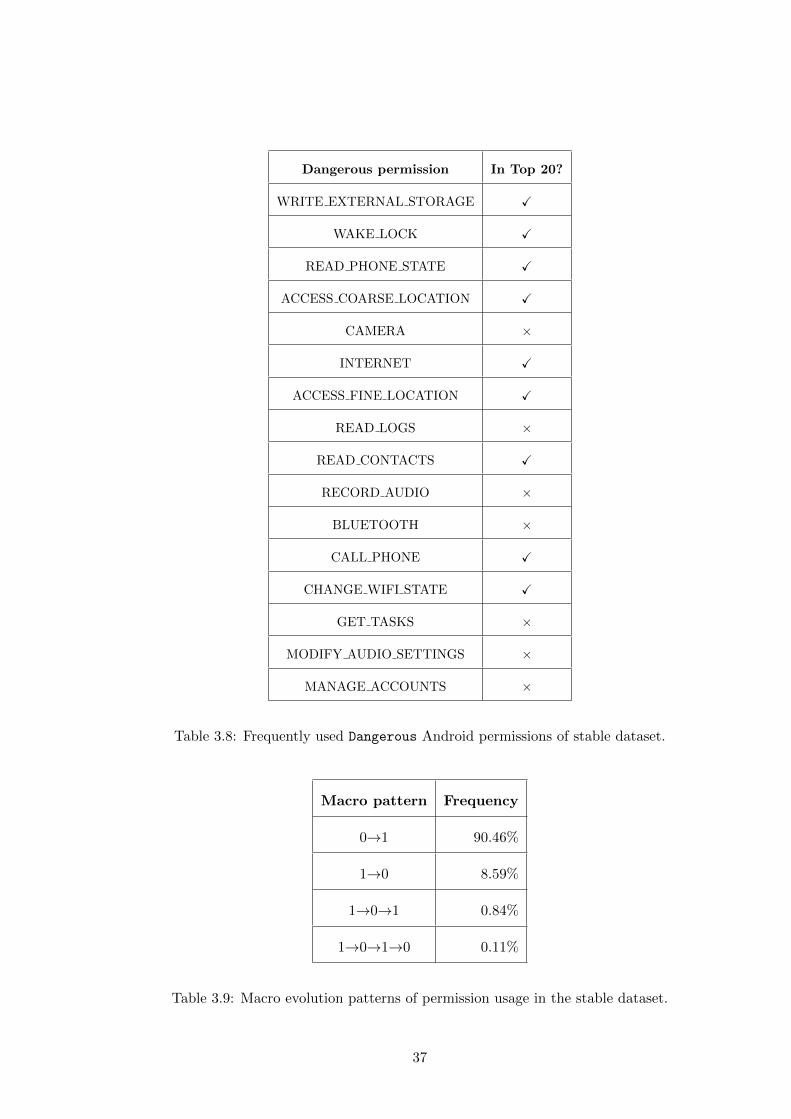
least one more Dangerous permission. In more detail, we list the frequently used
Dangerous permissions in the first column of Table 3.8. We found that WRITE EXTERNAL
STORAGE is the most requested Dangerous permission, in which sensitive personal or en-
terprise files can be written to external media. This permission is also a hot-spot for
most malicious activities. INTERNET, READ PHONE STATE, and WAKE LOCK are also re-
quested frequently by the new versions of the apps. The first two are needed to allow
for embedded advertising libraries (ads), but these third-party ads are also raising pri-
vacy concerns of abusing the user’s personal information. We then cross-checked this list
with the Top-20 malware permissions [78], as shown in column 2 of Table 3.8. We ob-
served that 9 of the 16 frequent permissions listed are also frequently used by malicious
apps. This significant overlap intensifies our privacy and security concerns.
3.3.3 Macro and Micro Evolution Patterns
The characterization of permission changes we provided so far, in terms of
absolute numbers (added/deleted), reveals the general trend toward apps requiring more
and more permissions. In addition, we also performed an in-depth study where we looked
for a finer-grained characterization of permissions evolution in terms of “patterns”, e.g.,
repeated occurrences of permission changes.
25
Macro patterns. To construct the macro patterns, we use 0→1 and 1→0 as the basic
modes, where ‘0’ represents the state that the corresponding app does not use a par-
ticular permission, ‘1’ represents the state that the corresponding app uses a particular
permission, and ‘→’ represents a state transition. In Table 3.9, we tabulate the macro-
patterns we observed in the stable dataset, along with their frequencies. We found
that the permission additions dominate the permission changes (0→1 has a 90.46% fre-
quency), as pointed out earlier in Section 3.3.1. We also found occurrences of other
interesting patterns, e.g., permissions being deleted and then added back, though these
instances are much less frequent.
Micro patterns. Some Dangerous permissions appear to be confusing developers. For
example, the location permissions ACCESS COARSE LOCATION and ACCESS FINE LOCATION,
provide different levels of location accuracy, on GSM/WiFi position and GPS location,
respectively. Location tracking has been heavily debated because it could possibly be
used to violate the user’s privacy. We found that app developers handled the adding
and deleting of these Dangerous location permission in an interesting way; to reveal the
underlying evolution patterns of used by the Dangerous location permissions, we have
done a case study of micro-patterns on two widely used location permissions, ACCESS
COARSE LOCATION and ACCESS FINE LOCATION. We found that, although the most fre-
quent macro evolution pattern of location permission is 0→1, the micro evolution pat-
terns of the location permissions are quite diverse.
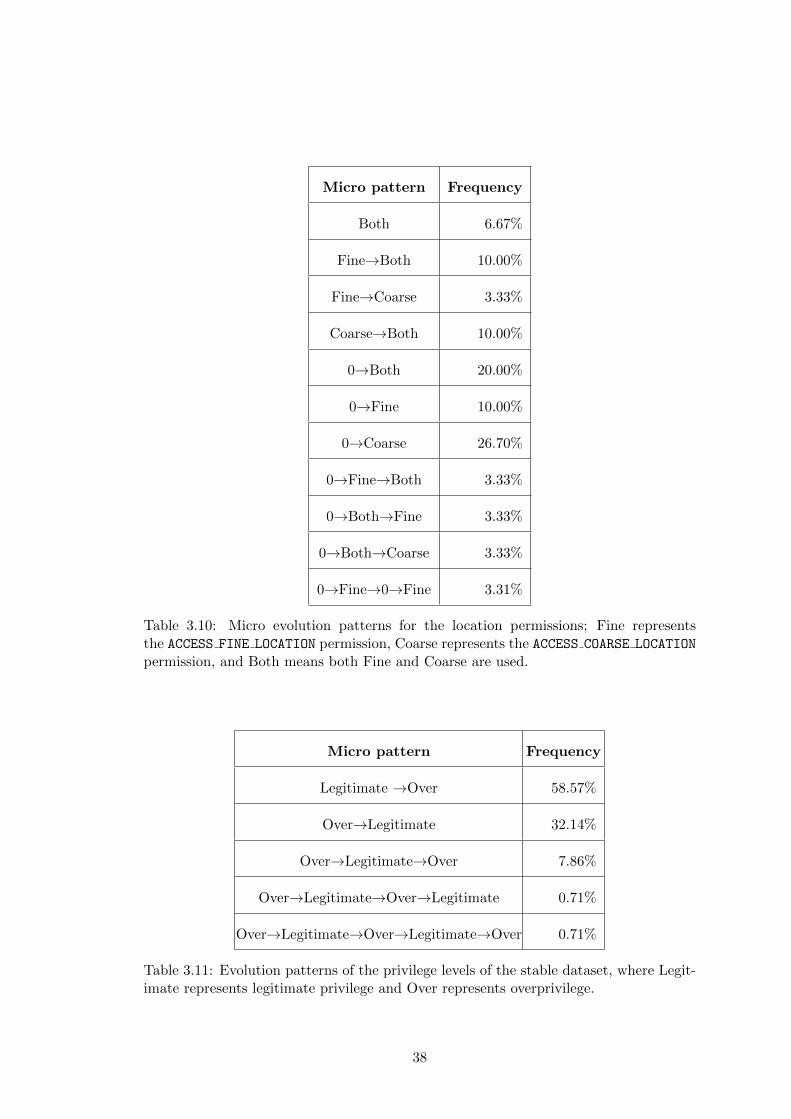
In Table 3.10, we tabulate the micro-patterns we observed for the location per-
mission alone. For instance, 0→Both→Fine means both location permissions are used
at first, then the ACCESS COARSE LOCATION permission is deleted in a later version of the
app. 0→Fine→0→Fine shows the app added ACCESS FINE LOCATION at first, dropped
26
0 5 10 150
5
10
15
Number of Dangerous Permissions
Num
ber
of
Norm
al P
erm
issi
ons
NetQin
KakaoTalk
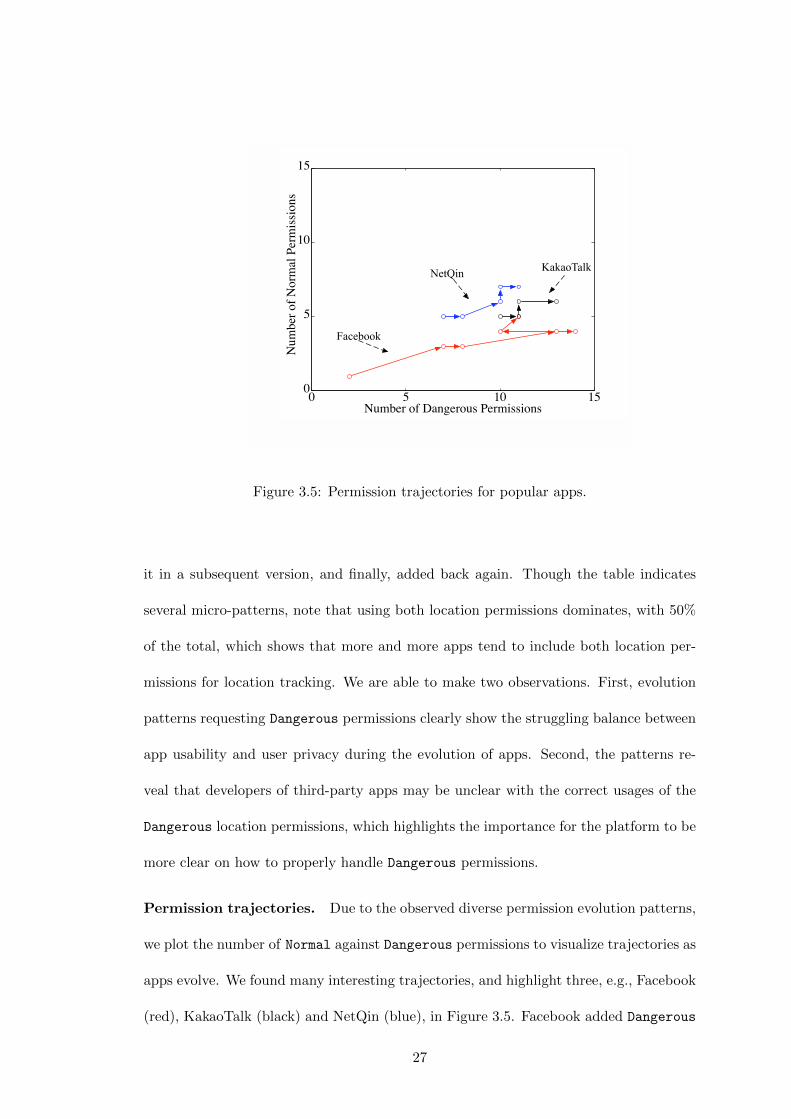
Figure 3.5: Permission trajectories for popular apps.
it in a subsequent version, and finally, added back again. Though the table indicates
several micro-patterns, note that using both location permissions dominates, with 50%
of the total, which shows that more and more apps tend to include both location per-
missions for location tracking. We are able to make two observations. First, evolution
patterns requesting Dangerous permissions clearly show the struggling balance between
app usability and user privacy during the evolution of apps. Second, the patterns re-
veal that developers of third-party apps may be unclear with the correct usages of the
Dangerous location permissions, which highlights the importance for the platform to be
more clear on how to properly handle Dangerous permissions.
Permission trajectories. Due to the observed diverse permission evolution patterns,
we plot the number of Normal against Dangerous permissions to visualize trajectories as
apps evolve. We found many interesting trajectories, and highlight three, e.g., Facebook
(red), KakaoTalk (black) and NetQin (blue), in Figure 3.5. Facebook added Dangerous
27
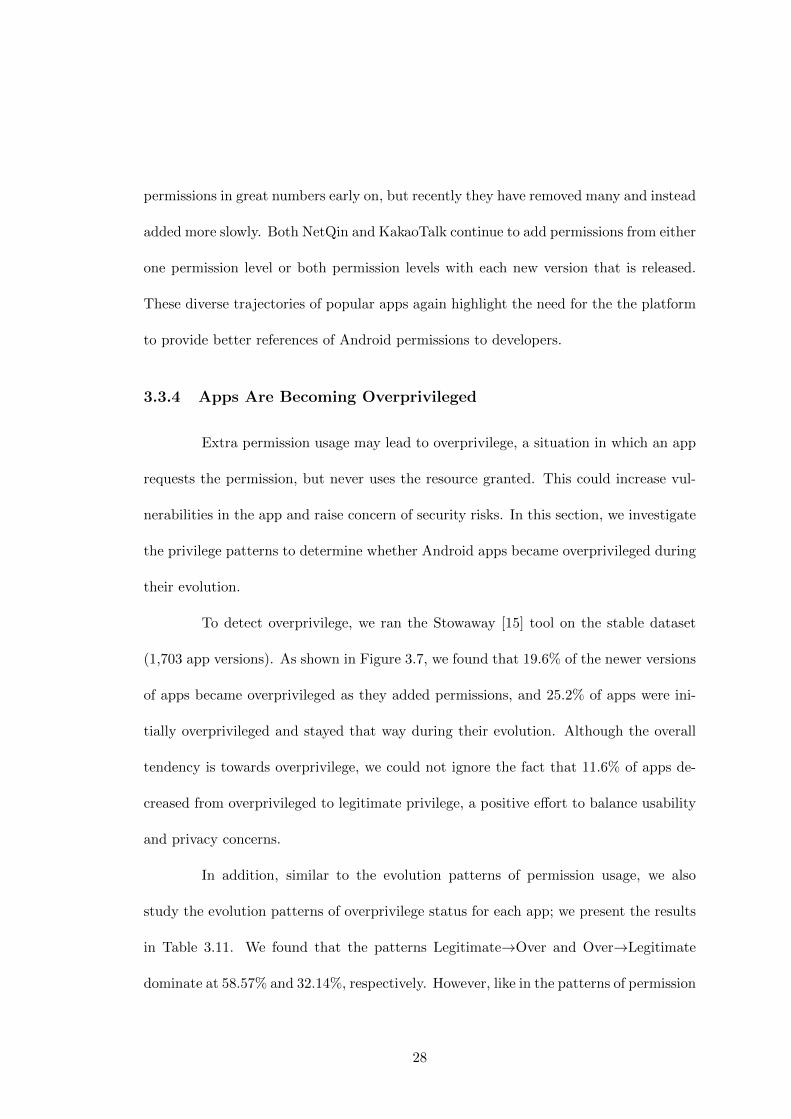
permissions in great numbers early on, but recently they have removed many and instead
added more slowly. Both NetQin and KakaoTalk continue to add permissions from either
one permission level or both permission levels with each new version that is released.
These diverse trajectories of popular apps again highlight the need for the the platform
to provide better references of Android permissions to developers.
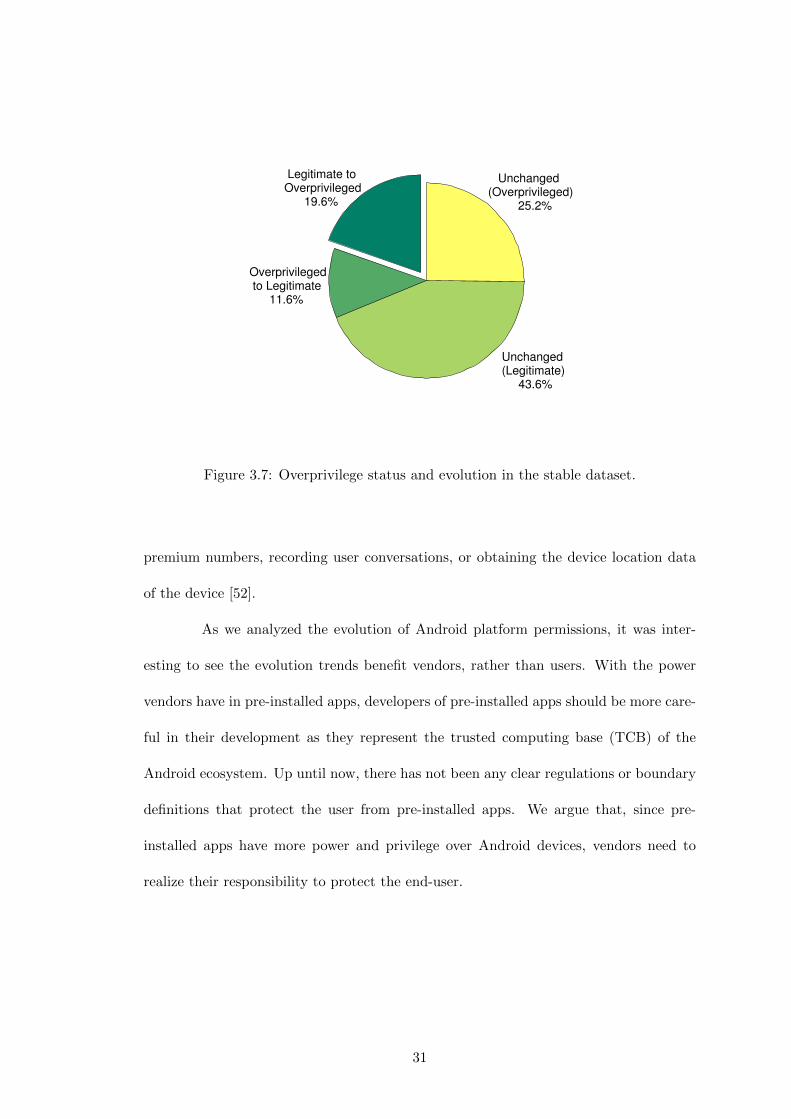
3.3.4 Apps Are Becoming Overprivileged
Extra permission usage may lead to overprivilege, a situation in which an app
requests the permission, but never uses the resource granted. This could increase vul-
nerabilities in the app and raise concern of security risks. In this section, we investigate
the privilege patterns to determine whether Android apps became overprivileged during
their evolution.
To detect overprivilege, we ran the Stowaway [15] tool on the stable dataset
(1,703 app versions). As shown in Figure 3.7, we found that 19.6% of the newer versions
of apps became overprivileged as they added permissions, and 25.2% of apps were ini-
tially overprivileged and stayed that way during their evolution. Although the overall
tendency is towards overprivilege, we could not ignore the fact that 11.6% of apps de-
creased from overprivileged to legitimate privilege, a positive effort to balance usability
and privacy concerns.
In addition, similar to the evolution patterns of permission usage, we also
study the evolution patterns of overprivilege status for each app; we present the results
in Table 3.11. We found that the patterns Legitimate→Over and Over→Legitimate
dominate at 58.57% and 32.14%, respectively. However, like in the patterns of permission
28
Normal Dangerous Sig Sig or Sys0
1
2
3
4
5
Protection Level
Ave
rag
e #
of
Pe
rmis
iso
ns P
er
Ap
p
Stable
Preinstalled
Figure 3.6: Average number of permissions per app, for each protection level, fromstable and pre-installed datasets.
usage, we also found other diverse patterns during the evolution of apps, which again
shows that there may be confusion for third-party developers when deciding on what
permissions to use for their app.
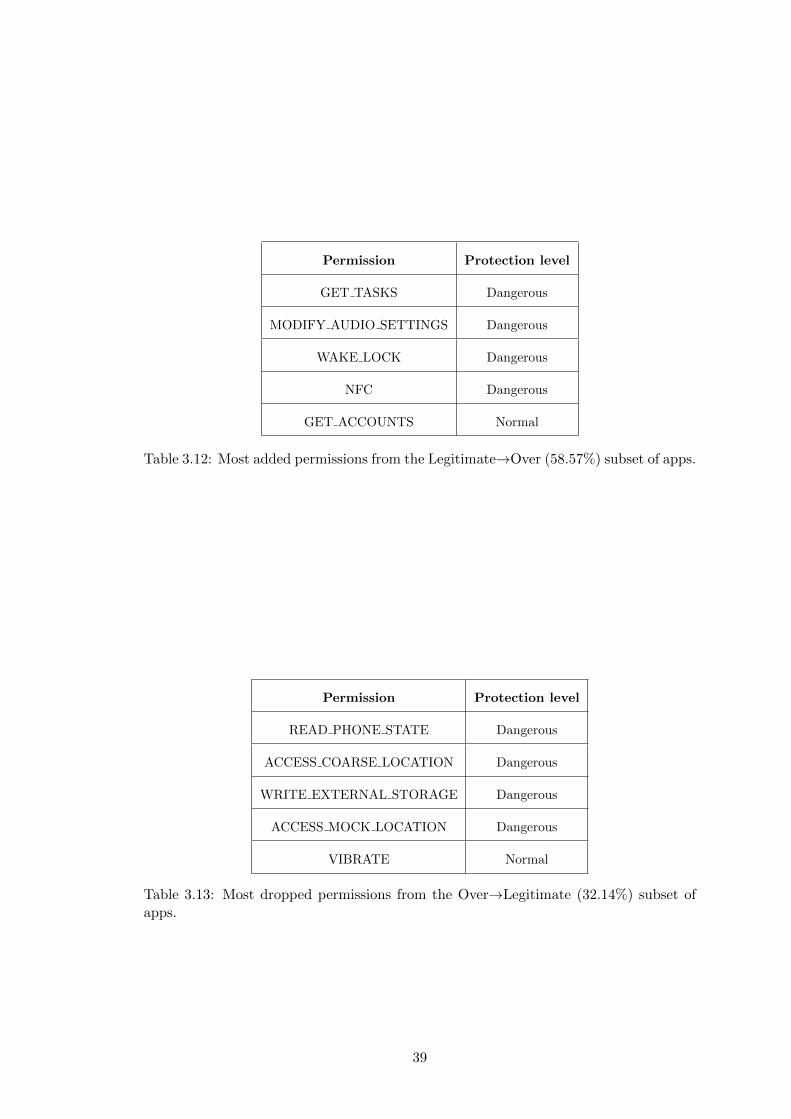
In Table 3.12 and 3.13, we further refine the observations to show the kinds of
permissions involved in the dominating patterns: we observe that Dangerous permissions
are the major source that causes an app to be overprivileged, which again emphasizes
that developers should exercise more care when requesting Dangerous permissions.
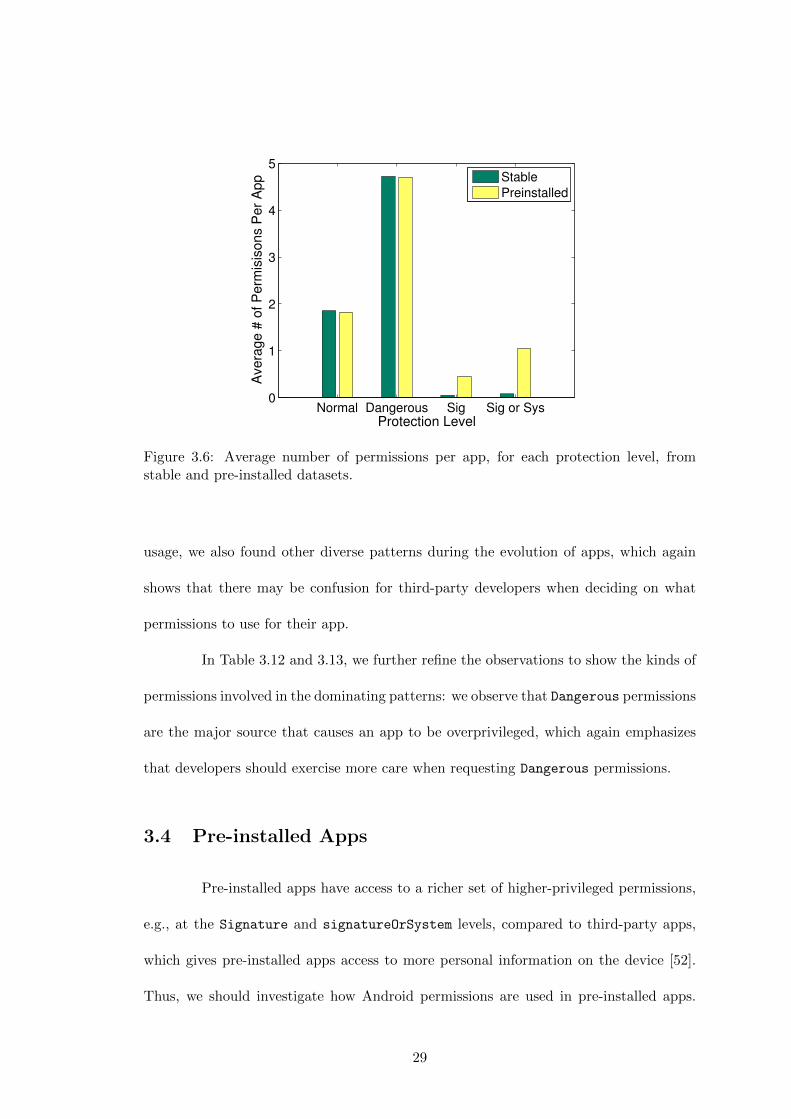
3.4 Pre-installed Apps
Pre-installed apps have access to a richer set of higher-privileged permissions,
e.g., at the Signature and signatureOrSystem levels, compared to third-party apps,
which gives pre-installed apps access to more personal information on the device [52].
Thus, we should investigate how Android permissions are used in pre-installed apps.
29
We conducted a permission-change analysis for pre-installed apps in a manner similar
to the stable dataset. We present the results in Figure 3.4. Figures 3.4(a) and 3.4(b)
indicate that permission usage is relatively constant, e.g., 62.61% of pre-installed apps
do not change their permissions at all, which is significant when compared to our third-
party apps with only 15.68%. Further, from Figure 3.4(c) and 6, pre-installed apps
request many more Signature and signatureOrSystem level permissions than third-
party apps, while at the same time requesting nearly just as many Normal and Dangerous
level permissions. This shows that pre-installed apps have a much higher capability to
penetrate the smartphone. Interestingly, the vendors also have the ability to define their
own permissions inside the platform when they customize the Android platform for their
devices. For example, HTC defines its own app update permission, HTC APP UPDATE.
The power of pre-installed apps requires great responsibility by vendors to
ensure that this power is not abused. On one hand, vendors are able to customize pre-
installed apps to take full advantage of all the hardware capabilities of the device, as well
as create a brand-personalized look-and-feel to enhance user experience. On the other
hand, users cannot opt out of pre-installed apps, and in most cases, cannot uninstall
the pre-installed apps, which raises the question: why should users be forced to trust
pre-installed apps? Hindering that trust is our finding that, despite being developed by
vendors, 66.1% of pre-installed apps were overprivileged.
What if the power of pre-installed apps is used against the user with malicious
intent? For example, the marred pre-installed app HTCLogger and other reported secu-
rity compromised apps have already indicated such security risks do exist and can signif-
icantly damage the smartphone and/or the user data [11, 52]. The vendors’ Signature
and signatureOrSystem level permissions can be exploited by malicious apps to do an
array of damaging actions, such as wiping out user data, sending out SMS messages to
30
Unchanged(Overprivileged) 25.2%
Overprivileged to Legitimate 11.6%
Legitimate toOverprivileged 19.6%
Unchanged(Legitimate) 43.6%
Figure 3.7: Overprivilege status and evolution in the stable dataset.
premium numbers, recording user conversations, or obtaining the device location data
of the device [52].
As we analyzed the evolution of Android platform permissions, it was inter-
esting to see the evolution trends benefit vendors, rather than users. With the power
vendors have in pre-installed apps, developers of pre-installed apps should be more care-
ful in their development as they represent the trusted computing base (TCB) of the
Android ecosystem. Up until now, there has not been any clear regulations or boundary
definitions that protect the user from pre-installed apps. We argue that, since pre-
installed apps have more power and privilege over Android devices, vendors need to
realize their responsibility to protect the end-user.
31
API Android SDK Total Release
level platform codename permissions (mm-dd-yy)
15 4.0.3 Ice Cream 165 12-16-11
Sandwich
MR1
14 4.0.2 Ice Cream 162 11-28-11
4.0.1 Sandwich 10-19-11
10 2.3.4 Gingerbread 137 04-28-11
2.3.3 MR1 02-09-11
9 2.3.2 Gingerbread 137 12-06-10
2.3.1
2.3
8 2.2.x Froyo 134 05-20-10
7 2.1.x Eclair MR1 122 01-12-10
6 2.0.1 Eclair 0 1 122 12-03-09
5 2.0 Eclair 122 10-26-09
4 1.6 Donut 106 09-15-09
3 1.5 Cupcake 103 04-30-09
Table 3.1: Official releases of the Android platform before 2012; base and tablet versionsare excluded.
32
API Dev Sys Accounts Cost Hardware Location Messages Network Personal Phone Storage Default
level tools tools Money Controls Info calls
3 36 35 1 2 6 4 5 5 6 3
4 -1 +2,-2 +1 +1 +2
5 +3 +4 +2 +7
6
7
8 +7 +6, -1
9 +1 +2 -2 +2
10
14 +2 +1 +2,-1 +1 +1 +5 +1 +1 +12
15 +1 +1 +1
Overall -1 +13 +4 +1 +2 +1 +1 +4 +5 +1 +2 +29
Table 3.2: Permission changes per API level and permission categories.
33
Dangerous permission Category
READ HISTORY BOOKMARKS Personal Info
WRITE HISTORY BOOKMARKS Personal Info
READ USER DICTIONARY Personal Info
READ PROFILE Personal Info
WRITE PROFILE Personal Info
READ SOCIAL STREAM Personal Info
WRITE SOCIAL STREAM Personal Info
WRITE EXTERNAL STORAGE Storage
AUTHENTICATE ACCOUNTS Accounts
MANAGE ACCOUNTS Accounts
USE CREDENTIALS Accounts
NFC Network
USE SIP Network
CHANGE WIFI MULTICAST STATE System Tools
CHANGE WIMAX STATE System Tools
Table 3.3: Added Dangerous permissions and their categories.
Total Induced by
changes platform changes
Add 857 14 (1.63%)
Delete 183 5 (2.73%)
Total 1040 19 (1.82%)
Table 3.4:App permission changes in the stable dataset.
34
Android permission In Top 20?
ACCESS NETWORK STATE X
WRITE EXTERNAL STORAGE X
WAKE LOCK X
GET ACCOUNTS ×
VIBRATE X
Table 3.5: Most frequently added permissions in the stable dataset.
Android Permission In Top 20?
ACCESS MOCK LOCATION ×
READ OWNER DATA ×
INSTALL PACKAGES ×
RECEIVE MMS ×
MASTER CLEAR ×
Table 3.6: Most frequently deleted permissions in the stable dataset.
35
Permission % of apps using it
INTERNET 97.8%
READ PHONE STATE 93.6%
ACCESS NETWORK STATE 81.2%
WRITE EXTERNAL STORAGE 67.2%
ACCESS WIFI STATE 63.8%
READ SMS 62.7%
RECEIVE BOOT COMPLETED 54.6%
WRITE SMS 52.2%
SEND SMS 43.9%
VIBRATE 38.3%
ACCESS COARSE LOCATION 38.1%
READ CONTACTS 36.3%
ACCESS FINE LOCATION 34.3%
WAKE LOCK 33.7%
CALL PHONE 33.7%
CHANGE WIFI STATE 31.6%
WRITE CONTACTS 29.7%
WRITE APN SETTINGS 27.7%
RESTART PACKAGES 26.4%
Table 3.7: Top-20 most frequent permissions requested by malware.
36
Dangerous permission In Top 20?
WRITE EXTERNAL STORAGE X
WAKE LOCK X
READ PHONE STATE X
ACCESS COARSE LOCATION X
CAMERA ×
INTERNET X
ACCESS FINE LOCATION X
READ LOGS ×
READ CONTACTS X
RECORD AUDIO ×
BLUETOOTH ×
CALL PHONE X
CHANGE WIFI STATE X
GET TASKS ×
MODIFY AUDIO SETTINGS ×
MANAGE ACCOUNTS ×
Table 3.8: Frequently used Dangerous Android permissions of stable dataset.
Macro pattern Frequency
0→1 90.46%
1→0 8.59%
1→0→1 0.84%
1→0→1→0 0.11%
Table 3.9: Macro evolution patterns of permission usage in the stable dataset.
37
Micro pattern Frequency
Both 6.67%
Fine→Both 10.00%
Fine→Coarse 3.33%
Coarse→Both 10.00%
0→Both 20.00%
0→Fine 10.00%
0→Coarse 26.70%
0→Fine→Both 3.33%
0→Both→Fine 3.33%
0→Both→Coarse 3.33%
0→Fine→0→Fine 3.31%
Table 3.10: Micro evolution patterns for the location permissions; Fine representsthe ACCESS FINE LOCATION permission, Coarse represents the ACCESS COARSE LOCATION
permission, and Both means both Fine and Coarse are used.
Micro pattern Frequency
Legitimate →Over 58.57%
Over→Legitimate 32.14%
Over→Legitimate→Over 7.86%
Over→Legitimate→Over→Legitimate 0.71%
Over→Legitimate→Over→Legitimate→Over 0.71%
Table 3.11: Evolution patterns of the privilege levels of the stable dataset, where Legit-imate represents legitimate privilege and Over represents overprivilege.
38
Permission Protection level
GET TASKS Dangerous
MODIFY AUDIO SETTINGS Dangerous
WAKE LOCK Dangerous
NFC Dangerous
GET ACCOUNTS Normal
Table 3.12: Most added permissions from the Legitimate→Over (58.57%) subset of apps.
Permission Protection level
READ PHONE STATE Dangerous
ACCESS COARSE LOCATION Dangerous
WRITE EXTERNAL STORAGE Dangerous
ACCESS MOCK LOCATION Dangerous
VIBRATE Normal
Table 3.13: Most dropped permissions from the Over→Legitimate (32.14%) subset ofapps.
39
Chapter 4
Multi-layer Profiling of Android
Applications
4.1 Overview of Approach
We present an overview of the design and implementation of ProfileDroid.
We measure and profile apps at four different layers: (a) static, or app specification
(b) user interaction, (c) operating system, and (d) network. For each layer, our system
consists of two parts: a monitoring and a profiling component. For each layer, the
monitoring component runs on the Android device where the app is running. The
captured information is subsequently fed into the profiling part, which runs on the
connected computer. In Figure 4.1, on the right, we show a high level overview of our
system and its design. On the left, we have an actual picture of the actual system the
Android device that runs the app and the profiling computer (such as a desktop or a
laptop).
In the future, we foresee a light-weight version of the whole profiling system
40
Static
Network
User
OS
Static
Network
User
OS
Monitoring Profiling
ProfileDroid
APKAppProfile
BehavioralPatterns
Inconsistencies
Figure 4.1: Overview and actual usage (left) and architecture (right) of ProfileDroid.
to run exclusively on the Android device. The challenge is that the computation, the
data storage, and the battery consumption must be minimized. How to implement the
profiling in an incremental and online fashion is beyond the scope of the current work.
Note that our system is focused on profiling of an individual app, and not intended to
monitor user behavior on mobile devices.
From an architectural point of view, we design ProfileDroid to be flexible
and modular with level-defined interfaces between the monitoring and profiling compo-
nents. Thus, it is easy to modify or improve functionality within each layer. Further-
more, we could easily extend the current functionality to add more metrics, and even
potentially more layers, such as a physical layer (temperature, battery level, etc.).
4.1.1 Implementation and Challenges
We describe the implementation of monitoring at each layer, and briefly touch
on challenges we had to surmount when constructing ProfileDroid.
To profile an application, we start the monitoring infrastructure (described at
length below) and then the target app is launched. The monitoring system logs all
the relevant activities, e.g., user touchscreen input events, system calls, and all network
traffic in both directions.
41
Static Layer. At the static layer, we analyze the APK (Android application package)
file, which is how Android apps are distributed. We use apktool to unpack the APK file
to extract relevant data. From there, we mainly focus on the Manifest.xml file and the
bytecode files contained in the /smali folder. The manifest is specified by the developer
and identifies hardware usage and permissions requested by each app. The smali files
contain the app bytecode which we parse and analyze statically, as explained later in
Section 4.2.1.
User Layer. At the user layer, we focus on user-generated events, i.e., events that
result from interaction between the user and the Android device while running the
app. To gather the data of the user layer, we use a combination of the logcat and
getevent tools of adb. From the logcat we capture the system debug output and log
messages from the app. In particular, we focus on events-related messages. To collect
the user input events, we use the getevent tool, which reads the /dev /input/event*
to capture user events from input devices, e.g., touchscreen, accelerometer, proximity
sensor. Due to the raw nature of the events logged, it was challenging to disambiguate
between swipes and presses on the touchscreen. We provide details in Section 4.2.2.
Operating System Layer. At the operating system-layer, we measure the operating
system activity by monitoring system calls. We collect system calls invoked by the app
using an Android-specific version of strace. Next, we classify system calls into four cat-
egories: filesystem, network, VM/IPC, and miscellaneous. As described in Section 4.2.3,
this classification is challenging, due to the virtual file system and the additional VM
layer that decouples apps from the OS.
Network Layer. At the network layer, we analyze network traffic by logging the
data packets. We use an Android-specific version of tcpdump that collects all network
42
traffic on the device. We parse, domain-resolve, and classify traffic. As described in
Section 4.2.4, classifying network traffic is a significant challenge in itself; we used infor-
mation from domain resolvers, and improve its precision with manually-gathered data
on specific websites that act as traffic sources.
Having collected the measured data as described above, we analyze it using
the methods and the metrics of Section 4.2.
4.1.2 Experimental Setup
Android Devices. The Android devices monitored and profiled in this dissertation
were a pair of identical Motorola Droid Bionic phones, which have dual-core ARM
Cortex-A9 processors running at 1GHz. The phones were released on released September
8, 2011 and run Android version 2.3.4 with Linux kernel version 2.6.35.
App Selection. As of September 2013, Google Play lists more than 800,000 apps [17],
so to ensure representative results, we strictly follow the following criteria in selecting our
test apps. First, we selected a variety of apps that cover most app categories as defined in
Google Play, such as Entertainment, Productivity tools, etc. Second, all selected apps
had to be popular, so that we could examine real-world, production-quality software
with a broad user base. In particular, the selected apps must have at least 1,000,000
installs, as reported by Google Play, and be within the Top-130 free apps, as ranked by
the Google Play website. In the end, we selected 27 apps as the basis for our study: 19
free apps and 8 paid apps; the 8 paid apps have free counterparts, which are included
in the list of 19 free apps. The list of the selected apps, as well as their categories, is
shown in Table 4.1.
Conducting the experiment. In order to isolate app behavior and improve preci-
sion when profiling an app, we do not allow other manufacturer-installed apps to run
43
concurrently on the Android device, as they could interfere with our measurements.
Also, to minimize the impact of poor wireless link quality on apps, we used WiFi in
strong signal conditions. Further, to ensure statistics were collected of only the app in
question, we installed one app on the phone at a time and uninstalled it before the next
app was tested. Note however, that system daemons and required device apps were still
able to run as they normally would, e.g., the service and battery managers.
Finally, in order to add stability to the experiment, the multi-layer traces for
each individual app were collected from tests conducted by multiple users to obtain
a comprehensive exploration of different usage scenarios of the target application. To
cover a larger variety of running conditions without burdening the user, we use capture-
and-replay, as explained below [46]. Each user ran each app one time for 5 minutes; we
capture the user interaction using event logging. Then, using a replay tool we created,
each recorded run was replayed back 5 times in the morning and 5 times at night, for
a total of 10 runs each per user per app. The runs of each app were conducted at
different times of the day to avoid time-of-day bias, which could lead to uncharacteristic
interaction with the app; by using the capture-and-replay tool, we are able to achieve
this while avoiding repetitive manual runs from the same user. For those apps that
had both free and paid versions, users carried out the same task, so we can pinpoint
differences between paid and free versions. To summarize, our profiling is based on 30
runs (3 users × 10 replay runs) for each app.
44
4.2 Analyzing Each Layer
In this section, we first provide detailed descriptions of our profiling method-
ology, and we highlight challenges and interesting observations.
4.2.1 Static Layer
The first layer in our framework aims at understanding the app’s functionality
and permissions. In particular, we analyze the APK file on two dimensions to identify
app functionality and usage of device resources: first, we extract the permissions that
the app asks for, and then we parse the app bytecode to identify intents, i.e., indirect
resource access via deputy apps. Note that, in this layer only, we analyze the app with-
out running it—hence the name static layer.
Functionality usage. Android devices offer several major functionalities, labeled as
follows: Internet, GPS, Camera, Microphone, Bluetooth and Telephony. We present the
results in Table 4.2. A ‘X’ means the app requires permission to use the device, while
‘I’ means the device is used indirectly via intents and deputy apps. We observe that
Internet is the most-used functionality, as the Internet is the gateway to interact with
remote servers via 3G or WiFi—all of our examined apps use the Internet for various
tasks. For instance, Pandora and YouTube use the Internet to fetch multimedia files,
while Craigslist and Facebook use it to get content updates when necessary.
GPS, the second most popular resource (9 apps) is used for navigation and
location-aware services. For example, Gasbuddy returns gas stations near the user’s lo-
cation, while Facebook uses the GPS service to allow users to check-in, i.e., publish their
45
presence at entertainment spots or places of interests. Camera, the third-most popular
functionality (5 apps) is used for example, to record and post real-time news information
(CNN), or for for barcode scanning Amazon. Microphone, Bluetooth and Telephony are
three additional communication channels besides the Internet, which could be used for
voice communication, file sharing, and text messages. This increased usage of various
communication channels is a double-edged sword. On the one hand, various commu-
nication channels improve user experience. On the other hand, it increases the risk of
privacy leaks and security attacks on the device.
Intent usage. Android intents allow apps to access resources indirectly by using
deputy apps that have access to the requested resource. For example, Facebook does
not have the camera permission, but can send an intent to a deputy camera app to take
and retrieve a picture.1 We decompiled each app using apktool and identified instances
of the android.content.Intent class in the Dalvik bytecode. Next, we analyzed the
parameters of each intent call to find the intent’s type, i.e., the device’s resource to be
accessed via deputy apps.
We believe that presenting users with the list of resources used via intents (e.g.,
that the Facebook app does not have direct access to the camera, but nevertheless it can
use the camera app to take pictures) helps them make better-informed decisions about
installing and using an app. Though legitimate within the Android security model,
this lack of user forewarning can be considered deceiving; with the more comprehensive
picture provided by ProfileDroid, users have a better understanding of resource usage,
direct or indirect [13].
1This was the case for the version of the Facebook app we analyzed in March 2012, the time weperformed the study. However, we found that, as of June 2012, the Facebook app requests the Camerapermission explicitly.
46
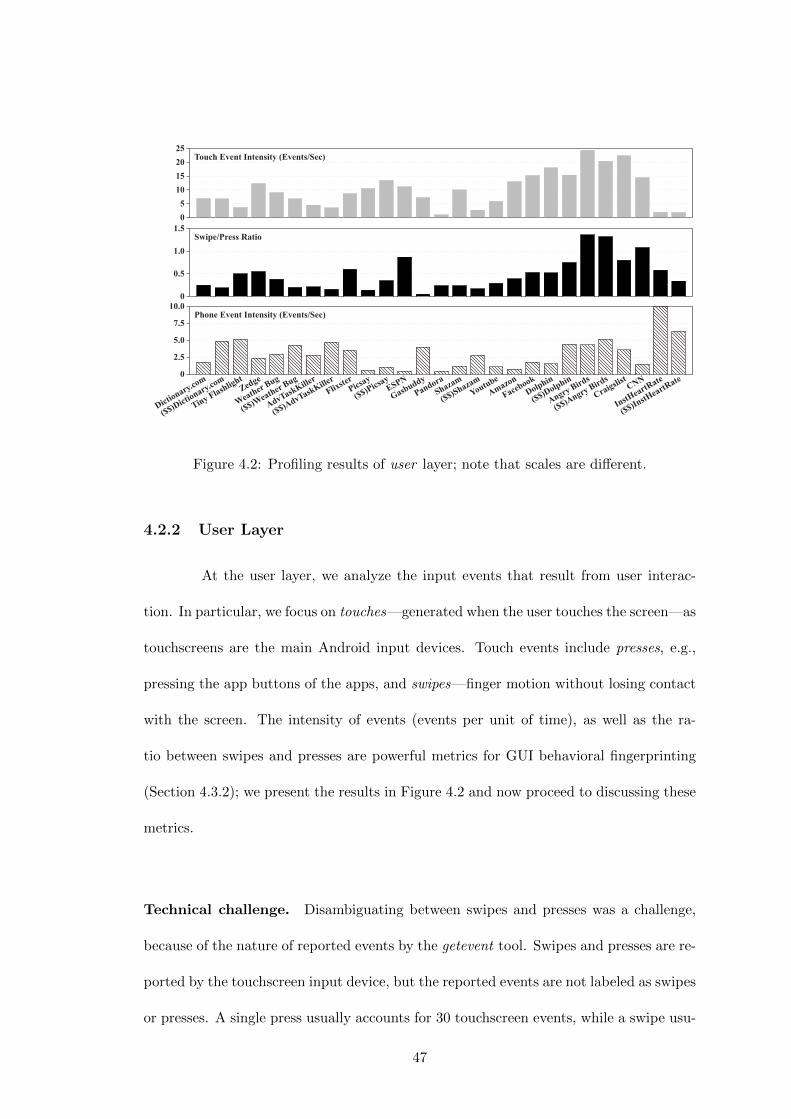
0
2.5
5.0
7.5
10.0
0
0.5
1.0
1.5
0
5
10
15
20
25
Dictionary.com
($$)Dictionary.com
Tiny Flashlight
Zedge
Weather Bug
($$)Weather Bug
AdvTaskKiller
($$)AdvTaskKiller
Flixster
Picsay
($$)PicsayESPN
Gasbuddy
Pandora
Shazam
($$)Shazam
Youtube
Amazon
Dolphin
($$)Dolphin
Angry Birds
($$)Angry Birds
CraigslistCNN
InstHeartRate
($$)InstHeartRate
Touch Event Intensity (Events/Sec)
Swipe/Press Ratio
Phone Event Intensity (Events/Sec)
Figure 4.2: Profiling results of user layer; note that scales are different.
4.2.2 User Layer
At the user layer, we analyze the input events that result from user interac-
tion. In particular, we focus on touches—generated when the user touches the screen—as
touchscreens are the main Android input devices. Touch events include presses, e.g.,
pressing the app buttons of the apps, and swipes—finger motion without losing contact
with the screen. The intensity of events (events per unit of time), as well as the ra-
tio between swipes and presses are powerful metrics for GUI behavioral fingerprinting
(Section 4.3.2); we present the results in Figure 4.2 and now proceed to discussing these
metrics.
Technical challenge. Disambiguating between swipes and presses was a challenge,
because of the nature of reported events by the getevent tool. Swipes and presses are re-
ported by the touchscreen input device, but the reported events are not labeled as swipes
or presses. A single press usually accounts for 30 touchscreen events, while a swipe usu-
47
ally accounts for around 100 touchscreen events. In order to distinguish between swipes
and presses, we developed a method to cluster and label events. For example, two events
separated by less than 80 milliseconds are likely to be part of a sequence of events, and
if that sequence of events grows above 30, then it is likely that the action is a swipe
instead of a press. Evaluating and fine-tuning our method was an intricate process.
Touch events intensity. We measured touch intensity as the number of touch events
per second—this reveals how interactive an app is. For example, the music app Pandora
requires only minimal input (music control) once a station is selected. In contrast, in
the game Angry Birds, the user has to interact with the interface of the game using
swipes and screen taps, which results in a high intensity for touch events.
Swipe/Press ratio. We use the ratio of swipes to presses to better capture the nature
of the interaction, and distinguish between apps that have similar touch intensity. Note
that swipes are used for navigation and zooming, while touches are used for selection.
Figure 4.2 shows that apps that involve browsing, news-page flipping, gaming, e.g., CNN,
Angry Birds, have a high ratio of swipes to presses; even for apps with the same touch
intensity, the swipe/press ratio can help profile and distinguish apps, as seen in the
table 4.3.
Phone event intensity. The bottom chart in Figure 4.2 shows the intensity of events
generated by the phone itself during the test. These events contain a wealth of contextual
data that, if leaked, could pose serious privacy risks. The most frequent events we
observed were generated by the accelerometer, the light proximity sensor, and for some
48
location-aware apps, the compass. For brevity, we omit details, but we note that phone-
event intensity, and changes in intensity, can reveal the user’s proximity to the phone,
the user’s motion patterns, and user orientation and changes thereof.
4.2.3 Operating System Layer
We first present a brief overview of the Android OS, and then discuss metrics
and results at the operating system layer.
Android OS is a Linux-based operating system, customized for mobile devices.
Android apps are written in Java and compiled to Dalvik executable (Dex) bytecode.
The bytecode is bundled with the app manifest (specification, permissions) to create
an APK file. When an app is installed, the user must grant the app the permissions
specified in the manifest. The Dex bytecode runs on top of the Dalvik Virtual Machine
(VM)—an Android-specific Java virtual machine. Each app runs as a separate Linux
process with a unique user ID in a separate copy of the VM. The separation among
apps offers a certain level of protection and running on top of a VM avoids granting
apps direct access to hardware resources. While increasing reliability and reducing the
potential for security breaches, this vertical (app–hardware) and horizontal (app–app)
separation means that apps do not run natively and inter-app communications must
take place primarily via IPC. We profile apps at the operating system layer with several
goals in mind: to understand how apps use system resources, how the operating-system
intensity compares to the intensity observed at other layers, and to characterize the
potential performance implications of running apps in separate VM copies. To this end,
we analyzed the system call traces for each app to understand the nature and frequency
of system calls. We present the results in Table 4.4.
49
System call intensity. The second column of Table 4.4 shows the system call inten-
sity in system calls per second. While the intensity differs across apps, note that in all
cases the intensity is relatively high (between 30 and 1,183 system calls per second) for
a mobile platform.
System call characterization. To characterize the nature of system calls, we group
them into four bins: file system (FS), network (NET), virtual machine (VM&IPC), and
miscellaneous (MISC). Categorizing system calls is not trivial.
Technical challenge. The Linux version running on our phone (2.6.35.7 for Arm) sup-
ports about 370 system calls; we observed 49 different system calls in our traces. While
some system calls are straightforward to categorize, the operation of virtual filesystem
calls such as read and write, which act on a file descriptor, depends on the file descrip-
tor and can represent file reading and writing, network send/receive, or reading/altering
system configuration via /proc. Therefore, for all the virtual filesystem calls, we cate-
gorize them based on the file descriptor associated with them, as explained below. FS
system calls are used to access data stored on the flash drive and SD card of the mo-
bile device and consist mostly of read and write calls on a file descriptor associated
with a space-occupying file in the file system, i.e., opened via open. NET system calls
consist mostly of read and write calls on a file descriptor associated with a network
socket, i.e., opened via socket; note that for NET system calls, reads and writes mean
receiving from and sending to the network. VM&IPC system calls are calls inserted by
the virtual machine for operations such as scheduling, timing, idling, and IPC. For each
50
such operation, the VM inserts a specific sequence of system calls. We extracted these
sequences, and compared the number of system calls that appear as part of the sequence
to the total number, to quantify the VM and IPC-introduced overhead. The most com-
mon VM/IPC system calls we observed (in decreasing order of frequency) were: clock
gettime, epoll wait, getpid, getuid32, futex, ioctl, and ARM cacheflush. The
remaining system calls are predominantly read and write calls to the /proc special
filesystem are categorized as MISC.
The results are presented in Table 4.4: for each category, we show both in-
tensity, as well as the percentage relative to all categories. Note that FS and NET
percentages are quite similar, but I/O system calls (FS and NET) constitute a rela-
tively small percentage of total system calls, with the VM&IPC dominating. We will
come back to this aspect in Section 4.3.4.
4.2.4 Network Layer
The network-layer analysis summarizes the data communication of the app via
WiFi or 3G. Android apps increasingly rely on Internet access for a diverse array of
services, e.g., for traffic, map or weather data and even offloading computation to the
cloud. An increasing number of network traffic sources are becoming visible in app
traffic, e.g., Content Distribution Networks, Cloud, Analytics and Advertisement. To
this end, we characterize the app’s network behavior using the following metrics and
present the results in Table 4.5.
Traffic intensity. This metric captures the intensity of the network traffic of the
app. Depending on the app, the network traffic intensity can vary greatly, as shown in
Table 4.5. For the user, this great variance in traffic intensity could be an important
51
property to be aware of, especially if the user has a limited data plan. Not surprisingly,
we observe that the highest traffic intensity is associated with a video app, YouTube.
Similarly, the entertainment app Flixster, music app Pandora, and personalization
app Zedge also have large traffic intensities as they download audio and video files. We
also observe apps with zero, or negligible, traffic intensity, such as the productivity app
Advanced Task Killer and free photography app Picsay.
Origin of traffic. The origin of traffic means the percentage of the network traffic
that comes from the servers owned by the app provider. This metric is particularly in-
teresting for privacy-sensitive users, since it is an indication of the control that the app
provider has over the app’s data. Interestingly, there is large variance for this metric, as
shown in Table 4.5. For example, the apps Amazon, Pandora, YouTube, and Craigslist
deliver most of their network traffic (e.g., more than 95%) through their own servers
and network. However, there is no origin traffic in the apps Angry Birds and ESPN.
Interestingly, we observe that ony 67% of the Facebook traffic comes from Facebook
servers, with the remaining coming from content providers or the cloud.
Technical challenge. It is a challenge to classify the network traffic into different
categories (e.g., cloud vs. ad network), let alone identify the originating entity. To
resolve this, we combine an array of methods, including reverse IP address lookup,
DNS and whois, and additional information and knowledge from public databases and
the web. In many cases, we use information from CrunchBase (crunchbase.com) to
identify the type of traffic sources after we resolve the top-level domains of the network
traffic [18]. Then, we classify the remaining traffic sources based on information gleaned
52
from their website and search results.
In some cases, detecting the origin is even more complicated. For example,
consider the Dolphin web browser—here the origin is not the Dolphin web site, but
rather the website that the user visits with the browser, e.g., if the user visits CNN,
then cnn.com is the origin. Also, YouTube is owned by Google and YouTube media
content is delivered from domain 1e100.net, which is owned by Google; we report the
media content (96.47%) as Origin, and the remaining traffic (3.53%) as Google which
can include Google ads and analytics.
CDN+Cloud traffic. This metric shows the percentage of the traffic that comes from
servers of CDN (e.g., Akamai) or cloud providers (e.g., Amazon AWS). Content Distri-
bution Network (CDN) has become a common method to distribute the app’s data to its
users across the world faster, with scalability and cost-effectively. Cloud platforms have
extended this idea by providing services (e.g., computation) and not just data storage.
Given that it is not obvious if someone using a cloud service is using it as storage, e.g.,
as a CDN, or for computation, we group CDN and cloud services into one category.
Interestingly, there is a very strong presence of this kind of traffic for some apps, as
seen in Table 4.5. For example, the personalization app Zedge, and the video-heavy app
Flixster need intensive network services, and they use CDN and Cloud data sources.
The high percentages that we observe for CDN+Cloud traffic point to how important
CDN and Cloud sources are, and how much apps rely on them for data distribution.
Google traffic. Given that Android is a product of Google, it is natural to wonder how
involved Google is in Android traffic. The metric is the percentage of traffic exchanged
53
with Google servers (e.g., 1e100.net), shown as the second-to-last column in Table 4.5.
It has been reported that the percentage of Google traffic has increased significantly over
the past several years [19]. This is due in part to the increasing penetration of Google
services (e.g., maps, ads, analytics, and Google App Engine). Note that 22 of out of the
27 apps exchange traffic with Google, and we discuss this in more detail in Section 4.3.7.
Third-party traffic. This metric is of particular interest to privacy-sensitive users.
We define third party traffic as network traffic from various advertising services (e.g.,
Atdmt) and analytical services (e.g., Omniture) besides Google, since advertising and
analytical services from Google are included in the Google traffic metric. From Ta-
ble 4.5, we see that different apps have different percentages of third-party traffic. Most
apps only get a small or negligible amount of traffic from third parties (e.g., YouTube,
Amazon and Facebook). At the same time, nearly half of the total traffic of ESPN and
Dolphin comes from third parties.
The ratio of incoming traffic and outgoing traffic. This metric captures the role
of an app as a consumer or producer of data. In Table 4.5, we see that most of the apps
are more likely to receive data than to send data. As expected, we see that the network
traffic from Flixster, Pandora, and YouTube, which includes audio and video content,
is mostly incoming traffic as the large values of the ratios show. In contrast, apps such
as Picsay and Angry Birds tend to send out more data than they receive.
Note that this metric could have important implications for performance op-
timization of wireless data network providers. An increase in the outgoing traffic could
challenge network provisioning, in the same way that the emergence of p2p file shar-
54
ing stretched cable network operators, who were not expecting large household upload
needs. Another use of this metric is to detect suspicious variations in the ratio, e.g.,
unusually large uploads, which could indicate a massive theft of data. Note that the
goal is to provide the framework and tools for such an investigation, which we plan to
conduct as our future work.
Number of distinct traffic sources. An additional way of quantifying the inter-
actions of an app is with the number of distinct traffic sources, i.e., distinct top-level
domains. This metric can be seen as a complementary way to quantify network interac-
tions, a sudden increase in this metric could indicate malicious behavior. In Table 4.5
we present the results. First, we observe that all the examined apps interact with at
least two distinct traffic sources, except Advanced Task Killer. Second, some of the
apps interact with a surprisingly high number of distinct traffic sources, e.g., Weather
bug, Flixster, and Pandora. Note that we count all the distinct traffic sources that
appear in the traces of multiple executions.
The percentage of HTTP and HTTPS traffic. To get a sense of the percentage
of secure Android app traffic, we compute the split between HTTP and HTTPS traffic,
e.g., non-encrypted and encrypted traffic. We present the results in the last column
of Table 4.5 (‘–’ represents no traffic). The absence of HTTPS traffic is staggering in
the apps we tested, and even Facebook has roughly 22 % of unencrypted traffic, as we
further elaborate in section 4.3.4.
55
4.3 ProfileDroid: Profiling Apps
In this section, we ask the question: How can ProfileDroid help us better un-
derstand app behavior? In response, we show what kind of information ProfileDroid
can extract from each layer in isolation or in combination with other layers.
4.3.1 Capturing Multi-layer Intensity
The intensity of activities at each layer is a fundamental metric that we want
to capture, as it can provide a thumbnail of the app behavior. The multi-layer intensity
is a tuple consisting of intensity metrics from each layer: static (number of functionali-
ties), user (touch event intensity), operating system (system call intensity), and network
(traffic intensity).
Presenting raw intensity numbers is easy, but it has limited intuitive value.
For example, reporting 100 system calls per second provides minimal information to a
user or an application developer. A more informative approach is to present the relative
intensity of this app compared to other apps.
We opt to represent the activity intensity of each layer using labels: H (high),
M (medium), and L (low). The three levels (H,M,L) are defined relative to the intensi-
ties observed at each layer using the five-number summary from statistical analysis [24]:
minimum (Min), lower quartile (Q1), median (Med), upper quartile (Q3), and maxi-
mum (Max). Specifically, we compute the five-number summary across all 27 apps at
each layer, and then define the ranges for H, M , and L as follows:
Min < L ≤ Q1 Q1 < M ≤ Q3 Q3 < H ≤Max
The results are in the following table:
56
Note that there are many different ways to define these thresholds, depending
on the goal of the study, whether it is conserving resources, (e.g., determining static
thresholds to limit intensity), or studying different app categories (e.g., general-purpose
apps have different thresholds compared to games). In addition, having more than three
levels of intensity provides more accurate profiling, at the expense of simplicity. To sum
up, we chose to use relative intensities and characterize a wide range of popular apps to
mimic testing of typical Google Play apps.
Table 4.6 shows the results of applying this H-M -L model to our test apps.
We now proceed to showing how users and developers can benefit from an H-M -L-based
app thumbnail for characterizing app behavior. Users can make more informed decisions
when choosing apps by matching the H-M -L thumbnail with individual preference and
constraints. For example, if a user has a small-allotment data plan on the phone, perhaps
he would like to only use apps that are rated L for the intensity of network traffic; if
the battery is low, perhaps she should refrain from running apps rated H at the OS or
network layers.
Developers can also benefit from the H-M -L model by being able to profile their
apps with ProfileDroid and optimize based on the H-M -L outcome. For example, if
ProfileDroid indicates an unusually high intensity of filesystem calls in the operating
system layer, the developer can examine their code to ensure those calls are legitimate.
Similarly, if the developer is contemplating using an advertising library in their app, she
can construct two H-M -L app models, with and without the ad library and understand
the trade-offs.
In addition, an H-M -L thumbnail can help capture the nature of an app. Intu-
itively, we would expect interactive apps (social apps, news apps, games, Web browsers)
to have intensity H at the user layer; similarly, we would expect media player apps to
57
have intensity H at the network layer, but L at the user layer. Table 4.6 supports these
expectations, and suggests that the the H-M -L thumbnail could be an initial way to
classify apps into coarse behavioral categories.
4.3.2 Cross-layer Analysis
We introduce a notion of cross-layer analysis to compare the inferred (or ob-
served) behavior across different layers. Performing this analysis serves two purposes:
to identify potential discrepancies (e.g., resource usage via intents, as explained in Sec-
tion 4.2.1), and to help characterize app behavior in cases where examining just one
layer is insufficient. We now provide some examples.
Network traffic disambiguation. By cross-checking the user and network layers
we were able to distinguish advertising traffic from expected traffic. For example, when
profiling the Dolphin browser, by looking at both layers, we were able to separate adver-
tisers traffic from web content traffic (the website that the user browses to), as follows.
From the user layer trace, we see that the user surfed to, for example, cnn.com, which,
when combined with the network traffic, can be used to distinguish legitimate traffic
coming from CNN and advertising traffic originating at CNN; note that the two traffic
categories are distinct and labeled Origin and Third-party, respectively, in Section 4.2.4.
If we were to only examine the network layer, when observing traffic with the source
cnn.com, we would not be able to tell Origin traffic apart from ads placed by cnn.com.
Application disambiguation. In addition to traffic disambiguation, we envision
cross-layer checking to be useful for behavioral fingerprinting for apps. Suppose that we
58
need to distinguish a file manager app from a database-intensive app. If we only exam-
ine the operating system layer, we would find that both apps show high FS (filesystem)
activity. However, the database app does this without any user intervention, whereas
the file manager initiates file activity (e.g., move file, copy file) in response to user input.
By cross-checking the operating system layer and user layer we can distinguish between
the two apps because the file manager will show much higher user-layer activity. We
leave behavioral app fingerprinting to future work.
4.3.3 Free Versions of Apps Could End Up Costing More Than Their
Paid Versions
The Android platform provides an open market for app developers. Free apps
(69% of all apps on Google Play [17]) significantly contributed to the adoption of Android
platform. However, the free apps are not as free as we would expect. As we will explain
shortly, considerable amounts of network traffic are dedicated to for-profit services, e.g.,
advertising and analytics.
In fact, we performed a cross-layer study between free apps and their paid
counterparts. As mentioned above, users carried out the same task when running the free
and paid versions of an app. We now proceed to describe findings at each layer. We found
no difference at the static layer (Table 4.2). At the user-layer, Figure 4.2 shows that
most of behaviors are similar between free and paid version of the apps, which indicates
that free and paid versions have similar GUI layouts, and performing the same task
takes similar effort in both the free and the paid versions of an app. The exception was
the photography app Picsay. At first we found this finding counterintuitive; however,
the paid version of Picsay provides more picture-manipulating functions than the free
version, which require more navigation (user input) when manipulating a photo.
59
Differences are visible at the OS layer as well: as shown in Table 4.4, system
call intensity is significantly higher (around 50%–100%) in free apps compared the their
paid counterparts, which implies lower performance and higher energy consumption.
The only exception is Picsay, whose paid version has higher system call intensity; this
is due to increased GUI navigation burden as we explained above.
We now move on to the network layer. Intuitively, the paid apps should not
bother users with the profit-making extra traffic, e.g., ads and analytics, which consumes
away the data plan. However, the results only partially match our expectations. As
shown in Table 4.5, we find that the majority of the paid apps indeed exhibit dramatically
reduced network traffic intensity, which help conserve the data plan. Also, as explained
in Section 4.3.6, paid apps talk to fewer data sources than their free counterparts.
However, we could still observe traffic from Google and third party in the paid apps. We
further investigate whether the paid apps secure their network traffic by using HTTPS
instead of HTTP. As shown in Table 4.5, that is usually not the case, with the exception
of Instant Heart Rate.
To sum up, the “free” in “free apps” comes with a hard-to-quantify, but no-
ticeable, user cost. Users are unaware of this because multi-layer behavior is generally
opaque to all but most advanced users; however, this shortcoming is addressed well by
ProfileDroid.
4.3.4 Heavy VM&IPC Usage Reveals a Security-Performance Trade-
off
As mentioned in Section 4.2.3, Android apps are isolated from the hardware
via the VM, and isolated from each other by running on separate VM copies in separate
processes with different UIDs. This isolation has certain reliability and security advan-
60
tages, i.e., a corrupted or malicious app can only inflict limited damage. The flip side,
though, is the high overhead associated with running bytecode on top of a VM (instead
of natively), as well as the high overhead due to IPC communication that has to cross
address spaces. The VM&IPC column in Table 4.4 quantifies this overhead: we were
able to attribute around two-thirds of system calls (63.77% to 87.09%, depending on the
app) to VM and IPC. The precise impact of VM&IPC system calls on performance and
energy usage is beyond the scope of this dissertation, as it would require significantly
more instrumentation. Nevertheless, the two-thirds figure provides a good intuition of
the additional system call burden due to isolation.
4.3.5 Most Network Traffic is not Encrypted
As Android devices and apps manipulate and communicate sensitive data (e.g.,
GPS location, list of contacts, account information), we have investigated whether the
Android apps use HTTPS to secure their data transfer. Last column of Table 4.5 shows
the split between HTTP and HTTPS traffic for each app. We see that most apps use
HTTP to transfer the data. Although some apps secure their traffic by using HTTPS,
the efforts are quite limited. This is a potential concern: for example, for Facebook
77.26% of network traffic is HTTPS, hence the remaining 22.74% can be intercepted
or modified in transit in a malicious way. A similar concern is notable with Instant
Heart Rate, a health app, whose free version secures only 13.73% of the traffic with
HTTPS; personal health information might leak in the remaining 86.27% HTTP traffic.
We further investigate which traffic sources are using HTTPS and report the results in
Table 4.8. Note how HTTPS data sources (Origin, CDN, Google) also deliver services
over HTTP. These results reveal that deployment of HTTPS is lagging in Android
apps—an undesirable situation as Android apps are often used for privacy-sensitive
61
tasks.
4.3.6 Apps Talk to Many More Traffic Sources Than One Would Think
When running apps that have Internet permission, the underlying network
activity is a complete mystery: without access to network monitoring and analysis
capabilities, users and developers do not know where the network traffic comes from and
goes to. To help address this issue, we investigate the traffic sources; Table 4.5 shows
the number of distinct traffic sources in each app, while Table 4.9 shows the number
of distinct traffic sources per traffic category. We make two observations here. First,
Table 4.5 reveals that most of the apps interact with at least two traffic sources, and
some apps have traffic with more than 10 sources, e.g., Pandora and Shazam, because
as we explained in Section 4.2.4, traffic sources span a wide range of network traffic
categories: Origin, CDN, Cloud, Google and third party. Second, paid apps have fewer
traffic sources than their free counterparts (3 vs. 8 for Dictionary.com, 4 vs. 13 for
Shazam, 9 vs. 22 for Dolphin), and the number of third-party sources is 0 or 1 for
most paid apps. This information is particularly relevant to app developers, because
not all traffic sources are under the developer’s control. Knowing this information makes
both users and developers aware of the possible implications (e.g., data leaking to third
parties) of running an app.
4.3.7 How Predominant is Google Traffic in the Overall Network Traf-
fic?
Android apps are relying on many Google services such as Google maps,
YouTube video, AdMob advertising, Google Analytics, and Google App Engine. Since
62
Google leads the Android development effort, we set out to investigate whether Google
“rules” the Android app traffic. In Table 4.5, we have presented the percentage of
Google traffic relative to all traffic. While this percentage varies across apps, most apps
have at least some Google traffic. Furthermore, Google traffic dominates the network
traffic in the apps Tiny Flashlight (99.79%), Gasbuddy (81.37%) and Instant Heart
Rate (85.97%), which shows that these apps crucially rely on Google services. However,
some apps, such as Amazon and Facebook, do not have Google traffic; we believe this
information is relevant to certain categories of users.
In addition, we further break down the Google traffic and analyze the ratio of
incoming traffic from Google to outgoing traffic to Google. The ratios are presented in
Table 4.9. We find that most apps are Google data receivers (in/out ratio > 1). However,
Advanced Task Killer, Picsay and Flixster, are sending more data to Google than
they are receiving (in/out ratio < 1); this is expected.
4.4 Acknowledgement
The design, implementation and evaluation of ProfileDroid are the result of
joint work. Lorenzo Gomez developed the replay part used in ProfileDroid.
63
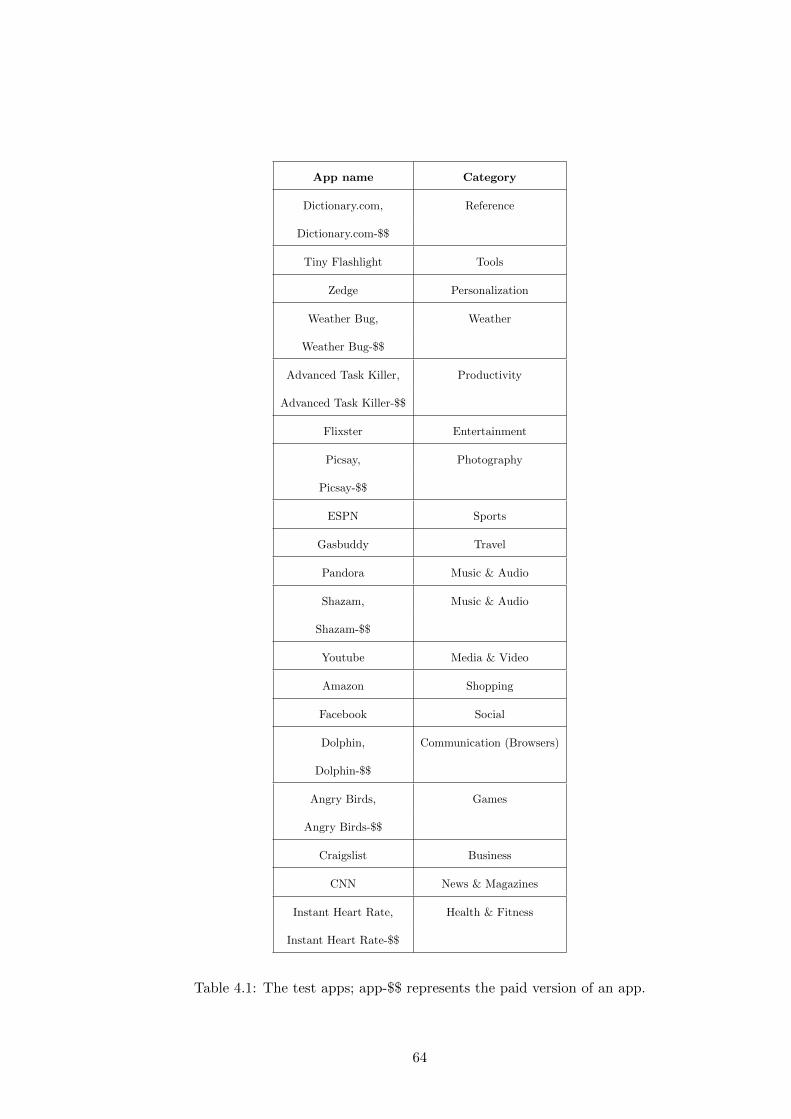
App name Category
Dictionary.com, Reference
Dictionary.com-$$
Tiny Flashlight Tools
Zedge Personalization
Weather Bug, Weather
Weather Bug-$$
Advanced Task Killer, Productivity
Advanced Task Killer-$$
Flixster Entertainment
Picsay, Photography
Picsay-$$
ESPN Sports
Gasbuddy Travel
Pandora Music & Audio
Shazam, Music & Audio
Shazam-$$
Youtube Media & Video
Amazon Shopping
Facebook Social
Dolphin, Communication (Browsers)
Dolphin-$$
Angry Birds, Games
Angry Birds-$$
Craigslist Business
CNN News & Magazines
Instant Heart Rate, Health & Fitness
Instant Heart Rate-$$
Table 4.1: The test apps; app-$$ represents the paid version of an app.
64
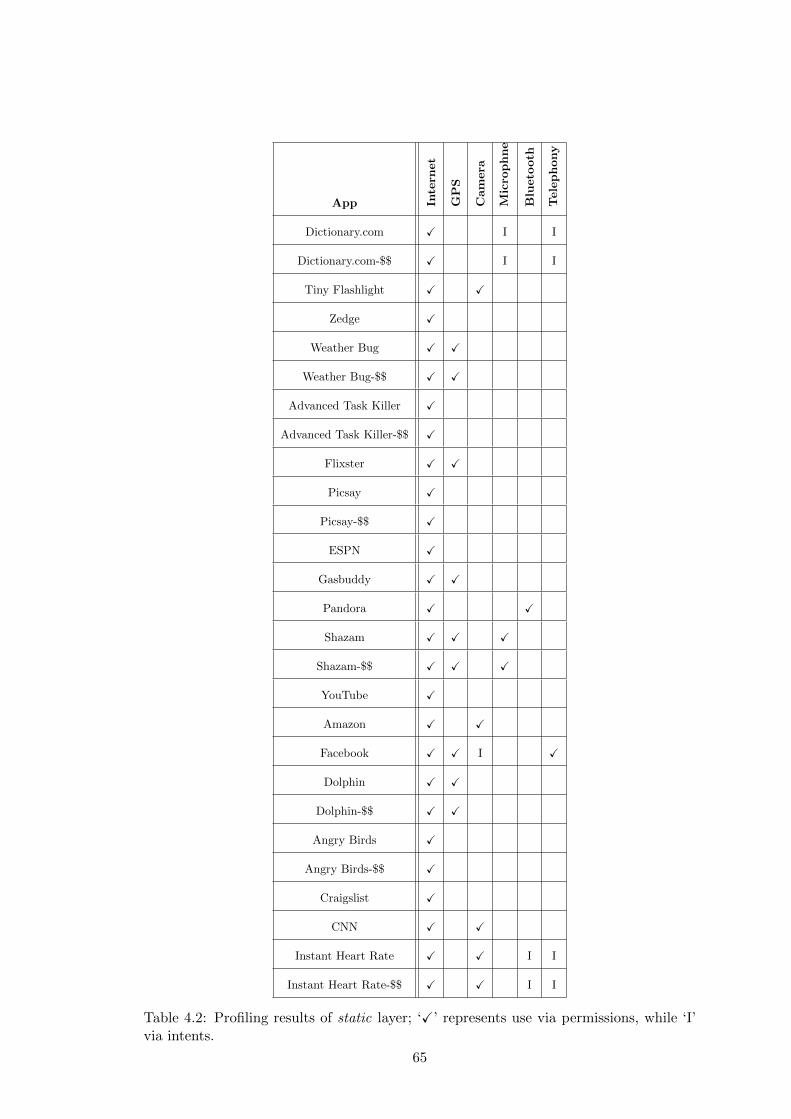
App Inte
rnet
GP
S
Cam
era
Mic
rop
hn
e
Blu
eto
oth
Tele
ph
ony
Dictionary.com X I I
Dictionary.com-$$ X I I
Tiny Flashlight X X
Zedge X
Weather Bug X X
Weather Bug-$$ X X
Advanced Task Killer X
Advanced Task Killer-$$ X
Flixster X X
Picsay X
Picsay-$$ X
ESPN X
Gasbuddy X X
Pandora X X
Shazam X X X
Shazam-$$ X X X
YouTube X
Amazon X X
Facebook X X I X
Dolphin X X
Dolphin-$$ X X
Angry Birds X
Angry Birds-$$ X
Craigslist X
CNN X X
Instant Heart Rate X X I I
Instant Heart Rate-$$ X X I I
Table 4.2: Profiling results of static layer; ‘X’ represents use via permissions, while ‘I’via intents.
65
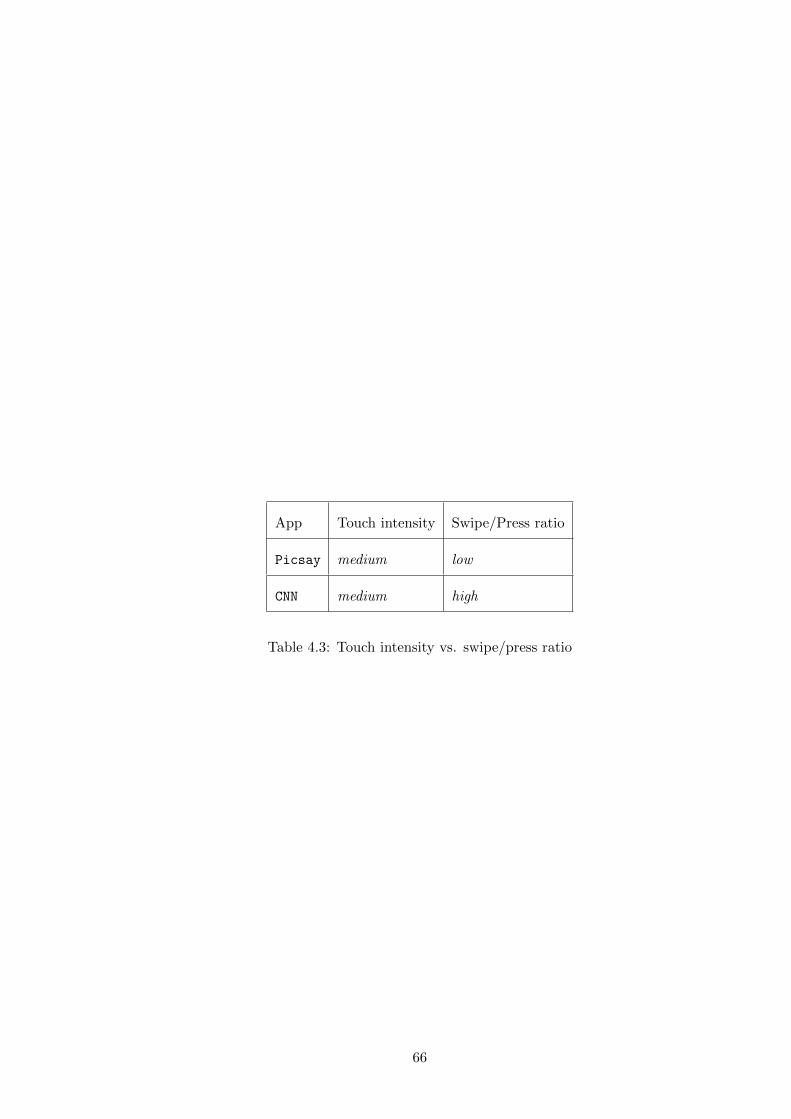
App Touch intensity Swipe/Press ratio
Picsay medium low
CNN medium high
Table 4.3: Touch intensity vs. swipe/press ratio
66
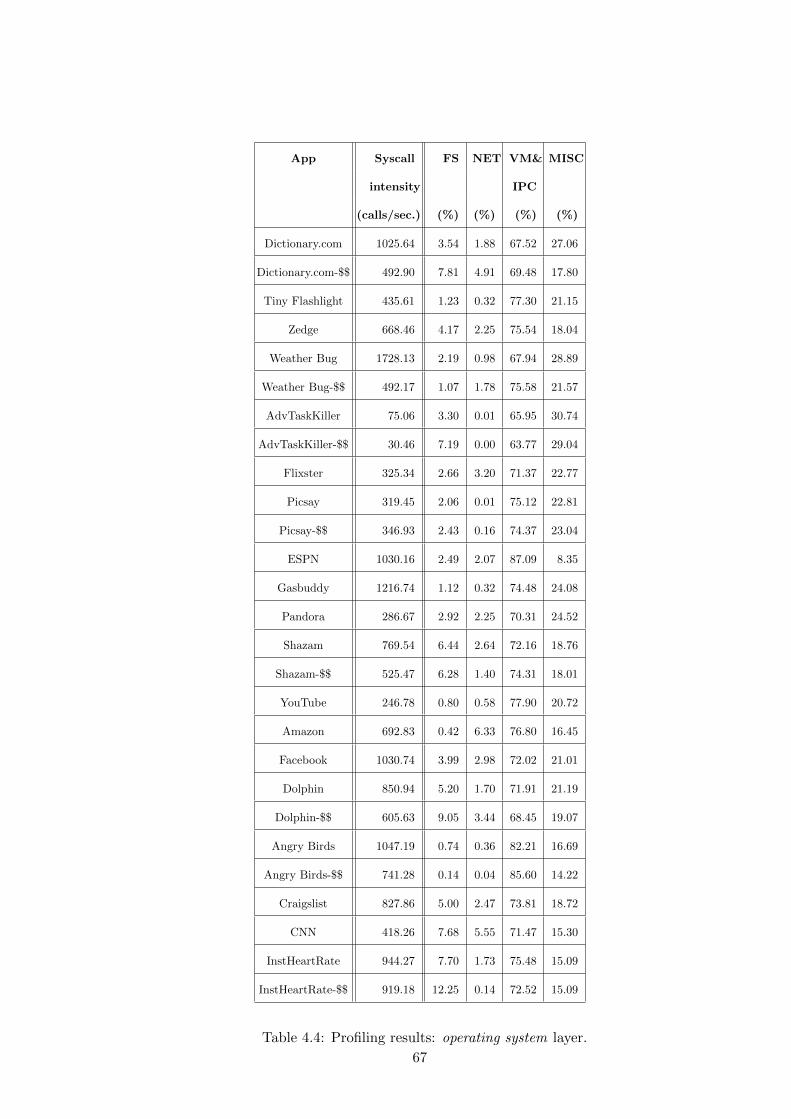
App Syscall FS NET VM& MISC
intensity IPC
(calls/sec.) (%) (%) (%) (%)
Dictionary.com 1025.64 3.54 1.88 67.52 27.06
Dictionary.com-$$ 492.90 7.81 4.91 69.48 17.80
Tiny Flashlight 435.61 1.23 0.32 77.30 21.15
Zedge 668.46 4.17 2.25 75.54 18.04
Weather Bug 1728.13 2.19 0.98 67.94 28.89
Weather Bug-$$ 492.17 1.07 1.78 75.58 21.57
AdvTaskKiller 75.06 3.30 0.01 65.95 30.74
AdvTaskKiller-$$ 30.46 7.19 0.00 63.77 29.04
Flixster 325.34 2.66 3.20 71.37 22.77
Picsay 319.45 2.06 0.01 75.12 22.81
Picsay-$$ 346.93 2.43 0.16 74.37 23.04
ESPN 1030.16 2.49 2.07 87.09 8.35
Gasbuddy 1216.74 1.12 0.32 74.48 24.08
Pandora 286.67 2.92 2.25 70.31 24.52
Shazam 769.54 6.44 2.64 72.16 18.76
Shazam-$$ 525.47 6.28 1.40 74.31 18.01
YouTube 246.78 0.80 0.58 77.90 20.72
Amazon 692.83 0.42 6.33 76.80 16.45
Facebook 1030.74 3.99 2.98 72.02 21.01
Dolphin 850.94 5.20 1.70 71.91 21.19
Dolphin-$$ 605.63 9.05 3.44 68.45 19.07
Angry Birds 1047.19 0.74 0.36 82.21 16.69
Angry Birds-$$ 741.28 0.14 0.04 85.60 14.22
Craigslist 827.86 5.00 2.47 73.81 18.72
CNN 418.26 7.68 5.55 71.47 15.30
InstHeartRate 944.27 7.70 1.73 75.48 15.09
InstHeartRate-$$ 919.18 12.25 0.14 72.52 15.09
Table 4.4: Profiling results: operating system layer.
67
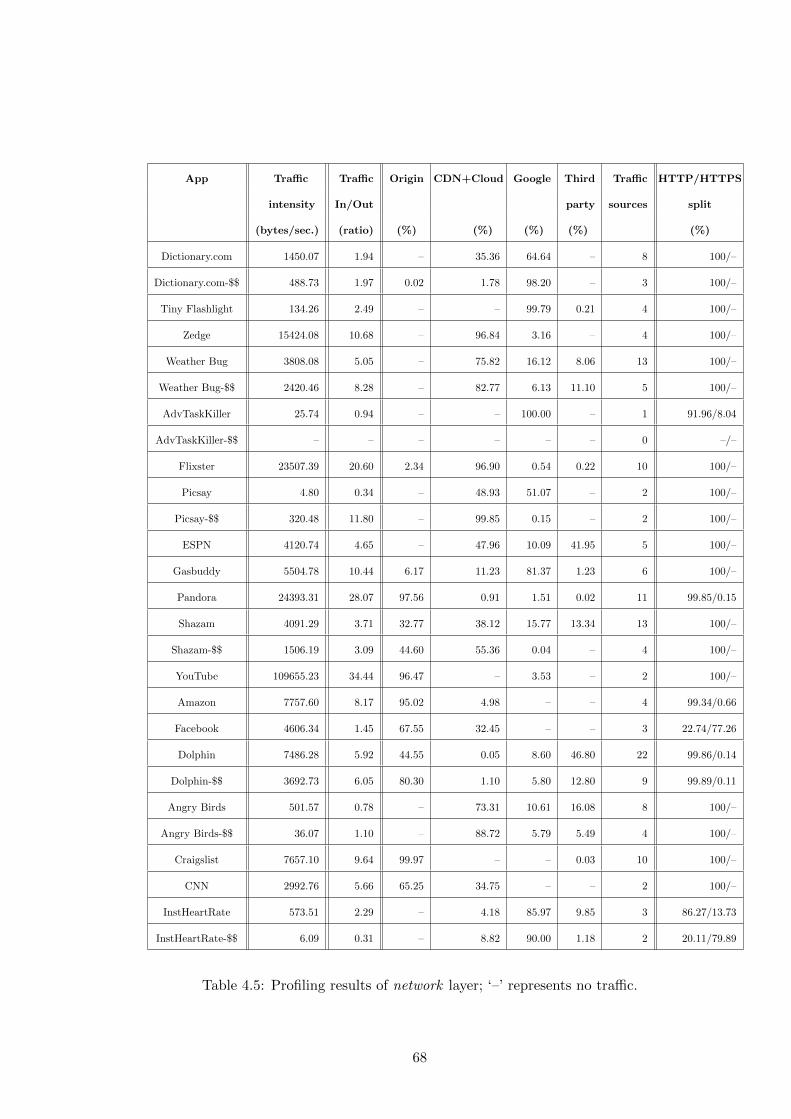
App Traffic Traffic Origin CDN+Cloud Google Third Traffic HTTP/HTTPS
intensity In/Out party sources split
(bytes/sec.) (ratio) (%) (%) (%) (%) (%)
Dictionary.com 1450.07 1.94 – 35.36 64.64 – 8 100/–
Dictionary.com-$$ 488.73 1.97 0.02 1.78 98.20 – 3 100/–
Tiny Flashlight 134.26 2.49 – – 99.79 0.21 4 100/–
Zedge 15424.08 10.68 – 96.84 3.16 – 4 100/–
Weather Bug 3808.08 5.05 – 75.82 16.12 8.06 13 100/–
Weather Bug-$$ 2420.46 8.28 – 82.77 6.13 11.10 5 100/–
AdvTaskKiller 25.74 0.94 – – 100.00 – 1 91.96/8.04
AdvTaskKiller-$$ – – – – – – 0 –/–
Flixster 23507.39 20.60 2.34 96.90 0.54 0.22 10 100/–
Picsay 4.80 0.34 – 48.93 51.07 – 2 100/–
Picsay-$$ 320.48 11.80 – 99.85 0.15 – 2 100/–
ESPN 4120.74 4.65 – 47.96 10.09 41.95 5 100/–
Gasbuddy 5504.78 10.44 6.17 11.23 81.37 1.23 6 100/–
Pandora 24393.31 28.07 97.56 0.91 1.51 0.02 11 99.85/0.15
Shazam 4091.29 3.71 32.77 38.12 15.77 13.34 13 100/–
Shazam-$$ 1506.19 3.09 44.60 55.36 0.04 – 4 100/–
YouTube 109655.23 34.44 96.47 – 3.53 – 2 100/–
Amazon 7757.60 8.17 95.02 4.98 – – 4 99.34/0.66
Facebook 4606.34 1.45 67.55 32.45 – – 3 22.74/77.26
Dolphin 7486.28 5.92 44.55 0.05 8.60 46.80 22 99.86/0.14
Dolphin-$$ 3692.73 6.05 80.30 1.10 5.80 12.80 9 99.89/0.11
Angry Birds 501.57 0.78 – 73.31 10.61 16.08 8 100/–
Angry Birds-$$ 36.07 1.10 – 88.72 5.79 5.49 4 100/–
Craigslist 7657.10 9.64 99.97 – – 0.03 10 100/–
CNN 2992.76 5.66 65.25 34.75 – – 2 100/–
InstHeartRate 573.51 2.29 – 4.18 85.97 9.85 3 86.27/13.73
InstHeartRate-$$ 6.09 0.31 – 8.82 90.00 1.18 2 20.11/79.89
Table 4.5: Profiling results of network layer; ‘–’ represents no traffic.
68
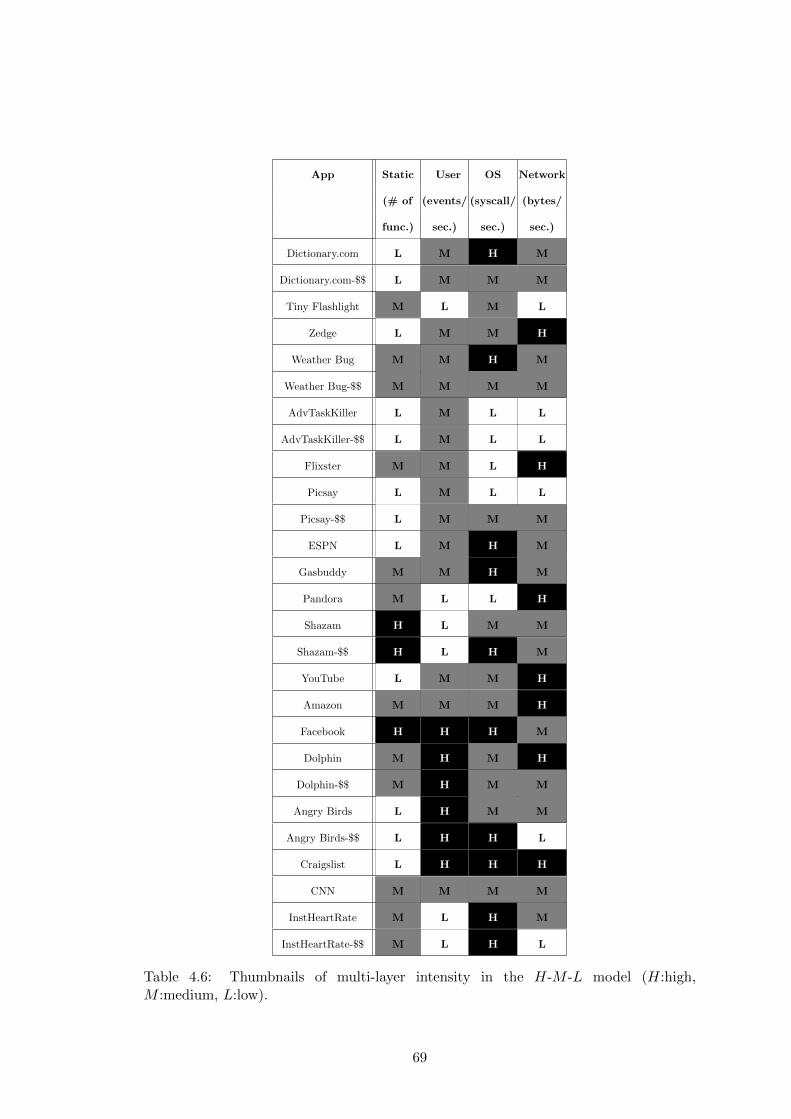
App Static User OS Network
(# of (events/ (syscall/ (bytes/
func.) sec.) sec.) sec.)
Dictionary.com L M H M
Dictionary.com-$$ L M M M
Tiny Flashlight M L M L
Zedge L M M H
Weather Bug M M H M
Weather Bug-$$ M M M M
AdvTaskKiller L M L L
AdvTaskKiller-$$ L M L L
Flixster M M L H
Picsay L M L L
Picsay-$$ L M M M
ESPN L M H M
Gasbuddy M M H M
Pandora M L L H
Shazam H L M M
Shazam-$$ H L H M
YouTube L M M H
Amazon M M M H
Facebook H H H M
Dolphin M H M H
Dolphin-$$ M H M M
Angry Birds L H M M
Angry Birds-$$ L H H L
Craigslist L H H H
CNN M M M M
InstHeartRate M L H M
InstHeartRate-$$ M L H L
Table 4.6: Thumbnails of multi-layer intensity in the H-M -L model (H:high,M :medium, L:low).
69
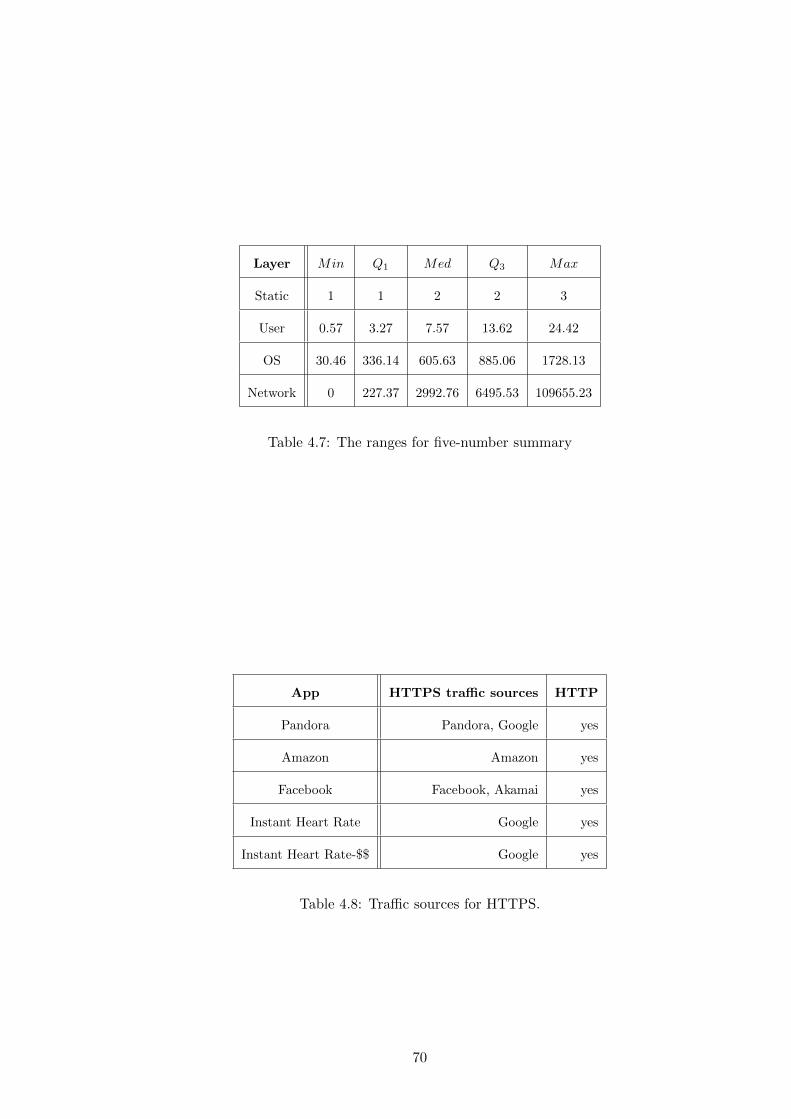
Layer Min Q1 Med Q3 Max
Static 1 1 2 2 3
User 0.57 3.27 7.57 13.62 24.42
OS 30.46 336.14 605.63 885.06 1728.13
Network 0 227.37 2992.76 6495.53 109655.23
Table 4.7: The ranges for five-number summary
App HTTPS traffic sources HTTP
Pandora Pandora, Google yes
Amazon Amazon yes
Facebook Facebook, Akamai yes
Instant Heart Rate Google yes
Instant Heart Rate-$$ Google yes
Table 4.8: Traffic sources for HTTPS.
70
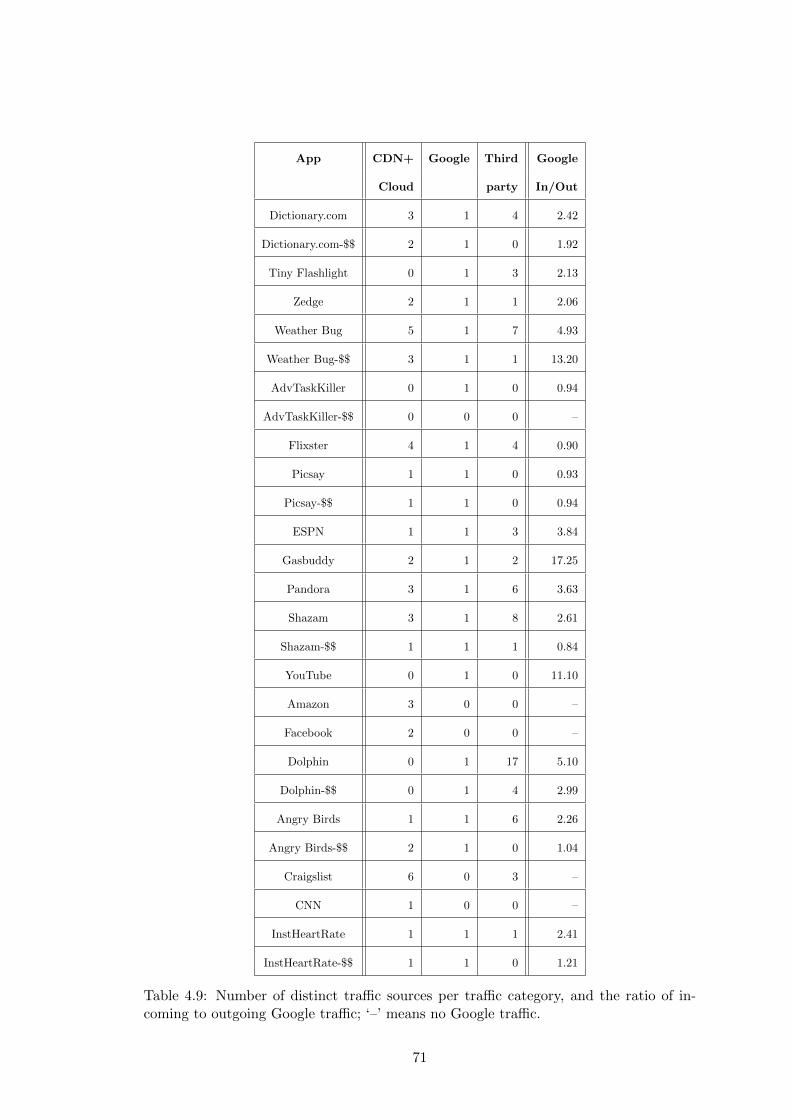
App CDN+ Google Third Google
Cloud party In/Out
Dictionary.com 3 1 4 2.42
Dictionary.com-$$ 2 1 0 1.92
Tiny Flashlight 0 1 3 2.13
Zedge 2 1 1 2.06
Weather Bug 5 1 7 4.93
Weather Bug-$$ 3 1 1 13.20
AdvTaskKiller 0 1 0 0.94
AdvTaskKiller-$$ 0 0 0 –
Flixster 4 1 4 0.90
Picsay 1 1 0 0.93
Picsay-$$ 1 1 0 0.94
ESPN 1 1 3 3.84
Gasbuddy 2 1 2 17.25
Pandora 3 1 6 3.63
Shazam 3 1 8 2.61
Shazam-$$ 1 1 1 0.84
YouTube 0 1 0 11.10
Amazon 3 0 0 –
Facebook 2 0 0 –
Dolphin 0 1 17 5.10
Dolphin-$$ 0 1 4 2.99
Angry Birds 1 1 6 2.26
Angry Birds-$$ 2 1 0 1.04
Craigslist 6 0 3 –
CNN 1 0 0 –
InstHeartRate 1 1 1 2.41
InstHeartRate-$$ 1 1 0 1.21
Table 4.9: Number of distinct traffic sources per traffic category, and the ratio of in-coming to outgoing Google traffic; ‘–’ means no Google traffic.
71
Chapter 5
Enabling BYOH Management via
Behavior-aware Profiling
5.1 Brofiler: Systematic Profiling
We propose a systematic approach to profile BYOHs based on their behav-
ioral patterns. The goal is to develop a classification that is: intuitive and useful, so
that network administrators can monitor, manage, and reason about groups of BYOHs.
Our framework focuses on profiling user behavior based on multiple dimensions such as
frequency of appearance, data usage, and IP requests. At the same time, our profiling
can be integrated in a policy and traffic management system as shown in Figure 5.1. In
Section 5.3 we discuss the kind of policies our approach can help put in place.
5.1.1 Datasets and Initial Statistics
Our study is based on two datasets collected at a monitoring point inside a
large, educational, campus network. One dataset, denoted DHCP-366,1 consists of the
1The 366 stands for the days of 2012, which was a leap year.
72
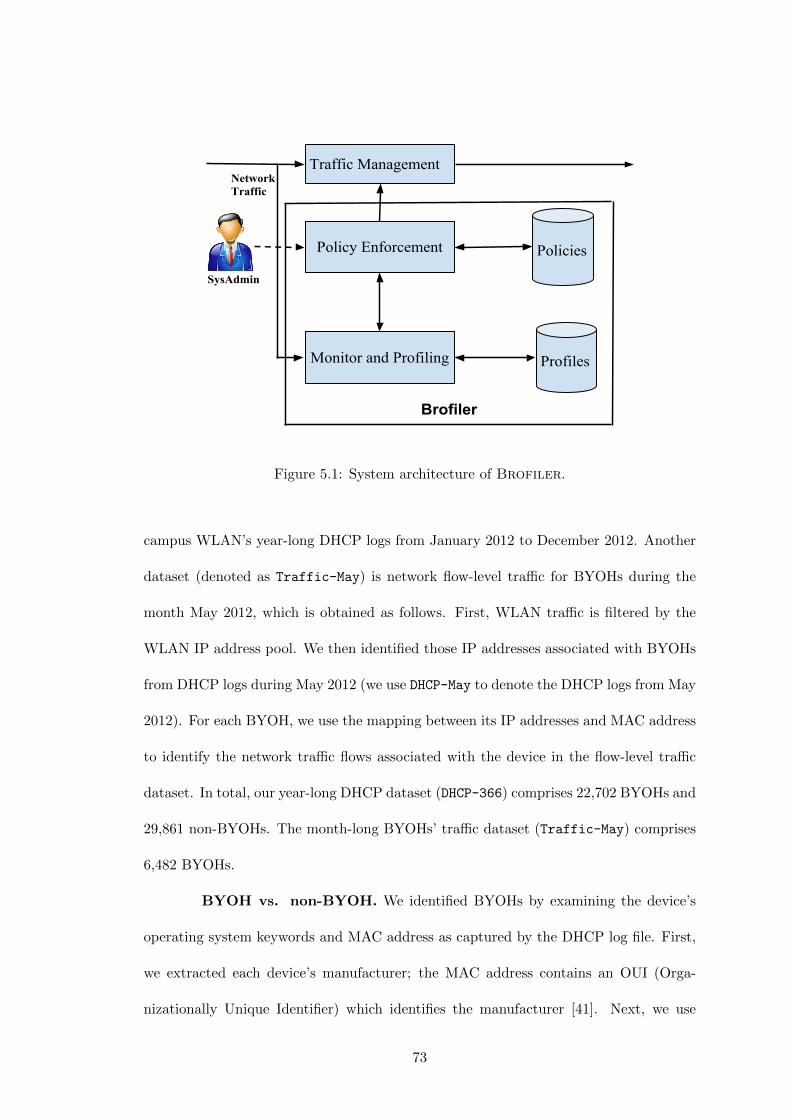
3URILOHV
3ROLFLHV
7UDIILF�0DQDJHPHQW�1HWZRUN�7UDIILF
3ROLF\�(QIRUFHPHQW
0RQLWRU�DQG�3URILOLQJ
%URILOHU
6\V$GPLQ
Figure 5.1: System architecture of Brofiler.
campus WLAN’s year-long DHCP logs from January 2012 to December 2012. Another
dataset (denoted as Traffic-May) is network flow-level traffic for BYOHs during the
month May 2012, which is obtained as follows. First, WLAN traffic is filtered by the
WLAN IP address pool. We then identified those IP addresses associated with BYOHs
from DHCP logs during May 2012 (we use DHCP-May to denote the DHCP logs from May
2012). For each BYOH, we use the mapping between its IP addresses and MAC address
to identify the network traffic flows associated with the device in the flow-level traffic
dataset. In total, our year-long DHCP dataset (DHCP-366) comprises 22,702 BYOHs and
29,861 non-BYOHs. The month-long BYOHs’ traffic dataset (Traffic-May) comprises
6,482 BYOHs.
BYOH vs. non-BYOH. We identified BYOHs by examining the device’s
operating system keywords and MAC address as captured by the DHCP log file. First,
we extracted each device’s manufacturer; the MAC address contains an OUI (Orga-
nizationally Unique Identifier) which identifies the manufacturer [41]. Next, we use
73
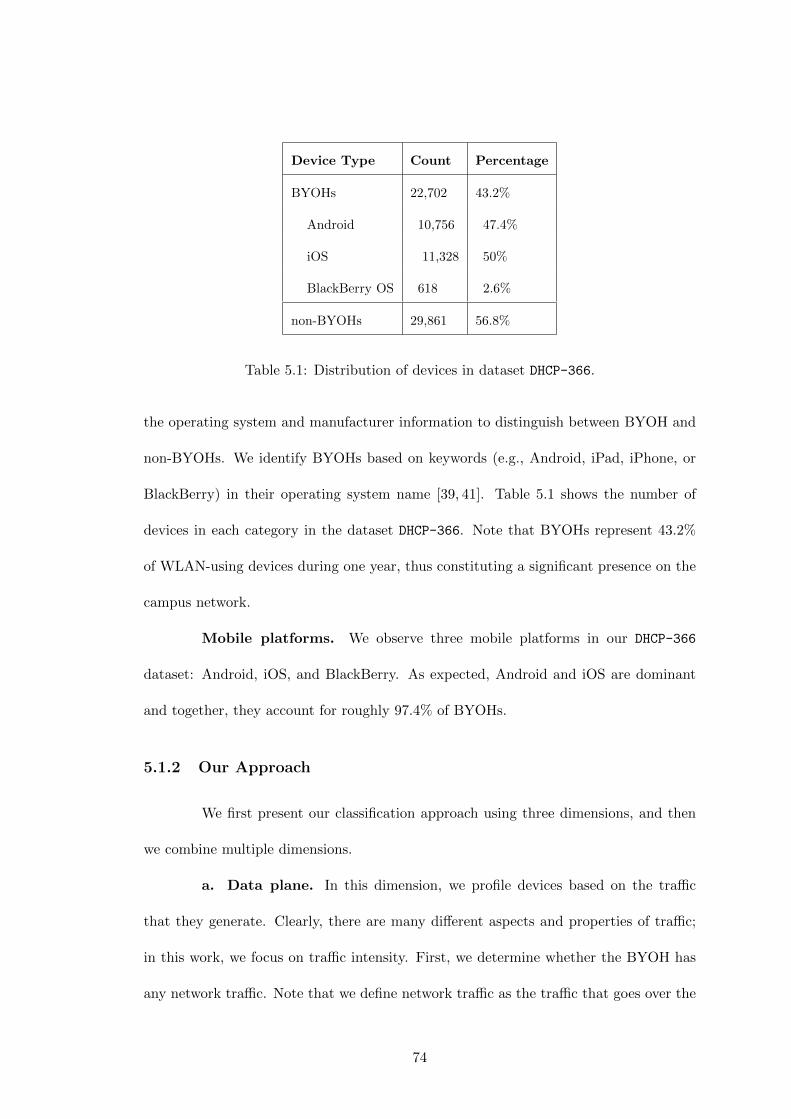
Device Type Count Percentage
BYOHs 22,702 43.2%
Android 10,756 47.4%
iOS 11,328 50%
BlackBerry OS 618 2.6%
non-BYOHs 29,861 56.8%
Table 5.1: Distribution of devices in dataset DHCP-366.
the operating system and manufacturer information to distinguish between BYOH and
non-BYOHs. We identify BYOHs based on keywords (e.g., Android, iPad, iPhone, or
BlackBerry) in their operating system name [39, 41]. Table 5.1 shows the number of
devices in each category in the dataset DHCP-366. Note that BYOHs represent 43.2%
of WLAN-using devices during one year, thus constituting a significant presence on the
campus network.
Mobile platforms. We observe three mobile platforms in our DHCP-366
dataset: Android, iOS, and BlackBerry. As expected, Android and iOS are dominant
and together, they account for roughly 97.4% of BYOHs.
5.1.2 Our Approach
We first present our classification approach using three dimensions, and then
we combine multiple dimensions.
a. Data plane. In this dimension, we profile devices based on the traffic
that they generate. Clearly, there are many different aspects and properties of traffic;
in this work, we focus on traffic intensity. First, we determine whether the BYOH has
any network traffic. Note that we define network traffic as the traffic that goes over the
74
institution’s network, not over the mobile wireless carrier.
We define two categories of BYOHs: (a) Zero traffic BYOHs or or mobile
zombies, that do not generate any network traffic, and (b) Non-zero traffic BYOHs,
that generate traffic. Later, we show how we further study traffic behavior based on
traffic intensity. In our dataset, there are 3,040 zero traffic BYOHs and 3,442 non-zero
traffic BYOHs. We present the details in Section 5.2.2.
b. Temporal behavior. In this dimension, we profile devices based on
temporal behavior, focusing on device appearance frequency on the campus network. A
human-centric way to define frequency is by counting how many distinct weeks the device
appeared on campus. The intuition is that regular employees and diligent students
appear every week on the campus network. Clearly, profiling criteria depend on the
context and nature of the network, e.g., campus versus enterprise or a government
network. Here, we use the datasets DHCP-May and Traffic-May. Note that May 2012
began on a Monday and spanned five weeks, labeled as follows: Week 1 (May 1 to May
5), Week 2 (May 6 to May 12), Week 3 (May 13 to May 19), Week 4 (May 20 to May
26), and Week 5 (May 27 to May 31).
We define the following terms. If a BYOH appears in at least four of the five
weeks, we label it as REG (short for regular). Otherwise, we label the BYOH as NRE
(short for non-regular). This applies to both zero and non-zero traffic BYOHs. We
present the details in Section 5.2.3.
c. Protocol and Control plane. This dimension captures the operational
properties of every BYOH. There are many interesting aspects such as the OS it runs,
whether it conforms to protocol specifications, and whether it could pose security con-
cerns, e.g., using encryption. In this work, we mostly focus on: (a) the behavior of the
BYOH from a DHCP point of view, i.e., how it behaves in terms of acquiring an IP
75
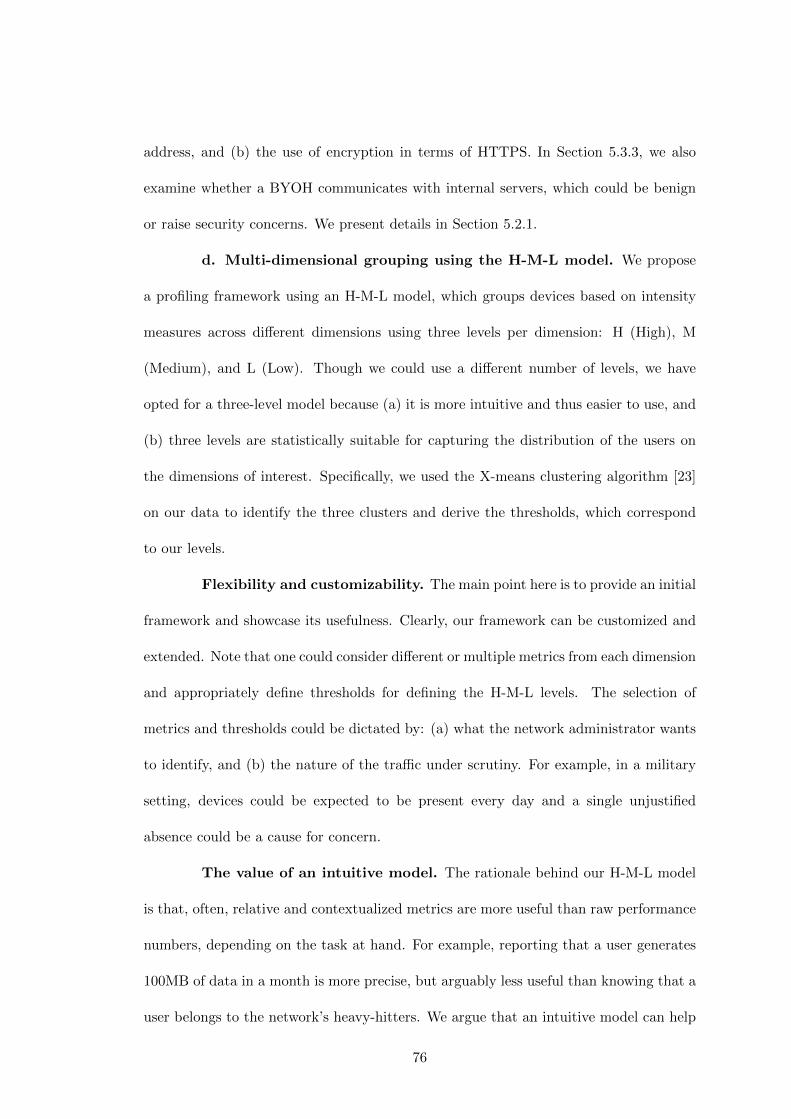
address, and (b) the use of encryption in terms of HTTPS. In Section 5.3.3, we also
examine whether a BYOH communicates with internal servers, which could be benign
or raise security concerns. We present details in Section 5.2.1.
d. Multi-dimensional grouping using the H-M-L model. We propose
a profiling framework using an H-M-L model, which groups devices based on intensity
measures across different dimensions using three levels per dimension: H (High), M
(Medium), and L (Low). Though we could use a different number of levels, we have
opted for a three-level model because (a) it is more intuitive and thus easier to use, and
(b) three levels are statistically suitable for capturing the distribution of the users on
the dimensions of interest. Specifically, we used the X-means clustering algorithm [23]
on our data to identify the three clusters and derive the thresholds, which correspond
to our levels.
Flexibility and customizability. The main point here is to provide an initial
framework and showcase its usefulness. Clearly, our framework can be customized and
extended. Note that one could consider different or multiple metrics from each dimension
and appropriately define thresholds for defining the H-M-L levels. The selection of
metrics and thresholds could be dictated by: (a) what the network administrator wants
to identify, and (b) the nature of the traffic under scrutiny. For example, in a military
setting, devices could be expected to be present every day and a single unjustified
absence could be a cause for concern.
The value of an intuitive model. The rationale behind our H-M-L model
is that, often, relative and contextualized metrics are more useful than raw performance
numbers, depending on the task at hand. For example, reporting that a user generates
100MB of data in a month is more precise, but arguably less useful than knowing that a
user belongs to the network’s heavy-hitters. We argue that an intuitive model can help
76
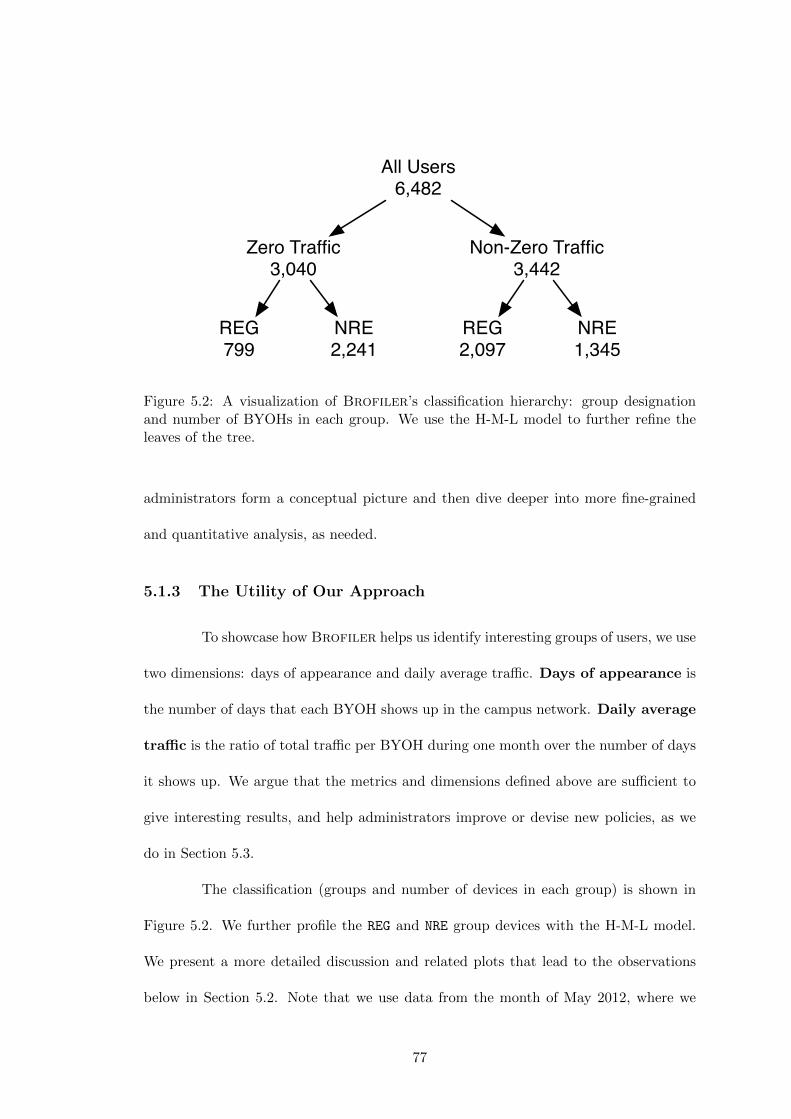
All Users6,482
Zero Traffic3,040
Non-Zero Traffic3,442
REG799
NRE2,241
REG2,097
NRE1,345
Figure 5.2: A visualization of Brofiler’s classification hierarchy: group designationand number of BYOHs in each group. We use the H-M-L model to further refine theleaves of the tree.
administrators form a conceptual picture and then dive deeper into more fine-grained
and quantitative analysis, as needed.
5.1.3 The Utility of Our Approach
To showcase how Brofiler helps us identify interesting groups of users, we use
two dimensions: days of appearance and daily average traffic. Days of appearance is
the number of days that each BYOH shows up in the campus network. Daily average
traffic is the ratio of total traffic per BYOH during one month over the number of days
it shows up. We argue that the metrics and dimensions defined above are sufficient to
give interesting results, and help administrators improve or devise new policies, as we
do in Section 5.3.
The classification (groups and number of devices in each group) is shown in
Figure 5.2. We further profile the REG and NRE group devices with the H-M-L model.
We present a more detailed discussion and related plots that lead to the observations
below in Section 5.2. Note that we use data from the month of May 2012, where we
77
have both DHCP, DHCP-May, and traffic information, Traffic-May. We now turn to
presenting some of the findings enabled by Brofiler.
1. In the Traffic-May dataset, nearly half of the BYOHs are mobile zombies,
which we define as BYOHs that hold IP addresses without transferring any data
through the campus network. Note that the data transferred while interacting
with the captive portal does not count; rather we mean no data is transferred
after the captive portal exchange.
2. We find that 23% of the BYOHs in Traffic-May are vagabonds, a term we use
to refer to BYOHs that appear only one day during that month. Vagabonds is a
sub-category of non-regular BYOHs, that we defined earlier.
3. We found that 3% of non-zero traffic BYOHs show low frequency of appearance
and high traffic (denoted as LH), which is an uncommon behavior. We investigated
this further and found the cause to be the use of video and streaming.
4. 26% of the mobile zombies appear frequently, each for more than 10 days in a
month. This group unnecessarily and repeatedly occupies IP addresses, and should
be managed accordingly.
5. We identify a group with high frequency of appearance during the month and
low traffic (denoted as HL in our H-M-L classification), which accounts for 4% of
non-zero traffic BYOHs.
5.2 Studying and Profiling BYOHs
We use Brofiler as a starting point towards a long-term study on real BYOH
traces. We show how Brofiler can help us profile and classify BYOHs, and reveal
78
performance and network management issues. The goal here is to highlight both the
usefulness of our approach, and interesting observations on BYOH behaviors. Even
for the rather expected behaviors, such as diurnal pattern and bimodal usage, this is
arguably the first study to quantify these behaviors for BYOHs in a systematic and
comprehensive way.
Summary of observations. We highlight our results grouped by the four
dimensions of our approach.
a. Protocol and Control Plane.
1. 68% of BYOHs misbehave, by not conforming to the DHCP protocol specifications.
2. 80.6% of the IP lease requests by BYOHs are non-conforming.
3. Most of the web data of BYOHs is not encrypted: less than 15% of web traffic
uses HTTPS.
b. Data Plane.
1. Of the BYOHs that produce traffic, 94% generate network traffic of less than
100MB (in a month). However, just 6% of BYOHs generate 82.1% of total BYOHs’
traffic.
2. Data generation is very bursty, with 70% of BYOHs generating half of their
monthly traffic in just one day. Surprisingly, 28.8% of BYOHs are active (sending
or receiving traffic) only one day during the month.
3. 42% of BYOHs talk to internal (campus) servers.
c. Temporal Behavior.
1. BYOHs’ patterns of appearance on the network follow weekly and daily patterns.
79
2. Intra-day behaviors of BYOHs are anthropocentric.
3. 55% of BYOHs are NRE devices while 45% of devices are REG devices.
4. Over 23% of the BYOHs are vagabonds that appear on only one day.
d. Multi-level profiling. The key results were listed in Section 5.1.3.
5.2.1 Protocol and Control Plane
There are many interesting aspects in this dimension. Here, we focus on the
DHCP operations of BYOHs and the use of encryption.
Non-conforming IP Lease Requests. We examine the DHCP operations
between BYOHs and DHCP servers. We find that 68% of BYOHs issue unnecessary IP
lease requests; this behavior is largely limited to BYOHs. We define a non-conforming
IP lease request as an IP lease request sent by a device which already has an IP address
from an earlier, unexpired lease. Note that this process begins with DHCPDISCOVER and
it is not the regular IP lease renewal process via DHCPREQUEST. In other words, clients
behave as if the IP acquisition process has failed, and they go back to the initial IP
discovery phase, as indicated by the DHCPDISCOVER message.
Roughly 80% of IP requests issued by BYOHs are non-conforming.
This erratic behavior significantly increases DHCP server workload and overloads the
networks’ DHCP service. In contrast, we find that non-BYOHs never issue such requests.
Recent anecdotal evidence suggests that software bugs (acknowledged by Google [3]) in
BYOHs are responsible for this misbehavior and argues that this erratic behavior is
not due to the events of disconnection, reconnection and roaming [1,3].This observation
suggests that network administrators should monitor and diagnose protocol operation
behaviors from BYOHs in order to detect malfunctioning devices.
80
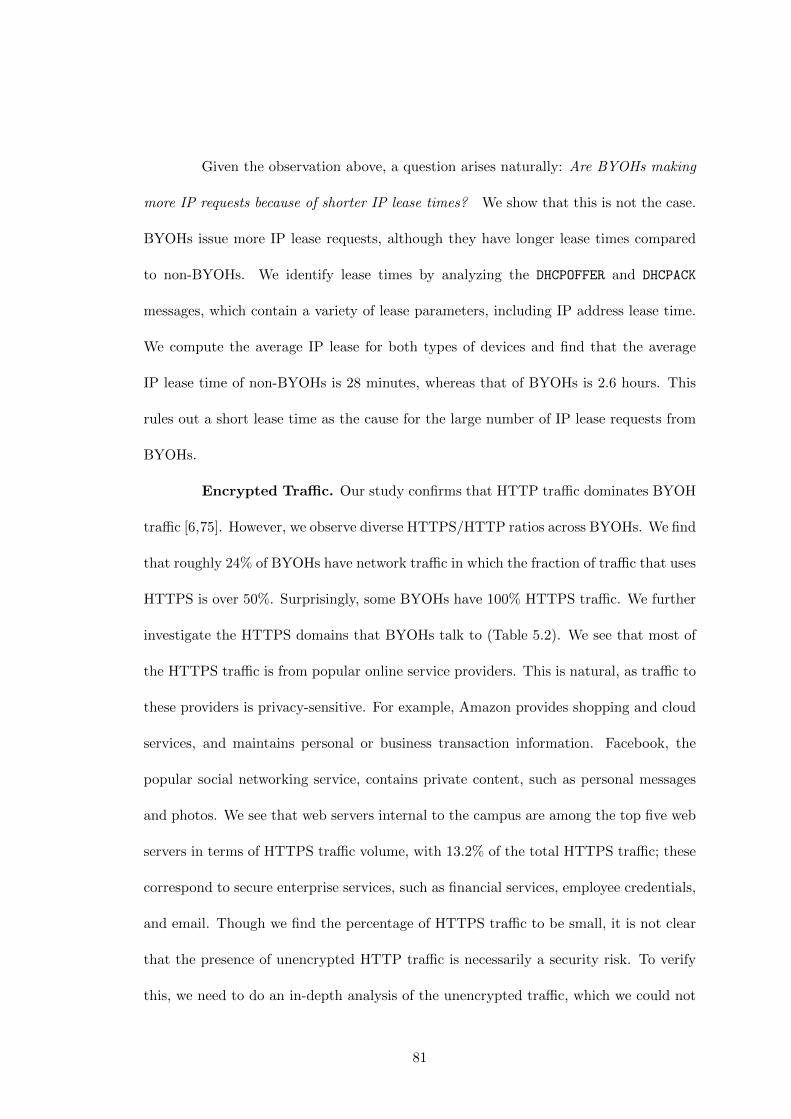
Given the observation above, a question arises naturally: Are BYOHs making
more IP requests because of shorter IP lease times? We show that this is not the case.
BYOHs issue more IP lease requests, although they have longer lease times compared
to non-BYOHs. We identify lease times by analyzing the DHCPOFFER and DHCPACK
messages, which contain a variety of lease parameters, including IP address lease time.
We compute the average IP lease for both types of devices and find that the average
IP lease time of non-BYOHs is 28 minutes, whereas that of BYOHs is 2.6 hours. This
rules out a short lease time as the cause for the large number of IP lease requests from
BYOHs.
Encrypted Traffic. Our study confirms that HTTP traffic dominates BYOH
traffic [6,75]. However, we observe diverse HTTPS/HTTP ratios across BYOHs. We find
that roughly 24% of BYOHs have network traffic in which the fraction of traffic that uses
HTTPS is over 50%. Surprisingly, some BYOHs have 100% HTTPS traffic. We further
investigate the HTTPS domains that BYOHs talk to (Table 5.2). We see that most of
the HTTPS traffic is from popular online service providers. This is natural, as traffic to
these providers is privacy-sensitive. For example, Amazon provides shopping and cloud
services, and maintains personal or business transaction information. Facebook, the
popular social networking service, contains private content, such as personal messages
and photos. We see that web servers internal to the campus are among the top five web
servers in terms of HTTPS traffic volume, with 13.2% of the total HTTPS traffic; these
correspond to secure enterprise services, such as financial services, employee credentials,
and email. Though we find the percentage of HTTPS traffic to be small, it is not clear
that the presence of unencrypted HTTP traffic is necessarily a security risk. To verify
this, we need to do an in-depth analysis of the unencrypted traffic, which we could not
81
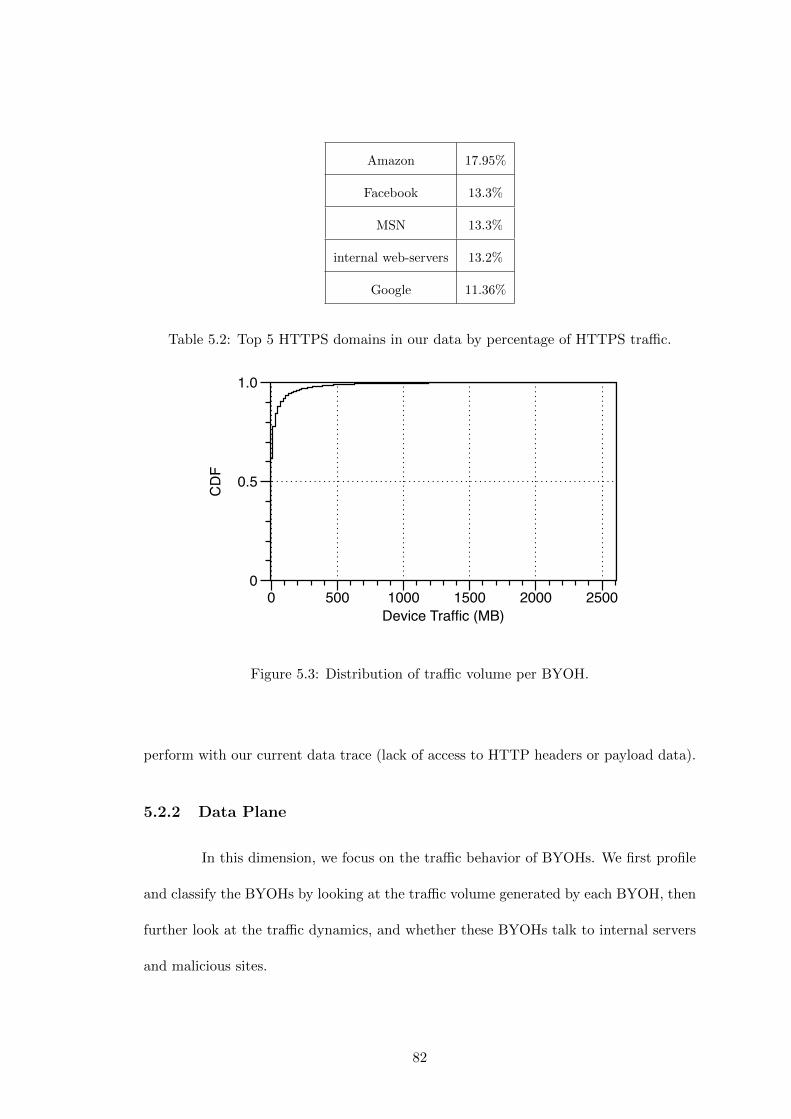
Amazon 17.95%
Facebook 13.3%
MSN 13.3%
internal web-servers 13.2%
Google 11.36%
Table 5.2: Top 5 HTTPS domains in our data by percentage of HTTPS traffic.
CD
F
0
0.5
1.0
Device Traffic (MB)0 500 1000 1500 2000 2500
Figure 5.3: Distribution of traffic volume per BYOH.
perform with our current data trace (lack of access to HTTP headers or payload data).
5.2.2 Data Plane
In this dimension, we focus on the traffic behavior of BYOHs. We first profile
and classify the BYOHs by looking at the traffic volume generated by each BYOH, then
further look at the traffic dynamics, and whether these BYOHs talk to internal servers
and malicious sites.
82
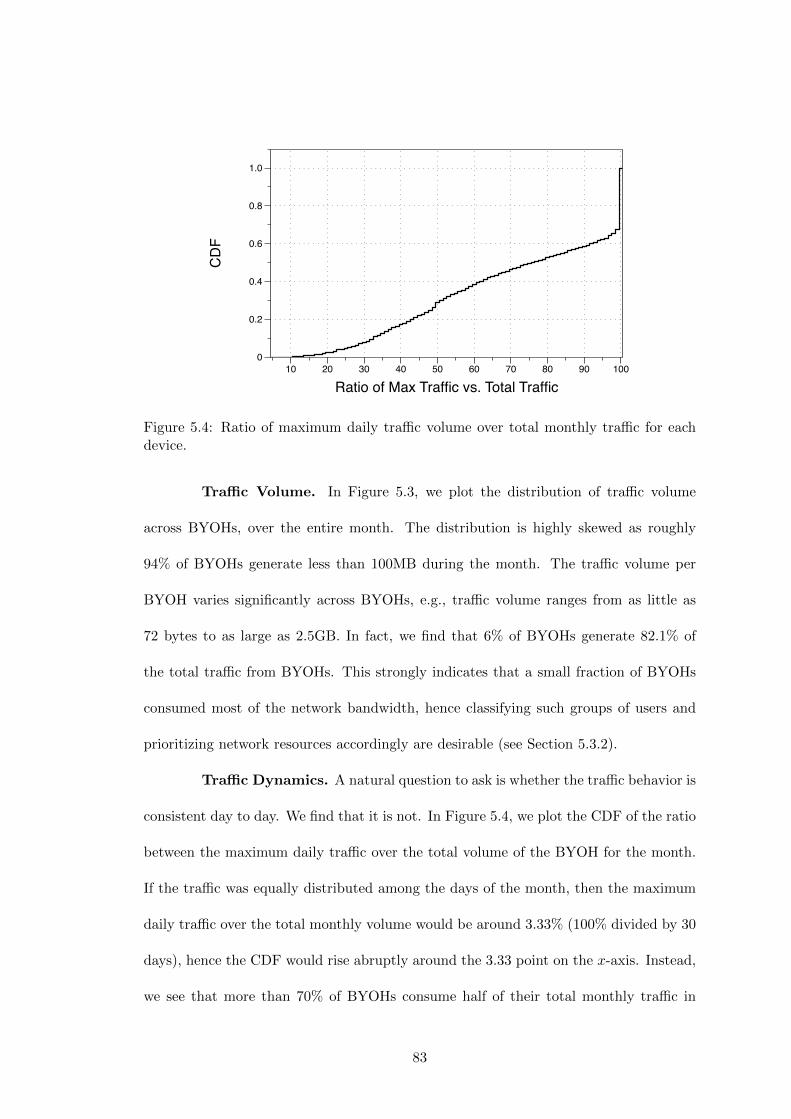
CD
F
0
0.2
0.4
0.6
0.8
1.0
Ratio of Max Traffic vs. Total Traffic10 20 30 40 50 60 70 80 90 100
Figure 5.4: Ratio of maximum daily traffic volume over total monthly traffic for eachdevice.
Traffic Volume. In Figure 5.3, we plot the distribution of traffic volume
across BYOHs, over the entire month. The distribution is highly skewed as roughly
94% of BYOHs generate less than 100MB during the month. The traffic volume per
BYOH varies significantly across BYOHs, e.g., traffic volume ranges from as little as
72 bytes to as large as 2.5GB. In fact, we find that 6% of BYOHs generate 82.1% of
the total traffic from BYOHs. This strongly indicates that a small fraction of BYOHs
consumed most of the network bandwidth, hence classifying such groups of users and
prioritizing network resources accordingly are desirable (see Section 5.3.2).
Traffic Dynamics. A natural question to ask is whether the traffic behavior is
consistent day to day. We find that it is not. In Figure 5.4, we plot the CDF of the ratio
between the maximum daily traffic over the total volume of the BYOH for the month.
If the traffic was equally distributed among the days of the month, then the maximum
daily traffic over the total monthly volume would be around 3.33% (100% divided by 30
days), hence the CDF would rise abruptly around the 3.33 point on the x-axis. Instead,
we see that more than 70% of BYOHs consume half of their total monthly traffic in
83
a single day (x = 50, y = 0.3). Surprisingly, 28.8% of BYOHs are active (sending or
receiving traffic) only one day in the entire month. The above observations are helpful
guidelines for managing and provisioning the network. At a high level, the observations
suggest that traffic volumes: (a) vary across devices significantly, and (b) are very bursty
in time. An effective management policy will need to consider these factors. In fact, we
will see how they can help devise policies in Section 5.3.2.
Talking to internal servers and malicious sites. We found that 42%
of BYOHs talk to internal servers (i.e., servers within the campus network) and 58%
talk only to outside servers. We also examine the traffic sources to see if any BYOHs
are connecting to blacklisted websites and IPs—we found no such devices. Overall,
understanding the typical behavior of users could provide profiles and patterns that
could help identify outliers and surprising behaviors.
5.2.3 Temporal Behavior
We now study the temporal behavior of BYOHs.
Weekly and Daily Patterns. Our study indicates that BYOHs’ patterns
of appearance on the network follow weekly and daily patterns. Our daily observations
along the entire month indicate that the number of BYOHs exhibits weekly periodicity:
the number of devices increases on Monday, reaches its peak point on Tuesday and
Thursday, and then decreases from Friday to Sunday. By considering these weekly and
daily patterns, network operators have an opportunity to provision and use network
resources more efficiently.
Intra-Day Behavior. To manage traffic on a per-hour basis, we need to
understand the intra-day behavior of BYOHs. In Figure 5.5, we plot the number of
84
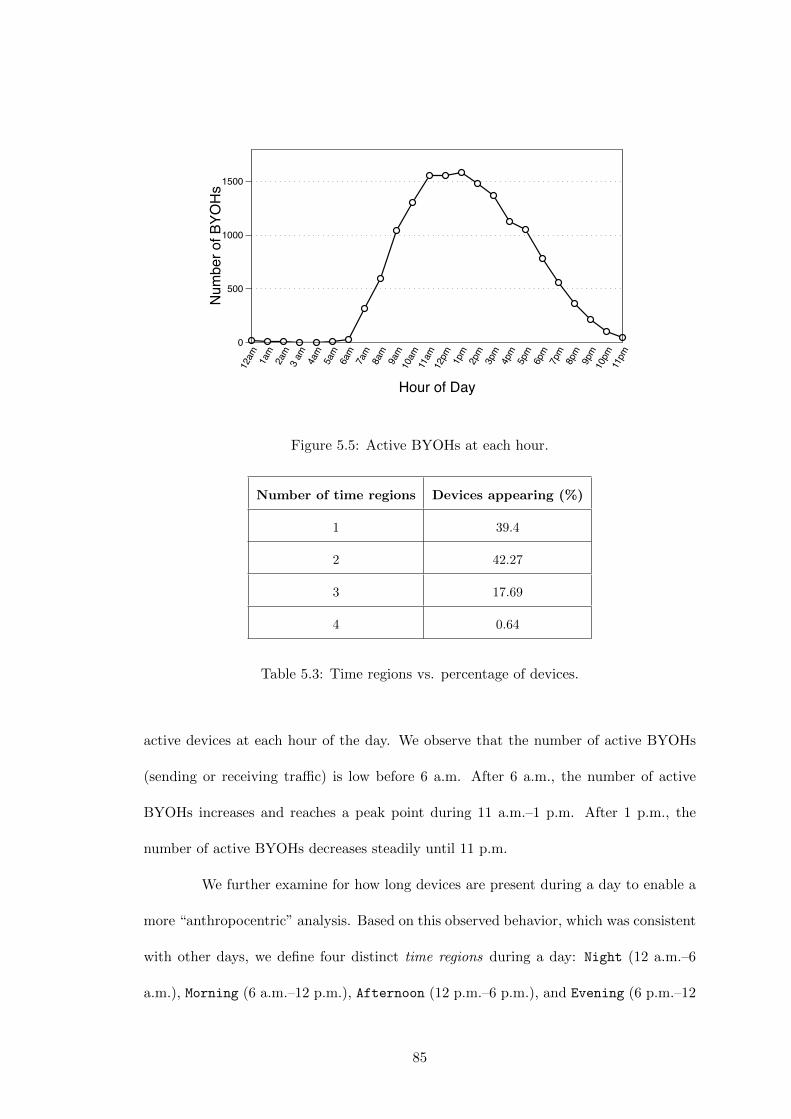
Num
ber o
f BYO
Hs
0
500
1000
1500
Hour of Day
12am 1am
2am
3 am 4am
5am
6am
7am
8am
9am
10am
11am
12pm 1pm
2pm
3pm
4pm
5pm
6pm
7pm
8pm
9pm
10pm
11pm
Figure 5.5: Active BYOHs at each hour.
Number of time regions Devices appearing (%)
1 39.4
2 42.27
3 17.69
4 0.64
Table 5.3: Time regions vs. percentage of devices.
active devices at each hour of the day. We observe that the number of active BYOHs
(sending or receiving traffic) is low before 6 a.m. After 6 a.m., the number of active
BYOHs increases and reaches a peak point during 11 a.m.–1 p.m. After 1 p.m., the
number of active BYOHs decreases steadily until 11 p.m.
We further examine for how long devices are present during a day to enable a
more “anthropocentric” analysis. Based on this observed behavior, which was consistent
with other days, we define four distinct time regions during a day: Night (12 a.m.–6
a.m.), Morning (6 a.m.–12 p.m.), Afternoon (12 p.m.–6 p.m.), and Evening (6 p.m.–12
85
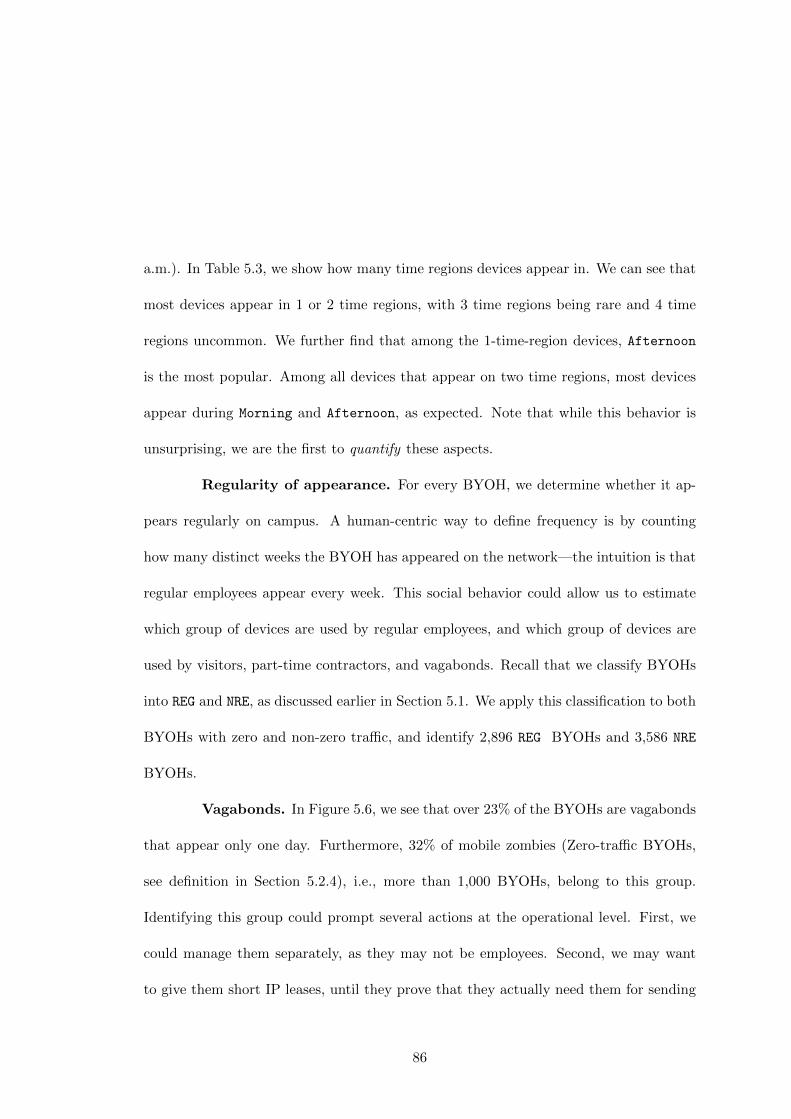
a.m.). In Table 5.3, we show how many time regions devices appear in. We can see that
most devices appear in 1 or 2 time regions, with 3 time regions being rare and 4 time
regions uncommon. We further find that among the 1-time-region devices, Afternoon
is the most popular. Among all devices that appear on two time regions, most devices
appear during Morning and Afternoon, as expected. Note that while this behavior is
unsurprising, we are the first to quantify these aspects.
Regularity of appearance. For every BYOH, we determine whether it ap-
pears regularly on campus. A human-centric way to define frequency is by counting
how many distinct weeks the BYOH has appeared on the network—the intuition is that
regular employees appear every week. This social behavior could allow us to estimate
which group of devices are used by regular employees, and which group of devices are
used by visitors, part-time contractors, and vagabonds. Recall that we classify BYOHs
into REG and NRE, as discussed earlier in Section 5.1. We apply this classification to both
BYOHs with zero and non-zero traffic, and identify 2,896 REG BYOHs and 3,586 NRE
BYOHs.
Vagabonds. In Figure 5.6, we see that over 23% of the BYOHs are vagabonds
that appear only one day. Furthermore, 32% of mobile zombies (Zero-traffic BYOHs,
see definition in Section 5.2.4), i.e., more than 1,000 BYOHs, belong to this group.
Identifying this group could prompt several actions at the operational level. First, we
could manage them separately, as they may not be employees. Second, we may want
to give them short IP leases, until they prove that they actually need them for sending
86
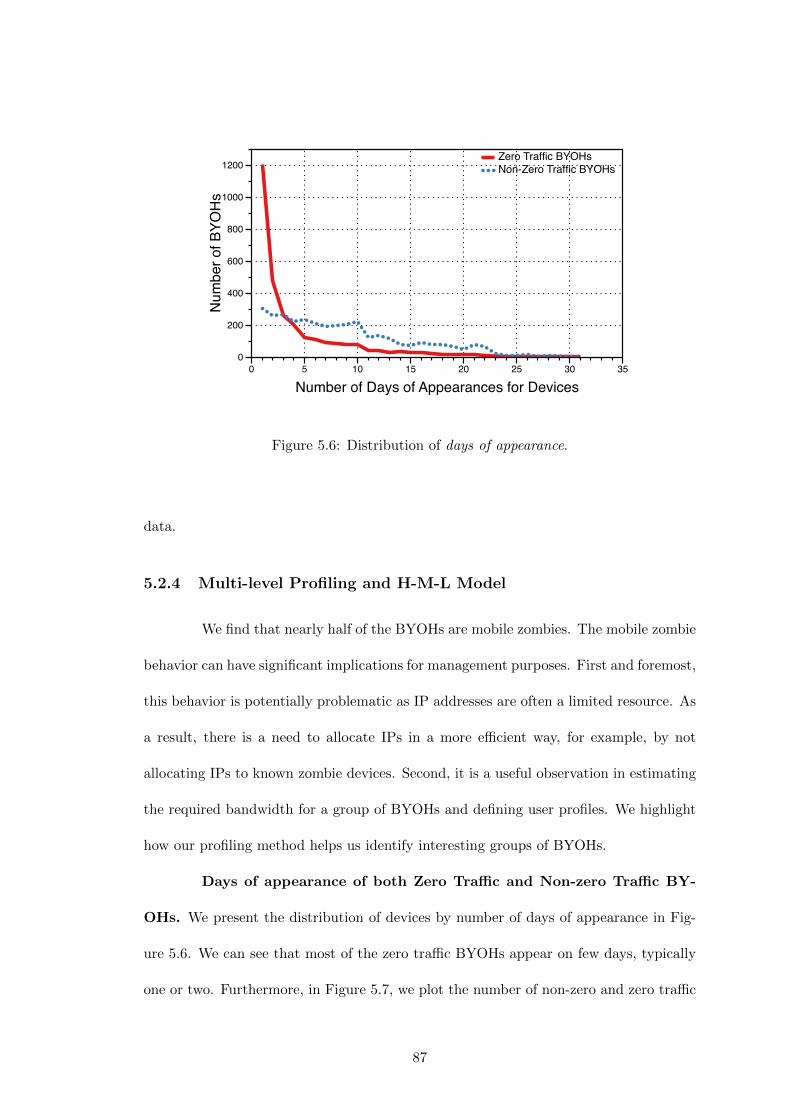
Zero Traffic BYOHsNon-Zero Traffic BYOHs
Num
ber o
f BYO
Hs
0
200
400
600
800
1000
1200
Number of Days of Appearances for Devices0 5 10 15 20 25 30 35
Figure 5.6: Distribution of days of appearance.
data.
5.2.4 Multi-level Profiling and H-M-L Model
We find that nearly half of the BYOHs are mobile zombies. The mobile zombie
behavior can have significant implications for management purposes. First and foremost,
this behavior is potentially problematic as IP addresses are often a limited resource. As
a result, there is a need to allocate IPs in a more efficient way, for example, by not
allocating IPs to known zombie devices. Second, it is a useful observation in estimating
the required bandwidth for a group of BYOHs and defining user profiles. We highlight
how our profiling method helps us identify interesting groups of BYOHs.
Days of appearance of both Zero Traffic and Non-zero Traffic BY-
OHs. We present the distribution of devices by number of days of appearance in Fig-
ure 5.6. We can see that most of the zero traffic BYOHs appear on few days, typically
one or two. Furthermore, in Figure 5.7, we plot the number of non-zero and zero traffic
87
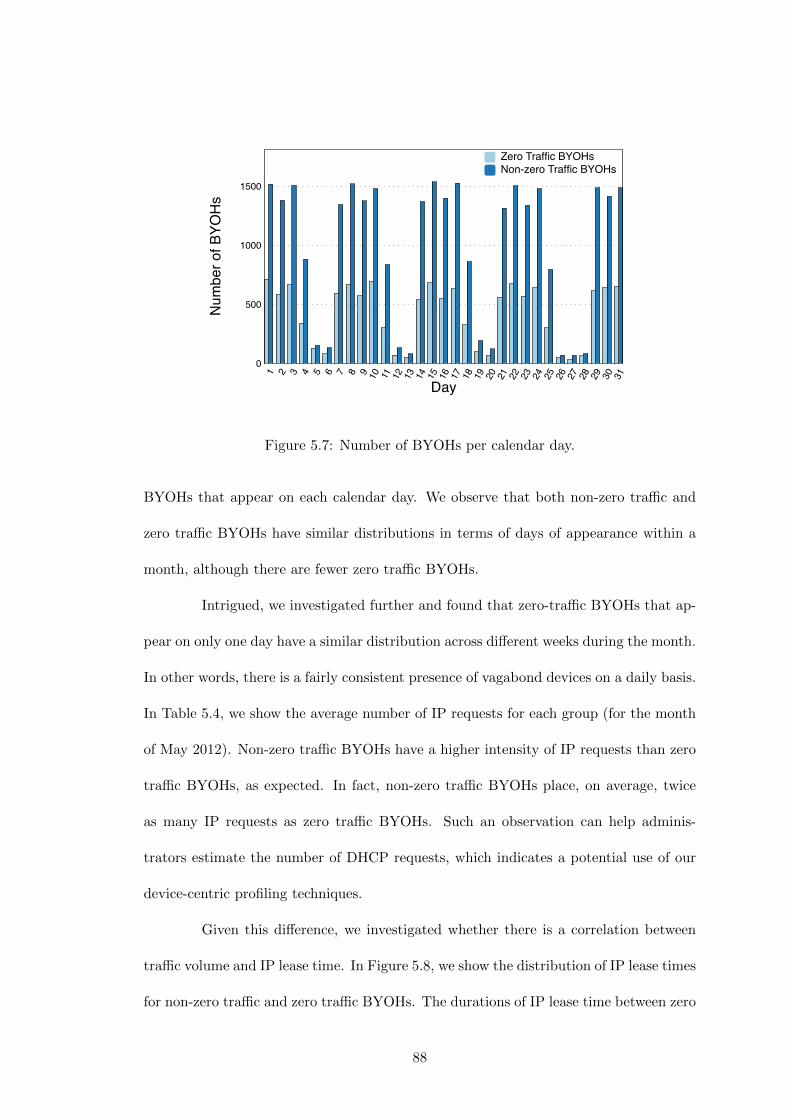
Zero Traffic BYOHsNon-zero Traffic BYOHs
Num
ber o
f BYO
Hs
0
500
1000
1500
Day
1 2 3 4 5 6 7 8 9 10 11 12 13 14 15 16 17 18 19 20 21 22 23 24 25 26 27 28 29 30 31
Figure 5.7: Number of BYOHs per calendar day.
BYOHs that appear on each calendar day. We observe that both non-zero traffic and
zero traffic BYOHs have similar distributions in terms of days of appearance within a
month, although there are fewer zero traffic BYOHs.
Intrigued, we investigated further and found that zero-traffic BYOHs that ap-
pear on only one day have a similar distribution across different weeks during the month.
In other words, there is a fairly consistent presence of vagabond devices on a daily basis.
In Table 5.4, we show the average number of IP requests for each group (for the month
of May 2012). Non-zero traffic BYOHs have a higher intensity of IP requests than zero
traffic BYOHs, as expected. In fact, non-zero traffic BYOHs place, on average, twice
as many IP requests as zero traffic BYOHs. Such an observation can help adminis-
trators estimate the number of DHCP requests, which indicates a potential use of our
device-centric profiling techniques.
Given this difference, we investigated whether there is a correlation between
traffic volume and IP lease time. In Figure 5.8, we show the distribution of IP lease times
for non-zero traffic and zero traffic BYOHs. The durations of IP lease time between zero
88
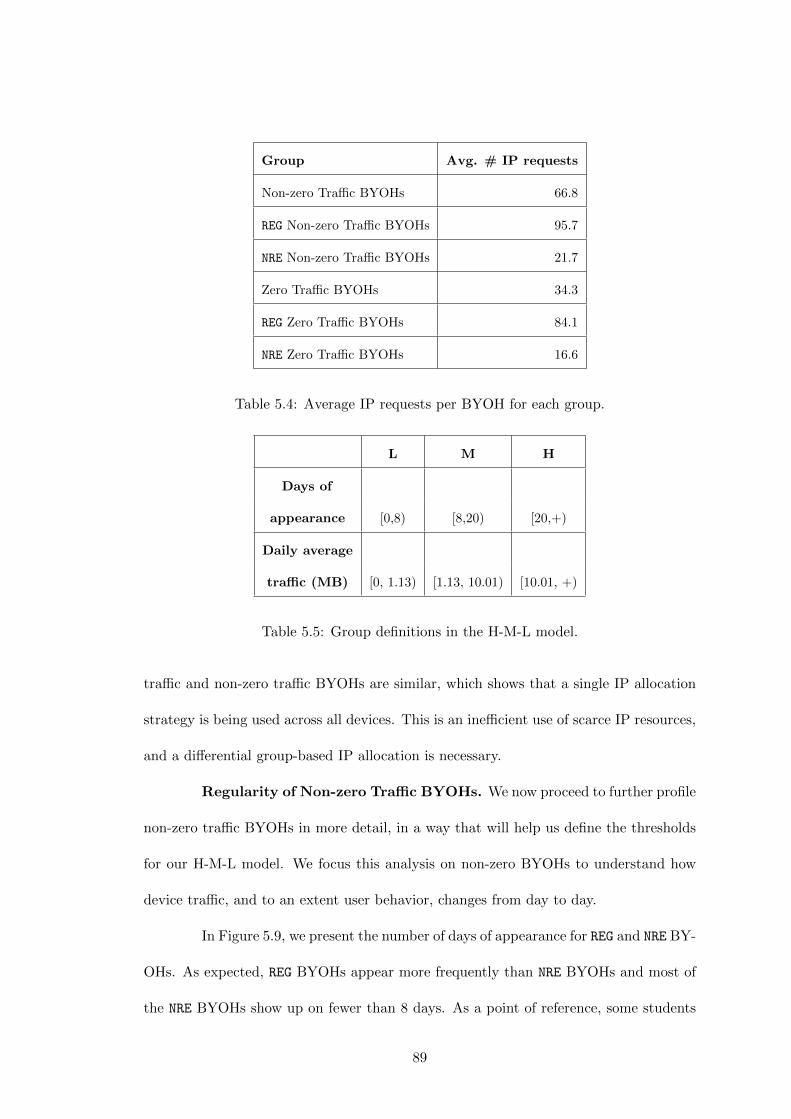
Group Avg. # IP requests
Non-zero Traffic BYOHs 66.8
REG Non-zero Traffic BYOHs 95.7
NRE Non-zero Traffic BYOHs 21.7
Zero Traffic BYOHs 34.3
REG Zero Traffic BYOHs 84.1
NRE Zero Traffic BYOHs 16.6
Table 5.4: Average IP requests per BYOH for each group.
L M H
Days of
appearance [0,8) [8,20) [20,+)
Daily average
traffic (MB) [0, 1.13) [1.13, 10.01) [10.01, +)
Table 5.5: Group definitions in the H-M-L model.
traffic and non-zero traffic BYOHs are similar, which shows that a single IP allocation
strategy is being used across all devices. This is an inefficient use of scarce IP resources,
and a differential group-based IP allocation is necessary.
Regularity of Non-zero Traffic BYOHs. We now proceed to further profile
non-zero traffic BYOHs in more detail, in a way that will help us define the thresholds
for our H-M-L model. We focus this analysis on non-zero BYOHs to understand how
device traffic, and to an extent user behavior, changes from day to day.
In Figure 5.9, we present the number of days of appearance for REG and NRE BY-
OHs. As expected, REG BYOHs appear more frequently than NRE BYOHs and most of
the NRE BYOHs show up on fewer than 8 days. As a point of reference, some students
89
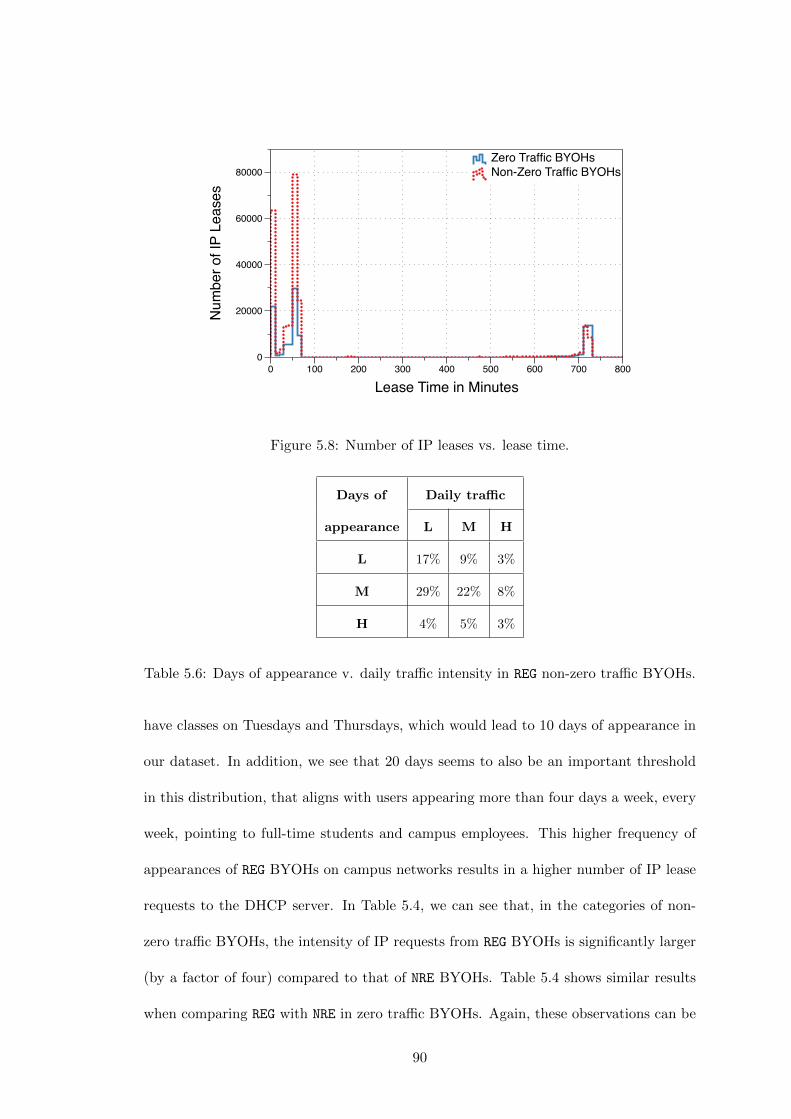
Zero Traffic BYOHsNon-Zero Traffic BYOHs
Num
ber o
f IP
Leas
es
0
20000
40000
60000
80000
Lease Time in Minutes0 100 200 300 400 500 600 700 800
Figure 5.8: Number of IP leases vs. lease time.
Days of Daily traffic
appearance L M H
L 17% 9% 3%
M 29% 22% 8%
H 4% 5% 3%
Table 5.6: Days of appearance v. daily traffic intensity in REG non-zero traffic BYOHs.
have classes on Tuesdays and Thursdays, which would lead to 10 days of appearance in
our dataset. In addition, we see that 20 days seems to also be an important threshold
in this distribution, that aligns with users appearing more than four days a week, every
week, pointing to full-time students and campus employees. This higher frequency of
appearances of REG BYOHs on campus networks results in a higher number of IP lease
requests to the DHCP server. In Table 5.4, we can see that, in the categories of non-
zero traffic BYOHs, the intensity of IP requests from REG BYOHs is significantly larger
(by a factor of four) compared to that of NRE BYOHs. Table 5.4 shows similar results
when comparing REG with NRE in zero traffic BYOHs. Again, these observations can be
90
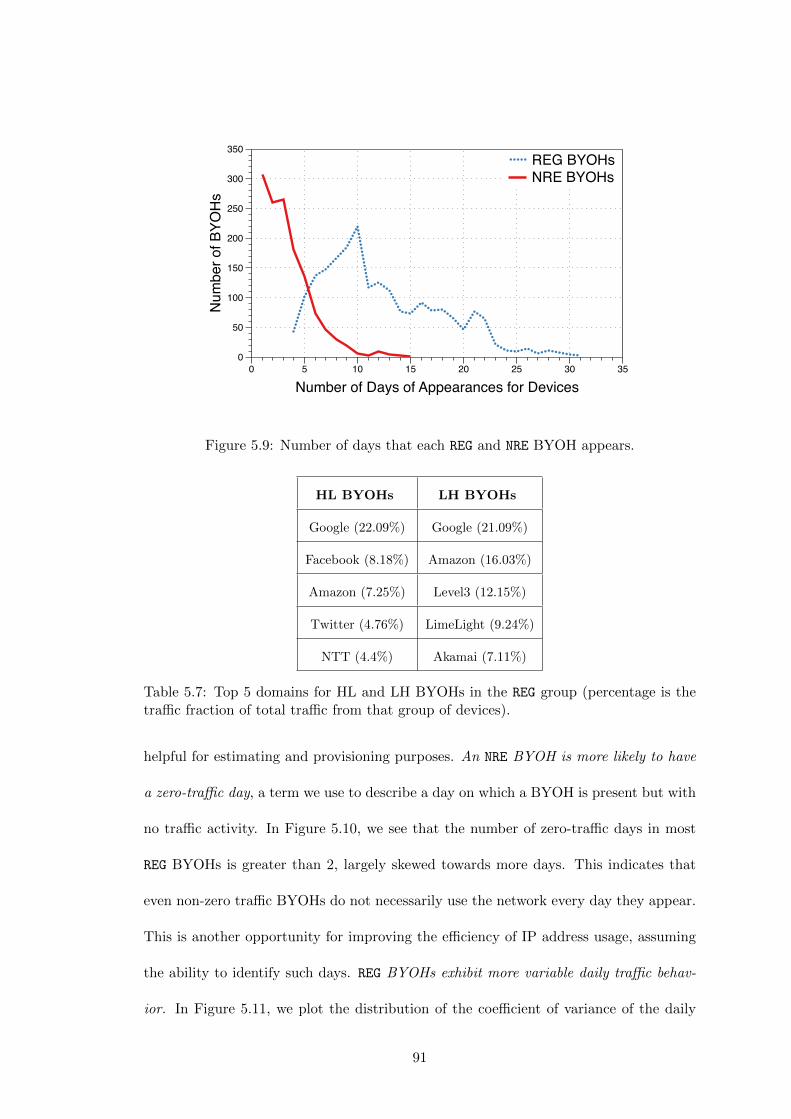
REG BYOHsNRE BYOHs
Num
ber o
f BYO
Hs
0
50
100
150
200
250
300
350
Number of Days of Appearances for Devices0 5 10 15 20 25 30 35
Figure 5.9: Number of days that each REG and NRE BYOH appears.
HL BYOHs LH BYOHs
Google (22.09%) Google (21.09%)
Facebook (8.18%) Amazon (16.03%)
Amazon (7.25%) Level3 (12.15%)
Twitter (4.76%) LimeLight (9.24%)
NTT (4.4%) Akamai (7.11%)
Table 5.7: Top 5 domains for HL and LH BYOHs in the REG group (percentage is thetraffic fraction of total traffic from that group of devices).
helpful for estimating and provisioning purposes. An NRE BYOH is more likely to have
a zero-traffic day, a term we use to describe a day on which a BYOH is present but with
no traffic activity. In Figure 5.10, we see that the number of zero-traffic days in most
REG BYOHs is greater than 2, largely skewed towards more days. This indicates that
even non-zero traffic BYOHs do not necessarily use the network every day they appear.
This is another opportunity for improving the efficiency of IP address usage, assuming
the ability to identify such days. REG BYOHs exhibit more variable daily traffic behav-
ior. In Figure 5.11, we plot the distribution of the coefficient of variance of the daily
91
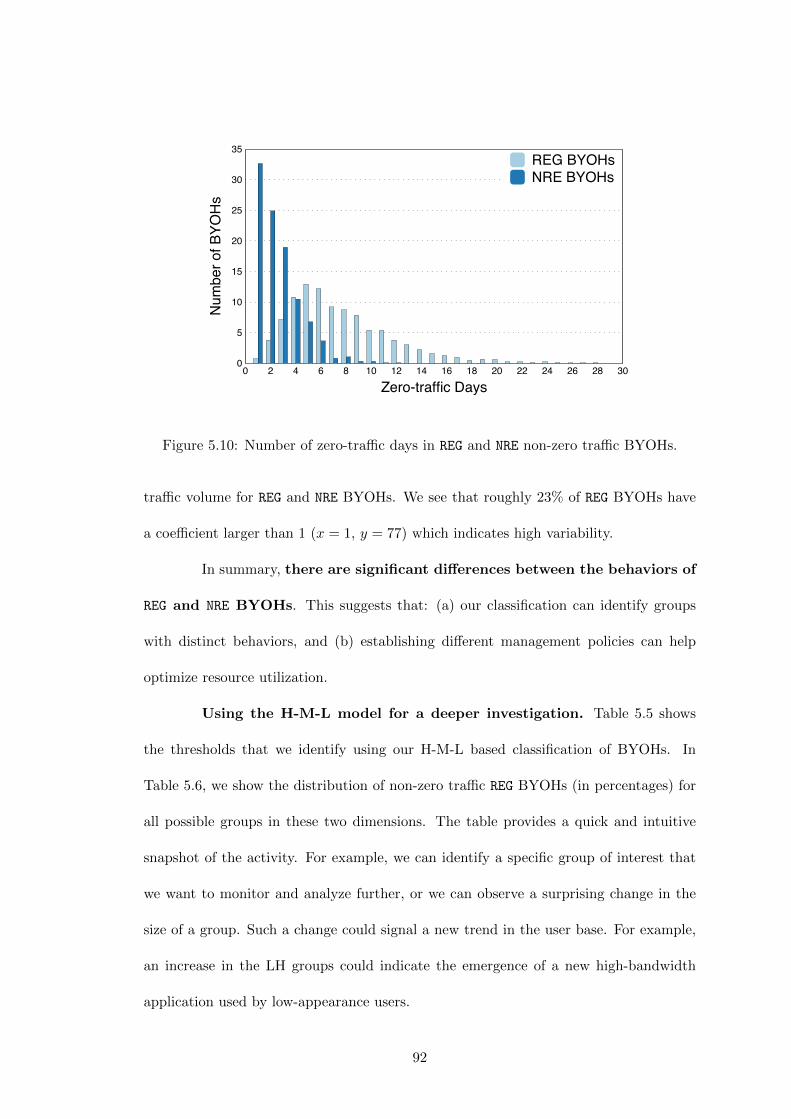
REG BYOHsNRE BYOHs
Num
ber o
f BYO
Hs
0
5
10
15
20
25
30
35
Zero-traffic Days0 2 4 6 8 10 12 14 16 18 20 22 24 26 28 30
Figure 5.10: Number of zero-traffic days in REG and NRE non-zero traffic BYOHs.
traffic volume for REG and NRE BYOHs. We see that roughly 23% of REG BYOHs have
a coefficient larger than 1 (x = 1, y = 77) which indicates high variability.
In summary, there are significant differences between the behaviors of
REG and NRE BYOHs. This suggests that: (a) our classification can identify groups
with distinct behaviors, and (b) establishing different management policies can help
optimize resource utilization.
Using the H-M-L model for a deeper investigation. Table 5.5 shows
the thresholds that we identify using our H-M-L based classification of BYOHs. In
Table 5.6, we show the distribution of non-zero traffic REG BYOHs (in percentages) for
all possible groups in these two dimensions. The table provides a quick and intuitive
snapshot of the activity. For example, we can identify a specific group of interest that
we want to monitor and analyze further, or we can observe a surprising change in the
size of a group. Such a change could signal a new trend in the user base. For example,
an increase in the LH groups could indicate the emergence of a new high-bandwidth
application used by low-appearance users.
92
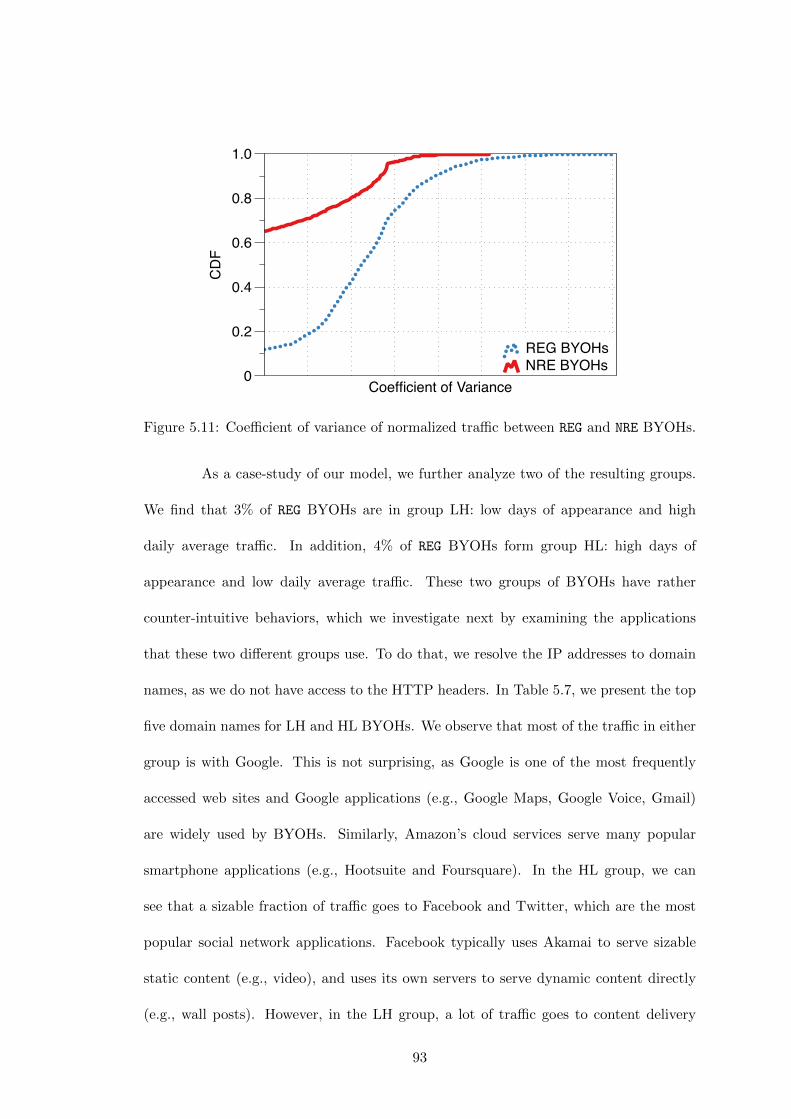
REG BYOHsNRE BYOHs
CD
F
0
0.2
0.4
0.6
0.8
1.0
Coefficient of Variance
Figure 5.11: Coefficient of variance of normalized traffic between REG and NRE BYOHs.
As a case-study of our model, we further analyze two of the resulting groups.
We find that 3% of REG BYOHs are in group LH: low days of appearance and high
daily average traffic. In addition, 4% of REG BYOHs form group HL: high days of
appearance and low daily average traffic. These two groups of BYOHs have rather
counter-intuitive behaviors, which we investigate next by examining the applications
that these two different groups use. To do that, we resolve the IP addresses to domain
names, as we do not have access to the HTTP headers. In Table 5.7, we present the top
five domain names for LH and HL BYOHs. We observe that most of the traffic in either
group is with Google. This is not surprising, as Google is one of the most frequently
accessed web sites and Google applications (e.g., Google Maps, Google Voice, Gmail)
are widely used by BYOHs. Similarly, Amazon’s cloud services serve many popular
smartphone applications (e.g., Hootsuite and Foursquare). In the HL group, we can
see that a sizable fraction of traffic goes to Facebook and Twitter, which are the most
popular social network applications. Facebook typically uses Akamai to serve sizable
static content (e.g., video), and uses its own servers to serve dynamic content directly
(e.g., wall posts). However, in the LH group, a lot of traffic goes to content delivery
93
networks (CDNs), such as Limelight and Akamai, that deliver large volume traffic (e.g.,
video). These domain differences between LH and HL groups could explain why LH
devices generate a lot of traffic, while HL devices do not. At the same time, it also
provides an indication of the interests of end-users in that group.
5.3 Operational Issues and Solutions
So far, we have applied the Brofiler framework to profile BYOHs along
multiple dimensions and to identify groups with common behaviors. Here, we close the
loop by showing how Brofiler enables administrators to employ intuitive and effective
policies to manage their network. We revisit the implications that our observations have,
and propose solutions to some of the operational issues that we have identified focusing
on the efficient use of resources.
A major advantage of our approach is that it is easy to deploy without requir-
ing any software installation on the device, or device registration. It can be deployed
by a network administrator, and it will learn BYOH behavior on-the-fly, and label and
manage devices according to a desired policy, as we explain below. However, the ad-
ministrator has the ability to label specific devices (e.g. the tablet of the president) and
treat them differently.
Note that we do not claim that our approaches are the best (or the only) ap-
proaches. Rather, we showcase the benefit of having a deep and intuitive understanding
of the BYOH traffic, which our approach provides.
94
5.3.1 Efficient DHCP Address Allocation
In the previous sections, we found that the operation of DHCP in our network
is far from ideal: (a) BYOHs issue a large number of non-conforming IP lease requests,
(b) nearly half of BYOHs acquire IP addresses, but do not send any traffic over campus
network, and (c) many “vagabond” BYOHs appear in the campus network. To address
these issues, we propose a strategy, based on three design principles, for tailoring IP
lease allocations to BYOHs. We then evaluate the effect of our proposed strategy and
show that it can substantially improve lease request behavior.
Principle #1: Device-centric priviledges: The on-the-fly learning of our approach
could lead to the creation of device profiles, which can be stored and then used to provide
different privileges and permissions to each device.
One reasonable implementation of device-centric management could be as fol-
lows: (a) all never-before seen devices are given IP addresses, (b) verified zombie devices
may be entered in a blacklist that will preclude them from procuring an IP address, un-
less the user makes an explicit request to be removed from that list, (c) there could be
a priviledged-list of devices that receive preferential treatment, with respect to DHCP
but also bandwidth as we will see later, and (d) periodically, we could flush old entries
in the database and the lists. This way, we allow visitors to use the network as guests,
but we eliminate inefficiencies for devices that do not use the network anyway, and allow
administrators to hard-code policies for particular devices.
Principle #2: Compliance validation: To cope with non-conforming IP lease re-
quests, we mandate that the DHCP server ignore non-conforming IP lease requests by
maintaining a BYOH’s current state of IP lease allocation. If a BYOH currently holds
one active IP lease, the DHCP server will ignore any subsequent non-conforming or
95
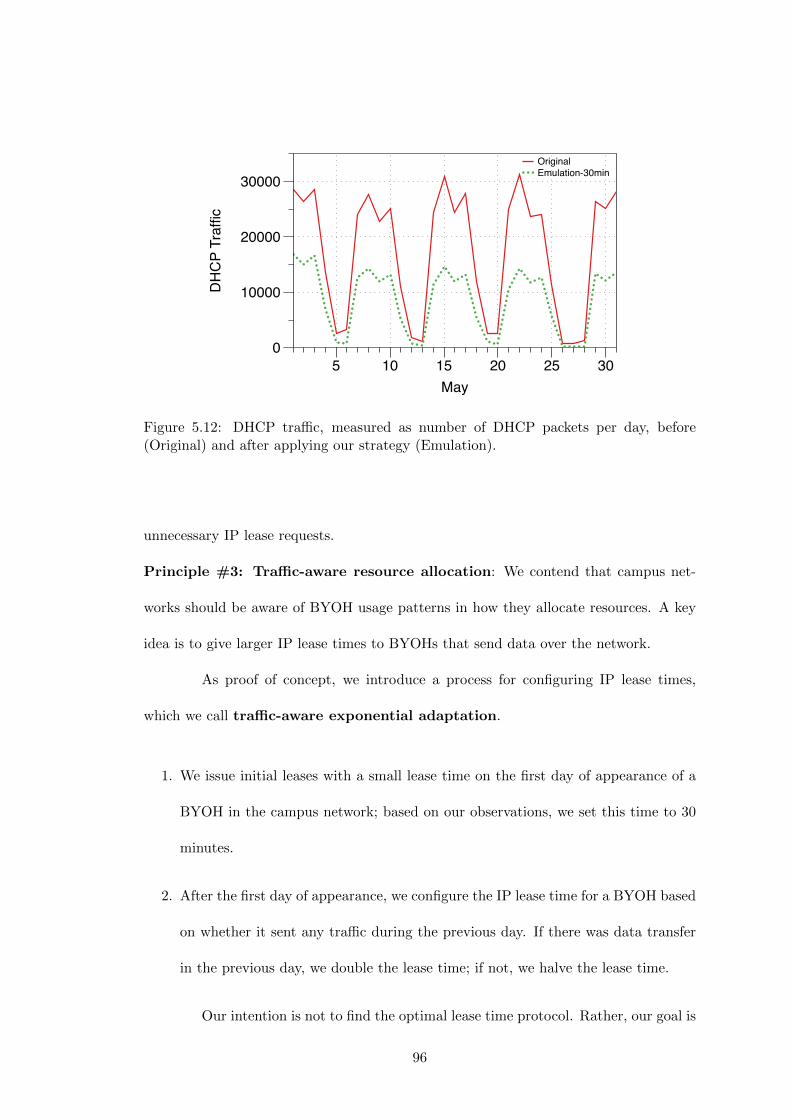
OriginalEmulation-30min
DH
CP
Traf
fic
0
10000
20000
30000
May5 10 15 20 25 30
Figure 5.12: DHCP traffic, measured as number of DHCP packets per day, before(Original) and after applying our strategy (Emulation).
unnecessary IP lease requests.
Principle #3: Traffic-aware resource allocation: We contend that campus net-
works should be aware of BYOH usage patterns in how they allocate resources. A key
idea is to give larger IP lease times to BYOHs that send data over the network.
As proof of concept, we introduce a process for configuring IP lease times,
which we call traffic-aware exponential adaptation.
1. We issue initial leases with a small lease time on the first day of appearance of a
BYOH in the campus network; based on our observations, we set this time to 30
minutes.
2. After the first day of appearance, we configure the IP lease time for a BYOH based
on whether it sent any traffic during the previous day. If there was data transfer
in the previous day, we double the lease time; if not, we halve the lease time.
Our intention is not to find the optimal lease time protocol. Rather, our goal is
96
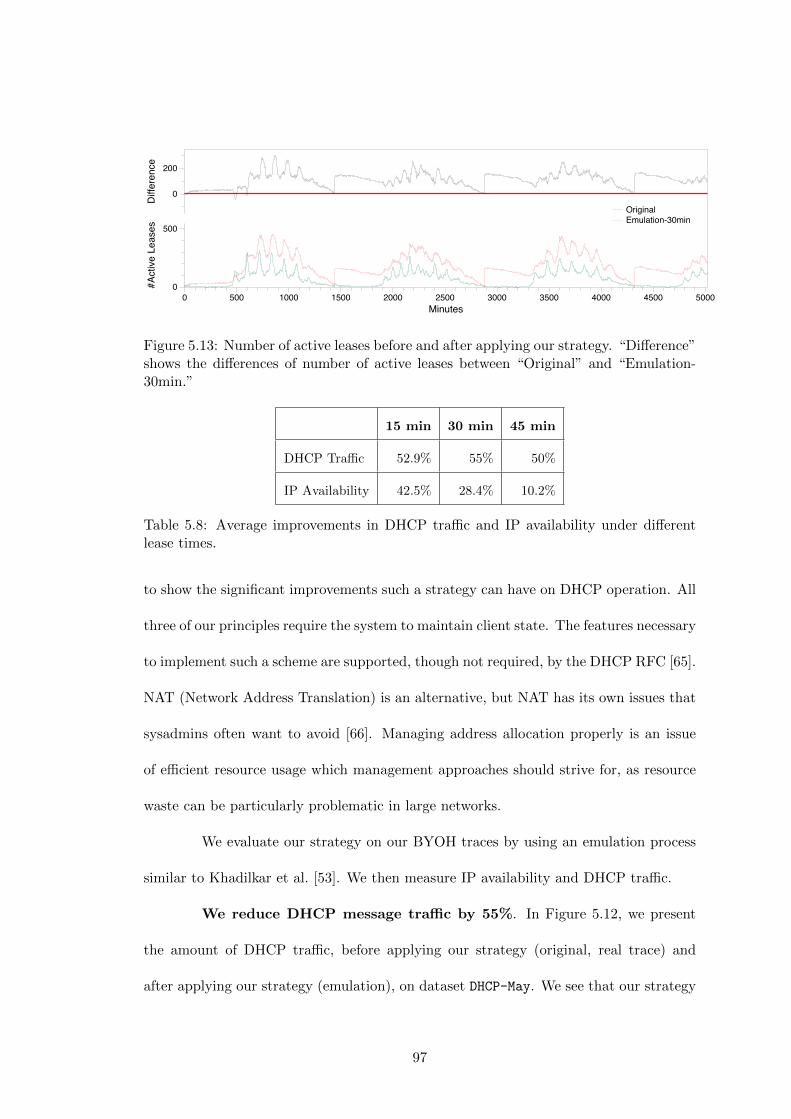
OriginalEmulation-30min
#Act
ive
Leas
es
0
500
Diff
eren
ce
0
200
Minutes0 500 1000 1500 2000 2500 3000 3500 4000 4500 5000
Figure 5.13: Number of active leases before and after applying our strategy. “Difference”shows the differences of number of active leases between “Original” and “Emulation-30min.”
15 min 30 min 45 min
DHCP Traffic 52.9% 55% 50%
IP Availability 42.5% 28.4% 10.2%
Table 5.8: Average improvements in DHCP traffic and IP availability under differentlease times.
to show the significant improvements such a strategy can have on DHCP operation. All
three of our principles require the system to maintain client state. The features necessary
to implement such a scheme are supported, though not required, by the DHCP RFC [65].
NAT (Network Address Translation) is an alternative, but NAT has its own issues that
sysadmins often want to avoid [66]. Managing address allocation properly is an issue
of efficient resource usage which management approaches should strive for, as resource
waste can be particularly problematic in large networks.
We evaluate our strategy on our BYOH traces by using an emulation process
similar to Khadilkar et al. [53]. We then measure IP availability and DHCP traffic.
We reduce DHCP message traffic by 55%. In Figure 5.12, we present
the amount of DHCP traffic, before applying our strategy (original, real trace) and
after applying our strategy (emulation), on dataset DHCP-May. We see that our strategy
97
reduces DHCP traffic from BYOHs on all days; the reduction is more marked on working
days. On average, our strategy reduces BYOHs’ DHCP traffic by 55%.
We increase IP availability by 28.4%. In Figure 5.13 we show the number
of active leases without (original) and with (emulation) using our strategy. We see that
the number of active leases decreases, hence our strategy improves IP availability on
most days. Overall, we improve the IP availability by an average of 28.4%.
Note that we set the initial lease time as 30 minutes in our emulation and a
different lease time setting may result in different performance improvements (Table 5.8).
For example, a 15-minute lease time could result in reducing DHCP overhead by an
average of 53% and increasing IP availability by 42.5%.
5.3.2 Enforcing Data Usage Quotas
The large number of BYOHs and the rapid growth in data demands can po-
tentially complicate the task of managing the campus network and fill up the available
capacity. We found that in our case, this increase is driven by a small fraction of BYOHs:
6% of BYOHs generate 82.1% of total BYOHs’ traffic, as noted in Section 5.2.2. The
lopsided data usage patterns of these “heavy users” could affect other users. Therefore,
we set out to explore the effectiveness of enforcing limits on the data usage per device.
Introducing data quotas per user. In a manner similar to data plan limits
imposed by commercial wireless cellular carriers or ISPs, we propose and analyze the
effects of imposing a maximum volume of data that each BYOH consumes per month
and per day. We propose quotas at two time granularities: (a) monthly quota, in
which we vary the data limits from 100MB to 500MB per-month, and (b) daily quota,
which we vary from 10MB to 300 MB per-day.
98
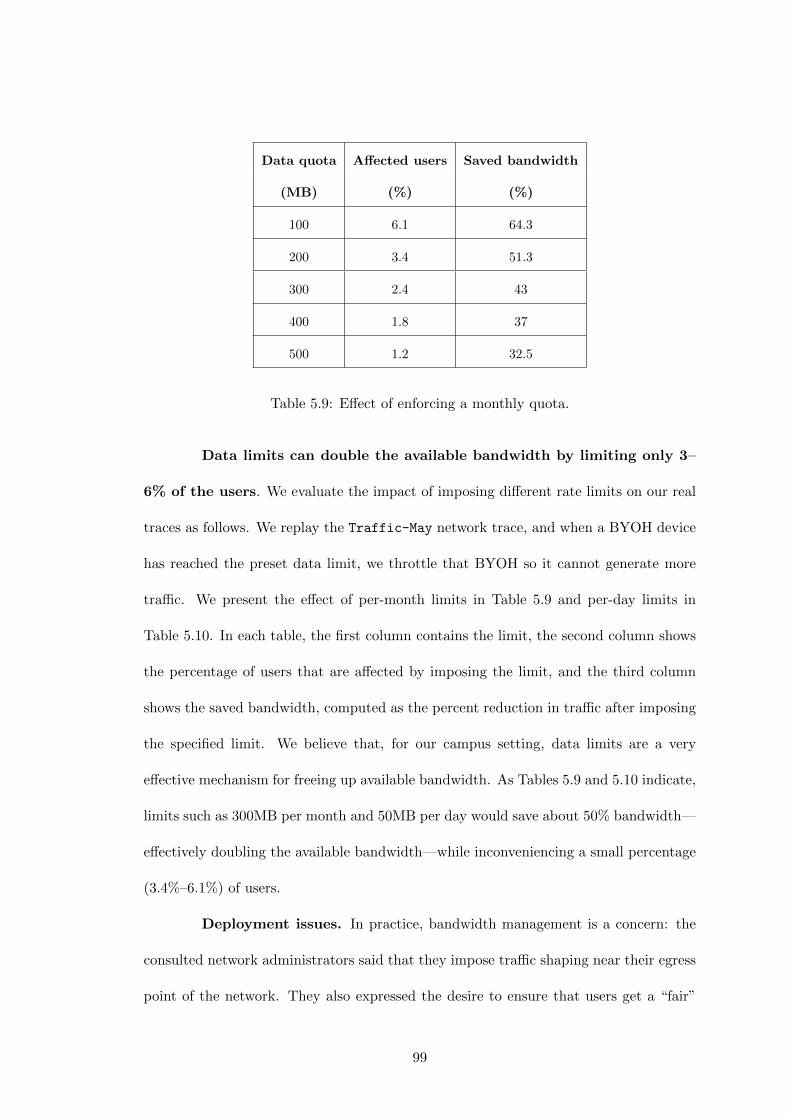
Data quota Affected users Saved bandwidth
(MB) (%) (%)
100 6.1 64.3
200 3.4 51.3
300 2.4 43
400 1.8 37
500 1.2 32.5
Table 5.9: Effect of enforcing a monthly quota.
Data limits can double the available bandwidth by limiting only 3–
6% of the users. We evaluate the impact of imposing different rate limits on our real
traces as follows. We replay the Traffic-May network trace, and when a BYOH device
has reached the preset data limit, we throttle that BYOH so it cannot generate more
traffic. We present the effect of per-month limits in Table 5.9 and per-day limits in
Table 5.10. In each table, the first column contains the limit, the second column shows
the percentage of users that are affected by imposing the limit, and the third column
shows the saved bandwidth, computed as the percent reduction in traffic after imposing
the specified limit. We believe that, for our campus setting, data limits are a very
effective mechanism for freeing up available bandwidth. As Tables 5.9 and 5.10 indicate,
limits such as 300MB per month and 50MB per day would save about 50% bandwidth—
effectively doubling the available bandwidth—while inconveniencing a small percentage
(3.4%–6.1%) of users.
Deployment issues. In practice, bandwidth management is a concern: the
consulted network administrators said that they impose traffic shaping near their egress
point of the network. They also expressed the desire to ensure that users get a “fair”
99
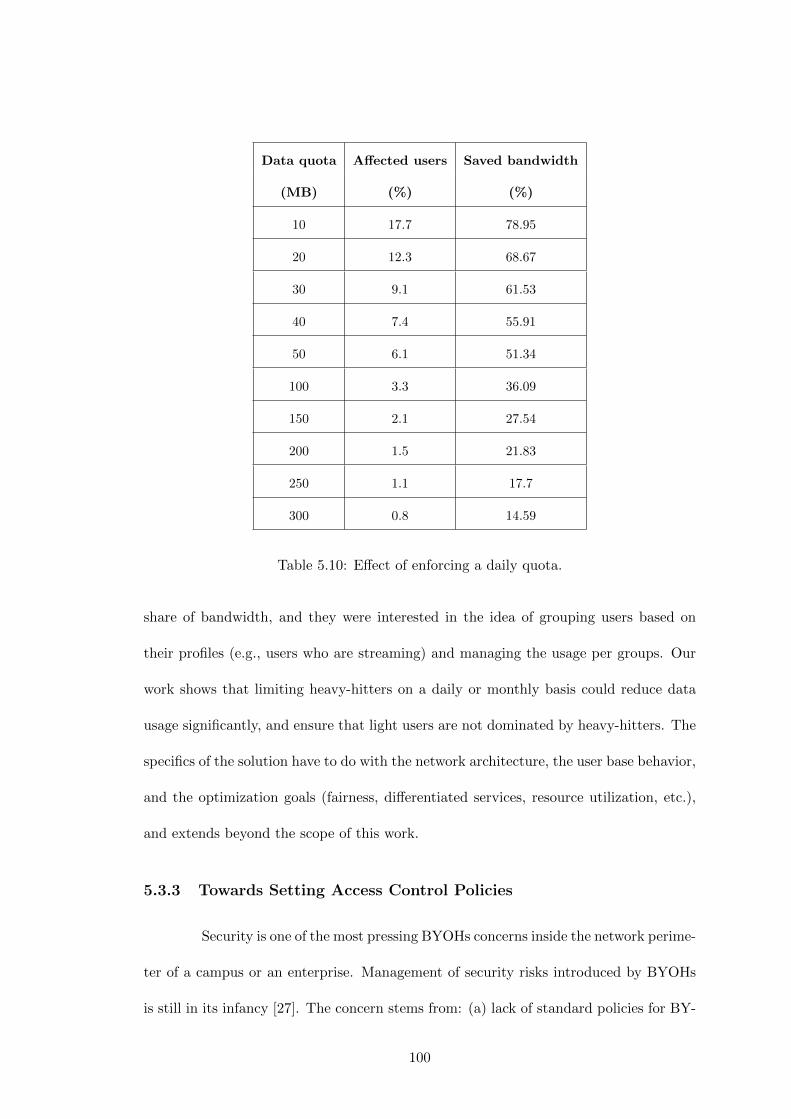
Data quota Affected users Saved bandwidth
(MB) (%) (%)
10 17.7 78.95
20 12.3 68.67
30 9.1 61.53
40 7.4 55.91
50 6.1 51.34
100 3.3 36.09
150 2.1 27.54
200 1.5 21.83
250 1.1 17.7
300 0.8 14.59
Table 5.10: Effect of enforcing a daily quota.
share of bandwidth, and they were interested in the idea of grouping users based on
their profiles (e.g., users who are streaming) and managing the usage per groups. Our
work shows that limiting heavy-hitters on a daily or monthly basis could reduce data
usage significantly, and ensure that light users are not dominated by heavy-hitters. The
specifics of the solution have to do with the network architecture, the user base behavior,
and the optimization goals (fairness, differentiated services, resource utilization, etc.),
and extends beyond the scope of this work.
5.3.3 Towards Setting Access Control Policies
Security is one of the most pressing BYOHs concerns inside the network perime-
ter of a campus or an enterprise. Management of security risks introduced by BYOHs
is still in its infancy [27]. The concern stems from: (a) lack of standard policies for BY-
100
OHs in contrast to the well established policies and tools to ensure the safety of laptops
and desktops, (b) large variations among devices OS or device OS versions, and (c) the
vulnerabilities introduced by apps, easily bought for as little as $0.99, whose behavior
and potential risks are not well-understood.
Brofiler’s profiling can provide a basis to start the discussion on providing
security policies, and enable administrators to begin reasoning about security issues. As
a showcase, we discuss how an administrator can think about establishing access control
policies. This case-study is more tentative than the two previous studies, where we
demonstrated tangible benefits. Nevertheless, we show that having intuitive groups can
provide a good starting point for developing security policies.
We now state our assumptions; while reasonable to us, in practice the specific
needs for access policies might vary across organizations or administrators. For the sake
of the case-study, we focus on non-zero traffic BYOHs. Specifically, we could assess
the security threat of each such device considering three aspects of its behavior: (a)
is the device talking to Internal Servers (IS)? (b) does it belong to the group of non-
regular devices (NRE)?, (c) does the device use unencrypted HTTP flows (HTTP)?
Clearly, the three aspects capture indications that the BYOH may pose a risk. The
first aspect captures whether the device accesses sensitive information of the institution.
The second aspect represents the regularity of the BYOH with the consideration that a
regular BYOH could be treated differently from an ephemeral BYOH. The third aspect
provides an indication of how security-sensitive is the device owner or the apps that
the device runs. For example, using unencrypted traffic could allow an eavesdropper
to gain access to sensitive personal information, and subsequently, allow the hacker to
impersonate that user, including potentially the student account, and thus putting the
network at risk.
101
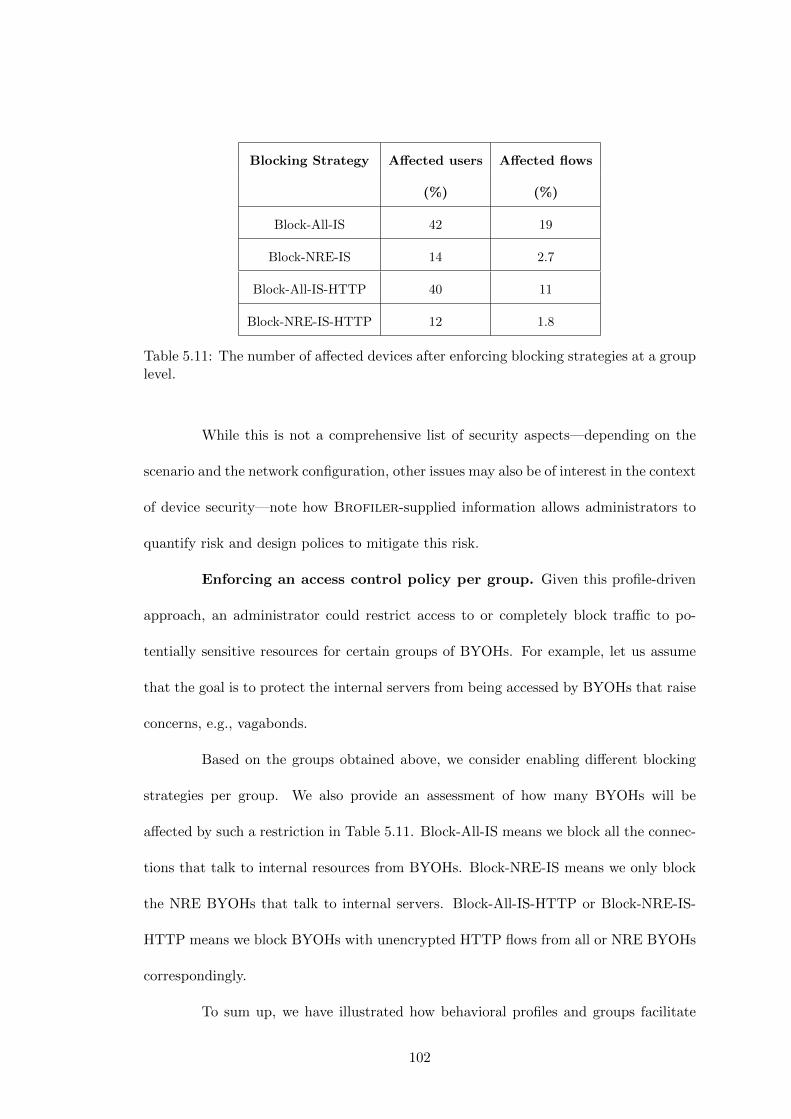
Blocking Strategy Affected users Affected flows
(%) (%)
Block-All-IS 42 19
Block-NRE-IS 14 2.7
Block-All-IS-HTTP 40 11
Block-NRE-IS-HTTP 12 1.8
Table 5.11: The number of affected devices after enforcing blocking strategies at a grouplevel.
While this is not a comprehensive list of security aspects—depending on the
scenario and the network configuration, other issues may also be of interest in the context
of device security—note how Brofiler-supplied information allows administrators to
quantify risk and design polices to mitigate this risk.
Enforcing an access control policy per group. Given this profile-driven
approach, an administrator could restrict access to or completely block traffic to po-
tentially sensitive resources for certain groups of BYOHs. For example, let us assume
that the goal is to protect the internal servers from being accessed by BYOHs that raise
concerns, e.g., vagabonds.
Based on the groups obtained above, we consider enabling different blocking
strategies per group. We also provide an assessment of how many BYOHs will be
affected by such a restriction in Table 5.11. Block-All-IS means we block all the connec-
tions that talk to internal resources from BYOHs. Block-NRE-IS means we only block
the NRE BYOHs that talk to internal servers. Block-All-IS-HTTP or Block-NRE-IS-
HTTP means we block BYOHs with unencrypted HTTP flows from all or NRE BYOHs
correspondingly.
To sum up, we have illustrated how behavioral profiles and groups facilitate
102
an intuitive discussion on how to enforce security policies. Evaluating the effectiveness
of the aforementioned policies in a real deployment is beyond the scope of this work;
nevertheless, Brofiler has allowed us to draw up policies that have intuitive appeal.
103
Chapter 6
Related Work
In the following, we discuss research efforts that are closely related to the
problems we have addressed in this dissertation.
6.1 Android Security
Barrera et al. [22] introduced a self-organizing method to visualize permissions
usage in different app categories. A comprehensive usability study of Android per-
missions was conducted through surveys in order to investigate Android permissions’
effectiveness at warning users, which showed that current Android permission warnings
do not help most users make correct security decisions [13]. Chia et al. [58] focused
on the effectiveness of user-consent permission systems in Facebook, Chrome, and An-
droid apps; they have shown that app ratings were not a reliable indicator of privacy
risks. Enck et al. [73] presented a framework that reads the declared permissions of
an application at install time and compared it against a set of security rules to detect
potentially malicious applications. Ongtang et al. [54] described a fine-grained Android
permission model for protecting applications by expressing permission statements in
104
more detail. Felt et al. [15] examined the mapping between Android APIs and permis-
sions and proposed Stowaway, a static analysis tool to detect over-privilege in Android
apps. Our method profiles the phone functionalities in static layer not only by explicit
permission request, but also by implicit Intent usage. Comdroid found a number of
exploitable vulnerabilities in inter-app communication in Android apps [25]. Permission
re-delegation attack were shown to perform privileged tasks with the help of an app with
permissions [14]. Taintdroid performed dynamic information-flow tracking to identify
the privacy leaks to advertisers or single content provider on Android apps [74]. Fur-
thermore, Enck et al. [72] found pervasive misuse of personal identifiers and penetration
of advertising and analytics services by conducting static analysis on a large scale of
Android apps. Our work profiles the app from multiple layers, and furthermore, we
profile the network layer with a more fine-grained granularity, e.g., Origin, CDN, Cloud,
Google and so on. AppFence extended the Taintdroid framework by allowing users to
enable privacy control mechanisms [59]. Dietz et al. [49] extended the Android IPC
mechanisms to address confused deputy attacks. A behavior-based malware detection
system Crowdroid was proposed to apply clustering algorithms on system calls statis-
tics to differentiate between benign and malicious apps [38]. pBMDS was proposed
to correlate user input features with system call features to detect anomalous behav-
iors on devices [47]. Grace et al. [52] used Woodpecker to examined how the Android
permission-based security model is enforced in pre-installed apps of stock smartphones.
Capability leaks were found that could be exploited by malicious activities. DroidRanger
was proposed to detect malicious apps in official and alternative markets [79]. AdSplit
was proposed to separate the advertisement from the host app as a different process [68].
Zhou et al. characterized a large set of Android malwares and a large subset of malwares’
main attack was accumulating fees on the devices by subscribing to premium services by
105
abusing SMS-related Android permissions [78]. Colluding applications could combine
their permissions and perform activities beyond their individual privileges. They can
communicate directly [20], or exploit covert or overt channels in Android core system
components [64]. An effective framework was developed to defense against privilege-
escalation attacks on devices, e.g., confused deputy attacks and colluding attacks [67].
Peng et al. [35] proposed to use probabilistic generative models to rank the risks of
apps based on permissions and provide risk score with a real value between 0 to 100.
Grace et al. [51] proposed a system to discover malwares with two order analysis. The
first-order analysis includes discovering high-risk apps by looking at the vlunerability
specific signature and detecting medium-risk apps by looking at control and data flow
graphs. The second order analysis is to detect the malwares that use intensively en-
crypts or dynamically changes its payload. Pandita et al. [63] used natural language
processing techniques to understand why an app uses a permission.
6.2 Smartphone Measurements and Profiling
Falaki et al. [34] analyzed network logs from 43 smartphones and found com-
monly used app ports, properties of TCP transfer and the impact factors of smartphone
performance. Furthermore, they also analyzed the diversity of smartphone usage, e.g.,
how the user uses the smartphone and apps [37]. Maier et al. [29] analyzed proto-
col usage, the size of HTTP content and the types of handheld traffic. These efforts
aid network operators, but they do not analyze the Android apps themselves. Recent
work by Xu et al. [61] did a large scale network traffic measurement study on usage
behaviors of smartphone apps, e.g., locality, diurnal behaviors and mobility patterns.
Qian et al. [28] developed a tool named ARO to locate the performance and energy
106
bottlenecks of smartphones by considering the cross-layer information ranging from ra-
dio resource control to application layer. Huang et al. [44] performed the measurement
study using smartphones on 3G networks, and presented the app and device usage of
smartphones. Falaki et al. [36] developed a monitoring tool SystemSens to capture the
usage context, e.g., CPU and memory, of smartphone. Livelab [21] is a measurement
tool implemented on iPhones to measure iPhone usage and different aspects of wireless
network performance. Powertutor [48] focused on power modeling and measured the
energy usage of smartphone. All these efforts focus on studying other layers, or device
resource usage, which is different from our focus. Shafiq et al. [56] have studied the
traffic of smartphones as aggregated over backbone Internet links. Sommers et al. [45]
compared the performance of cellular and WiFi in metropolitan areas. Gember et al. [5]
developed guidelines to accurately assess smartphone performance from the perspective
of in-context.
6.3 Studies on Campus Network
Prior research on DHCP has focused on studying and optimizing DHCP per-
formance [53,71]; these are earlier studies, around 2007, when smartphones and tablets
were not widely used. A fingerprinting technique was proposed to classify devices by
type and to manage IP lease time according to device type [39]. Here, we take into ac-
count the important factor, network traffic, to optimize DHCP resource. Very few prior
efforts focus on BYOH management over campus WiFi networks, which is our main
focus here, and those efforts had largely different goals. Gember et al. [6] have studied
the user-perceived performance differences between handheld devices and non-handheld
devices(e.g., laptops) in campus networks. They found that smartphones tend to have
107
smaller flow size and smaller range of flow durations. Chen et al. [75] have studied
the network performance of smartphones in campus networks, focusing on delay and
congestion. In contrast, we focus on BYOH management from the point of view of the
network administrator and focus on individual BYOH behavior, behavior-based profiles,
which are not addressed in the aforementioned studies.
108
Chapter 7
Conclusions and Future Work
In this dissertation, we have presented several key steps to help us understand
and improve the smartphone ecosystem.
First, we have investigated how Android permission and their use evolve in the
Android ecosystem via a rigorous study on the evolution of the platform, third-party
apps, and pre-installed apps. We found that the ecosystem is becoming less secure and
offer our recommendations on how to remedy this situation. We believe that our study
is beneficial to researchers, developers, and users, and that our results have the potential
to improve the state of practice in Android security.
Second, we have presented ProfileDroid, a monitoring and profiling sys-
tem for characterizing Android app behaviors at multiple layers: static, user, OS and
network. We proposed an ensemble of metrics at each layer to capture the essential
characteristics of app specification, user activities, OS and network statistics. Through
our analysis of top free and paid apps, we show that characteristics and behavior of
Android apps are well-captured by the metrics selected in our profiling methodology,
thereby justifying the selection of these metrics. Finally, we illustrate how, by using
109
ProfileDroid for multi-layer analysis, we were able to uncover surprising behavioral
characteristics.
Finally, taking a network administrator’s point of view, we have designed and
implemented a systematic framework, Brofiler, for profiling the behavior of BYOHs
along four dimensions: (a) protocol and control plane, (b) data plane, (c) temporal
behavior, and (d) across dimensions using the H-M-L model by considering the different
levels of intensity in each dimension. We arguably provided the first multi-dimensional
study of BYOHs, which shows how our profiling can provide interesting insights. We
also showed that using profiles, a network administrator can develop effective policies
for managing BYOHs. To that end, we showcased its usefulness and the gains that it
can lead to in: (a) DHCP management, with a 28.5% increase in address availability,
and (b) bandwidth management, with a doubling of the bandwidth availability by only
rate limiting 6% of the users.
7.1 Future Directions
In the future, we will continue to extend our previous work in the following
directions:
1. We will continue to investigate and characterize the Android apps security prob-
lems from other three layers, e.g., network layer, user layer and operating system
layers, which includes resourceful information. In the following, we will plan to
defend against the Android malware from a systematic perspective, namely, by
combining the knowledge from multiple layers.
2. Based on ProfileDroid, we will continue to develop a framework that gives a
finer-grained categorization of applications on Google Play. The scope of selected
110
apps for this dissertation was small. In the following, we will try to test a signifi-
cantly larger portion of the applications on the market, and categories based off of
the metrics of our layers could be created, e.g, “Network Heavy” if the app had a
high outcome in network traffic, “Very Interactive” if the app had a high intensity
of touchscreen events. These new categories could help users select applications
according to their usage preference. When new categories are combined with the
market’s current categories, the user will have a greater ability to select the app
that best fits their preferences.
3. We will continue to expand Brofiler to: (a) reveal more interesting behaviors,
by introducing more metrics within each dimension, and (b) apply our approach to
address more BYOH-related management problems under the guidance of network
administrators. For example, integrating comprehensive access control into our
framework Brofiler. We will also continue to extend the work into more broad
domains of different networks.
111
Bibliography
[1] Android Rapidly Repeats DHCP Transactions Many Times, November 2012.http://www.net.princeton.edu/android/android-rapidly-repeats-dhcp-transactions-many-times-33590.html.
[2] Freewarelovers, May 2012. http://www.freewarelovers.com/android.
[3] iOS Requests DHCP Too Often, September 2012. http://www.net.princeton.edu/apple-ios/ios40-requests-DHCP-too-often.html.
[4] Google Play. https://play.google.com/store, September 2013.
[5] A. Gember, A. Akella, J. Pang, A. Varshavsky, and R. Caceres. Obtaining In-context Measurements of Cellular Network Performance. In ACM IMC, 2012.
[6] A. Gember, A. Anand, and A. Akella. A Comparative Study of Handheld andNon-Handheld Traffic in Campus Wi-Fi Networks. In PAM, 2011.
[7] Amazon App Store. http://www.amazon.com/mobile-apps/b?ie=UTF8&node=2350149011, September 2013.
[8] Android- and iOS-Powered Smartphones Expand Their Share of the Market. http://www.idc.com/getdoc.jsp?containerId=prUS23503312, May 2012.
[9] Android-defined Permission Category. http://developer.android.com/reference/android/Manifest.permission group.html, September 2013.
[10] Android Developer. Android API. http://developer.android.com/guide/appendix/api-levels.html, September 2013.
[11] Android Police. Massive Security Vulnerability In HTC Android De-vices. http://www.androidpolice.com/2011/10/01/massive-security-vulnerability-in-htc-android-devices, October 2011.
[12] Android SDK. http://developer.android.com/sdk/android-2.2.html, September 2013.
[13] A.P. Felt, E. Ha, S. Egelman, A. Haney, E. Chin and D. Wagner. Android Permis-sions: User Attention, Comprehension, and Behavior . In SOUPS, 2012.
[14] A.P. Felt, H. Wang, A. Moshchuk, S. Hanna and E. Chin. Permission Re-Delegation:Attacks and Defenses. In USENIX Security Symposium, 2011.
112
[15] A.P.Felt, E. Chin, S. Hanna, D. Song, and D. Wagner. Android Permissions De-mystified. In ACM CCS, 2011.
[16] Appannie. Google Play Passes Apples App Store In Total Downloads, July 2013.http://blog.appannie.com/app-annie-index-market-q2-2013/.
[17] Appbrain. Number of Android Apps, September 2013. http://www.appbrain.com/stats/number-of-android-apps.
[18] B. Krishnamurthy and C. E. Willis. Privacy diffusion on the web: A longitudinalperspective. In WWW, 2009.
[19] C. Labovitz, S. Iekel-Johnson, D. McPherson, J. Oberheide, and F. Jahanian. In-ternet inter-domain traffic. In ACM SIGCOMM, 2010.
[20] C. Marforio, H. Ritzdorf, A. Francillon, and S. Capkun. Analysis of the Com-munication between Colluding Applications on Modern Smartphones. In ACSAC,2012.
[21] C. Shepard, A. Rahmati, C. Tossell, L. Zhong, and P. Kortum. LiveLab: MeasuringWireless Networks and Smartphone Users in the Field. In HotMetrics, 2010.
[22] D. Barrera, H.G. Kayacik, P.C. van Oorschot and A. Somayaji. A Methodologyfor Empirical Analysis of Permission-based Security Models and its Application toAndroid. In ACM CCS, 2010.
[23] D. Pelleg, A.W.Moore. X-means: Extending K-means with Efficient Estimation ofthe Number of Clusters. In ICML, 2000.
[24] D.C. Hoaglin, F. Mosteller and J. W. Tukey. Understanding robust and exploratorydata analysis, 1983. Wiley.
[25] E. Chin, A. P. Felt, K. Greenwood, and D. Wagner. Analyzing Inter-ApplicationCommunication in Android. In ACM MobiSys, 2011.
[26] Engadget. Google now at 1.5 million Android activations per day,April 2013. http://www.engadget.com/2013/04/16/eric-schmidt-google-now-at-1-5-million-android-activations-per/.
[27] Enterasys. Trends in BYOD:Network Management and Security Are Leading Con-cerns, March 2013. http://blogs.enterasys.com/trends-in-byod-network-security-and-management-are-leading-concerns/.
[28] F. Qian, Z. Wang, A. Gerber, Z. Morley Mao, S. Sen, and O. Spatscheck. ProfilingResource Usage for Mobile apps: a Cross-layer Approach. In ACM MobiSys, 2011.
[29] G. Maier, F. Schneider, and A. Feldmann. A First Look at Mobile Hand-heldDevice Traffic. In PAM, 2010.
[30] Gartner. Smartphone Sales Grew 46.5 Percent in Second Quarter of 2013 andExceeded Feature Phone Sales for First Time, 2013. http://www.gartner.com/newsroom/id/2573415.
[31] Gartner. Nearly 75% Of All Smartphones Sold In Q1 Were Android. http://www.gartner.com/newsroom/id/2482816, June 2013.
113
[32] Gartner. Worldwide PC Shipments in the First Quarter of 2013 Drop to LowestLevels, 2013. http://www.gartner.com/newsroom/id/2420816.
[33] Google. Android Open Source Project, September 2013. http://source.android.com/.
[34] H. Falaki, D. Lymberopoulos, R. Mahajan, S. Kandula, and D. Estrin. A FirstLook at Traffic on Smartphones. In ACM IMC, 2010.
[35] H. Peng, C. Gates, B. Sarma, N. Li, Y. Qi, R. Potharaju, C. Nita-Rotaru andI. Molloy. Using Probabilistic Generative Models For Ranking Risks of AndroidApps. In ACM CCS, 2012.
[36] H.Falaki, R.Mahajan, and D. Estrin. SystemSens: A Tool for Monitoring Usage inSmartphone Research Deployments. In ACM MobiArch, 2011.
[37] H.Falaki, R.Mahajan, S. Kandula, D.Lymberopoulos, R.Govindan, and D.Estrin .Diversity in Smartphone Usage. In ACM MobiSys, 2010.
[38] I. Burguera,U. Zurutuza, and S. Nadjm-Tehrani. Crowdroid: behavior-based mal-ware detection system for Android. In SPSM, 2011.
[39] I. Papapanagiotou,E. M Nahum and V. Pappas. Configuring DHCP Leases in theSmartphone Era. In ACM IMC, 2012.
[40] IDC-Press Release. Smartphones Expected to Grow 32.7% in 2013. http://www.idc.com/getdoc.jsp?containerId=prUS24143513, June 2013.
[41] IEEE Standards. Vendors of Mac Address, November 2012. http://standards.ieee.org/develop/regauth/oui/oui.txt.
[42] Increased Smartphone Usage Increases Network Complaints. http://www.telecompetitor.com/j-d-power-increased-smartphone-usage-increases-network-complaints/, March 2012.
[43] iOS App Store. https://itunes.apple.com/us/app/apple-store/id375380948?mt=8,September 2013.
[44] J. Huang, Q. Xu, B. Tiwana, Z. M. Mao, M. Zhang, and P. Bahl. Anatomizing appPerformance Differences on Smartphones. In ACM MobiSys, 2010.
[45] J. Sommers and P. Barford. Cell vs. WiFi: On the Performance of Metro AreaMobile Connections. In ACM IMC, 2012.
[46] L. Gomez, I. Neamtiu, T. Azim and T. Millstein. RERAN: Timing- and Touch-Sensitive Record and Replay for Android . In ICSE, 2013.
[47] L. Xie, X. Zhang, J.-P. Seifert, and S. Zhu. pBMDS: A Behavior-based MalwareDetection System for Cellphone Devices. In ACM WiSec, 2010.
[48] L. Zhang, B. Tiwana, Z. Qian, Z. Wang, R. Dick, Z. M. Mao, and L. Yang. AccurateOnline Power Estimation and Automatic Battery Behavior Based Power ModelGeneration for Smartphones. In CODES+ISSS, 2010.
114
[49] M. Dietz, S. Shekhar, Y. Pisetsky, A. Shu, and D.S. Wallach. Quire: lightweightprovenance for smart phone operating systems. In USENIX Security Symposium,2011.
[50] M. Egele, C. Kruegel, E. Kirda, and G. Vigna. Detecting Privacy Leaks in iOSapps. In NDSS, 2011.
[51] M. Grace, Y. Zhou, Q. Zhang, S. Zou, X. Jiang. RiskRanker: Scalable and AccurateZero-day Android Malware Detection. In ACM MobiSys, 2012.
[52] M. Grace, Y. Zhou, Z. Wang, and X. Jiang. Systematic Detection of CapabilityLeaks in Stock Android Smartphones . In NDSS, 2012.
[53] M. Khadilkar, N. Feamster, M. Sanders and R. Clark. Usage-based DHCP leasetime optimization . In ACM IMC, 2007.
[54] M. Ongtang, S. McLaughlin, W. Enck and P. McDaniel. Semantically RichApplication-Centric Security in Android. In ACSAC, 2009.
[55] Malware Patrol. http://www.malware.com.br/.
[56] M.Z.Shafiq, L. Ji, Alex X. Liu and J. Wang. Characterizing and Modeling InternetTraffic Dynamics of Cellular Devices. In ACM Sigmetrics, 2011.
[57] NIST (National Institute of Standards and Technology). Guidelines for Managingand Securing Mobile Devices in the Enterprise, July 2012. http://csrc.nist.gov/publications/drafts/800-124r1/draft sp800-124-rev1.pdf.
[58] P. H. Chia, Y. Yamamoto, and N. Asokan. Is this App Safe? A Large Scale Studyon Application Permissions and Risk Signals . In WWW, 2012.
[59] P. Hornyack, S. Han, J. Jung, S. Schechter, and D. Wetherall. These arent theDroids youre looking for: Retrotting Android to protect data from imperious ap-plications. In ACM CCS, 2011.
[60] P. Pearce, A.P. Felt, G. Nunez and D. Wagner. AdDroid: Privilege Separation forApplications and Advertisers in Android . In ACM AsiaCCS, 2012.
[61] Q. Xu, J. Erman, A. Gerber, Z. Morley Mao, J. Pang, and S. Venkataraman.Identify Diverse Usage Behaviors of Smartphone Apps. In ACM IMC, 2011.
[62] Q. Xu, J. Huang, Z. Wang F. Qian A. Gerber and Z. Morley Mao. Cellular DataNetwork Infrastructure Characterization and Implication on Mobile Content Place-ment. In ACM Sigmetrics, 2011.
[63] R. Pandita, X. Xiao, W. Yang, W. Enck, and T. Xie. WHYPER: Towards Automat-ing Risk Assessment of Mobile Applications. In USENIX Security Symposium, 2013.
[64] R. Schlegel, K. Zhang, X. Zhou, M. Intwala, A. Kapadia, and X. Wang. Sound-comber: A Stealthy and Context-Aware Sound Trojan for Smartphones. In NDSS,2011.
[65] RFC. Dynamic Host Configuration Protocol, March 1997. http://www.ietf.org/rfc/rfc2131.txt.
115
[66] RFC. Architectural Implications of NAT, 2000. ftp://ftp.ripe.net/rfc/rfc2993.txt.
[67] S. Bugiel, L. Davi, A. Dmitrienko, T. Fischer, A. Sadeghi, and B.Shastry. TowardsTaming Privilege-Escalation Attacks on Android . In NDSS, 2012.
[68] S. Shekhar, M. Dietz, and D.S. Wallach. AdSplit: Separating smartphone adver-tising from applications. In USENIX Security Symposium, 2012.
[69] S.Fahl, M.Harbach, T.Muders L.Baumgartner B.Freisleben M. Smith. Why Eveand Mallory Love Android: An Analysis of Android SSL (In)Security . In ACMCCS, 2012.
[70] T. Henderson, D. Kotz and I. Abyzov. The Changing Usage of a Mature Campus-wide Wireless Network. In Computer Networks 52(14), pages 2690–2712, 2008.
[71] V. Birk, J. Stroik, and S. Banerjee. Debugging DHCP Performance . In IMC, 2004.
[72] W. Enck, D. Octeau, P. McDaniel, and S. Chaudhuri. A Study of Android Appli-cation Security. In USENIX Security Symposium, 2011.
[73] W. Enck, M. Ongtang and P. McDaniel. On Lightweight Mobile Phone ApplicationCertification. In ACM CCS, 2009.
[74] W. Enck, P. Gilbert, B. G. Chun, L. P. Cox, J. Jung, P. McDaniel, and A. N. Sheth.Taintdroid: An information-flow tracking system for realtime privacy monitoringon smartphones. In OSDI, 2010.
[75] X. Chen, R. Jin, K. Suh, B. Wang and W. Wei. Network Performance of SmartMobile Handhelds in a University Campus WiFi Network. In ACM IMC, 2012.
[76] X.Wei, L.Gomez, I.Neamtiu, and M. Faloutsos. ProfileDroid: Multi-layer Profilingof Android Applications . In ACM MobiCom, 2012. DOI:10.1145/2348543.2348563.
[77] X.Wei, L.Gomez, I.Neamtiu, and M. Faloutsos. Permission Evolution in the An-droid Ecosystem . In ACSAC, 2012. DOI:10.1145/2420950.2420956.
[78] Y. Zhou and X. Jiang. Dissecting Android Malware: Characterization and Evolu-tion. In IEEE S&P, 2012.
[79] Y. Zhou, Z. Wang, Wu Zhou and X. Jiang. Hey, You, Get off of My Market:Detecting Malicious Apps in Official and Alternative Android Markets . In NDSS,2012.
116