Embed Size (px)
Citation preview

Page 1 of 50
Understanding and Addressing Food Security in
Southwest Baltimore
Anne Palmer, Program Director, Johns Hopkins Center for a Livable Future
Joyce Smith, Executive Director, Operation ReachOut Southwest Stephen A. Haering, Chief Resident,
Johns Hopkins Preventive Medicine Residency Program Shawn McKenzie, Assistant Director, Johns Hopkins Center for a Livable Future
Page 2 of 50
Special thanks to the following individuals for their contributions to this report: Allyson Karpyn from the Food Trust for her technical assistance with developing the residents’ survey, the data analysis, and the initial report on the residents’ results. Katie Berndtson, Kristina Weeks and Brent Kim for their data analysis; Roni Neff for her assistance with data analysis and overall review of the report.
Page 3 of 50
TABLE OF CONTENTS Introduction...................................................................................................4 Background ...................................................................................................5 Results from the food store assessment ......................................................6 Results from the residents’ survey ............................................................11 Key Findings, Discussion and Recommendations....................................24 Appendices...................................................................................................27 Bibliography................................................................................................45
Page 4 of 50
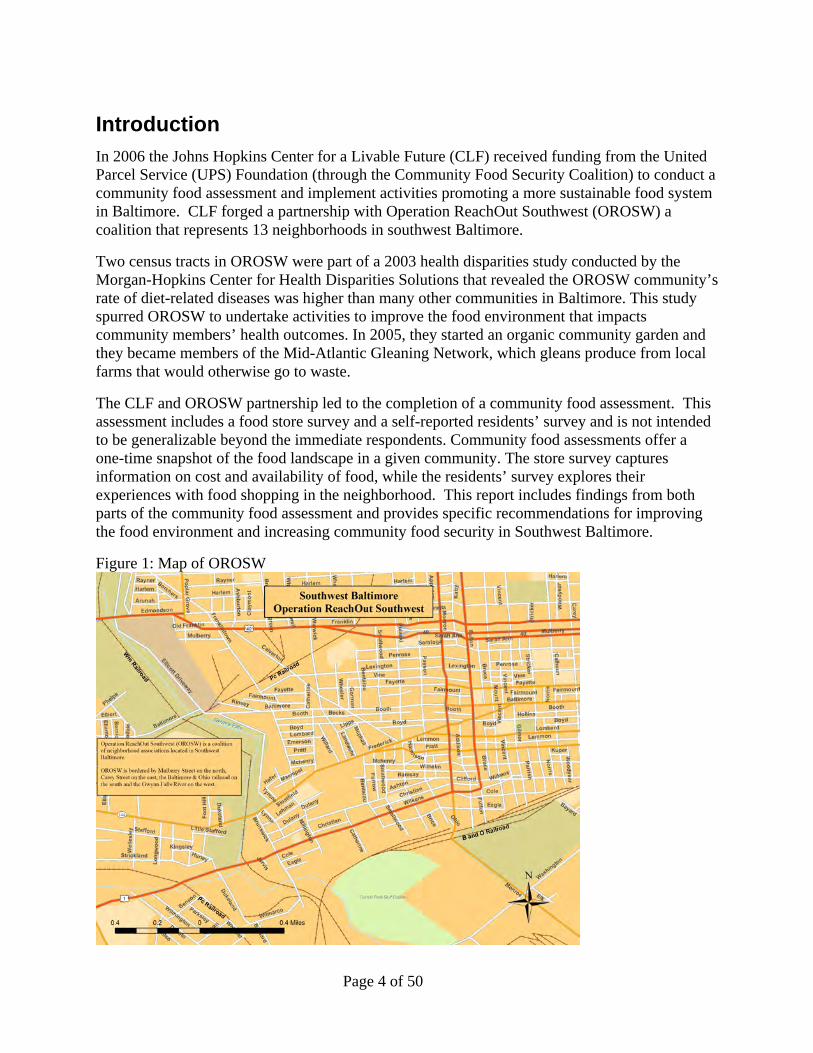
Introduction In 2006 the Johns Hopkins Center for a Livable Future (CLF) received funding from the United Parcel Service (UPS) Foundation (through the Community Food Security Coalition) to conduct a community food assessment and implement activities promoting a more sustainable food system in Baltimore. CLF forged a partnership with Operation ReachOut Southwest (OROSW) a coalition that represents 13 neighborhoods in southwest Baltimore.
Two census tracts in OROSW were part of a 2003 health disparities study conducted by the Morgan-Hopkins Center for Health Disparities Solutions that revealed the OROSW community’s rate of diet-related diseases was higher than many other communities in Baltimore. This study spurred OROSW to undertake activities to improve the food environment that impacts community members’ health outcomes. In 2005, they started an organic community garden and they became members of the Mid-Atlantic Gleaning Network, which gleans produce from local farms that would otherwise go to waste.
The CLF and OROSW partnership led to the completion of a community food assessment. This assessment includes a food store survey and a self-reported residents’ survey and is not intended to be generalizable beyond the immediate respondents. Community food assessments offer a one-time snapshot of the food landscape in a given community. The store survey captures information on cost and availability of food, while the residents’ survey explores their experiences with food shopping in the neighborhood. This report includes findings from both parts of the community food assessment and provides specific recommendations for improving the food environment and increasing community food security in Southwest Baltimore.
Figure 1: Map of OROSW
Page 5 of 50
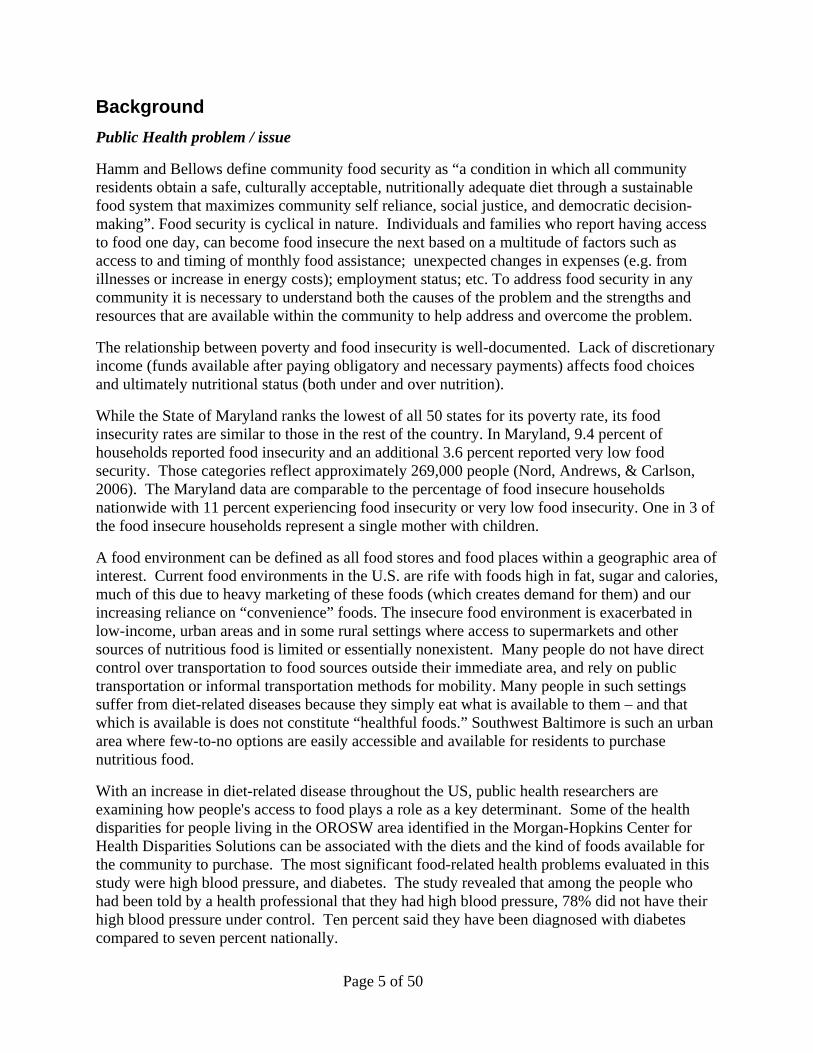
Background Public Health problem / issue
Hamm and Bellows define community food security as “a condition in which all community residents obtain a safe, culturally acceptable, nutritionally adequate diet through a sustainable food system that maximizes community self reliance, social justice, and democratic decision-making”. Food security is cyclical in nature. Individuals and families who report having access to food one day, can become food insecure the next based on a multitude of factors such as access to and timing of monthly food assistance; unexpected changes in expenses (e.g. from illnesses or increase in energy costs); employment status; etc. To address food security in any community it is necessary to understand both the causes of the problem and the strengths and resources that are available within the community to help address and overcome the problem.
The relationship between poverty and food insecurity is well-documented. Lack of discretionary income (funds available after paying obligatory and necessary payments) affects food choices and ultimately nutritional status (both under and over nutrition).
While the State of Maryland ranks the lowest of all 50 states for its poverty rate, its food insecurity rates are similar to those in the rest of the country. In Maryland, 9.4 percent of households reported food insecurity and an additional 3.6 percent reported very low food security. Those categories reflect approximately 269,000 people (Nord, Andrews, & Carlson, 2006). The Maryland data are comparable to the percentage of food insecure households nationwide with 11 percent experiencing food insecurity or very low food insecurity. One in 3 of the food insecure households represent a single mother with children.
A food environment can be defined as all food stores and food places within a geographic area of interest. Current food environments in the U.S. are rife with foods high in fat, sugar and calories, much of this due to heavy marketing of these foods (which creates demand for them) and our increasing reliance on “convenience” foods. The insecure food environment is exacerbated in low-income, urban areas and in some rural settings where access to supermarkets and other sources of nutritious food is limited or essentially nonexistent. Many people do not have direct control over transportation to food sources outside their immediate area, and rely on public transportation or informal transportation methods for mobility. Many people in such settings suffer from diet-related diseases because they simply eat what is available to them – and that which is available is does not constitute “healthful foods.” Southwest Baltimore is such an urban area where few-to-no options are easily accessible and available for residents to purchase nutritious food.
With an increase in diet-related disease throughout the US, public health researchers are examining how people's access to food plays a role as a key determinant. Some of the health disparities for people living in the OROSW area identified in the Morgan-Hopkins Center for Health Disparities Solutions can be associated with the diets and the kind of foods available for the community to purchase. The most significant food-related health problems evaluated in this study were high blood pressure, and diabetes. The study revealed that among the people who had been told by a health professional that they had high blood pressure, 78% did not have their high blood pressure under control. Ten percent said they have been diagnosed with diabetes compared to seven percent nationally.
Page 6 of 50
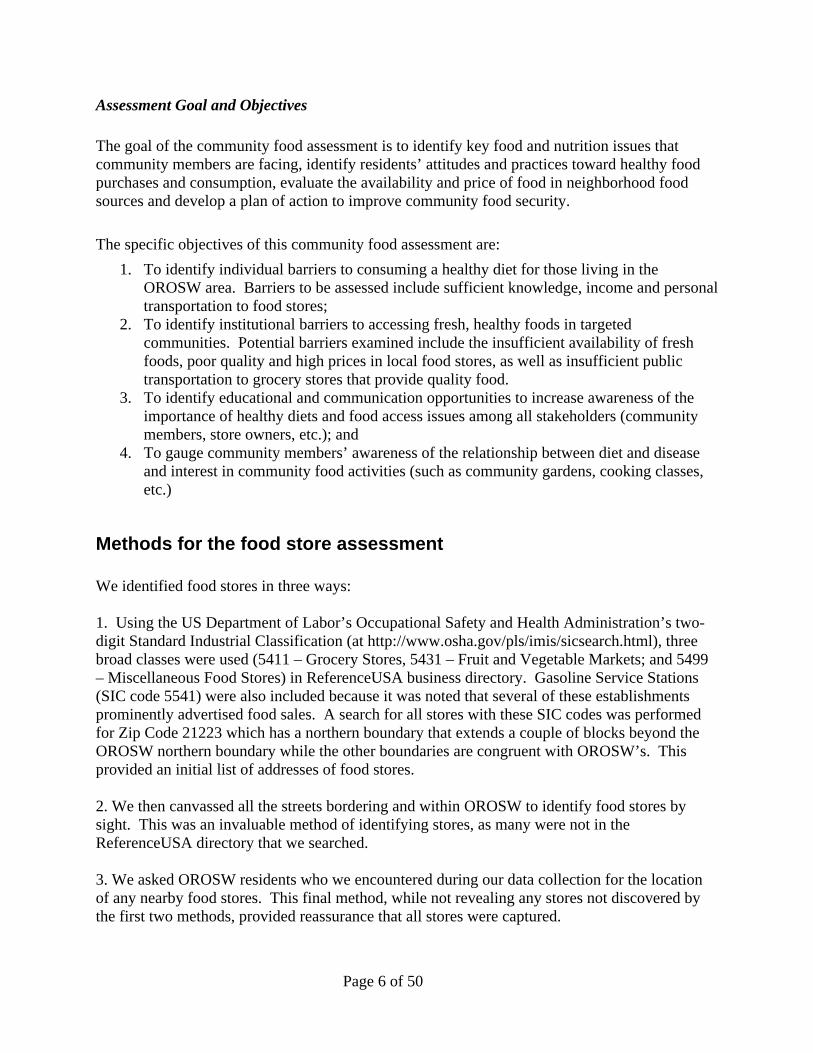
Assessment Goal and Objectives The goal of the community food assessment is to identify key food and nutrition issues that community members are facing, identify residents’ attitudes and practices toward healthy food purchases and consumption, evaluate the availability and price of food in neighborhood food sources and develop a plan of action to improve community food security. The specific objectives of this community food assessment are:
1. To identify individual barriers to consuming a healthy diet for those living in the OROSW area. Barriers to be assessed include sufficient knowledge, income and personal transportation to food stores;
2. To identify institutional barriers to accessing fresh, healthy foods in targeted communities. Potential barriers examined include the insufficient availability of fresh foods, poor quality and high prices in local food stores, as well as insufficient public transportation to grocery stores that provide quality food.
3. To identify educational and communication opportunities to increase awareness of the importance of healthy diets and food access issues among all stakeholders (community members, store owners, etc.); and
4. To gauge community members’ awareness of the relationship between diet and disease and interest in community food activities (such as community gardens, cooking classes, etc.)
Methods for the food store assessment We identified food stores in three ways: 1. Using the US Department of Labor’s Occupational Safety and Health Administration’s two-digit Standard Industrial Classification (at http://www.osha.gov/pls/imis/sicsearch.html), three broad classes were used (5411 – Grocery Stores, 5431 – Fruit and Vegetable Markets; and 5499 – Miscellaneous Food Stores) in ReferenceUSA business directory. Gasoline Service Stations (SIC code 5541) were also included because it was noted that several of these establishments prominently advertised food sales. A search for all stores with these SIC codes was performed for Zip Code 21223 which has a northern boundary that extends a couple of blocks beyond the OROSW northern boundary while the other boundaries are congruent with OROSW’s. This provided an initial list of addresses of food stores. 2. We then canvassed all the streets bordering and within OROSW to identify food stores by sight. This was an invaluable method of identifying stores, as many were not in the ReferenceUSA directory that we searched. 3. We asked OROSW residents who we encountered during our data collection for the location of any nearby food stores. This final method, while not revealing any stores not discovered by the first two methods, provided reassurance that all stores were captured.
Page 7 of 50
With the above methodology 41 stores were classified as “OROSW food stores.” 35 of these stores were within OROSW geographic boundaries; 6 of these stores were within a few blocks of the geographic borders and/or were identified by OROSW residents as stores from which they obtained food. A census survey of the 41 OROSW food stores was conducted in December 2006. (There were three refusals). The Nutritional Environments Measurement Survey (NEMS) (Glanz, Sallis, Saelens, & Frank, 2005) was modified and used to record the availability and price of a number food items in each store: this included three varieties of milk, ten common fruits, and ten common vegetables. A variety of food items had “regular option” and “healthy option” (the nomenclature of “regular option” and “healthy option” was provided by the developers of the NEMS instrument, utilizing the percentage of fat or simple carbohydrates in the food as the basis for determining that item’s classification); this included ground beef, hot dogs, frozen dinners, baked goods, beverages, bread, baked chips, and cereal. Refer to Appendix A for the “Food Store Survey” used in the OROSW community food assessment.
Results for the food store assessment Survey results for availability of milk, fruits, vegetables, ground beef, hotdogs and bread are reported below.
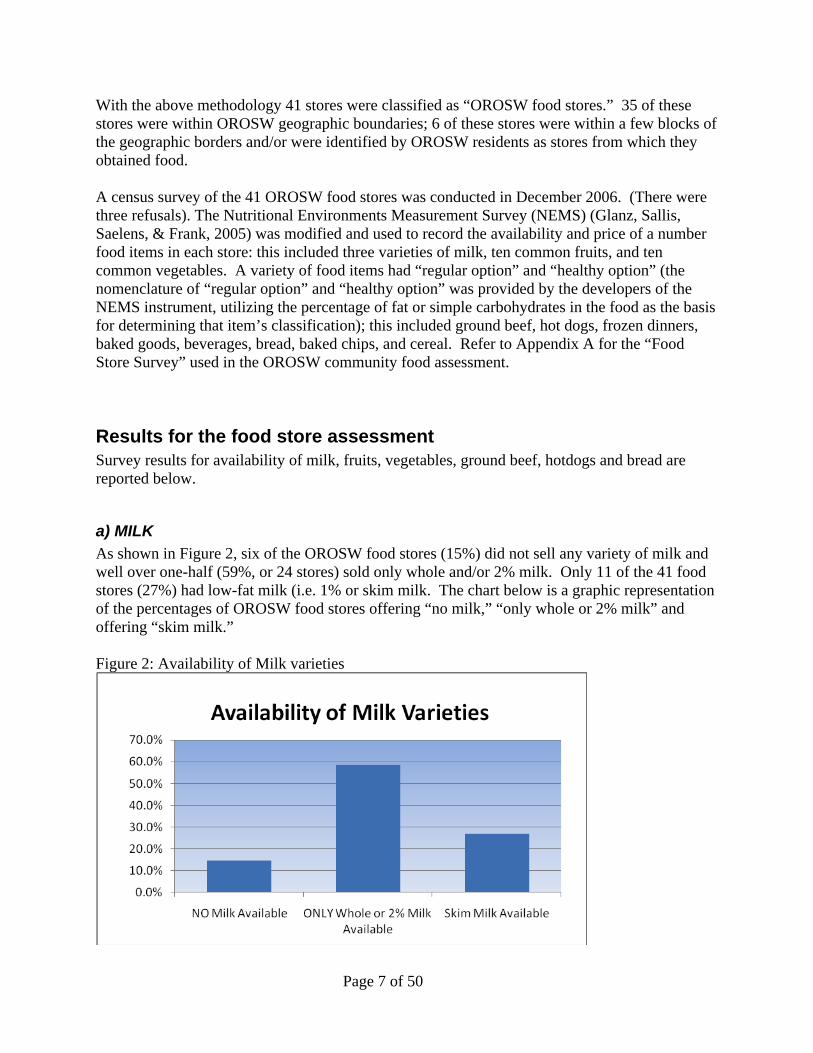
a) MILK As shown in Figure 2, six of the OROSW food stores (15%) did not sell any variety of milk and well over one-half (59%, or 24 stores) sold only whole and/or 2% milk. Only 11 of the 41 food stores (27%) had low-fat milk (i.e. 1% or skim milk. The chart below is a graphic representation of the percentages of OROSW food stores offering “no milk,” “only whole or 2% milk” and offering “skim milk.” Figure 2: Availability of Milk varieties
Page 8 of 50
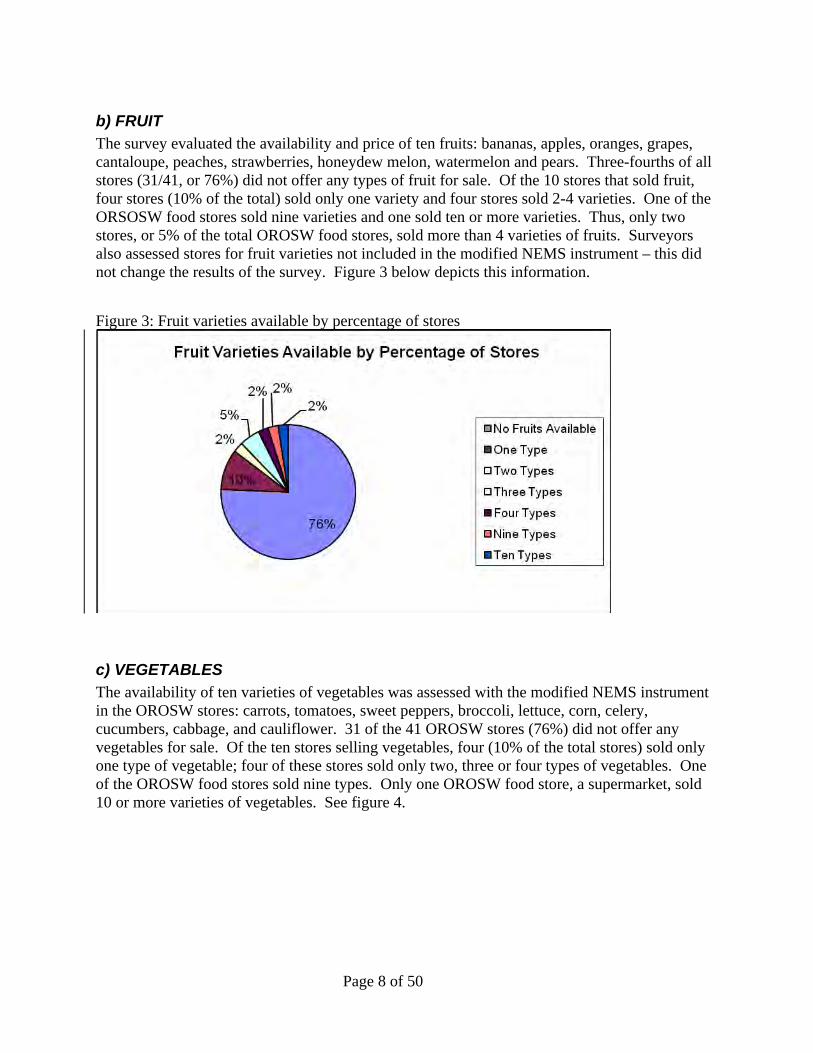
b) FRUIT The survey evaluated the availability and price of ten fruits: bananas, apples, oranges, grapes, cantaloupe, peaches, strawberries, honeydew melon, watermelon and pears. Three-fourths of all stores (31/41, or 76%) did not offer any types of fruit for sale. Of the 10 stores that sold fruit, four stores (10% of the total) sold only one variety and four stores sold 2-4 varieties. One of the ORSOSW food stores sold nine varieties and one sold ten or more varieties. Thus, only two stores, or 5% of the total OROSW food stores, sold more than 4 varieties of fruits. Surveyors also assessed stores for fruit varieties not included in the modified NEMS instrument – this did not change the results of the survey. Figure 3 below depicts this information. Figure 3: Fruit varieties available by percentage of stores
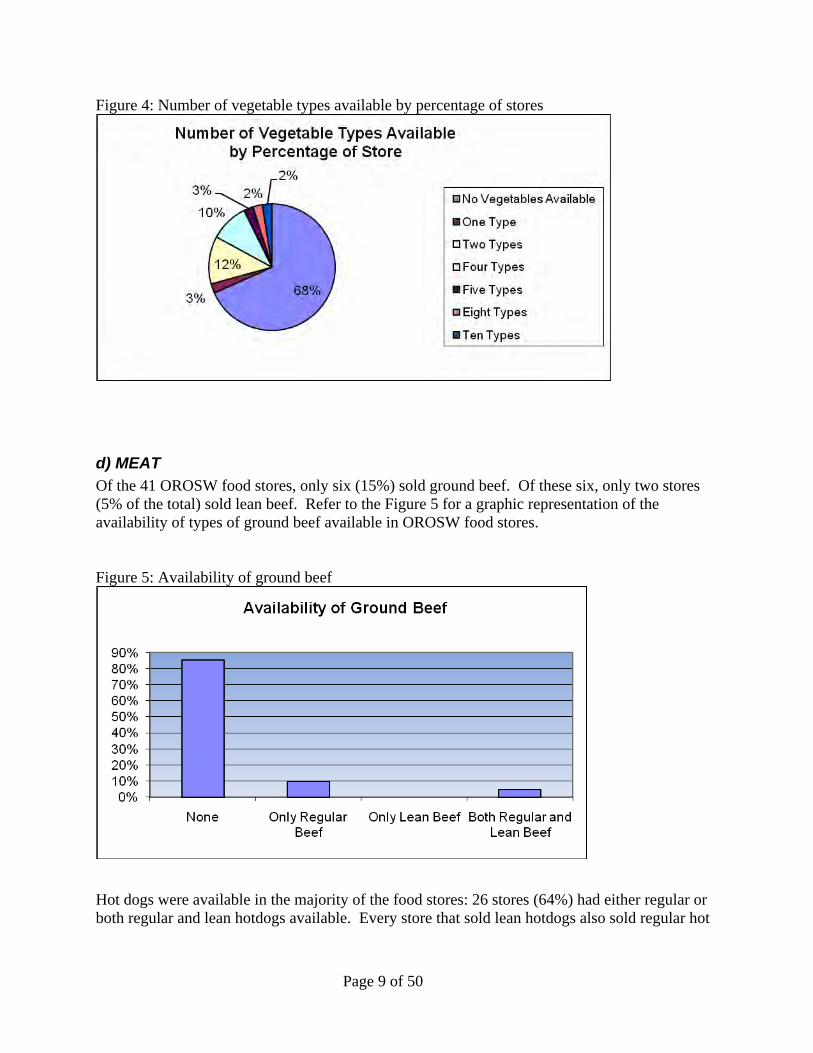
c) VEGETABLES The availability of ten varieties of vegetables was assessed with the modified NEMS instrument in the OROSW stores: carrots, tomatoes, sweet peppers, broccoli, lettuce, corn, celery, cucumbers, cabbage, and cauliflower. 31 of the 41 OROSW stores (76%) did not offer any vegetables for sale. Of the ten stores selling vegetables, four (10% of the total stores) sold only one type of vegetable; four of these stores sold only two, three or four types of vegetables. One of the OROSW food stores sold nine types. Only one OROSW food store, a supermarket, sold 10 or more varieties of vegetables. See figure 4.
Page 9 of 50
Figure 4: Number of vegetable types available by percentage of stores
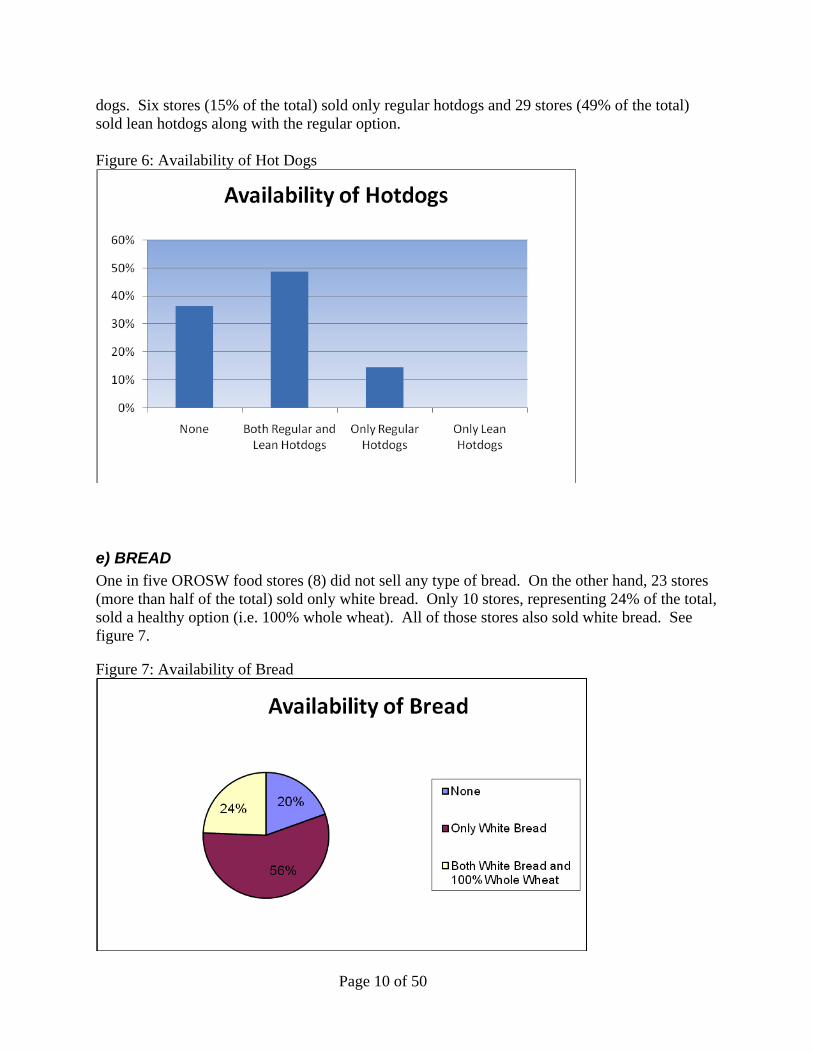
d) MEAT Of the 41 OROSW food stores, only six (15%) sold ground beef. Of these six, only two stores (5% of the total) sold lean beef. Refer to the Figure 5 for a graphic representation of the availability of types of ground beef available in OROSW food stores. Figure 5: Availability of ground beef
Hot dogs were available in the majority of the food stores: 26 stores (64%) had either regular or both regular and lean hotdogs available. Every store that sold lean hotdogs also sold regular hot
Page 10 of 50
dogs. Six stores (15% of the total) sold only regular hotdogs and 29 stores (49% of the total) sold lean hotdogs along with the regular option. Figure 6: Availability of Hot Dogs
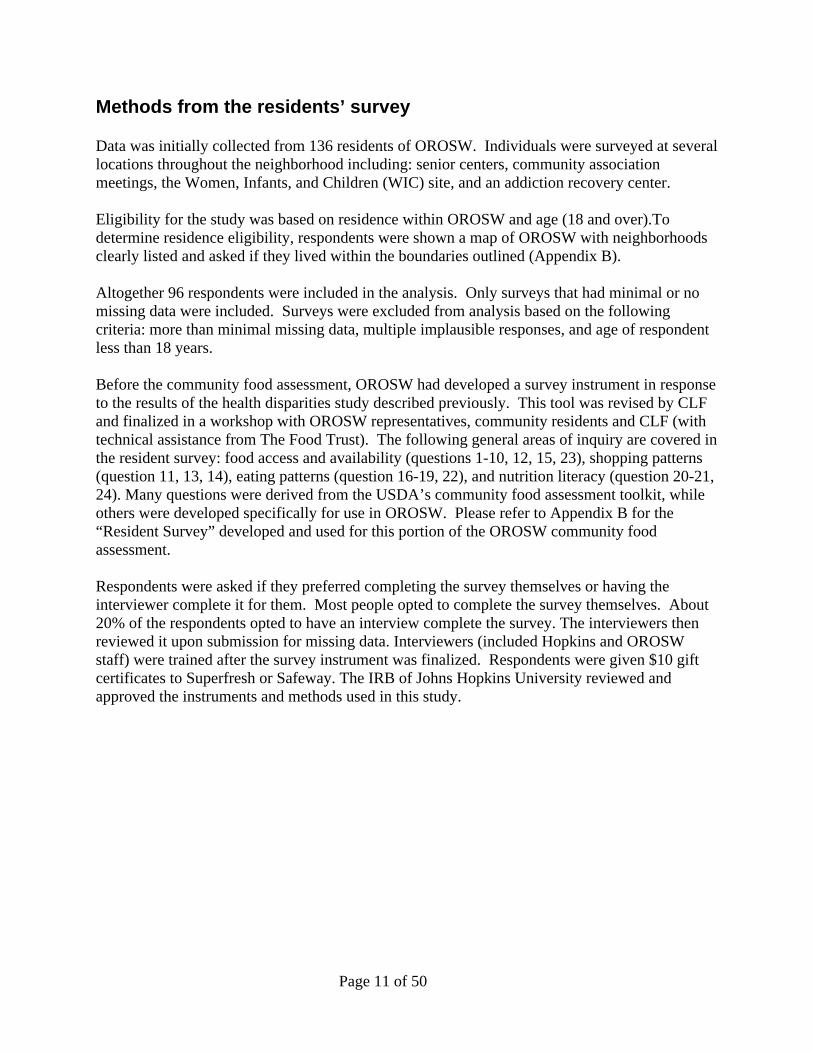
e) BREAD One in five OROSW food stores (8) did not sell any type of bread. On the other hand, 23 stores (more than half of the total) sold only white bread. Only 10 stores, representing 24% of the total, sold a healthy option (i.e. 100% whole wheat). All of those stores also sold white bread. See figure 7. Figure 7: Availability of Bread
Page 11 of 50
Methods from the residents’ survey Data was initially collected from 136 residents of OROSW. Individuals were surveyed at several locations throughout the neighborhood including: senior centers, community association meetings, the Women, Infants, and Children (WIC) site, and an addiction recovery center. Eligibility for the study was based on residence within OROSW and age (18 and over).To determine residence eligibility, respondents were shown a map of OROSW with neighborhoods clearly listed and asked if they lived within the boundaries outlined (Appendix B). Altogether 96 respondents were included in the analysis. Only surveys that had minimal or no missing data were included. Surveys were excluded from analysis based on the following criteria: more than minimal missing data, multiple implausible responses, and age of respondent less than 18 years. Before the community food assessment, OROSW had developed a survey instrument in response to the results of the health disparities study described previously. This tool was revised by CLF and finalized in a workshop with OROSW representatives, community residents and CLF (with technical assistance from The Food Trust). The following general areas of inquiry are covered in the resident survey: food access and availability (questions 1-10, 12, 15, 23), shopping patterns (question 11, 13, 14), eating patterns (question 16-19, 22), and nutrition literacy (question 20-21, 24). Many questions were derived from the USDA’s community food assessment toolkit, while others were developed specifically for use in OROSW. Please refer to Appendix B for the “Resident Survey” developed and used for this portion of the OROSW community food assessment. Respondents were asked if they preferred completing the survey themselves or having the interviewer complete it for them. Most people opted to complete the survey themselves. About 20% of the respondents opted to have an interview complete the survey. The interviewers then reviewed it upon submission for missing data. Interviewers (included Hopkins and OROSW staff) were trained after the survey instrument was finalized. Respondents were given $10 gift certificates to Superfresh or Safeway. The IRB of Johns Hopkins University reviewed and approved the instruments and methods used in this study.
Page 12 of 50
Results from the residents’ survey
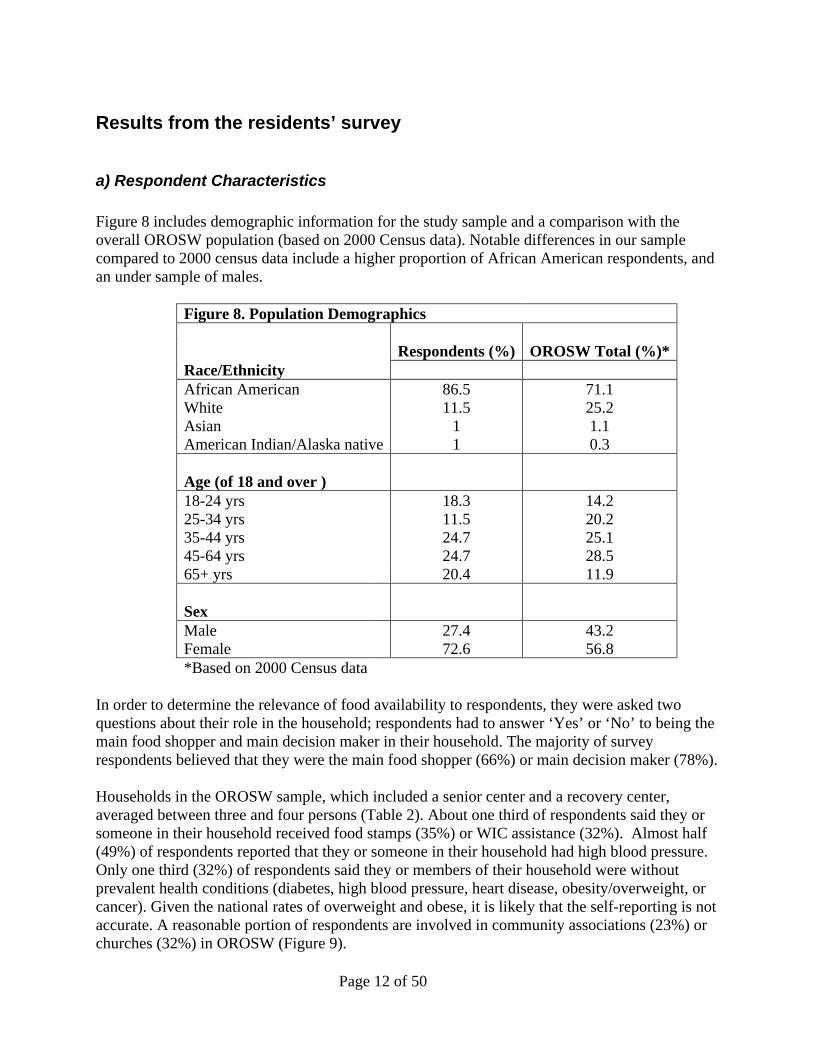
a) Respondent Characteristics Figure 8 includes demographic information for the study sample and a comparison with the overall OROSW population (based on 2000 Census data). Notable differences in our sample compared to 2000 census data include a higher proportion of African American respondents, and an under sample of males.
Figure 8. Population Demographics Respondents (%) OROSW Total (%)* Race/Ethnicity African American 86.5 71.1 White 11.5 25.2 Asian 1 1.1 American Indian/Alaska native 1 0.3 Age (of 18 and over ) 18-24 yrs 18.3 14.2 25-34 yrs 11.5 20.2 35-44 yrs 24.7 25.1 45-64 yrs 24.7 28.5 65+ yrs 20.4 11.9 Sex Male 27.4 43.2 Female 72.6 56.8 *Based on 2000 Census data
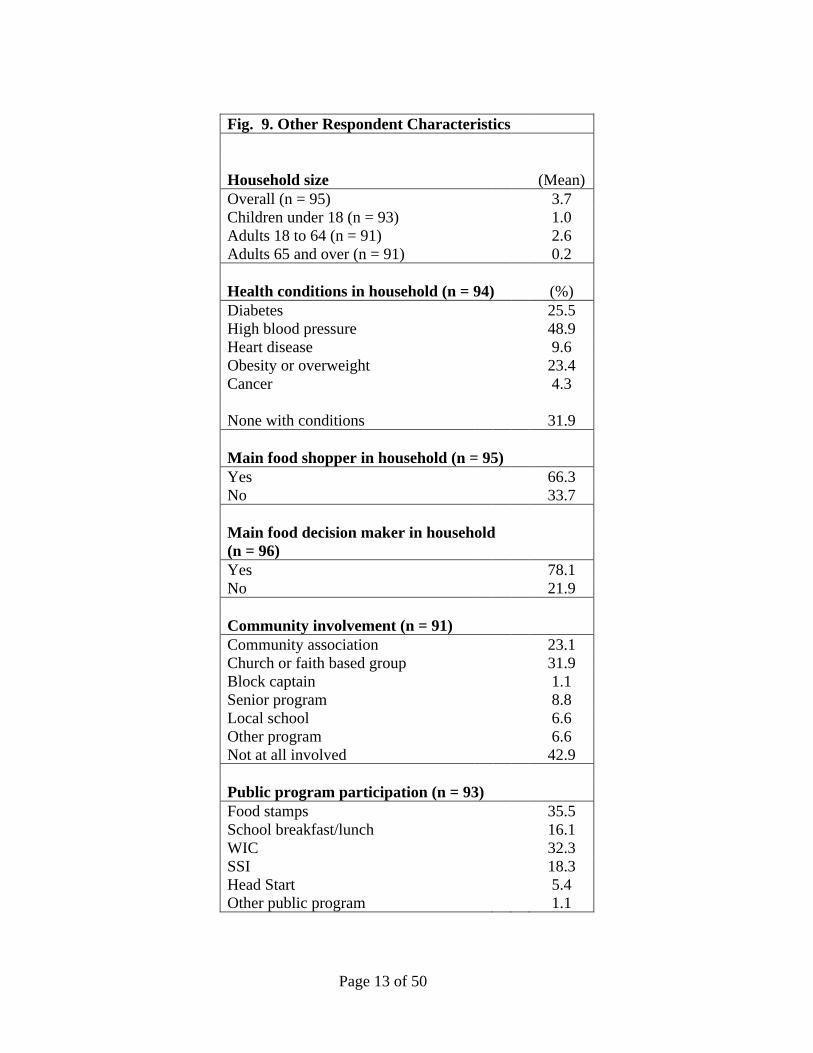
In order to determine the relevance of food availability to respondents, they were asked two questions about their role in the household; respondents had to answer ‘Yes’ or ‘No’ to being the main food shopper and main decision maker in their household. The majority of survey respondents believed that they were the main food shopper (66%) or main decision maker (78%). Households in the OROSW sample, which included a senior center and a recovery center, averaged between three and four persons (Table 2). About one third of respondents said they or someone in their household received food stamps (35%) or WIC assistance (32%). Almost half (49%) of respondents reported that they or someone in their household had high blood pressure. Only one third (32%) of respondents said they or members of their household were without prevalent health conditions (diabetes, high blood pressure, heart disease, obesity/overweight, or cancer). Given the national rates of overweight and obese, it is likely that the self-reporting is not accurate. A reasonable portion of respondents are involved in community associations (23%) or churches (32%) in OROSW (Figure 9).
Page 13 of 50
Fig. 9. Other Respondent Characteristics Household size (Mean) Overall (n = 95) 3.7 Children under 18 (n = 93) 1.0 Adults 18 to 64 (n = 91) 2.6 Adults 65 and over (n = 91) 0.2 Health conditions in household (n = 94) (%) Diabetes 25.5 High blood pressure 48.9 Heart disease 9.6 Obesity or overweight 23.4 Cancer 4.3 None with conditions 31.9 Main food shopper in household (n = 95) Yes 66.3 No 33.7 Main food decision maker in household (n = 96) Yes 78.1 No 21.9 Community involvement (n = 91) Community association 23.1 Church or faith based group 31.9 Block captain 1.1 Senior program 8.8 Local school 6.6 Other program 6.6 Not at all involved 42.9 Public program participation (n = 93) Food stamps 35.5 School breakfast/lunch 16.1 WIC 32.3 SSI 18.3 Head Start 5.4 Other public program 1.1
Page 14 of 50
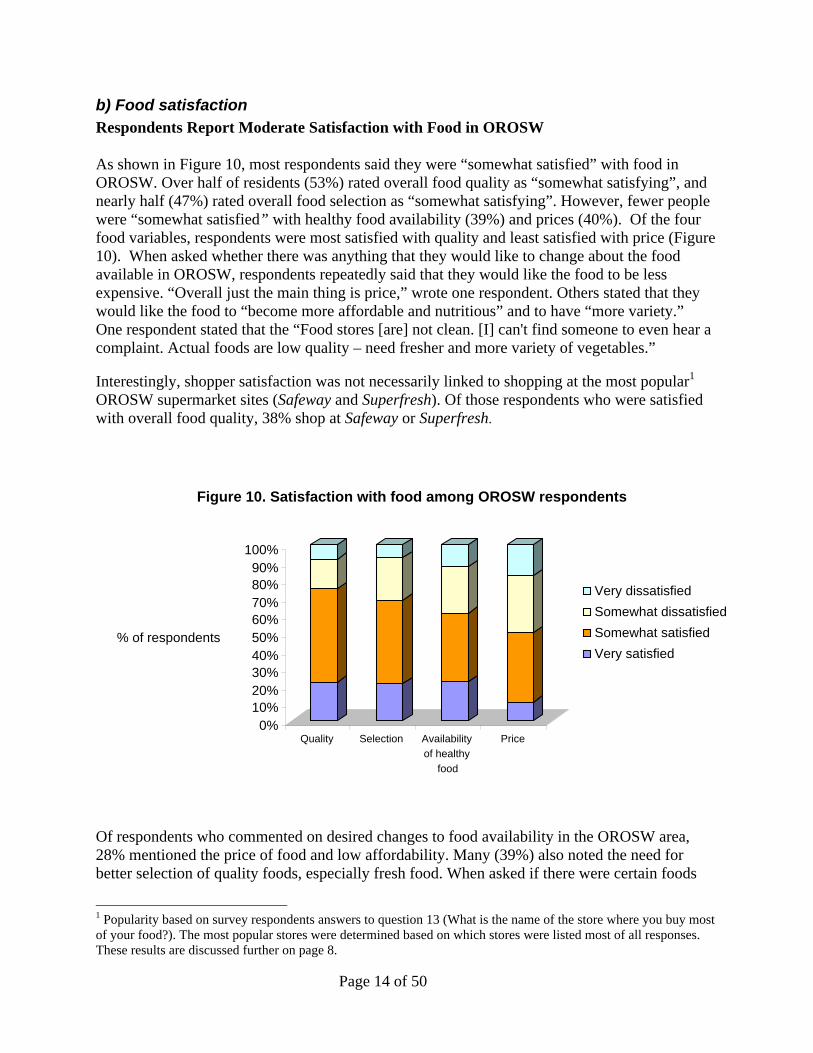
b) Food satisfaction Respondents Report Moderate Satisfaction with Food in OROSW As shown in Figure 10, most respondents said they were “somewhat satisfied” with food in OROSW. Over half of residents (53%) rated overall food quality as “somewhat satisfying”, and nearly half (47%) rated overall food selection as “somewhat satisfying”. However, fewer people were “somewhat satisfied” with healthy food availability (39%) and prices (40%). Of the four food variables, respondents were most satisfied with quality and least satisfied with price (Figure 10). When asked whether there was anything that they would like to change about the food available in OROSW, respondents repeatedly said that they would like the food to be less expensive. “Overall just the main thing is price,” wrote one respondent. Others stated that they would like the food to “become more affordable and nutritious” and to have “more variety.” One respondent stated that the “Food stores [are] not clean. [I] can't find someone to even hear a complaint. Actual foods are low quality – need fresher and more variety of vegetables.” Interestingly, shopper satisfaction was not necessarily linked to shopping at the most popular1 OROSW supermarket sites (Safeway and Superfresh). Of those respondents who were satisfied with overall food quality, 38% shop at Safeway or Superfresh.
Of respondents who commented on desired changes to food availability in the OROSW area, 28% mentioned the price of food and low affordability. Many (39%) also noted the need for better selection of quality foods, especially fresh food. When asked if there were certain foods
1 Popularity based on survey respondents answers to question 13 (What is the name of the store where you buy most of your food?). The most popular stores were determined based on which stores were listed most of all responses. These results are discussed further on page 8.
0% 10% 20% 30% 40% 50% 60% 70% 80% 90%
100%
% of respondents
Quality Selection Availability of healthy
food
Price
Figure 10. Satisfaction with food among OROSW respondents
Very dissatisfied Somewhat dissatisfied Somewhat satisfied Very satisfied
Page 15 of 50
that they would like to buy but can not find, 60% of OROSW respondents reported ‘No.’ Of those that said ‘Yes,’ they most noted that fresh fruits and vegetables and quality meat were not available in the OROSW area. Respondents who felt there were unavailable foods in the OROSW area also suggested improving food selection/freshness (57%) and price (30%) in the OROSW area.
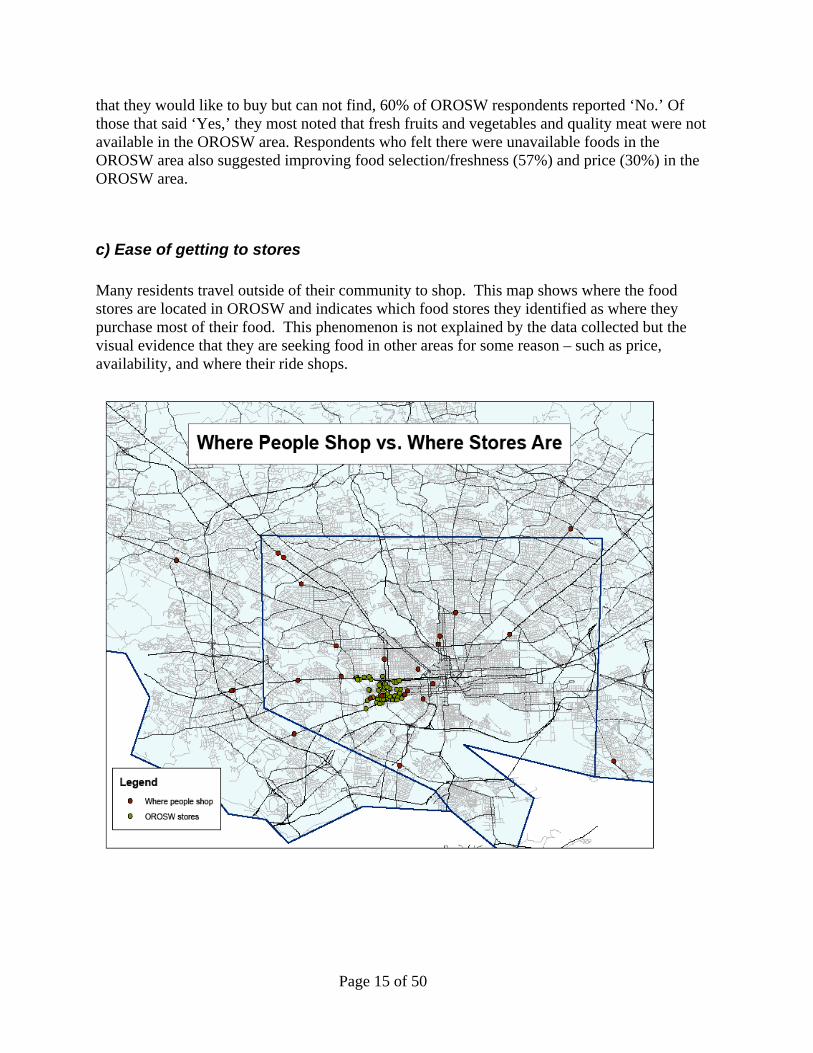
c) Ease of getting to stores
Many residents travel outside of their community to shop. This map shows where the food stores are located in OROSW and indicates which food stores they identified as where they purchase most of their food. This phenomenon is not explained by the data collected but the visual evidence that they are seeking food in other areas for some reason – such as price, availability, and where their ride shops.
Page 16 of 50
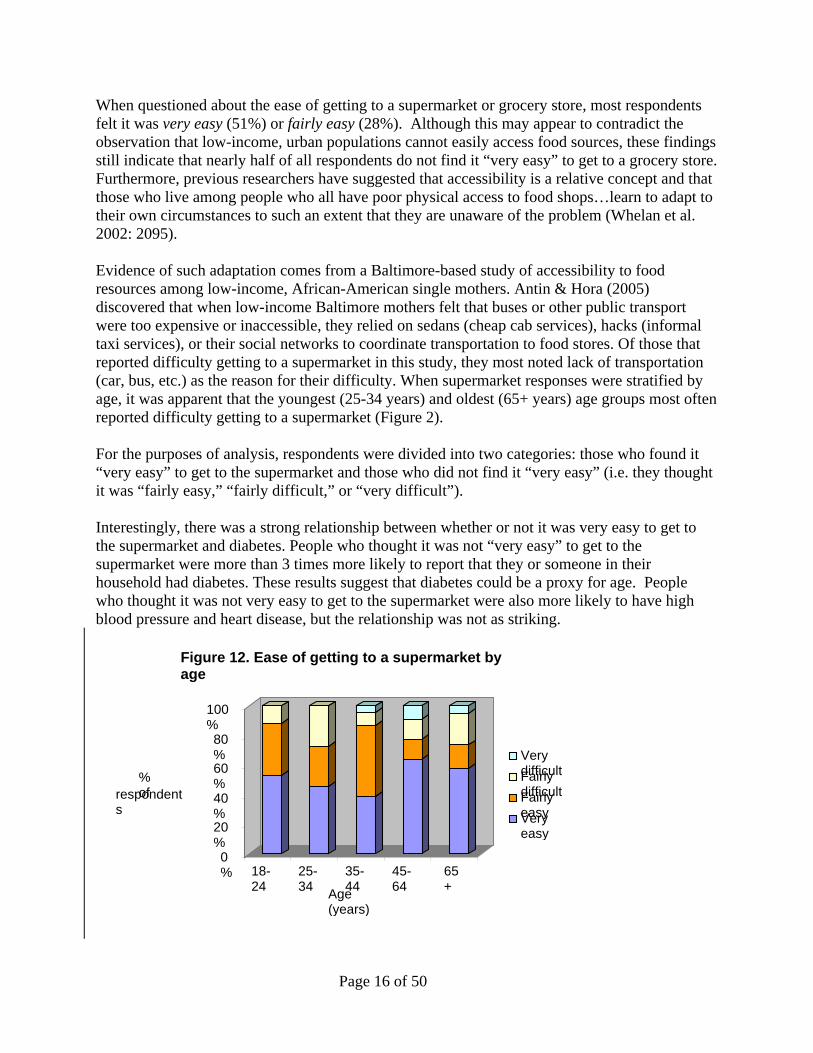
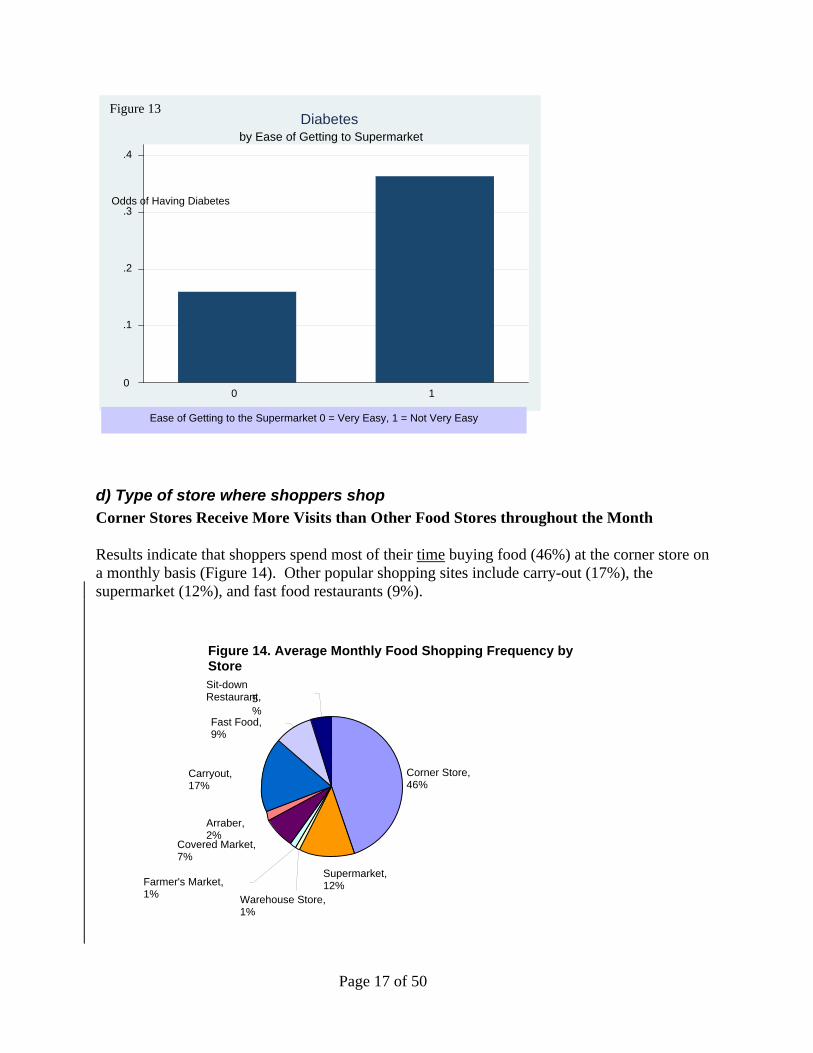
When questioned about the ease of getting to a supermarket or grocery store, most respondents felt it was very easy (51%) or fairly easy (28%). Although this may appear to contradict the observation that low-income, urban populations cannot easily access food sources, these findings still indicate that nearly half of all respondents do not find it “very easy” to get to a grocery store. Furthermore, previous researchers have suggested that accessibility is a relative concept and that those who live among people who all have poor physical access to food shops…learn to adapt to their own circumstances to such an extent that they are unaware of the problem (Whelan et al. 2002: 2095). Evidence of such adaptation comes from a Baltimore-based study of accessibility to food resources among low-income, African-American single mothers. Antin & Hora (2005) discovered that when low-income Baltimore mothers felt that buses or other public transport were too expensive or inaccessible, they relied on sedans (cheap cab services), hacks (informal taxi services), or their social networks to coordinate transportation to food stores. Of those that reported difficulty getting to a supermarket in this study, they most noted lack of transportation (car, bus, etc.) as the reason for their difficulty. When supermarket responses were stratified by age, it was apparent that the youngest (25-34 years) and oldest (65+ years) age groups most often reported difficulty getting to a supermarket (Figure 2). For the purposes of analysis, respondents were divided into two categories: those who found it “very easy” to get to the supermarket and those who did not find it “very easy” (i.e. they thought it was “fairly easy,” “fairly difficult,” or “very difficult”). Interestingly, there was a strong relationship between whether or not it was very easy to get to the supermarket and diabetes. People who thought it was not “very easy” to get to the supermarket were more than 3 times more likely to report that they or someone in their household had diabetes. These results suggest that diabetes could be a proxy for age. People who thought it was not very easy to get to the supermarket were also more likely to have high blood pressure and heart disease, but the relationship was not as striking.
0%
20%
40%
60%
80%
100%
% of respondent
s
18-24
25-34
35-44
45-64
65+ Age
(years)
Figure 12. Ease of getting to a supermarket by age
Very difficult Fairly difficult Fairly easy Very easy
Page 17 of 50
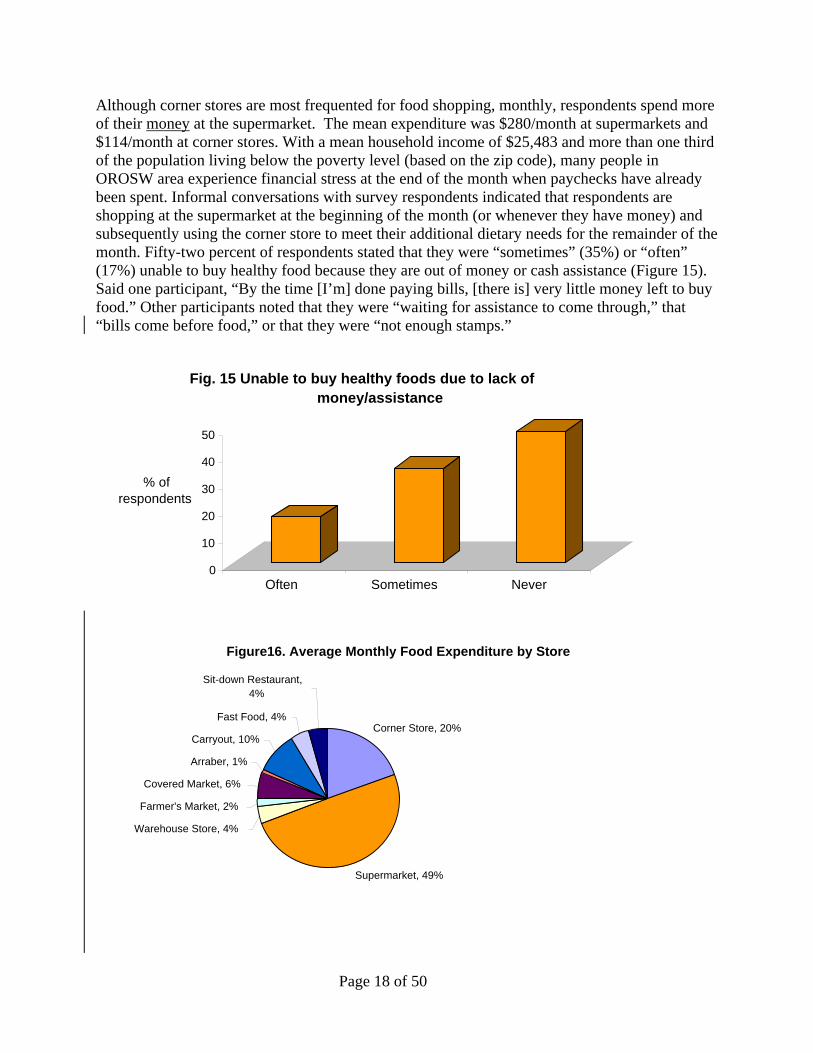
d) Type of store where shoppers shop Corner Stores Receive More Visits than Other Food Stores throughout the Month Results indicate that shoppers spend most of their time buying food (46%) at the corner store on a monthly basis (Figure 14). Other popular shopping sites include carry-out (17%), the supermarket (12%), and fast food restaurants (9%).
Figure 13
0
.1
.2
.3
.4
Odds of Having Diabetes
0 1
by Ease of Getting to Supermarket Diabetes
Figure 14. Average Monthly Food Shopping Frequency by Store
Corner Store, 46%
Covered Market, 7%
Arraber, 2%
Carryout, 17%
Fast Food, 9%
Sit-down Restaurant, 5
%
Warehouse Store, 1%
Farmer's Market, 1%
Supermarket, 12%
Ease of Getting to the Supermarket 0 = Very Easy, 1 = Not Very Easy
Page 18 of 50
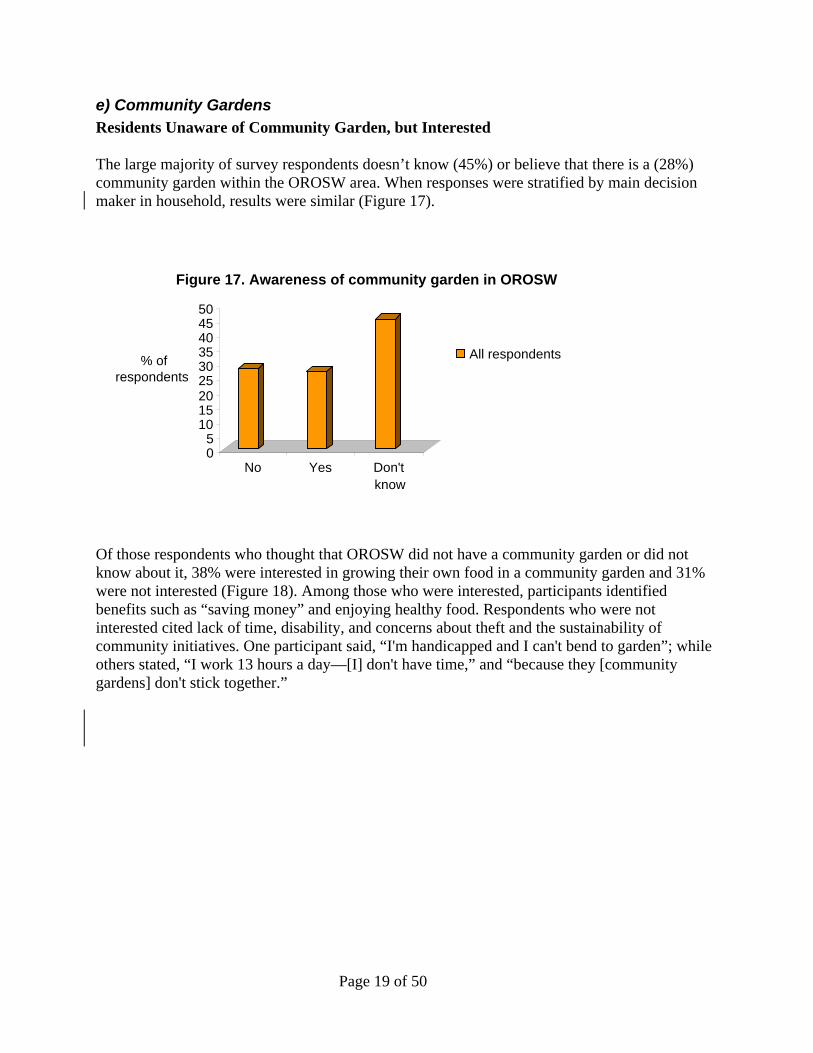
Although corner stores are most frequented for food shopping, monthly, respondents spend more of their money at the supermarket. The mean expenditure was $280/month at supermarkets and $114/month at corner stores. With a mean household income of $25,483 and more than one third of the population living below the poverty level (based on the zip code), many people in OROSW area experience financial stress at the end of the month when paychecks have already been spent. Informal conversations with survey respondents indicated that respondents are shopping at the supermarket at the beginning of the month (or whenever they have money) and subsequently using the corner store to meet their additional dietary needs for the remainder of the month. Fifty-two percent of respondents stated that they were “sometimes” (35%) or “often” (17%) unable to buy healthy food because they are out of money or cash assistance (Figure 15). Said one participant, “By the time [I’m] done paying bills, [there is] very little money left to buy food.” Other participants noted that they were “waiting for assistance to come through,” that “bills come before food,” or that they were “not enough stamps.”
Figure16. Average Monthly Food Expenditure by Store
Corner Store, 20%
Supermarket, 49%
Warehouse Store, 4%
Farmer's Market, 2%
Covered Market, 6%
Arraber, 1%
Carryout, 10%
Fast Food, 4%
Sit-down Restaurant, 4%
0
10
20
30
40
50
% of respondents
Often Sometimes Never
Fig. 15 Unable to buy healthy foods due to lack of money/assistance
Page 19 of 50
e) Community Gardens Residents Unaware of Community Garden, but Interested The large majority of survey respondents doesn’t know (45%) or believe that there is a (28%) community garden within the OROSW area. When responses were stratified by main decision maker in household, results were similar (Figure 17).
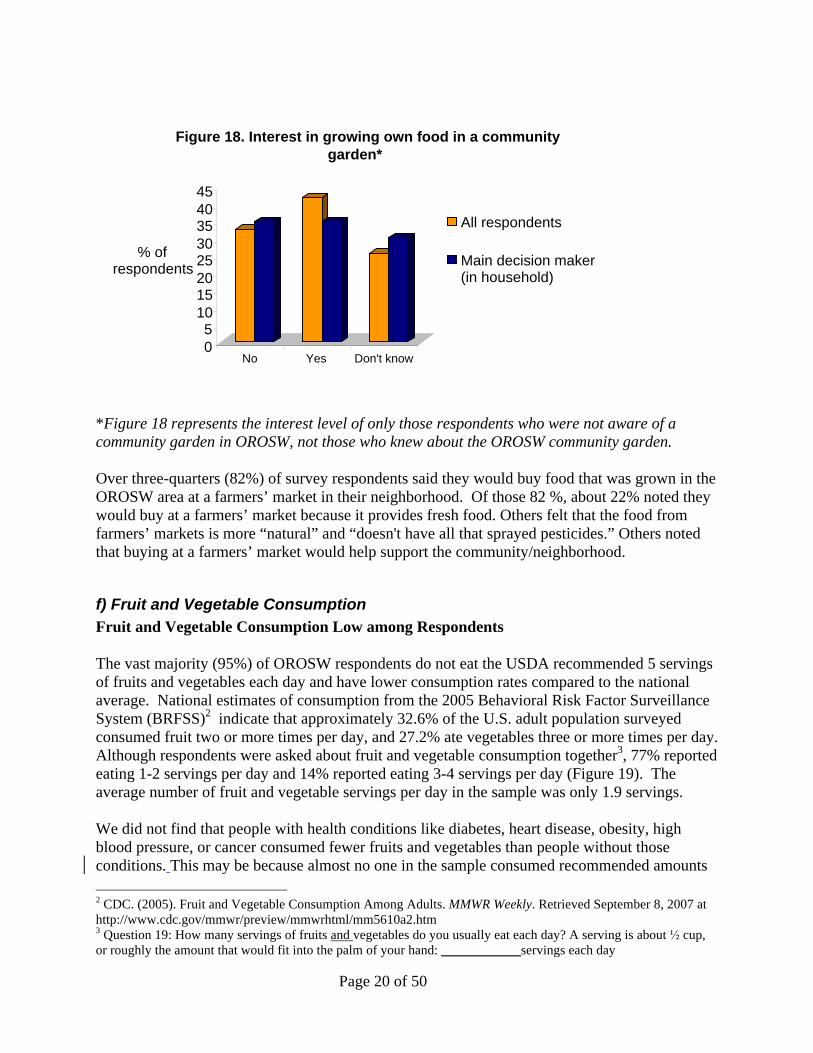
Of those respondents who thought that OROSW did not have a community garden or did not know about it, 38% were interested in growing their own food in a community garden and 31% were not interested (Figure 18). Among those who were interested, participants identified benefits such as “saving money” and enjoying healthy food. Respondents who were not interested cited lack of time, disability, and concerns about theft and the sustainability of community initiatives. One participant said, “I'm handicapped and I can't bend to garden”; while others stated, “I work 13 hours a day—[I] don't have time,” and “because they [community gardens] don't stick together.”
0 5
10 15 20 25 30 35 40 45 50
% of respondents
No Yes Don't know
Figure 17. Awareness of community garden in OROSW
All respondents
Page 20 of 50
*Figure 18 represents the interest level of only those respondents who were not aware of a community garden in OROSW, not those who knew about the OROSW community garden. Over three-quarters (82%) of survey respondents said they would buy food that was grown in the OROSW area at a farmers’ market in their neighborhood. Of those 82 %, about 22% noted they would buy at a farmers’ market because it provides fresh food. Others felt that the food from farmers’ markets is more “natural” and “doesn't have all that sprayed pesticides.” Others noted that buying at a farmers’ market would help support the community/neighborhood.
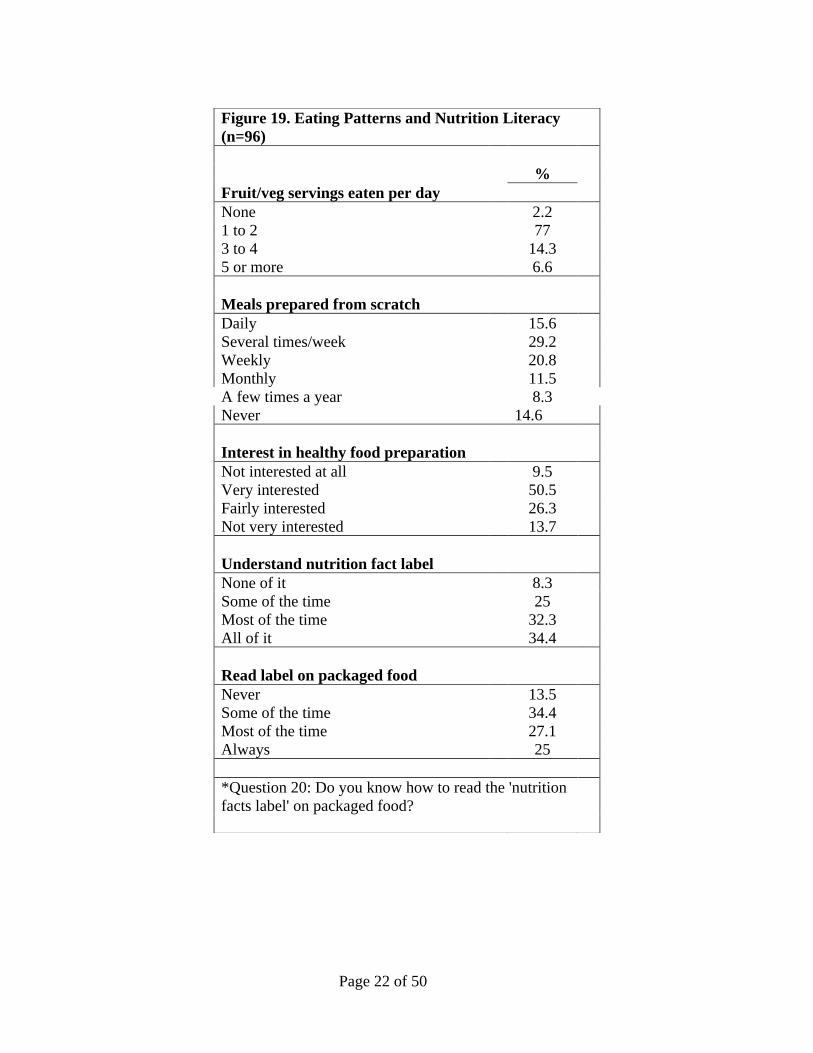
f) Fruit and Vegetable Consumption Fruit and Vegetable Consumption Low among Respondents The vast majority (95%) of OROSW respondents do not eat the USDA recommended 5 servings of fruits and vegetables each day and have lower consumption rates compared to the national average. National estimates of consumption from the 2005 Behavioral Risk Factor Surveillance System (BRFSS)2 indicate that approximately 32.6% of the U.S. adult population surveyed consumed fruit two or more times per day, and 27.2% ate vegetables three or more times per day. Although respondents were asked about fruit and vegetable consumption together3, 77% reported eating 1-2 servings per day and 14% reported eating 3-4 servings per day (Figure 19). The average number of fruit and vegetable servings per day in the sample was only 1.9 servings. We did not find that people with health conditions like diabetes, heart disease, obesity, high blood pressure, or cancer consumed fewer fruits and vegetables than people without those conditions. This may be because almost no one in the sample consumed recommended amounts 2 CDC. (2005). Fruit and Vegetable Consumption Among Adults. MMWR Weekly. Retrieved September 8, 2007 at http://www.cdc.gov/mmwr/preview/mmwrhtml/mm5610a2.htm 3 Question 19: How many servings of fruits and vegetables do you usually eat each day? A serving is about ! cup, or roughly the amount that would fit into the palm of your hand: ____________servings each day
0 5
10 15 20 25 30 35 40 45
% of respondents
No Yes Don't know
Figure 18. Interest in growing own food in a community garden*
All respondents
Main decision maker (in household)
Page 21 of 50
of fruits and vegetables. Respondents who indicated that they or a child in their family participated in the School Breakfast/School Lunch program reported increases of " servings of fruit and vegetables per day over non-School Breakfast/School Lunch participants. However, participation in other public programs, such as Head Start or food stamps, was not associated with increased fruit and vegetable intake.
g) Meal Preparation In terms of meal preparation, many respondents report preparing meals from scratch several times per week (29%) or on a weekly basis (20%) and are very interested (50%) in learning about healthy food preparation. Given the high number of respondents who report preparing meals from scratch, we stratified the data by age (younger or older than 40). Findings indicate that 56% of those under 40 years old prepare meals from scratch several times/week or weekly. About half (55%) of respondents 40 years or older reported preparing meals from scratch daily or several times/week.
Page 22 of 50
Figure 19. Eating Patterns and Nutrition Literacy
(n=96) % Fruit/veg servings eaten per day None 2.2 1 to 2 77 3 to 4 14.3 5 or more 6.6 Meals prepared from scratch Daily 15.6 Several times/week 29.2 Weekly 20.8 Monthly 11.5 A few times a year 8.3 Never 14.6 Interest in healthy food preparation Not interested at all 9.5 Very interested 50.5 Fairly interested 26.3 Not very interested 13.7 Understand nutrition fact label None of it 8.3 Some of the time 25 Most of the time 32.3 All of it 34.4 Read label on packaged food Never 13.5 Some of the time 34.4 Most of the time 27.1 Always 25 *Question 20: Do you know how to read the 'nutrition facts label' on packaged food?
Page 23 of 50
Most respondents stated they knew how to read all (34%) or most (32%) of nutrition facts labels and generally reported using the knowledge to read labels on purchased food some of the time (34%), or most of the time (27%) (Table 4). Respondents reported looking at transfat, cholesterol, sugar, sodium, and caloric values, sometimes with the intention of meeting special dietary needs of a family member. Over half (60%) of respondents strongly agree that health is related to eating. When asked if there was anything they would like to change about their eating, 67% responded ‘yes’. Respondents noted a variety of changes that they would like to make in their eating; the largest group of responses addressed eating fewer fatty, greasy foods (13%). Some commented about changing their diets with the intent to reduce negative health outcomes, for example by “try[ing] to eat healthy foods low in sodium to prevent high blood pressure.” About 10% of respondents wanted to incorporate more fruits and vegetables into their diet. One respondent stated wanting to “eat more fruit, leave the junk food out of my diet.” While several respondents expressed a desire to “eat less food” or “smaller portions,” others responses suggested a problem of malnutrition: “I should eat 3 meals a day. I sometimes eat only 2 or 1.”
Limitations The sampling may have misrepresented the OROSW population. Compared to the 2000 Census data, certain segments of the OROSW population were underrepresented in the food assessment. The OROSW sample had fewer whites, people aged 25-34, and males than the 2000 Census. Selection bias in sampling is possible. First, the survey was conducted in places where people were gathered and thus would have missed people who were not at the public sites where the surveys were handed out. The sample was biased towards those participating in community association meeting, those using senior centers, WIC participants and drug treatment sites. There was also likely selection bias in those willing to fill in the survey, including based on having time to do so and literacy levels. An additional limitation is that approximately 30% of completed surveys were not included in the final analysis due to missing or substantially inappropriate responses. Respondents were asked if they wanted to complete the survey themselves or to have a data collector record the information. Most people opted to complete the survey themselves. Assuring the surveys were completed was especially difficult at the WIC sites; respondents were returning them simultaneously and the data collector did not always have time to review every page. In the future, having at least two data collectors at each site would help ensure adequate respondent understanding and survey completion. Particularly given the use of data collectors for many of the surveys, social desirability bias is an additional concern. Finally, the small sample size made it challenging to assess statistical significance and to stratify on most variables.
Page 24 of 50
Key Findings, Discussion and Recommendations A number of promising approaches exist to help improve health outcomes in the OROSW area and in Baltimore City overall. These approaches include: increasing community capacity to improve food access and nutrition, increasing utilization of supermarkets, farmers’ markets, and community gardens in low-income neighborhoods, increasing coordination/integration of public and private health and nutrition services in food distribution programs, and creating greater demand for increased consumption of fruits and vegetables and improvement of other healthy eating habits. 1. Finding: Respondents Report Moderate Satisfaction with Food in the OROSW area. Recommendation: Residents’ stated satisfaction with the food in their neighborhood may reflect the impact of their overall food environment on their expectations. As discussed above, if one resides in a neighborhood with few healthy food options, expectations may commensurate according to what is available. Someone who ordinarily shops in a food store where a variety of fresh fruits and vegetables are regularly available might be less satisfied with the food in OROSW. Satisfaction may also be related to the number of supermarkets in the neighborhood. Unlike many urban neighborhoods, the OROSW area has two chain markets – Safeway (right outside the OROSW area) and SuperFresh, within the OROSW neighborhoods. Initiatives are needed to increase demand for healthy food and to increase expectations of what is an acceptable food market. Health communication initiatives can reach out to residents through a variety of channels including community groups, health facilities, schools, and churches. Illustrative messages could include how to request healthy foods from your food store and how community groups and organizations can support those stores that are providing nutritious food. Messages can also focus on the benefits of changing one’s diet and how good nutrition can improve health outcomes. 2. Finding: Corner Stores Receive More Visits than Other Food Stores throughout the Month Recommendation: Although the supermarkets capture most consumer dollars in OROSW, the corner stores were a close second and remain the location residents frequent most often. As discussed earlier, when money becomes tight at the end of the month, corner stores, with lower prices, may be the store of choice to fill in the food gaps. Creating healthy corner stores can improve the overall food environment. Dr. Joel Gittelsohn started the Baltimore Healthy Stores program in East Baltimore several years ago. That program engages Korean corner store owners and supermarkets in the inner city to offer healthier food options and to promote them at the point of purchase using culturally appropriate materials and strategies. Dr. Gittelsohn has expanded the program to west Baltimore and included non-Korean owners as well. Since this food assessment, OROSW and CLF have approached and identified several corner stores that are interested in participating in a healthy corner store program. Providing them with technical expertise in improving their stores would ultimately benefit the neighborhoods and the store owners.
Page 25 of 50
3. Finding: Residents Unaware of Community Garden but Interested Recommendation: The community garden in OROSW is a relatively new development and has been positioned as an intergenerational project. Young and old work together to plan, plant, weed and harvest the garden. Given the level of interest in the garden, it could be promoted in a more aggressive manner to gain greater participation. Urban agriculture is one response to increasing local healthy food consumption, and also increases the amount of green space in cities. Eighty-two percent of respondents said they would purchase food grown in OROSW. The OROSW gardening club has expressed interesting in selling some of their produce at a farm stand, but they don’t have the volume or food safety/storage infrastructure necessary yet. Knowing there is high demand could encourage gardeners to plan for larger production in the next growing season. Community gardens also provide a source of fresh food in the community, and OROSW residents have shown an interest in growing their own food in such a garden. To encourage growing, gardens should be placed in a safe location and residents should be aware of the location of gardens while having easy access to them. During the Maryland growing season, farmers’ markets directly improve food access to community residents by setting up a location in which farmers sell, on a weekly basis, fresh fruits and vegetables that are locally grown. Markets provide high quality, fresh foods that both increase access to healthy food choices and provide an opportunity to educate people, through a variety of methods, about the importance of eating at least five fruits and vegetables a day. They also provide a certified site for WIC participants to utilize their WIC farmers' market coupons and seniors to redeem their Senior Farmers’ Market Nutrition Program Vouchers. Currently, there are no farmer’s markets located in the OROSW area. While starting farmer’s markets can prove to be financially difficult, there may be merit in exploring the possibility of having a small market to generate demand. 4. Finding: Fruit and Vegetable Consumption Low among Respondents Recommendation: Many cities struggle to improve access to healthy foods only to have projects fail because a simultaneous effort to create demand for the food had not been considered. The Baltimore City Health Department and other stakeholders could partner to create a campaign which promotes the health of OROSW residents through better nutrition. The campaign could provide food and nutrition education, increase knowledge of the benefits of eating fruits and vegetables, promote positive images of shopping, cooking and eating fruits and vegetables, increase perceived social pressure, and increase perceived behavioral control through the combined effect of repeated visits to the farmers’ markets, repeated contacts with peer educators and health educators both at the farmers’ markets and at community organizations and institutions throughout the community. Specific target audiences need to be identified in order to tailor the campaign materials appropriately. Coupling these opportunities with education provides great potential for increasing fruit and vegetable consumption and thereby contributing to the improvement of health outcomes in OROSW.
Page 26 of 50
5. Finding: Sixty percent of respondents strongly agreed that health is related to eating, and
67% said they personally wanted to change something about the way they eat.
Recommendation: This recommendation specifically relates to how any social marketing or health communication messages should be crafted for these audiences. The majority of the respondents understood that eating and health are connected so encouraging people to change their eating could focus on the specific health benefits one gets from consuming a healthy diet. In addition, many of these are seeking a change in their own diet. Some of these changes included eating less greasy or fatty foods, and incorporating more fruits and vegetables. Identifying neighborhood champions who have been able to make a change in their diet for positive results is one strategy to motivate people to make changes. In addition, 50% of respondents were very interested and 26% were fairly interested in looking how to prepare healthy food. OROSW could conduct a nutrition education outreach program that could include cooking demos, simple recipes, making available foods (corner store) healthier. 6. Finding: Residents who experience difficulty getting to the supermarket are more likely to
experience diabetes, high blood pressure, and heart disease than those who find it very easy to get to the supermarket.
Recommendation: Having easy access to healthy food undeniably impacts health. Further research regarding how OROSW residents get to the supermarket might shed light on how transportation ease impacts health. Understanding how residents access food sources, and identifying barriers that respondents might be aware of, would allow CLF and OROSW to design interventions that facilitate access to healthy foods for people who cannot very easily get to the supermarket.
Overall Recommendation The issues that emerged from the food assessment are not unique to the OROSW neighborhood. Several areas in Baltimore suffer from a similar lack of food options. The Baltimore City Dept of Health and Dept. of Planning are forming a food policy task force to examine the feasibility of establishing a food policy council for Baltimore City. The task force members hail from various sectors – community, non-profit, universities – that are interested and working on food system issues. Staring in September 2008, the members will meet and draft a report that will include recommendations for policy changes, community engagement and the role of the private sector in improving access to and demand for healthier foods in Baltimore neighborhoods. In addition to city government’s commitment to improving the food environments, citizens need to be engaged in the identification of community needs and resources. Communities’ would benefit from establishing mechanisms for regular communication with the Food Policy Task Force and by providing support for community organizations in identifying new resources and community services (e.g., providing contacts with untapped community assets such as business leaders in the food industry and other small neighborhood enterprises).
Page 27 of 50
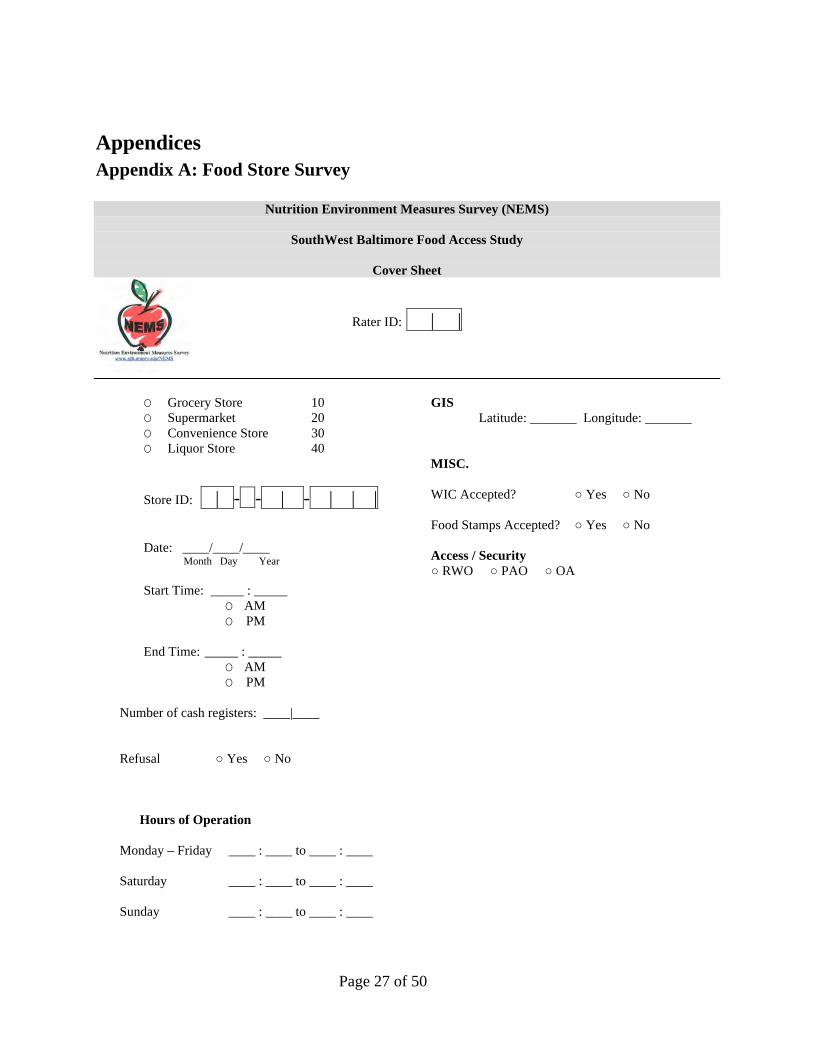
Appendices Appendix A: Food Store Survey
Nutrition Environment Measures Survey (NEMS)
SouthWest Baltimore Food Access Study
Cover Sheet
Rater ID: | |
O Grocery Store 10 O Supermarket 20 O Convenience Store 30 O Liquor Store 40
Store ID: | - - | - | | | Date: ____/____/____
Month Day Year
Start Time: _____ : _____ O AM O PM
End Time: _____ : _____
O AM O PM
Number of cash registers: ____|____ Refusal # Yes # No
Hours of Operation Monday – Friday ____ : ____ to ____ : ____ Saturday ____ : ____ to ____ : ____ Sunday ____ : ____ to ____ : ____
GIS Latitude: _______ Longitude: _______ MISC. WIC Accepted? # Yes # No Food Stamps Accepted? # Yes # No Access / Security # RWO # PAO # OA

Page 28 of 50
Comments: ____________________________________________________________________________ ______________________________________________________________________________________ ______________________________________________________________________________________ ______________________________________________________________________________________
Page 29 of 50
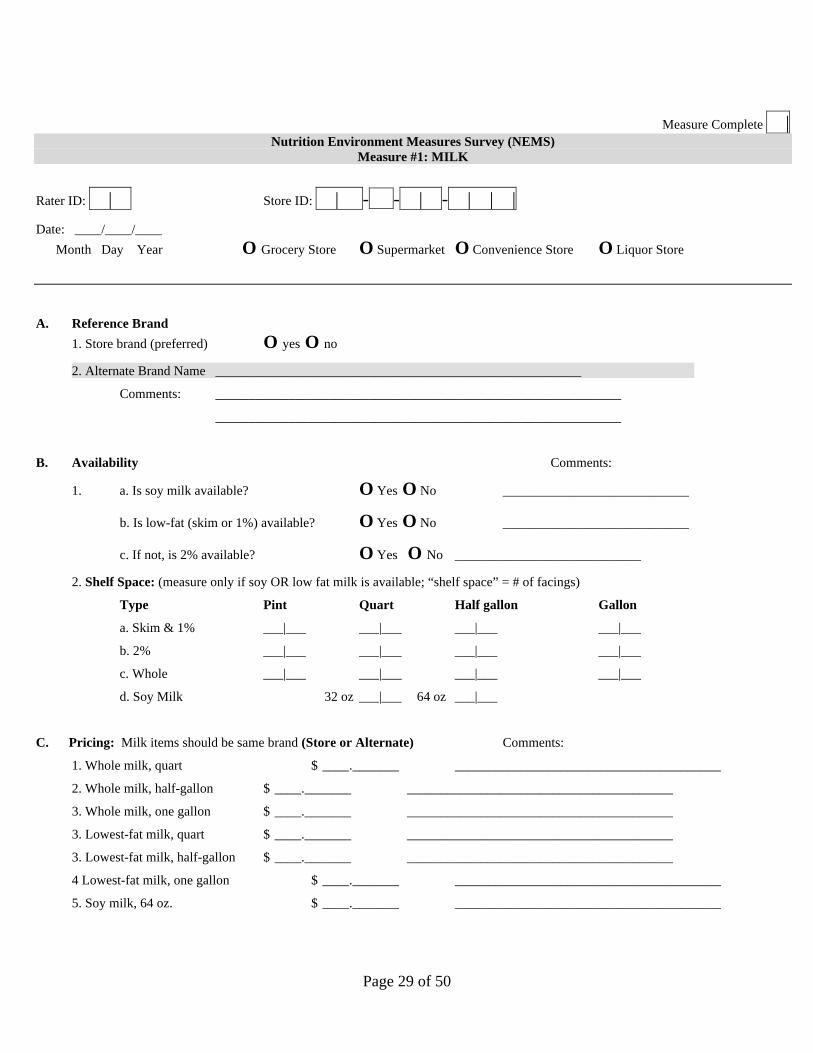
Measure Complete |
Nutrition Environment Measures Survey (NEMS) Measure #1: MILK
Rater ID: | Store ID: | - - | - | | | Date: ____/____/____ Month Day Year O Grocery Store O Supermarket O Convenience Store O Liquor Store
A. Reference Brand
1. Store brand (preferred) O yes O no
2. Alternate Brand Name _______________________________________________________ Comments: _____________________________________________________________
_____________________________________________________________
B. Availability Comments:
1. a. Is soy milk available? O Yes O No ____________________________
b. Is low-fat (skim or 1%) available? O Yes O No ____________________________
c. If not, is 2% available? O Yes O No ____________________________
2. Shelf Space: (measure only if soy OR low fat milk is available; “shelf space” = # of facings)
Type Pint Quart Half gallon Gallon
a. Skim & 1% ___|___ ___|___ ___|___ ___|___
b. 2% ___|___ ___|___ ___|___ ___|___
c. Whole ___|___ ___|___ ___|___ ___|___
d. Soy Milk 32 oz ___|___ 64 oz ___|___
C. Pricing: Milk items should be same brand (Store or Alternate) Comments:
1. Whole milk, quart $ ____._______ ________________________________________
2. Whole milk, half-gallon $ ____._______ ________________________________________
3. Whole milk, one gallon $ ____._______ ________________________________________
3. Lowest-fat milk, quart $ ____._______ ________________________________________
3. Lowest-fat milk, half-gallon $ ____._______ ________________________________________
4 Lowest-fat milk, one gallon $ ____._______ ________________________________________
5. Soy milk, 64 oz. $ ____._______ ________________________________________
Page 30 of 50
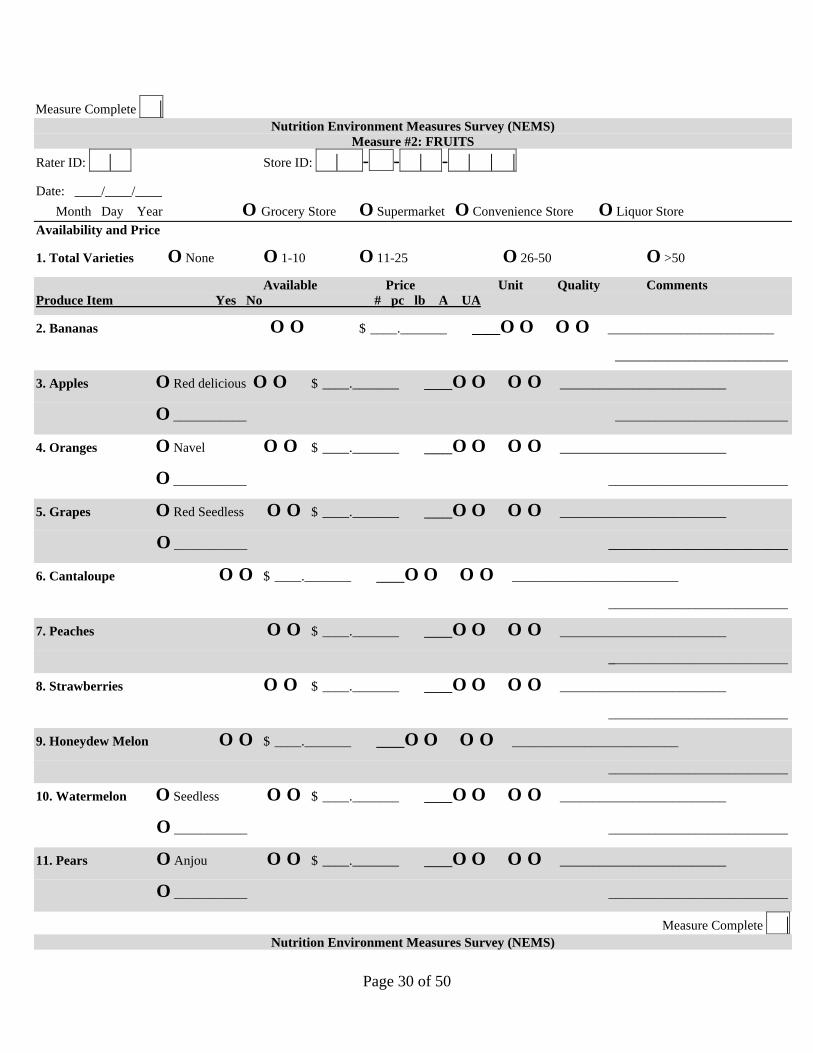
Measure Complete | Nutrition Environment Measures Survey (NEMS)
Measure #2: FRUITS Rater ID: | Store ID: | - - | - | | | Date: ____/____/____ Month Day Year O Grocery Store O Supermarket O Convenience Store O Liquor Store Availability and Price
1. Total Varieties O None O 1-10 O 11-25 O 26-50 O >50
Available Price Unit Quality Comments Produce Item Yes No # pc lb A UA
2. Bananas O O $ ____._______ ___O O O O _________________________
__________________________
3. Apples O Red delicious O O $ ____._______ ___O O O O _________________________
O ___________ __________________________
4. Oranges O Navel O O $ ____._______ ___O O O O _________________________
O ___________ ___________________________
5. Grapes O Red Seedless O O $ ____._______ ___O O O O _________________________
O ___________ ___________________________
6. Cantaloupe O O $ ____._______ ___O O O O _________________________
___________________________
7. Peaches O O $ ____._______ ___O O O O _________________________
___________________________
8. Strawberries O O $ ____._______ ___O O O O _________________________
___________________________
9. Honeydew Melon O O $ ____._______ ___O O O O _________________________
___________________________
10. Watermelon O Seedless O O $ ____._______ ___O O O O _________________________
O ___________ ___________________________
11. Pears O Anjou O O $ ____._______ ___O O O O _________________________
O ___________ ___________________________
Measure Complete | Nutrition Environment Measures Survey (NEMS)
Page 31 of 50
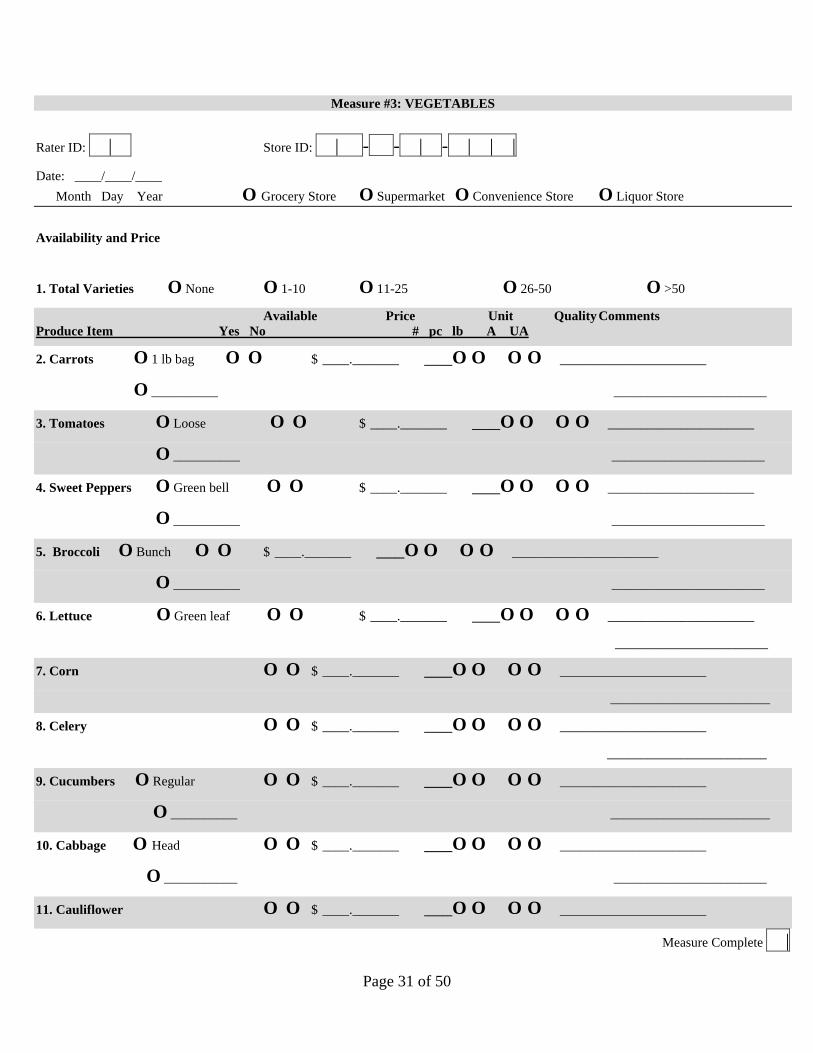
Measure #3: VEGETABLES
Rater ID: | Store ID: | - - | - | | | Date: ____/____/____ Month Day Year O Grocery Store O Supermarket O Convenience Store O Liquor Store
Availability and Price
1. Total Varieties O None O 1-10 O 11-25 O 26-50 O >50
Available Price Unit Quality Comments Produce Item Yes No # pc lb A UA
2. Carrots O 1 lb bag O O $ ____._______ ___O O O O ______________________
O __________ _______________________
3. Tomatoes O Loose O O $ ____._______ ___O O O O ______________________
O __________ _______________________
4. Sweet Peppers O Green bell O O $ ____._______ ___O O O O ______________________
O __________ _______________________
5. Broccoli O Bunch O O $ ____._______ ___O O O O ______________________
O __________ _______________________
6. Lettuce O Green leaf O O $ ____._______ ___O O O O ______________________
_______________________
7. Corn O O $ ____._______ ___O O O O ______________________
________________________
8. Celery O O $ ____._______ ___O O O O ______________________
________________________
9. Cucumbers O Regular O O $ ____._______ ___O O O O ______________________
O __________ ________________________
10. Cabbage O Head O O $ ____._______ ___O O O O ______________________
O ___________ _______________________
11. Cauliflower O O $ ____._______ ___O O O O ______________________
Measure Complete |
Page 32 of 50
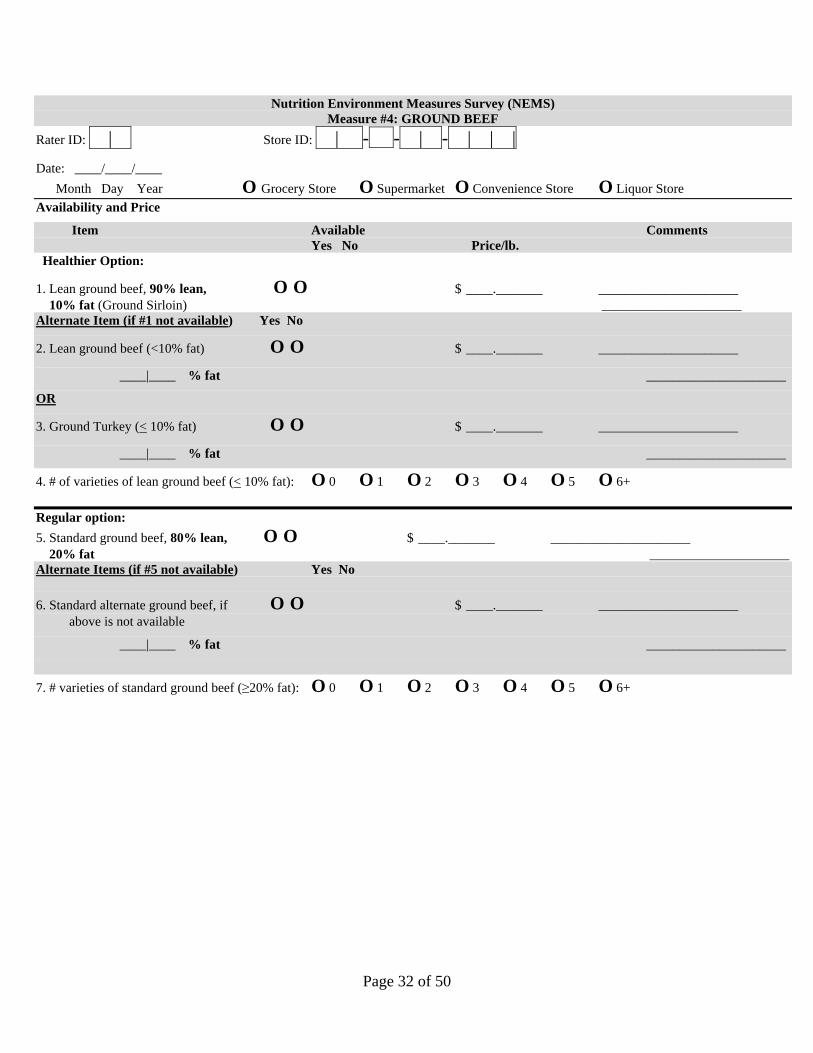
Nutrition Environment Measures Survey (NEMS) Measure #4: GROUND BEEF
Rater ID: | Store ID: | - - | - | | | Date: ____/____/____ Month Day Year O Grocery Store O Supermarket O Convenience Store O Liquor Store Availability and Price
Item Available Comments Yes No Price/lb. Healthier Option:
1. Lean ground beef, 90% lean, O O $ ____._______ _____________________ 10% fat (Ground Sirloin) _____________________ Alternate Item (if #1 not available) Yes No
2. Lean ground beef (<10% fat) O O $ ____._______ _____________________ ____|____ % fat _____________________
OR
3. Ground Turkey (< 10% fat) O O $ ____._______ _____________________ ____|____ % fat _____________________
4. # of varieties of lean ground beef (< 10% fat): O 0 O 1 O 2 O 3 O 4 O 5 O 6+ Regular option: 5. Standard ground beef, 80% lean, O O $ ____._______ _____________________ 20% fat _____________________ Alternate Items (if #5 not available) Yes No 6. Standard alternate ground beef, if O O $ ____._______ _____________________ above is not available
____|____ % fat _____________________
7. # varieties of standard ground beef ($20% fat): O 0 O 1 O 2 O 3 O 4 O 5 O 6+
Page 33 of 50
Measure Complete |
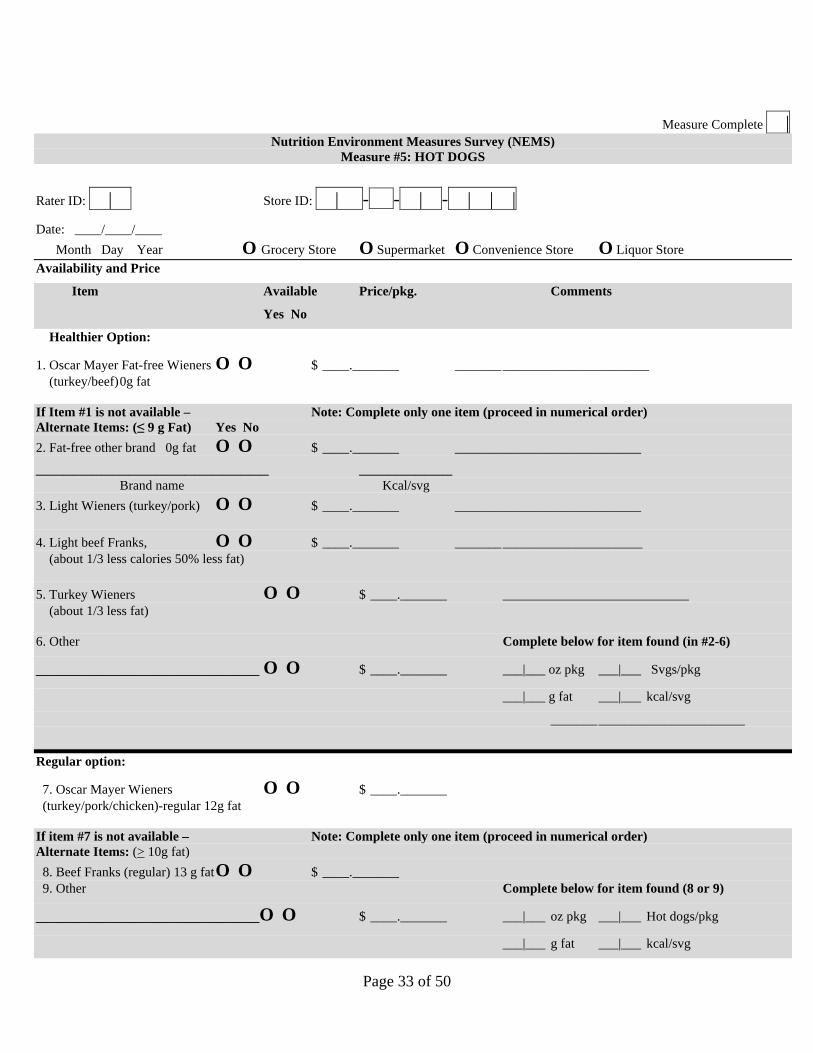
Nutrition Environment Measures Survey (NEMS) Measure #5: HOT DOGS
Rater ID: | Store ID: | - - | - | | | Date: ____/____/____ Month Day Year O Grocery Store O Supermarket O Convenience Store O Liquor Store Availability and Price
Item Available Price/pkg. Comments
Yes No
Healthier Option:
1. Oscar Mayer Fat-free Wieners O O $ ____._______ _______ ______________________ (turkey/beef) 0g fat If Item #1 is not available – Note: Complete only one item (proceed in numerical order) Alternate Items: (! 9 g Fat) Yes No 2. Fat-free other brand 0g fat O O $ ____._______ ____________________________ _________________________ __________ Brand name Kcal/svg 3. Light Wieners (turkey/pork) O O $ ____._______ ____________________________ 4. Light beef Franks, O O $ ____._______ _______ _____________________ (about 1/3 less calories 50% less fat) 5. Turkey Wieners O O $ ____._______ ____________________________ (about 1/3 less fat) 6. Other Complete below for item found (in #2-6)
________________________ O O $ ____._______ ___|___ oz pkg ___|___ Svgs/pkg ___|___ g fat ___|___ kcal/svg _______ ______________________ Regular option:
7. Oscar Mayer Wieners O O $ ____._______ (turkey/pork/chicken)-regular 12g fat If item #7 is not available – Note: Complete only one item (proceed in numerical order) Alternate Items: (> 10g fat) 8. Beef Franks (regular) 13 g fat O O $ ____._______ 9. Other Complete below for item found (8 or 9)
________________________O O $ ____._______ ___|___ oz pkg ___|___ Hot dogs/pkg ___|___ g fat ___|___ kcal/svg
Page 34 of 50
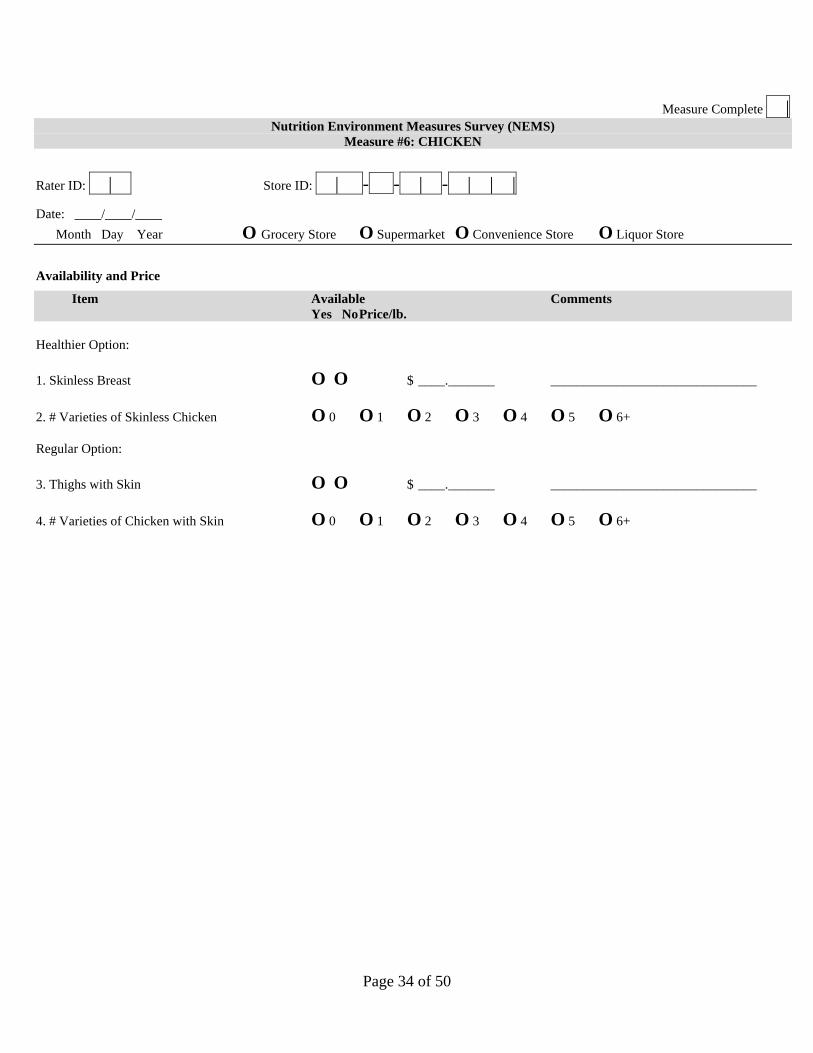
Measure Complete | Nutrition Environment Measures Survey (NEMS)
Measure #6: CHICKEN
Rater ID: | Store ID: | - - | - | | | Date: ____/____/____ Month Day Year O Grocery Store O Supermarket O Convenience Store O Liquor Store
Availability and Price
Item Available Comments Yes No Price/lb. Healthier Option: 1. Skinless Breast O O $ ____._______ _______________________________ 2. # Varieties of Skinless Chicken O 0 O 1 O 2 O 3 O 4 O 5 O 6+ Regular Option: 3. Thighs with Skin O O $ ____._______ _______________________________ 4. # Varieties of Chicken with Skin O 0 O 1 O 2 O 3 O 4 O 5 O 6+
Page 35 of 50
Measure Complete |
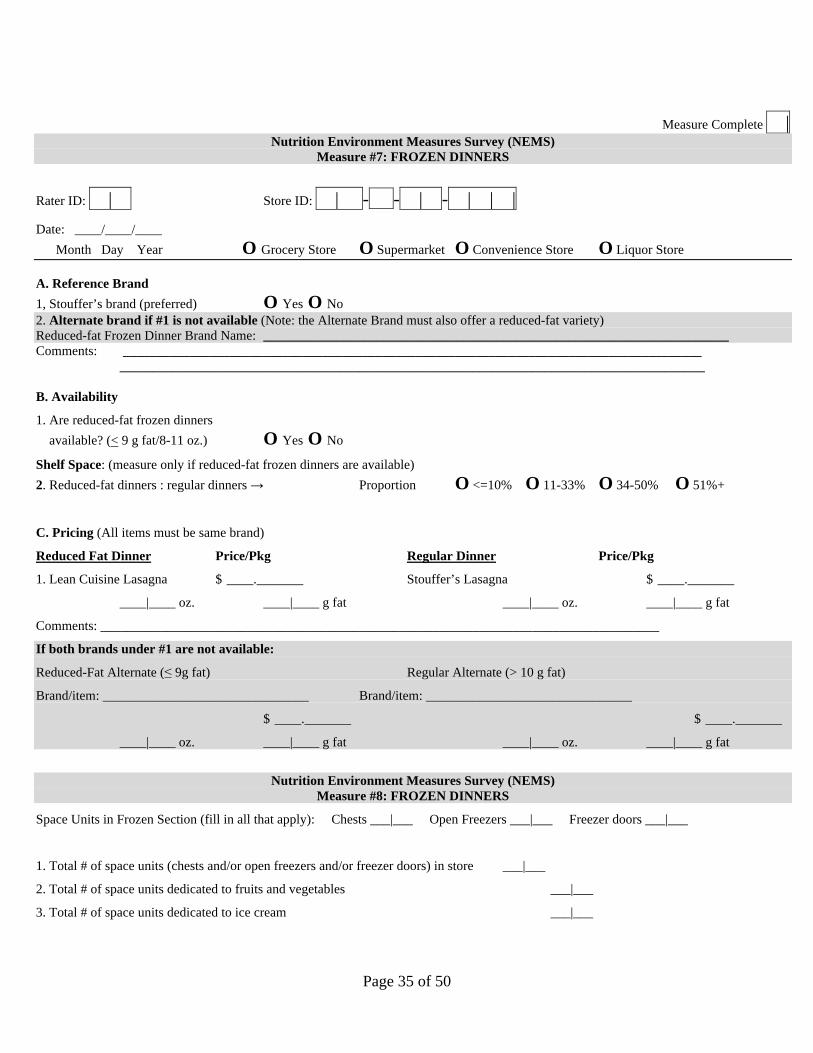
Nutrition Environment Measures Survey (NEMS) Measure #7: FROZEN DINNERS
Rater ID: | Store ID: | - - | - | | | Date: ____/____/____ Month Day Year O Grocery Store O Supermarket O Convenience Store O Liquor Store A. Reference Brand 1, Stouffer’s brand (preferred) O Yes O No 2. Alternate brand if #1 is not available (Note: the Alternate Brand must also offer a reduced-fat variety) Reduced-fat Frozen Dinner Brand Name: ______________________________________________________________________ Comments: _______________________________________________________________________________________ ________________________________________________________________________________________ B. Availability
1. Are reduced-fat frozen dinners available? (< 9 g fat/8-11 oz.) O Yes O No
Shelf Space: (measure only if reduced-fat frozen dinners are available) 2. Reduced-fat dinners : regular dinners % Proportion O <=10% O 11-33% O 34-50% O 51%+
C. Pricing (All items must be same brand)
Reduced Fat Dinner Price/Pkg Regular Dinner Price/Pkg
1. Lean Cuisine Lasagna $ ____._______ Stouffer’s Lasagna $ ____._______
____|____ oz. ____|____ g fat ____|____ oz. ____|____ g fat
Comments: ____________________________________________________________________________________
If both brands under #1 are not available:
Reduced-Fat Alternate (& 9g fat) Regular Alternate (> 10 g fat)
Brand/item: _______________________________ Brand/item: _______________________________
$ ____._______ $ ____._______
____|____ oz. ____|____ g fat ____|____ oz. ____|____ g fat
Nutrition Environment Measures Survey (NEMS)
Measure #8: FROZEN DINNERS
Space Units in Frozen Section (fill in all that apply): Chests ___|___ Open Freezers ___|___ Freezer doors ___|___
1. Total # of space units (chests and/or open freezers and/or freezer doors) in store ___|___
2. Total # of space units dedicated to fruits and vegetables ___|___
3. Total # of space units dedicated to ice cream ___|___
Page 36 of 50
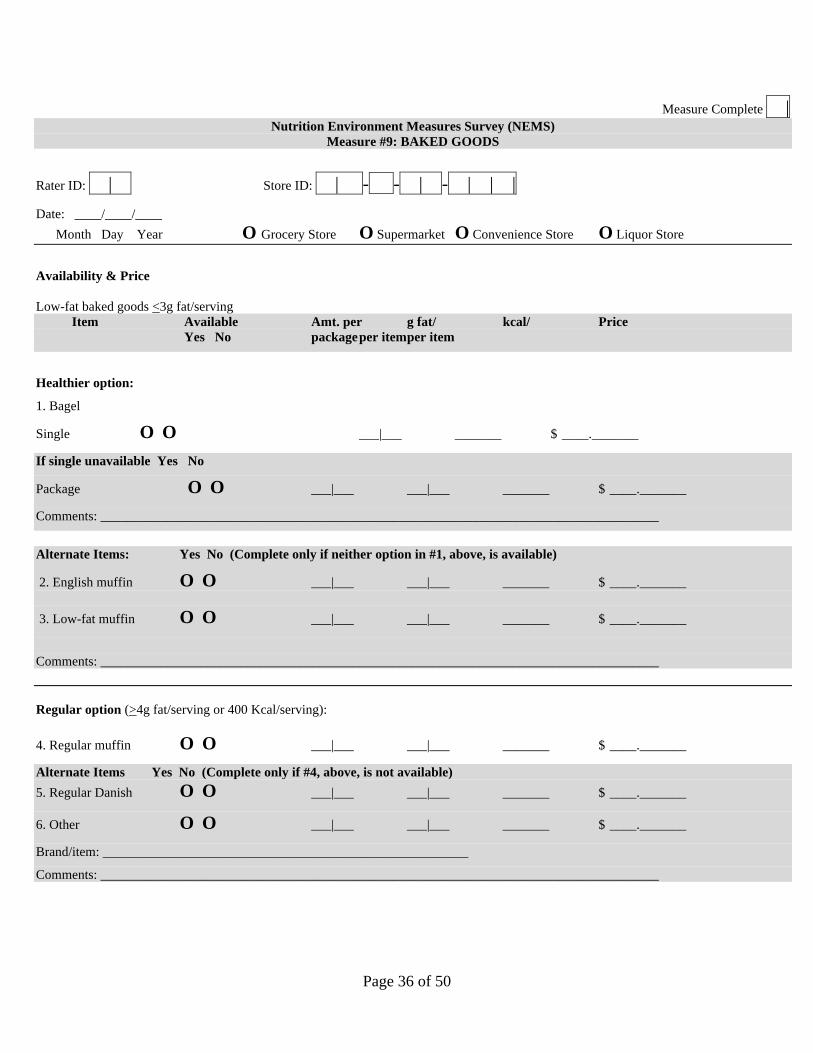
Measure Complete | Nutrition Environment Measures Survey (NEMS)
Measure #9: BAKED GOODS
Rater ID: | Store ID: | - - | - | | | Date: ____/____/____ Month Day Year O Grocery Store O Supermarket O Convenience Store O Liquor Store
Availability & Price Low-fat baked goods <3g fat/serving Item Available Amt. per g fat/ kcal/ Price Yes No package per item per item
Healthier option:
1. Bagel
Single O O ___|___ _______ $ ____._______
If single unavailable Yes No
Package O O ___|___ ___|___ _______ $ ____._______
Comments: ____________________________________________________________________________________
Alternate Items: Yes No (Complete only if neither option in #1, above, is available)
2. English muffin O O ___|___ ___|___ _______ $ ____._______ 3. Low-fat muffin O O ___|___ ___|___ _______ $ ____._______
Comments: ____________________________________________________________________________________ Regular option (>4g fat/serving or 400 Kcal/serving): 4. Regular muffin O O ___|___ ___|___ _______ $ ____._______
Alternate Items Yes No (Complete only if #4, above, is not available) 5. Regular Danish O O ___|___ ___|___ _______ $ ____._______
6. Other O O ___|___ ___|___ _______ $ ____._______
Brand/item: _______________________________________________________
Comments: ____________________________________________________________________________________
Page 37 of 50
Measure Complete | Nutrition Environment Measures Survey (NEMS)
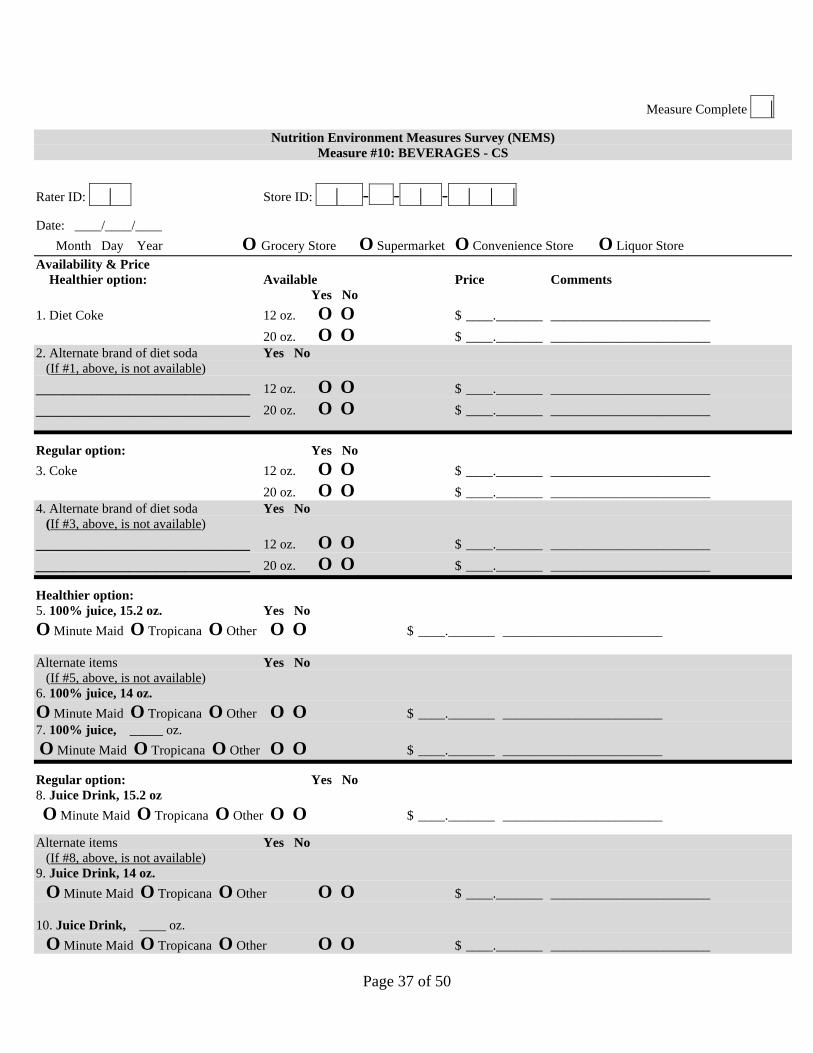
Measure #10: BEVERAGES - CS
Rater ID: | Store ID: | - - | - | | | Date: ____/____/____ Month Day Year O Grocery Store O Supermarket O Convenience Store O Liquor Store Availability & Price Healthier option: Available Price Comments Yes No 1. Diet Coke 12 oz. O O $ ____._______ ________________________ 20 oz. O O $ ____._______ ________________________ 2. Alternate brand of diet soda Yes No (If #1, above, is not available) _______________________ 12 oz. O O $ ____._______ ________________________ _______________________ 20 oz. O O $ ____._______ ________________________
Regular option: Yes No 3. Coke 12 oz. O O $ ____._______ ________________________ 20 oz. O O $ ____._______ ________________________ 4. Alternate brand of diet soda Yes No (If #3, above, is not available) _______________________ 12 oz. O O $ ____._______ ________________________ _______________________ 20 oz. O O $ ____._______ ________________________
Healthier option: 5. 100% juice, 15.2 oz. Yes No O Minute Maid O Tropicana O Other O O $ ____._______ ________________________ Alternate items Yes No (If #5, above, is not available) 6. 100% juice, 14 oz. O Minute Maid O Tropicana O Other O O $ ____._______ ________________________ 7. 100% juice, _____ oz. O Minute Maid O Tropicana O Other O O $ ____._______ ________________________
Regular option: Yes No 8. Juice Drink, 15.2 oz O Minute Maid O Tropicana O Other O O $ ____._______ ________________________
Alternate items Yes No (If #8, above, is not available) 9. Juice Drink, 14 oz. O Minute Maid O Tropicana O Other O O $ ____._______ ________________________ 10. Juice Drink, ____ oz. O Minute Maid O Tropicana O Other O O $ ____._______ ________________________
Page 38 of 50
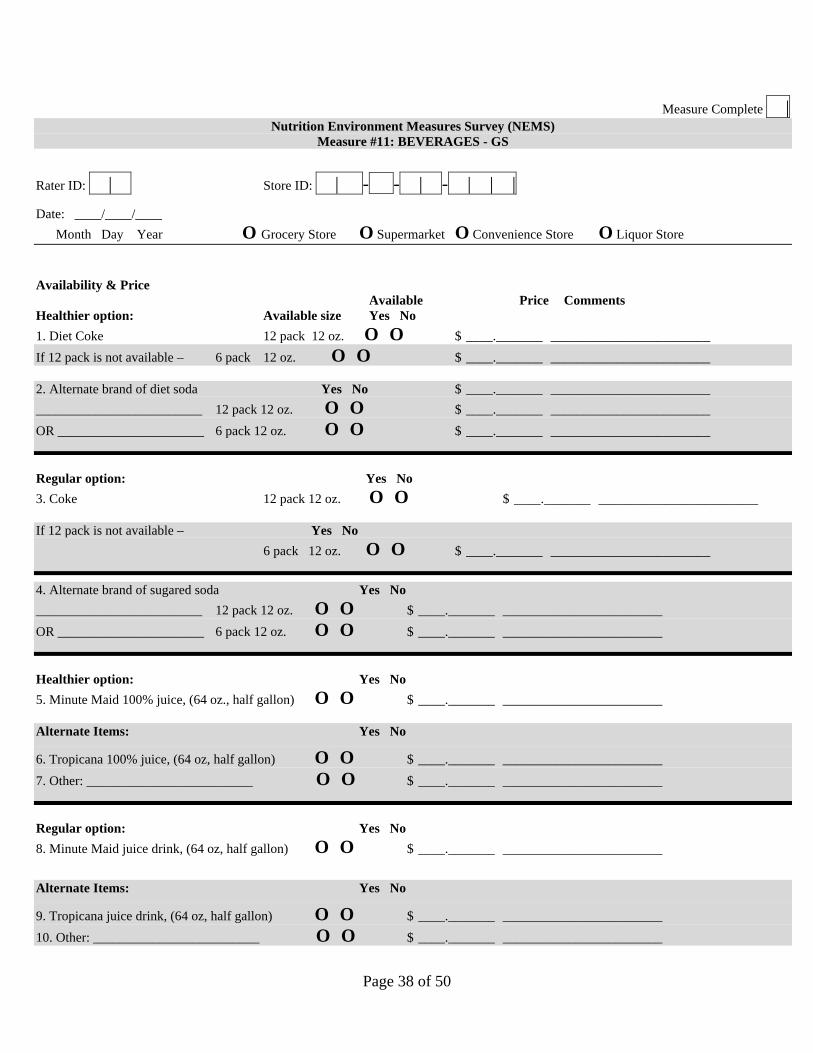
Measure Complete | Nutrition Environment Measures Survey (NEMS)
Measure #11: BEVERAGES - GS
Rater ID: | Store ID: | - - | - | | | Date: ____/____/____ Month Day Year O Grocery Store O Supermarket O Convenience Store O Liquor Store
Availability & Price Available Price Comments Healthier option: Available size Yes No 1. Diet Coke 12 pack 12 oz. O O $ ____._______ ________________________ If 12 pack is not available – 6 pack 12 oz. O O $ ____._______ ________________________ 2. Alternate brand of diet soda Yes No $ ____._______ ________________________ _________________________ 12 pack 12 oz. O O $ ____._______ ________________________ OR ______________________ 6 pack 12 oz. O O $ ____._______ ________________________
Regular option: Yes No 3. Coke 12 pack 12 oz. O O $ ____._______ ________________________ If 12 pack is not available – Yes No 6 pack 12 oz. O O $ ____._______ ________________________
4. Alternate brand of sugared soda Yes No _________________________ 12 pack 12 oz. O O $ ____._______ ________________________ OR ______________________ 6 pack 12 oz. O O $ ____._______ ________________________
Healthier option: Yes No 5. Minute Maid 100% juice, (64 oz., half gallon) O O $ ____._______ ________________________ Alternate Items: Yes No
6. Tropicana 100% juice, (64 oz, half gallon) O O $ ____._______ ________________________ 7. Other: _________________________ O O $ ____._______ ________________________
Regular option: Yes No 8. Minute Maid juice drink, (64 oz, half gallon) O O $ ____._______ ________________________
Alternate Items: Yes No
9. Tropicana juice drink, (64 oz, half gallon) O O $ ____._______ ________________________ 10. Other: _________________________ O O $ ____._______ ________________________
Page 39 of 50
Measure Complete |
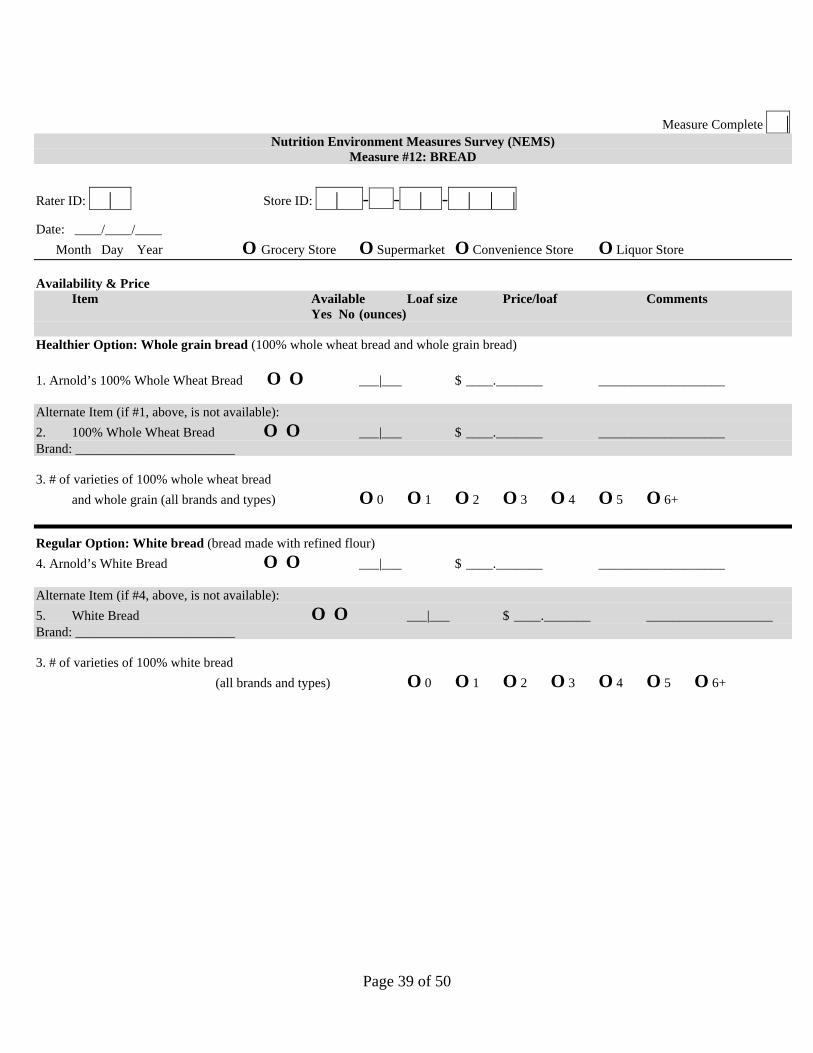
Nutrition Environment Measures Survey (NEMS) Measure #12: BREAD
Rater ID: | Store ID: | - - | - | | | Date: ____/____/____ Month Day Year O Grocery Store O Supermarket O Convenience Store O Liquor Store Availability & Price Item Available Loaf size Price/loaf Comments Yes No (ounces) Healthier Option: Whole grain bread (100% whole wheat bread and whole grain bread) 1. Arnold’s 100% Whole Wheat Bread O O ___|___ $ ____._______ ___________________ Alternate Item (if #1, above, is not available): 2. 100% Whole Wheat Bread O O ___|___ $ ____._______ ___________________ Brand: ________________________ 3. # of varieties of 100% whole wheat bread and whole grain (all brands and types) O 0 O 1 O 2 O 3 O 4 O 5 O 6+
Regular Option: White bread (bread made with refined flour) 4. Arnold’s White Bread O O ___|___ $ ____._______ ___________________ Alternate Item (if #4, above, is not available): 5. White Bread O O ___|___ $ ____._______ ___________________ Brand: ________________________ 3. # of varieties of 100% white bread
(all brands and types) O 0 O 1 O 2 O 3 O 4 O 5 O 6+
Page 40 of 50
Measure Complete |
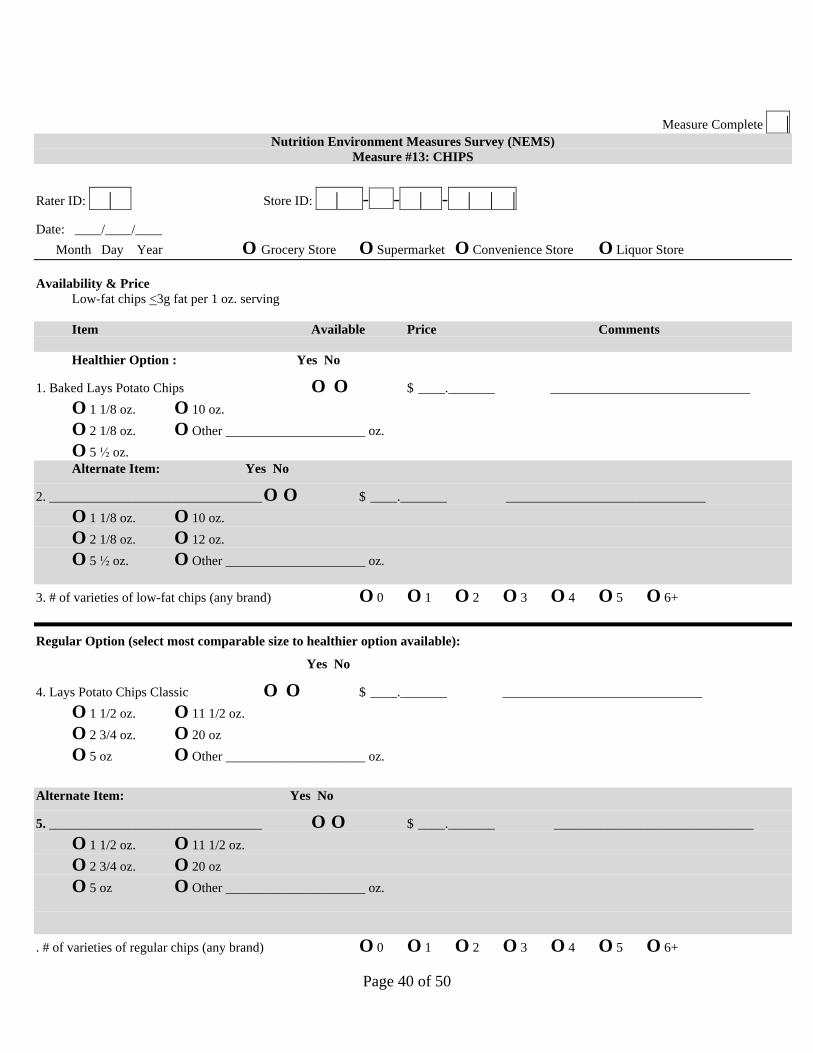
Nutrition Environment Measures Survey (NEMS) Measure #13: CHIPS
Rater ID: | Store ID: | - - | - | | | Date: ____/____/____ Month Day Year O Grocery Store O Supermarket O Convenience Store O Liquor Store Availability & Price Low-fat chips <3g fat per 1 oz. serving Item Available Price Comments Healthier Option : Yes No
1. Baked Lays Potato Chips O O $ ____._______ ______________________________ O 1 1/8 oz. O 10 oz. O 2 1/8 oz. O Other _____________________ oz. O 5 ! oz. Alternate Item: Yes No
2. ________________________________ O O $ ____._______ ______________________________ O 1 1/8 oz. O 10 oz. O 2 1/8 oz. O 12 oz. O 5 ! oz. O Other _____________________ oz. 3. # of varieties of low-fat chips (any brand) O 0 O 1 O 2 O 3 O 4 O 5 O 6+
Regular Option (select most comparable size to healthier option available):
Yes No
4. Lays Potato Chips Classic O O $ ____._______ ______________________________ O 1 1/2 oz. O 11 1/2 oz. O 2 3/4 oz. O 20 oz O 5 oz O Other _____________________ oz.
Alternate Item: Yes No
5. ________________________________ O O $ ____._______ ______________________________ O 1 1/2 oz. O 11 1/2 oz. O 2 3/4 oz. O 20 oz O 5 oz O Other _____________________ oz.
. # of varieties of regular chips (any brand) O 0 O 1 O 2 O 3 O 4 O 5 O 6+
Page 41 of 50
Measure Complete |
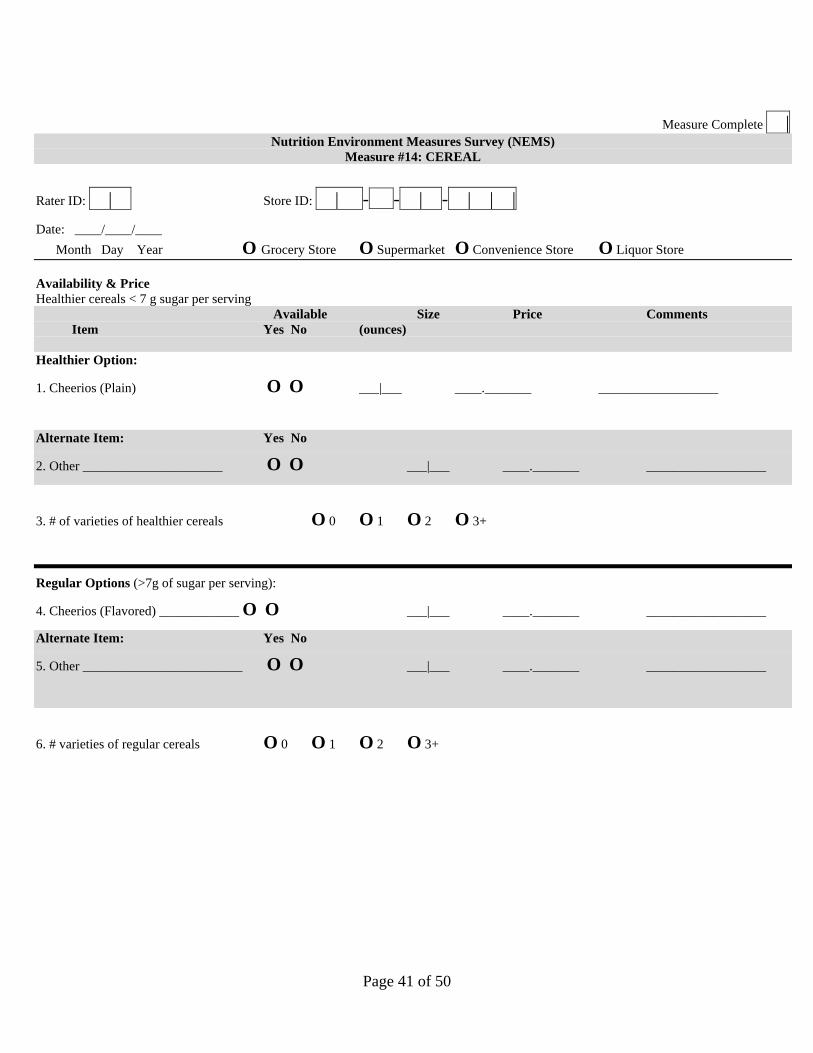
Nutrition Environment Measures Survey (NEMS) Measure #14: CEREAL
Rater ID: | Store ID: | - - | - | | | Date: ____/____/____ Month Day Year O Grocery Store O Supermarket O Convenience Store O Liquor Store Availability & Price Healthier cereals < 7 g sugar per serving Available Size Price Comments Item Yes No (ounces) Healthier Option:
1. Cheerios (Plain) O O ___|___ ____._______ __________________
Alternate Item: Yes No
2. Other _____________________ O O ___|___ ____._______ __________________
3. # of varieties of healthier cereals O 0 O 1 O 2 O 3+
Regular Options (>7g of sugar per serving):
4. Cheerios (Flavored) ____________ O O ___|___ ____._______ __________________
Alternate Item: Yes No
5. Other ________________________ O O ___|___ ____._______ __________________
6. # varieties of regular cereals O 0 O 1 O 2 O 3+
Page 42 of 50
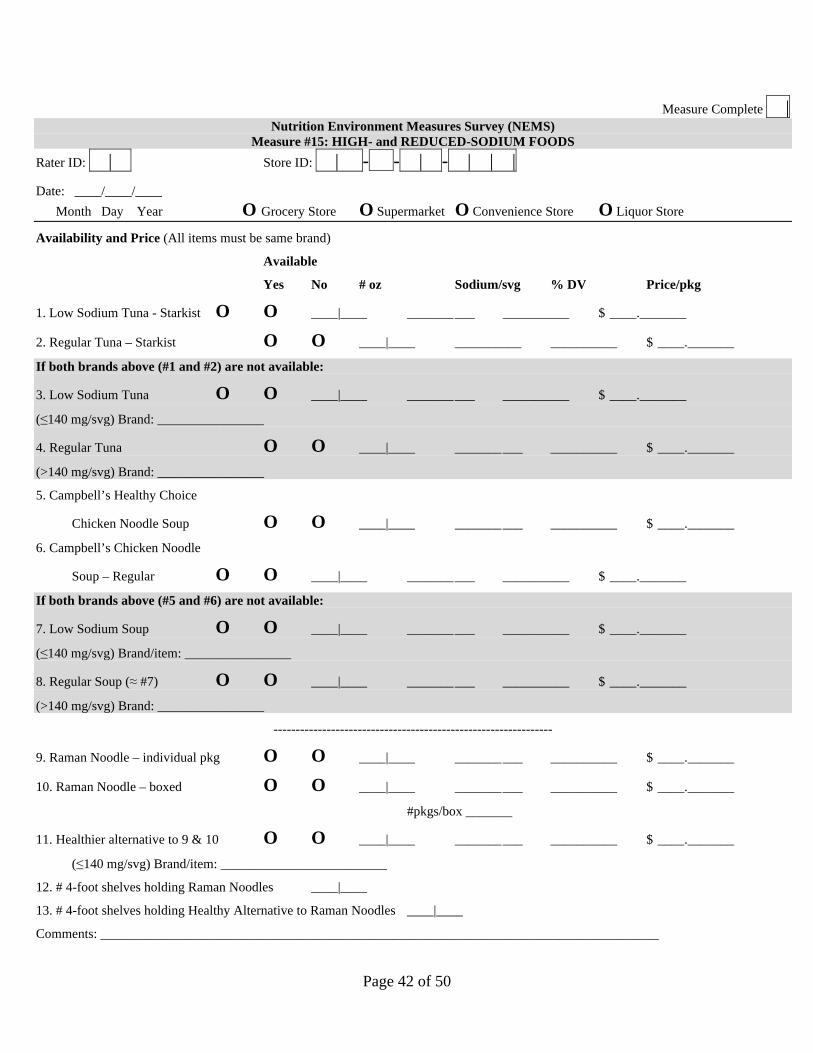
Measure Complete | Nutrition Environment Measures Survey (NEMS)
Measure #15: HIGH- and REDUCED-SODIUM FOODS Rater ID: | Store ID: | - - | - | | | Date: ____/____/____ Month Day Year O Grocery Store O Supermarket O Convenience Store O Liquor Store
Availability and Price (All items must be same brand)
Available
Yes No # oz Sodium/svg % DV Price/pkg
1. Low Sodium Tuna - Starkist O O ____|____ _______ ___ __________ $ ____._______
2. Regular Tuna – Starkist O O ____|____ __________ __________ $ ____._______
If both brands above (#1 and #2) are not available:
3. Low Sodium Tuna O O ____|____ _______ ___ __________ $ ____._______
(&140 mg/svg) Brand: ________________
4. Regular Tuna O O ____|____ _______ ___ __________ $ ____._______
(>140 mg/svg) Brand: ________________
5. Campbell’s Healthy Choice
Chicken Noodle Soup O O ____|____ _______ ___ __________ $ ____._______
6. Campbell’s Chicken Noodle
Soup – Regular O O ____|____ _______ ___ __________ $ ____._______
If both brands above (#5 and #6) are not available:
7. Low Sodium Soup O O ____|____ _______ ___ __________ $ ____._______
(&140 mg/svg) Brand/item: ________________
8. Regular Soup (' #7) O O ____|____ _______ ___ __________ $ ____._______
(>140 mg/svg) Brand: ________________
---------------------------------------------------------------
9. Raman Noodle – individual pkg O O ____|____ _______ ___ __________ $ ____._______
10. Raman Noodle – boxed O O ____|____ _______ ___ __________ $ ____._______
#pkgs/box _______
11. Healthier alternative to 9 & 10 O O ____|____ _______ ___ __________ $ ____._______
(&140 mg/svg) Brand/item: _________________________
12. # 4-foot shelves holding Raman Noodles ____|____
13. # 4-foot shelves holding Healthy Alternative to Raman Noodles ____|____
Comments: ____________________________________________________________________________________
Page 43 of 50
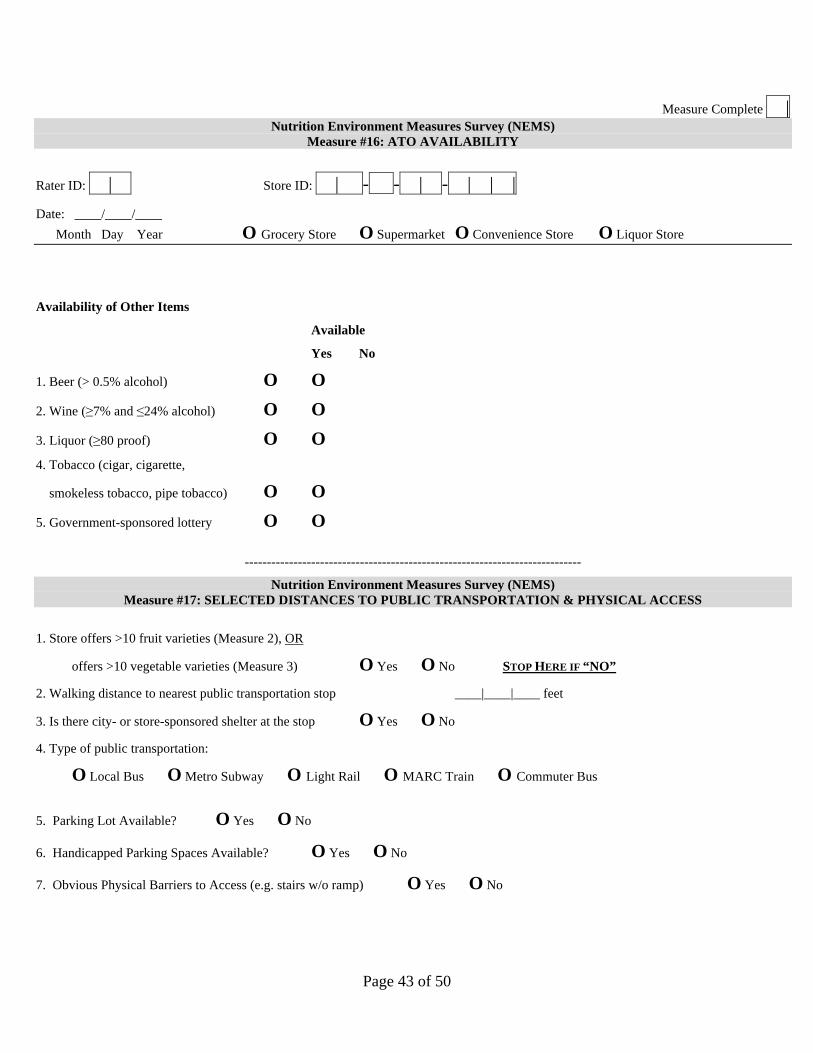
Measure Complete | Nutrition Environment Measures Survey (NEMS)
Measure #16: ATO AVAILABILITY
Rater ID: | Store ID: | - - | - | | | Date: ____/____/____ Month Day Year O Grocery Store O Supermarket O Convenience Store O Liquor Store
Availability of Other Items
Available
Yes No
1. Beer (> 0.5% alcohol) O O 2. Wine ($7% and &24% alcohol) O O
3. Liquor ($80 proof) O O 4. Tobacco (cigar, cigarette,
smokeless tobacco, pipe tobacco) O O
5. Government-sponsored lottery O O
----------------------------------------------------------------------------
Nutrition Environment Measures Survey (NEMS) Measure #17: SELECTED DISTANCES TO PUBLIC TRANSPORTATION & PHYSICAL ACCESS
1. Store offers >10 fruit varieties (Measure 2), OR
offers >10 vegetable varieties (Measure 3) O Yes O No STOP HERE IF “NO” 2. Walking distance to nearest public transportation stop ____|____|____ feet
3. Is there city- or store-sponsored shelter at the stop O Yes O No 4. Type of public transportation:
O Local Bus O Metro Subway O Light Rail O MARC Train O Commuter Bus
5. Parking Lot Available? O Yes O No
6. Handicapped Parking Spaces Available? O Yes O No
7. Obvious Physical Barriers to Access (e.g. stairs w/o ramp) O Yes O No

Page 44 of 50
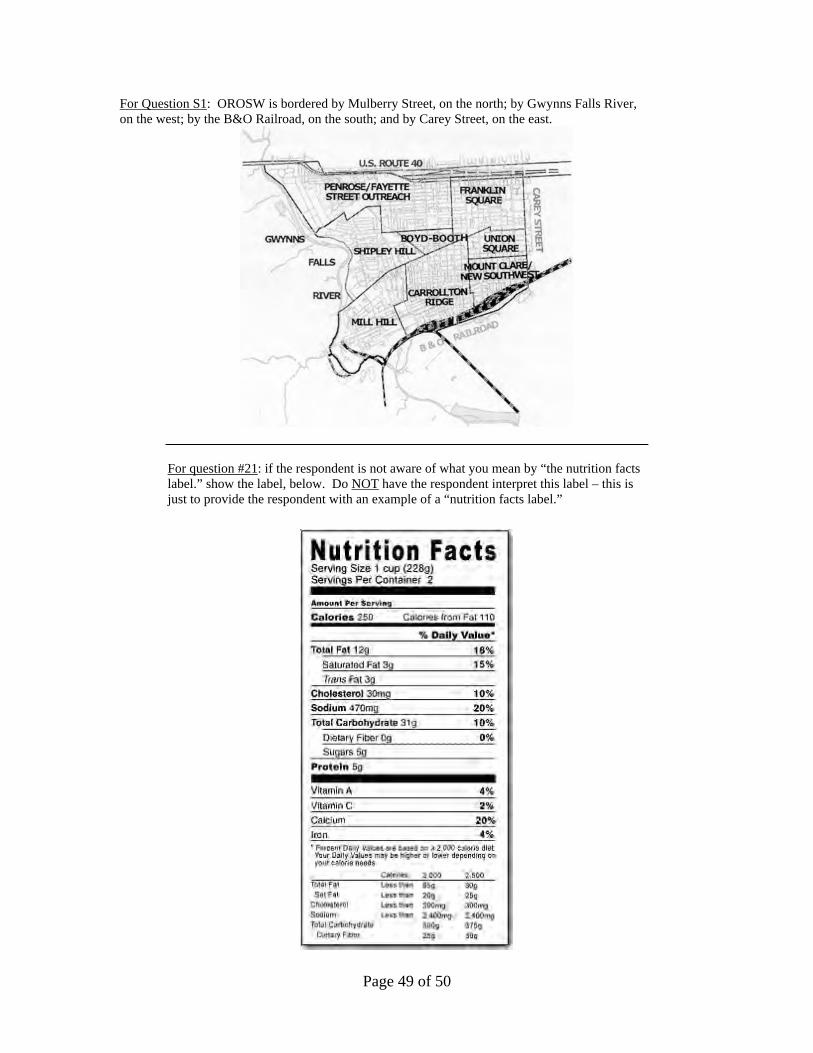
For Question S1: OROSW is bordered by Mulberry Street, on the north; by Gwynns Falls River, on the west; by the B&O Railroad, on the south; and by Carey Street, on the east.
For question #21: if the respondent is not aware of what you mean by “the nutrition facts label.” show the label, below. Do NOT have the respondent interpret this label – this is just to provide the respondent with an example of a “nutrition facts label.”
Page 45 of 50
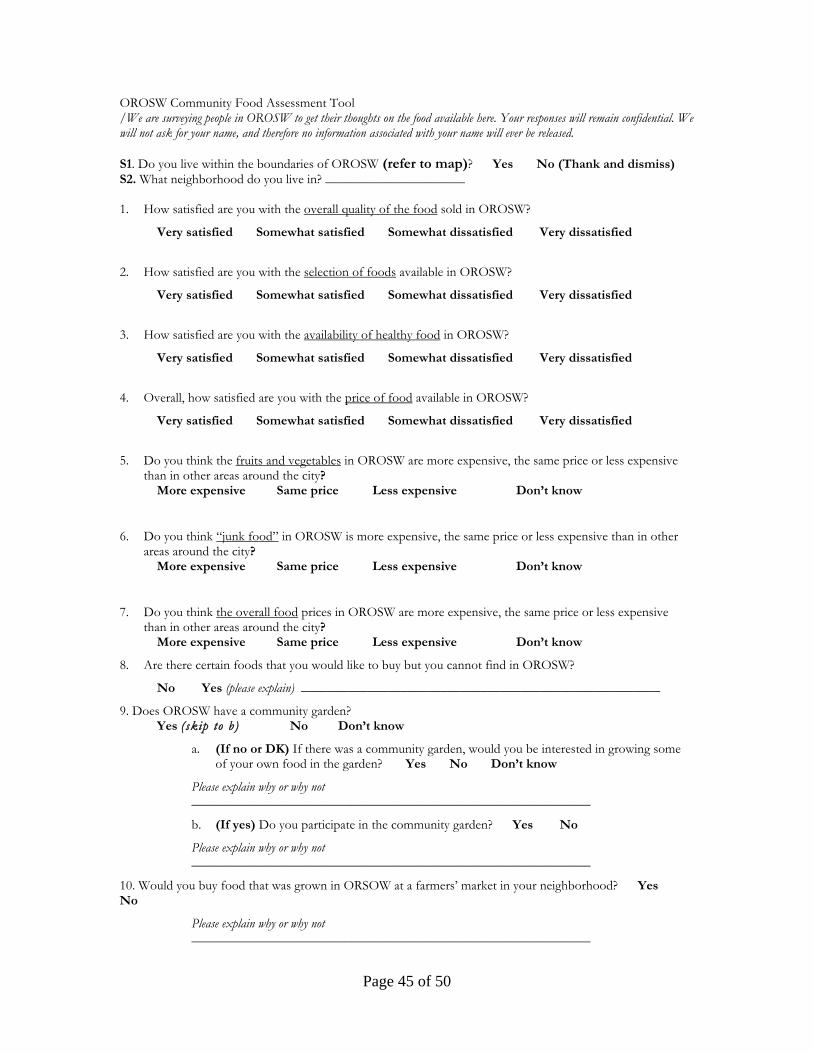
OROSW Community Food Assessment Tool /We are surveying people in OROSW to get their thoughts on the food available here. Your responses will remain confidential. We will not ask for your name, and therefore no information associated with your name will ever be released. S1. Do you live within the boundaries of OROSW (refer to map)? Yes No (Thank and dismiss) S2. What neighborhood do you live in? _____________________ 1. How satisfied are you with the overall quality of the food sold in OROSW?
Very satisfied Somewhat satisfied Somewhat dissatisfied Very dissatisfied
2. How satisfied are you with the selection of foods available in OROSW?
Very satisfied Somewhat satisfied Somewhat dissatisfied Very dissatisfied
3. How satisfied are you with the availability of healthy food in OROSW?
Very satisfied Somewhat satisfied Somewhat dissatisfied Very dissatisfied
4. Overall, how satisfied are you with the price of food available in OROSW?
Very satisfied Somewhat satisfied Somewhat dissatisfied Very dissatisfied
5. Do you think the fruits and vegetables in OROSW are more expensive, the same price or less expensive than in other areas around the city?
More expensive Same price Less expensive Don’t know
6. Do you think “junk food” in OROSW is more expensive, the same price or less expensive than in other areas around the city?
More expensive Same price Less expensive Don’t know
7. Do you think the overall food prices in OROSW are more expensive, the same price or less expensive than in other areas around the city?
More expensive Same price Less expensive Don’t know
8. Are there certain foods that you would like to buy but you cannot find in OROSW?
No Yes (please explain) ______________________________________________________
9. Does OROSW have a community garden? Yes ( skip to b) No Don’t know
a. (If no or DK) If there was a community garden, would you be interested in growing some of your own food in the garden? Yes No Don’t know
Please explain why or why not ____________________________________________________________
b. (If yes) Do you participate in the community garden? Yes No
Please explain why or why not ____________________________________________________________
10. Would you buy food that was grown in ORSOW at a farmers’ market in your neighborhood? Yes No
Please explain why or why not ____________________________________________________________
Page 46 of 50
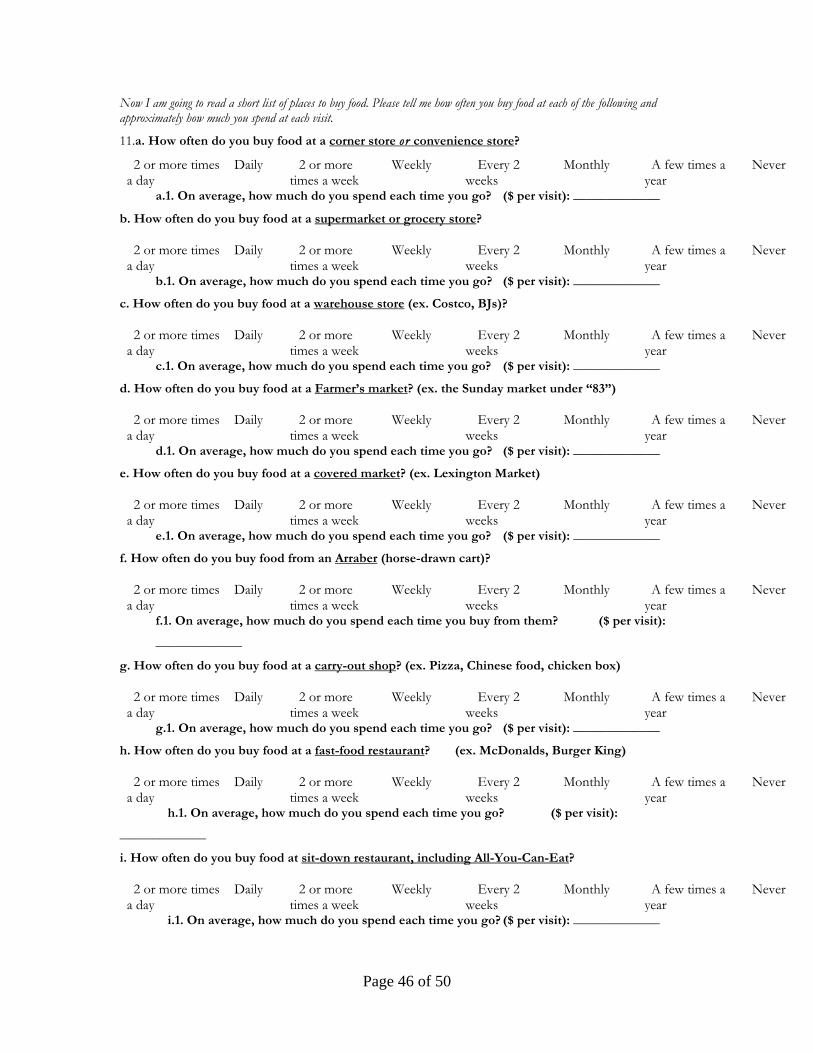
Now I am going to read a short list of places to buy food. Please tell me how often you buy food at each of the following and approximately how much you spend at each visit.
11.a. How often do you buy food at a corner store or convenience store?
a.1. On average, how much do you spend each time you go? ($ per visit): _____________
b. How often do you buy food at a supermarket or grocery store?
b.1. On average, how much do you spend each time you go? ($ per visit): _____________
c. How often do you buy food at a warehouse store (ex. Costco, BJs)?
c.1. On average, how much do you spend each time you go? ($ per visit): _____________
d. How often do you buy food at a Farmer’s market? (ex. the Sunday market under “83”)
d.1. On average, how much do you spend each time you go? ($ per visit): _____________
e. How often do you buy food at a covered market? (ex. Lexington Market)
e.1. On average, how much do you spend each time you go? ($ per visit): _____________
f. How often do you buy food from an Arraber (horse-drawn cart)?
f.1. On average, how much do you spend each time you buy from them? ($ per visit):
_____________
g. How often do you buy food at a carry-out shop? (ex. Pizza, Chinese food, chicken box)
g.1. On average, how much do you spend each time you go? ($ per visit): _____________
h. How often do you buy food at a fast-food restaurant? (ex. McDonalds, Burger King)
h.1. On average, how much do you spend each time you go? ($ per visit):
_____________
i. How often do you buy food at sit-down restaurant, including All-You-Can-Eat?
i.1. On average, how much do you spend each time you go? ($ per visit): _____________
2 or more times a day
Daily 2 or more times a week
Weekly Every 2 weeks
Monthly A few times a year
Never Other:
2 or more times a day
Daily 2 or more times a week
Weekly Every 2 weeks
Monthly A few times a year
Never Other:
2 or more times a day
Daily 2 or more times a week
Weekly Every 2 weeks
Monthly A few times a year
Never Other:
2 or more times a day
Daily 2 or more times a week
Weekly Every 2 weeks
Monthly A few times a year
Never Other:
2 or more times a day
Daily 2 or more times a week
Weekly Every 2 weeks
Monthly A few times a year
Never Other:
2 or more times a day
Daily 2 or more times a week
Weekly Every 2 weeks
Monthly A few times a year
Never Other:
2 or more times a day
Daily 2 or more times a week
Weekly Every 2 weeks
Monthly A few times a year
Never Other:
2 or more times a day
Daily 2 or more times a week
Weekly Every 2 weeks
Monthly A few times a year
Never Other:
2 or more times a day
Daily 2 or more times a week
Weekly Every 2 weeks
Monthly A few times a year
Never Other:
Page 47 of 50
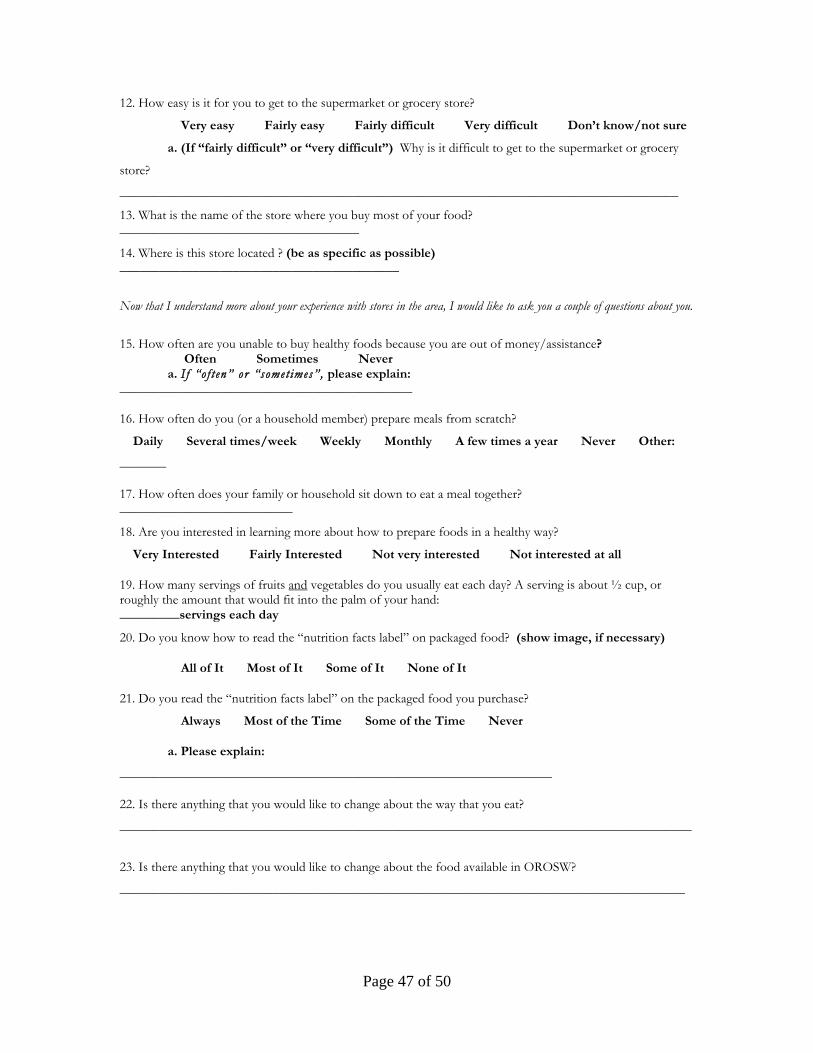
12. How easy is it for you to get to the supermarket or grocery store?
Very easy Fairly easy Fairly difficult Very difficult Don’t know/not sure
a. (If “fairly difficult” or “very difficult”) Why is it difficult to get to the supermarket or grocery
store?
____________________________________________________________________________________
13. What is the name of the store where you buy most of your food? ____________________________________
14. Where is this store located ? (be as specific as possible) __________________________________________
Now that I understand more about your experience with stores in the area, I would like to ask you a couple of questions about you.
15. How often are you unable to buy healthy foods because you are out of money/assistance? Often Sometimes Never a. I f “o f t en” or “somet imes”, please explain: ____________________________________________ 16. How often do you (or a household member) prepare meals from scratch?
Daily Several times/week Weekly Monthly A few times a year Never Other:
_______
17. How often does your family or household sit down to eat a meal together? __________________________
18. Are you interested in learning more about how to prepare foods in a healthy way?
Very Interested Fairly Interested Not very interested Not interested at all
19. How many servings of fruits and vegetables do you usually eat each day? A serving is about ! cup, or roughly the amount that would fit into the palm of your hand: _________servings each day
20. Do you know how to read the “nutrition facts label” on packaged food? (show image, if necessary)
All of It Most of It Some of It None of It
21. Do you read the “nutrition facts label” on the packaged food you purchase?
Always Most of the Time Some of the Time Never
a. Please explain:
_________________________________________________________________
22. Is there anything that you would like to change about the way that you eat?
______________________________________________________________________________________
23. Is there anything that you would like to change about the food available in OROSW?
_____________________________________________________________________________________
Page 48 of 50
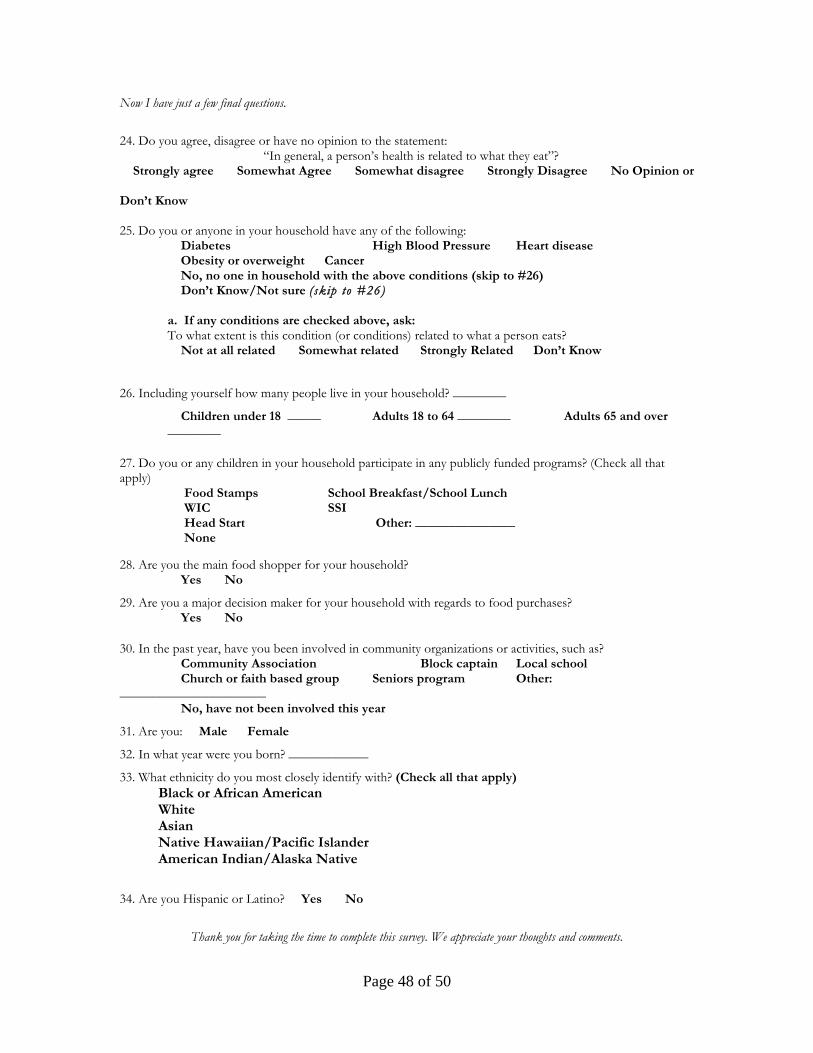
Now I have just a few final questions.
24. Do you agree, disagree or have no opinion to the statement: “In general, a person’s health is related to what they eat”?
Strongly agree Somewhat Agree Somewhat disagree Strongly Disagree No Opinion or Don’t Know 25. Do you or anyone in your household have any of the following: Diabetes High Blood Pressure Heart disease
Obesity or overweight Cancer No, no one in household with the above conditions (skip to #26)
Don’t Know/Not sure ( skip to #26) a. If any conditions are checked above, ask: To what extent is this condition (or conditions) related to what a person eats? Not at all related Somewhat related Strongly Related Don’t Know
26. Including yourself how many people live in your household? ________
Children under 18 _____ Adults 18 to 64 ________ Adults 65 and over ________
27. Do you or any children in your household participate in any publicly funded programs? (Check all that apply)
Food Stamps School Breakfast/School Lunch WIC SSI Head Start Other: _______________ None
28. Are you the main food shopper for your household? Yes No
29. Are you a major decision maker for your household with regards to food purchases? Yes No
30. In the past year, have you been involved in community organizations or activities, such as? Community Association Block captain Local school Church or faith based group Seniors program Other: ______________________ No, have not been involved this year
31. Are you: Male Female
32. In what year were you born? ____________
33. What ethnicity do you most closely identify with? (Check all that apply) Black or African American White Asian Native Hawaiian/Pacific Islander American Indian/Alaska Native
34. Are you Hispanic or Latino? Yes No
Thank you for taking the time to complete this survey. We appreciate your thoughts and comments.
Page 49 of 50
For Question S1: OROSW is bordered by Mulberry Street, on the north; by Gwynns Falls River, on the west; by the B&O Railroad, on the south; and by Carey Street, on the east.
For question #21: if the respondent is not aware of what you mean by “the nutrition facts label.” show the label, below. Do NOT have the respondent interpret this label – this is just to provide the respondent with an example of a “nutrition facts label.”
Page 50 of 50
Bibliography
Bhattacharya, J., Currie, J., & Haider, S. (2004). Poverty, food insecurity, and nutritional outcomes in children and adults. Journal of Health Economics, 23(4), 839-862.
Diez-Roux, A. V., Nieto, F. J., Caulfield, L., Tyroler, H. A., Watson, R. L., & Szklo, M. (1999). Neighbourhood differences in diet: The atherosclerosis risk in communities (ARIC) study. Journal of Epidemiology and Community health, 53(1), 55-63.
Glanz, K., Sallis, J. F., Saelens, B. E., & Frank, L. D. (2005). Healthy nutrition environments: Concepts and measures. American Journal of Health Promotion, 19(5), 330-3, ii.
Hamm, M. W., & Bellows, A. C. (2003). Community food security: Background and future directions. J.Nutr.Educ.Behav., 35(1), 37-43.
Karp, R. J., Cheng, C., & Meyers, A. F. (2005). The appearance of discretionary income: Influence on the prevalence of under- and over-nutrition. Int.J.Equity Health., 4, 10.
LaVeist, T., Bowen-Reid, T., Jackson, J., Gary, T., Thorpe, R., Gaskin, D., Browne, D. (2008). “Exploring Health Disparities in Integrated Communities: Overview of the EHDIC Study” Journal of Urban Health
Life Sciences Research Office, Federation of American Societies for Experimental Biology. (1990). Core indicators of nutritional state for difficult-to-sample populations. The Journal of Nutrition, 120 Suppl 11, 1559-1600.
Nelson, M. (2000). Childhood nutrition and poverty. The Proceedings of the Nutrition Society, 59(2), 307-315.
Nord, M., Andrews, M., & Carlson, S. (2006). Household food security in the United States, 2005 No. 29). Washington, DC: United States Department of Agriculture, Economic Research Service.
Townsend, M. S., Peerson, J., Love, B., Achterberg, C., & Murphy, S. P. (2001). Food insecurity is positively related to overweight in women. The Journal of Nutrition, 131(6), 1738-1745.