Embed Size (px)
Citation preview
U n d e r s ta n d i n g a g r i c U lt U r e a n d i c t p r a c t i c e s i n i n d i a 1
Understanding Agriculture and
ICT Practices in India
www.dendia.org
Understanding agriculture and ict practices in india
This work is licensed under a creative commons Attribution 4.0 International License.
You can modify and build upon this document non-commercially, as long as you give credit to the original authors and license your new creation under the identical terms.
Author: Anoushka Jha
Editor : Kriti Singh
Reviewer: Anulekha Nandi
Design & layout: Ravi Kumar Yadav
Year of Publication: 2020
Published and distributed by
Digital Empowerment Foundation
contentspreface & acknowledgment �������������������4
introduction �������������������������������������������5Key Findings ............................................. 8
demographic data ��������������������������������10
economic Background ��������������������������11Land Ownership ..................................... 11Gender and Economic Decision-Making .. 12Agriculture Labour Force Make-Up ......... 12Agriculture and Household Financial Make-Up .......................................................... 12Ownership of Asset and Livestock ........... 13
Farming practices ���������������������������������14Family Labour Involvement .................... 14Cultivation Practices .............................. 15Sourcing of Seeds.................................... 15Area Coverage ......................................... 16Crop Production ...................................... 16Use of Fertilisers and Pesticides .............. 16Soil Health ............................................. 17Irrigation Facilities and Practices ............ 17
agricultural Finance �����������������������������18Cost of Investment, Recovery and Debt ... 18Crop Insurance ........................................ 19
production, storage and distribution ��20Production, Sale, and Subsistence ........... 20Storage, Sale and Distribution ................ 21
Knowledge, training, and capacity-Building ���������������������������������22Knowledge, Awareness, and Stakeholders................................................................ 22Networks and Institutional Support ............................... 23
type of area and availability of disaster risk Management ���������������������������������24
access to information ���������������������������25Type of Information Available ................. 25Agriculture Related Government Entitlements ............................................ 25
ict and agriculture ������������������������������26
state-Wise comparison�������������������������28
recommendations ��������������������������������30
4 U n d e r s ta n d i n g a g r i c U lt U r e a n d i c t p r a c t i c e s i n i n d i a
preface & acknowledgmentAgriculture and ICT – When will the game change?For the last two decades at least we have been discussing the gamechanger that the internet would be for the Indian farmer. In a country where last mile access remains the most formidable challenge for all extension work, the world wide web was supposed to have emerged as the final solution. However, as our survey brings out rather starkly, internet penetration in the agriculture sector remains rather poor with more than two thirds of farmers not having access to the internet. Smart phone usage is also paltry and an insignificant number get information or support on government schemes.
The rest of the results are more or less as expected. Chemical usage is almost universal, both as fertilizer and as pesticide. Cooperative networks do not exist. Small and marginal farmers abound, most rural populations depend exclusively on farming and a large number are either barely breaking even or undergoing losses. The government is able to reach very few people, cold storage facilities are unavailable and most borrowings are still from informal sources. The gender relations are skewed and most decisions are taken by the male members of the household.
This study therefore gives us some very critical insights. The major one is that information dissemination and training hold the key for all agricultural development and
agri extension work. It is both a felt need and a service which is the key to agriculture growth. For this to work, it is important for the state to guarantee internet access to all. That is why the immediate implementation of Bharat Net is critical for the social development of the country. High quality internet access is a critical infrastructure that must be guaranteed to every person.
What is therefore a crucial lesson is that rural poverty needs to be tackled by providing our farmers state of the art training, giving them real time information on weather patterns and enable price discovery. Soil testing, productivity training and skilling on grading and sorting is also very important for farmers to maintain the most efficient ratio of what they must sell and what they should retain for own consumption or for value addition. The Indian farmer fights against all odds to provide food and nutrition to the country and in turn gets very little support. The role of digital empowerment in making India into a farmer-friendly economy is an absolute necessary and must be underlined with urgency.
Amir Ullah KhanPolicy adviser at the Bill & Melinda Gates Foundation; Visiting professor, ISBHe is also a Board Member at Digital Empowerment Foundation
U n d e r s ta n d i n g a g r i c U lt U r e a n d i c t p r a c t i c e s i n i n d i a 5
introductionAgriculture is one of the largest sources of livelihood with more than 70% of the rural population depending on it. This sector accounts for 23% of the country’s GDP and is the largest producer (25% of global production), consumer (27% of global production) and importer (14%) of pulses in the world. According to FAO (Food and Agricultural Organisation), marginal and small farmers account for 82% of the total farmers in the country. Our study showed that 56% of the 735 people surveyed have a marginal land holding (up to 2.5 acres) and 29% have small land holding (up to 5 acres), representing a combined 85% of those surveyed1. FAO further notes that the share of agriculture in the country’s GDP has steadily declined from 1951-2011 and there are around 190 million undernourished people. This is further compounded by widespread agrarian distress in the country, with reasons ranging from increasing prices in the market for farmers, production gluts, flawed import-export policies, demonetisation, lower investment in agriculture, and weather2 which are not supported by institutional and
1. Food and Agriculture Organization of the United Na-tion. (n.d). India at glance. Retrieved from http://www.fao.org/india/fao-in-india/india-at-a-glance/en/2. Chari, M. & Subramanian, N. (2019). The election fix: India’s farm crisis is alarming: What are politicians prom-ising to do about it? Scroll.In (05 May 2019). Retrieved from https://scroll.in/article/922325/the-election-fix-indias-farm-crisis-is-alarming-what-are-politicians-prom-ising-to-do-about-it
infrastructural investments to buffet against these risks. With respect to the lower investment in agriculture, the study highlights that 94% of the total 735 respondents do not have cold storage facility in their village, 96% of 735 respondents have not received any kind of training related to cultivation practices while 86% of 735 respondents have no idea about community seed bank. Weather has been one of the major reasons for agrarian distress, in the survey conducted, 43% of 735 respondent said their areas are drought affected and 92% of 735 respondents did not have any disaster risk management system in place. Moreover, due to the absence of unified trading license across the state and union territory most of the farmers sell their produce to intermediaries and are even exploited through a non-transparent and multipoint levy of a market fee3 . The study highlights that farmers sell their agriculture produce to middlemen making them more vulnerable to the market prices and exploitation by these intermediaries. Indebtedness is also one of the major reasons of concern for farmers. Around 52.5% of the rural households are indebted which is further supplemented by low
3. Bhanwala, HK. & Dora, SK. (2019). Cooperative federalism is a must for agricultural reform. Livemint. (01 July 2019). Retrieved from https://www.livemint.com/opinion/online-views/opinion-cooperative-federal-ism-is-a-must-for-agricultural-reform-1562004454432.html
FAO notes that the share of agriculture in the India’s GDP has steadily declined from 1951-2011 and there are around 190 million undernourished people
6 U n d e r s ta n d i n g a g r i c U lt U r e a n d i c t p r a c t i c e s i n i n d i a
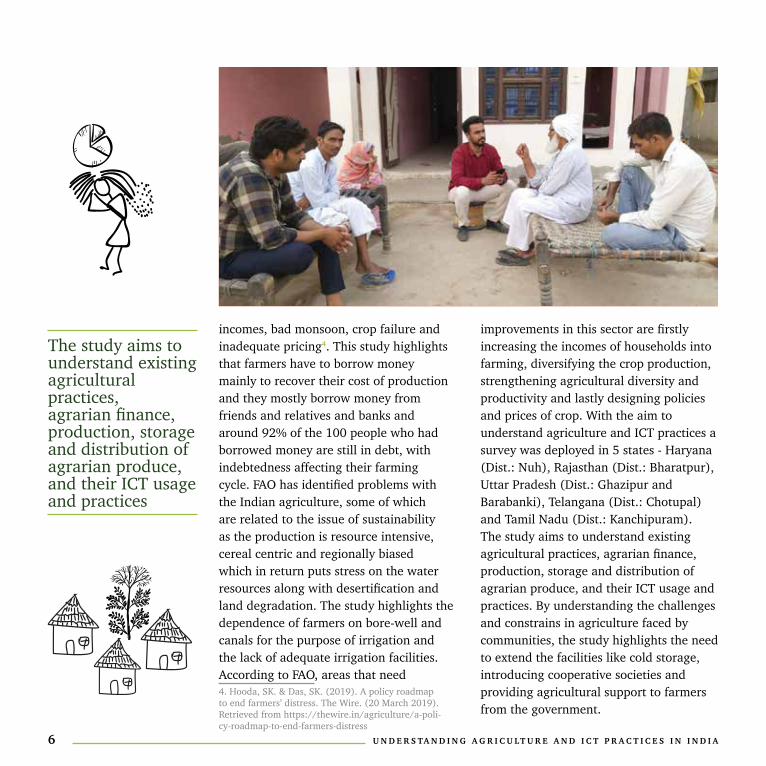
incomes, bad monsoon, crop failure and inadequate pricing4. This study highlights that farmers have to borrow money mainly to recover their cost of production and they mostly borrow money from friends and relatives and banks and around 92% of the 100 people who had borrowed money are still in debt, with indebtedness affecting their farming cycle. FAO has identified problems with the Indian agriculture, some of which are related to the issue of sustainability as the production is resource intensive, cereal centric and regionally biased which in return puts stress on the water resources along with desertification and land degradation. The study highlights the dependence of farmers on bore-well and canals for the purpose of irrigation and the lack of adequate irrigation facilities. According to FAO, areas that need 4. Hooda, SK. & Das, SK. (2019). A policy roadmap to end farmers’ distress. The Wire. (20 March 2019). Retrieved from https://thewire.in/agriculture/a-poli-cy-roadmap-to-end-farmers-distress
improvements in this sector are firstly increasing the incomes of households into farming, diversifying the crop production, strengthening agricultural diversity and productivity and lastly designing policies and prices of crop. With the aim to understand agriculture and ICT practices a survey was deployed in 5 states - Haryana (Dist.: Nuh), Rajasthan (Dist.: Bharatpur), Uttar Pradesh (Dist.: Ghazipur and Barabanki), Telangana (Dist.: Chotupal) and Tamil Nadu (Dist.: Kanchipuram). The study aims to understand existing agricultural practices, agrarian finance, production, storage and distribution of agrarian produce, and their ICT usage and practices. By understanding the challenges and constrains in agriculture faced by communities, the study highlights the need to extend the facilities like cold storage, introducing cooperative societies and providing agricultural support to farmers from the government.
The study aims to understand existing agricultural practices, agrarian finance, production, storage and distribution of agrarian produce, and their ICT usage and practices
U n d e r s ta n d i n g a g r i c U lt U r e a n d i c t p r a c t i c e s i n i n d i a 7
8 U n d e r s ta n d i n g a g r i c U lt U r e a n d i c t p r a c t i c e s i n i n d i a
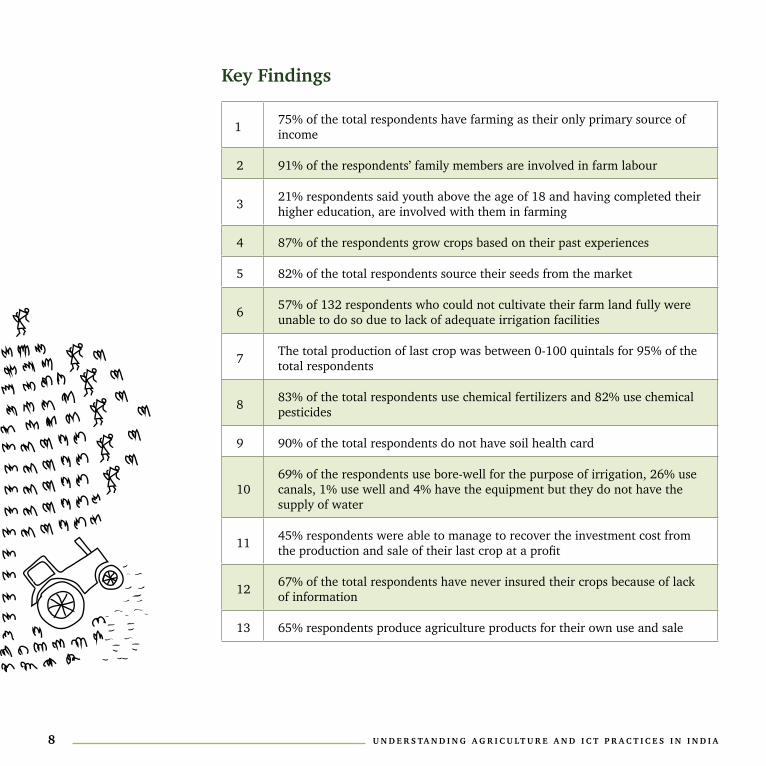
Key Findings
1 75% of the total respondents have farming as their only primary source of income
2 91% of the respondents’ family members are involved in farm labour
3 21% respondents said youth above the age of 18 and having completed their higher education, are involved with them in farming
4 87% of the respondents grow crops based on their past experiences
5 82% of the total respondents source their seeds from the market
6 57% of 132 respondents who could not cultivate their farm land fully were unable to do so due to lack of adequate irrigation facilities
7 The total production of last crop was between 0-100 quintals for 95% of the total respondents
8 83% of the total respondents use chemical fertilizers and 82% use chemical pesticides
9 90% of the total respondents do not have soil health card
1069% of the respondents use bore-well for the purpose of irrigation, 26% use canals, 1% use well and 4% have the equipment but they do not have the supply of water
11 45% respondents were able to manage to recover the investment cost from the production and sale of their last crop at a profit
12 67% of the total respondents have never insured their crops because of lack of information
13 65% respondents produce agriculture products for their own use and sale
U n d e r s ta n d i n g a g r i c U lt U r e a n d i c t p r a c t i c e s i n i n d i a 9
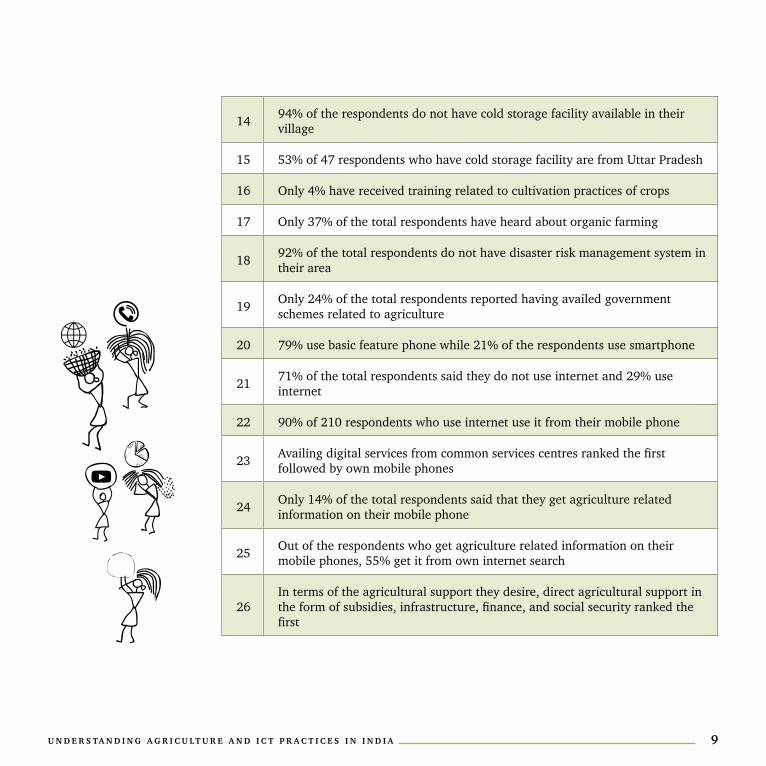
14 94% of the respondents do not have cold storage facility available in their village
15 53% of 47 respondents who have cold storage facility are from Uttar Pradesh
16 Only 4% have received training related to cultivation practices of crops
17 Only 37% of the total respondents have heard about organic farming
18 92% of the total respondents do not have disaster risk management system in their area
19 Only 24% of the total respondents reported having availed government schemes related to agriculture
20 79% use basic feature phone while 21% of the respondents use smartphone
21 71% of the total respondents said they do not use internet and 29% use internet
22 90% of 210 respondents who use internet use it from their mobile phone
23 Availing digital services from common services centres ranked the first followed by own mobile phones
24 Only 14% of the total respondents said that they get agriculture related information on their mobile phone
25 Out of the respondents who get agriculture related information on their mobile phones, 55% get it from own internet search
26In terms of the agricultural support they desire, direct agricultural support in the form of subsidies, infrastructure, finance, and social security ranked the first
1 0 U n d e r s ta n d i n g a g r i c U lt U r e a n d i c t p r a c t i c e s i n i n d i a
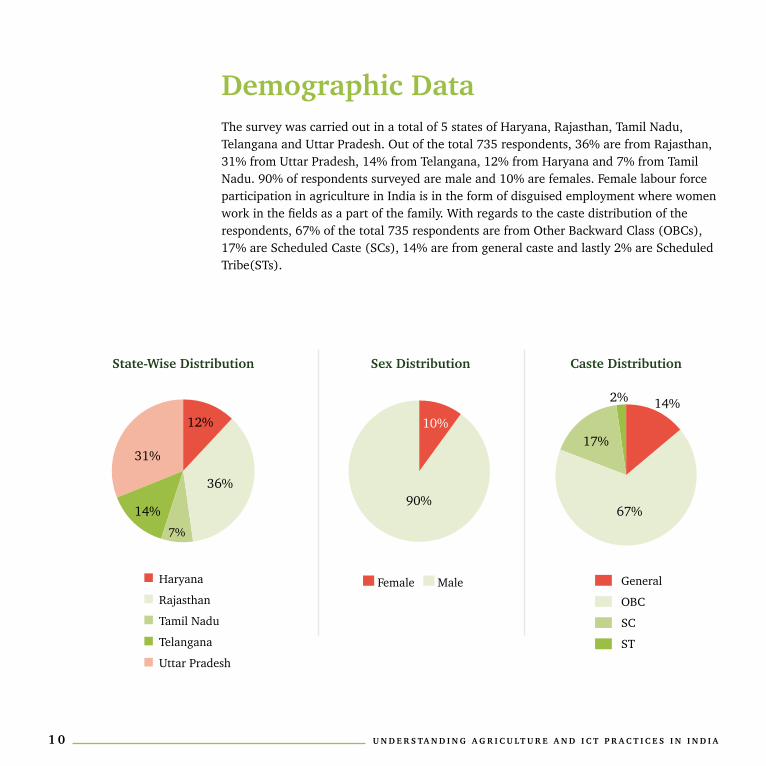
demographic dataThe survey was carried out in a total of 5 states of Haryana, Rajasthan, Tamil Nadu, Telangana and Uttar Pradesh. Out of the total 735 respondents, 36% are from Rajasthan, 31% from Uttar Pradesh, 14% from Telangana, 12% from Haryana and 7% from Tamil Nadu. 90% of respondents surveyed are male and 10% are females. Female labour force participation in agriculture in India is in the form of disguised employment where women work in the fields as a part of the family. With regards to the caste distribution of the respondents, 67% of the total 735 respondents are from Other Backward Class (OBCs), 17% are Scheduled Caste (SCs), 14% are from general caste and lastly 2% are Scheduled Tribe(STs).
14%
67%
17%
2%
caste distributionsex distribution
Female Male General
OBC
SC
ST
10%
90%
state-Wise distribution
12%
36%
7%
14%
31%
Haryana
Rajasthan
Tamil Nadu
Telangana
Uttar Pradesh
U n d e r s ta n d i n g a g r i c U lt U r e a n d i c t p r a c t i c e s i n i n d i a 1 1
economic Background
land Ownership Out of 735 respondents surveyed, 70% respondents said that farming has been a hereditary occupation and land has been passed down through generations in the family. However, 24% of the respondents reported to be first generation farmers while 6% said that their family had been farm labourers. In Haryana out of 91 respondents 16% are first generation farmers, in Rajasthan 22% of 267 respondents are first generation farmers, in Tamil Nadu 2% of 51 respondents are first generation farmers, while in Telangana 3% of the 100 respondents are first generation farmers and lastly in Uttar Pradesh 45% of 226 respondents are first generation farmers.
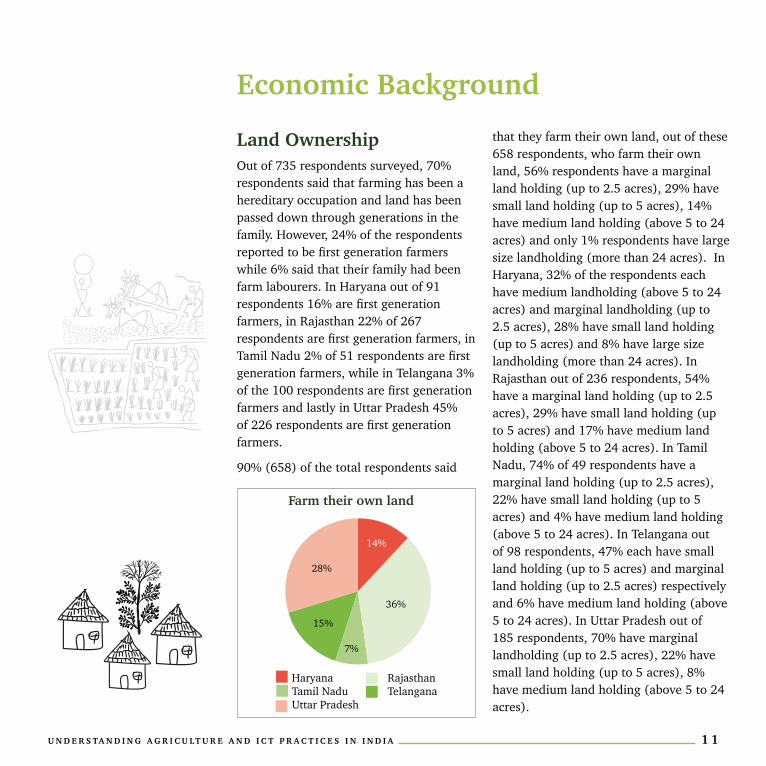
90% (658) of the total respondents said
that they farm their own land, out of these 658 respondents, who farm their own land, 56% respondents have a marginal land holding (up to 2.5 acres), 29% have small land holding (up to 5 acres), 14% have medium land holding (above 5 to 24 acres) and only 1% respondents have large size landholding (more than 24 acres). In Haryana, 32% of the respondents each have medium landholding (above 5 to 24 acres) and marginal landholding (up to 2.5 acres), 28% have small land holding (up to 5 acres) and 8% have large size landholding (more than 24 acres). In Rajasthan out of 236 respondents, 54% have a marginal land holding (up to 2.5 acres), 29% have small land holding (up to 5 acres) and 17% have medium land holding (above 5 to 24 acres). In Tamil Nadu, 74% of 49 respondents have a marginal land holding (up to 2.5 acres), 22% have small land holding (up to 5 acres) and 4% have medium land holding (above 5 to 24 acres). In Telangana out of 98 respondents, 47% each have small land holding (up to 5 acres) and marginal land holding (up to 2.5 acres) respectively and 6% have medium land holding (above 5 to 24 acres). In Uttar Pradesh out of 185 respondents, 70% have marginal landholding (up to 2.5 acres), 22% have small land holding (up to 5 acres), 8% have medium land holding (above 5 to 24 acres).
14%
36%
7%
15%
28%
Haryana Rajasthan Tamil Nadu Telangana Uttar Pradesh
Farm their own land
1 2 U n d e r s ta n d i n g a g r i c U lt U r e a n d i c t p r a c t i c e s i n i n d i a
gender and economic decision-MakingOut of 658 respondents who farm their own land, 57% responded that head of the family takes decisions about land, productivity, cultivation, sale and distribution. 17% respondents said that men in their family take important decisions, 12% responded that the family comprising of men, women and young people together come to a decision, 4% respondents said that men primarily take decisions and women folk also provide their inputs while 10% respondents did not respond. This highlights the limited role played by women in economic activity.
agriculture labour Force Make-UpOut of 77 respondents who said that they don’t farm their own land, 78% (60) respondents work as daily wage laborers. Out of 60 respondents who work as daily wage workers, 70% (42) are daily wagers from the same village while 30% (18) are seasonal migrant laborers. Out of a total of 60 respondents working as daily wage laborers, 36% responded that they engaged in farming throughout the year, 27% for 7 to 8 months, 22% for 5-6 months and 15% of the respondents are engaged in farming for up to 4 months in a year.
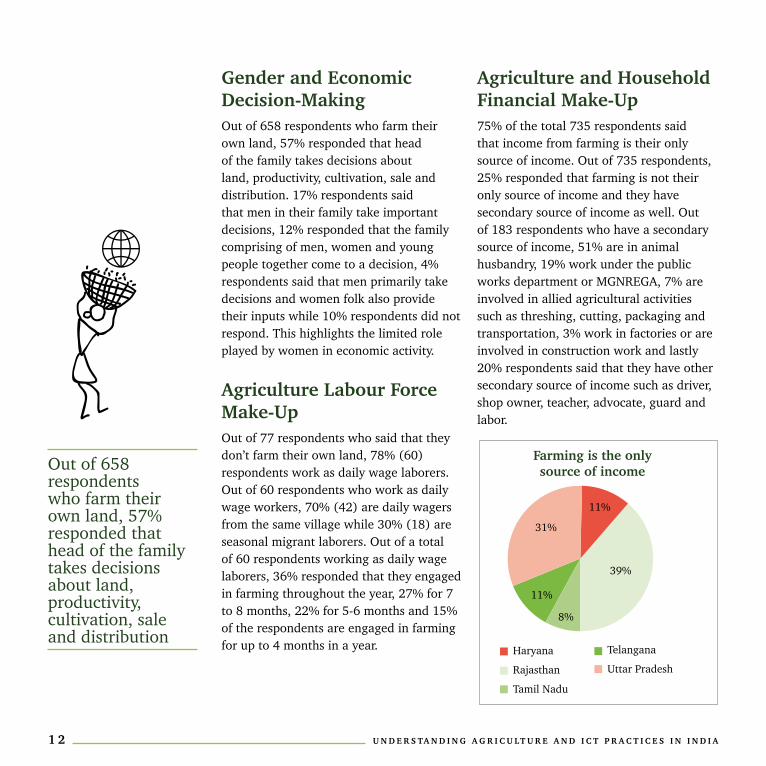
agriculture and Household Financial Make-Up 75% of the total 735 respondents said that income from farming is their only source of income. Out of 735 respondents, 25% responded that farming is not their only source of income and they have secondary source of income as well. Out of 183 respondents who have a secondary source of income, 51% are in animal husbandry, 19% work under the public works department or MGNREGA, 7% are involved in allied agricultural activities such as threshing, cutting, packaging and transportation, 3% work in factories or are involved in construction work and lastly 20% respondents said that they have other secondary source of income such as driver, shop owner, teacher, advocate, guard and labor.
11%
39%
8%
11%
31%
Haryana
Rajasthan
Tamil Nadu
Telangana
Uttar Pradesh
Farming is the only source of incomeOut of 658
respondents who farm their own land, 57% responded that head of the family takes decisions about land, productivity, cultivation, sale and distribution
U n d e r s ta n d i n g a g r i c U lt U r e a n d i c t p r a c t i c e s i n i n d i a 1 3
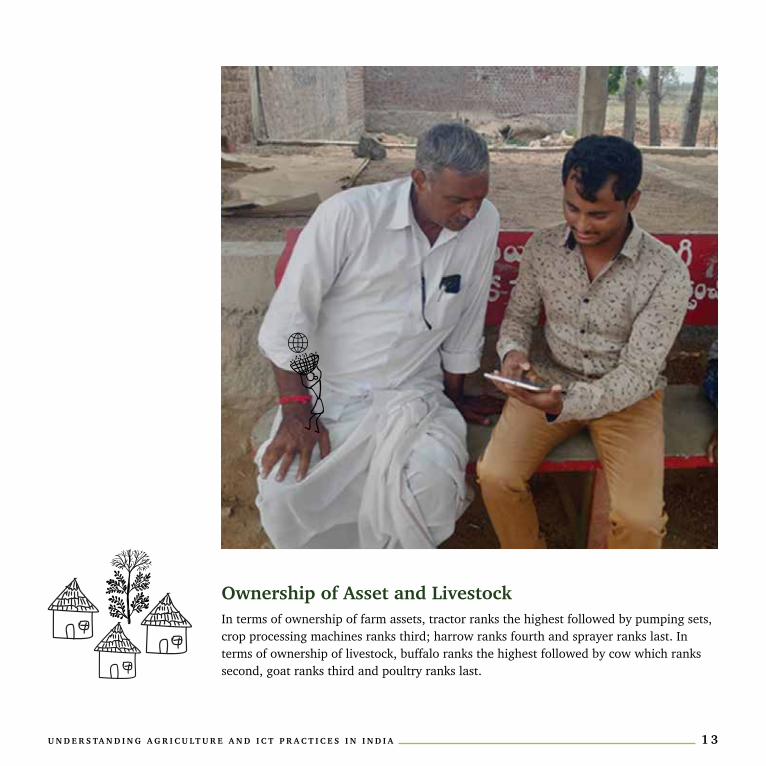
Ownership of asset and livestockIn terms of ownership of farm assets, tractor ranks the highest followed by pumping sets, crop processing machines ranks third; harrow ranks fourth and sprayer ranks last. In terms of ownership of livestock, buffalo ranks the highest followed by cow which ranks second, goat ranks third and poultry ranks last.
1 4 U n d e r s ta n d i n g a g r i c U lt U r e a n d i c t p r a c t i c e s i n i n d i a
Farming practices
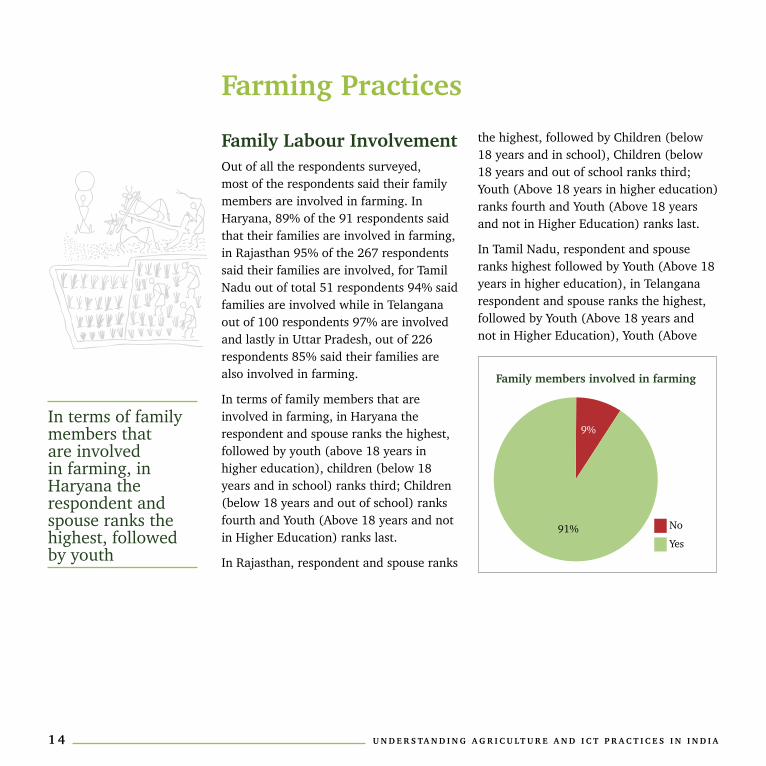
Family labour involvement Out of all the respondents surveyed, most of the respondents said their family members are involved in farming. In Haryana, 89% of the 91 respondents said that their families are involved in farming, in Rajasthan 95% of the 267 respondents said their families are involved, for Tamil Nadu out of total 51 respondents 94% said families are involved while in Telangana out of 100 respondents 97% are involved and lastly in Uttar Pradesh, out of 226 respondents 85% said their families are also involved in farming.
In terms of family members that are involved in farming, in Haryana the respondent and spouse ranks the highest, followed by youth (above 18 years in higher education), children (below 18 years and in school) ranks third; Children (below 18 years and out of school) ranks fourth and Youth (Above 18 years and not in Higher Education) ranks last.
In Rajasthan, respondent and spouse ranks
the highest, followed by Children (below 18 years and in school), Children (below 18 years and out of school ranks third; Youth (Above 18 years in higher education) ranks fourth and Youth (Above 18 years and not in Higher Education) ranks last.
In Tamil Nadu, respondent and spouse ranks highest followed by Youth (Above 18 years in higher education), in Telangana respondent and spouse ranks the highest, followed by Youth (Above 18 years and not in Higher Education), Youth (Above
Family members involved in farming
No
Yes
9%
91%
In terms of family members that are involved in farming, in Haryana the respondent and spouse ranks the highest, followed by youth
U n d e r s ta n d i n g a g r i c U lt U r e a n d i c t p r a c t i c e s i n i n d i a 1 5
18 years in higher education) ranks third; Children (below 18 years and in school) ranks fourth and Children (below 18 years and out of school) ranks last. In Uttar Pradesh respondent and spouse ranks highest followed by Youth (Above 18 years in higher education), Youth (Above 18 years and not in Higher Education) ranks third, Children (below 18 years and out of school) ranks fourth and Children (below 18 years and in school) ranks last.
cultivation practices 65% of the total respondents said that they grow 2 crops in their field in a year, 14% grow 3 crops, 11% grow 1 crop, and 4% grow 4 crops in a year while 1% of respondents each grow 11 and 5 crops in a year. In Haryana, out of 91 respondents 56% grow 2 crops, 24% grow 3 crops and 12% grow 4 crops. In Rajasthan out of 267 respondents, 80% grow 2 crops, 6% grow 3 crops and 5% grow 4 crops while in Tamil Nadu, out of 51 respondents, 98% grow 1 and 2% of the respondents grow 2 crops. In Telangana 71% of the 100 respondents grow 2 crops, 27% grow 1 crop and lastly in Uttar Pradesh 64% of the 226 respondents grow 2 crops, 30% grow 3 crops and 4% grow 4 crops. In terms of deciding which crops comes after another, in Haryana season (Kharif/Rabi) ranks the highest, followed by Past year experiences (Like crop failure, low prices etc.), To preserve soil health ranks third and Availability of seeds at reasonable rates ranks last. In Rajasthan
season (Kharif/Rabi) ranks the highest, followed by to preserve soil health, Past year experiences (like crop failure, low prices etc.) ranks third and Availability of seeds at reasonable rates ranks last. In Tamil Nadu, season (Kharif/Rabi) ranks the highest while past experience (like crop failure, low prices etc.) and to preserve soil health ranks second. In Telangana, season (kharif/rabi) ranks the highest, followed by past year experiences (like crop failure, low prices), availability of seeds at reasonable rates ranks third and to preserve soil health ranks last. While in Uttar Pradesh season (Kharif/Rabi) ranks the highest, to preserve the health of soil ranks second, past year experiences (like crop failure, low prices) ranks third and availability of seeds at reasonable rates ranks last. Season (Kharif/Rabi) mostly determines the crop which would be sown after another which also aligns with India’s agriculture pattern which is mostly rain-fed and lack of proper irrigation facilities.
sourcing of seedsOut of total 735 respondents, 82% said they sourced their seeds from market, 12% got it from their own households, and 5% got it from the community seed bank and1% got seeds from other sources such as agriculture cooperative society. Out of 91 respondents from Haryana 80% source their seeds from the market and 20% source seed from their own household, in Rajasthan out of 267 respondents, 86% source seed from market, 13% from their
1 6 U n d e r s ta n d i n g a g r i c U lt U r e a n d i c t p r a c t i c e s i n i n d i a
own household and 1% from community seed bank, in Tamil Nadu 96% of the 51 respondents source seed from market, and 2% of the respondents each source seeds from their household and agriculture cooperative society. While in Telangana, out of 100 respondents 88% source seeds from market, 10% from community seed bank and 2% from their own households and lastly in Uttar Pradesh out of 226 respondents 73% source seed from market, 16% from their own households and 11% from the community seed banks. Market is the biggest source of providing seeds to farmers while community seed banks can be strengthened and would further help in promoting and sustaining a variety of crops and thereby reducing farmer’s dependence on the market.
area coverage82% of the total respondents said that full available area of land was used for their last crop while 18% (132) said that they cultivated crop in partial area of their land. 75 out of 132 respondents said lack of adequate irrigation facility/ water supply shortages is the major reason for using partial area of land for cultivation, 50 respondents said that unfarmed land was unusable, 34 people said that they did not have enough money to seed the entire land and lastly 19 people said that high prices of kerosene/oil to run the motor was their reason for partially cultivating their land.
crop production95% of the total respondents said that the total production of their last crop was between 0-100 quintals, 3% said it was between 101-200 quintals and for 1% it was from 201-300 quintals.
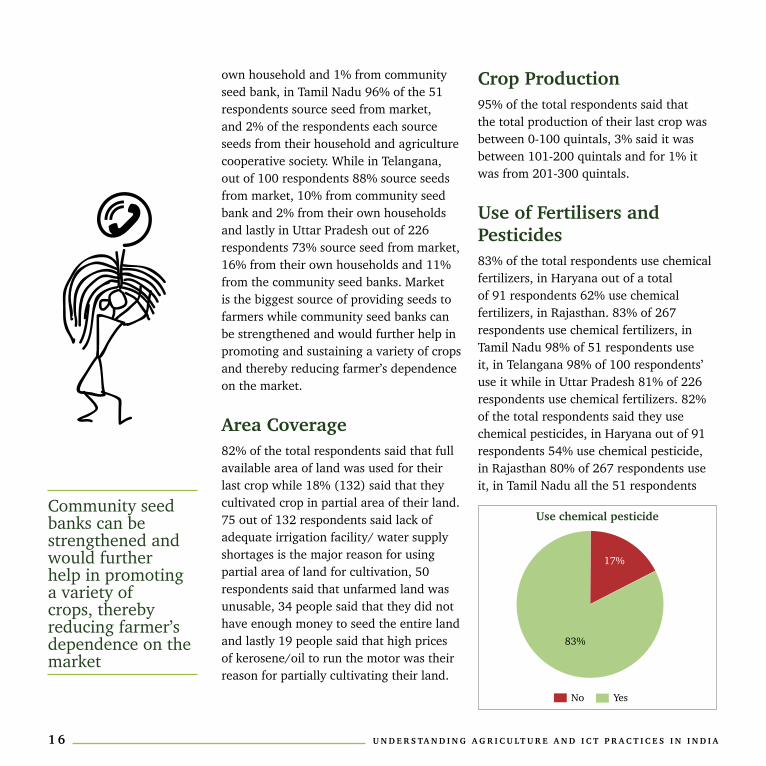
Use of Fertilisers and pesticides 83% of the total respondents use chemical fertilizers, in Haryana out of a total of 91 respondents 62% use chemical fertilizers, in Rajasthan. 83% of 267 respondents use chemical fertilizers, in Tamil Nadu 98% of 51 respondents use it, in Telangana 98% of 100 respondents’ use it while in Uttar Pradesh 81% of 226 respondents use chemical fertilizers. 82% of the total respondents said they use chemical pesticides, in Haryana out of 91 respondents 54% use chemical pesticide, in Rajasthan 80% of 267 respondents use it, in Tamil Nadu all the 51 respondents
Use chemical pesticide
No Yes
17%
83%
Community seed banks can be strengthened and would further help in promoting a variety of crops, thereby reducing farmer’s dependence on the market
U n d e r s ta n d i n g a g r i c U lt U r e a n d i c t p r a c t i c e s i n i n d i a 1 7
use it while in Telangana 99% of the 100 respondents use it and lastly in Uttar Pradesh 85% of 226 respondents use chemical pesticide.
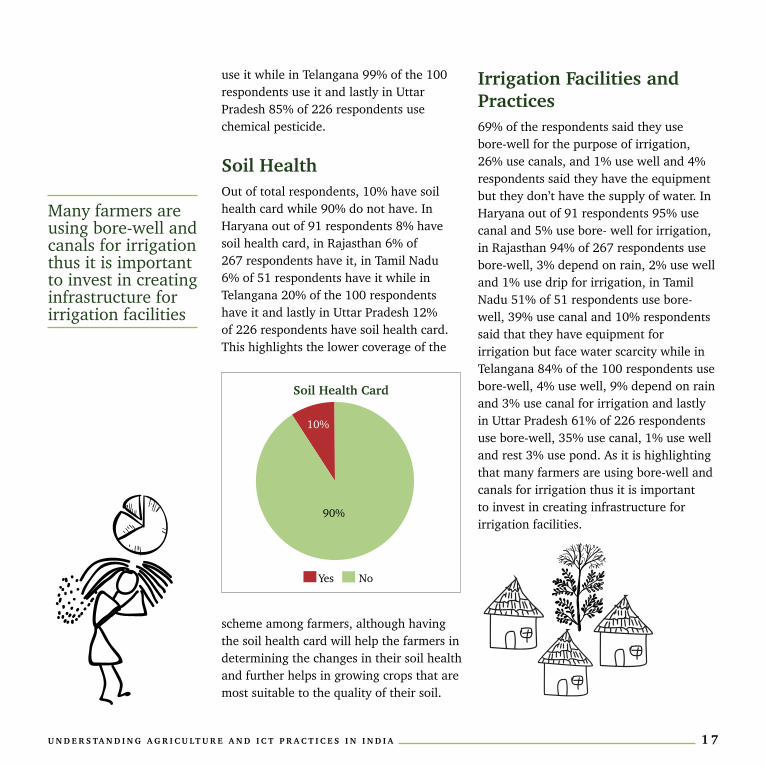
soil Health Out of total respondents, 10% have soil health card while 90% do not have. In Haryana out of 91 respondents 8% have soil health card, in Rajasthan 6% of 267 respondents have it, in Tamil Nadu 6% of 51 respondents have it while in Telangana 20% of the 100 respondents have it and lastly in Uttar Pradesh 12% of 226 respondents have soil health card. This highlights the lower coverage of the
scheme among farmers, although having the soil health card will help the farmers in determining the changes in their soil health and further helps in growing crops that are most suitable to the quality of their soil.
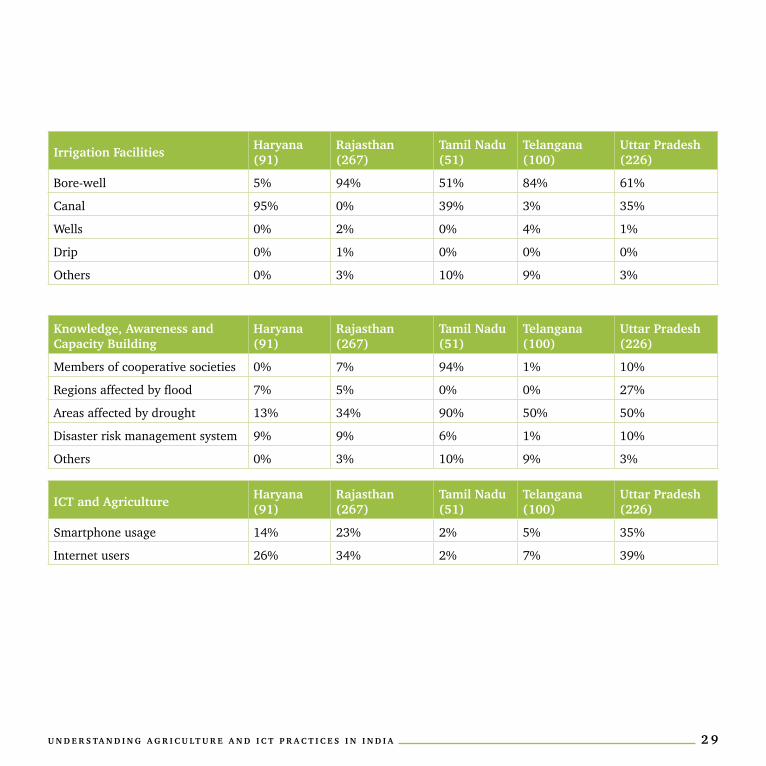
irrigation Facilities and practices69% of the respondents said they use bore-well for the purpose of irrigation, 26% use canals, and 1% use well and 4% respondents said they have the equipment but they don’t have the supply of water. In Haryana out of 91 respondents 95% use canal and 5% use bore- well for irrigation, in Rajasthan 94% of 267 respondents use bore-well, 3% depend on rain, 2% use well and 1% use drip for irrigation, in Tamil Nadu 51% of 51 respondents use bore-well, 39% use canal and 10% respondents said that they have equipment for irrigation but face water scarcity while in Telangana 84% of the 100 respondents use bore-well, 4% use well, 9% depend on rain and 3% use canal for irrigation and lastly in Uttar Pradesh 61% of 226 respondents use bore-well, 35% use canal, 1% use well and rest 3% use pond. As it is highlighting that many farmers are using bore-well and canals for irrigation thus it is important to invest in creating infrastructure for irrigation facilities.
soil Health card
Yes No
10%
90%
Many farmers are using bore-well and canals for irrigation thus it is important to invest in creating infrastructure for irrigation facilities
1 8 U n d e r s ta n d i n g a g r i c U lt U r e a n d i c t p r a c t i c e s i n i n d i a
agricultural Finance
cost of investment, recovery and debtOut of the total respondents, 45% of people were able to manage to recover the investment cost from the production and sale of their last crop at a profit, while 35% were just able to manage to recover the
cost and lastly 20% could not recover the cost from the production and had to sell their crop at a loss.
In Haryana out of 91 respondents, 77% respondents were able to recover the investment cost from the production and sell their last crop at a profit, 19% just managed to recover the cost and 4% could
U n d e r s ta n d i n g a g r i c U lt U r e a n d i c t p r a c t i c e s i n i n d i a 1 9
not recover the cost and had to sell their crop at a loss. In Rajasthan, out of 267 respondents, 49% managed to recover the investment cost from the production and sell of their last crop at a profit, while 34% were just able to manage to recover the cost and lastly 17% could not recover the cost from the production and had to sell their crop at a loss. In Tamil Nadu, out of 51 respondents 90% could not recover the cost from the production and had to sell their crop at a loss, 8% just managed to recover the cost and 2% managed to recover the investment cost from the production and sell of their last crop at a profit. In Telangana, 40% of 100 respondents just managed to recover the cost, 37% managed to recover the cost and sell their crop at a profit and 23% could not recover the cost and had to sell at a loss while in Uttar Pradesh, 48% just managed to recover the cost, 41% managed to recover the cost and sell at a profit while only 11% could not recover the cost and had to sell at a loss.
Out of 143 people who could not recover the cost from production and had to sell at a loss, 76% (109) said that it would affect their investment in the next farming cycle. Out of 109 respondents who said that it would affect their investment in next farming cycle, 92% (100) respondents said that they have had to borrow money
to make up for this deficit. 46% of 100 respondents borrowed money from their friends and relatives, 21% borrowed from bank, 17% from money lender and 7% from cooperative society. Out of 100 respondents who have had to borrow money, 54% borrow money at interest rate of 1%, 20% borrow at interest rate of 3%, 15% borrow at interest rate of 2% while 4% borrow money at 0 interest rate and lastly 2% each of the respondents borrow money at the rate of interest of 4%, 5% and 10% respectively. 92% of the 100 respondents who have had to borrow money are still in debt while 8% have repaid their loan. Out of 60 respondents who work as daily wagers, 57% said that their wages have been affected as they were not able to repay the debt.
crop insurance67% (493) of the total respondents have never insured their crops, 22% insure their crop sometimes while 11% responded that they always insure their crops. Out of 493 respondents who never insure their crops, 48% said the main reason for not opting for crop insurance is lack of information, for 27% it is shortage of money, 9% said that the insurance policies are not in favor of farmers, 7% responded that they do not trust the insurance companies while 5% never felt the need for the insurance.
In Tamil Nadu, out of 51 respondents 90% could not recover the cost from the production and had to sell their crop at a loss
2 0 U n d e r s ta n d i n g a g r i c U lt U r e a n d i c t p r a c t i c e s i n i n d i a
production, storage and distribution
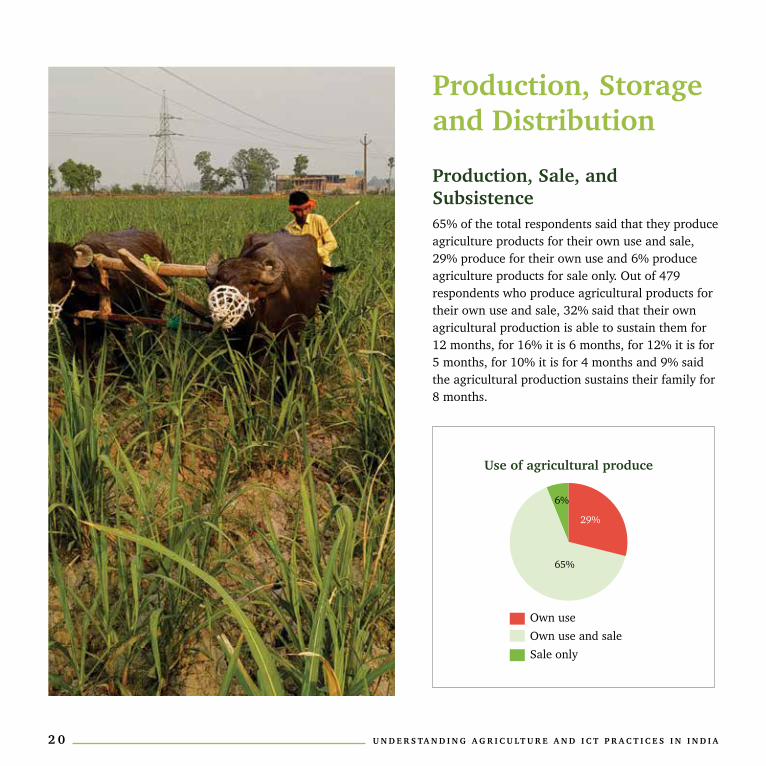
production, sale, and subsistence65% of the total respondents said that they produce agriculture products for their own use and sale, 29% produce for their own use and 6% produce agriculture products for sale only. Out of 479 respondents who produce agricultural products for their own use and sale, 32% said that their own agricultural production is able to sustain them for 12 months, for 16% it is 6 months, for 12% it is for 5 months, for 10% it is for 4 months and 9% said the agricultural production sustains their family for 8 months.
Own use Own use and saleSale only
Use of agricultural produce
29%
65%
6%
U n d e r s ta n d i n g a g r i c U lt U r e a n d i c t p r a c t i c e s i n i n d i a 2 1
storage, sale and distributionIn terms of selling agricultural products, in Uttar Pradesh organized markets and local haat ranks the highest followed by middlemen. In Haryana organized market ranks the highest, followed by middlemen and lastly local haat. In Rajasthan, organized market ranks the highest, followed by middlemen and local haat ranks the last. In Tamil Nadu, organized market ranks the highest followed by local haat while in Telangana, middlemen rank the highest, followed by organized market and local haat ranks last. This highlights the practice of selling agricultural products in organized markets and to middlemen, although farmers can be further encouraged to sell their produce in local market which will further help in reducing the cost given to middlemen and would also fetch them better prices.
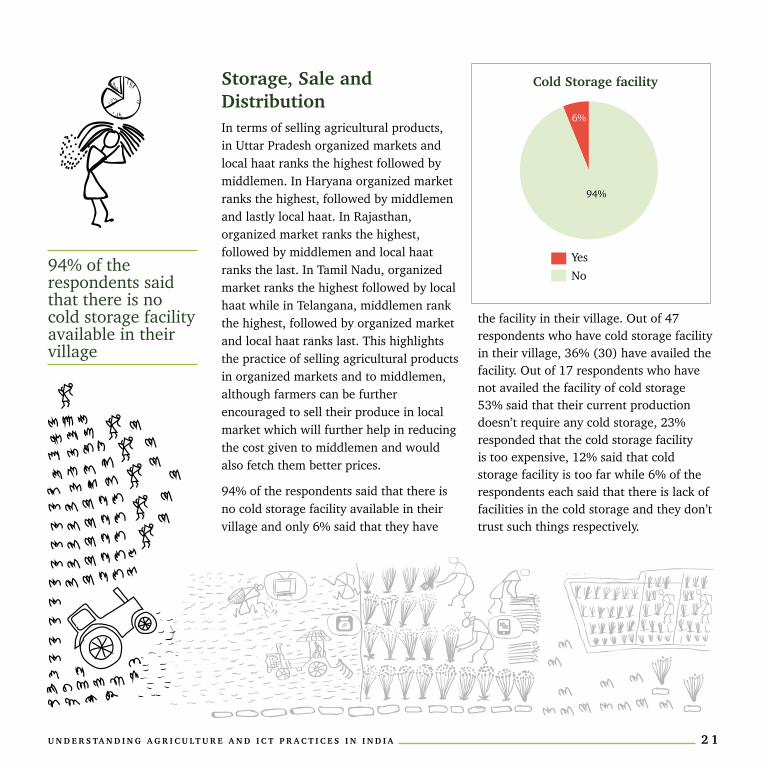
94% of the respondents said that there is no cold storage facility available in their village and only 6% said that they have
the facility in their village. Out of 47 respondents who have cold storage facility in their village, 36% (30) have availed the facility. Out of 17 respondents who have not availed the facility of cold storage 53% said that their current production doesn’t require any cold storage, 23% responded that the cold storage facility is too expensive, 12% said that cold storage facility is too far while 6% of the respondents each said that there is lack of facilities in the cold storage and they don’t trust such things respectively.
YesNo
cold storage facility
6%
94%
94% of the respondents said that there is no cold storage facility available in their village
2 2 U n d e r s ta n d i n g a g r i c U lt U r e a n d i c t p r a c t i c e s i n i n d i a
Knowledge, training, and capacity-Building
Knowledge, awareness, and stakeholdersOut of total respondents, only 4% (29) said they have received training related to cultivation practices of crops, out of 29 respondents who have received training, 69% got it from the local government officials, 23% got it from the NGOs, 8% from private sectors. In Haryana out of 91 respondents 96% haven’t received any training while only 4% (3) have received training. All the 3 people who have received training from government officials. In Rajasthan out of 267 respondents, 97% (259) haven’t received training while 8 (3%) have. Out of 8 respondents, 50% received training from local government officials and 25% each from NGOs and private sector respectively. None of the respondents from Tamil Nadu and Telangana have received any training related to agriculture practices of crop, while in Uttar Pradesh, out of 226 respondents, 92% have not received any training and 8% (17) have received, out of 17 respondents who have received training, 73% have received training from local government officials and 27% from NGOs. This highlights that framers from states like Tamil Nadu and Telangana have not received any training while in
other states the percentage of those who have received training is low, thus more trainings can be provided by collaborating with local government and NGOs for generating awareness regarding cultivation practices. 86% of the total respondents did not know about community seed bank, while 14% know about it. Out of 104 respondents who know about community seed bank, 48% are preserving indigenous seeds in their community seed bank.
37% (270) of the total respondents have heard about organic farming and 17% of the total respondents practice organic farming. In Haryana out of 91 respondents 15% practice organic farming, in Rajasthan 23% of 267 respondents practice it, in Tamil Nadu 2% of 51 respondents do it while in Telangana 5% of the 100 respondents do it and lastly in Uttar Pradesh 19% of 226 respondents practice organic farming. Out of 610 respondents who do not practice organic farming, 65% want to know about organic farming. In Haryana out of 91 respondents 62% want to know about organic farming, in Rajasthan 47% of 267 respondents want to know, in Tamil Nadu 96% of 51 respondents want to know while in Telangana 44% of the 100 respondents want to know and lastly in Uttar Pradesh
Farmers from states like Tamil Nadu and Telangana have not received any training while in other states the percentage of those who have received training is low
U n d e r s ta n d i n g a g r i c U lt U r e a n d i c t p r a c t i c e s i n i n d i a 2 3
55% of 226 want to know about organic farming.
networks and institutional support11% (78) of the total respondents are members of cooperative societies. In Haryana none of the 91 respondents are members of cooperative societies, in Rajasthan 7% of 276 respondents are members of cooperative society, in Tamil Nadu, 94% of 51 respondents are members while in Telangana only 1% of 100 respondents are members of cooperative society and lastly in Uttar Pradesh, 10% of 226 respondents are members of cooperative society. There is a need to generate more awareness
about cooperative societies and how they can benefit farmers in terms being self-sufficient and other benefits such as accessibility of credit, marketing supplying.
When asked about the kind of agricultural support that respondents get from the government, most of the respondents said they haven’t received any agricultural support from the government, getting subsidies on seeds, fertilizers, and pesticides came second, information about agricultural best practices ranks third, getting social protection schemes ranks fourth, while infrastructural support like irrigation, water supply etc. ranks fifth and agricultural finance like crop insurance, zero interest loan etc. ranks last.
2 4 U n d e r s ta n d i n g a g r i c U lt U r e a n d i c t p r a c t i c e s i n i n d i a
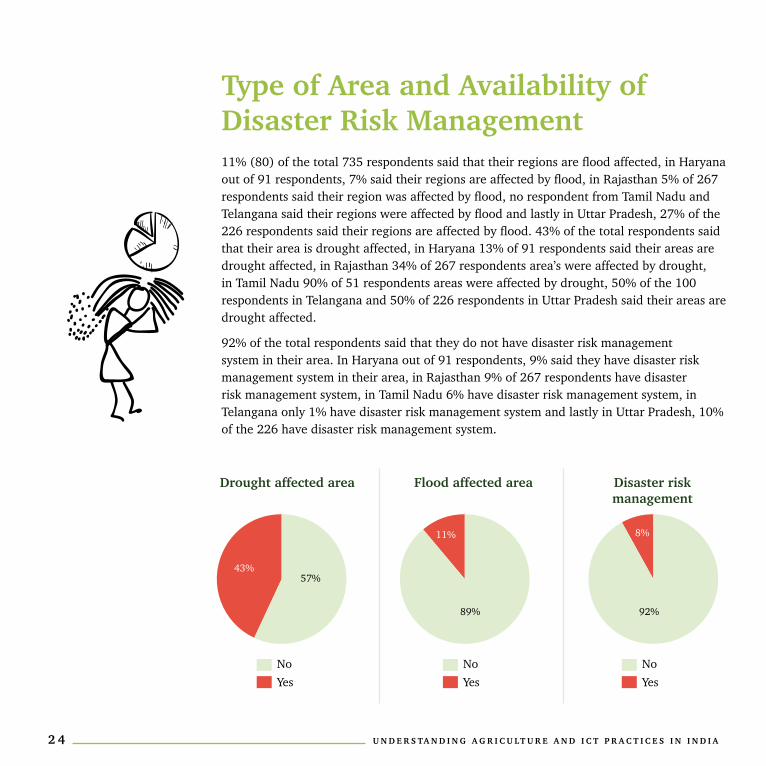
type of area and availability of disaster risk Management11% (80) of the total 735 respondents said that their regions are flood affected, in Haryana out of 91 respondents, 7% said their regions are affected by flood, in Rajasthan 5% of 267 respondents said their region was affected by flood, no respondent from Tamil Nadu and Telangana said their regions were affected by flood and lastly in Uttar Pradesh, 27% of the 226 respondents said their regions are affected by flood. 43% of the total respondents said that their area is drought affected, in Haryana 13% of 91 respondents said their areas are drought affected, in Rajasthan 34% of 267 respondents area’s were affected by drought, in Tamil Nadu 90% of 51 respondents areas were affected by drought, 50% of the 100 respondents in Telangana and 50% of 226 respondents in Uttar Pradesh said their areas are drought affected.
92% of the total respondents said that they do not have disaster risk management system in their area. In Haryana out of 91 respondents, 9% said they have disaster risk management system in their area, in Rajasthan 9% of 267 respondents have disaster risk management system, in Tamil Nadu 6% have disaster risk management system, in Telangana only 1% have disaster risk management system and lastly in Uttar Pradesh, 10% of the 226 have disaster risk management system.
NoYes
NoYes
NoYes
drought affected area Flood affected area disaster risk management
43%
11% 8%
57%
89% 92%
U n d e r s ta n d i n g a g r i c U lt U r e a n d i c t p r a c t i c e s i n i n d i a 2 5
access to information
type of information availableWith respect to agriculture related information that is available in the village, most of the respondents said that they do not receive any kind of information related to agriculture. In the instance where such information is available information on animal husbandry and livestock ranks first, information about farming practices ranks second, information on specific crops ranks third, information related to government schemes ranks fourth followed by information and resources on how to solve problems with livestock or crops ranking fifth and information about market linkage ranking last.
agriculture related government entitlements24% of the total respondents said that they availed government schemes related to agriculture. In Haryana out of 91 respondents 12% have availed government schemes related to agriculture,
in Rajasthan 20% of 267 respondents have availed, in Tamil Nadu 2% of 51 respondents have availed the schemes while in Telangana 44% of the 100 respondents have availed and lastly in Uttar Pradesh 30% of 226 respondents have availed government schemes related to agriculture.
Out of 178 respondents who have availed government schemes related to agriculture, 66% have availed Pradhan Mantri Kisan Samman Nidhi Yojana, 7% have availed Pradhan Mantri Fasal Bima Yojana and 1% have availed Parampargat Krishi Vikas Yojana. Out of 178 respondents who have availed government schemes, 49% received information from Panchayat office or Sarpanch, 22% from the newspapers, 21% get it from their neighbors or fellow residents in the village, 3% from the television and 2% of the respondents each from mobile phone (related information from government via SMS) and mobile phone (related information from government via apps) respectively and 1% get information from radio.
In Haryana out of 91 respondents 12% have availed government schemes related to agriculture

2 6 U n d e r s ta n d i n g a g r i c U lt U r e a n d i c t p r a c t i c e s i n i n d i a
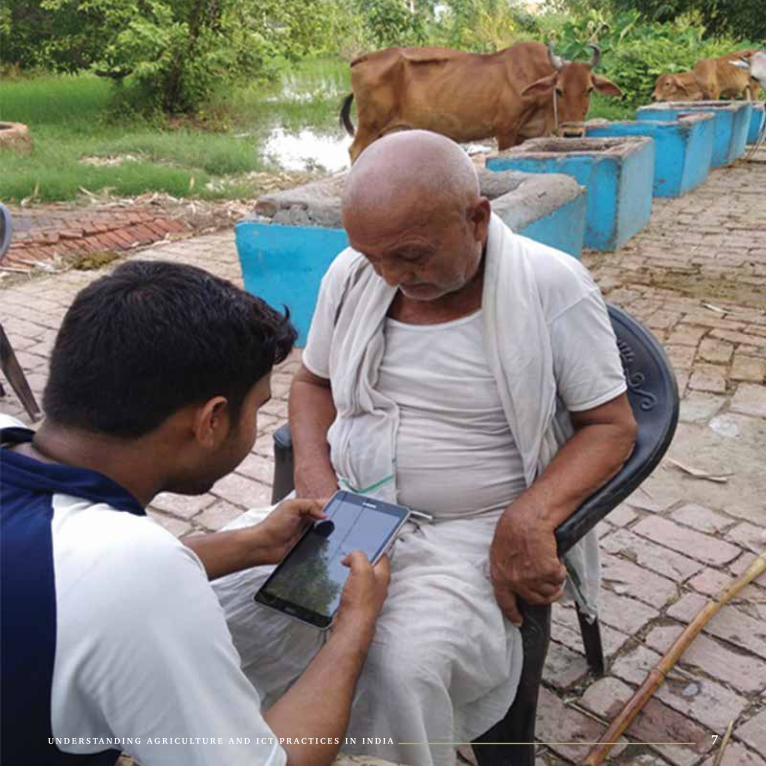
ict and agricultureOut of total respondents, 79% use basic feature phone while 21% of the respondents use smartphone. In Haryana out of 91 respondents 14% use smartphone, in Rajasthan 23% of 267 respondents use it, in Tamil Nadu 2% of 51 respondents use smartphone while in Telangana 5% of the 100 respondents use smartphone and lastly in Uttar Pradesh 35% of 226 respondents use smartphone.
65% (479) of the respondents own the device and are the owners of their device, while 29% (215) respondents who own the device but share it with their families, and lastly out of 6% (41) respondents do not own the device. 71% of the total respondents said they do not use internet and 29% use internet. In Haryana out of 91 respondents 26% use internet, in Rajasthan 34% of 267 respondents use it, in Tamil Nadu 2% of 51 respondents use it while in Telangana 7% of the 100 respondents use it and lastly in Uttar Pradesh 39% of 226 respondents use internet.
90% of 210 respondents who use internet use it from their mobile phones while 10% use it from their cable Wi-Fi. In terms of using internet, watching videos on films, songs, games and other entertainment ranks the highest, followed by looking for news, respondents look for information related to agriculture and related services ranks third, using internet for downloading music, videos, and movies etc. ranks fourth and using for social media ranks last.
Out of the total 735 respondents, availing facilities of digital services from common
NoYes
Basic feature phoneSmartphone
internet Usage Mobile phone use
29%21%
71%
79%
U n d e r s ta n d i n g a g r i c U lt U r e a n d i c t p r a c t i c e s i n i n d i a 2 7
service centres ranks the first, followed by availing facilities of digital services from their own mobile phone (owner and primary user) which ranks second. 163 respondents also noted that they did not understand what digital services meant. 78 people reported as having not availed such services. Availing digital service facilities from friends/ relative’s computer rank third from last, while availing it from shared mobile (not owner and secondary user) hold the penultimate rank with cyber cafes ranking last.
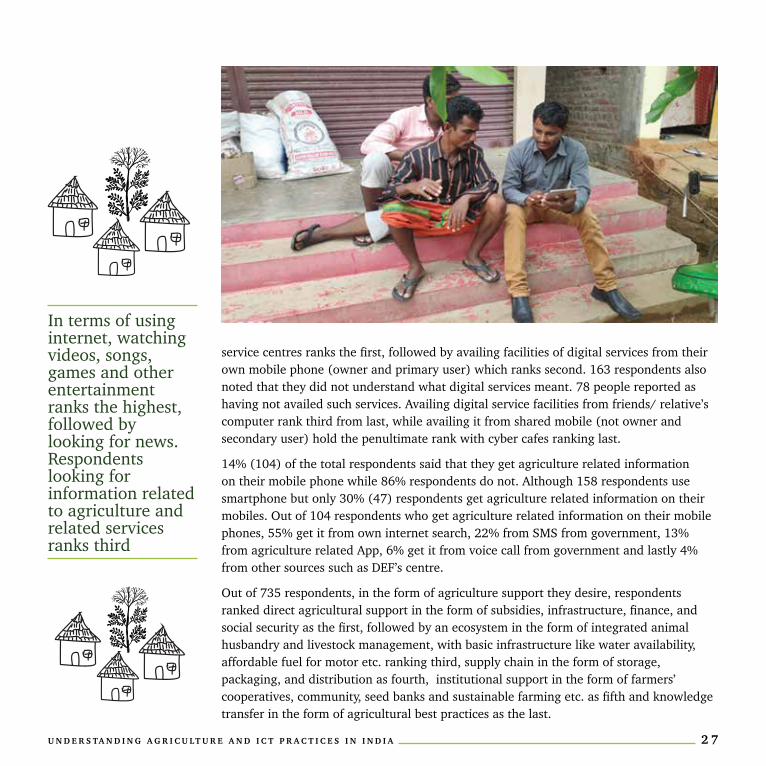
14% (104) of the total respondents said that they get agriculture related information on their mobile phone while 86% respondents do not. Although 158 respondents use smartphone but only 30% (47) respondents get agriculture related information on their mobiles. Out of 104 respondents who get agriculture related information on their mobile phones, 55% get it from own internet search, 22% from SMS from government, 13% from agriculture related App, 6% get it from voice call from government and lastly 4% from other sources such as DEF’s centre.
Out of 735 respondents, in the form of agriculture support they desire, respondents ranked direct agricultural support in the form of subsidies, infrastructure, finance, and social security as the first, followed by an ecosystem in the form of integrated animal husbandry and livestock management, with basic infrastructure like water availability, affordable fuel for motor etc. ranking third, supply chain in the form of storage, packaging, and distribution as fourth, institutional support in the form of farmers’ cooperatives, community, seed banks and sustainable farming etc. as fifth and knowledge transfer in the form of agricultural best practices as the last.
In terms of using internet, watching videos, songs, games and other entertainment ranks the highest, followed by looking for news. Respondents looking for information related to agriculture and related services ranks third
2 8 U n d e r s ta n d i n g a g r i c U lt U r e a n d i c t p r a c t i c e s i n i n d i a
state-Wise comparison
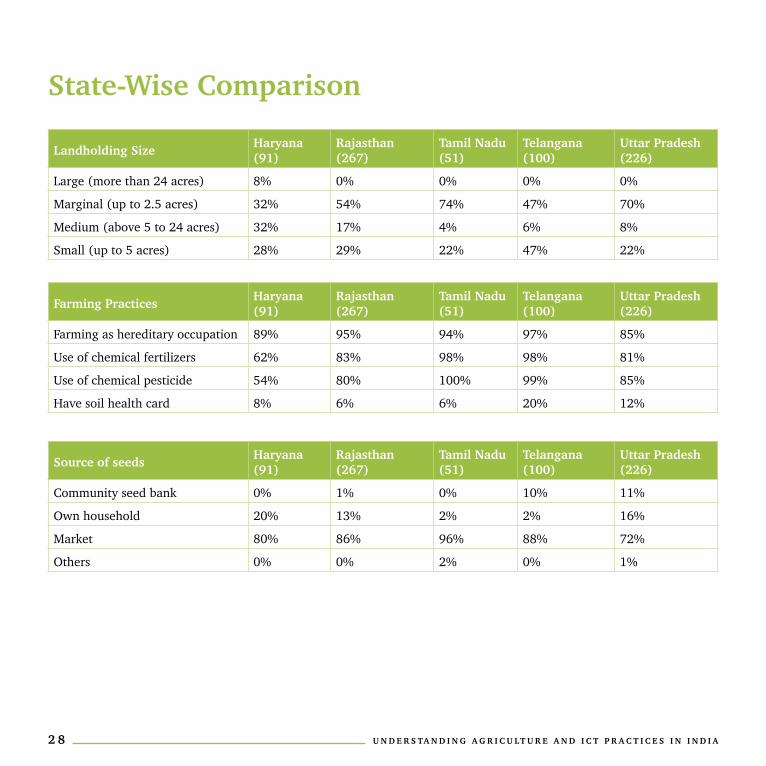
landholding size Haryana (91)
rajasthan (267)
tamil nadu (51)
telangana (100)
Uttar pradesh (226)
Large (more than 24 acres) 8% 0% 0% 0% 0%
Marginal (up to 2.5 acres) 32% 54% 74% 47% 70%
Medium (above 5 to 24 acres) 32% 17% 4% 6% 8%
Small (up to 5 acres) 28% 29% 22% 47% 22%
Farming practices Haryana (91)
rajasthan (267)
tamil nadu (51)
telangana (100)
Uttar pradesh (226)
Farming as hereditary occupation 89% 95% 94% 97% 85%
Use of chemical fertilizers 62% 83% 98% 98% 81%
Use of chemical pesticide 54% 80% 100% 99% 85%
Have soil health card 8% 6% 6% 20% 12%
source of seeds Haryana (91)
rajasthan (267)
tamil nadu (51)
telangana (100)
Uttar pradesh (226)
Community seed bank 0% 1% 0% 10% 11%
Own household 20% 13% 2% 2% 16%
Market 80% 86% 96% 88% 72%
Others 0% 0% 2% 0% 1%
U n d e r s ta n d i n g a g r i c U lt U r e a n d i c t p r a c t i c e s i n i n d i a 2 9
irrigation Facilities Haryana (91)
rajasthan (267)
tamil nadu (51)
telangana (100)
Uttar pradesh (226)
Bore-well 5% 94% 51% 84% 61%
Canal 95% 0% 39% 3% 35%
Wells 0% 2% 0% 4% 1%
Drip 0% 1% 0% 0% 0%
Others 0% 3% 10% 9% 3%
Knowledge, awareness and capacity Building
Haryana (91)
rajasthan (267)
tamil nadu (51)
telangana (100)
Uttar pradesh (226)
Members of cooperative societies 0% 7% 94% 1% 10%
Regions affected by flood 7% 5% 0% 0% 27%
Areas affected by drought 13% 34% 90% 50% 50%
Disaster risk management system 9% 9% 6% 1% 10%
Others 0% 3% 10% 9% 3%
ict and agriculture Haryana (91)
rajasthan (267)
tamil nadu (51)
telangana (100)
Uttar pradesh (226)
Smartphone usage 14% 23% 2% 5% 35%
Internet users 26% 34% 2% 7% 39%
3 0 U n d e r s ta n d i n g a g r i c U lt U r e a n d i c t p r a c t i c e s i n i n d i a
recommendations• Provide agricultural support in the form of subsidies, infrastructure, finance, and
social security
• Provide agriculture related information on mobile phones
• Improve irrigation facility and supply of water in the farms.
• Generate awareness regarding the use of soil health card, crop insurance, sustainable agricultural and financial practices among people
• Generate awareness about cold storage and liaise with stakeholders to create the facility of cold storage
• Create awareness about the benefits of cooperative societies and how they can be helpful
• Provide training related to cultivation practices of crops
• Generate awareness about government schemes on agriculture
• Development of regulated Mandi at village level
• Developing a sustainable water distribution and irrigation system
U n d e r s ta n d i n g a g r i c U lt U r e a n d i c t p r a c t i c e s i n i n d i a 3 1
3 2 U n d e r s ta n d i n g a g r i c U lt U r e a n d i c t p r a c t i c e s i n i n d i a
ContaCt
Digital Empowerment FoundationHouse No. 44, 2nd & 3rd Floor (Next to Naraina IIT Academy)
Kalu Sarai, (Near IIT Flyover), New Delhi – 110016
Tel: 91-11-26532786 / Fax: 91-11-26532787Email: [email protected] | URL: www.defindia.org