Embed Size (px)
Citation preview

Understanding, Accessing, & Using
New CANS & ANSA Outcome
Management Reports in Practice
Betty Walton, Wendy Harrold, & Stephanie Moynihan
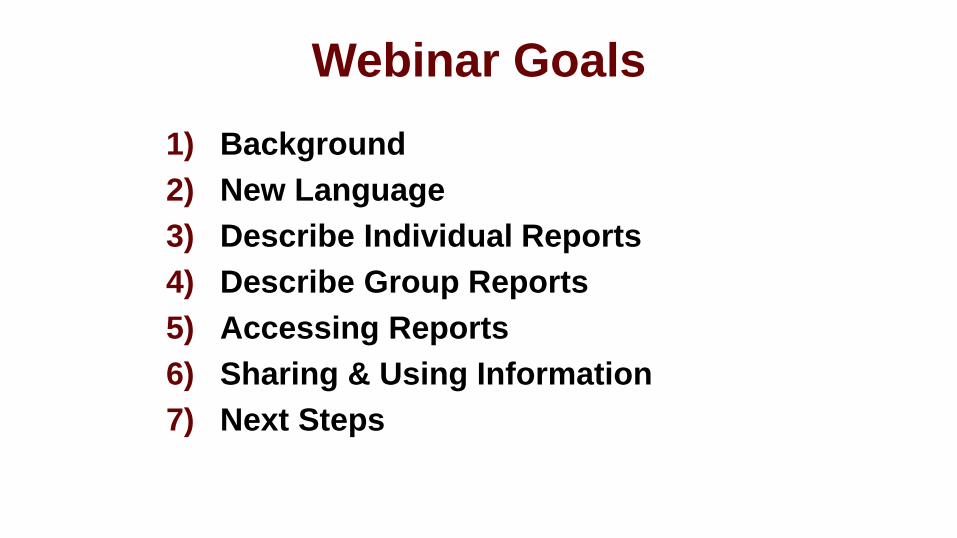
Webinar Goals
1) Background
2) New Language
3) Describe Individual Reports
4) Describe Group Reports
5) Accessing Reports
6) Sharing & Using Information
7) Next Steps
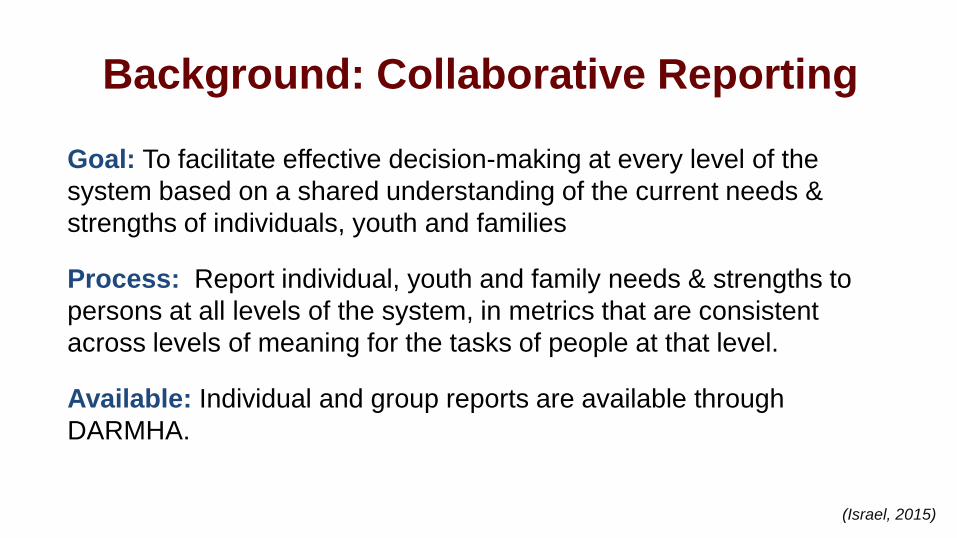
Background: Collaborative Reporting
Goal: To facilitate effective decision-making at every level of the
system based on a shared understanding of the current needs &
strengths of individuals, youth and families
Process: Report individual, youth and family needs & strengths to
persons at all levels of the system, in metrics that are consistent
across levels of meaning for the tasks of people at that level.
Available: Individual and group reports are available through
DARMHA.
(Israel, 2015)
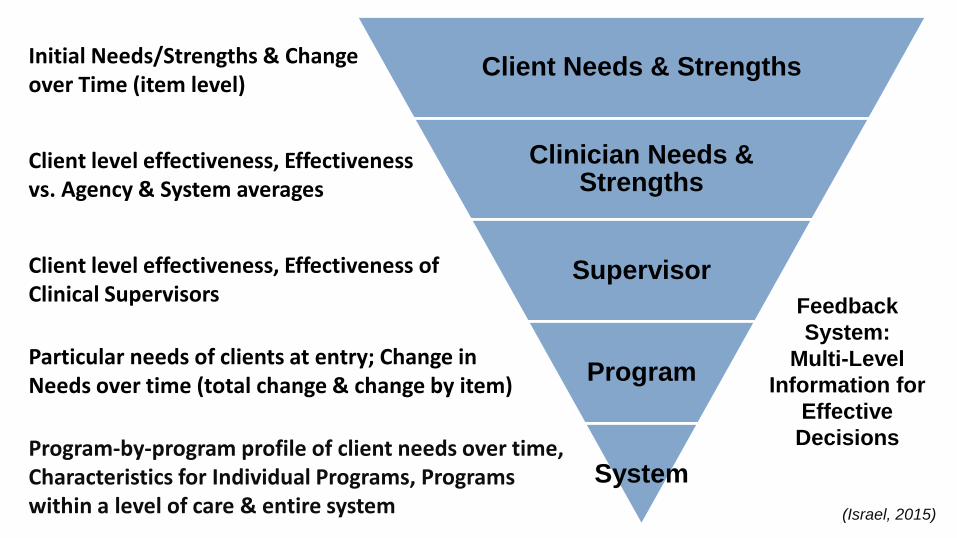
Feedback
System:
Multi-Level
Information for
Effective
Decisions
Client Needs & Strengths
Clinician Needs & Strengths
Supervisor
Program
System
Initial Needs/Strengths & Change over Time (item level)
Client level effectiveness, Effectiveness vs. Agency & System averages
Client level effectiveness, Effectiveness of Clinical Supervisors
Particular needs of clients at entry; Change in Needs over time (total change & change by item)
Program-by-program profile of client needs over time, Characteristics for Individual Programs, Programs within a level of care & entire system (Israel, 2015)
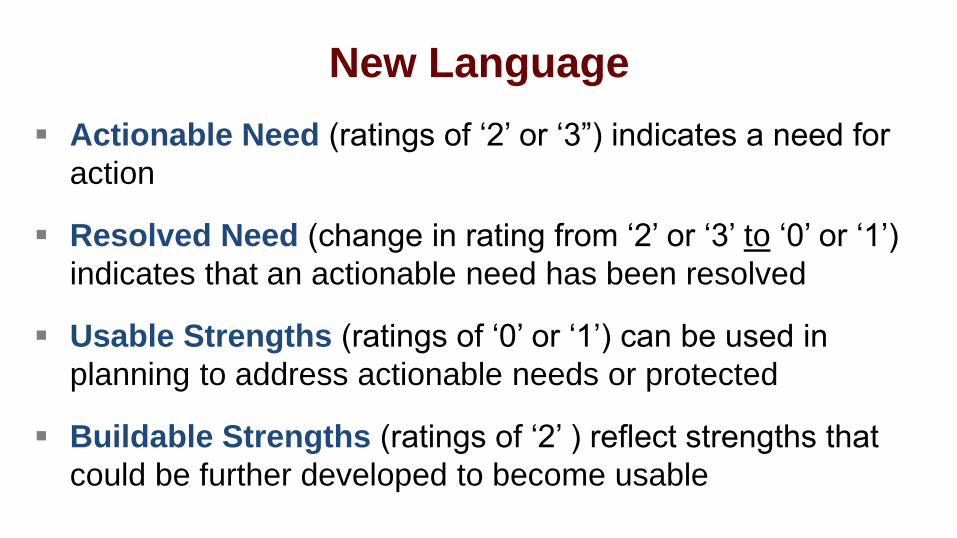
New Language
Actionable Need (ratings of ‘2’ or ‘3”) indicates a need for
action
Resolved Need (change in rating from ‘2’ or ‘3’ to ‘0’ or ‘1’)
indicates that an actionable need has been resolved
Usable Strengths (ratings of ‘0’ or ‘1’) can be used in
planning to address actionable needs or protected
Buildable Strengths (ratings of ‘2’ ) reflect strengths that
could be further developed to become usable
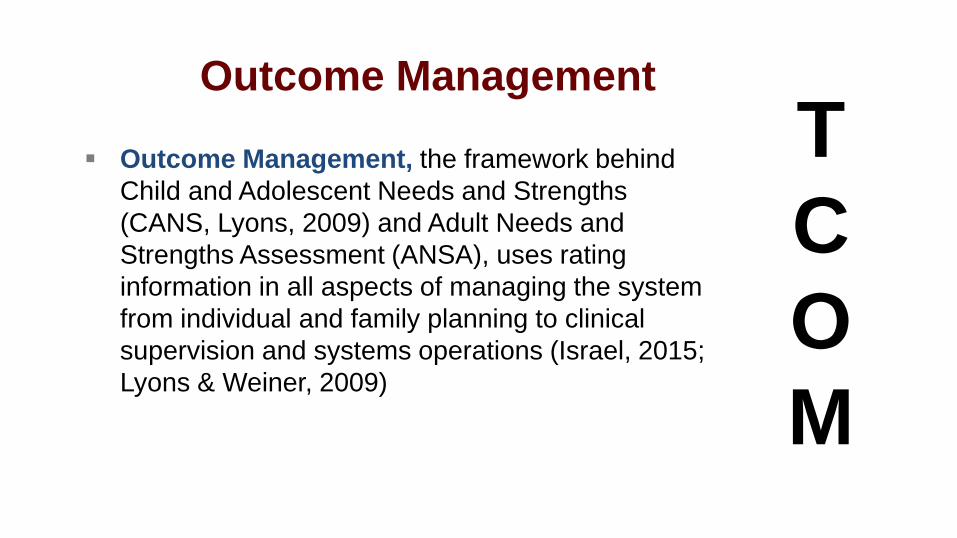
Outcome Management
Outcome Management, the framework behind
Child and Adolescent Needs and Strengths
(CANS, Lyons, 2009) and Adult Needs and
Strengths Assessment (ANSA), uses rating
information in all aspects of managing the system
from individual and family planning to clinical
supervision and systems operations (Israel, 2015;
Lyons & Weiner, 2009)
T
C
O
M
Monitoring Progress
New Reports
Meaningful Use of CANS & ANSA
ENGAGEMENT, PLANNING, AND
TRACKING CHANGE OVER TIME
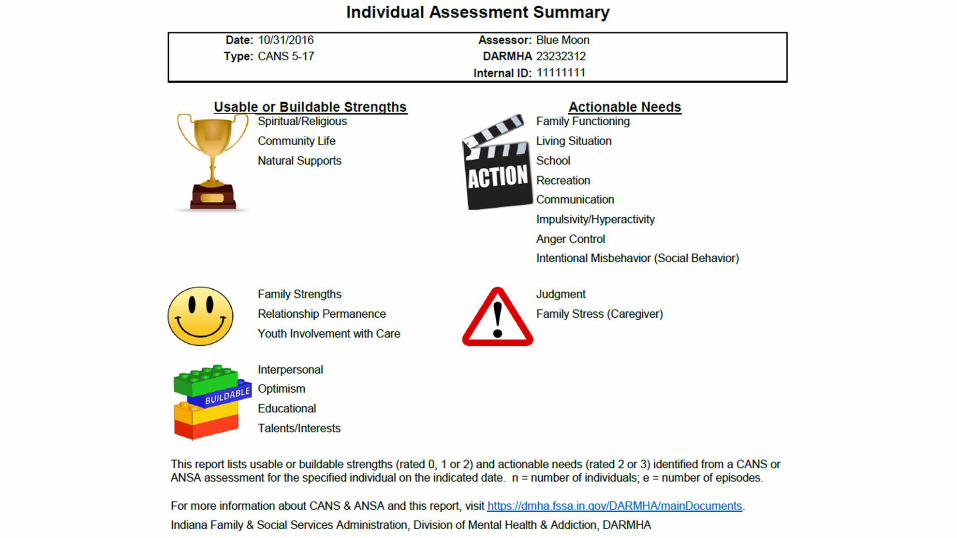
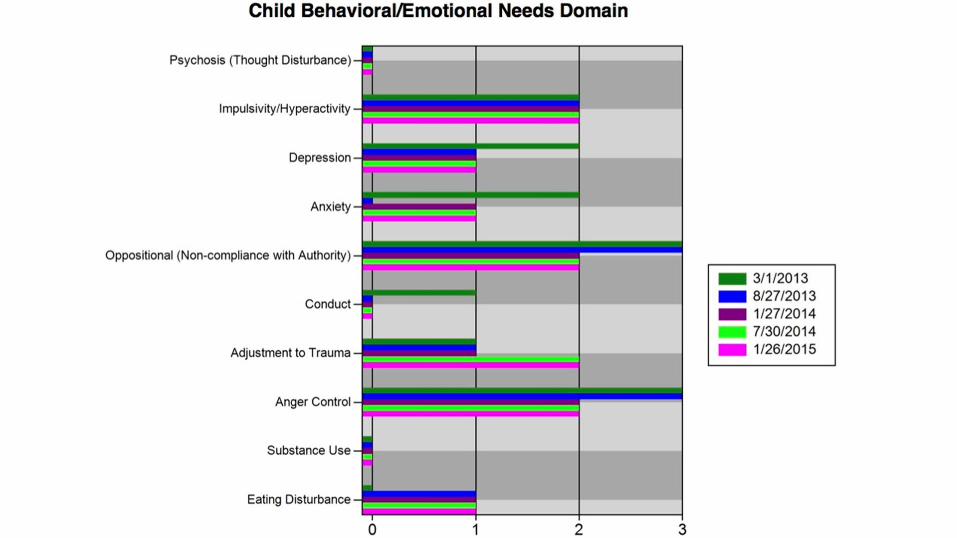
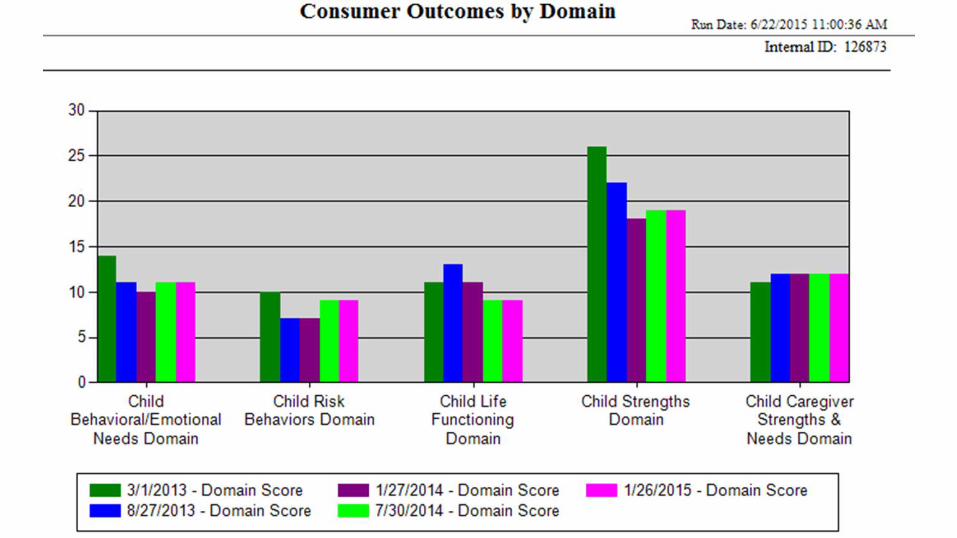
Individual Reports
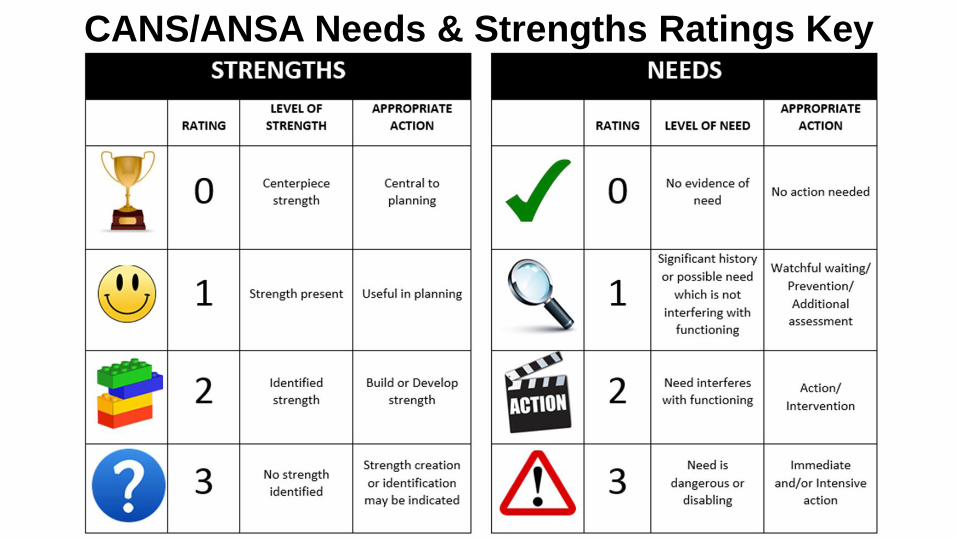
CANS/ANSA Needs & Strengths Ratings Key
TRACKING PROGRAM & SYSTEM
CHANGE
Group/Aggregate Reports
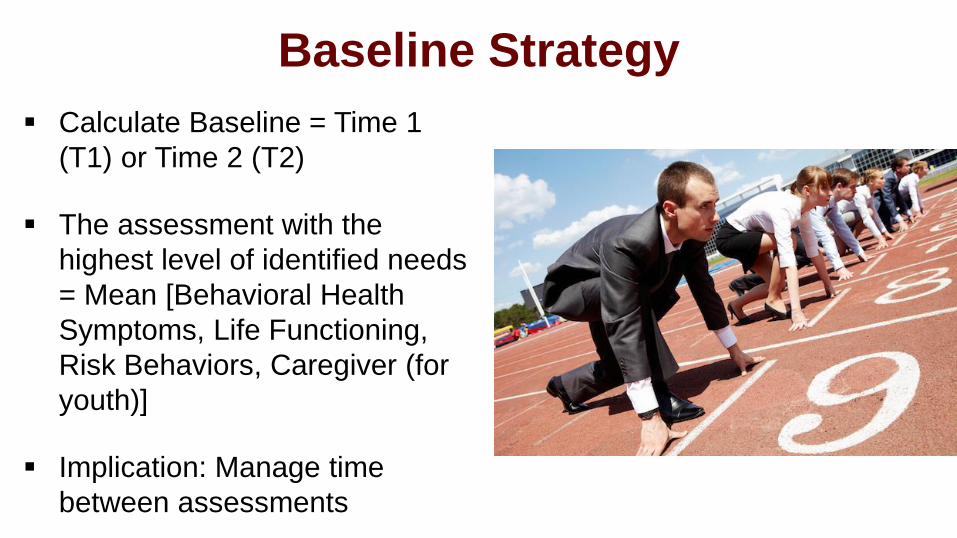
Baseline Strategy
Calculate Baseline = Time 1
(T1) or Time 2 (T2)
The assessment with the
highest level of identified needs
= Mean [Behavioral Health
Symptoms, Life Functioning,
Risk Behaviors, Caregiver (for
youth)]
Implication: Manage time
between assessments
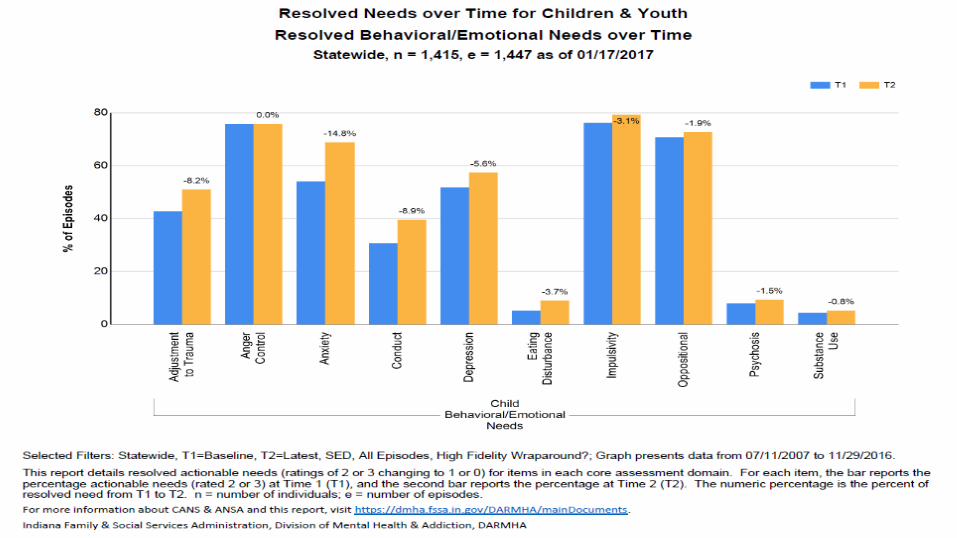
Resolved Needs
The report graphically displays the percentage of actionable needs at
Time 1 compared to T2 for a designated group of people.
One graph is included for each CANS or ANSA needs domain:
Function, Behavioral Health, Risk Behaviors, Acculturation, and
Caregiver Needs and Strengths
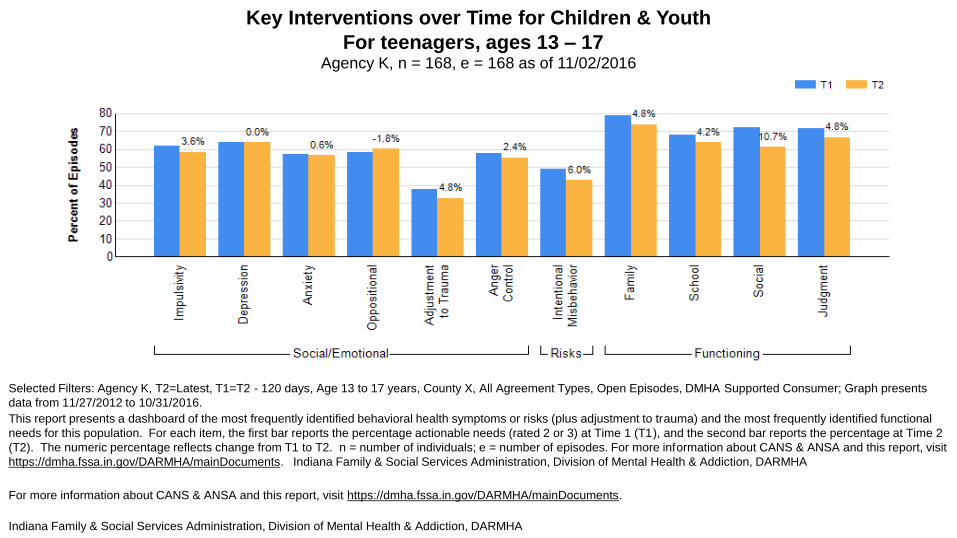
Key Interventions over Time for Children & Youth
For teenagers, ages 13 – 17 Agency K, n = 168, e = 168 as of 11/02/2016
Selected Filters: Agency K, T2=Latest, T1=T2 - 120 days, Age 13 to 17 years, County X, All Agreement Types, Open Episodes, DMHA Supported Consumer; Graph presents
data from 11/27/2012 to 10/31/2016.
This report presents a dashboard of the most frequently identified behavioral health symptoms or risks (plus adjustment to trauma) and the most frequently identified functional
needs for this population. For each item, the first bar reports the percentage actionable needs (rated 2 or 3) at Time 1 (T1), and the second bar reports the percentage at Time 2
(T2). The numeric percentage reflects change from T1 to T2. n = number of individuals; e = number of episodes. For more information about CANS & ANSA and this report, visit
https://dmha.fssa.in.gov/DARMHA/mainDocuments. Indiana Family & Social Services Administration, Division of Mental Health & Addiction, DARMHA
For more information about CANS & ANSA and this report, visit https://dmha.fssa.in.gov/DARMHA/mainDocuments.
Indiana Family & Social Services Administration, Division of Mental Health & Addiction, DARMHA
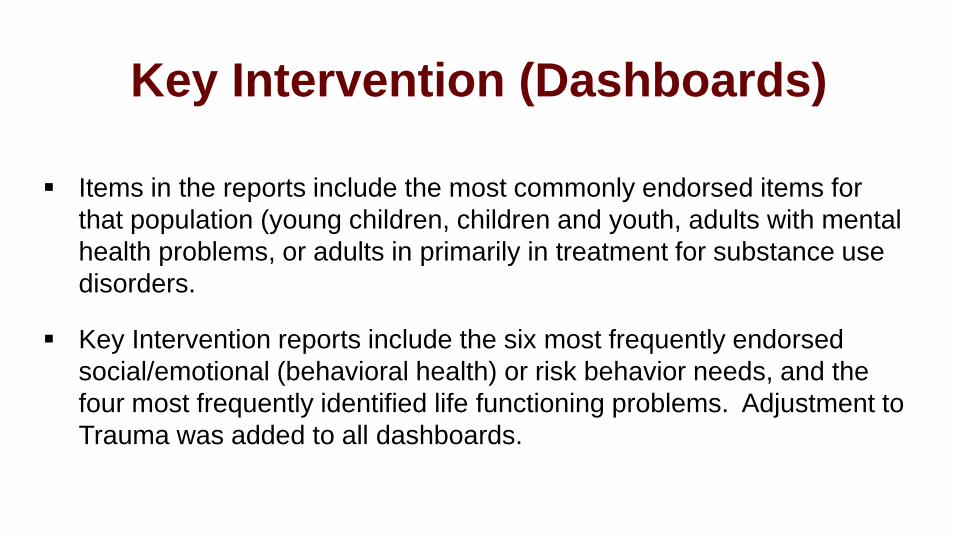
Key Intervention (Dashboards)
Items in the reports include the most commonly endorsed items for
that population (young children, children and youth, adults with mental
health problems, or adults in primarily in treatment for substance use
disorders.
Key Intervention reports include the six most frequently endorsed
social/emotional (behavioral health) or risk behavior needs, and the
four most frequently identified life functioning problems. Adjustment to
Trauma was added to all dashboards.
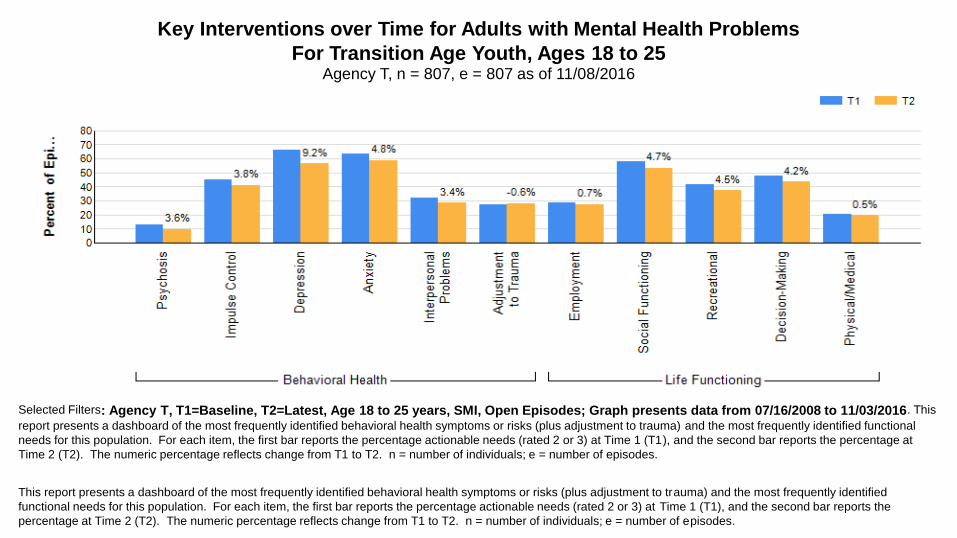
Key Interventions over Time for Adults with Mental Health Problems
For Transition Age Youth, Ages 18 to 25Agency T, n = 807, e = 807 as of 11/08/2016
Selected Filters: Agency T, T1=Baseline, T2=Latest, Age 18 to 25 years, SMI, Open Episodes; Graph presents data from 07/16/2008 to 11/03/2016. This
report presents a dashboard of the most frequently identified behavioral health symptoms or risks (plus adjustment to trauma) and the most frequently identified functional
needs for this population. For each item, the first bar reports the percentage actionable needs (rated 2 or 3) at Time 1 (T1), and the second bar reports the percentage at
Time 2 (T2). The numeric percentage reflects change from T1 to T2. n = number of individuals; e = number of episodes.
This report presents a dashboard of the most frequently identified behavioral health symptoms or risks (plus adjustment to trauma) and the most frequently identified
functional needs for this population. For each item, the first bar reports the percentage actionable needs (rated 2 or 3) at Time 1 (T1), and the second bar reports the
percentage at Time 2 (T2). The numeric percentage reflects change from T1 to T2. n = number of individuals; e = number of episodes.
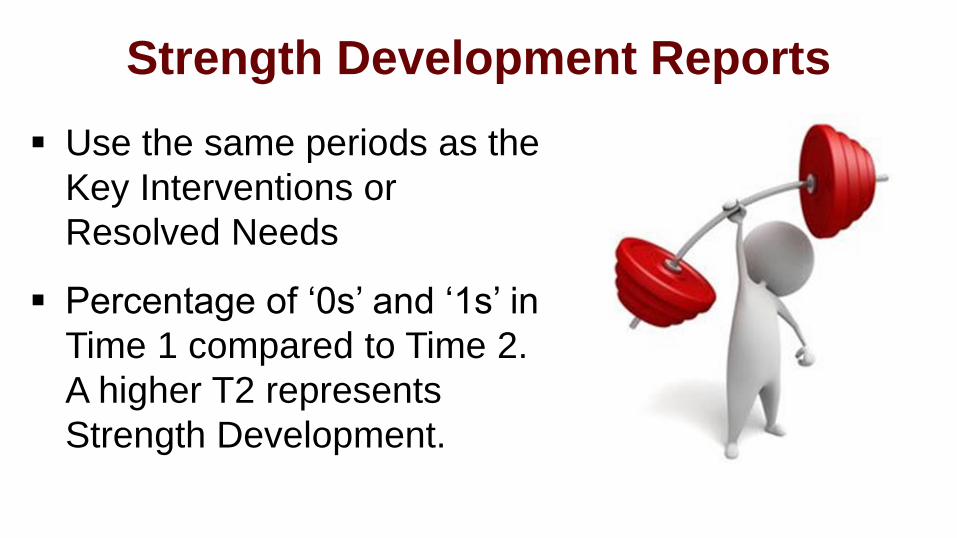
Strength Development Reports
Use the same periods as the
Key Interventions or
Resolved Needs
Percentage of ‘0s’ and ‘1s’ in
Time 1 compared to Time 2.
A higher T2 represents
Strength Development.
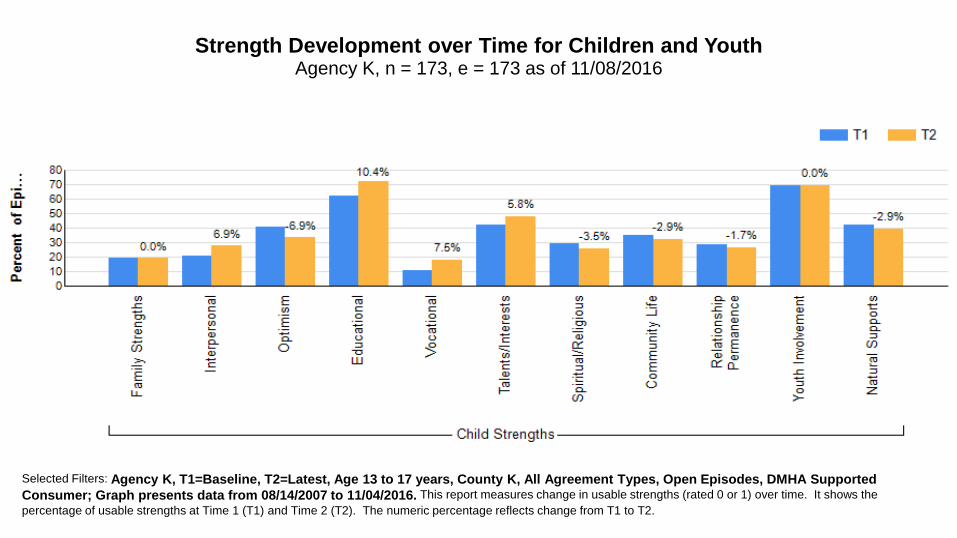
Strength Development over Time for Children and YouthAgency K, n = 173, e = 173 as of 11/08/2016
Selected Filters: Agency K, T1=Baseline, T2=Latest, Age 13 to 17 years, County K, All Agreement Types, Open Episodes, DMHA Supported
Consumer; Graph presents data from 08/14/2007 to 11/04/2016. This report measures change in usable strengths (rated 0 or 1) over time. It shows the
percentage of usable strengths at Time 1 (T1) and Time 2 (T2). The numeric percentage reflects change from T1 to T2.
Reliable Change over Time for Adults with Mental Health Problems
Statewide, Ages 26-35, n = 39,192, e = 46,175 as of 11/08/2016
Consumers: 39,192
Consumers w/Positive Change: 17,656
Percent Improved: 45.05%Functioning Strengths Behavioral Needs Risks
Positive Change 8,706 5,485 9,048 5,952
Negative Change 6,701 9,700 5,490 3,952
No Change 30,758 30,977 31,621 36,254
Selected Filters: Statewide, T1=Baseline, T2=Latest, Age 26 to 35 years, SMI, Closed Episodes, DMHA Supported Consumer; Graph presents data from 01/22/2008 to
11/07/2016. This report measures change over time by using the average (mean) and reliability information to calculate statistically significant change in each CANS or ANSA
domain (Improved, Maintained, or Worsened). The number and percentage of individuals who experienced reliable improvement over time is reported. Additionally, for each
assessment domain, the number of individuals who experienced positive, negative, or no change is reported. n = number of individuals; e = number of episodes
This report measures change over time by using the average (mean) and reliability information to calculate statistically significant change in each CANS or ANSA domain (Improved, Maintained, or Worsened). The number and
percentage of individuals who experienced reliable improvement over time is reported. Additionally, for each assessment domain, the number of individuals who experienced positive, negative, or no change is reported. n = number
of individuals; e = number of episodes.
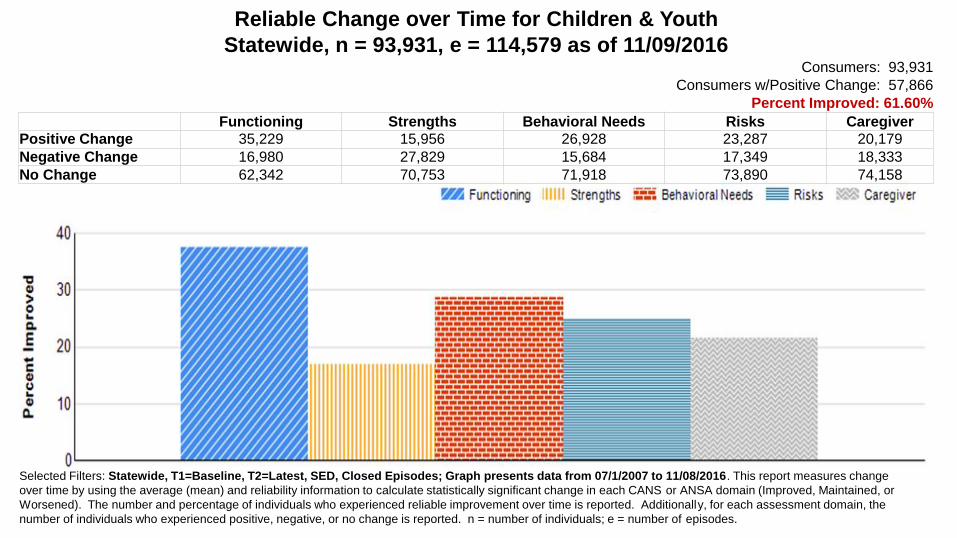
Reliable Change over Time for Children & Youth
Statewide, n = 93,931, e = 114,579 as of 11/09/2016Consumers: 93,931
Consumers w/Positive Change: 57,866
Percent Improved: 61.60%
Functioning Strengths Behavioral Needs Risks Caregiver
Positive Change 35,229 15,956 26,928 23,287 20,179
Negative Change 16,980 27,829 15,684 17,349 18,333
No Change 62,342 70,753 71,918 73,890 74,158
Selected Filters: Statewide, T1=Baseline, T2=Latest, SED, Closed Episodes; Graph presents data from 07/1/2007 to 11/08/2016. This report measures change
over time by using the average (mean) and reliability information to calculate statistically significant change in each CANS or ANSA domain (Improved, Maintained, or
Worsened). The number and percentage of individuals who experienced reliable improvement over time is reported. Additionally, for each assessment domain, the
number of individuals who experienced positive, negative, or no change is reported. n = number of individuals; e = number of episodes.
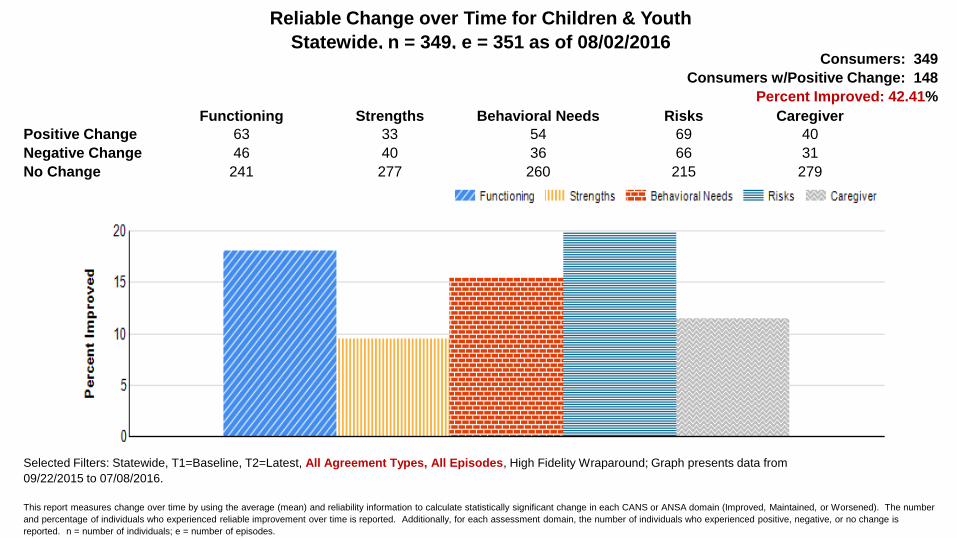
Reliable Change over Time for Children & Youth
Statewide, n = 349, e = 351 as of 08/02/2016Consumers: 349
Consumers w/Positive Change: 148
Percent Improved: 42.41%
Functioning Strengths Behavioral Needs Risks Caregiver
Positive Change 63 33 54 69 40
Negative Change 46 40 36 66 31
No Change 241 277 260 215 279
Selected Filters: Statewide, T1=Baseline, T2=Latest, All Agreement Types, All Episodes, High Fidelity Wraparound; Graph presents data from
09/22/2015 to 07/08/2016.
This report measures change over time by using the average (mean) and reliability information to calculate statistically significant change in each CANS or ANSA domain (Improved, Maintained, or Worsened). The number
and percentage of individuals who experienced reliable improvement over time is reported. Additionally, for each assessment domain, the number of individuals who experienced positive, negative, or no change is
reported. n = number of individuals; e = number of episodes.
ACCESSING OUTCOME REPORTS
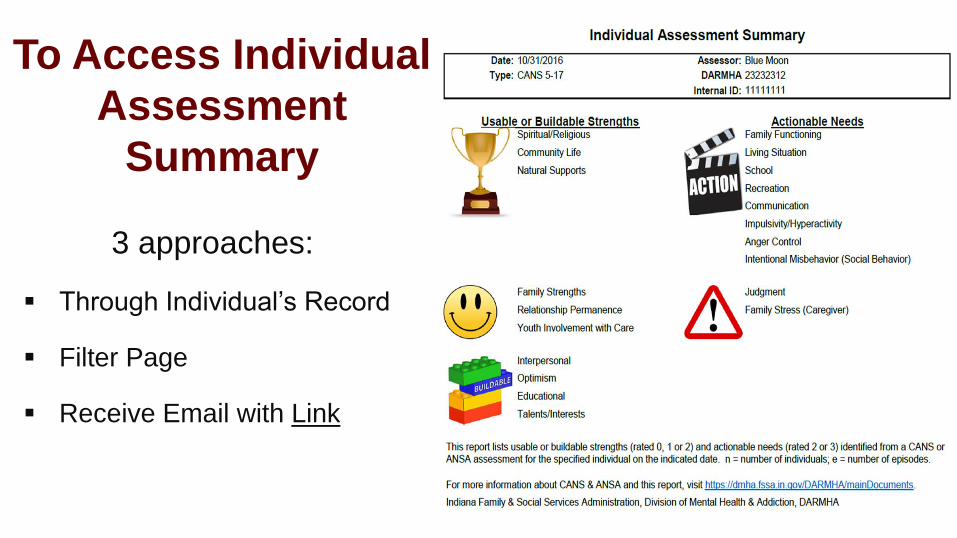
To Access Individual
Assessment
Summary
3 approaches:
Through Individual’s Record
Filter Page
Receive Email with Link
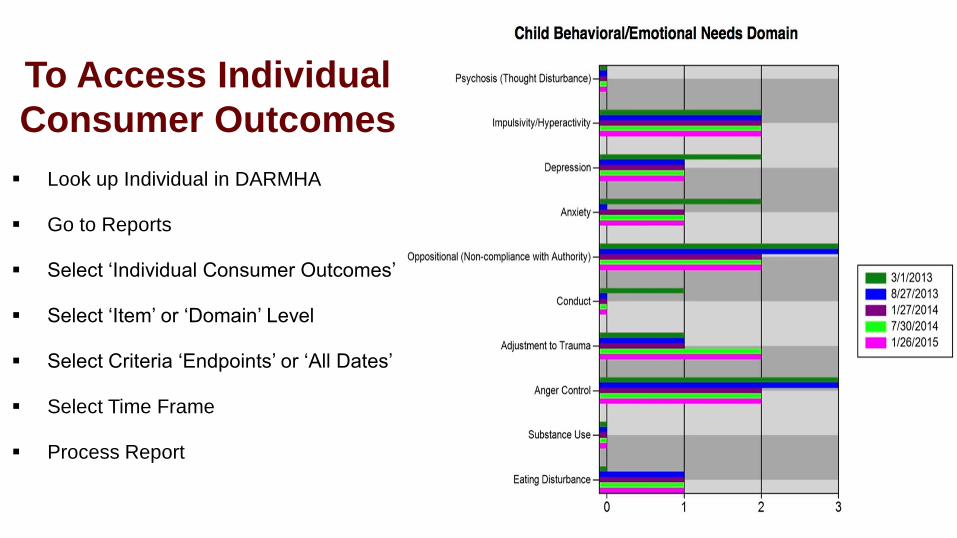
To Access Individual
Consumer Outcomes
Look up Individual in DARMHA
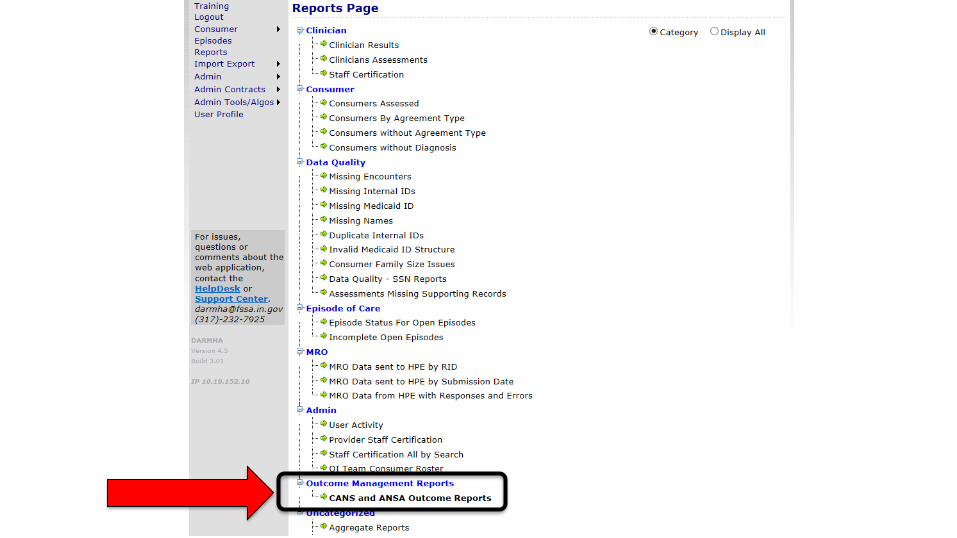
Go to Reports
Select ‘Individual Consumer Outcomes’
Select ‘Item’ or ‘Domain’ Level
Select Criteria ‘Endpoints’ or ‘All Dates’
Select Time Frame
Process Report
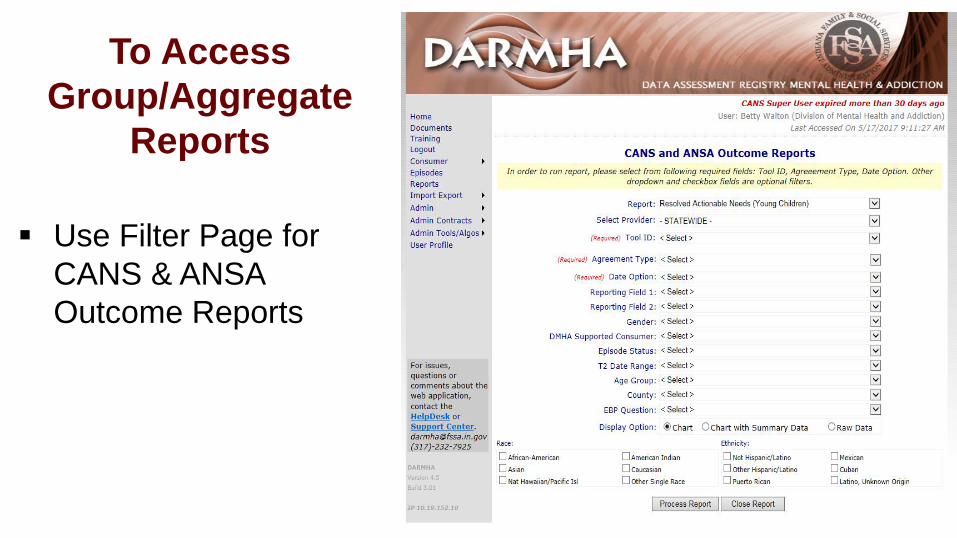
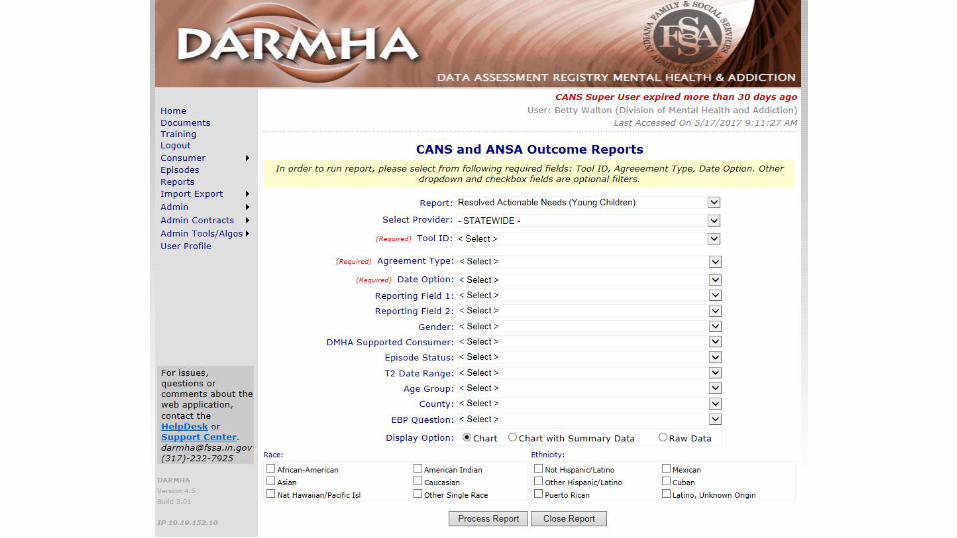
To Access
Group/Aggregate
Reports
Use Filter Page for
CANS & ANSA
Outcome Reports
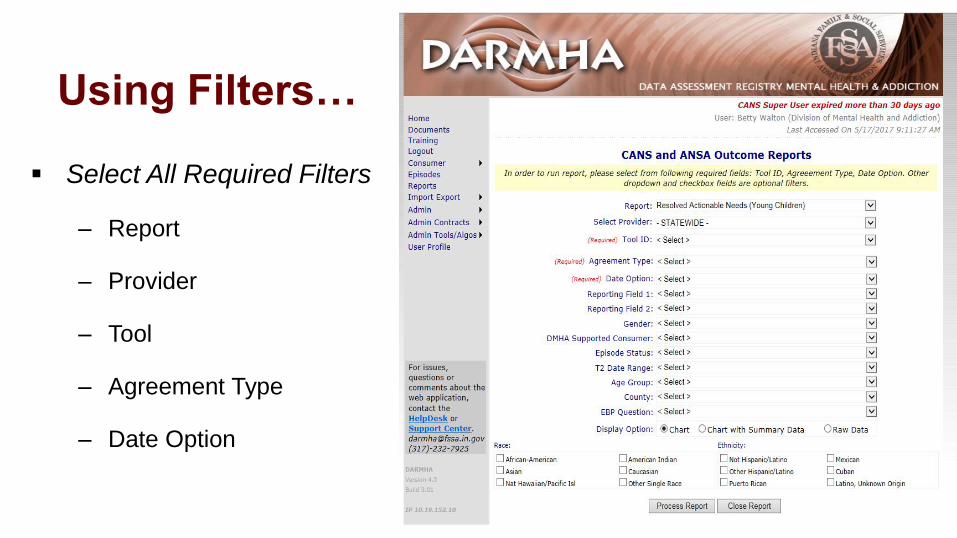
Using Filters…
Select All Required Filters
– Report
– Provider
– Tool
– Agreement Type
– Date Option
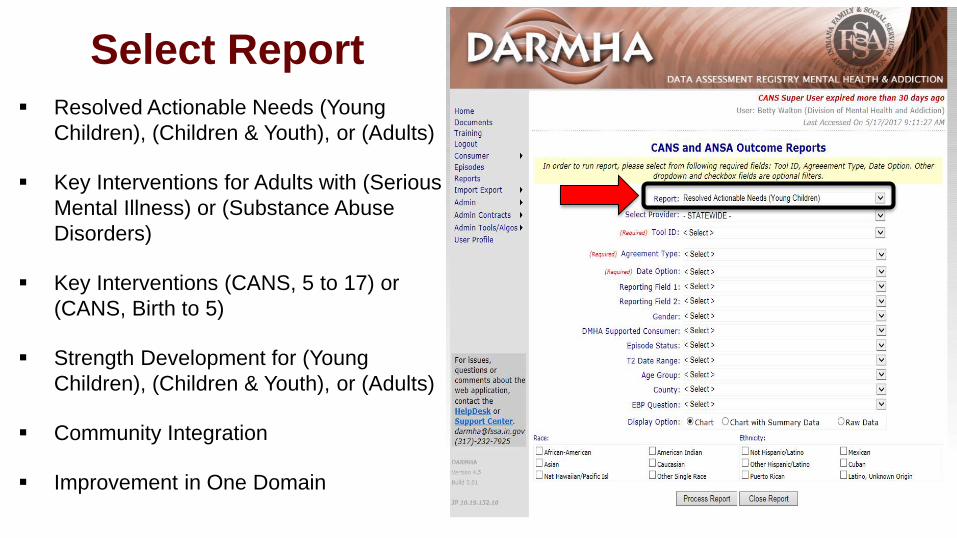
Select Report
Resolved Actionable Needs (Young
Children), (Children & Youth), or (Adults)
Key Interventions for Adults with (Serious
Mental Illness) or (Substance Abuse
Disorders)
Key Interventions (CANS, 5 to 17) or
(CANS, Birth to 5)
Strength Development for (Young
Children), (Children & Youth), or (Adults)
Community Integration
Improvement in One Domain
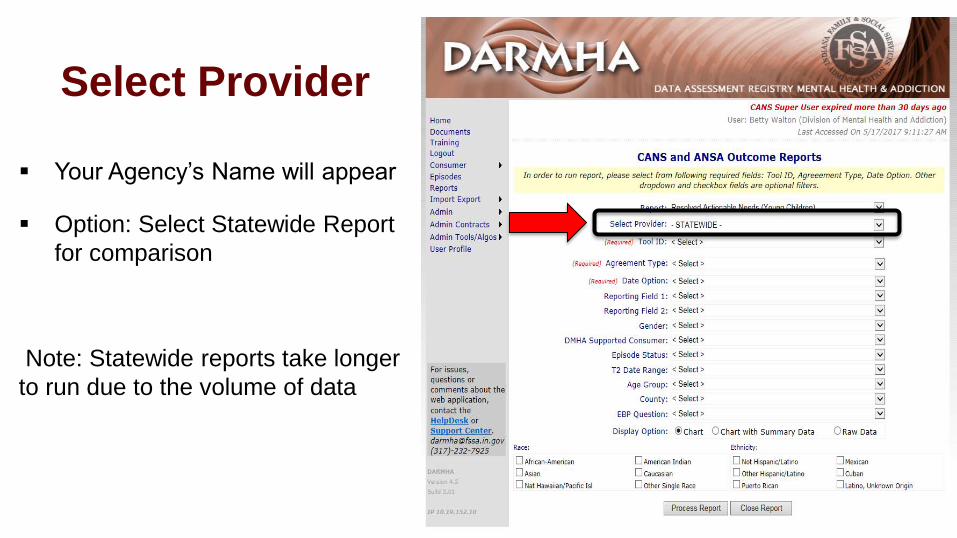
Select Provider
Your Agency’s Name will appear
Option: Select Statewide Report
for comparison
Note: Statewide reports take longer
to run due to the volume of data
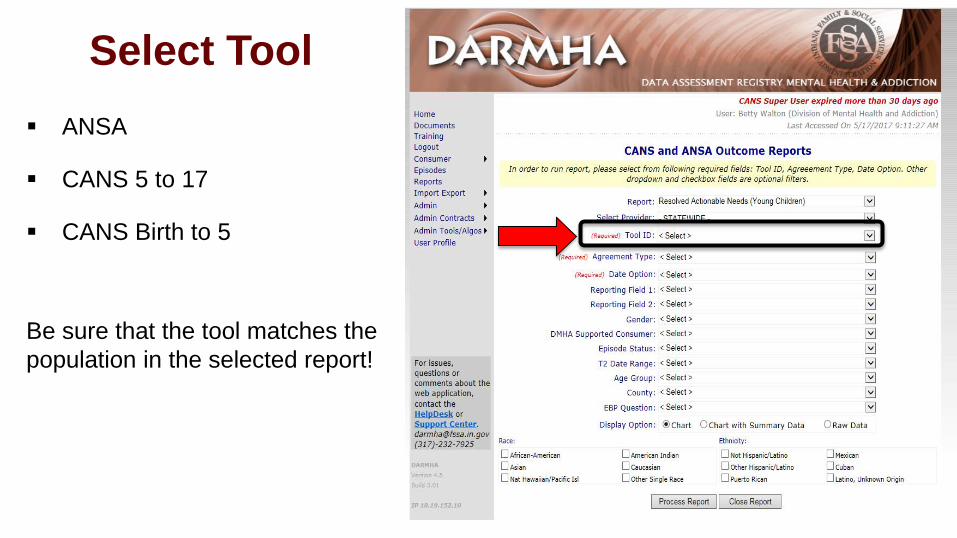
Select Tool
ANSA
CANS 5 to 17
CANS Birth to 5
Be sure that the tool matches the
population in the selected report!
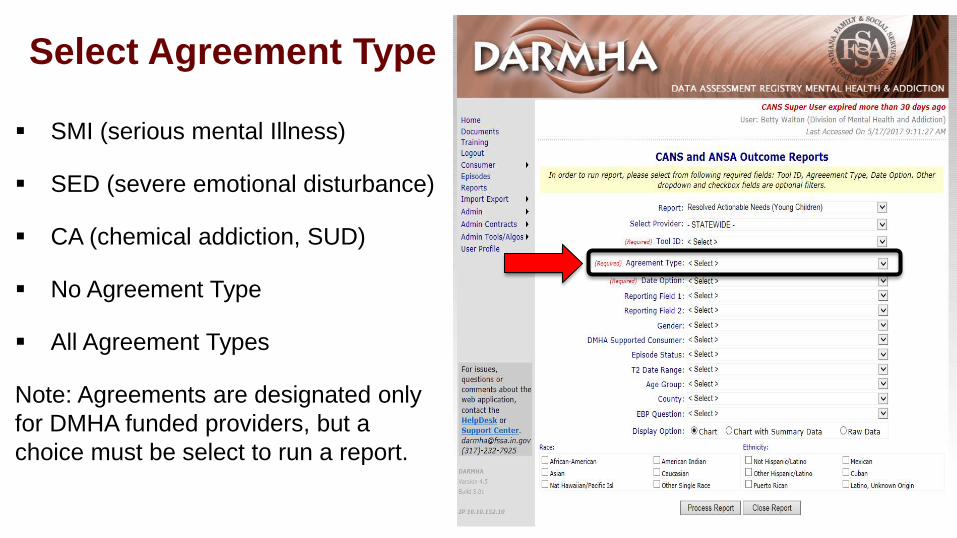
Select Agreement Type
SMI (serious mental Illness)
SED (severe emotional disturbance)
CA (chemical addiction, SUD)
No Agreement Type
All Agreement Types
Note: Agreements are designated only
for DMHA funded providers, but a
choice must be select to run a report.
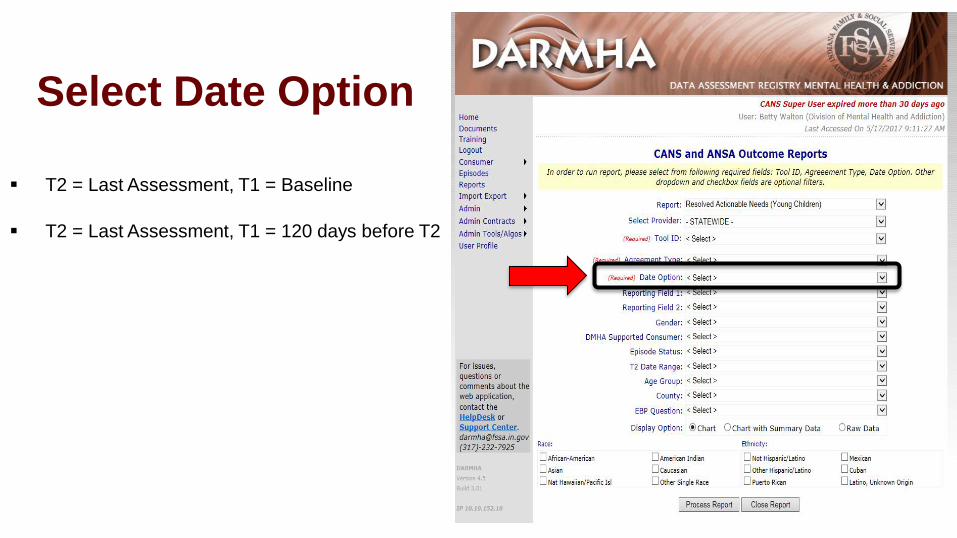
Select Date Option
T2 = Last Assessment, T1 = Baseline
T2 = Last Assessment, T1 = 120 days before T2
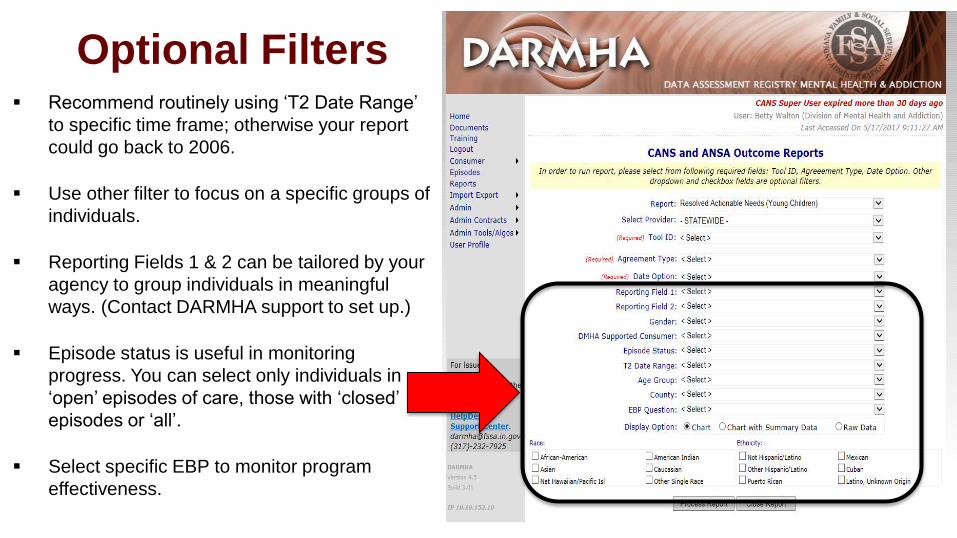
Optional Filters Recommend routinely using ‘T2 Date Range’
to specific time frame; otherwise your report
could go back to 2006.
Use other filter to focus on a specific groups of
individuals.
Reporting Fields 1 & 2 can be tailored by your
agency to group individuals in meaningful
ways. (Contact DARMHA support to set up.)
Episode status is useful in monitoring
progress. You can select only individuals in
‘open’ episodes of care, those with ‘closed’
episodes or ‘all’.
Select specific EBP to monitor program
effectiveness.
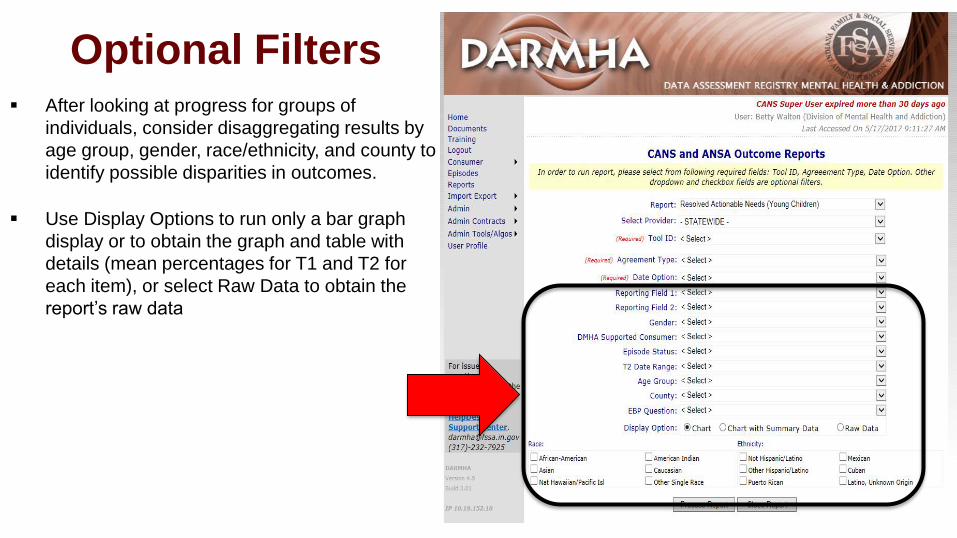
Optional Filters After looking at progress for groups of
individuals, consider disaggregating results by
age group, gender, race/ethnicity, and county to
identify possible disparities in outcomes.
Use Display Options to run only a bar graph
display or to obtain the graph and table with
details (mean percentages for T1 and T2 for
each item), or select Raw Data to obtain the
report’s raw data

SHOWTIME!!!
Let’s run some reports!
BEGINNING TO USE OUTCOME
MANAGEMENT REPORTS
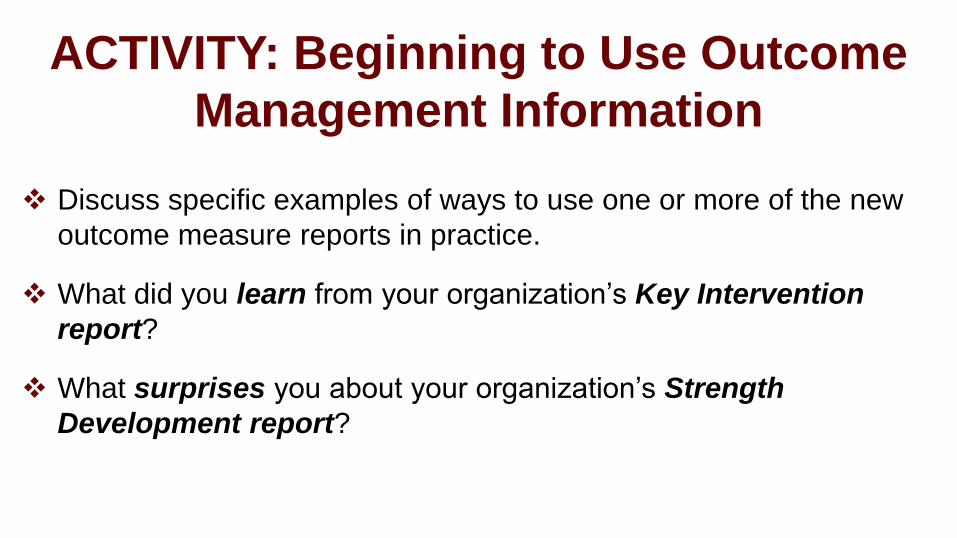
ACTIVITY: Beginning to Use Outcome
Management Information
Discuss specific examples of ways to use one or more of the new
outcome measure reports in practice.
What did you learn from your organization’s Key Intervention
report?
What surprises you about your organization’s Strength
Development report?
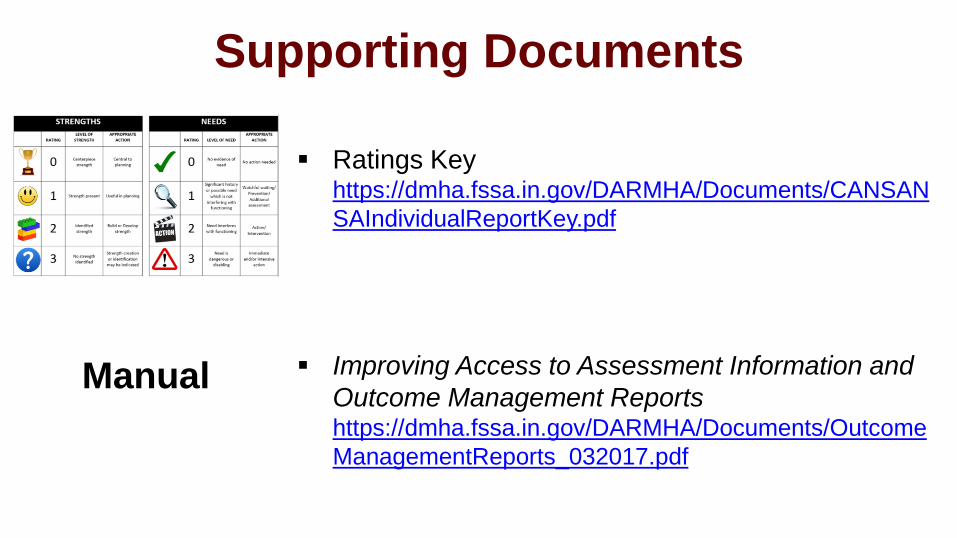
Supporting Documents
Ratings Key https://dmha.fssa.in.gov/DARMHA/Documents/CANSAN
SAIndividualReportKey.pdf
Improving Access to Assessment Information and
Outcome Management Reports https://dmha.fssa.in.gov/DARMHA/Documents/Outcome
ManagementReports_032017.pdf
Manual
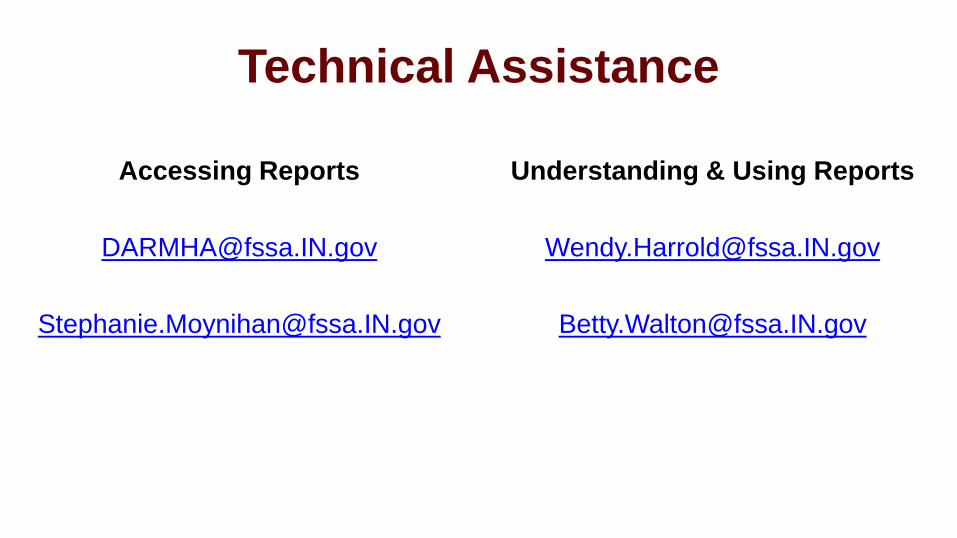
Technical Assistance
Accessing Reports
Understanding & Using Reports
Israel, N. (2015). TCOM report suite: Minimum standards for vendors and systems. Chicago,
IL: Chapin Hall at The University of Chicago.
Lyons, J. S. (2009). Communimetrics: A communication theory of measurement in human
service settings. New York: Springer.
Lyons, J. S. & Weiner, D.A. (eds.) (2009). Behavioral health care: Assessment, service
planning, and total clinical outcomes management. Kingston, NJ: Civic Research Institute.
Walton, B. A., Moynihan, S., & Harrold, W., (2017). Improving access to assessment
information and outcome management reports. Available at
https://dmha.fssa.in.gov/DARMHA/Documents/OutcomeManagementReports_032017.pdf
References
Betty Walton, Ph.D., LCSW
Director, Indiana CANS & ANSA Training &
Technical Assistance
Assistant Research Professor
Indiana University School of Social Work
Indiana Family & Social Service Administration,
Division of Mental Health & Addiction
Wendy HarroldDeputy Director, Provider Quality and Performance
Indiana Family & Social Services Administration,
Division of Mental Health & Addiction
Contact Information
Stephanie Moynihan, MS
Project Coordinator, Indiana CANS & ANSA Training &
Technical Assistance
Indiana University School of Social Work
Indiana Family & Social Service Administration,
Division of Mental Health & Addiction
DARMHA Support Team