Embed Size (px)
Citation preview

Undergraduate Honors Program
Computer Science
An Eye-Tracking Evaluation of Multicultural Interface
Designs
by
Daniel Shaw
submitted in partial fulfillment of the requirementsthe degree of
B.A.
c� copyright by Daniel Shaw
2005

An Eye-Tracking Evaluation of Multicultural Interface Designs
Abstract
This paper examines the impact of a multicultural approach on the usability
of web and software interface designs. Through the use of an eye-tracking sys-
tem, the study compares the ability of American users to navigate traditional
American and Japanese websites. The ASL R6 eye-tracking system recorded
user search latency and the visual scan path in locating specific items on the
American and Japanese pages. Experimental results found statistically signifi-
cant latency values when searching for left- or right-oriented navigation menus.
Among the participants, visual observations of scan paths indicated a strong
preference for initial movements toward the left. These results demonstrate the
importance of manipulating web layouts and navigation menus for American
and Japanese users. This paper further discusses the potential strengths re-
sulting from modifications of interface designs to correspond with such cultural
search tendencies, and suggestions for further research.

An Eye-Tracking Evaluation of Multicultural Interface Designs
by
Daniel L. Shaw
Advisor: Professor Jim Gips
Senior Honors Thesis
Boston College
Submitted to the Department of Computer Science in partial fulfillment of the requirements for the degree of
Bachelor of Arts
May, 2005

Abstract
An Eye-Tracking Evaluation of Multicultural Interface Designs
Daniel L. Shaw
This paper examines the impact of a multicultural approach on the
usability of web and software interface designs. Through the use of an eye-
tracking system, the study compares the ability of American users to navigate
traditional American and Japanese websites. The ASL R6 eye-tracking system
recorded user search latency and the visual scan path in locating specific items on
the American and Japanese pages. Experimental results found statistically
significant latency values when searching for left- or right-oriented navigation
menus. Among the participants, visual observations of scan paths indicated a
strong preference for initial movements toward the left. These results demonstrate
the importance of manipulating web layouts and navigation menus for American
and Japanese users. This paper further discusses the potential strengths resulting
from modifications of interface designs to correspond with such cultural search
tendencies, and suggestions for further research.
Shaw Eye-Tracking Thesis ii

To my grandparents.
Shaw Eye-Tracking Thesis iii

Acknowledgments
I wish to express sincere appreciation to my advisor, Professor Jim Gips,
who inspired, directed, and supported my thesis from beginning to end. Professor
Gips provided invaluable support in all aspects of my senior year at Boston
College, and for that I am truly grateful. I would also like to thank Professor
Adam Brasel for his advice, particularly with designing the eye-tracking
experiment. I would like to acknowledge Professor Hiram Brownell, who assisted
with the statistical evaluation of the eye-tracking results. I would like to thank
Chris Merritt-Lish and Virginia Salem who provided training and support for the
ASL eye-tracking equipment. I would also like to acknowledge Rachel Krebs for
her assistance in preparing and reviewing my experimental application to the
Boston College Institutional Review Board. In addition, I would like to say thank
you to my parents, my sisters, Mike DiCenzo, Joe Ritacco, the EagleEyes team,
the Loyola Volunteers, and all of my family and friends for their support and
encouragement during my four years at Boston College. Finally, I would like to
thank all of the volunteers who participated in this study.
Shaw Eye-Tracking Thesis iv

Table of Contents Abstract ii Dedication iii Acknowledgements iv List of Figures vi List of Tables vii List of Appendices viii Chapter
I. Introduction 1 II. Literature Review
Global Differences 3 Multicultural Design Issues 6 Cultural Models 10 Visual Search 13
III. Approaches to Internationalization 18 IV. Methodology Participants 27 Equipment 27 Stimuli 29 Procedure 31 Data Collection 35 V. Experimental Results 38 VI. Discussion 42 VII. Conclusions 50 VIII. Future Work 54 References 56 Appendices 58
Shaw Eye-Tracking Thesis v

List of Figures Figure 3.1 – US IBM Website Homepage 19 Figure 3.2 – US IBM Website Global Portal 19 Figure 3.3 – US IBM Website Directory of Worldwide Contacts 20 Figure 3.4 – Japanese IBM Website Homepage 20 Figure 3.5 – US IKEA Website Homepage 22 Figure 3.6 – IKEA Website Global Portal 22 Figure 3.7 – Saudi Arabian IKEA Website (English) 23 Figure 3.8 – Saudi Arabian IKEA Website (Arabic) 23 Figure 4.1 – Instructions for US Starbucks Website Item Search Task 32 Figure 4.2 – US Starbucks Website 32 Figure 4.3 – Japanese Starbucks Website 33 Figure 4.4 – Calibration Grid 33 Figure 4.5 – Instructions for Experimental Demo Item Search Task 34 Figure 4.6 – Experimental Demo Website 34 Figure 5.1 – Sample Search Path for US Education Website 47 Figure 5.2 – Sample Search Path for Japanese Education Website 47 Figure 5.3 – Sample Search Path for US Starbucks Website 48 Figure 5.4 – Sample Search Path for Japanese Starbucks Website 48
Shaw Eye-Tracking Thesis vi

List of Tables Table 5.1 – Mean Latency Values for First Menu Fixation 38 Table 5.2 – Mean Latency Values for First Item Fixation 38 Table 5.3 – Significance of Two-Tailed T-Test (US and Japanese Menus) 38 Table 5.4 – Significance of Two-Tailed T-Test (US and Japanese Items) 39 Table 5.5 – Standard Deviation of Latency Values for First Menu Fixation 39 Table 5.6 – Standard Deviation of Latency Values for First Item Fixation 39 Table 5.7 – Adjusted Mean Latency Values for First Menu Fixation 39 Table 5.8 – Adjusted Mean Latency Values for First Item Fixation 39 Table 5.9 – Adjusted Significance of Two-Tailed T-Test (US and Japanese Menus) 40 Table 5.10 – Adjusted Significance of Two-Tailed T-Test (US and Japanese Items) 40 Table 5.11 – Aggregate Number of Initial Eye Movements (US) 40 Table 5.12 – Aggregate Number of Initial Eye Movements (Japan) 40 Table 5.13 – Total Number of Initial Eye Movements per Country 40 Table 5.14 – Mean Task Item Location Difficulty (Self-Reported by Participants) 41 Table 5.15 – Mean Latency Values for First Item Fixation – US Pages Difficult 41 Table 5.16 – Mean Latency Values for First Item Fixation – Japanese Pages Difficult 41 Table A.1 – Latency Values for First Menu Fixation – US (in Seconds) 58 Table A.2 – Latency Values for First Menu Fixation – Japan (in Seconds) 58 Table A.3 – Latency Values for First Item Fixation – US (in Seconds) 59 Table A.4 – Latency Values for First Item Fixation – Japan (in Seconds) 59
Shaw Eye-Tracking Thesis vii

List of Appendices Appendix A – Experimental Data 58 Appendix B – Websites Used 60 Appendix C – Randomization Order 65 Appendix D – Participant Forms 66
Shaw Eye-Tracking Thesis viii

Chapter I - Introduction
The growth of the Internet and other forms of computer-mediated
communication was both gradual and global. Today, users have embraced the
ability to interact with individuals across the world, sharing information beyond
borders at a level never before realized in the history of the human experience.
While developers have long applied usability guidelines for domestic products,
the international community has not received appropriate attention in the design
of multicultural interfaces. Many international companies apply bare-minimum
localization to their websites, translating content without regard to the multitude
of other factors that affect interface usability. This is not to say that resources are
not available for developers – in fact, quite the opposite is true. An assessment of
published literature reveals that concepts such as localization and globalization
have been researched and reviewed at length, ready for implementation in real-
world situations.
The objective of this study is to examine the cultural impact of interface
layout design on usability in order to promote the implementation of multicultural
design guidelines in web and software development. Through the use of an eye-
tracking system, this study will consider usability differences between American
and Japanese websites as representatives of many possible examples of
multicultural interfaces. Eye-tracking allows for an in-depth evaluation of
usability through search tasks, and subsequent latency and visual scanning
analysis. By examining how a user finds their way through a website, one can
Shaw Eye-Tracking Thesis 1

look to explain why many users claim that interfaces designed in their native
culture are easier to navigate. Consequently, if cultural interface preferences
correspond with real-world usability, then there is certainly reason to justify
implementation of such design strategies for websites and software applications.
Users across the world would greatly benefit from an increased movement toward
internationalization of interface design, and developers would benefit from
increased usability of their products. This study aims to unite and strengthen those
causes through an eye-tracking analysis of multicultural interface designs.
Shaw Eye-Tracking Thesis 2

Chapter II – Literature Review
Global Differences
The Internet was originally funded and developed by the U.S. Department
of Defense as a medium that would allow English-speaking users to communicate
with other English speakers [1]. While the Internet was always intended to be a
global communication channel, it was not specifically designed to be multilingual,
or multicultural. Although there was not a compelling case for early
internationalization, the expansion of the Internet during the 1990s was felt
around the world and forced developers to consider global users. Generally, until
the early 1980s, US-based software publishers did not demonstrate recognition of
the need for internationalized and localized products [2]. As a result, early
attempts to internationalize software (and, later, websites) did not follow
consistent rules among different developers. In 1990, the Localization Industry
Standards Association (LISA) was founded in order to create a set of
globalization guidelines for software developers and localization service providers
[2]. A special group of the International Standards Organization (ISO) is also
working to standardize icons and signs found within software and online
graphical user interfaces [3]. During the late 1990s, some software developments
allowed for the production of multilingual content without additional international
support or add-ons [2].
Of course, there would be no need to create standardized guidelines
without an international population looking to utilize software and web services
Shaw Eye-Tracking Thesis 3

developed outside of their native region or language. While economics have
driven much of the internationalization movement, social, cultural, and political
factors have also contributed to the growing industry [3]. The difficulty for
developers comes in the understanding that while most customers won’t ask for
internationalized products, they still expect software or websites to operate in
their language and local customs [4]. Developers can choose to ignore this
demand, but in doing so, they would neglect an international community that
includes millions of computer users. A web developer that adds support for
French, Italian, German, and Spanish languages increases their potential audience
by 200 million users. Adding Japanese and Chinese language support provides for
another 200 million potential customers [1]. In fact, while English was once the
dominant language of the Internet, less than half (32%) of the current online
population considers English their first language. The greatest expansion of the
Internet is currently projected to come from the Middle East, Eastern Europe,
Latin America, and Africa, areas which have not traditionally been the focus for
software and web developers [1].
In terms of software development, globalization (or internationalization) is
the methodology of creating products that are general enough to be used by both
domestic and international audiences [5]. Localization involves taking a general
or location-specific product and creating custom versions for each other culture
[5]. As a stand-alone solution, localization is not always practical because of the
difficulty of defining the specific characteristics embodied by a user of a
Shaw Eye-Tracking Thesis 4

particular culture. In the same way that there is no such thing as an “average web
user,” there is no “average American user” or “average Japanese user,” and a
software developer interested in localization needs to carefully recognize the
subtle differences between individual users of the same culture [1]. As such, it is
generally considered more practical for developers to globalize products and then
localize as needed [5]. One approach involves choosing several “typical” markets
for initial development and then expanding localization based on successes and
failures within those early trials. As an example, Microsoft develops the English,
German, and Japanese versions of its operating systems at the same time, as
representing specific target markets [6]. English is the largest language market for
Windows, and most of the development team members are native speakers.
German is the largest European-language market, and provides a good example of
European ease of functionality and translation. Japanese is a good representation
of the translating difficulties of the languages of East Asia, which also happens to
be Microsoft’s second-largest market [6].
It is important to recognize the underlying role of the human-computer
interface when globalizing or localizing software or online services. In addition to
facilitating communication between the user and the processor (server, etc …),
computer-mediated communication is also used to share information among
human users [3]. Even in the case of a street sign (one of the success models of
multicultural interface design) which does not allow a driver or pedestrian to
communicate with other users, the original developer of the sign is able to use the
Shaw Eye-Tracking Thesis 5

medium to transmit safety warnings and other messages [3]. This method of
sharing knowledge is most successful if developers have a general understanding
of the differences between different groups of people, whether they are considered
to be individual or cultural. Generally, people want to have the ability to
communicate with other users, without having to learn additional languages or the
specific cultural details pertaining to the other users. In addition, users don’t want
to be short-changed when it comes to localized software, and expect the same
features and options as the developer’s native version [6]. This desire places the
burden of cultural usability on the developer to make sure that the software or
website allows users to communicate with others in a multilingual or multicultural
context, with the same ease as communication within the user’s own language and
culture.
Multicultural Design Issues
While localization requires software or web customization that extends
beyond language, translation is nonetheless a crucial component of
internationalization. Given the complexity of human language, machine
translation is extremely challenging and, in general, requires that a human review
the final translation [3]. This brings additional time and expense considerations to
the process. In addition, some languages are more difficult to localize than others,
based on the complexity of the language, availability of translators, and the tools
required. The most difficult languages to translate from English (US) are Arabic,
Japanese, Chinese, and Russian, while the easiest are Spanish, French, Italian, and
Shaw Eye-Tracking Thesis 6

German [1]. Computers have long had difficulty with multilingual
communication, dating back to attempts to reproduce the cursive handwriting of
Arabic on early monitors and dot matrix printers [3]. Other difficulties with
internationalization stem from the fact that Internet connection speeds are not
globally consistent [1]. Users in North America, for instance, tend to have greater
access to broadband service than Eastern European users. Developers need to take
connection speeds into account when using graphics, videos, or sound online. In
addition, it is also important to recognize that while a website may be designed
for German users, in most cases there is no way to make sure that only German
users visit the site [1]. This, again, calls for developers to first globalize their
software or website, making sure that their product has a consistent image for
both branding and usability, before applying changes to localize content.
In addition to text translation, localized software also requires attention to
the impact of color, graphics, and icons presented in the user interface. While
graphics cannot completely replace words, well-designed graphics can reduce the
number of versions of a product, reduce translation costs, ease learning, improve
comprehension, and take advantage of an already existing body of recognizable
symbols [5]. Carefully designed graphics can enhance the usability of
multilingual and multicultural user interfaces. In certain cultures, icons are an
especially powerful way to communicate information [1]. When using
internationalized icons, it is important to avoid extremes, maintain neutrality, and
make the graphic multipurpose [5]. Using an icon of a rodent to symbolize a
Shaw Eye-Tracking Thesis 7

computer mouse would not be effective for a user whose native language does not
include that word association. Graphics that include hand gestures, verbal
analogies, embedded text, religious symbols, and national emblems should all be
avoided [5]. Flags are generally not a good way to represent a language, unless
the audience can be defined purely by geographic boundaries [1]. The flag of
Spain should not be used to represent the Spanish language if Latin American
users are expected to use the software or website. Even the United States flag
does not necessarily represent English for many American citizens. To avoid
these regional faux pas, it is best to maintain neutrality when using graphical
symbols to represent a language or culture.
Customizing the visual display is not limited to graphics, as there are
cultural differences in the general presentation of color as well. Developers,
especially on the web, need to carefully balance the accepted cultural use of color,
with the marketing goals of information exchange [1]. Different cultures have
different psychological associations for color, and it would be easy for developers
to misrepresent their message based on the choices of colors used [3]. The color
red, for example, has different connotations based on the cultural context in which
it appears. In China, red signifies celebration, happiness and luck; however, in
India, red symbolizes purity. In the United States, the color red is often interpreted
as a signal of danger, or to stop, due to the common use in North American traffic
lights. American users would generally accept the color green as safe for passage,
while some tropical countries associate green with the dangers of the jungle [4].
Shaw Eye-Tracking Thesis 8

Thus, the simple use of red or green would be a potentially hazardous situation for
users if the developers did not take local color customs into account during the
design process. One approach to avoid (or reduce) misunderstandings is to design
in black and white first, and add color to enhance as necessary [5]. Color schemes
should be clearly defined, and color codes made explicit across product
variations. Developers need to understand the symbolism that accompanies a
particular color, and selected appropriate colors for each locale [4].
The presentation of information must also be consistent based on the
particular preferences of each locale. Beyond translation, text needs to be
appropriately formatted for dates, time zones, currencies, etc … [3]. While
American users may interpret 03-04-05 as signifying March 4, 2005, European
users would read the date as April 3, 2005, and Japanese users would see April 5,
2003. Such formatting errors could have a critical impact on intercultural
communication, potentially disastrous in a global economy. When a digital time is
displayed, it needs to conform to the user’s local time zone or be properly
designated otherwise, with clear and consistent labeling [3]. In the same way that
time zones are properly noted when used within the United States, information
regarding a specific time becomes especially vital when working with
international users who may be several time zones away. These concepts also
apply to the use of music, as the “Jeopardy” theme song will not adequately
signify to all users that the program or website is currently calculating an equation
[6]. If the developer anticipates these issues ahead of time and adapts the software
Shaw Eye-Tracking Thesis 9

or website to the user, rather than expect the user to adjust to a culturally-limited
interface, intercultural communication can be significantly facilitated.
Cultural Models
In order to apply the most appropriate usability standards to localized
software or websites, a developer needs to first have the ability to examine a
culture and determine the specific characteristics that will have the greatest
impact on those standards. Identification of key international variables requires
understanding the various cultural models, through which a developer can isolate
those specific variables that affect usability. While there are many different
cultural models to choose from, some of the most common include the Iceberg
Model, the Pyramid Model, and the Onion Model, each of which considers
different aspects of a particular culture [3]. These models allow for the directed
study of fundamental cultural dimensions, which can further target unique
international variables. In one particular model, cultural analyst Geert Hofstede
identifies five specific dimensions of culture, based on a study of hundreds of
IBM employees in 53 countries from 1978-1983 [5]. He describes Power Distance
as the “extent to which people of a culture accept large of small distances of
power in social hierarchies.” According to Hofstede, Individualism versus
Collectivism “measures the orientation to individual or group achievements.”
Masculinity versus Femininity “measures the degree to which a culture does or
does not separate traditional gender roles.” Uncertainty Avoidance “measures the
degree to which a culture is uncomfortable with uncertainty and seeks to reduce
Shaw Eye-Tracking Thesis 10

uncertainty, often in the pursuit of the truth.” Finally, Long-Term Time
Orientation “grows out of a long-term basis of some cultures in Confucian
thought, which emphasizes patience.”
Of the 53 countries surveyed, the responses from the United States and
Japan are particularly interesting. Aside from Power Distance, in which the US
ranked 38th and Japan ranked 33rd (more employer-employee distance) the other
categories demonstrate marked differences between the countries. The United
States was ranked as the most individualistic country, while Japan was found to
be 22nd (more collective). However, Japan was listed as the most masculine
country, whereas the United States was 15th (more feminine). Japan was the
fourth-highest ranked country for Long-Term Time Orientation, while the United
States was 17th (less patient). The greatest difference between the United States
and Japan came in Uncertainty Avoidance, where the US ranked 43rd and Japan
ranked 7th (less comfortable with uncertainty). These variations have a significant
impact on the differences in user interface design among software and websites
produced for American and Japanese users. This, in turn, has gradually influenced
the user experience, from both a social and technological perspective. Generally,
in Japan, if the user cannot use the system, they blame themselves for not reading
the instruction manual carefully [3]. Users tend to believe that the developer
created the interface in the best possible way, and will work to adapt to the
system, rather than configure the setup based on personal preferences. In the
United States, users are much less patient (Long-Term Time Orientation), and
Shaw Eye-Tracking Thesis 11

often attempt to alter the system to their individual desires, placing the blame on
the product designer for a poorly constructed interface [3].
In looking at the layout differences between American and Japanese user
interfaces, one of the most important variations involves the way that text is
formatted and displayed. It can be taken for granted that English appears visually
distinct from the traditional Japanese character sets (Kanji, Hiragana, and
Katakana). When translated from one language to another, these visual
differences lead to major problems with formatting, due to the increased or
decreased text length. The text-stretching can alter the required size of the user
interface controls that include text, and necessitate moving and reshaping the
controls [6]. When translating from English to German, it is common for the text
to expand by 30%, and as much as 300% for short strings [4]. In general, East
Asian languages use larger font sizes than other language groups and require
expanding text boxes, buttons, and static controls vertically [6]. The larger font
allows for Chinese characters to remain the same size as the number of strokes
increase, unlike English words which differ in length, in height, and form [8].
Bidirectional languages such as Arabic and Hebrew also require mirroring user
interface controls to satisfy the right-to-left reading order of those languages,
which will be discussed in further depth later [6]. Some languages require
different justification based on the spacing between characters, words, and lines
[7]. In fact, some East Asian languages will combine characters and lines within
the same row as part of a top to bottom writing system where columns run from
Shaw Eye-Tracking Thesis 12

right to left. An additional visual issue results from the fact that highlighting
important information is often done with fonts that may not be available
internationally, and colors which have already been shown to cause cultural
confusion [3]. Westerners also tend to use bold text, while Chinese or Japanese
users often prefer dots or accent-like symbols above or below each character [7].
The use of italics to emphasize text is also less appropriate in some scripts, and
the ability to change text case – such as uppercase to stress a particular phrase –
becomes impossible in non-case scripts.
Visual Search
Beyond text translation, the most consistent and most noticeable variation
among American and Japanese user interfaces is the position of text and graphics.
This distinction is overwhelmingly based on the difference between the visual
search pattern of American and Japanese users. When evaluating scanning
techniques, it is important to be mindful that those patterns which are generally
applied to a selection of users in a particular culture, do not necessarily apply to
an individual user from that group. Still, there have been some consistent theories
relating cultural – especially linguistic – principles of visual search tendencies. It
has been shown, for example, that native English-speaking users have an effective
visual field that ranges four characters to the left and fifteen characters to the right
of the current letter being read [9]. In regards to visual search, this is evidenced in
the natural right-to-left scanning techniques of English readers. Jakob Nielsen,
generally regarded as the leading authority on usability, has argued that language
Shaw Eye-Tracking Thesis 13

experiences directly influence different scanning patterns, and thus affect the
user’s visual search performance [10]. Additional studies have found that the
language experiences of young children strongly influence their preferred
scanning direction [11]. Again, it is important to consider that language
experiences are not universal, even within a group of users who share the same
native language. Early exposure to other reading patterns, whether in school or as
a result of growing up in a bilingual family, will affect natural scanning
tendencies. Within the current global climate, it has been increasingly necessary
for non-native English speakers to learn English as a second (or third) language,
as the prevailing use of English in commercial transactions can require the
mastery of several varying scanning techniques. As such, traditional preferences
that may have been commonplace several decades ago have been gradually
altered, and will almost certainly continue to evolve over the years to come.
While most usability studies that focused on cultural navigation have
found some connection between language and scanning preference, there have
been other theories regarding visual search. One study that used an eye tracking
system to measure search performance for click-down menus found that users
tend to search via clustered graphics and icons (where there are quality icons), and
not necessarily left-to-right (among English users) [12]. Anthony Hornof argues
for the existence of several different types of visual searches, based on the amount
of graphical information presented [13]. Hornof explains that a systematic search
“works when there is one group being searched.” A noisy systematic search says
Shaw Eye-Tracking Thesis 14

that “people will try to search in a regular and systematic manner, examining each
item only once, but that random noise will interrupt the process.” According to
Hornof, because of the noise, some items will be missed in a visual sweep and it
will often take several visual sweeps to locate a particular item. After the layout is
searched once without success, the search is repeated starting from the beginning.
This would explain some variation in the search trail, but does not specifically
prohibit a left-to-right trend for English readers, or a right-to-left trend for
Japanese users. Where these studies may find their greatest relative strength is in
the comparatively different search strategies for interfaces that are particularly
oriented toward the use of graphics or text. This research appears to suggest that
interfaces that rely heavy on text will tend to support visual search patterns that
mirror innate reading strategies, based on the user’s native language. On the other
hand, software and websites that include an abundance of graphics would require
a rather different set of skills, and thus result in the properties of a noisy
systematic search, as described above.
Currently, in software and web interface design, text- or graphics-only
layouts tend to be the exception, as most programs and webpages are created with
a balance of each. When culture is taken into account, it has been found that the
language experience can strongly influence design guidelines [14]. Subsequently,
both the English and Japanese languages have a powerful impact on the way that
a particular user interface is arranged, with special emphasis on the location of
interactive elements. Previous research has determined that the layout or
Shaw Eye-Tracking Thesis 15

orientation of these elements is directly responsible for the usability of the system
[15]. A real-world study of Middle Eastern websites designed in Arabic and
Hebrew found that such sites frequently oriented text, links, and graphics from
right-to-left, in accordance with the traditional writing systems of those languages
[16]. The researchers suggested that while American users would initially focus
on the left side of a website, Middle Eastern users would initially focus on the
right side, and that the most important information should be presented
appropriately. They also noted that by manipulating the orientation of the display,
the user’s “comfort zone” is also changed, which thusly affects the way that they
view information. A separate study by Charles Sheppard and Jean Scholtz tested
the ability of North American users to find and retrieve information on a set of
websites with left-oriented navigation, and another set with right-oriented
navigation [17]. When asked to answer specific questions about the content of the
pages, the North American users answered 100% of the questions correctly on the
left-oriented pages. However, the North American users were only able to answer
40% of the questions correctly on the right-oriented pages. The study additionally
tested Middle Eastern users, and found that while they performed better than
North American users on the right-oriented pages, they also scored 100% on the
left-oriented pages. Although Sheppard and Scholtz credited this unexpected
result to flaws in the experimental design, it is possible that the Middle Eastern
users also had more familiarity with left-oriented pages than the North American
users had with right-oriented pages. Regardless, there is a clear connection
between a user’s language, and the usability of interface designs that have been
Shaw Eye-Tracking Thesis 16

localized to the scanning tendencies associated with that language.
Shaw Eye-Tracking Thesis 17

Chapter III – Approaches to Internationalization
The objective of this study is to examine the cultural impact of interface
layout design on usability in order to promote the implementation of multicultural
design guidelines in web and software development. Specifically, this study looks
to compare the effect of manipulating the navigation menu based on traditional
right-to-left and left-to-right reading patterns. Previous research [15, 16, and 17]
has suggested that personal language skills influence the scanning tendencies of
users interacting with websites and other software interfaces. One way to
investigate the current approach toward multicultural interface design is to look at
the websites and software applications available today. A careful search reveals
that both globalization and localization are implemented, though without the
consistency that one might expect. Recall that globalizing websites leads to
interfaces which are general enough to be used by any individual, regardless of
culture [5]. Localized websites take a general interface and create a customized
version for other cultures. While both approaches have supporting theorists, it
may still be surprising to find that there does not seem to be a set of common
guidelines as to when globalization is preferable to localization, and vice-versa.
Various genres of websites – sports, entertainment, technology, etc … – do not
share a consistent methodology for handling various languages and cultures. This
seems to be true regardless of the country that the main site is based out of.
Often, globalization involves the creation of a basic layout template for
one cultural version of a website. In constructing additional cultural versions of
Shaw Eye-Tracking Thesis 18
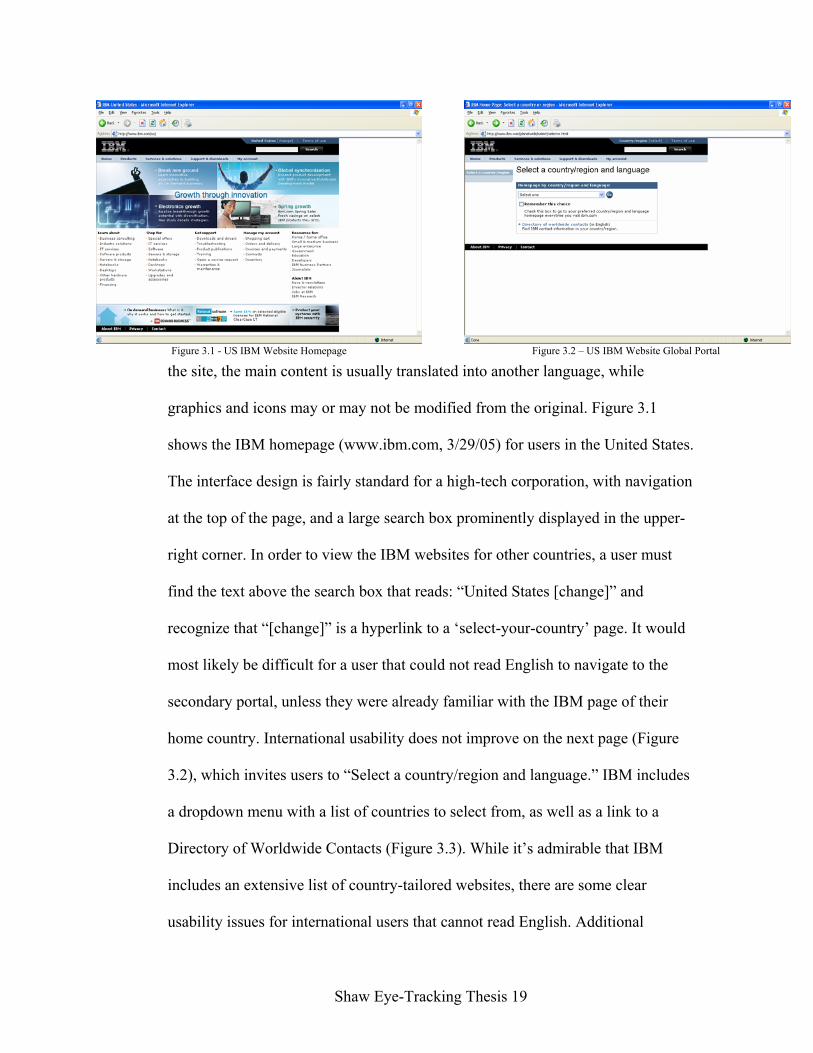
Figure 3.1 - US IBM Website Homepage Figure 3.2 – US IBM Website Global Portal
the site, the main content is usually translated into another language, while
graphics and icons may or may not be modified from the original. Figure 3.1
shows the IBM homepage (www.ibm.com, 3/29/05) for users in the United States.
The interface design is fairly standard for a high-tech corporation, with navigation
at the top of the page, and a large search box prominently displayed in the upper-
right corner. In order to view the IBM websites for other countries, a user must
find the text above the search box that reads: “United States [change]” and
recognize that “[change]” is a hyperlink to a ‘select-your-country’ page. It would
most likely be difficult for a user that could not read English to navigate to the
secondary portal, unless they were already familiar with the IBM page of their
home country. International usability does not improve on the next page (Figure
3.2), which invites users to “Select a country/region and language.” IBM includes
a dropdown menu with a list of countries to select from, as well as a link to a
Directory of Worldwide Contacts (Figure 3.3). While it’s admirable that IBM
includes an extensive list of country-tailored websites, there are some clear
usability issues for international users that cannot read English. Additional
Shaw Eye-Tracking Thesis 19
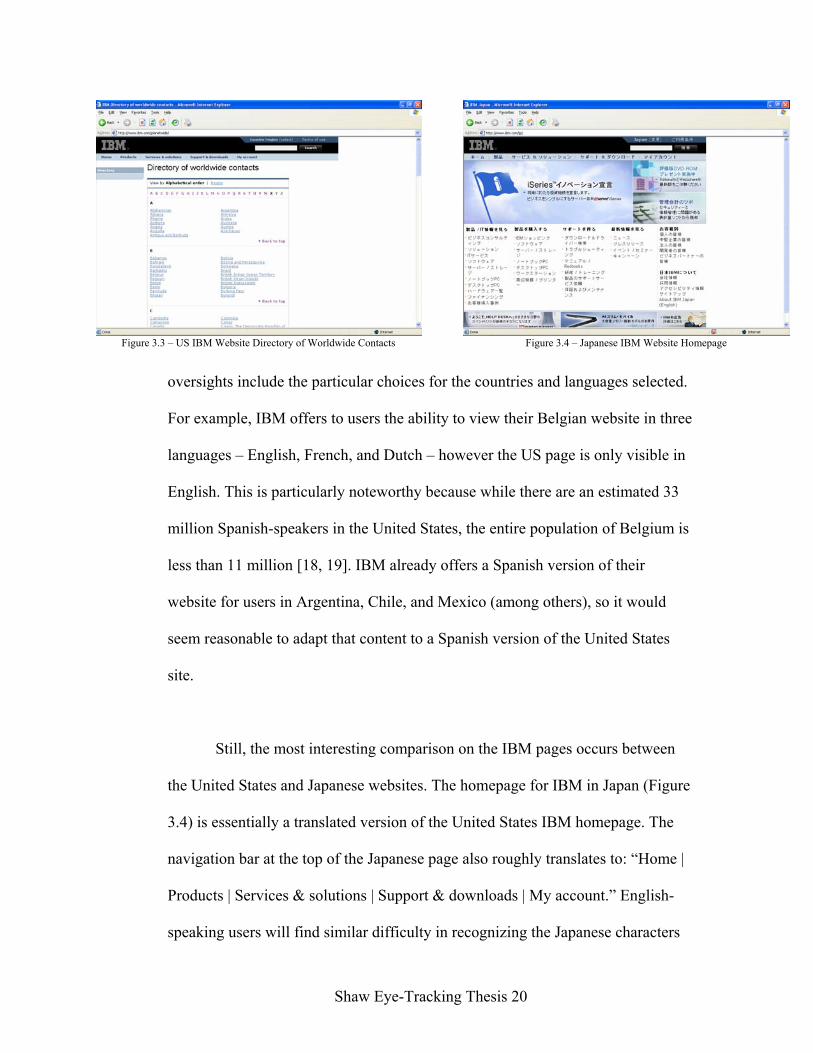
Figure 3.3 – US IBM Website Directory of Worldwide Contacts
Figure 3.4 – Japanese IBM Website Homepage
oversights include the particular choices for the countries and languages selected.
For example, IBM offers to users the ability to view their Belgian website in three
languages – English, French, and Dutch – however the US page is only visible in
English. This is particularly noteworthy because while there are an estimated 33
million Spanish-speakers in the United States, the entire population of Belgium is
less than 11 million [18, 19]. IBM already offers a Spanish version of their
website for users in Argentina, Chile, and Mexico (among others), so it would
seem reasonable to adapt that content to a Spanish version of the United States
site.
Still, the most interesting comparison on the IBM pages occurs between
the United States and Japanese websites. The homepage for IBM in Japan (Figure
3.4) is essentially a translated version of the United States IBM homepage. The
navigation bar at the top of the Japanese page also roughly translates to: “Home |
Products | Services & solutions | Support & downloads | My account.” English-
speaking users will find similar difficulty in recognizing the Japanese characters
Shaw Eye-Tracking Thesis 20

above the search box as a link to select another country or language. There is a
recognizable link in the bottom-right section of the page: “About IBM Japan
(English),” which provides contact information (in English) for the Japanese IBM
headquarters. Aside from translated text and several different graphics, the US
and Japanese versions of the IBM websites are virtually identical. It is likely that
users who were already familiar with one version of the site would be able to
more quickly identify links and other defining characteristics on additional sites,
even in languages that they do not read. However, if a Japanese-speaking user
stumbled onto the US IBM homepage, it would clearly be difficult to both
understand the content of the site, and navigate to the Japanese version of the
page. In terms of positive multicultural interface design, IBM grants the user the
ability to view their site in many languages tailored to numerous countries. The
main drawback is that users who are unfamiliar with their home version of the
IBM website may find particular difficulty in navigating among pages in multiple
languages.
The home furnishing manufacturer IKEA (www.ikea.com, 3/29/05) has
chosen to localize their web pages, presenting an entirely different approach
toward multicultural interface design. The US IKEA website (Figure 3.5) closely
resembles the US IBM site, with a navigation bar at the top of the page, and a
similar layout structure overall. Unlike the US IBM site, the US IKEA site does
not include a direct link to IKEA sites from other countries and languages.
However, IKEA includes a global portal (Figure 3.6) that users generally pass
Shaw Eye-Tracking Thesis 21

Figure 3.5 – US IKEA Website Homepage Figure 3.6 – IKEA Website Global Portal
through before they are directed to their local IKEA website. The IKEA portal
divides the individual IKEA sites into four regions: Europe, North America,
Middle East, and Asia Pacific. Beneath each subheading, IKEA lists the available
countries in both English and the native language(s) of that nation. Interestingly
enough, IKEA includes both French and Dutch translations for their Belgian
pages, though, again, only English is available for the United States site.
Compared to the IBM strategy, the IKEA pages already appear more usable for an
international audience. It generally takes more than a global portal, however, for a
successful model of localized interfaces, and IKEA has taken measures to
customize their website by country. Although it would seem appropriate to again
compare the IKEA websites for the United States and Japan, IKEA will not open
their first Japanese store until 2006, and, understandably, have yet to completely
localize the Japanese pages. However, IKEA opened their first store in Saudi
Arabia in 1983 – two years prior to their first US opening – and have localized
their Saudi Arabian site.
Shaw Eye-Tracking Thesis 22
Figure 3.7 – Saudi Arabian IKEA Website (English) Figure 3.8 – Saudi Arabian IKEA Website (Arabic)
The IKEA Saudi Arabian site offers the ability to view the site in both
English (Figure 3.7) and Arabic (Figure 3.8). The English version includes a link
(in Arabic) to the Arabic version at the top of the page, as well as a link (in
English) to the IKEA global portal in the bottom-right corner. Although there is
no distinct navigational menu on the English homepage, the layout features a left
justification, with the “Store locator” at the top-left section of the page. The
design appears to appropriately correspond with the left-to-right reading
characteristics of the English language. This can be directly contrasted with the
Arabic version of the website, on which the items have a clear right justification,
satisfying Saudi Arabian users that read right-to-left. The English and Arabic
pages are virtual mirror images of each other, with the same links to the online
catalog and product recall information. The Arabic page also includes a link (in
English) to the English version, as well as a link to the global portal at the bottom-
right corner. Although the screenshots of the Arabic and English pages include
different pictures of IKEA furnishings – a bedroom and a kitchen – the difference
is merely coincidental as each site features a set of the same rotating graphics.
Shaw Eye-Tracking Thesis 23

Essentially, there are only two major differences between the sites: the translation,
and the justification. The reasoning for having two language choices to represent
the Saudi Arabian websites is simply to reach additional users who speak one, but
not both, of the languages. It is the layout choice on the IKEA pages – left-
justification for English, and right-justification for Arabic – that provides for the
most interesting analysis.
On the surface, it may appear obvious that the difference in justifications
is based on the reading strategies for the English and Arabic languages. Yet, it
would also have been possible to display the Arabic text in the traditional right-to-
left manner if the Arabic page was left-justified. In the same way, the English text
would still have been legible if it were written in the standard fashion, but right-
justified with the IKEA graphics and links. From a usability standpoint, there
must have been a specific reason for justifying the text and graphics in accordance
with the characteristics of each language. Assuming well-intentioned web
designers, it would be reasonable to conclude that these choices were made to
increase the ease and efficiency of the user’s experience on each site. As previous
research [15, 16] has indicated, the layout of a page can increase or decrease
usability, based on the user’s native language and culture. Studies [10, 11] have
also suggested that language skills affect an individual’s visual scanning approach
and patterns. If the user’s native language can alter the usability of a page layout,
and these linguistic skills also change visual search tendencies, then there must
also be a connection between visual scanning and the usability of particular
Shaw Eye-Tracking Thesis 24

interface designs. Therefore, if a user’s native language changes (from a right-to-
left reading pattern to left-to-right, or vice-versa), their visual search approach
also changes, and the page layout must change to maintain usability.
This study aims to further establish this connection between culture,
specifically language, and the usability of various web designs, based on
associated visual search tendencies. The results of the experiment and subsequent
data analysis will look to explain scanning trends on localized website designs,
and how these trends affect the usability of each site. In order to test these claims,
the experiment tracks and records a user’s eye movement and latency when
completing a usability task. American users, and native English speakers, are
presented with American and Japanese websites (both displayed in English) and
asked to find a specific item on each page. Using localization techniques similar
to the Saudi Arabian IKEA website, the American and Japanese pages have been
specifically chosen for how close matching pairs of pages (within a particular
genre) mirror each other. While none of the pages are strict mirror images, the
major difference among the pages is that the American sites are left-justified,
while the Japanese sites are right-justified – with the exception of one particular
pair of sites. The eye-tracking application used in the experiment asks each user to
find an item that has been located at a mirrored orientation on each pair of
websites. The software records the user’s visual path as he or she scans each page,
as well as the amount of time that it takes the user to locate both the navigation
menu that contains the requested item, as well as the item itself.
Shaw Eye-Tracking Thesis 25

Based on previous research and the nature of this experiment, I would
expect that the American users will tend to begin their visual search path with a
movement to the left that corresponds with the left-to-right scanning pattern for
English language readers. In addition, I would also expect that this initial
tendency to begin the search on the left side of the layout will decrease the latency
for locating the item on American pages with left-justified navigation, with a
corresponding increase in latency for finding items on Japanese pages with right-
justified menus. Because the American sites have been designed with American
users in mind, it stands to reason that it will be easier for American users to locate
the item on these pages. However, this does not mean that the Japanese pages
should be less usable – as measured by latency to complete a task – unless there
are inherent usability problems for American users on right-justified websites.
And, if this is true, one could reason that Japanese users would do well with right-
justified Japanese pages, but have similar usability issues with left-justified
websites. This would mean that for optimal usability, websites should be left-
justified for American users and right-justified for Japanese users, which is,
essentially, the strongest argument for localization. If there are cultural or
linguistic differences among peoples that affect the usability of particular
interface layouts, then web and software developers should respect these
differences and create sites that incorporate the unique interface design needs of
each culture.
Shaw Eye-Tracking Thesis 26
Chapter IV – Methodology
Participants
The participants were 15 undergraduate students (9 female, 6 male) from
Boston College, representing a broad range of majors. Every participant was a
native English speaker from North America (14 US, 1 Canada), who used the
Internet at least several times per day (as self-reported on an exit survey). Three
participants reported fluency in another language – either French or Spanish – but
no participant was familiar with Japanese or other right-to-left reading languages.
Six participants reported that they view web pages from countries outside of the
United States at least one a week, with one participant as frequent as once per
day. Three participants reported that they use the Internet to view websites in
languages other than English at least once a week, with two of the participants
noting that they visit French websites for class assignments. Twelve participants
claimed to use Google as their primary search engine, while the other three
participants use Yahoo! for online searches. One participant wore prescription
eyeglasses during calibration and the experiment, with no noticeable tracking
problems. Participants were not compensated for their assistance. All participants
were provided with written consent forms in accordance with the Boston College
Institutional Review Board regulations [protocol #05.087.01], and the experiment
was conducted in accordance with Boston College IRB ethical regulations.
Equipment
The experiment was performed using an ASL R6 commercial eye-tracker,
Shaw Eye-Tracking Thesis 27

which uses a pan/tilt camera mounted under the computer screen. The ASL
system also includes an optional magnetic head tracker that was not used in this
study. The camera uses reflections from the pupil and cornea to measure eye
position [20]. For increased accuracy, the system uses a bright pupil image, which
reduces error resulting from eyelashes, eyeglasses, contacts, and distance from the
camera [21]. Using these points, the ASL software calculates a gaze trail at each
eye fixation point, with the spatial error between the software calculation and true
eye position designed to be less than 1 degree [22]. The software also records
timing information, including the length of fixations and the total time spent on a
page. This information is passed to GazeTracker, eye-movement analysis
software that operates independently from the tracking system. GazeTracker
defines a fixation as a series of three or more samples within a 40 pixel radius for
at least 200 ms, and records, in sequence, the coordinates of each fixation, and the
duration. The GazeTracker application also allows for the creation of lookzones,
which specify particular areas of interest on each displayed image. GazeTracker
records information about those fixations that fall within the borders of one or
more lookzones, including: number of times observed; number of fixations before
first arrival; and, most importantly for this experiment, the duration before first
fixation arrival (seconds). The participant’s computer contained the stimuli
images and the GazeTracker application, while the operator’s computer ran the
ASL software. All images were displayed on a 17-inch flat panel monitor at a
resolution of 1024x768 and 32-bit color quality. The graphics card was an ATI
Radeon X800 XT.
Shaw Eye-Tracking Thesis 28

Stimuli
A selection of ten websites (presented in Appendix B) were chosen as
examples of five different genres of online content, including education, tourism,
food service, hotels, and search engines. Each genre was represented by an
American webpage and a Japanese webpage (in English) from a sample of real-
world websites discovered through a combination of intuition and meticulous
search. The education and hotels websites represent traditional American and
Japanese localization techniques, with the navigation menu on the left and right,
respectively. Each pair of websites was selected based on matching complexity
levels, with the education sites relatively simple and the hotels sites quite
complex. Complexity was judged based on the amount of content – including text
and graphics – on the page as compared to the amount of white space. The US
tourism page includes a navigation menu at the top, while the Japanese tourism
navigation menu remains on the right side of the layout. This was specifically
done to compare the traditional Japanese layout with the alternate standard US
layout.
The food service and search engine pages were intended to compare
localization and globalization techniques. Food service was represented by the
Starbucks company website, which, much like the Saudi Arabian IKEA site,
localizes their pages by mirroring around a central axis. Although the Starbucks
pages are not entirely identical in content between the US and Japanese sites, the
Shaw Eye-Tracking Thesis 29
layout is virtually the same in terms of position and complexity. Google, well-
known for their straightforward search engine layout, was chosen to represent
strict globalization. The Google website for the US and Japan are exactly the
same, except that the text of each is translated into their respective native
languages. Fortunately, the target item on each page – “I’m Feeling Lucky” –
remains in English, so the participants were not required to recognize any
Japanese text to complete the task. In fact, the Japanese pages for each genre are
almost entirely in English, which I found rare while searching for sample pages.
With localization guidelines becoming more common in multicultural web design,
most English pages based out of Japan had left-hand navigation. While this
demonstrated the increased spread of localization, it made it more difficult to find
appropriate websites for the study.
The websites were presented as screenshots taken within Internet
Explorer, with the address bar and browser navigation buttons removed, allowing
for greater area to be displayed, with fewer distractions to the participants. The
decision to use screenshots instead of live websites was made in order to reduce
the number of actions that the participant needed to take during the experiment.
This indirectly resulted from the difficulties that accompany identifying the visual
trail on a scrolling website. While the GazeTracker application has the ability to
handle live websites, it was determined that such interaction was unnecessary for
the purposes of this study. As a result, each participant saw the same websites in
the same manner (but not the same order), and allowed for a more precise
Shaw Eye-Tracking Thesis 30

analysis. I felt that ten websites provided enough information for the data to be
useful, without the added participant stress – both mentally and physically – that
might accompany viewing twenty or thirty successive websites. In addition, I
wanted to avoid the participants developing practice techniques or an
understanding of the specific goals of the study while the experiment was being
conducted. It was possible that after more than ten sites displayed, the participants
may have begun to expect either an American or Japanese webpage with the
corresponding navigation.
Procedure
The screenshots of the ten selected websites were arranged within the
GazeTracker application to fall in four pseudo-random sequences (listed in
Appendix C). The sequences were created such that, for any particular genre, the
US version was presented prior to the Japanese version in two of the four
sequences, and the Japanese version was presented prior to the US version in the
other two. In addition, no sequence contained a series of more than two US or
Japanese pages in a row. Each website version was also placed in different
positions within the four sequences; for example, the US hotels page fell in the
9th, 6th, 4th, and 1st positions. Finally, no two sites of the same genre (such as the
US and Japanese Starbucks pages) were presented within three positions of each
other. An instruction page (Figure 4.1) was placed immediately before each of the
ten websites, with the message: “Please locate the item labeled: [X] // When you
have found the item, stare at it for one second and press the spacebar key” where
Shaw Eye-Tracking Thesis 31

Figure 4.1 – Instructions for US Starbucks Website Item Search Task Figure 4.2 – US Starbucks Website
[X] is the search task item for each site.
A target item was identified on each page through the creation of
lookzones – visible to the operator before and after the study, but invisible for the
participant during the experiment. Each item was chosen based on its location
relative to the corresponding cultural version. For example, the menu item “our
stores” is located approximately 30% from the top of the US Starbucks page
(Figure 4.2), and the item “company information” falls about 30% from the top of
the Japanese Starbucks page (Figure 4.3). Each item chosen (one per page) was
part of a large, prominent navigation menu, and selected with the intention of
providing no clues as to whether the site was American or Japanese. The items
“our stores” and “company information” do not denote any cultural information
that could influence the visual search path. The only exception to this rule may
have been the hotels pages, where the Japanese site item chosen was “Hotel
Ginza.” This was intentionally balanced with the selection of “Casa Del Mar” as
the American hotel search task item. Using the GazeTracker software, a lookzone
Shaw Eye-Tracking Thesis 32

Figure 4.4 – Calibration Grid Figure 4.3 – Japanese Starbucks Website
was created around the selected task item for each website presented. An
additional lookzone was created around the navigational menu that contained each
task item. Overall, each website included two lookzones, for a total of twenty
different lookzones for the entire experiment.
When participants entered the eye-tracking lab (Boston College, Fulton
Hall 156), they signed a written consent form (Appendix D). Participants then sat
in a standard office chair, positioned in front of a table, approximately 25-inches
from where the user monitor and pan/tilt camera were situated. The image
displayed on the screen was a nine-point grid (Figure 4.4), which was used to
calibrate the participant’s standard eye position. After the operator used a remote
control to focus on the user’s eye in a window on the operator’s computer, the
participant was asked to look at each grid point in order – left-to-right and top-to-
bottom. Each pupil position was recorded using the ASL software to calibrate the
system to the participant’s unique eye angle. Calibration was then verified by
asking the participant to look at one of the nine points at random, while the
Shaw Eye-Tracking Thesis 33
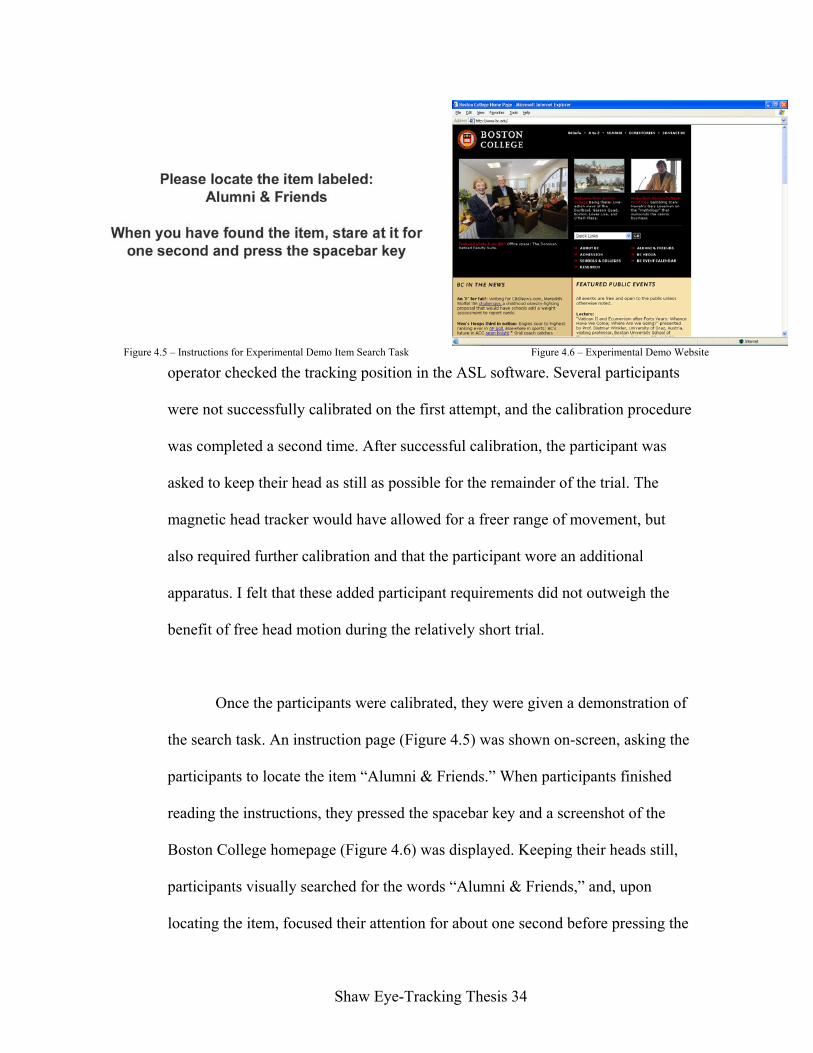
Figure 4.5 – Instructions for Experimental Demo Item Search Task Figure 4.6 – Experimental Demo Website
operator checked the tracking position in the ASL software. Several participants
were not successfully calibrated on the first attempt, and the calibration procedure
was completed a second time. After successful calibration, the participant was
asked to keep their head as still as possible for the remainder of the trial. The
magnetic head tracker would have allowed for a freer range of movement, but
also required further calibration and that the participant wore an additional
apparatus. I felt that these added participant requirements did not outweigh the
benefit of free head motion during the relatively short trial.
Once the participants were calibrated, they were given a demonstration of
the search task. An instruction page (Figure 4.5) was shown on-screen, asking the
participants to locate the item “Alumni & Friends.” When participants finished
reading the instructions, they pressed the spacebar key and a screenshot of the
Boston College homepage (Figure 4.6) was displayed. Keeping their heads still,
participants visually searched for the words “Alumni & Friends,” and, upon
locating the item, focused their attention for about one second before pressing the
Shaw Eye-Tracking Thesis 34

spacebar key to continue. At this point, the operator asked the participants if they
had any questions about the experimental task, and then loaded up one of the four
random sequences of the ten websites in the GazeTracker application. A blank
white screen marked the start of the experimental trial, and the participants were
asked to press the spacebar key when they were ready to begin. The first set of
instructions was displayed, following the same pattern as the demonstration
version of the instruction / website combination. During the trial, the operator
monitored the system to make sure that the participant was still calibrated;
however, no trial was interrupted to re-calibrate the system. After the sequence of
ten websites was displayed and each task item had been located, the GazeTracker
application recorded appropriate latency information, along with the participant’s
ID number (001-015). Participants were given an exit survey (Appendix D), and
debriefed as to the nature of the study. In several situations, multiple participants
were in the laboratory simultaneously, and users were not debriefed until the last
participant had completed the trial. Any additional participants were seated away
from the screen during the first trial, and did not see the instructions, task item, or
website sequence. For each participant, the total time from signing the consent
form to final debriefing was approximately ten minutes, while the experimental
trial lasted about two minutes in duration.
Data Collection
All data was recorded on the participant’s computer using the
GazeTracker software. The data was collected in order to perform two separate
Shaw Eye-Tracking Thesis 35

analyses – one quantitative, and one qualitative – on the participant’s visual
search path. The first was performed using the tracking information for each
lookzone – task item and navigation menu – of each of the ten websites, as
recorded by GazeTracker. The software also recorded the visual path while the
participant read each of the instruction pages; however, that information was not
used due to limited relevance in this study. GazeTracker allows for the ability to
export lookzone latency information for each participant into a separate text file.
The text file included additional pupil diameter information that was not relevant
to the data analysis in this experiment.
The second collection of data was also gathered through the GazeTracker
application, without the use of lookzones. GazeTracker records the participant’s
visual search trail on each website, in addition to the fixation points, which are
labeled in order and in duration. On each image, the visual search path can be
replayed in real-time, allowing for an observer to note specifically where the
participant was looking during the experimental trial. In this study, I observed
whether the initial movement for each participant on each slide was toward the
left or toward the right. Because of the positioning of the instructions in the center
of the screen, almost all participants began their visual search in the center and
made their first movement toward the left or right of the website displayed. For
some participants on certain websites, I was unable to detect whether the visual
trail began with a movement to the left or to the right. In these situations, the
visual trail either started with a vertical movement, or occurred off-screen. In
Shaw Eye-Tracking Thesis 36

addition, the position of the Google navigation menu and task item – for both the
US and Japanese versions – made it nearly impossible to identify the initial
movement on these pages. As a result, only data for the tourism, hotels, education,
and Starbucks pages was collected for this part of the analysis.
Shaw Eye-Tracking Thesis 37

Chapter V – Experimental Results
The study was conducted as a matched pairs experiment, comparing
latency in finding a specific item on an American website and corresponding
Japanese website. The analysis was conducted to determine the first fixation
latency for the navigation menu and the task item on each page. A total of 15
participants were tested on 10 different websites (5 American and 5 Japanese),
with fixations recorded for the menu and task item on each page, for a total of 300
data points. There were several situations where the GazeTracker application did
not record at least one fixation point for a participant’s visual search of a specific
website. These instances were not included in the recorded data, resulting in 28
data points removed from the analysis. Note that the columns in the following
tables do not reflect the display sequence of the websites (which was randomized,
as described earlier).
Table 5.1. Mean Latency Values for First Menu Fixation (in Seconds)
Country Tourism Hotels Education Starbucks Google US 2.812 1.583 0.963 1.080 1.145
Japan 3.814 4.367 1.262 1.082 0.878 Table 5.2. Mean Latency Values for First Item Fixation (in Seconds)
Country Tourism Hotels Education Starbucks Google US 5.151 5.437 1.587 1.442 1.225
Japan 5.170 5.168 1.612 1.605 1.129 Table 5.3. Significance (p value) of Two-Tailed T-Test (US and Japanese Menus)
Tourism Hotels Education Starbucks Google 0.31 0.01 0.38 0.46 0.71
Shaw Eye-Tracking Thesis 38

Table 5.4. Significance (p value) of Two-Tailed T-Test (US and Japanese Items) Tourism Hotels Education Starbucks Google
0.99 0.84 0.98 0.24 0.91
Looking at the raw data, there are several extreme latency values that
greatly skew the means for the menu and item data for both US and Japanese
websites. Removing values that fell outside of twice the standard deviation for
each mean provides for a stronger analysis. There were an additional 15 data
points subtracted for this step.
Table 5.5. Standard Deviation of Latency Values for First Menu Fixation (in Seconds)
Country Tourism Hotels Education Starbucks Google US 2.290 1.710 1.016 0.948 1.527
Japan 1.582 3.126 0.459 0.596 0.999 Table 5.6. Standard Deviation of Latency Values for First Item Fixation (in Seconds)
Country Tourism Hotels Education Starbucks Google US 4.956 9.344 1.064 1.027 1.483
Japan 3.198 3.307 0.485 0.719 0.965 Table 5.7. Adjusted Mean Latency Values for First Menu Fixation (in Seconds)
Country Tourism Hotels Education Starbucks Google US 2.402 1.189 0.713 0.893 0.764
Japan 3.814 3.683 1.262 1.082 0.667 Table 5.8. Adjusted Mean Latency Values for First Item Fixation (in Seconds)
Country Tourism Hotels Education Starbucks Google US 3.911 3.078 1.385 1.257 0.851
Japan 4.479 4.446 1.686 1.605 1.129
Shaw Eye-Tracking Thesis 39
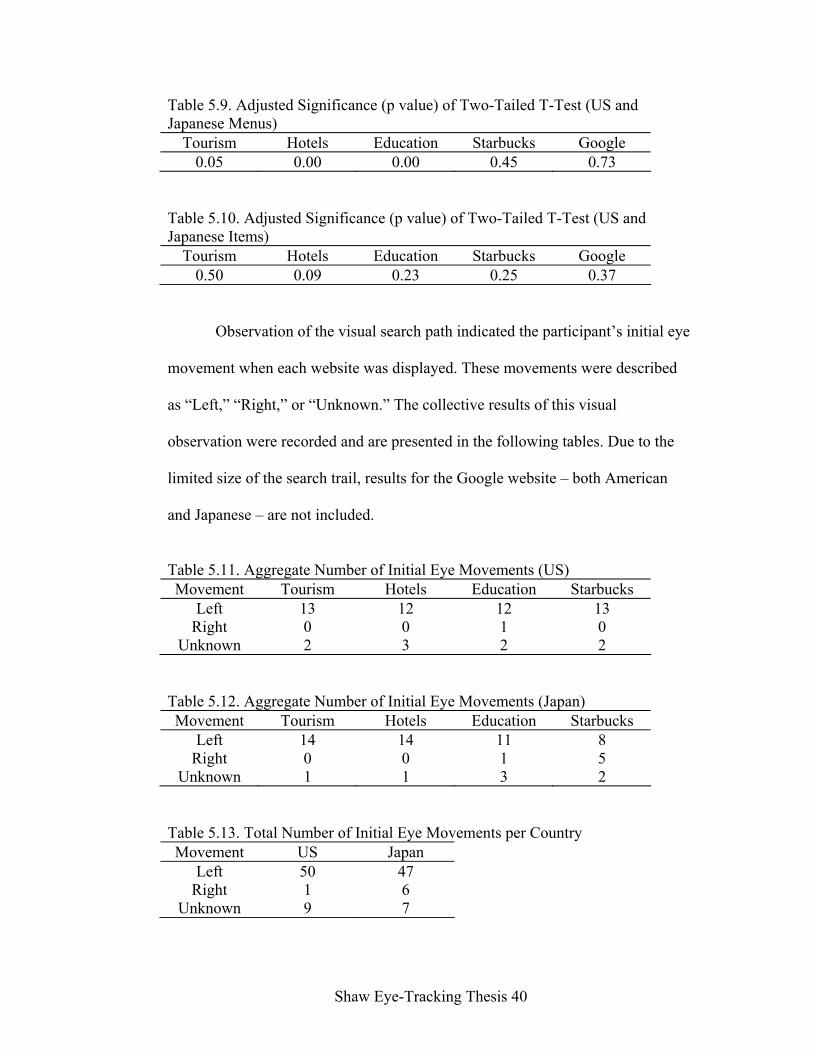
Table 5.9. Adjusted Significance (p value) of Two-Tailed T-Test (US and Japanese Menus)
Tourism Hotels Education Starbucks Google 0.05 0.00 0.00 0.45 0.73
Table 5.10. Adjusted Significance (p value) of Two-Tailed T-Test (US and Japanese Items)
Tourism Hotels Education Starbucks Google 0.50 0.09 0.23 0.25 0.37
Observation of the visual search path indicated the participant’s initial eye
movement when each website was displayed. These movements were described
as “Left,” “Right,” or “Unknown.” The collective results of this visual
observation were recorded and are presented in the following tables. Due to the
limited size of the search trail, results for the Google website – both American
and Japanese – are not included.
Table 5.11. Aggregate Number of Initial Eye Movements (US) Movement Tourism Hotels Education Starbucks
Left 13 12 12 13 Right 0 0 1 0
Unknown 2 3 2 2 Table 5.12. Aggregate Number of Initial Eye Movements (Japan) Movement Tourism Hotels Education Starbucks
Left 14 14 11 8 Right 0 0 1 5
Unknown 1 1 3 2 Table 5.13. Total Number of Initial Eye Movements per Country Movement US Japan
Left 50 47 Right 1 6
Unknown 9 7
Shaw Eye-Tracking Thesis 40

On the exit survey, participants were asked how difficult they found the
task of locating the item on the American and Japanese websites, using a Likert
Scale from 1 (Less Difficult) to 10 (More Difficult). 11 participants reported that
the items were more difficult to find on the American pages, while 4 participants
said that the Japanese items were more difficult to locate. There were not enough
participants in each group for a significant T-test; however, the mean values for
each group are presented in the tables below. Latency values have not been
adjusted by standard deviation as extreme values often swayed the participant
difficulty ratings.
Table 5.14. Mean Task Item Location Difficulty (Self-Reported by Participants)
Country US Japan Difficulty 3.87 5.73
Table 5.15. Mean Latency Values for First Item Fixation – US Pages Difficult (in Seconds)
Country Tourism Hotels Education Starbucks Google US 3.229 11.121 2.500 2.407 0.396
Japan 4.609 5.286 1.714 1.438 1.773 Table 5.16. Mean Latency Values for First Item Fixation – Japanese Pages Difficult (in Seconds)
Country Tourism Hotels Education Starbucks Google US 5.728 3.371 1.338 1.179 1.452
Japan 5.322 5.136 1.584 1.635 0.986
Shaw Eye-Tracking Thesis 41

Chapter VI – Discussion
Examining the unadjusted latency values (Tables 5.1 – 5.4) leads to some
interesting results, despite the lack of statistical significance. Each of the localized
websites had a smaller mean latency to locate the navigation menu on the
American pages as compared to the Japanese pages, although some of these
differences were quite small. The comparison between the American and
Japanese Starbucks pages, for example, appears to be quite coincidental. While I
expected the comparison of latency values for the Google search pages to differ
from the localized websites, I did not anticipate that the Japanese menu would be
faster to find than the American menu. Conceptually, I expected that globalization
would lead to a similar situation to the Starbucks pages, where there was virtually
no latency difference between the US and Japanese sites. One of the goals of
globalization is that the generalities of the layout allow for users to be familiar
enough with one version of a website, that a cultural modification (for example,
translation) would not cause major usability problems. A mean difference of
0.267 seconds would probably not be a major usability problem, but,
theoretically, the difference should not exist in the first place.
Nevertheless, the lack of statistical significance, especially with latency
values for first item fixation had p values that ranged from 0.84 – 0.99 for 80% of
the websites tested, certainly questions the validity of the results. Looking at the
raw data, I noticed that there were several latency values that stood out among the
rest. One participant needed only 0.343 seconds to find the menu on the US
Shaw Eye-Tracking Thesis 42

tourism page, yet took an additional 19.688 seconds before the first item fixation.
Another participant needed more than 30 seconds to locate the US hotels item,
beyond the time that it took to fixate on the navigation menu. Considering that no
participant for any website took more than 21 seconds to find the item, the
extreme latency value was clearly throwing off the results. In fact, removing one
data point for the US hotels item fixation reduced the mean latency value from
5.437 to 3.078, a decrease of more than 40%. Each of the ten US latency values
tested had one extreme data point (from various participants), while five of the
Japanese values included one data point outside of a reasonable range. It was for
this reason that I decided to perform a separate analysis on those values that fell
within two standard deviations from the mean latency value for each website’s
latency values tested.
In looking at the reasons behind the extreme latency values, I noticed
several possible explanations. Of those values which fell above the range, half
occurred on either the American or Japanese versions of the tourism and hotels
websites. Unsurprisingly, these pages were also considered the most visually
complicated of those tested, and had the highest latency values – for both menu
and item fixations – among the five groups. On the hotels pages, the items were
located on the bottom corners, among lists of relatively similar hotel names.
Participants with extreme latency values appeared to miss the item on their first
scan, moving to seemingly random search patterns on subsequent passes (an
example of Hornof’s noisy systematic search, perhaps). A well-designed visual
Shaw Eye-Tracking Thesis 43

search routine would likely have led to faster results, yet one needs to pause at
this point to consider the role of the web user and web designer. Frankly, it is an
unreasonable request by the designer to require that the user develop a particularly
well-designed search routine in order to find information on a website. It suffices
to say that poor web design transcends cultural boundaries, and if native users
cannot adequately navigate a website, an additional usability burden is placed
upon the international community. Incidentally, I also noticed that one participant
fixated for several seconds in one location on the US tourism page, before
continuing their search. Curious, I looked at the upper-right section of the tourism
page and found the sentence “Shop and stay this season …” It seems that the
participant noticed the word “Shop” while looking for “Shopping,” resulting in
the delay. It was an oversight on my part not to recognize the possible conflict
before the experimental trials, though the similarity did not appear to affect any of
the other participants.
After removing the extreme values, the mean latency values (Tables 5.7 –
5.10) become more reasonable and valid. The navigation menu for the tourism,
hotels, and education pages are all statistically significant (p <= .05). For each of
the localized pages, the American navigation menus and task items had smaller
first fixation latency values than corresponding Japanese pages. While the
significance of the difference between the American and Japanese item latencies
exceeded the accepted range, p values were greatly reduced as compared to the
unadjusted item means. This trend has led me to believe that additional studies on
Shaw Eye-Tracking Thesis 44

similar websites may lead to statistically significant results with a larger
participant pool. Still, it is particularly interesting to note that the American
latency values are smaller than the Japanese, especially in regard to the Starbucks
pages. The first fixation for both menus and items had smaller latency values on
the US page, which is essentially a mirror image of the Japanese page. The idea
that American users can navigate an American Starbucks page easier than a
Japanese Starbucks page is, in itself, strikingly significant, because it validates
consideration of the culture of the audience when designing websites. Here are
two pages where the content is virtually identical, and a design that is simply
flipped along its axis, and yet the latency value clearly favors the natural reading
layout. The tourism, hotels, and education pages all feature similar situations,
although their first menu fixations do reach statistical significance. The Google
pages are interesting on their own accord, not for their significance, but rather the
lack thereof. Google had the least significant difference in menu latency, and
second least significance in item latency. Essentially, compared to the localized
versions, the similarities between the US and Japanese Google page layout, leads
to especially similar usability between the two pages. This is, of course, one of the
goals of globalization: greater culture usability on (virtually) the same page.
The initial movements of the visual search path (Tables 5.11 – 5.13)
indicate a strong left-hand favoritism from the participants. It was only one of the
American pages that a participant made an initial movement toward the right side
of the screen. Because American layout favors left-side navigation, this innate
Shaw Eye-Tracking Thesis 45

tendency to look in that direction surely leads to the decrease search latency and
subsequent usability increase. With the exception of the Starbucks pages,
participants also favored the left side on Japanese pages, with initial movements
toward the left for all but one trial. The Starbucks page was a comparative
anomaly, as five users initially looked toward the right side of the websites. I
considered that because the Starbucks pages had a mirrored layout, if users had
already seen the American page, they may have recognized a pattern and known
to look to the right. However, I don’t believe that this is a valid explanation. For
one thing, it would be virtually impossible for the user to be able to recognize a
page as a Starbucks page without scanning the page first, which would already
have required that initial search movement. Thus, the user could not identify the
page, and then go back and modify their initial movement. In addition, the
participants were not informed that there would be multiple pages from one genre,
let alone one company, and therefore had no reason to expect a second Starbucks
page in the first place. It turns out, actually, that of the five participants who
looked to the right on the Japanese Starbucks pages, four saw the Japanese
Starbucks page before the American version. At this point, I am unable to explain
the situation as anything but a random coincidence. Most importantly, though, is
the overwhelming trend of initial movements toward the left for both American
and Japanese websites.
Due to the consistency of initial movement directions, several patterns
emerged among participant visual search paths. A sample search path on the
Shaw Eye-Tracking Thesis 46
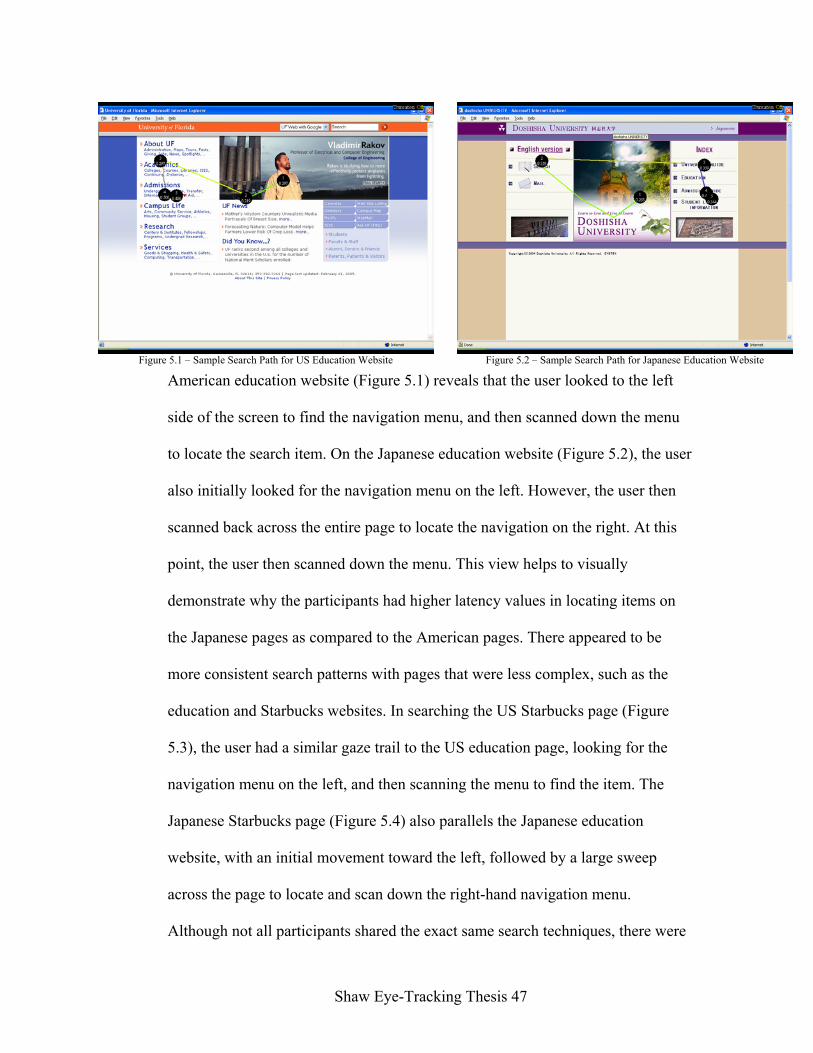
Figure 5.1 – Sample Search Path for US Education Website Figure 5.2 – Sample Search Path for Japanese Education Website
American education website (Figure 5.1) reveals that the user looked to the left
side of the screen to find the navigation menu, and then scanned down the menu
to locate the search item. On the Japanese education website (Figure 5.2), the user
also initially looked for the navigation menu on the left. However, the user then
scanned back across the entire page to locate the navigation on the right. At this
point, the user then scanned down the menu. This view helps to visually
demonstrate why the participants had higher latency values in locating items on
the Japanese pages as compared to the American pages. There appeared to be
more consistent search patterns with pages that were less complex, such as the
education and Starbucks websites. In searching the US Starbucks page (Figure
5.3), the user had a similar gaze trail to the US education page, looking for the
navigation menu on the left, and then scanning the menu to find the item. The
Japanese Starbucks page (Figure 5.4) also parallels the Japanese education
website, with an initial movement toward the left, followed by a large sweep
across the page to locate and scan down the right-hand navigation menu.
Although not all participants shared the exact same search techniques, there were
Shaw Eye-Tracking Thesis 47

Figure 5.3 – Sample Search Path for US Starbucks Website Figure 5.4 – Sample Search Path for Japanese Starbucks Website
vast similarities across the localized pages. Again, these patterns demonstrate the
specific trends that lead to increased usability on US pages for American users as
compared to Japanese designs, with the navigation on the right.
Finally, as part of the survey, participants were asked to rate the difficulty
(Tables 5.14 – 5.16) of each group – American and Japanese – of websites. Not
surprisingly, users found the Japanese task item searches to be more difficult than
the American versions. Only four of the participants believed that the American
search was more difficult. Of those four, three had specific problems navigating
one or more of the American pages (as evidenced by their corresponding latency
data). I asked the remaining participant why they felt that the American pages
were more difficult, and they replied that they knew they did not have to search
the areas of the Japanese websites that contained Japanese characters. In knowing
to search for American words on pages with both American and Japanese text, it
reduced the relative size of the search field. I found this to be a remarkable
strategy for a participant that only saw ten websites and had no prior knowledge
Shaw Eye-Tracking Thesis 48

of the experimental goals prior to the trial. The example provides one look into
how users may circumvent problems in websites designed with another culture in
mind. I was also interested how well individuals were able to correctly identify
the sites that they had navigation difficulty with. On the localized pages,
individuals who claimed more difficulty with American pages did, in fact, have
higher latency values with 3 of the 4 websites. Those participants who said that
the Japanese pages were more difficult to search were also accurate with 3 of 4
genres. The combination of this data with the previous example leads me to
believe that not only are users able to identify websites with troublesome
navigation, they are also able to find strategies to resolve those issues. The main
issue then becomes whether that responsibility should lie with the web developers
or the users themselves.
Shaw Eye-Tracking Thesis 49

Chapter VII – Conclusions
In this study, I set out to evaluate the impact of culture on interface
usability by comparing American users on US and Japanese websites. I examined
latency values for item search tasks on traditional layout examples from each
culture and found significant differences, especially in locating navigation menus.
The experimental results have both answered many of my original questions, and
raised additional questions on the use of localization and globalization in
multicultural interface design. Overall, I would consider the study to be a
successful examination of current approaches to designing for international
audiences. While the study is by no means intended as an exhaustive reference for
all questions on cultural web design, I feel that the results have led to significant
answers.
In comparing websites that had been translated into English (with the
exception of several Japanese characters), the study was able to factor out the
impact of the displayed text itself on cultural usability. Certainly whether or not a
user can read and understand the content of a website has a major impact on
usability; however, this study looked to demonstrate that there are important
factors beyond translation that affect cultural usability. While many different
possibilities were discussed, including graphics, color, and organization, the main
feature analyzed was the placement of the navigation menu in localized pages. I
found that in virtually all situations, arranging the navigation menu on the left side
of the page allowed for a smaller latency in the item search task. Observation of
Shaw Eye-Tracking Thesis 50
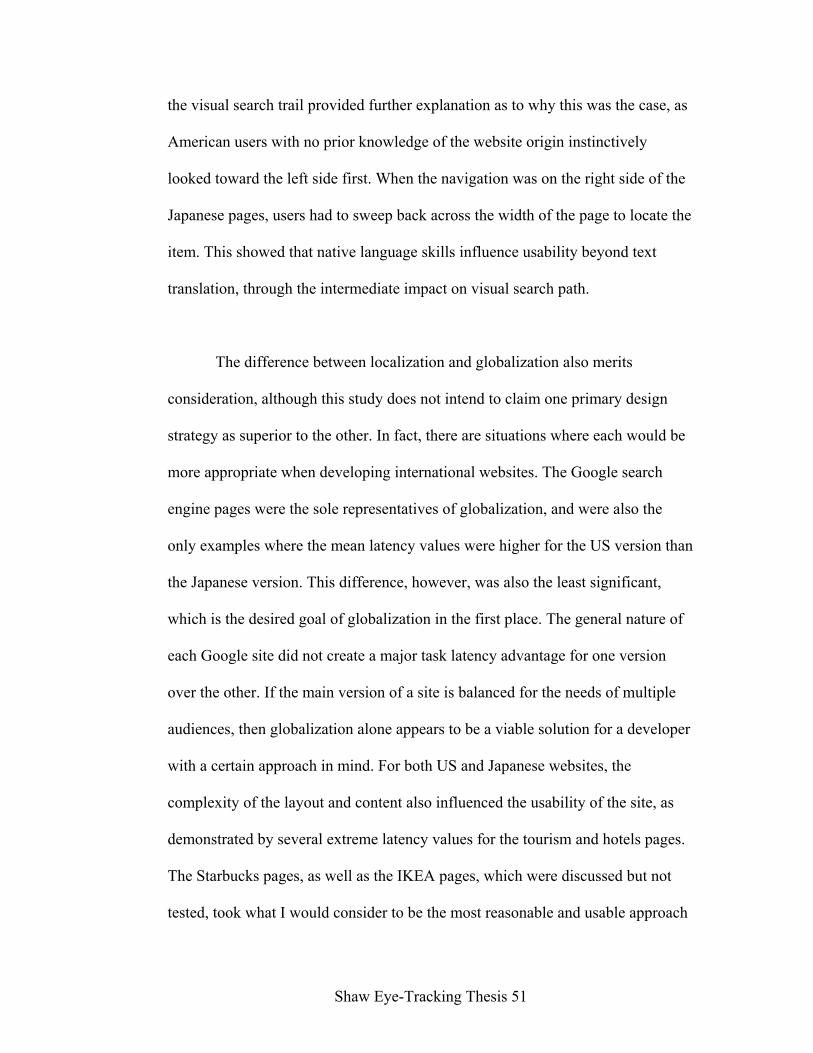
the visual search trail provided further explanation as to why this was the case, as
American users with no prior knowledge of the website origin instinctively
looked toward the left side first. When the navigation was on the right side of the
Japanese pages, users had to sweep back across the width of the page to locate the
item. This showed that native language skills influence usability beyond text
translation, through the intermediate impact on visual search path.
The difference between localization and globalization also merits
consideration, although this study does not intend to claim one primary design
strategy as superior to the other. In fact, there are situations where each would be
more appropriate when developing international websites. The Google search
engine pages were the sole representatives of globalization, and were also the
only examples where the mean latency values were higher for the US version than
the Japanese version. This difference, however, was also the least significant,
which is the desired goal of globalization in the first place. The general nature of
each Google site did not create a major task latency advantage for one version
over the other. If the main version of a site is balanced for the needs of multiple
audiences, then globalization alone appears to be a viable solution for a developer
with a certain approach in mind. For both US and Japanese websites, the
complexity of the layout and content also influenced the usability of the site, as
demonstrated by several extreme latency values for the tourism and hotels pages.
The Starbucks pages, as well as the IKEA pages, which were discussed but not
tested, took what I would consider to be the most reasonable and usable approach
Shaw Eye-Tracking Thesis 51

toward multicultural interface design. Each site had a similar style, with similar
content, yet made a drastic change between cultural versions by changing the
location of the navigation bar. At least with the Starbucks pages, this resulted in
stronger usability for American users on a layout that was designed with their
cultural needs in mind.
I feel that it is this final point – appreciation for the user’s needs – that
provides the strongest message resulting from this study. If the ultimate goal of
good web design is to provide usable content access, then it becomes all the more
important to study user needs on a cross-cultural level. This study has shown that
there are innate cultural differences that cause certain aspects of web design to be
more or less appropriate for specific peoples. Whether these issues are met with
localization, globalization, or a combination of both, is less material to the overall
picture than the simple fact that each user’s cultural needs cannot be ignored by
international web and software developers seeking maximum usability for their
products. With global users becoming an increasingly active online audience,
multicultural interface design is now more important than ever. While the
difference between searching a localized and non-localized website may be less
than a few seconds, it only takes a few seconds to make a lasting impression
online. Visual layout may well be the difference between a sale in an online store
and a more culturally-conscious competitor’s advantage. Users are aware when a
developer has considered their needs in designing a website, and users respond
accordingly. The simple strategy of focusing American pages on the left side, and
Shaw Eye-Tracking Thesis 52

Japanese pages on the right side, is a strong step down the path of solid
multicultural interface design, though real-world developers will likely want to
consider additional characteristics of online layouts. Although the Internet and
other forms of computer-mediated communication have helped to make the world
smaller, the Internet itself is becoming larger and increasingly more difficult to
navigate. International interface designers need to develop products with a global
perspective, guiding users down cultural roads, and remembering their
responsibility to appreciate the human characteristics of human-computer
interaction.
Shaw Eye-Tracking Thesis 53

Chapter VIII – Future Work
Due to the size and scope of the issues that accompany multicultural
interface design, there are many opportunities for future studies related to the
experiments that have been discussed in this paper. One of the most interesting
would involve repeating the same experiment with native Japanese users and
comparing their results to the American participants. I considered recruiting
Japanese volunteers for this experiment, but realized that it would be almost
impossible to differentiate the amount of exposure to American culture for
Japanese individuals living in the United States. The ideal solution, I suppose,
would be to run the experiment in Japan, though such work extended beyond the
reach and resources of this project. Additional work can be done on the specific
usability differences to compare localization and globalization approaches to
global web design. Although this study touched upon such differences, additional
experiments could be designed to more strongly compare and contrast the two
methodologies. The ASL eye-tracker also allows for eye-tracking of explicit
interaction with an online interface. While this study only required the user to
press the spacebar, further interaction using the keyboard, mouse, and scrolling
pages would allow for a more in-depth study of the navigation issues with cultural
interface design.
It would also be interesting to examine the results of training a user on
different cultural approaches toward interface design. For example, if one were to
alter the instruction page used in this study to explicitly tell the user that the
Shaw Eye-Tracking Thesis 54

upcoming website was American or Japanese, their initial visual search
movements may change accordingly. In most online interaction, the user is at
least broadly aware of the culture of the pages that they are viewing. As patterns
develop, users may be able to adapt to localization techniques that differ from
those of their native culture. One possible experiment could display ten similarly
designed Japanese pages in a row, and determine how much learning and
adaptation occurs from the first page to the last. If users are able to quickly adapt
in situations where they know to expect certain characteristics of web design, it
may result in less specific localization requirements in real-world situations where
there are less likely to be drastic changes among one particular assortment of
cultural websites from. Still, it would be wrong to assume this capability from all
users, and the overlying responsibility for strong cultural usability remains with
the human developers that oversee the creation, evaluation, and implementation of
multicultural interface designs.
Shaw Eye-Tracking Thesis 55

References [1] Yunker, John. Beyond Borders: Web Globalization Strategies. Indianapolis: New Riders, 2003. [2] Esselink, Bert. A Practical Guide to Localization. Philadelphia: John Benjamins, 2000. [3] Del Galdo, Elisa M., and Jakob Nielsen, eds. International User Interfaces. New York: John Wiley & Sons, 1996. [4] Deitsch, Andrew, and David Czarnecki. Java Internationalization. Cambridge: O’Reilly & Associates, 2001. [5] Aykin, Nuray, ed. Usability and Internationalization of Information Technology. Mahwah, New Jersey: Lawrence Erlbaum Associates, 2005. [6] Dr. International. Developing International Software. Redmond, Washington: Microsoft Press, 2003. [7] Savourel, Yves. XML Internationalization and Localization. Indianapolis: Sams, 2001. [8] Tang, C.K., Au Yeung, L.H., and H.C. Chen. “The Effective Visual Field in Chinese Reading.” Cognitive Processing of Chinese and Related Asian Languages. Ed. H.C. Chen. Hong Kong: The Chinese University Press, 1997. [9] Rayner, K. Inhoff, A.W., Morrison, R.E., Slowwiaczek, M.L., and J.H. Bertera. “Masking of Foveal and Parafoveal Vision During Eye Fixations in Reading.” Journal of Experiment Psychology: Human Perception and Performance 7 (1981): 167-179. [10] Nielsen, Jakob, ed. Designing User Interfaces for International Use. Amsterdam: Elsevier, 1990. [11] Liu, I.M., Chen, H.C., and M.J. Chen, eds. Cognitive Aspects of the Chinese Language. Hong Kong: Asian Research Service, 1988. [12] Byrne, Michael D., Anderson, John R., Douglass, Scott, and Michael Matessa. “Eye Tracking the Visual Search of Click-Down Menus.” Proceedings of CHI 99, May 15-20, 1999: Human Factors in Computing Systems. Pittsburgh: ACM SIGCHI, 1999. 402-9. [13] Hornof, Anthony J. “Cognitive Strategies for the Visual Search of Hierarchical Computer Displays.” Human-Computer Interaction 19 (2004).
Shaw Eye-Tracking Thesis 56

[14] Goonetillekey, Ravindra S., Lau W.C., and Heloisa M. Shih. “Visual Search Strategies and Eye Movements When Searching Chinese Character Screens.” Int. J. Human-Computer Studies 57 (2002): 447–468. [15] Backs, R.W., Walrath L.C., and G.A. Hancock. “Comparison of Horizontal and Vertical Menu Formats.” Proceedings of the Human Factors Society 31st Annual Meeting, October 19-22, 1987. Santa Monica, CA: Human and Ergonomics Society, 1987. 715-7. [16] Barber, Wendy, and Albert Badre. “Culturability: The Merging of Culture and Usability.” Proceedings of the 4th Conference on Human Factors & the Web, June 5, 1998. Basking Ridge, NJ: AT&T Labs, 1998. [17] Sheppard, Charles, and Jean Scholtz. “The Effects of Cultural Markers on Web Site Use.” Proceedings of the 5th Conference on Human Factors & the Web, June 3, 1999. Gaithersburg, Maryland: National Institute of Standards and Technology, 1999. [18] “Bilingual America.” 2002. 31 Mar. 2005 <http://www.bilingualamerica.com/main/20goodreasons.htm>. [19] “The World Factbook.” 10 Feb. 2005. 31 Mar. 2005 <http://www.cia.gov/cia/publications/factbook/geos/be.html>. [20] Pan, Bing, Hembrooke, Helene A., Gay, Geri K., Granka, Laura A., Feusner, Matthew K., and Jill K. Newman. “The Determinants of Web Page Viewing Behavior: An Eye-Tracking Study.” Proceedings of Eye Tracking Research & Applications. New York: ACM SIGGRAPH, 2004. [21] “Applied Science Laboratories.” 25 Jan. 2005. 2 Apr. 2005 <http://a-s-l.com/>. [22] Renshaw, J.A., Finlay, J.E., Ward, R.D., and D. Tyfa. “The Impact of Object Dimensions on Eye Gaze.” Proceedings Volume 2 of the 16th British HCI Conference, September 2-6, 2002. London, England: British HCI Group, 2002.
Shaw Eye-Tracking Thesis 57

Appendix A – Experimental Data
Table A.1. Latency Values for First Menu Fixation – US (in Seconds) Participant Tourism Hotels Education Starbucks Google
1 1.547 0.719 0.469 0.828 0.984 2 2.719 3.328 0.328 0.671 0.359 3 0.735 0.750 0.547 2.500 0.109 4 1.937 1.297 1.000 0.453 1.906 5 2.875 0.516 0.610 0.906 0.266 6 1.438 0.734 0.578 0.719 0.469 7 5.656 0.735 0.953 0.531 0.719 8 5.766 0.687 4.218 0.438 0.453 9 - 0.656 0.609 0.438 0.859 10 0.343 0.797 0.281 0.937 0.375 11 - 1.531 - - - 12 1.109 2.390 1.047 2.109 6.094 13 7.734 1.015 0.500 0.813 1.593 14 3.750 1.484 1.813 0.266 1.500 15 0.953 7.109 0.531 3.516 0.344
Table A.2. Latency Values for First Menu Fixation – Japan (in Seconds) Participant Tourism Hotels Education Starbucks Google
1 3.547 5.656 1.422 1.032 0.297 2 2.688 2.562 1.578 1.516 1.015 3 2.672 2.875 - 0.375 - 4 1.390 2.937 2.047 0.375 - 5 6.125 2.969 1.968 1.125 0.407 6 3.000 3.250 0.813 0.547 0.344 7 4.812 4.079 1.171 1.531 0.313 8 2.953 3.672 1.203 1.859 0.328 9 5.437 2.360 0.828 0.640 0.391 10 3.875 2.281 1.265 0.500 2.718 11 - - 0.843 - - 12 3.625 1.219 1.047 2.203 0.281 13 1.750 13.266 0.641 0.891 - 14 4.812 8.156 0.953 1.469 0.578 15 6.703 5.859 1.891 - 2.984
Shaw Eye-Tracking Thesis 58

Table A.3. Latency Values for First Item Fixation – US (in Seconds) Participant Tourism Hotels Education Starbucks Google
1 6.297 6.391 0.469 1.281 0.984 2 2.719 4.312 2.062 1.687 0.578 3 1.250 2.000 0.985 2.938 0.390 4 2.906 7.266 1.000 0.453 1.906 5 3.594 0.938 1.422 2.031 0.641 6 2.203 1.656 1.031 0.719 0.469 7 6.937 2.641 1.563 0.766 0.719 8 5.766 2.484 4.218 0.438 0.453 9 - 1.672 0.609 0.813 0.859 10 20.031 1.156 1.156 1.625 0.625 11 - 1.531 - - - 12 1.109 4.640 1.766 2.109 6.094 13 7.734 4.687 0.500 1.219 1.593 14 3.750 1.719 3.141 0.266 1.500 15 2.671 38.469 2.297 3.844 0.344
Table A.4. Latency Values for First Item Fixation – Japan (in Seconds) Participant Tourism Hotels Education Starbucks Google
1 14.141 5.656 1.969 1.641 0.922 2 3.188 2.562 2.125 2.047 1.343 3 2.672 4.484 - 0.672 - 4 1.390 3.593 2.047 0.906 - 5 7.875 4.265 1.968 2.469 0.407 6 4.125 3.250 1.188 0.547 1.063 7 4.812 4.313 1.687 2.047 0.938 8 3.468 5.078 1.203 2.203 0.562 9 5.687 4.797 1.406 1.203 0.391 10 4.938 2.281 1.500 0.938 2.953 11 - - 1.422 - - 12 3.906 1.828 1.656 2.875 0.281 13 2.422 14.563 0.641 1.594 - 14 6.062 9.390 1.234 1.719 0.578 15 7.688 6.297 2.516 - 2.984
Shaw Eye-Tracking Thesis 59

Appendix B – Websites Used
US - Tourism
http://www.chicago.il.org/default.html (February 21, 2005)
Japan - Tourism
http://www.tourism.metro.tokyo.jp/english/ (February 21, 2005)
Shaw Eye-Tracking Thesis 60
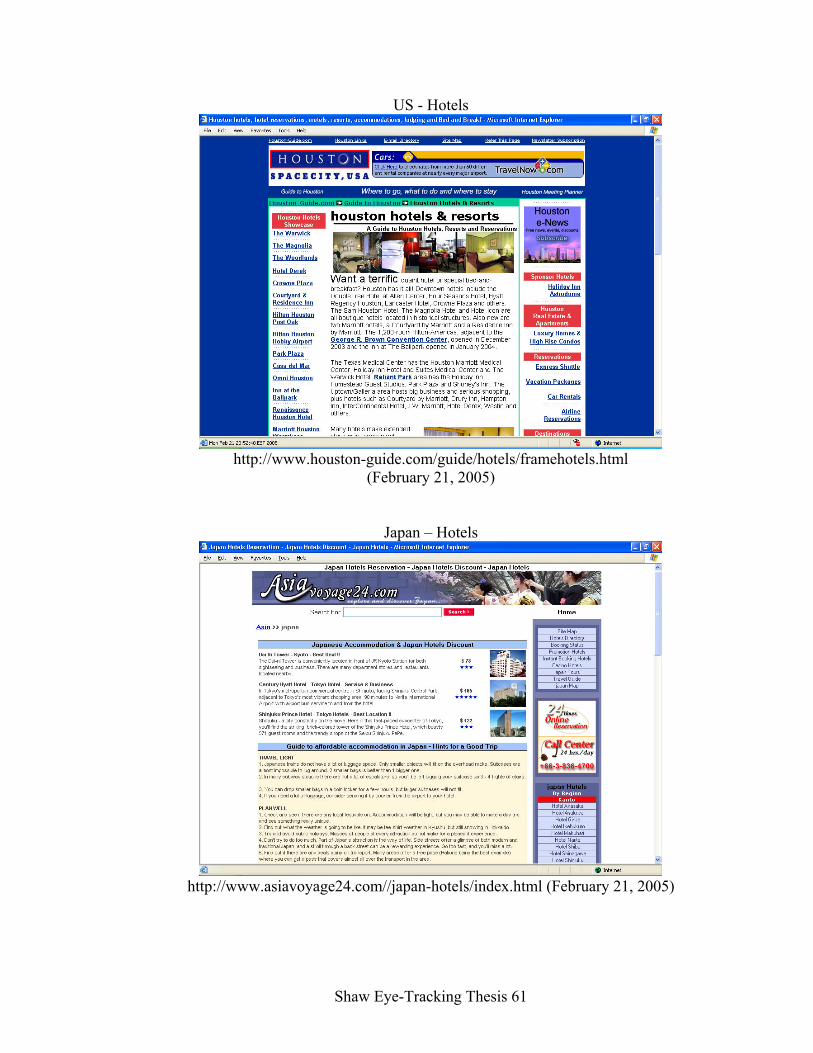
US - Hotels
http://www.houston-guide.com/guide/hotels/framehotels.html
(February 21, 2005)
Japan – Hotels
http://www.asiavoyage24.com//japan-hotels/index.html (February 21, 2005)
Shaw Eye-Tracking Thesis 61

US – Education
http://www.ufl.edu/ (February 21, 2005)
Japan – Education
http://www.doshisha.ac.jp/english/ (February 21, 2005)
Shaw Eye-Tracking Thesis 62
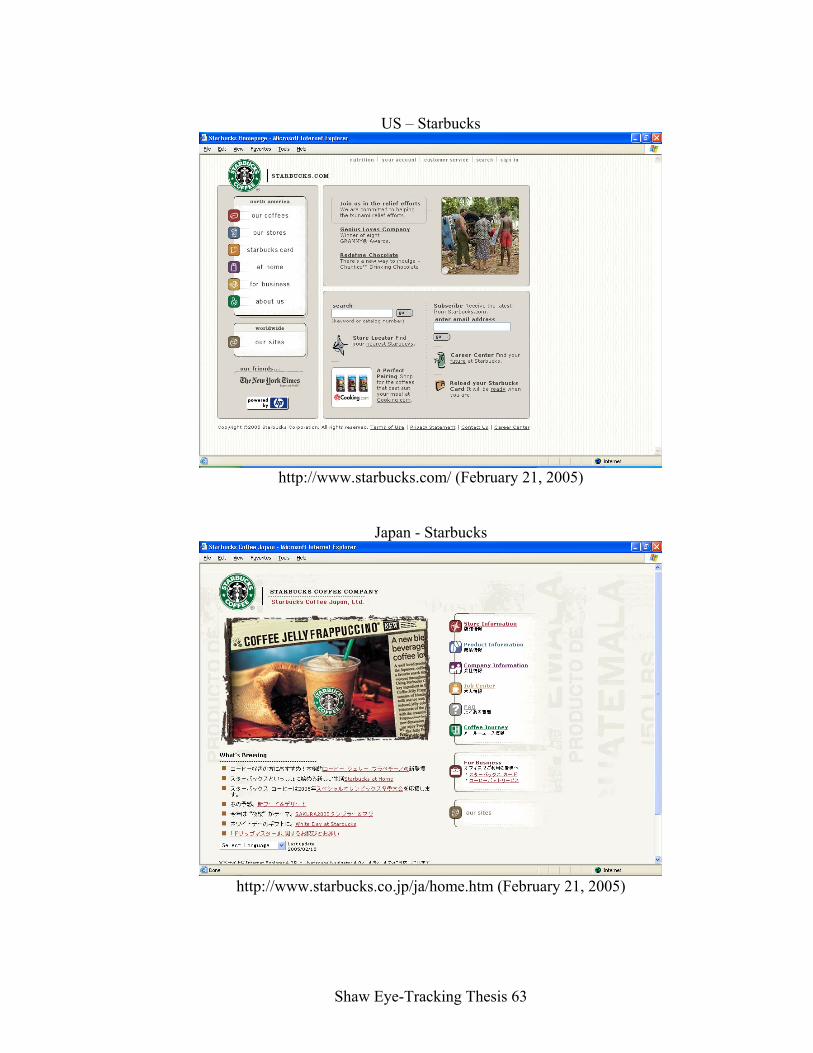
US – Starbucks
http://www.starbucks.com/ (February 21, 2005)
Japan - Starbucks
http://www.starbucks.co.jp/ja/home.htm (February 21, 2005)
Shaw Eye-Tracking Thesis 63
US – Google
http://www.google.com (February 21, 2005)
Japan - Google
http://www.google.co.jp/ (February 21, 2005)
Shaw Eye-Tracking Thesis 64

Appendix C – Randomization Order
Random Order 1 1. US Education 2. Japan Starbucks 3. Japan Hotels 4. US Tourism 5. US Google 6. Japan Tourism 7. US Starbucks 8. Japan Google 9. US Hotels 10. Japan Education Random Order 2 1. US Starbucks 2. Japan Google 3. US Education 4. Japan Hotels 5. Japan Tourism 6. US Hotels 7. Japan Education 8. US Google 9. US Tourism 10. Japan Starbucks Random Order 3 1. US Tourism 2. Japan Education 3. Japan Google 4. US Hotels 5. US Starbucks 6. Japan Tourism 7. US Education 8. US Google 9. Japan Hotels 10. Japan Starbucks Random Order 4 1. US Hotels 2. Japan Starbucks 3. US Google 4. Japan Tourism 5. Japan Education 6. US Starbucks 7. US Tourism 8. Japan Hotels 9. Japan Google 10. US Education
Shaw Eye-Tracking Thesis 65

Appendix D – Participant Forms
Participant Consent Form
BOSTON COLLEGE
Consent to Participate in a Research Study Introduction: You are being invited to participate in a research project about the affects of cultural web designs on usability. The study is being undertaken through the Computer Science department at Boston College. Your participation is completely voluntary. This study is being conducted by Dan Shaw, A&S ’05, under the advisement of James Gips, a Professor of Computer Science at Boston College.
Purpose: The study intends to explore the relationship between culturally-influenced web page designs and user efficiency. We are examining the correlation between the design of multicultural interfaces and corresponding ease of use, as measured by the amount of time it takes to navigate each page.
Procedures: If you decide to participate you will be asked to sit in front of a computer monitor and navigate through a collection of screen shots of real web pages. A small camera will track the position of your eye as you visually navigate each web page. As each subsequent web page is displayed, you will be asked to find a specific item on the page. After each page is displayed, you will be given a brief rest period and a new set of instructions. In order to standardize the camera software, you will first be asked to look at specific points on the screen during a short calibration process. The entire process should take about 30 minutes in total. At the conclusion of the procedure, you will be asked to complete a short exit survey on your experiences with the various interfaces.
Risks: To the best of our knowledge, the procedures used in this study have no more risk of harm to you than what you experience in everyday life.
Benefits: We hope this research demonstrates the efficiency and increased usability of culturally-specific interface designs, and will encourage greater research and development in this area. There are no direct benefits to you for participating in this study.
Shaw Eye-Tracking Thesis 66

Withdrawal from the study:If you choose to participate in this project, please understand that your participation is voluntary and you have the right to withdraw your consent or discontinue participation at any time. You are also welcome to ask questions at any time during the session.
Confidentiality: No personally identifiable information will be collected during the study, and no identifiers will be used that could potentially link you to the data collected. This data will be in the form of X and Y coordinates that track eye position over the recorded time. In addition, your responses on the exit survey will not contain personal identifiers. All of the data collected will be stored in a locked file cabinet in James Gips’ office at Boston College, which is also locked at all times. All data and documents relating to this study will be kept for five years beyond the termination of the study and then destroyed. Only the principal investigator (Dan Shaw) and research advisor (James Gips) will have access to this data set.
Questions: You are encouraged to ask questions now, and at anytime during the study. You can reach Dan Shaw at 617-655-5614 or Professor James Gips at 617-552-3981. If you have any questions about your rights as a participant in research, please contact the Boston College Office for Human Research Participant Protection at 617-552-4778. I have read and I believe I understand this Informed Consent document. I believe I understand the purpose of this research project and what I will be asked to do. I have been given the opportunity to ask questions and they have been answered satisfactorily. I understand that I may stop my participation in this research study at any time and that I can refuse to answer any question(s). I have received a signed copy of this Informed Consent document for my personal reference. I hereby give my informed and free consent to be a participant in this study. Signatures: _____________ _________________________________________________ Date Consent Signature of Participant
__________________________________________________________ Print Name of Participant _________________________________________________ Person providing information and witness to consent
Shaw Eye-Tracking Thesis 67

Participant Exit Survey
Age: 18-24 25-34 35+ ID #: ______ Gender: Male Female Random #: ______ Country of Birth: _____________________________ 1. How often do you use the Internet to view web pages? a) Once a month (or less) b) Once a week c) Once a day d) Several times per day (or more) 2. How often do you use the Internet to view web pages from countries other than the United States? a) Once a month (or less) b) Once a week c) Once a day d) Several times per day (or more) 3. How often do you use the Internet to view web pages in languages other than English? a) Once a month (or less) b) Once a week c) Once a day d) Several times per day (or more) 4. Is English your native language? a) Yes b) No 5. Are you fluent in languages other than English? a) Yes b) No 5a) If you answered “yes” to question 5, please list the languages below: 6) Which Internet search engine do you use most often? a) Yahoo! b) Google c) MSN d) Other (please specify): ______________ 7) Overall, how difficult did you find it to locate the item on Japanese web sites? Less More 1 2 3 4 5 6 7 8 9 10 8) Overall, how difficult did you find it to locate the item on English web sites? Less More 1 2 3 4 5 6 7 8 9 10
Shaw Eye-Tracking Thesis 68