Embed Size (px)
Citation preview

UNCLASSIFIED
AD NUMBER
LIMITATION CHANGESTO:
FROM:
AUTHORITY
THIS PAGE IS UNCLASSIFIED
AD483670
Approved for public release; distribution isunlimited.
Distribution authorized to U.S. Gov't. agenciesand their contractors;Administrative/Operational Use; MAY 1966. Otherrequests shall be referred to NavalPostgraduate School, Monterey, CA.
NPS ltr 28 Jun 1971

UNITED STATE! TE SC
Ti H . Jw O^ Ji O^
AT
HA 'lOACTr/.x j^r-n'1:: i-pp-/"':i'.f!is H'H' ■:
!":!•. UNTT-D STATr:S NAVAL POCTGRADUATK >
by
liu'iolf Theodore Anarev; Bredderman
'''Hooi.
.■lay 1966
This document is subject to special i xport con- trols and each transmittal to foreign gnvrnment or foreign nationals may be made only with prior approval of the U. S. Naval Postgraduate School.
■Wfe HI inmiiiiininii
RADIOACTIVE GASEOUS EFFLUENTS FROM THE CORE OF THE AGN-201
REACTOR AT THE UNITED STATES NAVAL POSTGRADUATE SCHOOL
by
Rudolf Theodore Andrew Bredderman Lieutenant Cotmander, United States Navy
B.S., Cornell University, 1956
Submitted in partial fulfillment for the degree of
MASTER OF SCIENCE IN PHYSICS
from the
UNITED STATES NAVAL POSTGRADUATE SCHOOL
May 1966
Signature of Author
Certified by
Accepted by
Nucleaj/Engr (Effects) Curriculum,
£X^
May, 1966
/ ''Thesi Thesis Advisor
£J. Chairman, Departfnent of Physics
Approved by (/[ 1 ^7 (A^iX aM Academic Dean

ABSTRACT
A (qualitative and quantitative analysis of the core p;as
generated by the AGN-201 reactor at the United. States Naval
Postgraduate School was made by analysis of the spectrum of
gamma-rays emitted two hours after peak power' operations.
The principle radioactive isotopes present, based on gamma-
ray photopeak energies and half-lives, were found to be
Krö'Jin, Kr8^, Kr88, Xe133, and Xe135- ^Q total activity
(gamma-ray energies - 2.7 Mev) was found to be 363 - '' 'nic-1"0-
curies per milliter. The percent of the total activity due
to the presence of each isotope identified in the order stated
above is 10.2%, 9-0%, '\7.^%, 18.6%, and HJ\%. The sources of
the remaining 10.^ of the total activity were not identified.

TABLE OF CONTENTS
Section Page
1. Introduction 11
2. Equipment a. Scintillation detector, enclosure and 11
preamplifier b. Power supplies 12 c. Multj -Channel Pulse Height Analyzer 12 d. Gas sample bottles 13
3. Equipment Calibration a. Gas bottle volume 13 b. Counting efficiency 17 c. Channel vs. Energy relationship for
Multi-Channel Analyzer 18 d. Peak-to-Total Ratio 18
4. Procedures a. Gas sampling 19 b. Obtaining gamma-ray spectrum 20 c. Determination of half-lives 21 d. Activity determination 21
5. Results a. Qualitative results 23 b. Quantitative results 30
6. Conclusions 33
7. Acknowledgements 3^
8. Bibliography 36
APPENDIX I Comparisons of the Original Gairma-ray 37 Spectrum with Spectrums Four and Fourteen Hours Later
APPENDIX II Decay Curves for Observed Photopeaks 39
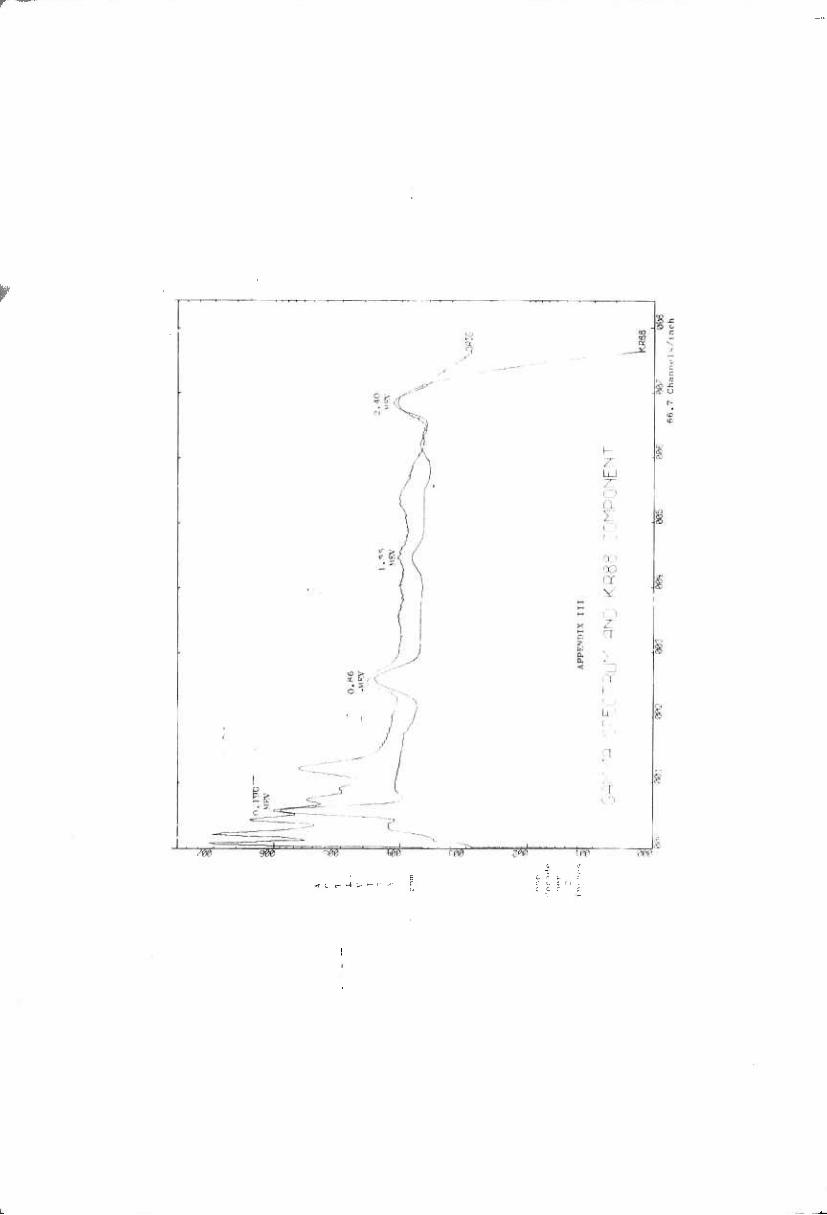
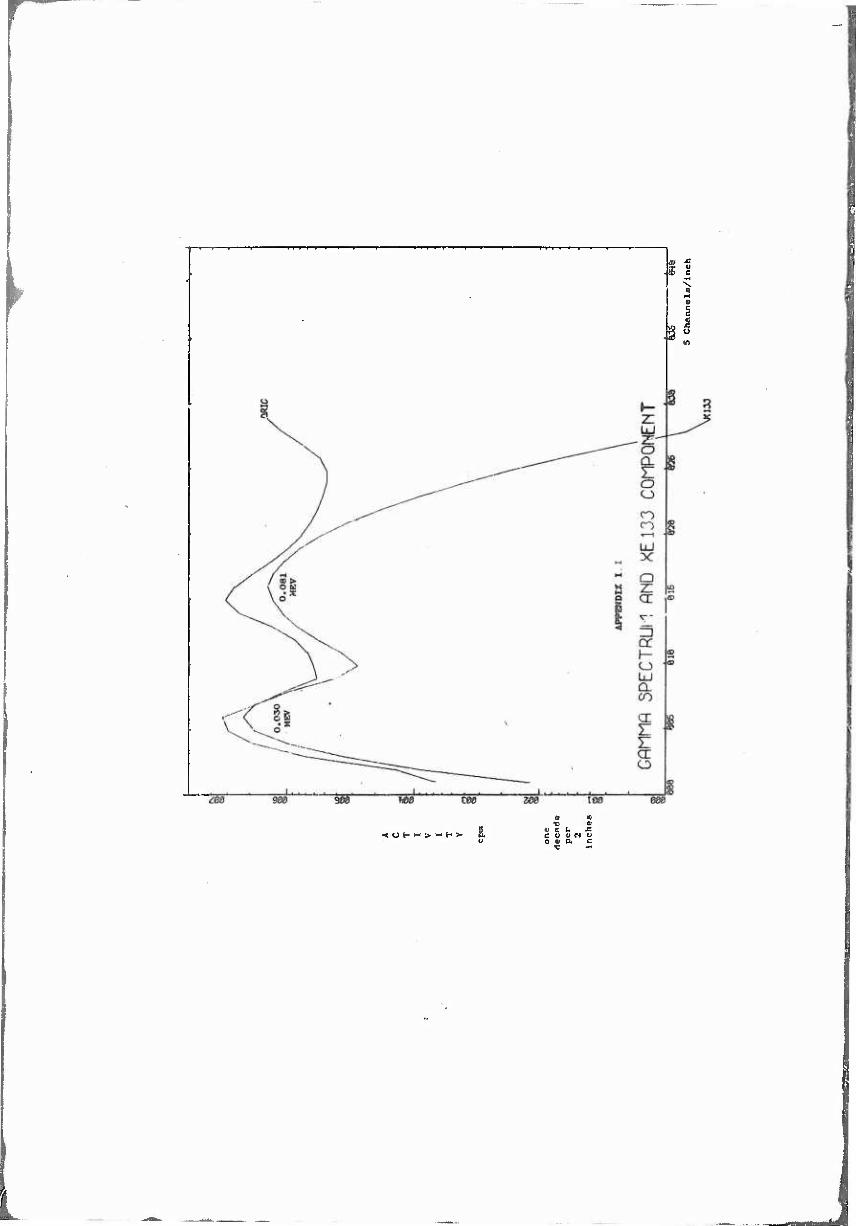
APPENDIX III Gamma-ray Spectrum Assigned to Each '18 Identified Isotope
APPENDIX IV Energy vs. Channel Number Curve for I'l 5^ March 1966

blST OP TABLES
Table Page
I. Photopcak Energies and Half-lives 25
Ila. Decay of Parent Isotopes 26
lib. Decay Scheme of Identified Isotopes 27
III. Gamma-rays Emitted by Radioactive Nuclei 29
IV. Activity Associated with Each Photopeak 31
V. Activity Associated with Each Identified 32 Radioactive Isotope
^•v! ca-. :»-i£?--a '*-'".' blank, t^r^for'- net f i ln:«tl.

trnm*
LIST CF ILLUSTRATIONS
Figure Page
1. Block Diagram of Scintillation Detector 1^ and Pulse Heirat Analyser
2. Diagrarr of Sample Bottle and Photomultiplier 15 Tube with Nal(Tl) Crystal
3. Block Diagram of Reactor Gas Handling 16 System
r>r >-.-i OMH p^£^ wr- blank, Mi-j'^fo — net n"Lm«il-
mm mm
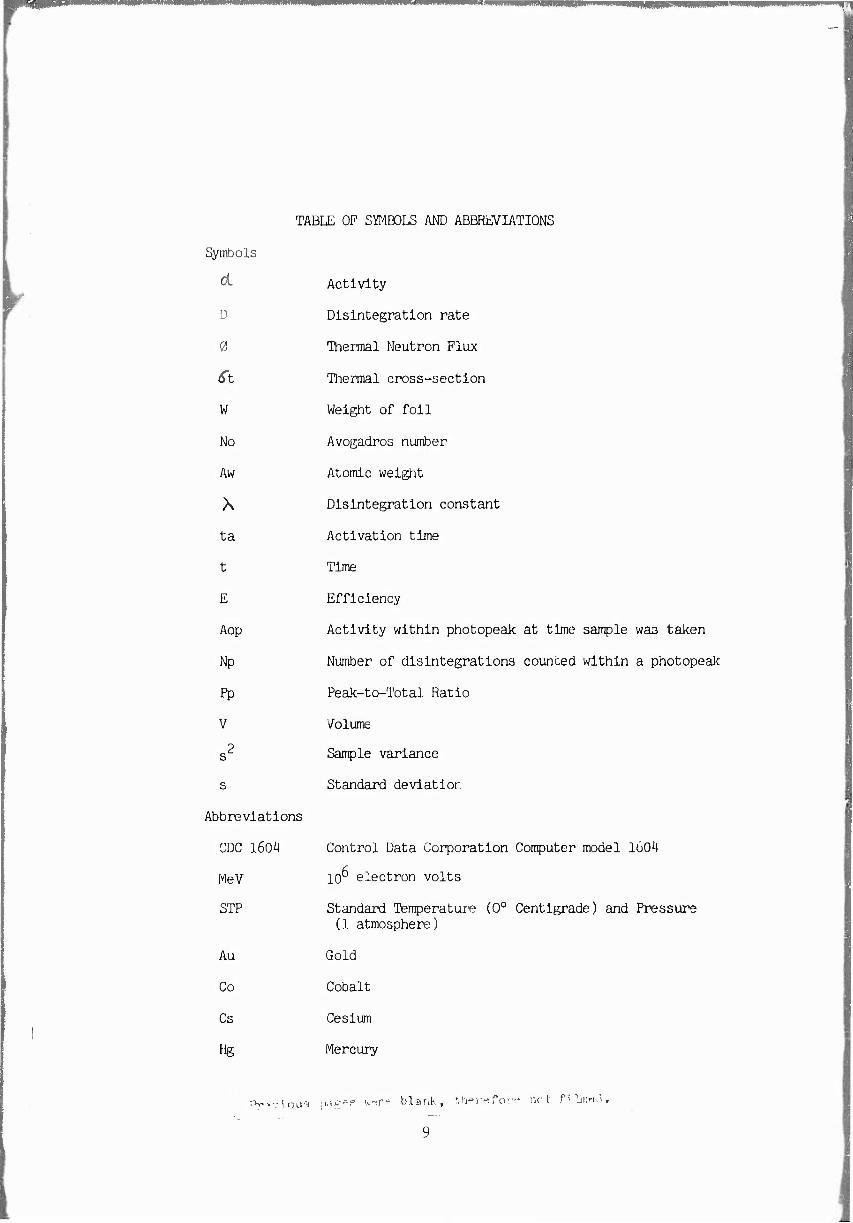
TABLE OF SYI-IBOLS AND ABBREVIATIONS
Symbols
oL Activity
D Disintegration rate
0 Ihermal Neutron Flux
(ft Thermal cross-section
W Weight of foil
No Avogadros number
Aw Atomic weight
X Disintegration constant
ta Activation time
t Time
E Efficiency
Aop Activity within photopeak at time sample wan taken
Np Number of disintegrations counted within a photopeak
Pp Peak-to-Total Ratio
V Volume
s2 Sample variance
s Standard deviation
AD D r^e vi at 1 ons
CDC l60iJ Control Data Corporation Computer model 160^
MeV 10° electron volts
STP Standard Temperature (0° Centigrade) and Pressure (1 atmosphere)
Au Gold
Co Cobalt
Cs Cesium
Hg Mercury
^vn.ouvi t).iP-?e w- blank, Ui-r^fo— net filnirnl,
9

Abtreviations
I Iodine
K Krypton
Xe Xenon
Zn Zinc
10
l. Introduction
Gas is generated in the rods and core of t he AGN--201
reactor at the United States Naval Postgraduate School cluring
operation of the reactor . Arter reactor shut-down, the quantity
of the gas builds up fran the fission products. 'lhe gas increases
the internal pressure in the reactor core and must be removed
periodically so that the gas pressure in the core and rods does
not exceed 5 psig. [ll] 'lh!s is nonnally done when the reactor
has been shut do.m for approximately two days, at which time
the gas still contains radioactive elements. To .lmow what these
elements m1f9'lt be, this study was undertaken to detennine the
identity and concentration or the radioactive elements in the
reactor gas approximately two hours after peak power operations.
Tne study was made by obtaining from the reactor core via t he
gas ma:1ifold , a measurable quantity or gas in a container
suitable f .:->r insertion in a well- type scintillation detector.
The gamna spectr'l.ITl was obtained on a 512 chanre 1 pulse hei ght
analyzer and a qualitative and q·yantltative analysis was made
on t he gcuraua spectrum.
2 . I:quipment
a. Scintillation detector, enclosure, and prea~lifier
A Na L(Tl) crystal, 3" in diarreter by 3" high, vlith <J. .-Jell o.78l"
in ai:meter by 2. O" high was used. The crystal 1vas an integral
part of a Harshaw Type 12SW12-W3 scinti llation de:tector. In
assembly, t.1e cr-ystal was directly attached t o the pllotoml~lti
plier tube and both completely encased i n . 03?. " t hi ck aluminum. [3]
The scintillation detector assembly was :::onnected t o a
ll

cathode-follower type preamplifier. 'lhe signal from the
prearrplifier was fed directly to the internal amplifier of
a 512 channel pulse hei@tlt analyzer. 'lhe scintillation
detector and prearq:>lifier were mounted within a 22" by 22"
by 28" box enclosures of lead brick lined inside by copper
and cadmium plates. A 4" by 6" access port and plug permitted
the exchange of active sample containers.
b. Power SUpplies
'lbe high voltage for the photanultiplier tube was furnished
by a Harmer Model N401 Hi@tl Voltage Power Supply. 'lhe preaJ'Il)
lifier pc:Mer was supplied by a stabilized power supply unit of
a Hanner Model N302 Non-overload Linear A!Jt>lifier. 'Ihe ant>lifier
section of this unit was not used.
c. Multi-Channel Pulse Hei@tlt Analyzer
A Nuclear Data 512 Channel pulse height analyzer ~1odel
ND-180 FMR was used. 'Ibis asselli>ly consisted of an analog-to
digital converter with internal linear amplifier and live
timer, a 512 channel (106 capability per channel) parallel
binary coded decimal memory system, and a read out control.
Associated equipment used with this assembly included ~ '· ·
oscilloscope, Teletype printer, and an X-Y plotter. 'lne
pertinent specifications quoted by the manufacturer in the
instruction manual for this equi~. ~t are as follows: [7]
Stability: 0. 2% l ong term stability.
Live Timer Accuracy: Better than 0.5% at pulse rate up to 5000 cpm.
Integral Linearity: Better than 0. 25% full scal e.
12

Differential Linearity: Better than 2% over top 9ö^ of measurement range.
Figure 1 shows the relationship of the above equipr^ent In
block diagram form.
d. Gas sample bottles
Gas sample bottles were made of aluminum, each with a
volume of about 3-5 ml. The bottles were designed to fit
snugly in the well of the scintillation detector and to confine
the gas within the bottle as deep as possible in the well.
This //as dene, by drilling out form one end a section of
aluminum round to form a deep cup, then fitting an aluminum
plug witain this cup to leave a reservoir for the gas in the
bottom of the cup. A small hole was drilled through the
center of the plug to permit the filling of the reservoir.
The exposed end of the plug was tapped and a valve fitted to
this end. The plug was then bonded to the cup and the entire
assembly made gas tight. The shape and dimensions of the
gas bottles are as indicated in Figure 2 along with the
dimensions of the pdotomultiplier ♦"ube and crystal assembly.
3. Equipment Calibration
a. Gas bottle volume. The volume of each gas bottle
was determined by filling it with distilled water, recording
the weight before and after filling; the difference in weight
in grams being the volume in millimeters. 'The bottles were
filled by connecting them to an assembly of valves and tubing,
evacuating the entire assembly with a vacuum pump, and then
allowing the vacuum to fill the entire assembly with wau-er.
13

1,1 vp
Timor
^^ Si p;rml
Input
Ana Io^
To Digital
Convert or
Address
Sealer
Digital
To Ana 1og
Ccnverter
(•-i on UK, {
Rt.OCK niAGIMM OF SCJNT11.I.ATION DETECTOR fill] and
PULSE HEIGHT ANALYZER
Add
fltih- tractL
Data
Rogi ster
U~nH
Brite
Chnnne1 nuoiber
Q Display
Plotter
-M Ferri te
Corp
Memory
Teletype
Printer
Counts
Digital
To Analog
Converter
Pre.-Amp.
Power
Supply
Crystal and Photomultiplltr
Preamplifier
High-Volt.
Power
Supply

PHOTmH.!L'l'TPLIE!l TlT!l!~ ~ .. i t I,
Nal(T1) CRYSTAL~]
llcscr,·oir' ----Volmn": 1 .;Qo::<;
.!. • N'1 ~1
DT'Ii~!\' <:; F'~' <;: ( i,
C'?Vc.:;'l' \ T.
1\ R
.7Rl ~.ono
...__Valve
2.01 11
0 " t-.- .... - ...
i"('h~c: '
!IJ~r r
r. "" 2 .01() . (~ r:-"
Crystal l"li.?.e - :\11 rH ~ x 3 11 h~t.
15

t I!l~=;ir1c q""l<"t.f'r
~·,; ~1..1
I
Ont~i !9 R~:'lt"t.n S11ielrl
r
I '--
Cor~ 'l':•n fc
~ Atmosphere Sc~plin; Tube
I I I I
I
l)
.;"-Gn.fi'. f>ir>n; fnld --------, I
~ lll"rt:"nr~· i•i;o~nnt~ter I
I
- -~
r.-~1 Ch:'l n h0r ,./
rH tro"'"" Tnnk ·- l....
T., Tltt i. 1 rl i.., r: ·~~h:w ~ t L..-----------~ Ii':-n on Ronf
16

This prc'Cedure inr.ui'ej tnat no aJr uubbleb or- pockctj were left
wilnin tue uotLlea wnen tney wei-o filled wiln water. Tne
.veljyilng waü donu on an analytical balance to - 0.000',) ^ramo
yii'luin,^ a po'öol'ule accuracy in volume of i 0.001 milliters.
Since theri were other uncertainties in determining the volume
by this method, it was estimated that tne volume was accurate
to ± 0.01 milliters.
b. Counting efficiency. Two samples of gold foil, each
weighing auout jo milligrams were weighed to * 0.000'.) grans.
One was irradiated in the reactor within a cadmium cover for
GO minutes at 20 watts. Tne second was irradiated in an
identical position for the same time at the same power level
but without the cadmium cover. Tne activities of tne
activated foils were determined using an aluminum sample
holder identical in size and shape to the gas bottles but
with the plug removable so that the gold foil could be centered
within its reservoir. The activity of the cadmium covered
foil was subtracted from the activity of the bare foil
yielding the activity ( C( ) due to tne activation of the bare
foil oy thermal neutrons.
Prom the relationship D = 0 ^ t w No (i-e ~ ta) -At
K e
the disintegration rate ( D ) of the activated gold (Au-^")
was calculated; where
0 = thermal neutron flux level of reactor at 20 watts [8]
<5t = thermal cross section for Au1 ' ;8.8 bams)
W ■= weight of gold foil in grans
N0 = Avogadroa number (6.023 x 10²³ atoms per mole)
17

A = Atomic weight of gold (197-028 .'xam; per mule)
^ = disintegration constant for Au1^8 (1.7B^8 x 10 ' per min.)
t,, = activatioi time ci
t = time lapse between activation and counting
The efficience ( E ) of tne entire counting assembly was
then determined from the relationship E - ^/ü
c. Channel vs-Knergy relationship for tne muiticnannel
analyzer. Using Cs^T, I^1, Zn65, Co60, ana Au198; a curve
was plotted using the following gamma-ray photopeak enerßle;-:
2.50, 1.33, 1-17, 1.11^, 0.663, 0.51, 0.411, 0.364, 0.080,
0.069, and 0.032; all in ifeV, This was done at periodic
times while counting each gas sample. The Channel vs. energy
curve was found to be linear at energies above approximately
0.3 MeV but slightly non-linear below this energy. In
addition, the energy associated witn a particular channel
varied linearly with the gain setting on the internal amplifier
d. Peal<-to-Total ratio. A Peak-to-Totai ratio curve
paralleling that in Appendix II of lleatn fl] was plotted using
Au-^, Cs1^ and Zn ^ samples countcu in the aluminum sample
holder. To determine the activity in tne photopeak, the
counts in the channels within the photopeak were normalizen
by fitting their natural logarithms to a quadratic by the
method of least squares. The total activity was determined
by surrming the counts in each spectrum up to and including
those channels witnin tne photopeak. The activity in
photopeaks other1 than the major photopeak for each sample
was subtracted from the total. More points on this curve
18

were desired but heither active or ac'r.ivatible inaterials
were available.
'I. Procedure
a. Gas Sampling. Gas samples were drawn from the
reactor gas manifold approximately two hours after peak
power operations. This time delay was chosen to permit the
Duilci up of the gas in the core aid to sample the gas while
its components of half-lives of the order of several hours
or more were stili of sufficient activity to permit, analysis.
The gas sampling was done J..n the following st^ps:
1. A sample bottle was attached to the Auxiliary Gas Sampling
Tube of the manifold.
2. With the valve to the reactor core closed, the bottle,
manifold tubing and GM chamber were evacuated to the atmcspo '■■
using a vacuum pump until a maximum vacuum was noted on the
manometer.
3. Using the vacuum in the GM chamber, new gas was drawn into
the manifold by opening the valve to the reactor core; the
valve on the gas bottle h'-in.- elnr-ed, Tne valve to the
reactor- core was tnen closeu and tne gas in the manifold was
drawn into the GM chamber. This stop was repeated severai
times until certain the gas in t!i :i;inJfold was new gas from
the core ana not old gas I're,,: i.je tuuing connecting the
manifold to the core.
4. The valve to the evacuated gas bottle was then opened and
the new gas in the manifold was permitted to fill the gas
bottle. The pressure of this gas was adjusted, using the
19

vacuum 1n the GM. chanber, to a vacuum of about one or two
centineters of Hg. 'lhe pressure was recorded and the valve
on the gas bottle closed.
5. If more than one sample was to be drawn on the same
day, a second bottle was attached to the manifold and steps
3 and 4 above were repeated.
b. ~taining the Ganma-ray Spectrum. As soon after
drawing a sanple as was possible, usually about one minute,
the bottle was placed in the well of the scintillation detector
and a ten minute live-time count was made at the desired gain
setting. 'lhe multi-channel analyzer pennitted the adjustrrent
of gain so that gamna-rays of energies up to about 3 MeV
could be counted. It was noted in prellminary runs that there
were no sipficant ganma-ray photopeaks of energies above
about 2. 7 fl!eV. It was also noted that after about 24 hours,
there was no significant gamna act! vity above 1. 0 MeV and
that increasing the gain by a factor of two ~!xactly halved
the energy per channel relationship. 'lherefore counting
was done utilizing coarse gain settings of "1" and "2"
while the fine gain setting was held at "10. 0". Count 1ng
at a coarse gain setting of "2" gave better definition to
the several photopeaks of energies below 0.40 MeV while
counting at a coarse gain setting of "1" pennitted the
counting of all significant ganma activity in newly obtained
sanples.
After a count was made, background was removed by
putting the analyzer in the "subtract" mode and again counting
20
for ten minutes live-tlloo, but with no sample in or near
the detector. After background was I'effiOVed, the data ln
the analyzer rooroory was printed out and plotted by hand
or with the X-Y plotter. ('lhe plots included in the
appendixes were made utilizing the COC 1604 cO!Jl)uter.)
After the initial count was made, succeeding ten minute
counts were made at one hour intervc:1ls for about six to
twelve hours, then at about six hour 1ntervalz for 48 hours
and then daily for about two weeks .
c. Detennination of half-lives. 'lhe half-lives of
the conponent sources of each photopeak were determined in
one of two wczys.
1. 'lhe count 1n the channel having the maxinn.un
count for a particular photopeak was noted, its channel
nuni>er and corresponding ganrna-ray energy obtained. A
semi-log plot of counts vs. time was made and graphically
analyzed to dete~ the half-lives of the components.
2. By use of the COC 1604 conputer, the photopeaks
of one sample were normalized and the total count within the
peak detennined. 'lhis total col.D1t was plotted in the same
manner as above. No significant differences were noted in
the results obtained by ~his roore involved procedure than
by the first procedure.
d. Activity detennination. It was noted that the
response of the detector to gamma-rays of a particular energy
produced a ganma spectrwn of a particular shape. '!hat is , in
addition to the photopeak, a particular shape was observr·c:
21

for the f.est of the spectrum representing garrma-rays detected
after undergoing Coopton scattering or back-scattering. A
plot of the channel number of the back-scatter peaks vs
p~otopeak energy was made for active samples having a single
prominent photopeak. 'lhese were Aul98, Zn65, and csl37.
Other prominent points 1n the C~ton distribution were
similarly plotted. All plots resulted in a straight line
relationship except when extrapolated to ver.y low energies.
In addition to the spectra of the elerrents rrentioned above,
the shape of the ~ton distribution between the 1. 33 1'1eV
photopeak and the 2. 50 sum peak of the spectrum from co60
was used to a~nt the plot from the above three sources.
Fran this plot, the shape of the Coopton and backscatter
portions of the spectrum for each photopeak observed in
gas sanple was approximated uy interpolation.
Following the procedure in Heath [ 4] , each photopeak ,
starting with the one from the highest energy gamma-rays,
was nonnallzed by fitting the logarithms of the counts in
each channel in the photopeak to a quadratic polynomial by
the rrethod of least squares. '!he counts within the nonna.lized
photopeak were then sl.Dllled. Using the peak-to-total ratio,
the total counts 1n the spectrum due to the photopeak
being analyzed was detennined (Total count = count in photopeak I
peak-to-total ratio). 'lhe counts 1n the Conpton and back
scatter portion of the spectl'llll were detennined by subtracting
the counts 1n the photopeak from the total counts. Having
the shape and total count for the Coopton and backscatter
22

portion of the spectrun, a particular count was assigned
to each cnannel within that portion of the spectrum. 'lhe
entire spectrum thus detennined for the photopeak being
analYzed was subtracted from the composite spectrum,
channel by charnel. '!he next photopeak was then nonnalized
and similar calculations and approximations made for the
C<Jll>ton and backseat ;er portion of its spectrum.
'!he total activity at STP was determined for each
photopeak and for the entire spectrum utilizing the
relationship
A • Np ·~p --~~~-~~-,r----
E Pp t V where
~ = coW'lt W'lder nonnalized photopeak
E = detector efficiency (0.404 ± 0.003)
PP • peak-to-total ratio
t = duration of count (10.00 ± .05 min)
V = voltune of gas bottle at STP (3.46 ± 0.01 ml)
An estimate of the standard deviation of the activity thus
determined was made utilizing the relationship
5. Results. A total of 13 gas sanples were taken on five
different days, all from one to three hours after peak power
operation (1000 watts). No qualitative difference were
observed in the ganma spectra. No significant quantitative
difference were observed.
a. Qualitative results. 'lhirteen significant photopeaks
23

were observed in the raw spectrum and two more were unmasked
in the removal, by channel for channel subtraction, of the
more prominent photopeaks and their associated Compton and
backscatter spectra. The spectrum obtained on 14 r1arch
and spectra of the saroo sample after four and 14 hours decay
have been include .. ~ for conparison as Appencllx I. The
ITI!asured half-lives of the photopeaks together with the
channel n1.111i:>er of the center channel in each photopeak and
its corresponding energy in MeV are tabulated in Table I.
Also included in this table is the identified source for
each photopeak, detennined on the basis of half-life and
photopeak energy using the tables of E. der r.,ateoslen and
M.Mc Keown[6]. The finding here are in agreement with those
of D. E. Hawkins at Los Alamos who concluded
The radioactive gaoeous effluents released from tne
reactor stack were found to consist of the following
noble gases: Kr85m, Kr87, Kr88, xe133, and xe135.[2]
For each sarrple, the counts in the photopeaks one and
two were observed to increase for approximately 20 hours
after the sample was drawn, and to decrease with a half
life consistent with that tabulated for xel33. The growth
is believed to be due to the decay or the parent isotope
I133 with a half-life of 22.4 hours, as is indicated in
the decay schemes for the parent isotopes tabulated in
Table II. None of the gamma rays associated with the
decay of I 133 could be found in the spectrum and a 20
hour half-life was not observed anywhere except in the
gr'Qtith of photopeaks one and two. Decay curves for each
24

T~I
Photopeak Energies and Half-lives
Center Photopeak Channel Energy Half-life Source
1 6 o.o3o±.oo2 Growth 21±2hrs xel33
2 15 0.081±.oo1 Decay 127±4hrs xe133
3 30 + 0.14~.002 + 4.S.:..2hrs Kr85m
4 39 o.19o±.oo2 3.0±. 3hrs ~5
5 51-48 o.249±.oo2 9.1±.5hrs xe133 6oihrs xe13}n
6 62 o.3oo±.oo5 4.2±.2hrs J<rB5m
1 82 o.4oo±.oo5 1.2±.2hrs Kr87 4.5±.2hrs
8 124 o.61o±.o10 Undetennined xe135
9 170 0.86±.015 2.7±. 15hrs J<rBB
10 238 1.22~.02 2. 7~.2hrs UnknQm
11 270 1.4o±.o2 2. a±o. 2hrs Unknown
12 298 1.5s±.02 2.7o±.15hrs J<rBB
13 359 1.8~.02 2.7~.2hrs UnknQm
14 420 2.2o±.o2 Undetenn1ned J<rBB
15 458 2.4o±.o2 2.9o±.15hrs q3 J\r ·-
25

~ ..
Q•)
vr'"' . ( ~~.??h)
1~-:: ,., ·~-:- . ( 1)'3·., )
~hl~~(A ,1.., ~ 1 ,l ~~('l" ~!. --+ ·, . . v . / ...
l "t. .,, ( ) 'l'r "'·~
- O? •
26

Ti\11L~ Jib
Dccny Schemes of I~cntificd Isotopes [!(~
0. :;:; ~1 <-V
l ' i ' --. 1 .),)( ") )
. ~ f'i. '-.7fl
------'T"'Ir 0. n 1 r.• ~v
-------o C
13~ s
¥-R!';m ( ·~ .1h) I \0.10~ MeV 77%
' 0.1">0
0
fl!-J, '!(.,. . ('!. 8 h
27
( -9 ) . 'i. n~:l n s -----~-o.mnr.tcv
""'"----.---....... ::! • 95i•icV 1:·~ ~
.> )"{,
70 :~ ------~~0. 8!';
------,.+--'1.. 0. 4 05
--~=--..&11:..- 0 ~7
l~b

photopeak except photopeaks 8 and 14 are included as
Appendix II. Data on the dec~ of photopeaks 8 and 14 was
not obtained in that these photopeaks were masked by adj a
cent photopeaks; yet it was concluded that these photopeaks
were due to ganma-r~s fran the dec~ of xel35 and Kr88
respectively.
Photopeaks 1, 2, 3, 4, and 5 were well defined but
the remaining photopeaks were not. In particular, photo
peak 9 at times appeared to be two photopeaks of nearly
the same energy and half-life as can be seen in the spectra
in Appendix I. '!he s~ may be true or photopeak 15.
At times it appeared that an additional photopeak of f
approximately 2. 55 MeV garrmas was masked by photopeak 15 i
and Us decay curve paralleled that or photopeak 15. '!he
sources for photopeaks 10 , ll, ard 13 could not be identified
and it is possible that one or all may be distinctive points
in the Corr;>ton spectrum of photopeak 15, although no similar
distinctive points were observed in the Compton of any of
the known isotopes used as references to determine the
shape of the Compton spectrum. Ihotopeaks 8 and 14 were
at all times masked by adjacent photopeaks.
To obtain more accurate half-lives and more certain
identification of the sources for photopeaks 8 through 15
a "spectrum stripping" procedure to remove the spectrum of
~8 from the raw spectrum would have to be employed
utilizing an active sample of isotopically pure Kr88.
Several of the lesser photopeaks of the isotopes
28
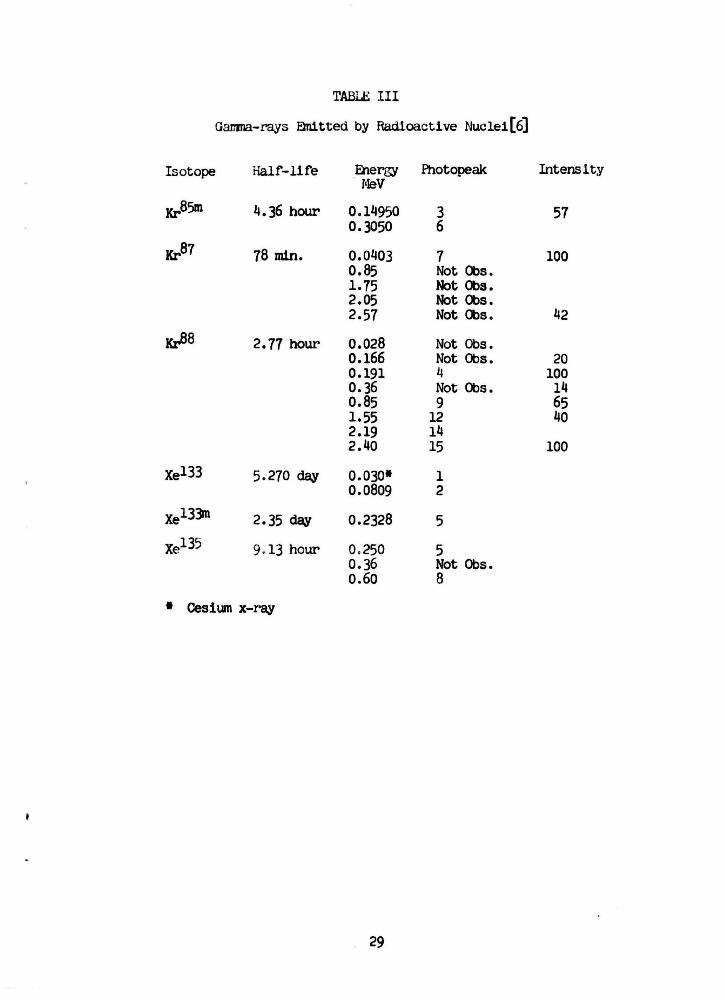
TABLE III
Gamma-rays Emitted by Radioactive Nucle1[6]
Isotope Half-life Energy Photopeak Intensity ~feV
Kr85m 4. 36 hour 0.14950 3 57 0.3050 6
Kr87 78 min. 0.0403 7 100 0.85 Not <l:ls. 1. 75 Not <l:ls. 2.05 Not <l:ls. 2.57 Not <l:ls. 42
~8 2. 77 hour 0.028 Not Obs. 0.166 Not Obs. 20 0.191 4 100 0.36 Not Obs. 14 0.85 9 65 1.55 12 40 2.19 14 2.40 15 100
xe133 5.270 day 0.030* 1 0.0809 2
xel3)n 2.35 day 0.2328 5
xel35 9. 13 hour 0.250 5 0.36 Not Obs. 0.60 8
• Cesium x-ray
29

identified could not be found as is indicated :in Table Ill.
It is assumed that these peaks were masked by the roore
prominent photopeaks.
'lhe spectra assigned to each identified isotope are
compared with the original spectrum in the graphs included
as Appendix III.
b. Quantitative results. 'lhe spectrum was broken
down into 15 photopeaks and the activity associated with
each photopeak calculated. 'lhese results are summarized
in Table rv and Table V A san;>le drawn after a peak power
operation on 14 March 1966 was selected for quantitative
analysis. '!he Energy vs. Channel Number Curve for 14 i>1arch
is included as Appendix rv. Prior reactor operation that
da.y ( 14 March 1966) was as follC7tls :
From 1441 to 1442 at 1000 watts 1512 1513 1000 watts 1538 1539 1000 watts 1558 1559 1000 watts 1637 1658 100 watts
Gas sample taken 1800.
'lhe reactor was not operated on the previous day (13 f'larch)
and the reactor core was reduced to atmospheric pressure prior
to reactor operation on 14 i~h 1966.
As can be seen from 'rable V, the most significant
contribution to the total activity of the reactor gas two
hours after high power operation is from the isotope Kr88,
the activity of which accounts for approximately half the
total act! vi ty. At about two hours after high power
operatioo the activity due to the presence of xel33 is
still increasing and continues to increase for about 20
30

TABLE IV
Activity Associated with each Photopoak
Photo- Peak
1
Energy MeV
0.030
Pealc-to- Total Ratio
• 99
Count in
10 min.
858,700
Activity Micro-
Curies/ml. x 10-3 27.6 ± 4.5
2 0.081 .98 1,188,700 39.1 ± 5.8
3 0.148 .925 813.700 28.4 ± 3.8
4 0.19 .99 634,900 23.2 ± 2.9
5 0 .23&0.25 .81 362,600 14.4 ± 1.7
6 0.30 .75 198,800 8.5 ± 0.9
7 0.40 .65 656,700 32.5 ± 3.2
8 0.61 .505 35,000 2.2 ± 0.2
9 0.86 .375 213,600 18.4 ± 1.5
10 1.22 .295 33,000 3.6 ± 0.3
11 1.4 .265 25,800 3.1 ± 0.2
12 1.55 .245 40,400 5.3 * 0.3
13 1.87 .210 202,400 31.1 ± 1.5
14 2.19 .185 115,100 20.1 ± 0.9
15 2.40 .170 481,900 104.5 ± 4.4
Entire At tim
Spectrum 9 drawn 11,156,157 363 ± 3-4
Pour Hours later 5,692,584 183 ± 1.7
Fourteen Hours later 3,481,355 112 ± 1.1
31

TABIE V
Activity Associated with each Identified Radioactive Isotope
Isotope Photopeaks Activity % Total Activity rnic~curie~ at time s~1e , per ml xlO- was drawn
~5m 3 and 6 36.9 ± 4.7 10.2
Kr87 7 32.5 ± 3.2 9.0
~8 11 , 9 , ].;:> , ± 10 111 and 15 .1.'(2 47.''
xe133 .1 and 2 66.7 ± 10.3 18.4
xe133m 5 0.7 :t 0.2 0.2
:xe135 5 and 8 15.9 ± 1. 7 4.4
Unknams 10, 11, and 37.8 :t 2.0 10.4 13
32

hours at which time It has approx^ i;iloly doubled. 'Ihis
increase combined with the decrt-aae in activity from the
shorter half-life conponents, results in the activity due
to the presence of Xe133 becoming the most significant
activity of any duration.
This was concluded by C. C. Grissom for this reactor
in that
From the absolute counting rate it is determined
that the activity of the gas ranges from 1.7x10 to
1.3xl0~2 micro-curies per cc of gas at approximately
70oP and 70cm of Hg for the gas which ranges in
age from 12 to ^8 hours. Of this amount, the
maximum activity due to the presence of any radio-
active iodine is less than 0.2% of the total activity.
At 48 hours approximately 70% of the activity is due
to the presence of Xe133 and its isomer and approxi-
mately 30% of the activity occurs as a result of
Xe135 being present .[j]
6. Conclusions
An analysis of the gamma spectrum of samples of
reactor gas drawn at approximately two hours after peak
power operation of the reactor resulted in the identification
of the sources of the ganrna activity. The most actively
decaying radioactive isotopes present are Xe-1-33, Xel35)
Kr"5m Kr^, and Kr"°. Based on quantitative calculations
for a sample drawn at two hours after peak power operation, 4-
the total activity is O.363 - 0.004 micro-curies per millillter.

or this total, Kraa contributes 0.172 ±_ .010 micro-curies
per milliliter or about 117% of Lhe tota l activity. xe133
contributes 1067~ ± .010' micro- curies per milliliter or
about 18% of the total activity. Kr85m contributed 0.0369
± .0047 micro-curies per milliliter or about 10.2%. Kr87
contributed 0.0325 ± .0032 micro-curies per milliliter
or about 8.9%. xel35 contributed 0.0159 ± .0017 micro-
curies per milliliter or about 4.4% of the total activity.
In additi~ the sources of significant points in the gamna
spectrum at 1.2, 1.4, and 1.87 Mev could not be identified. ' .
These were treated as photopeaks and their combined activit y
was 0.0378 ± .0020 micro-curies per mi l lil i t er or about
10. 4% of tne total ac~i vi ty.
A roore reliable quantitative analysis and breakdown
of the gamna spectrum can be made utilizing computer tech
niques such as those of Strickfaden and Kloepper·.f)J 'l'hel r
carputer program was not readily adaptable to t he CDC 16011
and was not used in this analysis . 'Ihe general techniques
of their program for approximating the Compton distribution
were utilized but the calculations carried out by hand.
7. Acknowledgements
I would .like to thank the members of the Reactor
Operating Coomittee who assisted in this study; Professors
E. A. Milne, G. W. Rodeback, and _w. W. Hawes and Mr. H. L.
·' McFarland for their timely advice and assistance in setting
up equipment and obtaining radioactive materials. I would
like to thank 1'1\Y advisor for his counseling and assistance
34

throughout the entire study.
I wish to acknowledge the assistance of 11\Y wife, Helen,
who helped in the organization and typing of this report and
who assisted greatly in the tedious plotting and calculating
necessary to break down the ganma spectrum into 1 ts c~ents.
35

BIBLIOORAPHY
1. Grissan, C. C. Analysis of Radioactive Gas Generated by the AGN-201 Reactor at the United States Naval Postgraduate School. 'lhesls. 1965
2. Hankins, D. E. Hadioactivl'~ Gaseous Effluents f'rom a Honx?genous Reactor. Los A:.aroos Scientific Laboratory. Research Report LAMS--2937; TID-4500. Noveniler, 1963.
3. Harshaw Chemical Conpany, Scintillation Phosphors, 2nd ed. 1962.
4. Heath, R. L. Scintillation Specti'Oiletry Gamna.-Ray Spectrum catalogue. Phillips Petroleum Co., Atomic Ehergy Division. July, 1957
5. Johnson, N. R., E. Eichler and G. D. 0' Kelley. Technique of Inorganic Chemistry, v. II. Interscience, 1963.
6. Mateosian, Der E. and M. McKeown. Table of Ganma-Rays Emitted by Radioactive Nuclei. Brookhaven National Laboratory. Associated Universities, Inc. May, 1960.
7. Nuclear Data, Inc. Instruction Manual. Tvtodels ND-180 FM and ND-181 F.M. 1965.
8. Perry, R. E. Absolute Neutron Flux of the AGN-201 Reactor. Thesis P 345. United States Naval Postgraduate School. 1964.
g. Strickfaden, W. B. and R. 1'4. Kloepper. IB'1 704 Programs for Unfolding Conplex Gamna.-Ray Spectra. I..os Alaroos Scientific Laboratory. Research Report LA-2461; TID-11500. 14 March 1961.
10. Strorninger, D. , J. M. Hollander, and G. T. Seaborg. Reviews of Modem Physics. v. 30, no. 2, part II. American Institute of Physics. April, 1958: 652-653; 71D-711.
11. United States Naval Postgraduate School. Operation and Admdnistration of Nuclear Reactor Facility. Postgraduate School Instruction, 9890.1. 31 October 1962.
36

er
z Z] cc h- er o LU LU r- CL CT 0") _J
_J cn CE rr 71 n i—i o O i—i r ÜC 0 r
er. ZI o
i- l r Ix ZI O (X
h- z; o o LU CO ü_ 1—1 <n cc er li l CL T r l- <^ o
V
10 <o
^f 'W -wt "W T08
-t O H ►- >

■I
? T ;j CI h a: K : tu IU h- a. CX CO _J
_J a^ cr cr. 71 i—(
»—i
o r cr o
-H UJ F ^ X ^- 1— '—' h ^ r. LL ID o QC
h- z: O o LU iO a 1—1
CY CO
a: a UJ
L. h- o o
<Ut-*-1>'-,f->- c u ai oj o
L

A c T I V I T Y
cpa
L
§
APPENDIX II
GROWTH: T„ » 21 t a hours
DECAY: T^, = 127 t 4 hour«
"6ir "fer -S5r ■ssr ■fcr TIKTIn" DÖDTÖ
K-XflLE - S0 hours/Inch Y-3CflLE -1 decude/2 Inches
DECAY OF PHOTOPEflKS ONE AND TWO öo030-0n081MEU GflMMRS FROM XE133
•;;

A
C
T I V I T
Y
cpm
X-3CflLE! -2 houra/inch
Y-3CflLE "1 decnde/2 incho«
DECAY OF PHOTOPEflKS THREE Rt[D SIX 0O.15-0O305MEU GflMMPS FROM KRÖSM
TIMR in Hours
^.n—. ; ■ ■■■' •>-■

cpn
APPENDIX II
"to" -tor
PP4; T, i 3.0 t 0.3 houra
PP12: Ttt = 2.70^0.15 hours
"tiF Inr ■frr eee TIME in Hours
^"SCfLE -^ houPH/lnch
Y-3CfL£ -1 decade/a inche«
DECflY OF PHOTOPFflKS 12 AND 4 L55 AMD „19MEU GflNMPS FRON KR88

cpm }
APPENDIX II
IM 9.1*0.S hours
TIME in Hours
X-3CfLE - 50 hours/inch
DeCflY orPHOTOPEflK nur ^.233MEU FROM XE133M a250MEU FROM XE13Ö

cpni
APPENDIX II
Kr85": T., ».t.S t 0.2 houro
Kr : Tj, = 1.2 t 0,2 houra
K-SCa£ -2 houra/inth
Y-3CflLf. -I docnde/2 Inchoa
DECAY OF PHOTOPEflK SEUEM Ö.40f1EU GflMMflS FROM KR87

cpm
APPENDIX II
PP!): I, = ^.70 t 0.15 lui
PPI T: T, L 0. \ 5 hours
630 035 TIME In Hours
«■SCALE - S ImurH/lncli
T-JtHLc "■ i (lpc;iflc/2 inchrs
DECAY OF PHOTOPEflKS 15 flND 9 2.4 AND a8&rEU GAMERS FROM KR88
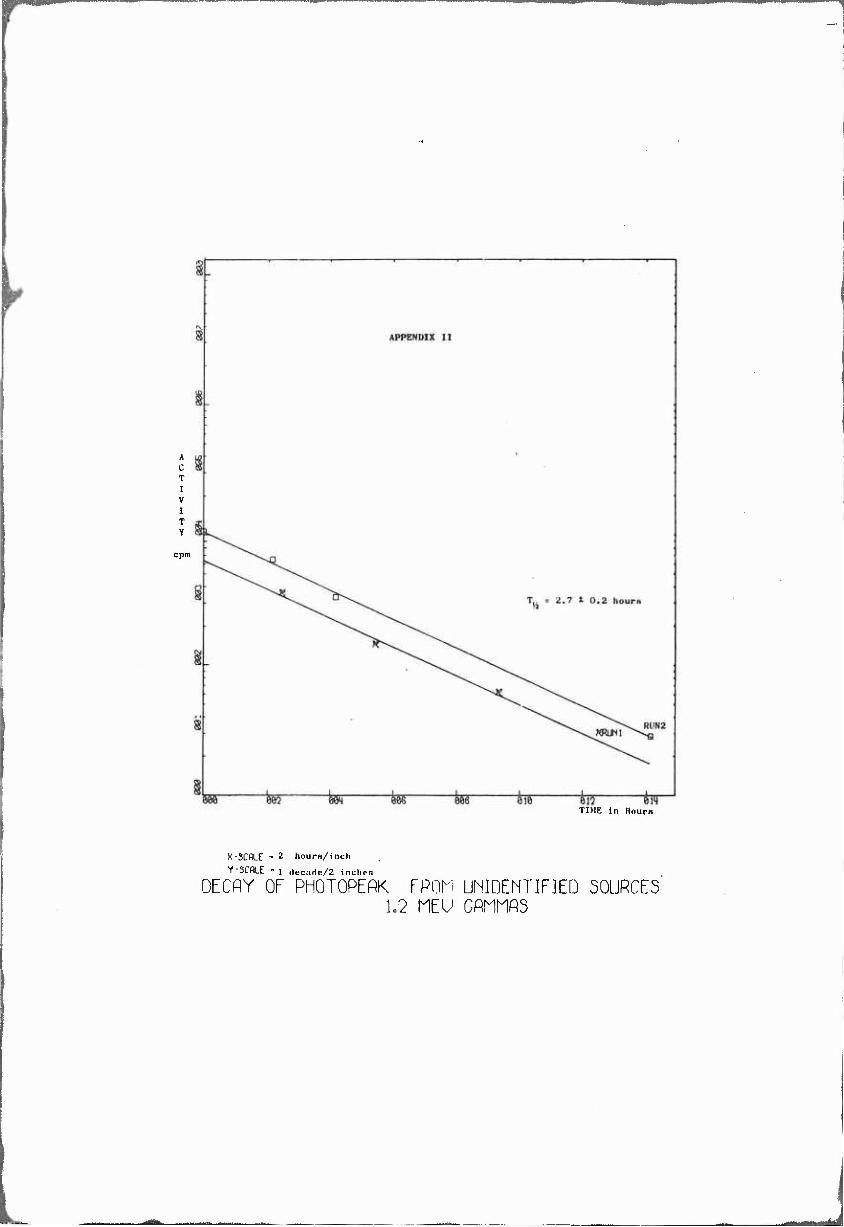
A C T I V I T Y
cpm
TIME In Hours
K-SCALE - 2 hourw/inch Y-SCALE - 1 (lecnrtc/2 inchcH
DECAY OF PHOTOPEflK FPOM UMIDENTIFIED SOURCES L2 MEU Gflnms

I V
I T Y
cpm
810 STT 914 TIMK in Hours
K-3CflLE; - 2 hourx/inch
I'-SCflLf -1 Herii(ip/2 inches
DECAY OF PHOTOPfflKFPDM UNIDENTIFIED SOURCES L4 NEU GflMMflS

A C T i V I T Y
cpm
TIME In Hours
K-3CflL£ " 2 hours/ inch
Y-9CflLE "1 rlccado/2 Indien
DECAY OF PHOTOPEflK FROM UNIDENTIFIED SOURCES . hS/'MEU GflMMflS

i
C r. L ret- c r c c c
L_

tVi->->i~f->- £.
-ft, c- »4 > "— i
.1
-3 " (0
•<Ol-i-i>l-<t-!>- a u
ecu C O O Ci OOP.
L


mmm***
^
<Ut>l-H>^t-l>-
„

mm
ti ;r. r-j cc o >-

UNCLASSIFIED
Scc'jrity Classification > Bsr^rr^^uscK
DOCUMENT CONTROL DATA - RiD (Socvrlty clnoaitlcallon ol title, body ol abstract end tndoninß annotation muat bo ontorod whan tho ovoeall roport la clooottiod)
1. ORIGINATING ACTIUITY fCorporjlo author;
U. S. Naval Postgraduate School 2a. REPORT SCCUniTY C L AODIFIC A TlOtJ
Unclassified 26 SHOUP
3. REPORT TITLE
I Radioactive Gaseous Effluents from the Core of the AGN-201 Reactor at the United States Naval Postgraduate School
«■ DESCRIPTIVE NOTES (Typo ol rmporl luwl Inclualva daloa)
L S. AUTNORCSJ (Luol name. Ural name, initial)
BREDDER'IAN, Rudolf Theodore Andrew Lieutenant Commander, United States Navy
■ 6. REPORT DATE S May 19o6
la. TOTAL NO. Of PACED
54 7b. NO. Of ncco
eleven ( üa. CONTRACT OR GRANT NO.
S b. PROJEC T NO.
9a. ORIOINATOR'O REPORT WUMDanfS;
in. OTHER RRPOnT NOfS> (Any othot humboto Uial may bo aaolCned thla toport)
' 10. A VA IL ABILITY/LIMITATION NOTICES
' Qualified requesters may obtain copies of this report from DDC
13. ABSTRACT
A qualitative and quantitative analysis of the core gas generated by the AGN-201 reactor at the United States Naval Postgraduate Scnool was made by analysis of the spectrum of gamma-rays emitted two hours after peak power operations, The principle radioactive isotopes prvsent, based n7 onftgammarcay photopeak energies and half-lives, were found to be Kr"5m> Kr ', Kr00, Xe-L^, and Xe1-". The total activity (gamma-ray energies ^ 2.7 MeV) was found to be 363 - ^ micro-curies par milliter. The percent of the total activity due to the presence of each isotope identified in the order stated above is 10.2%, 9.02!, 4?.^, lb.6%, and l\.k%. The sources of the remaining 10.W of the total activity were not identified.
Previous o-igee v.^rs blank, therefor** not filnwd.
DD /Ä. 1473 UNCLASSIFIED
57 Security Classification
Security Classificotion u.
KEY V/OROS LINK A
ROLt WT
L!NK D
ROLE WT
LINK C
ROLE WT
Reactor Gas Xenon Garaia Spectrum Krypton Gairirud Spectrum
INSTRUCTIONS
1. ORIGINATING ACTIVITY; Enter the name and address of tho contractor, Bubcontractor, Rrontee, Depariir.cr.t of DL- fcnsc activity or oilier organization (corporate author) issuing the rcpnrt.
2ä. REPORT SECURITY CLASSIFICATION: Enter tl-.e ovei^ MU security claoaificalion of the report. Indicate wnc'.her "Restricted Data" is incUidod. Marking is to bo in accorti- anco with appropriate security regulations.
26. GROUP: Automatic downgrading is specified in DoD Di- rective 5200. 10 and Armed Forces ludu:.trial Manual, Enter the group number. Also, when applicable, show that optional markings have been used for Group 3 and Group 4 as outhor- izotl.
.1. REPORT TITLE: Enter the complete report title in all capUnl Irt'^rs. Titles in all cases should be unclassified. If n rn'aninr.ful title cannot be selected without classifica- lion, show title cln isificaticn in all capitals in parenthesis immediatoly following the title.
•",. DESCRIPTIVE NOTES: If appropriate, enter the type of leport, e.g., interim, progress, summary, annual, or final. Give the inclusive dotes when a specific reporting period ia covered.
5. AUTHOR(S): Enter the name(s) of author(s) as shown on or in the report. Enter lust name, first name, middle initial. U rr.ililary, show rank and branch of service. The nome of the principal author is on absolute minimum requirement«
6. REPORT DATE: Enter the date of the report us day, month, year; or month, year. If more than one dote 'ippeorr, on the report, use date of publication.
7a. TOTAL NUMBER OF PAGES: The total page count should follow normal pagination procedures, i.e., enter the number of pages containing information.
lb. NUMBER OF REFERENCES: Enter the total number o. references cited in the report.
8fl. CONTRACT OR GHANT NUMBER: If appropriate, enter the applicable number c I the contract or grant under which the report was written.
ÖÖ, 8c, & 8d. PROJECT NUMBER: Enter the appropriate mllltory department identification, such as project number, subproject number, system numbers, task number, etc 9a. ORIGINATOR'S REPORT NUMBER(S): Enter the offi- cial report number by which the document will be identified and controlled by the originating activity. This number musi bo unique to this ;cport.
96. OTHER REPORT NUMBER(S): If the report has been assigned any other report numbers (oithar by tha originator or by tho aponsor), also enter thus nuiaber(s).
10. AVAILABILITY/LIMITATION NOTICES: Enter ony lim- itations on further dissemination of the report, other than those
impoaed by aecurily classificotion, using standard stuteme: ta such us:
(1) "Qualified requesters may obtain copies of thi» report from DDC"
(2) "Foreign announcement and disacmlnation of thio report by DDC is not authorized."
(3) "U. S. Govcrnmc.-t agencies may obtain copies of this report directly ,fron) DDC. Other quallflod DDC users shall request through
(4) "U. S. military agencies may obtain coploo of this report directly from DDC. Other qualified users shall request through
(5) "All distribution of thin report is controlled. Qual- ified DDC ui.ers shall request through
If the report has been furnished to fie Office of Technical Services, Department of Commerce, for aale to tho public, indi- cate this fact and enter tho price, if known.
U. SUPPLEMENTARY NOTES: Use for additional explana- tory notes.
12. SPONSORING MILITARY ACTIVITY: Enter tho name of the departmental project office or laboratory sponooring (pay inß (or) the research 'ind development. Include address*
13- ABSTRACT: En;er an abstract giving a brief and factual summary of the docun ent indicative of the report, oven though it may olso apprar el ewhere in the body of tho technical re- port. If ar.ditional sf ice is required, a continuation sheet shall be attached.
It is li:f,hl. dcsii ible that the abstract of claaoified reporto be unclassified. Eac.i paragraph of tho abstract shall end with an indication of the n.ilitary security classification of the in- formation in the paragraph, represented as (TS), (S), (C), or CV).
There is no limitation on the length of tho abstTuct. How- ever, the suggested length is from ISO to 225 words.
14. KEY WORDS: Key words are technically meaningful torms or short phrases that characterize a report and may be usod as index entries for cataloging the report. Key words must bo selected so that no security classification is required. Identi- fiers, such as equipment model designation, trade name, military! project code name, gt'Ographlc location, may be used us key words but will be followed by an indication of technical con- text. Tho assignment of links, rales, and weights la optional.
DD FORM I JAN »4 1473 (BACK) ^.'CLASSIFIED
58 Security Classification
rttito