Embed Size (px)
Citation preview

UNCLASSIFIED
AD NUMBER
LIMITATION CHANGESTO:
FROM:
AUTHORITY
THIS PAGE IS UNCLASSIFIED
AD904766
Approved for public release; distribution isunlimited.
Distribution authorized to U.S. Gov't. agenciesonly; Administrative/Operational Use; OCT 1972.Other requests shall be referred to FederalAviation Administration, SupersonicTransportation Office, Washington, DC 20590.
FAA ltr 26 Apr 1977

I
I / .. · .·· I 'y··~.i'' , r '-._ , { -... ., . . ..,r . t---- \
' ' I \
Report No: ~~SS~j!_j -&o t:)?970
SST Technology Follow-On Program-Phase I
! \
' TITANIUM 3~1-2.5Y Cj{ HYDRAULIC -. ~ TUBING DEVEloPMENT~
10 G~W ~arruff, L~a~derYelden,. W·!·~elson, , · w.~purr• w.\Ou1st
\ .
The Boeing Company Commercial Airplane Group
P .0. Box 3707 Seattle, Washington 98124
FEDERAL AVIATION ADMINISTRATION Supersonic Transport Office
800 Independence Avenue, S. W. Washington, D.C. 20590
J ' . ---
,-, ··, g_- ~ h~ ULl not ; ~;. c!it~ilt:t:,. :oan or r~n,.,....,...:
this n;p;'.ft w:t11out ~rm~asiol ti !Ui.~~ ~<:.'OCY.
- --·--~--~-~-........ '
1S (1Ju. \

Verity K2 Document Display
Private STINET Home | Collections
View Saved Searches | View Shopping Cart | View Orders
Other items on page 1 of your search results: 1
View XML
Citation Format: Full Citation (1F)
Accession Number: AD0904766
Citation Status: Active
Citation Classification: Unclassified
Fields and Groups: 010309 - Civilian Aircraft 110602 - Fabrication Metallurgy 130700 - Hydraulic and Pneumatic Equipment
Corporate Author: BOEING COMMERCIAL AIRPLANE CO SEATTLE WA
Unclassified Title: (U) Titanium 3Al-2.5V CW Hydraulic Tubing Development.
Title Classification: Unclassified
Descriptive Note: Final rept. on Task 2,
Personal Author(s): Harruff, G W vanderVelden, J Nelson, W G Spurr, W Quist, W
Report Date: Oct 1972
Media Count: 150 Page(s)
Cost: $14.60
Contract Number: DOT-FA-SS-71-12
https://dtic-stinet.dtic.mil/stinet/jsp/docre...IC+RELEASE&XPC=&PAG=150+++Page%28s%29&MC=&PE= (1 of 3) [5/7/2008 12:36:56 PM]
Distribution Change Order-refer to Change Authority Field

Verity K2 Document Display
Report Number(s): D6-60260 FAA-SS-72-60
Monitor Acronym: FAA-SS
Monitor Series: 72-60
Report Classification: Unclassified
Supplementary Note: Report on SST Technology Follow-On Program-Phase 1.
Descriptors: (U) *HYDRAULIC EQUIPMENT, TITANIUM ALLOYS, PIPES, JET TRANSPORT AIRCRAFT, COLD WORKING, MECHANICAL PROPERTIES, SURFACE PROPERTIES, MICROSTRUCTURE, BENDING, MANUFACTURING, SURFACE ROUGHNESS, QUALITY CONTROL, FATIGUE(MECHANICS), SUPERSONIC AIRCRAFT, COMMERCIAL AIRCRAFT, SPECIFICATIONS, FLEXIBLE STRUCTURES, STRESS RELIEVING
Identifiers: (U) SST TECHNOLOGY FOLLOW ON PROGRAM, SUPERSONIC TRANSPORTS, TITANIUM ALLOY 3AL 2.5V.
Identifier Classification: Unclassified
Abstract: (U) This report contains the fatigue, metallurgical, and bend test results on titanium alloy 3Al-2.5V cold worked and stress relieved tubing procured during the prototype supersonic transport test program, and the new texture-controlled tubing. The tubing procured for the prototype program was tested with three different inside-diameter finishes developed by Boeing, Grumman Aerospace, and McDonnell-Douglas. The texture-controlled tubing was developed during this program, and its requirements are defined in the new Boeing-proposed specification, which is included in this report. (Author)
Abstract Classification: Unclassified
Distribution Limitation(s): 01 - APPROVED FOR PUBLIC RELEASE
Source Serial: F
Source Code: 390145
Document Location: DTIC AND NTIS
IAC Assigned Accession Number: MCIC-087970
Change Authority: ST-A FAA LTR, 26 APR 77
https://dtic-stinet.dtic.mil/stinet/jsp/docre...IC+RELEASE&XPC=&PAG=150+++Page%28s%29&MC=&PE= (2 of 3) [5/7/2008 12:36:56 PM]
Distribution Change Order-refer to Change Authority Field

Verity K2 Document Display
Privacy & Security Notice | Web Accessibility
https://dtic-stinet.dtic.mil/stinet/jsp/docre...IC+RELEASE&XPC=&PAG=150+++Page%28s%29&MC=&PE= (3 of 3) [5/7/2008 12:36:56 PM]
Distribution Change Order-refer to Change Authority Field

l ;
The contents of this report reflect the views of The Boeing Company, which is responsible for the facts and the accuracy of the data presented herein. The contents do not necessarily reflect the official views or policy of the Department of Transportation. This report does not constitute a standard, specification, or regulation.
'
•
•
•
•
•
•
•
•

)
)
TECHNICAL REPORT STANDARD TITLE PAGE
1. Report No. 2. Government Accession No. 3. Recipient's Catalog No.
F AA-SS-72-60 4. Title and Subtitle SST TECHNOLOGY FOLLOW-ON PROGRAM, PHASE!-
5. Report Date October 1972
Titanium 3Al-2.5V CW Hydraulic Tubing Development 6. Performing Organization Code
7. Authodsl G. W. Harruff, J. vanderVelden, 8. Performing Organization Report No.
W. G. Nelson, W. Spurr, and W. Quist 9. Performing Organization Name and Address
The Boeing Company Commercial Airplane Group P. 0. Box 3707
D6-60260 10. Work Unit No.
11. Contract or Grant No. DOT-FA-SS-71-12 V
1-S=-e~a~t..:..t~le...:..,_W_a_s_h_i_n::::gt_o_n_9_8_1_2_4 ______________ ----113. Type of Report and Period Covered
12. Sponsoring Agency Name and Address Final Report, Task 6 Federal Aviation Administration Supersonic Transport Office 800 Independence Avenue SW Washington, D. C. 20590
15. Supplementary Notes
14. Sponsoring Agency Code
Other documents released: D6-60261, D6-60262, D6-60263 and D6-60264.
"'~ 6. Abstract This report contains the fatigue, metallurgical, and bend test results on titanium alloy 3Al-2.5V cold worked and stress relieved tubing procured during the prototype supersonic transport test program, and the new texture-controlled tubing. The tubing procured for the prototype program was tested with three different inside-diameter finishes developed by Boeing, Grumman Aerospace, and McDonnell-Douglas. The texture-controlled tubing was developed during this program, and its requirements are defined in the new Boeing-proposed specification, which is included in this report.
lJ. !<ey Words l<ahgue Flexure Supersonic Texture
1\
Tubing
19. Security Classif. (of this report)
Unclassified
Form DOT F 1700.7 (8-69)
18. Distribution Statement Approved for U.S. Government only. Distribution of this report outside the U.S. Government must have prior approval of the Supersonic Transport Office.
20. Security Classif. (of this page) 21. No. of Pages 22. Price
Unclassified 160.

)
,
)
,
,
,
)
,
PREFACE
This is one of a series of final reports submitted under Department of Transportation contract DOT-FA-SS-71-12, task 6, dated June 30, 1971. The report was prepared by the Mechanical Systems Staff organization of The Boeing Company, Commercial Airplane Group, Seattle, Washington.
Test and development work was conducted to establish improved criteria for a proposed new specification for the procurement of improved titanium 3Al-2.5V cold worked and stress relieved tubing.
The success of this effort depended largely on the cooperation which was obtained from engineering personnel at various tubing and airframe manufacturers. This assistance is gratefully acknowledged.
iii

)
CONTENTS , Page
1.0 INTRODUCTION
, 2.0 SUMMARY. 3 2.1 General 3 2.2 Selection of Optimum Tubing . 3 2.3 Perform~nce of the New Tubing 4
3.0 PART I-EVALUATION OF VARIOUS TUBING 5 )
3.1 General Approach 5 3.2 Survey of Existing 3Al-2.5V Tubing Specifications . 6 3.3 Surface Condition 7 3.4 Microstructure . 13 3.5 Residual Stress 14
) 3.6 Tubing Texture 15 3.6.1 Metallurgical Considerations 15 3.6.2 R-Ratio and Pole Figure Data 16
3.7 Tube Bending and Flattening Tests . 18 3.8 Rotary Flexure Tests 18
3.8.1 Preparation and Inspection of Test Specimens 18 ) 3.8.2 Stress Application and Flexure Test Geometry 18
3.8.3 Test Procedure and Results . 21
4.0 PART II-EVALUATION OF IMPROVED TUBING 25 4.1 Surface Condition 26 4.2 Microstructure . 27 4.3 Residual Stress 27 4.4 Texture Studies 28 4.5 Tube Bending and Flattening Tests . 29 4.6 Rotary Flexure Tests 29
4.6.1 Preparation and Inspection of Tube Specimens 29 • 4.6.2 Stress Application and Flexure Test Geometry 29 4.6.3 Test Procedure and Results . 29
5.0 DISCUSSION OF TEST RESULTS-PARTS I AND II 33 5.1 Bending and Flattening Tests 33
• 5.1.1 Bend Tests 33 5.1.2 Flattening Tests 34
5.2 Mechanical Properties of Various Ti-3Al-2.5V (CWSR) Tubes . 38 5.3 Characteristic Curves of Deflection versus Cycles and Stress
Versus Cycles for I x .080 Specimens . 40 5.4 Characteristic Curves of Deflection vs Cycles and Stress
) vs Cycles for 3/8 x .020 Specimens . 41
v
)

f
CONTENTS-Continued • Page
600 CONCLUSIONS 0 43
• 700 RECOMMENDATIONS 45
REFERENCES 47
APPENDIX A o 87
' APPENDIX B 0 103
APPENDIX C 0 113
•
•
•
•
vi •

)
FIGURES
No. Page
I Typical 3Al-2.5V CWSR Titanium Tube Surface Condition. 47 2 Surface Condition of the 3Al-2.5V CWSR Titanium Tubing
After Special Finishing 48 , 3 Scanning Electron Micrographs of ID Surface of Tube 4-As-Processed Surface Finish. 49
4 Scanning Electron Micrographs of ID Surface of Tube 6 After Special Finishing 50
5 Photomicrographs Showing Sections and Surface of Typical and Specially Finished Titanium Tubing, 3/8 Size, Tubes I, 2, and 3 (500X) 51
6 Photomicrograph Showing Sections and Surface to Typical and Specially Finished Titanium Tubing, 3/8 Size, Tubes 4, 5, and 6 (500X) 52
7 Crystallographic Texture in Titanium Tubes 53 8 Method for Measuring Strain Ratio "R" . 54 9 Basal Plane Pole Figure for I X .080 in. RMI Tube (Tube I Per Table 4) 55
10 Basal Plane Pole Figure for 3/8 X .020 in. Zirtech Tube (Tube 4 Per Table 4) 56
I I Basal Plane Pole for 3/8 X .020 in. Superior Tube (Tube 7 Per Table 4). 57 12 Basal Plane Pole Figure for 5/8 X .040 in. Superior Tube
(Tube 8 Per Table 4) 58 13 Basal Plane Pole Figure for 3/8 X .030 in. Zirtech Tube
(Tube 8 (B) Per Table 2) . 59 14 Basal Plane Pole Figure for 5/8 X .021 in. Zirtech Tube
(Tube E Per Table 4) 60 15 Basal Plane Pole Figure for 5/8 X .050 in. Zirtech Tube
(Tube F Per Table 4) 61 16 Basal Plane Pole Figure for I X .033 in. RMI Tube (TubeD Per Table 4) 62 17 Basal Plane Pole Figure for I X .033 in. RMI Tube (Tube G Per Table 4) 63 18 Basal Plane Pole Figure for I X .033 in. RMI Tube (Tube H Per Table 4) 64 19 Dimensions for 3/8 in. Bent Tube Specimen 65 20 Dimensions for I in. Bent Tube Specimen 66 21 1 in. Bent Tube Flexure Test Setup . 67
' 22 3/8 in. Bent Tube Flexure Test Setup . 68 23 Typical Longitudinal Cracks Which Originated on ID of
3/8 X .020 in. Tubing With Three Different Finishes 69 24 Typical Transverse Cracks Which Originated on OD of I X .080 in. Tubing 70 25 OD Surface Finish Showing Sanding Marks (20X) 71 26 Comparison of OD Finishes on Bishop 1.0 X .080 Tubing (20X) 73
• 27 Photomicrographs of 3/8, 5/8, and 1 in. Size XBMS 7-234A Tubing 74 28 Basal Plane Pole Figure for 3/8 X .020 in. Superior Tube
(Tube I Per Table 7) 76 29 Basal Plane Pole Figure for 3/8 X .030 in. Superior Tube
(Tube 2 Per Table 7) 77
) 30 Basal Plane Pole Figure for 5/8 X .020 in. Superior Tube
(Tube 3 Per Table 7) 78
vii

f
FIGURES (Concluded) • No. Page
31 Basal Plane Pole Figure for 5/8 X .050 in. Superior Tube (Tube 4 Per Table 7) 79
32 Basal Plane Pole Figure for I X .033 in. Bishop Tube • (Tube 5 Per Table 7) 80 33 Basal Plane Pole Figure for I X .080 in. Bishop Tube
(Tube 6 Per Table 7) 81 34 Flexure Fatigue Comparison for I X .080 in. Tubing,
Deflection VS Cycles to Failure 82 35 Flexure Fatigue Comparison for 1 X .080 in. Tubing, f
Longitudinal Stress VS Cycles to Failure . 83 36 Flexure Fatigue Comparison for 3/8 X .020 in. Tubing
Deflection VS Cycles to Failure 84 37 Flexure Fatigue Comparison for 3/8 X .020 in. Tubing
Circumferential Stress VS Cycles to Failure. 85 • TABLES
• No. Page
I Comparison of Titanium 3Al-2.5V Tube Specifications 8 2 Tubing Tested for Part I 12 3 Surface Roughness of Tubes 13 • 4 Residual Stress in Tubes 14 5 Strain Ratio of Various Tubes Tested in Part I 17 6 Flexure Test Results for Bent Tubes, Part I . 19 7 Ti-3Al-2.5V CWSR Tubes Procured for Part II per BMS 7-234A . 25 8 Surface Roughness Values of Ti-3Al-2.5V CWSR Tubing 26 • 9 Residual Stress Measurements for Ti-3Al-2.5V CWSR Tubing . 27
10. Crystallographic Texture Measurements for Ti-3Al-2.5V CWSR Tubing 28 I 1 Flexure Test Results for Bent Tubes, Part II 31 12 Bend Criteria for Three-Dimensional I 20° Bends 33 13 Bend Test Results 35 14 Flattening Test Results 37 • 15 Mechanical Properties of Various Ti-3Al-2.5V (CWSR) Tubes
at RT and 450° F 39
•
viii •
)
)
)
,
,
,
)
)
1.0 INTRODUCTION
Late in 1969, titanium alloy 3Al-2.5V cold worked and stress relieved tubing (Ti-3Al-2.5V CWSR) was selected for use in the hydraulic systems of the two SST prototype aircraft which at that time were nearing production. In l-l/2 years of work with this new tubing, considerable progress was made in optimizing tube performance and specification controls to ensure reliable performance on the prototype aircraft. It was realized, however, that a number of questions and problems required solution before the tubing could be used for production aircraft. At the time of cancellation of the SST program the following items were in work or recognized as requiring work:
• Tube hollows-Variations in the surface finish, heat treat condition, and microstructure of the starting stock contributed to variations in the final product. Controls and inspection requirements for the starting stock had to be developed and specified to ensure consistency and predictable performance of tubing.
• Tubing texture-It was suspected that differences in the amount of tube hollow diameter and wall reduction had a great effect on the properties of the tubing. Controlling tube material properties by longitudinal tensile and yield strength alone was believed to be inadequate. At the time there was no technique established to evaluate and control differences in titanium tubing texture.
• Ultrasonic inspection-Hydraulic impulse and flexure test failures of SST prototype tubing indicated the presence of defects which had passed unnoticed through various inspection procedures at both the tubing manufacturer and at Boeing. The defects were suspected to be closed cracks which would not give an echo in ultrasonic testing, or cracks oriented at inappropriate angles to the inspection probes, thereby giving a small echo.
• Finish requirements-Boeing specified chemical milling of the tubing outside diameter (OD) surface to eliminate defects which previously had caused test failures. At the time of the SST cancellation, fatigue cracking had also been noted to originate on the tubing inside diameter (ID) surface, thereby requiring consideration of new finish requirements for the ID as well as for the OD surface.
In view of other work with Ti-3Al-2.5V CWSR tubing which had started at Grumman and McDonnell-Douglas for the F-14 and F-15 aircraft, the following additional items were of interest:
• Different finish requirements-The Lockheed, Boeing, Grumman, McDonnellDouglas, and North American tubing finish requirements all differ. All have been demonstrated to qualify for hydraulic system use, but no attempt had been made to compare the differences by appropriate tests and to develop a common standard.
• Tubing test and qualification-No commonly agreed upon criteria existed for the evaluation and qualification of hydraulic tubing such as those for hydraulic fittings and hose. New tubing such as 21 Cr-6Ni-9Mn CRES and Ti-6Al-4 V or Ti-3Al-2.5V were normally being tested with a fitting joint.
1

2
During DOT-FA-SS-71-12 task 6 (ref. 1) the following was accomplished:
• Industry and military coordination
• Reporting of SST tubing development up to the time of program cancellation
• Comparison of the SST and other Ti-3Al-2.5V tubing as used by various airframe manufacturers
• Evaluation of tubing with a controlled crystallographic texture
• Improvement of ultrasonic inspection methods
• Draft of a new specification with proposed new or improved criteria for callout by the military or industry.
Work for this program extended over a 9-month period and was divided into two parts. The work under Part I consisted of a review of tubing specifications from other airframe manufacturers, evaluation of four types of tubing, and selection of the one type found to be optimum in fatigue testing. Following this selection, specification criteria were drafted and tubing ordered for work under Part II. This work extended over a 6-month period. Part II consisted of further evaluation of the tubing and specification criteria. In addition, this tubing was used in qualification testing with welded and separable fittings (refs. 2, 3, 4). Part II work was also intended to demonstrate that tube manufacturers understood and complied with the new requirements, and that the new tubing performed satisfactorily in hydraulic performance testing.
•
•
f
•
•
•
•
•
•

}
•
)
)
)
'
)
2.0 SUMMARY
The following work has been accomplished during this program.
"f.\; 2.1 GENERAL ·~\
\>} 'Existing specifications for Ti-3Al-2.5V cold worked and stress relieved tubing (CWSR) have been compiled and the approach to this program discussed and coordinated with the airframe and tubing manufacturers concerned. Progress and findings have been made know at industry meetings and have been useful to current programs such as F-14, F-15, and B-1, as well as Air Force contracts pertaining to titanium hydraulic fittings and tubing.:_]
2.2 SELECTION OF OPTIMUM TUBING
f;our types of tubing currently in use or being considered for use have been evaluated by fatigue testing ( 120° bend specimens) and by other performance tests.
Various types of Ti-3Al-2.5V CWSR tubing, tube hollows, and semi-finished tubes were evaluated metallurgically to qevelop a better understanding of the metallurigical factors governing tube performanc~he materials were characterized for microstructure, crystallographic texture, surface condition, failure mode, and defect type. Microstructures were evaluated for grain size and morphology. Texture was evaluated by a computerized X-ray pole figure technique, color metallography, and strain ratio (R) measurements. Good correlation between the various techniques was observed. Scanning electron microscopy and macro examination were utilized in characterizing surface condition.
\rntrasonic inspection was improved by developing new standards to detect rejectable defects which are neither longitudinal nor transverse.
Fatigue testing of 120° bend specimens was found to be an excellent method to evaluate and compare the fatigue performance of various tubing types, and to duplicate typical failure modes as are being observed during service of hydraulic tubing.
Residual stresses in the tube such as may be induced by straightening have been limited to a maximum of 15 ksi. A test procedure is specified for this inspection.J \--\{X"~;;)
The inside and outside finish requirement for the tubing was evaluated and altered to specify 32 RHR as a minimum. In addition the visual appearance was defined as a control of the surface finish. This finish requirement will necessitate the use of ultrasonically agitated internal drawing dies or similar advanced tube fabrication methods. Grit blasting and chemical milling are required for finishing the ID surface and chemical milling for the OD surface.
Criteria for tube hollows were defined on the basis of a survey of tubing and tube hollow manufacturers. These new specification requirements will eliminate unnecessary variations in hollow characteristics such that optimum tube fabrication practices can be standardized.
3

4
Quality assurance was provided by the introduction of ultrasonic, penetrant, and visual inspection requirements for the hollows. In addition, permissible defect levels, strength, and microstructural requirements have been defined.
A requirement for drawing of the tubing was specified, since this was observed to improve the tubing surface and open defects which otherwise can go undetected during ultrasonic inspection.
Qualification requirements have been specified for future evaluation and approval of tubing for hydraulic use, in the event that new tube fabrication methods are introduced which deviate from those presently specified.
2.3 PERFORMANCE OF THE NEW TUBING
Two tubing manufacturers, Bishop and Superior Tube Companies, fabricated tubing to the proposed new specification, with the exceptions noted in section 4.0.
Hydraulic impulse testing (80% at 450 F) indicated the superiority of the new tubing. Of 114 specimens made with tubing as originally purchased for SST use, 29 failed. Of 36 specimens made from tubing purchased to the new specification requirements, none failed during 200,000 cycles of impulse testing. The impulse testing is reported in references 2 and 3.
t
•
•
f
•
•
•
•
•

)
,
,
,
)
t
,
)
3.0 PART I-EVALUATION OF VARIOUS TUBING
3.1 GENERAL APPROACH
This program was intended to complete work for the SST prototype hydraulic tubing specification for Ti-3Al-2.5V cold worked and stress relieved (CWSR) titanium tubing. In addition, various tubing finishes and processing techniques were to be reviewed and evaluated to develop data for the selection of one standard tubing. Such standardization was regarded to be of mutual interest to manufacturers and users for reasons of cost and interchangeability. This work was programmed to fit with other tasks defined in the DOT/SST follow-on contract (ref. I). The various tasks were combined into an efficient and economical overall test plan. The tubing work was divided into two parts.
Part I consisted of the following tasks:
•
•
•
The industry was surveyed and active tubing specifications obtained. Existing differences were discussed to identify them as major or minor. Candidate materials or processes were chosen for testing.
Four candidates were tested. Three of them differed only in the surface finishes: (I) as specified by Boeing for SST prototype use, (2) as intended by Grumman for the F-14, and (3) as specified by McDonnell-Douglas for the F-15. The tubing required for these tests was drawn from the SST tubing store. The tubing had been fabricated (rocker formed) by Zirtech (Zirconium Technology Corporation) to XBMS 7-234 and to the wall thicknesses specified by Boeing for 4150-psi hydraulic system use. Zirtech also reprocessed this SST tubing for use in this program to the grit blasting and chemical milling requirements of the Grumman specifications and the chemical milling requirements of the McDonnell-Douglas specifications. The fourth (4) candidate material was fabricated by Superior Tube Company as an example of tubing with an improved crystallographic texture.
The fatigue tests of 120° tube bends were conducted in sizes 3/8 x .020 and I x .080 in. Specimens for the crystallographic-texture-controlled tubing could be made available only in the 3/8 x .020 size. More time than the available 3 months would have been required to fabricate and test different sizes and other textures.
• The four candidate materials were evaluated by metallurgical, formability, and fatigue testing. Special emphasis was placed on finding and evaluating various control methods for later inclusion in the specification.
• On the basis of the above-described work, a new specification was drafted and discussed with the tubing manufacturers involved.
Part II consisted of the following tasks, described in detail in section 4.
• Tubing was procured to the new specification and used in the fitting test program described in references 2, 3, and 4. Metallurgical, formability, and fatigue tests were
5

6
•
conducted to further evaluate and confirm the work done under part I, and to finalize the specification criteria.
Fatigue tests of bend specimens were conducted in the pressure and return line sizes for 3/8- and l-in. tubing. The tubing was used also in the qualification testing of fittings with tubing sizes and walls as indicated above, and 5/8 x .050 and 5/8 x .021 to investigate the tube performance for a 4150-psi Type III (-65°to 450° F) hydraulic system.
3.2 SURVEY OF EXISTING 3AL-2.5V TUBING SPECIFICATIONS
At the outset of this program the tubing and airframe manufacturers concerned were contacted and their cooperation invited. The response indicated a strong interest in the success of the program. The following company specifications and information were obtained:
• Lockheed, Georgia-STM08, Tubing, Titanium Hydraulic, Ti-3Al-2.5V, Rev. B, dated 11-18-68
This tubing is used in a portion of the high-pressure hydraulic system of several C-5 aircraft. It is cold worked and stress relieved, and used with flareless fittings having a swaged-on sleeve.
• Boeing-XBMS 7-234, Titanium 3Al-2.5V Seamless Tubing for Hydraulic Systems, Cold Worked and Stress Relieved, dated 10-7-70
As the finish requirement, chemical milling of the OD surface was specified. In addition, various polishing or grinding processes were recognized as type I, II, III, and IV prior to chemical milling. Type I was selected as the optimum performer based on fatigue testing. The specification also included a requirement to limit residual stresses caused by straightening.
At the time of the SST cancellation, test data indicated that chemical milling of the ID surface would be required, as well as a revision of ultrasonic inspection to control defects with an orientation neither longitudinal nor transverse.
• Grumman-GM 3107 Titanium 3Al-2.5V Tubing Seamless, Cold Worked and Stress Relieved, dated 94-70
Nearly identical specifications existed at Boeing and Grumman: Boeing BMS 7-203 and Grumman GM 3107. These two specifications were changed in 1970 to delete the shot peening requirement in an attempt to permit easier detection of defects in ultrasonic inspection. Deletion of peening of the outside and concern regarding the inside diameter necessitated later on the introduction of grit blasting and chemical milling as finish for the tubing.
This tubing was intended for use on the F-14. At the time of the survey, Grumman changed the F-14 hydraulic tubing to annealed in lieu of cold worked Ti-3Al-2.5V tubing. With that change, Grumman specified a new grit blasting plus chemical milling finish for the annealed tubing which was not shown in the specification for cold worked tubing. Grumman
•
•
•
f
•
•
•
•
•
•

)
,
,
)
)
staff personnel recommended that for the DOT /SST follow-on program their new grit blast plus chemically milled finish be tried for cold worked tubing. This recommendation was accepted.
• McDonnell-Douglas-MMS 1205, Titanium Seamless Tubing, Cold Worked and Stress Relieved, 3Al-2.5V, Aircraft Hydraulic System Preliminary Revision B, dated 9-8-71
Chemical milling of the inside and outside surfaces was specified for the surface finish of this tubing. Of special interest to the program was the prestressing treatment specified by McDonnell-Douglas after fittings are attached.
• North American STO 170 LB 0017-Titanium 3Al-2.5V Cold Worked and Stress Relieved Tubing, dated I 0-12-70
This specification was drafted for B-1 use. As surface finish, a 32 RHR roughness limit is specified without specific processing requirements such as for chemical milling. This specification also contains a requirement for penetrant inspection.
Detailed differences between these specifications are listed in table I.
The tubing evaluated in part I of this program is listed in table 2. The I x .080 and 3/8 x .020 in. sizes (numbered tube I through tube 6) were procured during the SST prototype test program and tested with three different ID finish processes. The first was in accordance with the Boeing Materials Specification, XBMS 7-234, Type I (ref. 5) used for the SST prototype. This surface finish is essentially as-processed, and only flash pickled, with no grit blasting or chemical milling specified. The second ID finish is that specified by McDonnell-Douglas, chemical milling (0.0005-in. surface removal) followed by pressurization to four times the working pressure for 30 seconds. The final ID treatment was that specified by Grumman Aerospace Corporation-a grit blast (0.0005 in. surface removal) followed by a 0.0005-in. chemical milling operation. The 3/8 x .020 size tubing (tubes 7 and 8) procured during the DOT/SST Technology Follow-On test program was made by Superior Tube Company per the specification XBMS 7-234, Type I, except that an attempt was made to optimize the crystallographic texture. Also, the ID was grit blasted and pickled. Prior to this finishing treatment the tubing had been drawn using an ultrasonically agitated mandrel die.
3.3 SURF ACE CONDITION
The surface roughness on the OD and ID surfaces of tubes I through 6 was determined using a profilometer. The results are shown in table 3. These surface measurements indicate that the ID surface roughness is not improved by chemical milling alone; it is improved by grit blasting and subsequent chemical milling. The surface condition of the various tubes was studied further using the wide-field microscope and macrophotography. The 3/8 x .020-in. Zirtech tube OD surfaces displayed a severely pickled, rough appearance, as shown in figure Ia. The 3/8 x .020-in. Superior tubes displayed a much smoother OD surface than did the Zirtech tubes but did show residual sanding marks (see fig. I b). The ID surface of the asreceived SST tubing (tube 4, Zirtech) displayed a very rough and rutted appearance. The
7

00
Company
Specif.cat•on no
Tested for or used on
Phystcal properties Long1tud•nal
Ftu
F ty at 2c;~ offset
Elongation 1n 2 ln. (%) m.n
Bending
F 1attemng
Circumferential Flaring
Residual hoop stress
Surface finish and defect
Dimens1onal tolerances Straightness
Wall th1ckness
D1ameter
Ovalrty
• •
TABLE 1.-COMPAR/SON OF TITANIUM 3AI-2.5V TUBE SPEC/FICA T/ONS A. Ti·3AI-2.5V Cold Worked and Stress Relieved
Boe1ng Grumman McDonneil Oouglds
XBMS 7 234, dated 10-7-70 GMPS 3107, dated 94 70 MMS1205 (rev 8-prf:'llm), dated9871 ---
SST F 14 P"or to 9 15 70 F 15
125,000 psr mrn 125,000 psr m111 I For tuh•r1g clas".>:flcatJon see F\ji CWSR 70 85,000 mrn. 105,00 max CWSR 95-100,000 mrn, 120.000 max CWSR 105- 125,000 mr 11. 145.000 max
105,000 pSI mnt 105,000 pSI mrn Tub1ng cldssrhed d'> follow') CWSR 70 70,000 psr mrn yreld CWSR 95-95,000 PSI mrn yreld CWSR 105- 105,000 psr mrn yreld
10% 10~, CWSR 70- 15 0\, CWSR 95- 13 O'·o CWSR 105-10 O'c
3 X 00 5 X 00 3 x ob 14xnomWT - [}::::>
ASTM B 338, 1.2 x 00 MS 33584 MS 33584
15,000 psr max - -
10 RHR 63, 00 RHR 32 10 RHR 63, 00 RHR 32 10 RHR 63. OORHR32 Type I Cnem mill 0.002 rn from OD surface, When specif1ed by purchase order shot peent'd After f1nal reduct1on. tubmg shdll be
no abras•ves per specrfrcat1on GSS 5310 p1ckled to remove a m1n1mum of 0 002 1n. Type II Cork belt polish and then chem froiT' OD surface and d m1n1mum ot 0 001
moll 0 002 111. from OD surface, no mch from I D abr as1ves. Nom.WT Max defect depth
Type Ill Sand with 400 or finer gr1t and l1n I (,n_) See {]::::> for surface cond,t10n1ng pr 10r
then chem mill 0 002 1n. from 00 sur Up to .030 0 002 to p1ckl1ng face 031 to 040 0 0025
Depth of defects shall be 1n conformance with 041 to 050 0 003 Tub1ng shall meet the fo!low,ng ultrason1c class A-2 and B-3 standards per 8AC 5439-2 .051 to 066 0.004 mspect10:1 defect l1m1~s Class A-2 I depth .002 1n by .060 1n. long) for .067 to 086 0 006 Nom.WT Max defect s1ze, ('.r) WT.,;;; .046. All tub1ng sha\( b~ 100°-~ eddy-current (1r1.) Depth ~ Class B-3 I depth 003 on by 125 on. long( for Inspected or ultrason1cally 1nspected A 045 dnd smaller 0 002 0.060 WT >.046 reference notch 1 '8 ,n_ iong t1mes appl1 046 thru 060 0.002 0 125
cable defect depth 'hall tle used 061 thru 080 0 003 0 125 081 thru 100 0.004 0.125 Ultra<>OrLIC 1nspect,on per MCAI R P.S.21211 Class AA
0.025 on./ft and not more than 0.125 1n any 0.025 rn./ft and not more than 0.125 rn. m dny 0 090 Ill max1mum many 3ft length 5-ft length 5-lt length
± 7 1/2% ±10%- ±1 QOi_:
Nom OD l1n.) Tolerance l1n.l 00 loll,) Tolerance (Ill) 00 l1n I Tolerance (in.)
0. 188 to 0.499 +0 004-0.000 0.188 to O.SOO rncl +0 004. 0 000 Up to 3/32 +0 002-0 000 0.500 to 0.999 +0.005-0.000 0.501 to 1.500 rncl +0 005- 0.000 3/32 to 2 1 ;2 +0 003 0.000 1 .000 to 1 499 +0.007 -0.000 1 501 to 2.499 rncl. •0 006-0 000 1.500 to 2 000 +0.01 0-0 000
Si='me as noted for t.llameter tolerances
i
Same as noted for did meter tolerancer., Same as noted for d1dmete1 role1ances
lrsted above l1sted above lrsted above
• • • - • -
2,
•

.. • -
TABLE 1.-Continued A. Ti-3AI-2.5V Cold Worked and Stress Relieved-Continued
Company North American Lockheed Georgia Proposed Aerospace Material Specification
Specification no. STO 170 LB 0017, dated 1 0-12· 70 STMOB-303. dated 11-18-68 (rev. B) AMS 4944, coordination copy, dated January 71
Tested for or used on 8-1 C-5 -
Physical propert1es Longitudinal
125,000 psi min Ftu 125.000 psi min 1/4 and 3/B tubes, 120,000 psi min Tube sizes over 3/B, 125,000 psi min
F ty at 2% offoet 105,000 psi min 1/4 and 3/B tubes, 90,000 psi min 105,000 psi max Tube sizes over 3/B. 95,000 psi m1n
Elongation in 10% 10% 10% 2 in.(%) mm
Bending 5x 00 5 X 00 -
Flattening 12 x nomWT 12 x nom WT -Circumferential
Flarong - - 1.2 X 00
Residual - - -hoop stress
Surface fin ISh and defects RHR 32 max as defined by ASA-846.1 [9 Shot peened with cast steel shot per External and internal surface imperfections Light belt polish•ng permitted prov•ded MIL-S-131658 such as handling marks, straightening 0.003 in. is removed after polishing by Surface finish prior to peening: marks, light mandrel and die marks. chem•cal etching. 10 RHR 63 shallow pits, seams, scores, and scale
00 RHR 32 pattern will not be considered injurious Prior to uttrasonic all tubing penetrant Sand blasting or vapor honing may be used provided they are within following mspected to MIL-1·6866 type I, m<!'thod A. on 10 allowances:
Surface finish: 10 63 RHR, 00 32 RHR Defects on either inside or outstde surfaces For maximum depth of discontinuities WT (in.) Max defect def:!th (in.) exceeding 5% of WT m depth or 0.002 in., -e> Up~ncl. 0.002 whichever IS greater, and 5/64 in. in length, .031 to .040 incl. 0.0025 as determined by ultrasonic inspection, .041 to .050 incl. 0.003 shall be rejected. .051 to .066 incl. 0.004
.067 to .086 incl. 0.006 Method of test shall be as agreed between purchaser and vendor
Dimensional tolerances Straightness 0.075 in. max in any 3-ft length 0.090 in. max in 3ft -
Wall thickness ±10% 1/4 00 through 5/B 00. ±10% ±10% 3/4 00, 1 00 & 1 1/4 00. ±.003
Diameter Nom 00 (ln.) Tolerance (in.) Nom 00 (in.) Tolerance (m.) Nom 00 (in I Tolerance (in.) o.25o thru o.75o +0.003 -0.000 0.188 to 0.500 +0.004 -0.000 0.188 to 0.500 +0.004 -0.004 0. 751 thru 1.250 -+0.003 -0.001 0.501 to 1.500 +0 005-0.000 0.500 to 1 .000 +0.005 -0.005 0.251 thru 1.500 +0.004 -0.001 1.501 to 2.500 +0.006 -0.000 1 .000 to 1. 500 +0.007 -0.007
Ovality Same as noted for diameter tolerance Same as noted for diameter tolerances -listed above. I is ted above.

0
•
Company Boeing
Specification no. BMS 7-2038, dated 11-10-70
Tested for or used on SST and 747
Physical properties Longitudinal
Ftu 90,000 pti min
F ty at 2% offset 74,000 psi min
Elong.ttion in 15% min 2 in.(%)
Bending 2 X OD
Flattening -Flaring -Residual -hoop stress
Surhce finish and defects ID AHA 63, OD RHA 32 Grinding of surface is not acceptable. Sanding, buffing, or poli~ing with a soft backing is acceptlble. A minimum of 0.002 in. shall be removed by chemical milling from OD surface alter sanding, poli~ing, and buffing.
Nom WT (in.) Max defect depth (in.)
Upto.060 Mn) .061 to .080 0.003 .081 to .100 0.004 [!::> .101to.120 0.005 .121 and over 0.006
Dimensionel tolerances Stro;ghtness 0.025 in./ft and not mOfe than 0.125 in. in
any 5-lt length
Wall thickness ±10%
Diameter Nom OD (in.) Tolerance (in.) 0.188 to 0.499 +0.004 -0.000 0.500 to 0.999 +0.005 -0.000 1.000 to 1.499 ~.007 -0.000 1.500 to 2.000 +0.010 -0.000
Ovality Same as noted for diameter tolerances listed above.
TABLE 1.-Continued B. Ti·3AI-2.5V Annealed
Grumman
GM 3118, dated 5-4-71
F-14
90,000 psi min 110,000 ps: max
75,000 psi min 95,000 psi max
15%
3 X 0D
~ 1.4 X OD
-
ID AHA 63, OD AHA 32 Tube 00 shall show a uniformly pickled surface finish (minimum of 0.0005 in. per surface shall have been chemially r11m0ved as a finishing ~at ion). Soft belt polishing prior to pickling operation is perminible, but all tracn of poliohi,. marks shall be removed by subMquent pidde.
Tube I D shall show a unifOfm mane finish and shall be achieved by grit blasting followed by a subsequent pici<hng operation to remove a minimum of O.IXJ05 in. per surface
NomWT Max defect depth jin.! (in.)
Up to .060 0.002} .061 to .080 0003 (a) .081to.100 0.004
0.025 in./ft and not more than 0.125 m. :n any 5-lt length.
±10%
Nom OD (in.) Tolerance (in.) 0.188 to 0.500 +0.004 -0.000 0.501 to 1.500 +0.005 -0.000 1.501 to 2.500 +0.006 -0 000
Same as noted for diameter tolerances I isted above.
Proposed Aerospace Matenal Specif:cation
AMS 4943
-
:
90,000 psi min
75,000 psi max
15%
-
---
"External and internal surface imperfections wch as handling marks, straightening marks, light mandrel and die marks. shallow pits, seams, scores and scale pattern will not be considered injurious provided the imperfections are removable wi th.n the tolerances specified herein for wall thickness."
No AHA requirements were noted.
No ultrasonic inwection w .. specified.
-
±10%
NomOO~ Tolerance (in.) 0.188 to 0. ~-004 -0.004 0.500 to 1.000 ~005 -0.005 1.000 to 1.500 ~-006 -0.006
-
' 1 Tubing ultrasonically inspected with standards having a reference notch 118 in. long +5%, 0.010 wide and a depth as specified for the cold worked tubing .
• • • • • • •

)
•
,
)
•
,
D> TABLE 1.-Conc/uded
Flattenong Tests (McDonnell-Douglas)
Specimens of the full sect1on of the tube not less than two inches in length shall be cut from tubes selected in accordance with the sampling plan. The tube specimens shall be flattened between parallel plates under a gradual load a!]plied perpendicularly to the longitudinal axis until the distance between the plates is not greater than . thot specified in the table below. After examination of the outside surfaces, the samples shall be split long1tudonally and the inside surfaces exam1ned. The inside and outside surfaces shall be free from cracks, tears, breaks or opened d1e or polishing marks when examined at 3 to 5 x magnification.
Flattening Factors
Outside diameter to Distance between plates wall thickness where I~ wall
ratio, OD/t thickness
10orless 71 11 to 16 121 17 to 30 151 31 to 50 171
[3:> Surface ConditiOning Prior to Pickling (McDonnell-Douglas)
Intermediate mechamcal conditionong prior to tonal pick long IS permissible within the following limits:
a. Center less grinding of the outside surfaces is not ~cceptable.
b. L1ght belt polishing or buffing of the outside diameter surfaces is permissible with a grit SIZe of 400 or less.
c Light grit blastong of the mside diameter surfaces is permissible with a grit size of 100 or iess.
d. Belt poliShing, buffing and grit blasting operations are not acceptable after final pick long.
@:> Oepth of DIScontinuities (Lockheed-Georgia)
The maximum depth of individual discontinuities shall not exceed the limits specified below. The specified limits are applicable only to discontmuities removable without violating the OD and wall thickness tolerances specified.
Depth of Discontinuities
Nom wall thickness (in I Max depth of discontinuities (in.)
.020 and under 10% of nominal wall thickness or .OCJl whichr.ver is greater.
.021 through .030 002
.031 through .040 0025
.041 through .050 .003
.051 through 066 .004
067 through .085 .006
Discontinuities having a depth equal to or less than the limits specified shall be removed from the exterior surfaces of the tubing, except that discontinuities, having large root radii plainly visible to the unaided eye and whose surfaces blend smoothly into the normal tubing surface, need not be removed. Removal shall be accomplished by light belt polishing and buffing; grit blasting or centerless grinding with hard wheels shall not be used.
Note: No ultrasomc inspection was speCified. Some eddy current inspection was done by the tube manufacturer for their own satisfaction.
Maximum Depth of Defects (Boeing)
A defect on the outside surface of tubing may be removed by sanding, polishing, and buffing prior <o chemical milling as apphcable, to bring the defect into conformance with the allowable noted defect requirePJents, providing the foniShed tubing remains within dimensional tolerance in the areas from which the defect was removed.
Inspection of Finished Tubing (Boeing)
Finished tubing shall be inspected for inside and outside defects per the requirements of BAC 5439-2. Depth of the standard notch shall be in conformance with the maximum defect limits shown. Length of the standard shall be 0.060 for wall thickness less than 0.046 inch and shall be 0.125 inch for wall thickness 0.046 or greater
~ Reverse Flattening Test (Grumman)
A representative sample of tubes from each lot shall be subjected to a reverse flattening test to examine the 1 D surf1ce condition. Specimens approximately 3" long shall be sectioned longitudinally along the diameter and one half flottened between parallel plates until the distance between the plote is essentially equal to the wall thickness of the tube sample. The flattened sample shall then be examined under fluorescent lighting at 30x magrHf1cat1on. Ev1dence of ID Imperfections (see GAC supplied stand.,dsl shall be cause for provisional rejection of the lot.
B:> (North American)
The surface requirements are presently being revised to have the ID RHR 63 and the OD RHR 32.
11

12
TABLE 2.- TUBING TESTED FOR PART I
Tube size Tube OD and WT Manufacturer and no. (in.) heat number
1 1 X .080 Reactive Metals, Inc. Niles, Ohio HT304450-03
2 1 X .080 Reactive Metals, Inc. Niles, Ohio HT 304450-03
3 1 X .080 Reactive Metals, Inc. Niles, Ohio HT 304450-03
4 3/8 X .020 Zirconium Technology Albany, Oregon BF 10059
5 3/8 X .020 Zirconium Technology Albany, Oregon BF 10059
6 3/8 X .020 Zirconium Technology Albany, Oregon BF 10059
7 3/8 X .020 Superior Tube Norristown, Pa. HT 304450
8 C5J8 X .040 Superior Tube Norristown, Pa.
a As processed for the SST prototype airplane.
bThe composition of the pickling solution is: 60 gal water 15 gal nit ric acid 2 gal hydrofluoric acid
CNonstandard size, used only for metallurgical analysis
Tubing specification and I D finish requirements
XBMS 7-234a
XBMS 7-234a, except the ID pickledb to remove 0.0005 in. from each surface. Note: This 10 finishing process is used by McDonnell-Douglas Airplane Division. Sept. 1971.
XBMS 7-234a, except the ID was was arit blasted (size 60 to 120 grit) to remove 0.0005 to 0.0010 in. from each I D surface. After grit blast, the I D was pickledb to remove 0.0005 in. from each surface. Note: This I D finishing process is used by Grumman Aerospace Corporation, Sept. 1971
XBMS 7-234a
XBMS 7·234a, except the ID was pickledb to remove 0.0005 in. from each surface. Note: This I D finishing process is used by McDonnell-Douglas Airplane Company.
XBMS 7-234a, except the ID was grit blasted (size 60 to 120 grit) to remove 0.0005 to 0.0010 in. from each I D surface. After grit blast, the ID was pickledb to remove 0.0005 in. from each surface. Note: This I D finishing process is used for Grumman Aerospace Corp for annealed tubing.
XBMS 7-234, except with special crystallographic texture. In addition, the I D was grit blasted and pickled. The metal removal was approximately 0.0005 in. for each operation.
Same as tube 7
•
•
•
•
•
•
•
•
•

,
)
•
,
)
chemical milling of this surface (tube 5, Zirtech) showed some improvement. Further improvement was evident in tubes that had been grit blasted prior to chemical milling (tube 6). The 10 surface of the Superior tubing (tube 7) showed the same appearance as tube 6 (fig. 2).
TABLE 3.-SURFACE ROUGHNESS OF TUBES
Tube Tube RHR Value no.a size (in.) OD surface ID surface
1 1 X .080 15 60
2 1 X .080 20 60 3 1 X .080 17 30 4 3/8 X .020 65 b50
5 3/8 X .020 60 b50
6 3/8 X .020 65 b40
7 3/8 X .020 10 20 8 5/8 X .040 14 18
asee table 2 for manufacturer, specification, and I D fin ish
bThe quantitative accuracy may have been affected by probe malfunction.
Scanning electron micrographs were taken on the 10 surface of tubes 4 and 6 to determine the difference between as-processed, and grit blasted and chemically milled surfaces. The results, shown in figures 3 and 4, illustrate the improved finish resulting from the grit blasting and chemical milling treatment. These effects are particularly noticeable when the electron beam is oriented in the longitudinal (or axial) direction of the tube.
The I x .080 in. tubes all displayed approximately the same OD surface. Under visual examination at I 0 times magnification similar pits, nicks, and scratches were visible which in high-stress fatigue testing tend to become origins for fatigue cracking. The chemical milling and grit blasting plus chemical milling treatments of the 10 resulted in progressive improvements over the as-received finish. The 10 surface of the I x .080 in. tubing did not show ruts and similar gross defects as had been observed in visual inspection of the 3/8 x .020 in. asreceived tubing (tube 4).
3.4 MICROSTRUCTURE
The microstructure and surface roughness of tubes I through 6 was photographed at 500X. The Ti-3Al-2.5V tubes possessed a fine, equiaxed structure and showed considerable cold work in the transverse direction (fig. 5 and 6). In these photographs it may also be noted that the 10 surface condition of the tubes appeared to improve considerably for the grit blasted and chemically milled condition but did not differ noticeably between the chemically milled and the as-processed tubing.
13

14
Color anodizing of titanium has been used by Boeing over the past several years as a method of studying crystallographic texture and texture banding. With this method it is possible to access the preferred crystallographic texture of titanium. The method is based on the observation that grains with a basal texture do not develop an oxide layer during anodizing as quickly as do grains with other orientations. This technique has been used with considerable success on plate and forgings to evaluate texture banding, but has not been previously attempted for tubing. Experimentation for this program indicated that:
• The tubing is not texture-banded (i.e., the microstructure did not contain banded regions of similarly oriented grains.)
• The grain size and orientations found were not sufficiently different for a texture analysis by color anodizing. The grain sizes tend to be too small, and crystals of similar orientation are too well dispersed.
3.5 RESIDUAL STRESS
The residual stresses in tubes 1, 4, 7, and 8 were measured using the method outlined in XBMS 7-234A (appendix A). Several additional samples were also analyzed with these tubes to provide additional information regarding the scatter obtained (see table 4).
The materials specification calls for a maximum stress of ±15.0 ksi; thus, most tubes meet the required values. Tubes 8, (B), and (E) were above the desired values but were not used extensively during the present investigation. High residual stress values are thought to be caused by excessive straightening and may result in a degradation of fatigue properties.
TABLE 4.-RES/DUAL STRESS IN TUBES
Tube no. Tube size Residual
Manufacturer Heat no. (in.) stress (ksi)
B· 1 X .080 13.4 Reactive Metals HT304450-03
3/8 X .020 -5.5 Zirtech BF10059 3/8 X .020 14.3 Superior HT304450 5/8 X .040 19.9 Superior HT304450
(Bl) 3/8 X .030 26.3 Zirtech BF10050 (E 5/8 X .021 35.8 Zirtech BF07058
~6~ b 5/8 X .050 -4.3 Zirtech BF07058 1 X .033 -0.6 Reactive Metals HT294804-23
(G) 1 X .033 -1.2 Reactive Metals HT294804-24 (H) 1 X .033 4.2 Reactive Metals HT304042-22
a See table 2 for specification and finish requirements. The residual stress in tubes 2 and 3, noted in table 2, should have the same value as those for tube 1. The residual stress in tubes 5 and 6, noted in table 2, should have the same value as those for tube 4.
b Samples selected from random tubes with additional wall thicknesses, sizes, and heats.
•
•
f
f
•
•
f
•

)
,
)
,
3.6 TUBING TEXTURE
3.6.1 Metallurgical Considerations
The mechanical and physical properties of many hexagonal-close-packed materials can be varied over broad ranges by the control of crystallographic texture. In seamless tubing applications, texture control has been applied in zirconium tubing technology to control the deleterious effects of hydride precipitates. Similarly, burst strengths and forming characteristics are improved by a favorable orientation of basal planes. The control of crystallographic texture in titanium tubing has not been made an integral part of tubing manufacturing technology, although preliminary evidence indicates that substantial improvements in many important properties could be obtained for titanium tubing.
The deformation characteristics of titanium are such that forming treatments produce an anisotropic texture. Judicious control of the metal working and annealing will result in particular textures being developed. In the manufacture of seamless titanium tubing it has been found that texture will usually vary between circumferential and radial orientations of the basal plane poles of the titanium unit cell (fig. 7). Severely textured material will normally be found to have one of these two basic textures. Investigations performed to date on zirconium and titanium tubing have demonstrated that the radial texture will cause an optimization of most properties important to aircraft hydraulic tubing. The radial texture affects the tubing properties as follows:
• It minimizes wall thinning during bending. Diameter reduction is the deformation mode.
• It maximizes the biaxial strength of the tube (circumferential and axial). This gives improved burst strengths.
• It maximizes the fracture resistance for flaws normal to the tube surface.
• It improves the fatigue resistance of tubes by increasing the biaxial strength of the tube, and by minimizing wall thinning in bends.
The circumferential texture results in properties almost the exact opposite of the above. Deformation is by wall thinning rather than by diameter reduction, and the circumferential strength is maximized (which minimizes toughness for defects oriented parallel to the axial directions).
The preferred radial texture in tubes is developed by manufacturing the tubes from controlled starting stock, such that a large degree of wall reduction takes place compared to the amount of diameter reduction. This value is called the T-ratio and is given as follows:
. W/W0 T-ratto = OD/OD
0
15

16
where:
w = Wall thickness of tube
wo = Wall thickness of hollow
OD = Outside diameter of tube
OD = 0 Outside diameter of hollow
High T-ratios (greater than 1.0) tend to give radial textures. Low T-ratios tend toward the circumferential crystallographic texture.
The actual texture produced in a tube can be measured by several different methods. The most accurate method available is X-ray diffraction, where the actual orientation of basal planes is measured and plotted as a stereographic projection pole figure plot. Unfortunately this technique is time consuming, relatively expensive, and requires special equipment, and therefore does not lend itself well to production applications. Several other methods, including hardness measurements and special metallographic techniques, are also available to measure texture in titanium tubes. However, the fastest and most straightforward technique appears to be direct measurement of the degree of wall and diameter reduction associated with the tensile testing of a tube. The advantage of this technique is that it utilizes two of the basic mechanical properties affected most by texture variations. The values derived from this test are called R-ratios and are determined as indicated in figure 8. High R-ratios indicate the desired radial texture (little wall thinning and relatively large diameter reduction) and low R-ratios the circumferential texture.
T-ratios and R-ratios generally move in concert; high T-ratios during the manufacture of a tube will be reflected in high R-ratios during the testing of the tube, and vice versa. This phenomenon has been observed experimentally in zirconium alloys and titanium alloys.
3.6.2 R-Ratio and Pole Figure Data
Crystallographic texture studies were performed on all tubes tabulated in the residual stress study (table 3) to relate manufacturing methods, tube size, and texture to the resulting mechanical and fatigue properties. The texture of each tube was determined by X-ray diffraction techniques and by mechanical test (R values). The X-ray diffraction results are shown in figures 9 through 18.
The X-ray texture evaluations indicate that the higher the ratio of wall reduction to diameter reduction during manufacture, the more advantageous is the resulting texture of the tube. The most desirable texture is considered to be that represented by basal plane poles perpendicular to the surface of tube; i.e., radial texture. For this case, burst strength is improved, deformation is by diameter reduction rather than wall reduction, fracture toughness is improved for flaws oriented in the axial direction, and fatigue properties are optimized. Considering the presently used tube fabrication techniques it is observed that thin-walled, large-diameter tubes tend to have the best texture and heavy-walled small-diameter tubes the worst.
f
•
•
•
•
•
•

)
•
)
•
)
,
)
Tubes manufactured by Zirtech and Reactive Metals, Inc. (RMI) are produced by tubereducing mills (Pilger mills) whereas Superior used tube drawing techniques. The pole figure analysis indicated that the 3/8 x .020 in. Superior tubing had a better texture than did the 3/8 x .020 in. Zirtech product.
R-ratio measurements were made from fractured tube tensile specimens. Measurements were taken in conformance with Boeing Materials Specification XBMS 7-234A (appendix A) . This ratio involves a measurement of the degree of wall thinning and diameter reduction after a tensile test. This method specifies "after test" measurements to be made midway between the fracture surface and the beginning of the neck-down region (see fig. 8). R values were derived for tubes I through 7 and the results are shown in table 5. The R-ratios established in this manner have a qualitative correlation with the pole figure plots shown in figures 9 through 18. In the 3/8-in.-diameter samples the crystallographic texture of the Superior tube was better than for the Zirtech. The l-in. diameter RMI tube also displayed a favorable crystallographic texture .
TABLE 5.-STRAIN RATIO OF VARIOUS TUBES TESTED IN PART I
Tube Strain ratio, Rb Tube size Manufacturer
no.a (in.)
c1 1 X .080 d0.70 Reactive Metals
c1 1 X .080 d1.115 Reactive Metals
c1 1 X .080 e0.78 & 0.92 Reactive Metals
f4 3/8 X .020 c0.402 Zirtech
4 3/8 X .020 c0.508 Zirtech
7 3/8 X .020 c0.730 Superior
7 3/8 X .020 c0.940 Superior
asee table 2 for specification and finish requirements.
bR = Ln(0Df/OD0
)-;... Ln(Wf/W0
)
Heat no.
HT304450-03
HT304450-03
HT304450-03
BF10059
BF10059
304450
304450
cTubes 2 and 3, as noted in table 2, are identical to tube 1, except for ID surface finish.
dBoeing measurement method: All measurements were made with a micrometer. The final dimensions were measured approximately halfway between the fracture surface and the point where uniform elongation ends.
eSuperior Tube Company measurement methods (sample sent to Superior) The 0.92 value was determined by using a vitagage for the measurements. The 0. 78 value was determined by using a micrometer for the measurements. The same vitagage calibration setting was used for measuring the dimensions before and after the test. The final measurements were taken about 0.25 in. from the fracture.
fTubes 5 and 6, as noted in table 2, are identical to tube 4, except for ID surface finish.
17

18
3.7 TUBE BENDING AND FLATTENING TESTS
Bending and flattening tests were performed to compare the formability of the rockerformed standard tube with the new texture-controlled tube. The tests were also intended to evaluate whether bending and/or flattening were meaningful specification controls. The work was conducted in the three 3/8-, 5/8- and l-in. sizes and for the tube fabrication methods being considered. The bends were made to 2, 2.5, and 3 times diameter bend radius and to a 120° angle. The springback, thinning, and flattening behavior were compared. The flattening tests were performed by flattening 3-in.-long straight sections to various dimensions, such as 16, 14, I 0, and 8 times the tubing wall thickness. Flattening tests were performed on the pressure and return lines in the 3/8-, 5/8-, and l-in. sizes made by different manufacturers and are described in section 5 .I.
3.8 ROTARY FLEXURE TESTS
3.8.1 Preparation and Inspection of Test Specimens
The tube sizes tested in rotary flexure were the 3/8 x .020 and I x .080 return and pressure lines, respectively. Prior to forming, all tubing was ultrasonically inspected, with certified standards per BAC 5439-2 (ref. 5) for longitudinal, transverse, and herringbone defects. All tubing used in these tests met the requirements.
Specimens were formed with 120° bends using a 30 bend radius (three times the tube diameter). The bending equipment and forming characteristics are described in section 5.0. After forming, the tubes were penetrant inspected for cracks per BAC 5423 (ref. 6) and found to be acceptable.
All specimens were checked for ovality, and these values are shown in table 6.
3.8.2 Stress Application and Flexure Test Geometry
The stress application for tubes formed with 120° bends are shown in appendix B. All stresses were determined by mathematical analyses, based upon deflection and pressure.
The geometry selected for the 3/8 x .020 and I x .080 rotary test specimens was very similar (30 bend radius and 120° bend, as shown on figs. 19 and 20), and conventional engineering bending theory when applied to these specimens would indicate similar stress distributions, ami and arne' for both types of specimens. Pressure values were calculated depending upon deflection to obtain the desired stress. Application of the analysis to both types of specimens indicates that internal stress distribution in the walls of the tubing is quite different in the l-in. tubing from that of the 3 /8-in. tubing. For the l-in. tubing, the maximum stress exists at ¢ = 270° on the outer surface of the tube wall and is longitudinally oriented, whereas for the 3/8-in. tubing, the maximum stress exists at ¢ = 0° or 180° on the inner surface of the tube wall and is cir,cumferentially oriented.
•
•
•
•
•
•
•

.. ... .. - - - - - -
TABLE 6.-FLEXURE TEST RESULTS FOR BENT TUBES, PART I
Tube Maximum Deflection. Failure Along Along
Specimen size. Special ovality single Press No. of (deg) Long itudi nala C1rcumferent1ala Failure analysis
no. 00 and WT finish in bend amplitude, (psi) cycles 8(a) q>(a) stress at failure O"m,n stress at failure O"min Or~gin Mode (in.) process (%) 0sA O"max (psi) O"min(psi) -- am ax (psi) O"min (psi) --
O"max O"max 16PB-B1 1 X .080 - 1.50 0.64 4150 698,340 42 270 38,720 14,900 0.385 - - - 00; abrasion Trans
and p1t 16PB-B2 1.90 0.875 5770 86,130 65 270 58,300 ·25.100 0430 - - - 00; pit or Trans
scratch 16PB-B3 1.60 0.64 4150 271,920 113 270 40,620 -16,800 0414 -- - - 00; gouge Trans 16PB-B4 2.10 0.875 5770 115,275 80 180 - - -- 65,500 1100 0.0168 10 Long 16PB-B5 2.00 0.725 4780 391,975 83 0 - - - 55,200 0 10 Long 16PB-B6 2.20 0.725 4780 9B X 106 No failure b 49,340 b-21,860 -0444 - - - - -16PB-B7 170 0.725 4780 99.180 110 270 48.740 -21,260 0436 -- - - OD;small pit Trans 16PB-B8 1.60 0.875 5770 68,730 106 270 59,000 -25,600 0435 -- - - 00; small pit Trans
16PB-G1 1 X .080 (c) 1.90 0.64 4150 256,470 108 270 40,820 -16.980 -0415 - - - 00; pit Trans 16PB-G2 2.50 0.64 4150 146,230 110 270 40,720 -16,880 -0414 - - - 00; gouge Trans 16PB-G3 240 0.725 4780 203,580 97 180 - - - 55,200 0 0 10 Long 16PB-G4 2.20 0.725 4780 229,680 96 270 49,340 -21,860 -0444 - - - 00; long Trans
scratch 16PB-G5 2.10 0.725 4780 167,040 26 270 43,840 -16,360 0.374 -- - - 00: pit Trans 16PB-G6 2.00 0.875 5770 87,652 116 270 58,300 -25,100 -0480 - - - 00; small Trans
scratch 16PB-G7 2.00 0.875 5770 61,552 18 270 49,400 -16,200 -0.329 - - - 00. crease Trans 16PB-G8 2.20 0.875 5770 91,350 114 270 58.600 -25,400 -0434 - - -- 00 Trans
16PB-M1 1 X .080 (d) 1.80 0.64 4150 129.780 72 270 40,920 -17,080 -0417 - - - 00; gouge Trans 16PB-M2 1.70 0.64 4150 10 X 106 No failure b41,320 b-17,480 -0424 - - - - -16PB-M3 2.00 0.725 4780 103,530 55 270 46,540 -20,060 -0430 - - - 00; gouge Trans 16PB-M4 2.30 0.725 4780 74,820 41 270 45,940 -18,460 -0402 - - - 00; scratch Trans 16PB-M5 2.30 0.725 4780 77,865 70 270 48,740 -21,260 -0.436 - - - 00; pit Trans 16PB-M6 1.80 0.875 5770 118.755 103 270 59,200 -26,000 -0439 - - - 00; small pit Trans 16PB-M7 2.00 0.875 5770 57,420 89 270 59,200 -26,000 -0.439 - - - 00; pit Trans 16PB-M8 1.90 0.875 5770 63,075 101 270 59,200 -26,000 -0.439 - - - 00; gouge Trans
6RB-B1 3/8 X .020 - 3.20 0.52 2680 94,620 76 0 - - - 45,600 2.000 0.044 10 Long 6RB-B2
I 3.20 0.52 2680 139,440 76 0 - - - 45,600 2,000 0.044 10 Long
6RB-B3 3.20 Q.59 3080 82.170 43 180 - - - 50,400 4,400 0.087 10 Long 6RB-B4 3.47 0.59 3080 74,700 32 0 - - - 51,400 3,400 0.067 10 Long 6RB-B5 3.20 0.59 3080 74,700 71 0 - - - 51,200 3,600 0.070 10 Long 6RB-B6 2.94 0.71 3730 39,840 81 180 - - - 60.600 5,800 0.096 10 Long 6RB-B7 2.94 0.71 3730 34,860 61' 180 - - - 60,200 6,200 0.103 10 Long 6RB-B8 3.20 0.71 3730 34,860 49 0 - - - 59,800 6,600 0.110 10 Long

N 0
•
TABLE 6.-Concluded
Tube Maximum Deflection. Specimen size. Special ovality single. Press No. of
no. OD and WT finish in bend amplitude. (psi) cycles (in.) process (%) 0 SA
6RB-G1 318 X .Q2Q (c) 3.47 0.52 2680 2,858.520 6RB-G2 3.20 0.52 2680 4,163.820 6RB-63 3.20 0.59 3080 378,480 6RB-G4 3.47 0.59 3080 388.440 6RB-G5 2.94 0.59 3080 398.400 6RB-G6 3.20 0.71 3730 80,510 6RB-G7 2.94 0.71 3730 88.810 6RB-G8 3.20 0.71 3730 73.870
6RB-M1 3/8 X .020 (d) 2.67 0.52 2680 614,200 6RB-M2 2.94 0.52 2680 10 X 106 6RB-M3 3.20 0.59 3080 1Q X 1o6 6RB-M4 2.94 0.59 3080 1,094,006 6RB-M5 3.20 0.59 3080 300,460 6RB-M6 2,67 0.71 3730 56.440 6RB-M7 3.20 0.71 3730 36,520 6RB-M8 2.94 0.71 3730 127,820
6RB-1 318 X .Q2Q (f) 3.20 0.52 2680 1 Q X 106 6RB-2
I 2.65 0.52 2680 10 X 106
6RB·3 2.65 0.59 3080 1 Q X 106 6RB-4 2.94 0.59 3000 10 X 1o6 6RB-5 3.20 0.59 3080 10 X 106 6RB-6 2.94 0.71 3730 647,400 6RB-7 2.94 0.71 3730 112,050 6RB-8 3.20 0.71 3730 154,380
Note: All specimens were fabricated to specification XBMS 7-234
a See appendix B for stress formula and nomenclature
bAssume max stress location at 8 = 90 and • = 0° or 18o"
cGrumman finish pro~s
Failure Longitudinala (deg) stress at failure
8(a) ~(a)
~ax (psi) O"min (psi)
Specimen no valid; tube 71 0 - -
59 180 - -
75 0 - -
50 0 - -
71 180 - -
71 0 - -
68 0 - -
60 0 - -
No failure - -
No f ilure - -60 0 - -
73 180 - -
77 180 - -
49 340 - -
78 0 - -
No failure - -
No failure - -
No failure - -
No failure - -No failure - -
83 180 - -
60 180 - -
36 180 - -
o Tube I D grit blasted (60-120 grit) to remove 0.0005 to 0.0010 in. from each I D surface o After grit blast, ID was pickled to remove 0.0005 in. from each surface
dMcDonneii-Douglas process o Tube I D pickled to remove 0.0005 in. from each surface o Tube pressurized to 21,000 psi for 30 sec prior to flexure testing
eSpecimens not analyzed
f Tubing with texture control
• • - -
Along Circumferential a Along Failure analysis stress at failure
am in amax (psi) amin (psi) ~in Orig1n Mode a,:nax a ,:;:;ax
broke off in center of bend - 45.600 2,000 0.044 (e) Long - 50.900 3.900 0.077 10 Long - 50.900 3,900 0.077 ID Long - 50.600 4,200 0.083 ID Long - 60.400 6,000 0.099 ID Long - 60.400 6,000 0.099 ID Long - 60.400 6.000 0.099 ID Long
- 45.400 2,200 0.048 (e) Long - b45,800 b1,800 0.039 - -- b51.400 b3.400 0.066 - -
- 50,900 3,900 0.077 (e) Long - 51,300 3,600 0.070 ID Long - 60,600 5,800 0.096 ID Long - 59.800 6,600 0.110 ID Long - 60,500 5,900 0.098 ID Long
- b45,800 b1.800 0.039 - -
- b45,800 b1.800 0.039 - -- b51.400 b1,800 0.066 - -
- b51.400 b1,800 0.066 - -- bs1.400 b1,800 0.066 - -
- 60.600 5,800 0.096 ID Long - 60,200 6,200 0.103 ID Long - 59,300 7.100 0.120 ID Long
- -

•
3.8.3 Test Procedure and Results
3.8.3.1 Proof Pressure Tests
Prior to flexure testing, each specimen was subjected to a proof pressure test for 5 minutes at the values shown below. Any leakage or permanent deformation in the tube constituted a failure. If leakage occurred in the hydraulic fittings, the fitting was repaired or replaced. All specimens met this requirement satisfactorily.
Tube Size, OD and WT
(in.)
3/8 X .020 1 X .080
3.8 .3 .2 Pressurization Test
Proof Pressure at Room Temperature
(psig)
4150 8300
Prior to flexure testing, the test specimens with the grit blast and chemically milled ID fmish (3/8 x .020 6RB-Ml to 6RB-M8 and 1 x .080 16PB-Ml to 16PB-M8 in table 6) were subjected to the pressurization test. This test is required by McDonnell-Douglas for all tube assemblies prior to installation in the airplane. Each tube assembly is pressurized to four times the working pressure for 30 seconds. McDonnell-Douglas reports that the pressurization test is helpful in detecting poor-quality tubing and defective fittings.
The 3/8 x .020 specimens were pressurized to 13,500 psi for 30 seconds. The 13,500 psi was based on the following:
where:
PB =
K =
Fty =
Ftu =
t =
OD =
=
Burst pressure
K Ftu x 2t OD- 1.4t
Minimum yield strength of tubing at room temperature (psi)
Minimum tensile strength of tubing at room temperature (psi)
Wall thickness
Outside diameter (in.)
~ ( 105,000 )] Lo.6 + o.4 125 ,ooo ( 125 ,ooo)(2)(.o2o)
.375- 1.4 (.020)
13,500psi
(1)
21

22
The .020-in. wall thickness was the minimum thickness specified for the SST prototype. The Lame formula shown below was used for sizing the prototype tubing and gave a PB of 14,100 psi; however, the conservative value of 13,500 psi was used for the pressurization test.
, oo2 - 102 Lame formula PB = F tu 2 2 OD +ID
(2)
where ID is the inside diameter (in.) and PB, Ftu and OD are as listed for the Boeing formula above.
The 1 x .080 specimens were pressurized to 21 ,000 psi for 30 seconds. The 21 ,000-psi value was obtained using equation 1, as follows:
[ 0.6 + 0.4 (105,000 J Ps
125,000 ( 125 ,000)(2)(.080) =
1.0 - I .4 (.080)
= 21,000 psi
The .080 wall thickness was determined by the Lame formula (eq. 2) for an operating temperature of 450 F. Since all testing on this program (Task 6) was at room temperature, the burst pressure was calculated using room temperature mechanical properties. The Lame formula showed the burst pressure to be 21,500 psi; however, the conservative value of 21 ,000 psi was used for the pressurization test: Results from the pressurization test showed no leakage and no significant change in the tube ovality after depressurization.
3.8.3.3 Flexure Tests
The flexure tests on the I x .080 and 3/8 x .020 specimens were conducted at different deflections and pressures for the characteristic curves. The stress application and flexure test geometry are defined in section 3.8.2.
The centering and deflection setting procedures for the rotary flexure equipment defined in ARP 1185 (ref. 7) were used where applicable. However, this ARP was written for straight tubes with specified lengths and required changes for tubes with bends, as follows:
• The tightening of the clamp near the tail stock was critical and required several adjustments to the head stock to obtain the required deflection.
• The application of pressure may affect the deflection setting. The specimen should be pressurized to the working pressure, then depressurized, and a final check made on the deflection.
• The I x .080 specimens were tested at 1030 and 43 5 rpm. The faster speed of 1030 rpm was found to be satisfactory and gave no dynamic problems.
• The 3/8 x .020 specimens were all tested at 835 rpm.
•
•
•
•

,
•
Photographs of the 1 x .080 and 3/8 x .020 in. test specimens are shown in figures 21 and 22.
For the 1 x .080 specimens, the predicted mode of failure was a transverse crack, due to longitudinal stress, originating at the outside of the tube at 8 = 90° and <P = 27cf. Of 24 specimens tested (three different configurations), 19 failures occurred as predicted, with the transverse cracks originating on the outside diameter of the tube. On three specimens, the failures occurred due to longitudinal cracks originating on the inside diameter of the tube. On the remaining two specimens, failures did not occur after 9.8 x 10⁶ and 10 x 106 cycles.
The test data for the 1 x .080 specimens showing deflection, pressure, total cycles, failure analysis (if applicable), calculated stresses and stress ratio (R = aminl amax) are shown in table 6. Stress values for specimens that failed are calculated at the point of failure, whereas if no failure occurred the value is calculated for the maximum at 8 = 90° and <P = 270° in the bend. The curves showing deflection versus cycles and longitudinal stress versus cycles are shown in figures 34 and 35 (section 5.0). These curves show the 21 test specimens, including the two specimens that did not fail. The three specimens that failed because of longitudinal cracks on the inside diameter could not be directly compared and were not plotted; however, the circumferential stresses at the point of failure are shown for reference on the data sheets.
For the 3/8 x .020 specimens, the predicted mode of failure was a longitudinal crack due to circumferential stress, which originated at the inside surface of the tube at 8 = 90° and <P = 0° or 180°. Of 32 specimens tested (four different configurations), 24 failures occurred as predicted, with longitudinal cracks originating on the inside diameter of the tube. On one specimen, the tube fractured in the bend before the fail-safe device stopped the test. The cyclic life for this specimen is not considered valid. Of the remaining seven specimens, no failure occurred after l 0 x 1 06 cycles.
The test data for the 3/8 x .020 specimens showing deflection, pressure, total cycles, failure analysis (if applicable), calculated stress, and stress ratio (R = aminlamax) are shown in table 6. The specimens that did not fail are also shown, with the maximum circumferential stress value obtained in the bend. The curves showing deflection vs cycles and circumferential stress vs cycles are shown in figures 36 and 37 (section 5.0).
Test results for the three ID finish configurations of the l x .080 tube specimens made from tubing procured during the SST program per XBMS 7-234 showed no significant difference. The failure analysis showed that failures on 19 of 22 specimens originated on the outside diameter. Therefore, the special (Grumman, McDonnell-Douglas) ID finishes did not improve the fatigue life over the as-received (Boeing) finish. Closeup photos of flexure fatigue cracks are shown in figures 23 and 24.
Test results for the four configurations of the 3/8 x .020 tube specimens showed that the Superior tubing per XBMS 7-234 with texture control had the best fatigue life. The results on tubing procured during the SST program per XBMS 7-234 showed ID failures and that improving the ID finish per the Grumman and McDonnell-Douglas ID requirements significantly improved the fatigue life over the as-received Boeing finish. Based on the part I test results, the texture-controlled tubing showed the best fatigue life and was used for subsequent tests in part II.
23

•
)
,
4.0 PART II-EVALUATION OF IMPROVED TUBING (Procured per Specification XBMS 7-234A)
Part II of this program was to evaluate the metallurgical characteristics of the new 3/8 x .020, 3/8 x .030, 5/8 x .021, 5/8 x .050, I x .033, and I x .080 tube sizes, and the fatigue characteristics of the 3/8 x .020 and I x .080 sizes procured per the proposed specification XBMS 7-234A (appendix A). The tubes evaluated are detailed in table 7. The tubes were evaluated as a function of manufacturer, surface condition, tube size, and crystallographic texture.
TABLE 7.- Ti-3AI-2.5V CWSR TUBES PROCURED FOR PART II PER BMS 7-234A
Tube Tube size,
00 and WT Manufacturer Heat no. Lot no. no. (in.)
1 3/8 X .020 Superior 304450-03 1
2 3/8 X .030 Superior 304450-03 1
3 5/8 X .021 Superior 304450-03 1
4 5/8 X .050 Superior 304450·03 1
5 10 X .033 Bishop 704511-06 1-1
6 10 X .080 Bishop 704511-06 1-1
The 3/8 and 5/8 tube sizes were manufactured by Superior Tube Company, using the I x .080 tubing made by Reactive Metals, Inc. for the SST program as the starting stock (tube hollows). Prior to manufacturing by Superior, the l x .080 starting stock was ultrasonically inspected and met the requirements of BAC 5439-2 (refs 8 and 9) for longitudinal, transverse, and herringbone defects.
The I x .033 and I x .080 tube sizes were manufactured by Bishop Tube Company using stock (tube hollows) procured from Reactive Metals, Inc.
Because of time limitations in the program, certain requirements for starting stock (tube hollows) were waived, and the Reactive Metals starting stock used for the 1 x .033 and I x .080 tubing was accepted on a best-effort basis. The basic new provisions of the specification were fourfold:
• Increased quality of tube hollows through more stringent defect allowances and quality control requirements
• Specified tube processing methods
25

26
• Required improved surface finishes
• Required specific degree of preferred crystallographic texture
4.1 SURFACE CONDITION
The surface roughness on the OD and ID surfaces of tubes I through 6 was determined using a profilometer. Boeing material specification XBMS 7-234A calls for the final tube reduction to be by drawing and prohibits the use of sanding or grinding operations on the OD surfaces following the final drawing operation. The OD surface is then chemically milled 0.002 in. and the ID surface is grit blasted (- 0.0005 in.) and chemically milled (- 0.0005 in.). The surface roughness of the various tubes was found to be as shown in table 8 and figure 25.
TABLE B.-SURFACE ROUGHNESS VALUES OF
Ti-3A/-2.5V CWSR TUBING
RH R roughness value ranges
Tube OD surface I D surface no.
Manufacturer Boeing Manufacturer Boeing
1 12-17 18·25 25-25 21-27
2 10-11 11-13 17-20 18-25
3 13-16 15-18 20-21 20-25
4 10-17 16-21 25-25 21-25
5 20-24 9-14 12-20 13-18
6 15-25 12-15 10-20 16-22
The surface roughness of all tubes was considerably better than that normally observed for Ti-3Al-2.5V tubing procured over the past several years. XBMS 7-234A stipulates that an RHR value of 3 2 on the ID and OD surfaces shall not be exceeded. As shown in table 8, these limits were easily met.
Examination of OD surfaces with a wide-field microscope revealed relatively coarse circumferential sanding marks on all tubing except the I x .033 size, however. These sanding marks (striker marks in some cases) apparently survived the final reduction process as well as the 0.002 in. chemical milling treatment, which was not anticipated when XBMS 7-234 was being revised, and which is in conflict with the intent of the revised specification. Sanding marks of this type have previously been noted to act as points of origin for fatigue cracks and are considered to be unacceptable for the OD surface finish.
•
•
•
t
t
•

•
,
)
•
,
•
The ID finish of all tubes appeared smooth and free from surface irregularities. After examination of the OD surface finish, 25 ft of the I x .080 tubing was returned to Bishop Tube Company for additional chemical milling to remove the sanding marks. Bishop removed approximately 0.0005 to 0.0010 in. from the OD and improved the surface; however, there was still some evidence of sanding marks. Photographs of the tubing as received and after additional chemical milling are shown in figure 26. (The photographs are of different pieces of tubing.)
4.2 MICROSTRUCTURE
The microstructures of the subject tubes were examined and are shown in figure 27. All tubes possessed a relatively fine, equiaxed, alpha-beta morphology, but tubes 1 and 5 displayed a somewhat larger grain size. A relatively high-temperature anneal in the alpha-beta (-1600° F) prior to final drawing might produce this increase in grain size. All tubes were judged to have acceptable microstructures.
4.3 RESIDUAL STRESS
The residual hoop stresses in the six different tube sizes were measured using the method outlined in XBMS 7-234A. The results of this investigation are shown in table 9.
TABLE 9.-RESIDUAL STRESS MEASUREMENTS FOR Ti-3A/-2.5V CWSR TUBING
Tube size, Tube OD and WT Residual no. (in.) Manufacturer stress (ksi)
1 3/8 X .020 Superior +7.1
2 3/8 X .030 Superior +11.0
3 5/8 X .021 Superior +5.8
4 5/8 X .050 Superior +13.5
5 1 X .033 Bishop +7.2
6 1 X .080 Bishop +25.5
The specification requirement for residual stresses is ± 15.0 ksi maximum; thus, all tubes except number 6 met the required limits. The experimental nature of these lots of material and a tight schedule required that they be procured on a best-effort basis, so the high residual stress value found for tube 6 was not considered cause for rejection. High residual stress values might be expected to occasionally cause premature fatigue failures for some modes of stressing.
27

28
4.4 TEXTURE STUDIES
Crystallographic texture studies were performed on the subject tubes using a computerized X-ray pole figure technique and a tensile test technique. The X-ray diffraction results are shown in figures 28 through 33 and in table I 0. The results of the pole figures were in accordance with previous observations. As tube diameter increased and wall thickness decreased the texture tended toward the desired radial orientation of basal plane poles. Conversely, small-diameter, thick-walled tubes tended to possess a circumferential texture of basal plane poles. Table 10 shows the cf>p angle of basal planes for each tube; the I x .033 tube has the smallest angle and the 5/8 x .050 tube the largest.
Note: The cf>p angle is the angle between a true radial texture of basal plane (<Jl) and the actual centroid of high intensity basal plane poles along the 270° a axis.
TABLE 10.-CRYSTALLOGRAPH/C TEXTURE MEASUREMENTS FOR Ti-3A/-2.5V CWSR TUBING
Tube Tube size, tl'p angiJl R-ratioa no. iODand WT (in. Manufacturer (o) Boeingc Manufacturer
1 3/8 X .020 Superior 52 0.49 do.74
2 3/8 X .030 Superior 62 0.50 d0.47
3 5/8 X .021 Superior 32 2.80 d2.40
4 5/8 X .050 Superior 63 0.33 d0.44
5 1 X .033 Bishop 37 0.91 e1.54
6 1 X .080 Bishop 52 0.31 e0.56
aR = Ln(ODf/OD0
) + Ln(Wf/W0 )
See XBMS 7-234A (appendix A) for an explanation of terms.
bsee figure 28 for example
dsuperior Measurement Method: Approximately 20 measurements were made with a micrometer for each value and averaged. The final dimensions on tested specimens were measured approximately 0.25 in. from the fracture. Prior to measuring the final dimensions, the rough edge at the fracture was cut off with a hack saw, lightly filed, and the ID lightly reamed to remove burrs.
eBishop Measurement Method: Several measurements were made for each value and averaged. The final dimensions were measured about 0.25 in. near the uniform elongation section.
cBoei ng Measurement Method: All measurements were made with a micrometer. The final dimensions were measured approximately halfway between the fracture surface and the point where uniform elongation ends. The fractured edge was cut off, lightly filed, and surfaces deburred.
'
f
•
•

•
The R values determined at Boeing and by the tube suppliers are also shown in table I 0. The R values qualitatively correlate well with the pole figure results (high R values corresponding to low cf>p and vice-versa) but a rather large scatter is sometimes noted between the Boeing and supplier R value determinations. This circumstance is considered to be due to variations in making the required measurements and is expected to improve considerably as data are accumulated and procedures refined.
4.5 TUBE BENDING AND FLATTENING TESTS
Tube bending and flattening tests were conducted on various tubes as defined in section 3.7. Test results on bending and flattening are given in section 5.0.
4.6 ROTARY FLEXURE TESTS
4.6.1 Preparation and Inspection of Tube Specimens
The preparation and inspection of the I x .080 and 3/8 x .020 pressure and return line sizes are the same as defined in part I, except that no penetrant inspection was conducted in part II. The penetrant test was discontinued since no indications for defects were noted in the work performed in part I.
4.6.2 Stress Application and Flexure Test Geometry
The stress application and flexure test geometry are the same as defined in part I (sec. 3.8.2).
4.6.3 Test Procedure and Results
4.6.3.1 Proof Pressure Tests
The proof pressure test procedure is the same as defined in section 3.8.3.1. All specimens met this requirement.
4.6.3.2 Flexure Tests
The flexure tests on the I x .080 and 3/8 x .020 specimens, made per specification XBMS 7-234A, were conducted at different deflections and pressures to establish the characteristic curves. The values were in the same range as those used in part I so that a direct comparison could be made.
The centering and deflection setting procedures for the rotary flexure test equipment are the same as defined in section 3.8.3.3. All 1 x .080 specimens were tested at 435 rpm.
For the 1 x .080 specimens, the predicted mode of failure was a transverse crack due to longitudinal stress originating at the outside of the tube at (} = 90° and cf> = 27cf in the bend . Of the 1 x .080 tubing made by Bishop Tube Company, four specimens which showed transverse striker marks were initially tested. Test results on these specimens ( 16 PBT-1 through
29

30
-4) showed transverse cracks and low fatigue life. After evaluating these results, a small quantity of the tubing was returned to Bishop for additional chemical milling to remove the striker marks.
Bishop removed approximately .001 in. from the 00 and improved the surface; however, there was still some evidence of the striker marks. Three new specimens (16 PBT-5 through -7) were tested. Test results showed improvement in fatigue life over tubing not being retreated by additional chemical milling at Bishop.
The test data for the I x .080 specimens showing deflection, pressure, total cycles, failure analysis (if applicable), and calculated longitudinal stress are shown in table 11. The stress value is calculated at the point of failure for specimens that failed, whereas if no failure occurred the value is the maximum at (} = 90° and <P = 270° in the bend. Curves showing deflection versus cycles and longitudinal stress versus cycles are shown in section 5.0.
For the 3/8 x .020 specimens, the predicted mode of failure was a longitudinal crack due to circumferential stress, originating at the inside surface of the tube at (} = 90° and at <P = 0° or 180°. Of the eight specimens tested, six failures occurred as predicted, with longitudinal cracks originating on the 10 of the tube. On the remaining two specimens no failures occurred after 1 0 x 1 06 cycles.
The test data for the 3/8 x .020 specimens showing deflection, pressure, total cycles, failure analysis (if applicable), and calculated circumferential stress are shown in table 11. Stress values are calculated at the point of failure for the specimens that failed, whereas if no failure occurred the value is the maximum at (} = 90° and <P = 0° or 180° in the bend. Curves showing deflection versus cycles and circumferential stress versus cycles are shown in section 5.0.
f
f
f
f
•
•
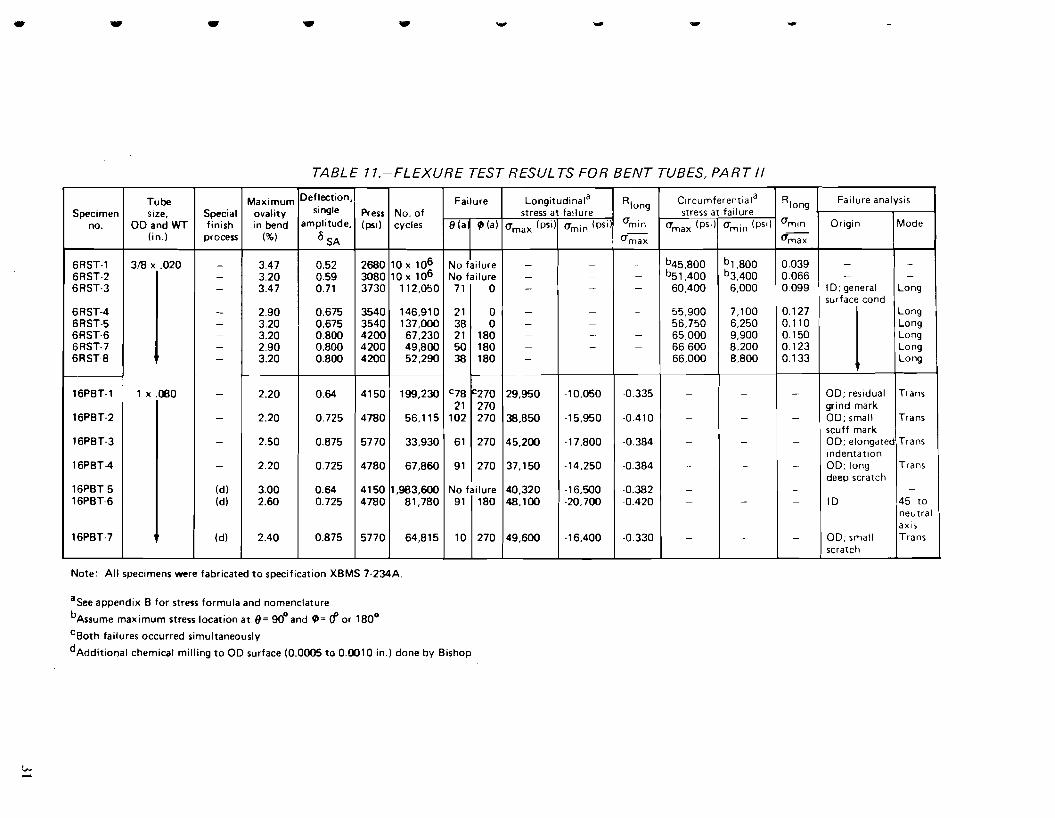
• - - -
TABLE 11.-FLEXURE TEST RESULTS FOR BENT TUBES, PART II
Tube Maximum Deflection,
Specimen size, Special ovality single Press No. of no. OD and WT finish in bend amplitude, (psi) cycles
(in.) process (%) 0 SA
6RST-1 3/8 X .020 - 3.47 0.52 2680 10 x 1 o6 6RST-2 - 3.20 0.59 3080 1 ox 1 o6 6RST-3 - 3.47 0.71 3730 112,050
6RST-4 - 2.90 0.675 3540 146,910 6RST-5 - 3.20 0.675 3540 137,000 6RST-6 - 3.20 0.800 4200 67,230 6RST-7 - 2.90 0.800 4200 49,800 6RST·B - 3.20 0.800 4200 52,290
16PBT-1 1 X .080 - 2.20 0.64 4150 199,230
16PBT-2 - 2.20 0.725 4780 56,115
16PBT-3 - 2.50 0.875 5770 33,930
16PBT-4 - 2.20 0.725 4780 67,860
16PBT-5 (d) 3.00 0.64 4150 1,983,600 16PBT-6 (d) 2.60 0.725 4780 81,780
16PBT-7 (d) 2.40 0.875 5770 64,815
Note: All specimens were fabricated to specification XBMS 7·234A.
a See appendix B for stress formula and nomenclature
bAssume maximum stress location at 8= 90° and~= r;f or 180°
cBoth failures occurred simultaneously
Failure
8(a '(a)
No failure No failure
71 0
21 0 38 0 21 180 50 180 38 180
C78 c270 21 270
102 270
61 270
91 270
No failure 91 180
10 270
dAdditional chemical milling to OD surface (0.0005 to 0.0010 in.) done by Bishop
Longitudinala Along Circumferentiala stress at failure stress at failure
<1max (psi) <1min (psi) <1m in <1max (psi) <1min (psi)
<1max
- - - b45,800 b1 ,BOO - - - b51,400 b3,400 - - - 60,400 6,000
- - - 55,900 7,100 - - - 56,750 6,250 - - - 65,000 9,900 - - - 66,600 8,200 - - - 66,000 8,800
29,950 -10,050 -0.335 - -
38,850 -15,950 -0.410 - -
45,200 -17,800 ·0.384 - -
37,150 ·14,250 -0.384 - -
40,320 -16,500 -0.382 - -
48,100 ·20,700 -0.420 - -
49,600 ·16,400 ·0.330 - -
Along Failure analysis
<1m in Origin Mode
<1m ax
0.039 - -0.066 - -
0.099 I D; general Long surface cond
0.127
l Long
0.110 Long 0.150 Long 0.123 Long 0.133 Long
- OD; residual Trans grind mark
- OD; small Trans scuff mark
- OD; elongated Trans inderttation
- OD; long Trans deep scratch
- - -
- ID 45 to neutral axis
- OD: small Trans scratch

)
•
•
5.0 DISCUSSION OF TEST RESULTS-PARTS I AND II
This section describes the results of tests on the various tubes conducted in parts I and II, including bending and flattening, mechanical properties, and characteristic curves showing deflection versus cycles. Each test is discussed separately.
5.1 BENDING AND FLATTENING TESTS
Bending and flattening tests were conducted on various tubes to determine the formability charactertistics. Many of the tubes used are manufactured to the previous specifications BMS 7-203 and XBMS 7-234 and were not used for the fatigue tests, but were tested for comparison only.
5.1.1 Bend Tests
The bend criteria for the 30 bend specimens formed to 120° bends are shown in table 12. The criteria include the type of bender, springback (degrees), and the minimum clamp length. The results show no significant difference in the springback when comparing the same size tube made by different manufacturers and to different specifications.
TABLE 12.-BEND CRITERIA FOR THREE-DIMENSIONAL 120° BENDS
Nominal Nominal tube Actual Minimum
tube wall wall Specification Manufacturer Type Springback clamp lengtha diameter thickness thickness bender (deg) (in.)
(in.) (in.) (in.)
3/8 .020 .021 XBMS 7-234 Zirtech Leonard PB 11 0.75 3/8 .030 .030
1 l Leonard PB 11.5 0.75
5/8 .021 .0225 Leonard 162-HYD 10 1.25 5/8 .050 .051 Leonard 162·HYD . 12 1.25 1 .080 .080 Reactive Metals Pines 1-1/2 14 2.00 1 .033 .034 XBMS 7-203A Reactive Metals Pines 1-1/2 10 2.00
3/8 .020 .020 XBMS 7-234A Superior Leonard PB 10.5 0.75 3/8 .030 .0305
I l Leonard PB 11 0.75
5/8 .021 .022 Leonard 162-HYD 9 1.25 5/8 .050 .051 Leonard 162-HYD 11 1.25 1 .033 0.034 Bishop Pines 1-1/2 10.5 2.00 1 .080 (b) Bishop Pines 1-1/2 14 2.00
Note: Manufacturing permits a max1mum thinout of 10%. Maximum ovality 3% permitted on bends
a Also minimum distance between bends
bwall thickness varied 0.005 in.
33

34
The results of bend tests conducted with various size bend blocks are shown in table 13. The comparison was made by evaluating the maximum bend ovality and bend thinout or reduction. Only one specimen for each size bend block was used; a better comparison could be made with more specimens.
The I x .080 tubes were made by two manufacturers to different specifications. The results did not show significant differences. Both types fractured using the 2.00-in. bend radius block.
The I x .033 tubes were made by two manufacturers to different specifications. The results were similar. Both types fractured using the 2.00- and 2.50-in. bend radius blocks.
The 5/8 x .050 tubes were made by two different manufacturers. The results were similar. Both types fractured using the 1.25- and 1.50-in. bend blocks.
The 5/8 x .021 tubes were made by two different manufacturers. The results were similar, and both types fractured using the 1.25-in. bend block.
The 3/8 x .030 tubes were made by Superior Tube Company per the initial specification XBMS 7-234 except for crystallographic texture control and to the new proposed specification XBMS 7-234A. The results show a tube fracture on the XBMS 7-234A tubing with a bend radius block of 0.750 in., whereas the XBMS 7-234 tubing did not fracture. The tube per specification XBMS 7-234A showed less bend thinout on the 0.933 and 1.000 bend radius blocks.
The four types of 3/8 x .020 tubes were made by two suppliers to different specifications. Results varied, and tube fractures occurred on three specimens formed with the 0.75-in. radius block. The best results were obtained on the Superior Tube per specification XBMS 7-234 with texture control, where no fracture occurred with the 0. 7 5-in. radius block. The lowest percentage ovality occurred with the Superior XBMS 7-234A tubing.
In summary, the results show the Superior 3/8 x .020 texture-controlled tubing per the new specification XBMS 7-234A and the XBMS 7-234 tubing procured for part I had the best formability.
5.1.2 Flattening Tests
The flattening tests were conducted to determine ductility. Results are shown in table 14. In most cases, the same tubes were used as for the bend tests. All tests were conducted per the procedure in the new proposed specification XBMS 7-234A.
The 1 x .080 tubes were made by three manufacturers. Reactive Metals and Zirtech fabricated to the same specification, and Bishop to the new specification XBMS 7-234A. Results show the Bishop tube to be the most satisfactory at 8t; however, lOt is considered the acceptable value.
•
•
•

• - -TABLE 13.-BEND TEST RESULTS
Nominal Average Average Tool Max Max tube size tube tube Manufacturer Specification Heat and lot no. bend bend bend
OD and WT OD WT radius ovality thinout (in.) (in.) (in.) (in.) (%) (%)
Tube Tube 1 X .080 1.001 .0770 Reactive Metals XBMS 7-234 304450·03 2.000 fracture fracture 1 X .080 1.001 .0770 Reactive Metals XBMS 7·234 304450·03 2.500 3.00 5.20 1 X .080 1.001 .0770 Reactive Metals XBMS 7-234 304450-03 3.000 3.00 6.50
1 X .080 1.001 .0790 Bishop XBMS 7-234A 704511-06 2.000 Tube Tube
fracture fracture 1 X .080 1.001 .0790 Bishop XBMS 7-234A 704511-06 2.50 2.80 7.90 1 X .080 1.001 .0790 Bishop XBMS 7-234A 704511-06 3.000 3.00 6.30
Tube Tube 1 X .033 1.002 .0320 Reactive Metals XBMS 7-203A 2094804-24 2.000 fracture fracture
Tube Tube 1 X .033 1.002 .0320 Reactive Metals XBMS 7-203A 2094804-24 2.500 fracture fracture 1 X .033 1.002 .0320 Reactive Metals XBMS 7-203A 2094804-24 3.000 .50 1.50
Tube Tube 1 X .033 1.002 .0325 Bishop XBMS 7-234A 704511-06 2.000 fracture fracture
Tube Tube 1 X .033 1.002 .0325 Bishop XBMS 7-234A 704511-06 2.500 fracture fracture 1 X .033 1.002 .0325 Bishop XBMS 7-234A 704511-06 3.000 .70 3.00
Tube Tube 5/8 X .050 .625 .0500 Superior XBMS 7-234A 304450-03 1.250 fracture fracture
Tube Tube 5/8 X .050 .625 .0500 Superior XBMS 7-234A 304450-03 1.500 fracture fracture 5/8 X .050 .625 .0500 Superior XBMS 7-234A 304450-03 1.750 2.05 8.00 5/8 X .050 .625 .0500 Superior XBMS 7-234A 304450-03 2.000 1.40 6.00
Tube Tube 5/8 X .050 .625 .0490 Zirtech XBMS 7-234 BF07058 1.250 fracture fracture
Tube Tube 5/8 X .050 .625 .0490 Zirtech XBMS 7-234 BF07058 1.500 fracture fracture 5/8 X .050 .625 .0490 Zirtech XBMS 7-234 BF07058 1.750 2.00 7.30 5/8 X .050 .625 .0490 Zirtech XBMS 7-234 BF07058 2.000 1.90 6.10
Tube Tube 5/8 X .021 .625 .0205 Superior XBMS 7-234A 304450-03 1.250 fracture fracture 5/8 X .021 .625 .0205 Superior XBMS 7-234A 304450-03 1.500 .80 2.30 5/8 X .021 .625 .0205 Superior XBMS 7-234A 304450-03 1.750 1.00 4.80

• •
Nominal Average Average tube size tube tube
OD and WT OD WT (in.) (in.) (in.)
5/8 X .021 .625 .0215 5/8 X .021 .625 .0215 5/8 X .021 .625 .0215
3/8 X .030 .377 .0300 3/8 X .030 .377 .0300 3/8 X .030 .377 .0300
3/8 X .030 .376 .0295 3/8 X .030 .376 .0295 3/8 X .030 .376 .0295
3/8 X .020 .377 .0205 3/8 X .020 .377 .0205 3/8 X .020 .377 .0205
3/8 X .020 .376 .0210 3/8 X .020 .376 .0210 3/8 X .020 .376 .0210
3/8 X .020 .376 .0205 3/8 X .020 .376 .0205 3/8 X .020 .376 .0205
3/8 X .020 .376 .0200 3/8 X .020 .376 .0200
aTube I D grit blasted and chemically milled per Grumman requirements
bTu bing has crystallographic texture control
• •
TABLE 13.-Concluded
Manufacturer Specification Heat and lot no.
Zirtech XBMS 7-234 BF07058 Zirtech XBMS 7-234 BF07058 Zirtech XBMS 7-234 BF07058
Superior XBMX 7-234A 304450-03 Superior XBMS 7-234A 304450-03 Superior XBMS 7-234A 304450-03
Superior XBMS 7-234 303118-15 Superior XBMS 7-234 303118-15 Superior XBMS 7-234 303118-15
Superior XBMS 7-234A 304450-03 Superior XBMS 7-234A 304450-03 Superior XBMS 7-234A 304450-03
Zirtech XBMS 7-234 BF10059 Zirtech XBMS 7-234 BF10059 Zirtech XBMS 7-234 BF10059
Zirtecha XBMS 7-234 BF10059 Zirtecha XBMS 7-234 BF10059 Zirtecha XBMS 7-234 BF10059
Superior ~XBMS 7-234 304450 Superior XBMS 7-234 304450
• - -
Tool Max Max bend bend bend radius ovality thinout (in.) (%) (%)
Tube Tube 1.250 fracture fracture 1.500 .30 6.90 1.750 1.50 4.60
Tube Tube 0.750 fracture fracture 0.933 3.20 6.70 1.000 2.70 5.00
0.750 4.80 6.70 0.933 3.20 10.00 1.000 2.70 10.00
Tube Tube 0.750 fracture fracture 0.933 1.80 4.80 1.000 1.80 5.00
Tube Tube 0.750 fracture fracture 0.933 2.40 4.30 1.000 2.10 4.00
Tube Tube 0.750 fracture fracture 0.933 3.20 2.40 1.000 2.60 8.50
0.750 4.80 9.50 0.933 2.90 7.50
- ..

•
Nom1nal tube stze.
ODondWT Menufecturer Spectt.cation (in.)
1 •. 080 React•ve Metals XBMS 7-234
1 )( .080 Zirtoch XBMS 7 234
1 '.080 Bithop XBMS 7 234A
1 •. 033 Reactive Metals XBMS 7-203A
1 •. 033 Bishop XBMS 7-234A
5/B • .050 Zirtach XBMS 7 234
5/8 •. 050 SupertOt XBMS 7-234A
5/8 •. 021 Zirtech XBMS 7 234
5/8 •. 021 Superior XBMS 7-234A
3/8 •. 020 Zirtech XBMS 7-234
3/8 •. 020 Zirtech bXBMS 7-234
3/8 •. 020 SupeorK>r cXBMS 7-234
3/8 •. 020 SuperK>r XBMS 7-234A
3/8 •. 030 Superior XBMS 7-234A
aReQutrement of par•aph 6.8
Drube ID grit blasted ond chemically milled per Grumman requir~nts
cT ubeng ha crystallographic texture control
TABLE 14 -FLATTENING TEST RESULTS
Heat and lot no.
304450-03
BC9014032-125R
7()ol511-06
29480424
7()ol511-06
BF07058
304450-03
BF0705B
304450-{13
BF10059
BF10059
304450
304450-03
304450-03
OD ID OP c
00 to wall Distance thickness ratio, between
OD/t I ref) plates a
12.5 12t 0 0.96
12 5 12to0.96
12 5 12t 0 0.96
30.3 15t 0 0.495
30.3 1St o 0.495
12.5 121 ° 0.60
12.5 12t = 0.60
29.8 15t 0 0.315
29.8 15t 0 0.315
18 75 15t 0 0.30
18.75 15t "0.30
18.75 15t = 0.30
18.75 15t 0 0.30
12.5 12t = 0.36
outside diameter cc irtt.1de diametef orange peel ~pearance cracked one s•de
16t 14t
- -
- -
- -
0.53 in. 0.46 in. OD-S OD-S ID-S ID-S
0.53 in 0.46 in. OD-OP ODS
ID-S ID-S
- -
- -
0.33 in. 0.29 in. OD-C OD-C I D-C I D-C
0.33 in. 0.29 in. OD-S OD-S ID-S ID-S
0.32 in_ 0.28 1n. OD-S ODS ID-S ID-S
0.32 in. 0.28 in_ OD-S ODS ID-S ID-S
0.32 in 0.28 in. ODS OD-S ID-S ID-S
0.32 in_ 0.28 in OD-S OD-S ID-S ID-S
- -
cracked both Sides sat1sfactory wall th1ckneu (tn.)
12t 101
0.96 ,,., 0.80 In
ODS OD-01' ID-S IDS
0.96 In 0.80 in ODS ODS 10-0P IDS
0.96 in 0.80 in ODS ODS ID-S IDS
0.40 1n. 0.33 ln. OD-CC OD-CC I D-CC I D-CC
0.40m. 0.33 '"-OD-CC OD-CC
IDC&OP ID-C
0.60 in. 0.50 In
OD-S OD-S ID-S ID-OP
0.80 in 0.50 in OD-S OD-S ID-S IDS
0.25 in. 0.21 in. OD-CC OD-OP&C I D-CC I D-C
0.25 ln. 0.21 in. ODS OD-OP ID-S ID-S
0.24 In_ 0.20 in. OD-C OD-CC I D-C I D-CC
0.24 in. 0.20 in OD-S OD-CC ID-S ID-S
0.24 in. 0.20 in. OD-S OD-S ID-S ID-S
0.24 in_ 0.20 in. OD-S OD-S ID-S ID-S
0.36 in_ 0.30 In_ OD-S OD-S ID-S ID-S
-
8t Rei"NNrks
0.64 in Good S4.J rfaces. Tube ODS showed wttsfKtory resulh at St. IDS
0.64 in. OD hod b<igtlt surface. I D OD-CC h.ld suins after vacuum I D-CC annealing. Tube showed
satisf.:tory results at lOt.
0.64 in Good s.ur1ace but had striker OD-S marks. Tube showed satisfactory ID-S results at 1 Ot
10 had hM\Iy chem~at milling. - OD hod good surface, but had
fine sand .,...rks. Tube showed YtHifac:tory results at 14t.
OD and I D hM:I hoi!lly - chemical milling. Tube showed
satisfectory results at 14 t.
0.40 in. AW~rage surf.:a. Tube OD-CC showed satisfactory mutts I D-CC at lOt
0.40 in. Brighter end smoother surfece OD-S th•n 5/8 x .050 Zirtech. Tube ID-S showed s.atisf~etorv result!. tt 8t
Surfooos showed hoovy - chermcal milling. Tube was
unYtisfactory at 16t
Good surfeces with fine - Sanding 11\Mks on OD. Tube
showed Ytisfactory resulu at lOt.
Good ID surface. Tube - showed Ytisf.:tory results
ot14t.
Heavy chemical milling on 00. - 10 showed f.tlrication marks.
Tube showed satisfectory results at 12t.
Good surfoces. Tube - showed satisfactory
results at 1 Ot.
Good turf~ces with fine - und 11\Mks on OD. Tube
showed Ytisfactory results at 1 Ot.
0.24 in_ Good surfaces with very OD-CC fine Ynd marks on 00. I D-CC Tube showed s.tisfactory
results at lOt.

38
The l x .033 tubes were made by two manufacturers and to different specifications. Results showed the Bishop tubing per XBMS 7-234A to be the best; however, both are satisfactory at l4t, the acceptable value being 1St.
The S/8 x .OSO tubes were made by two manufacturers and to different specifications. Results show that Superior Tubing per specification XBMS 7-234A gave satisfactory results at 8t. The Zirtech tubing was also satisfactory at only lOt, the acceptable value being l2t.
The S/8 x .021 tubes were made by two suppliers and to different specifications. Results show that the Superior tubing per XMBS 7-234A was satisfactory at lOt, whereas the Zirtech tubing per XBMS 7-234 was unsatisfactory at l6t. The acceptable value is 1St.
The four types of 3/8 x .020 tubes were made by two suppliers and to different specifications. Results show both Superior tubes per XBMS 7-234 with texture control and per XBMS 7-234A to be the most satisfactory at lOt. The Zirtech tubes per XBMS 7-234 were satisfactory at 12t and l4t only. The acceptable value is 1St.
The 3/8 x .030 tube had limited quantities and only one size was tested. The Superior tube per XBMS 7-234A showed satisfactory results at 1 Ot, the acceptable value being l2t.
In summary, the results show that the texture-controlled tubing to the new proposed specification (XBMS 7-234A) has the best formability.
5.2 MECHANICAL PROPERTIES OF VARIOUS Ti-3Al-2.5V (CWSR) TUBES
The mechanical properties of various Ti-3Al-2.SV cold worked and stress relieved (CWSR) tubes were determined for design use and comparison between manufacturers. Tests were conducted on l x .080, l x .033, S/8 x .OSO, 3/8 x .030, and 3/8 x .020 in. tube sizes. All sizes were tested at room temperature, and, in addition, the S/8 x .OSO and 3/8 x .030 were tested at 4ScfF. Complete test results are shown in table lS.
Evaluation of the mechanical properties, based upon two tests in each size, shows good correlation on the ultimate tensile strength (Ftu) and yield strength (Fty) at 0.2% offset. Average room temperature values for Ftu were l23,2SO psi to 126,400 psi and for Fty were l 06,100 psi to lll ,200 psi. The specification minimum requirements for Ftu and Fty were l2S,OOO psi and lOS,OOO psi respectively. The 4S0° F values for Ftu were 97,900 psi to 100, ISO psi and for F ty were 83, ISO psi to 8S, 100 psi.
The modulus of elasticity values showed some variation when comparing two tubes of the same heat number and also the tubes made by different manufacturers.' Average room temperature values were 13.2S x 106. For accurate calculations the specific modulus of elasticity value for the tube being tested or analyzed should be determined by tensile tests per ASTM procedure E8-68.
c
•
•
•
•
•

- • - - - - -
TABLE 15.-MECHAN/CAL PROPERTIES OF VARIOUS Ti-3A/-2.5V (CWSR) TUBES AT RT AND 450° F Ultimate Yield Modulus of
Specimen Manufacturer Heat no. Lot no. Specification Length OD (in.) ID (in.) Area Test temp. strength, F tu Avg Ftu strength, F tv Avg tty elasticity, E Avg E (in ) (in.2) ("F) (ksi) (ksi) (psi X 1Q6)
1 Zirtech BF10059 - XBMS 7-234 7.25 0.3772 0.3338 0.0242 72 125.2 125.3 110.3 110.5 13.8 14.0 2 Zirtech BF10059 - X8MS 7-234 0.3772 0.3341 0.0241 72 125.4 125.3 110.7 110.5 14.2 14.0 3 Superior 304450 - axBMS 7-234 0.3781 0.3368 0.232 78 124.3 123.25 108.3 107.25 15.6 14.85 4 304450 - •xBMS 7-234 0.3781 0.3364 0.0235 ! 122.2 123.25 106.2 107.25 14.1 14.85 5 304450-03 1 X8MS 7-234A 03778 0.3338 0.0246 123.1 124.25 108.7 1.094 13.3 13.25 6
l l 0.3778 0.3342 00244 125.4 124.25 110.1 1.094 13.2 13.25
7 0.3775 0.3338 0.0244 450 97.7 97.9 83.1 83.15 12.1 12.5 8 0.3775 0.3342 0.0242 450 98.1 97.9 83.2 83.15 12.9 12.5
9-2 0.3782 0.3248 0.0345 78 132.0 31.85 115.3 116.05 14.0 13.95 10 7.25 0.3784 0.3148 0.0346 72 131.7 31.85 116.8 116.05 13.9 13.95 11 9.00 0.6285 0.5248 0.0939 450 99.2 1100.15 84.3 85.1 1 1.7 11.35 12 9.00 0.6280 0.5249 0.0928 450 101.1 00.15 85.9 85.1 11.0 11.35 13 Bishop 704511-06 1-1 11.70 1.0050 0.9378 0.1026 80 127.5 126.3 111.8 1 1 1.2 15.6 14.9 14 Bishop 70451 1 .()6 1·1 11.70 1.0045 0.9358 0.1047 80 125.1 126.3 110.6 111.2 14.2 14.9 15 Reactive Metals 304450-03 - XBMS 7-234 11.30 1.0052 0.8394 0.2402 82 123.8 126.4 103.9 104.65 14.1 14.5 16 Reacti~ Metals 304450-03 - XBMS 7-234 ! 1.0055 0.8428 0.2362 ! 129.0 126.4 105.4 104.65 14.9 14.5 17 ilillhop 704511-06 - XBMS 7-234A 1.0020 0.8464 0.2258 124.6 25.35 105.4 106.1 14.7 14.9 18 Bishop 704511-06 I - XBMS 7-234A 1.0025 0.8462 0.2269 126.1 25.35 106.8 106.1 15.1 14.9
"Tubing has crystallographic texture control

40
5.3 CHARACTERISTIC CURVES OF DEFLECTION VERSUS CYCLES AND STRESS VERSUS CYCLES FOR 1 x .080 SPECIMENS
The I x .080 characteristic curves for parts I and II showing deflection versus cycles and stress versus cycles were constructed from the rotary flexure test results in tables 6 and II, and are shown in figures 34 and 35, respectively. The test results from parts I and II are shown on the same figure so a direct comparison can be made.
The deflection versus cycle curve shows the deflection (double amplitude) used for the tests and cycles to failure or a maximum of I 0 7 cycles if no failure occurred. The stress versus cycle curve shows the calculated longitudinal stress at the point of failure and cycles. If no failure occurred the stress was calculated for the maximum stress at () = 90° and (jJ = 270° in the bend.
The deflection and stress curves indicate similar results. The Boeing tubing procured during the prototype SST program and the same tubing with the inside diameter finished per the Grumman and McDonnell-Douglas specifications showed no significant difference because the majority of failures originated on the OD surface, and therefore the improved ID finish would not increase the fatigue life.
The Bishop tubing tested in part II made to the new specification XBMS 7-234A did not give the expected fatigue life, but this was to be expected because of transverse sanding "striker" marks on the OD surface.
After evaluating these test results, 25 ft of tubing was returned to Bishop for additional chemical milling to improve the outside surface. Upon return to Boeing, the tubing surface was re-examined and was found to be improved, but still contained some sanding marks (see fig. 25). The flexure tests on this tubing showed some improvement, but the tubing did not meet the performance expected for texture-controlled and properly finished tubing. Additional chemical milling would have improved the OD surface, but could not be done in time for this program. Bishop reported that these marks originated with the hollows used and that experimentation with different chemical milling techniques is required to optimize this finishing method. It is on the basis of this experience that a pictorial requirement was added to the specification.
In addition to the surface condition, the poor tube texture indicated in table 10 and in the pole figures also likely contributed to the poor fatigue performance of this tubing. The R-ratio of 0.31 for the Bishop I x .080 tubing was considerably lower than for the RMI I x .080 tubing tested during part I (R = 0. 7 to 1.15).
The stress ratios for fatigue testing ranged from minimum of R = 0.330 toR= 0.420 (appendix B). This range is considered essentially constant and results in a good S-N curve.
f!
f!
c:
Cl
•
•
•
•
•

)
)
'
,
5.4 CHARACTERISTIC CURVES OF DEFLECTION VS CYCLES AND STRESS VS CYCLES FOR 3/8 X .020 SPECIMENS
The 3/8 x .020 characteristic curves for parts I and II showing deflection vs cycles and stress vs cycles were constructed from the rotary flexure test results in tables 6 and 11, and are shown in figures 36 and 37. The test results from parts I and II are shown on the same figure so a direct comparison can be made.
The deflection vs cycle curve shows the deflection (double amplitude) used for the tests and cycles to failure or a maximum of 1 0 7 cycles if no failure occurred. The stress versus cycle curve shows the calculated circumferential stress at the point of failure and the number of cycles. If no failure occurred, the stress was calculated for the maximum stress at () = 90° and tP = 0° in the bend.
The tests conducted in part I were on the Boeing tubing procured during the prototype SST program and the same tubing with the inside diameter finished per the Grumman and McDonnell-Douglas specifications. The tubes made per the Grumman specification, which specified grit blasting and chemical milling on the ID surface, showed a significant improvement in fatigue life over the as-processed tubing, as did the pressure-tested tubing. In addition, the Superior tubing made per XBMS 7-234 with crystallographic texture control was evaluated, and results showed better fatigue properties than for the Boeing tubing with the ID reworked to the Grumman specification. The Superior tubing ID had been grit blasted and chemically milled.
The tube failures originated on the ID surface and in the neutral axis as predicted by the stress analysis {appendix B). The outside surfaces showed some sanding marks, which were not considered serious to this test because the failures were predicted to originate on the ID. Based on the results in part I the new proposed specification XBMS 7-234A with the crystallographic texture control was used for part II.
The tests conducted in part II (specimens 6RST-l through -8) showed good fatigue life, but slightly lower than that of the texture-controlled tubing tested in part I. The comparison of the pole figure results for parts I and II shown in figures 6 and 7, respectively, shows that the tubing used for part I had better texture. The texture difference was also demonstrated in the R-ratio values for the respective tubes. The tubing of part I has R values ranging from 0.73 to 0.94, whereas the tubing with the lower fatigue performance had an R value of 0.49.
The fatigue stress ratios ranged from a minimum of R = 0.039 to R = 0.150. This range is considered essentially constant and results in a good S-N curve.
41

,
)
,
6.0 'CONCLUSIONS
I. The data indicate that the new requirements of ultrasonic inspection, surface finish, and crystallographic texture for titanium 3Al-2.5V CWSR tubing ensure an improved and reliable performance in hydraulic flexure and impulse testing of tubing bends and tubefitting assemblies. The incorporation of more stringent controls on tubing starting stock is also expected to result in an improved and consistent quality product.
2. Fatigue testing of 120° bends and impulse testing at 450° proved to be a good method to evaluate different tubing textures and surface finishes.
3. Color anodizing and formability tests were not found to be sensitive criteria for inspection of tubing texture.
4. Basal plane pole figures and R-ratio data were found to be good methods for analysis and inspection of tubing texture. The R-ratio measurements were affected, however, by the equipment and operating technique used and will require continued improvement and refinement.
5. Requirements for chemical milling and RHR surface finish alone were not sufficient to ensure a good surface. Until chemical milling or other surface finishing methods are further developed, a pictorial surface finish requirement will be needed.
6. The texture developed in Ti-3Al-2.5V tubing can be generally correlated to the ratio of diameter reduction to wall reduction. __ .J
\
43

l
,
•
,
)
7.0 RECOMMENDATIONS
I. To achieve the same texture (R-ratio) in various tube sizes, 5/8 x .021 and 5/8 x .050 in. for example, different starting stock would be used to achieve the same degree of metal working. This is indicated by the good performance and R-ratio of thin-walled tubing compared to the poorer performance and R-ratio for heavy-walled tubing in the 3/8-in. tubing tested.
2. The techniques and tools for measuring the R-ratio of tubing texture require further development.
3. The optimum tubing texture and texture control should be established by systematic study and test. Fatigue properties should be determined for tubes with markedly different textures, and the effects of annealing cycles, reduction ratios, drawing, rolling, and extruding evaluated to quantitatively determine their effects on texture development.
4. The efficiency of ultrasonic inspection and/or other NDT methods should be improved.
5. The chemical milling techniques should be evaluated and optimized.
6. The degree of additional optimization of titanium tubing by shot peening should be established and the effects of residual stresses in the tubing further evaluated.
7. The above-mentioned recommendations for further work should not delay the acceptance of the new specification criteria by the industry and the military services. It is recommended that the proposed specification (appendix A) be the basis for a military specification for hydraulic tubing.
45

46
REFERENCES
I. Completion of Items of Test and Evaluation Work Which Were Nearing Completion at Termination of Contract FA-SS-67-3, DOT-FA-SS-71-12, Task 6B, June 30, 1971.
2. SST Technology Follow-On Program-Phase I, Welded Permanent Fittings for Titanium Hydraulic Tubing, Boeing document D6-60261, October 1972.
3. SST Technology Follow-On Program-Phase I, Reconnectable Titanium Fittings with Weld-Attached Sleeves for the Hydraulic System, Boeing document D6-60262, October 1972.
4. SST Technology Follow-On Program-Phase I, Repair Fittings and Repair Techniques for the Titanium Hydraulic Tubing, Boeing document D6-60264, October 1972.
5. Boeing Specification XBMS 7-234, "Titanium 3Al-2.5V Seamless Tubing for Hydraulic Systems, Cold Worked and Stress Relieved."
6. Boeing Specification BAC 5423, "Penetrant Methods of Inspection."
7. Boeing Specification ARP 1185, "Flexure Testing of Hydraulic Tubing Joints and Fittings."
8. Boeing Specification BAC 5439-2, "Ultrasonic Inspection of Tubing."
9. SST Technology Follow-On Program-Phase I, Titanium Alloy 6Al-4V and 3Al-2.5V Hydraulic Tubing, Boeing document D6-60205.
f
f
•
•
•

(a) Rough Surface of Tubes 4, 5, and 6 (20X)
)
)
(b) Smooth Surface of Tube 7 (Superior) (20X)
See table 2 for tube description
FIGURE 1.-TYPICAL 3AI-2.5V CWSR TITANIUM TUBE SURFACE CONDITION
47

48
Tube 4 (Zirtech) As Received Surface Condition (Detergent Clean+ "Flash Pickle") (20X)
Tube 6 (Zirtech) Grit Blast+ Chern Mill (20X)
Tube 7 (Superior) Grit Blast+ Chern Mill (20X)
FIGURE 2.-SURFACE CONDITION OF THE 3AI-2.5V CWSR TITANIUM TUBING AFTER SPECIAL FINISHING
fl
fl
c;
•
•
•
•
•

)
,
(a) Transverse Beam Direction (60X)
fi!"'
(b) Transverse Beam Direction (240X) (c) Longitudinal Beam Direction (260X)
(. ['··· ....• ' · ...••..• ,·.···;d) Longitudinal beam direction
(d) Transverse Beam Direction ( 1200X) Transverse beam direction (e)
FIGURE 3.-SCANNING ELECTRON MICROGRAPHS OF 10 SURFACE OF TUBE 4-AS-PROCESSED SURFACE FINISH
49

50
(a) Transverse Beam Direction (60X)
(b) Transverse Beam Direction (240X) (c) Longitudinal Beam Direction {260X)
~-.'---:--.·.·.·· .. ·.·.· .. :-:-:-:····.-... -.·~ ('.:.·.f ........ ·.·.·.·.·.·.·.·.··:-···.-.-.·.·.-............. ;.;.<::::::: ..
Longitudinal beam direction
Transverse beam direction
(d) Transverse Beam Direction ( 1200X) (el
FIGURE 4.-SCANNING ELECTRON MICROGRAPHS OF ID SURFACE OF TUBE 6
AFTER SPECIAL FINISHING
f
('
•
•
•
•

•
,
)
•
•
(a) Tube 1-Transverse Section
, . :' ~. ~ ·' •.• 'tl' . .; .
(b) Tube 2-Transverse Section
(c) Tube 3-Transverse Section
FIGURE 5.-PHOTOMICROGRAPHS SHOWING SECTIONS AND SURFACE OF TYPICAL AND SPEC/ALLY FINISHED TITANIUM TUBING, 3/8 SIZE, TUBES 1, 2, AND 3 (500X)
51

52
Tube 4-Transverse Section
Tube 4- Longitudinal Section
. '
' ~ . ' Tube 5-Transverse Section
Tube 6-Transverse Section
FIGURE 6.-PHOTOMICROGRAPH SHOWING SECTIONS AND SURFACE OF TYPICAL AND SPEC/ALLY FINISHED TITANIUM TUBING, 3/8 SIZE, TUBES 4, 5, AND 6 (500X)
f
fl
•
•
•

,
)
)
Unit Cell of Titanium
Hexagonal close-packed structure
Circumferential Texture of Basal Plane Poles
Random Texture of Basal Plane Poles
Radial Texture of Basal Plane Poles
Basal plane pole
Cross-section through a tube
FIGURE 7-CRYSTALLOGRAPHIC TEXTURE IN TITANIUM TUBES
53

54
Where: R
Ln f 0
OD w
strain ratio natural log final dimension, after testing original dimension, before testing outside diameter (average of several measurements) wall thickness (average of at least four measurements around circumference)
Note: All dimensions in inches
ODf (Outside diameter after tensile test)
FIGURE B.-METHOD FOR MEASURING STRAIN RATIO "R"
•
f
f
•
•
•
•

,
,
Contour lines Times random X-ray intensity
5 I 4.0
FIGURE 9_-BASAL PLANE POLE FIGURE FOR 1 X .080 IN. RMI TUBE (TUBE 1 PER TABLE 4)
55

56
Contour lines Times random X·ray intensity
.5
2
1.0
3 4 5
1.5 2.0 4.0
FIGURE 10.-BASAL PLANE POLE FIGURE FOR 3/8 X .020 IN. ZIRTECH TUBE (TUBE 4 PER TABLE 4)
f
t
•
•
•
•

)
)
.)
'
,
)
Contour lines Times random X-ray intensity
.5
2
1.0
3 4 5
1.5 2.0 4.0
FIGURE 11.-BASAL PLANE POLE FOR 3/8 X .020 IN. SUPERIOR TUBE (TUBE 7 PER TABLE 4)
57

58
Contour lines
Times random X-ray intensity
.5
2
1.0
3 4 5
1.5 2.0 4.0
FIGURE 12.-BASAL PLANE POLE FIGURE FOR 5/8 X .040 IN. SUPERIOR TUBE (TUBE 8 PER TABLE 4)
c
f
•
'
•

)
)
,
Contour lines Times random X-ray intensity
.5
2 3
1.0 1.5
FIGURE 13.-BASAL PLANE POLE FIGURE FOR 3/8 X .030 IN. ZIRTECH TUBE (TUBE 8(B) PER TABLE 2)
59

60
Contour lines Times random X-ray intensity
.5
2
1.0
3 4 I 5
1.5 2.0 l 4.0
FIGURE 14.-BASAL PLANE POLE FIGURE FOR 5/8 X .021/N. ZIRTECH TUBE (TUBE E PER TABLE 4)
(j
f
f

•
Contour lines
Times random
X-ray intensity .5
2
1.0
3 5
1.5 4.0
FIGURE 15.-BASAL PLANE POLE FIGURE FOR 5/8 X _050 IN ZIRTECH TUBE (TUBE F PER TABLE 4)
61

62
Contour I i nes
Times random
X-ray intensity .5
2
1.0
3 4 5 I 1.5 2.0 4.0 I
FIGURE 16.-BASAL PLANE POLE FIGURE FOR 1 X .033 IN. RMI TUBE (TUBED PER TABLE 4)
f
t'
•
•
•
•

)
.t
)
•
• Contour lines
Times random X-ray intensity
FIGURE 17.-BASAL PLANE POLE FIGURE FOR 1 X .0331N. RMI TUBE (TUBE G PER TABLE 4)
63

64
Contour lines Times random X-ray intensity
I 2
.5 I 1.0
3 4 5 I 1.5 2.0 4_o 1
FIGURE 18.-BASAL PLANE POLE FIGURE FOR 1 X .0331N. RM! TUBE (TUBE H PER TABLE 4)
•
•
•
•
•

- - - - - -
Dimensions in inches
[!:> Measured after forming
FIGURE 19.-DIMENSIONS FOR 3/8-IN. BENT TUBE SPECIMEN

l
•
.? .Ia
I I
Dimensions in inches
CJ::>. Measured after form111g
FIGURE 20.-DIMENSIONS FOR 1-IN. BENT TUBES SPECIMEN
.. .. - - -

- - -
FIGURE 21.-1-IN. BENT TUBE FLEXURE TEST SETUP

FIGURE 22.-3/8-/N. BENT TUBE FLEXURE TEST SETUP
• - -

(a) Tube 4, As-Received Finish, (20X)
( b)Tube 6, G rit-Biasted and Chemically Milled Finish (20X)
(c) Tube 7, Texture-controlled Tubing, Grit-Blasted and Chemically Milled Finish (20X)
See table 2 for tube description
FIGURE 23.- TYPICAL LONGITUDINAL CRACKS WHICH OR/GINA TED ON ID OF 3/8- x .020-in. TUBING WITH THREE DIFFERENT FINISHES
69

70
(<J) Cr<Jck Origin<Jtr:d in <J Pit ( 13X)
(b) Crack Originated in a Scratch (20X)
FIGURE 24.- TYPICAL TRANSVERSE CRACKS WHICH OR/GINA TED ON OD OF 1 X .080-/N. TUBING
(!
fl
Cl
•

,
•
Tube 1
3/8 in. x 0.20 in. 2160-0-4 20X
Tube 2
3/8 in. x 0.030 in. 2160-0-5 20X
Tube 3
5/8 in. x 0.021 in. 2160-0-6 20X
FIGURE 25.-0D SURFACE FINISH SHOWING SANDING MARKS (20X)
71

See tables 7 and 8 for tube description
FIGURE 25.-Conc/uded
72
Tube4
5/8 in. x 0.050 in. 2160·0·7 20X
Tube 5
1 in. x 0.033 in. 2160·0·8 20X
Tube 6
1 in. x 0.080 in. 2160·0·9 20X
fl
fl
t
•

As Received Per Specification From Bishop Tube Co.
After Additional Chemical Milling by Bishop Tube Co.
FIGURE 26.-COMPARISON OF OD FINISHES ON BISHOP 1.0 X .080 TUBING (20X)
73
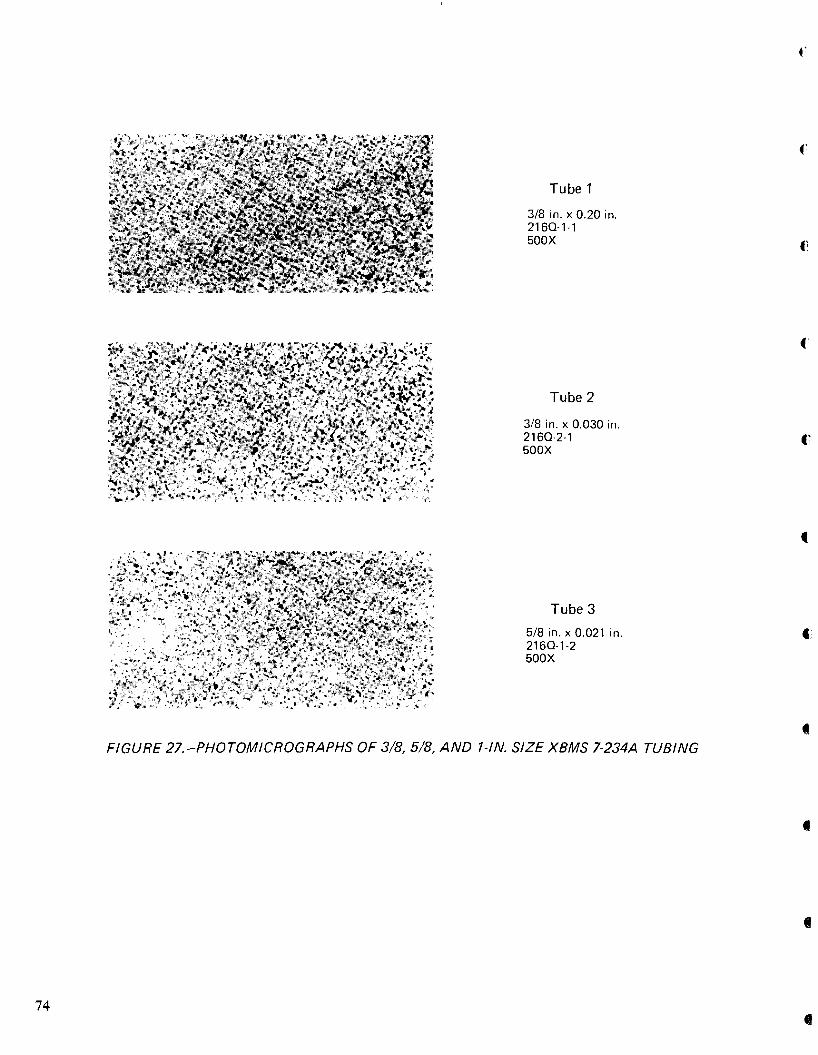
74
Tube 1
3/8 in. x 0.20 in. 2160-1-1 500X
Tube 2
3/8 in. x 0.030 in. 2160-2-1 50 0X
Tube 3
5/8 in. x 0.021 in. 2160-1-2 500X
FIGURE 27.-PHOTOMICROGRAPHS OF 3/8, 5/8, AND 1-IN. SIZE XBMS 7-234A TUBING
f
•
•

See tables 7 and 8 for tube description
FIGURE 27.-Concluded
•
Tube 4
5/8 in. x 0.050 in. 2160-2-2 50 0X
Tube 5
1 in. x 0.033 in. 2160-1-3 500 X
Tube 6
1 in. x 0.080 in. 2160-2-3 500X
75

76
Contour lines Times random X-ray intensity
5
4.0
FIGURE 28.-BASAL PLANE POLE FIGURE FOR 3/8 X .020 IN. SUPERIOR TUBE (TUBE 1 PER TABLE 7)
f
c
c
'
•

• Contour lines
Times random X-ray intensity
FIGURE 29.-BASAL PLANE POLE FIGURE FOR 3/8 X .030 IN. SUPERIOR TUBE (TUBE 2 PER TABLE 7)
77

78
Contour lines
Times random
X-ray intensity .5
5
4.0
FIGURE 30.-BASAL PLANE POLE FIGURE FOR 5/8 X .020 IN. SUPERIOR TUBE (TUBE 3 PER TABLE 1)
f
f
•
•

)
•
•
•
Contour lines Times random X-ray intensity
5
4.0
FIGURE 31.-BASAL PLANE POLE FIGURE FOR 5/8 X .050 IN. SUPERIOR TUBE (TUBE 4 PER TABLE 1)
79

80
Contour lines
Times random X-ray intensity
4
2.0
5
4.0
FIGURE 32.-BASAL PLANE POLE FIGURE FOR 1 X .033 IN. BISHOP TUBE (TUBE 5 PER TABLE 7)
f
f
•
•

,
•
•
Contour lines
Times random
X-ray intensity
2
3 4:::::====:::=:::::=:::::::::::::::::::
.5
5 4
2
1.0
3
1.5
4 5
2.0 4.0
FIGURE 33.-BASAL PLANE POLE FIGURE FOR 1 X .080 IN. BISHOP TUBE (TUBE 6 PER TABLE 7)
81

00 N
1.80
1.60
1.40
Deflection (in.)
(double amplitude)
1.20
Part I tests ' ~1\ ... ._ : I ,
\ \\\ \ ' ',\ \' \ \\ '
;-\~- \ .. '\, \ .. ,,... . '"'-,...... \. ~~ -..._, ________ _ ~~~---. . ...__ ___ _
Part II tests
•
Grumman 16PB-G 1 through -G8 McDonnell Douglas 16PB-M 1 through -M8 Boeing 16PB-B 1 through -B8 Bishop 16PB-T1 through -4 [:::> Bishop 16 PB-T5 through -7 ~
0
Bishop texture-controlled tubing per XBMS 7-234A, made on best-effort basis
•
Sames as [::>: Except additional chemical milling done by Bishop to improve the OD surface finish
1.00 ~------._ __ _. __ ~~~~_.~~------~--_.--~~--~~~L-------~--~~_.--~L-~~
104
Cycles to failure
FIGURE 34.-FLEXURE FA TIGUE COMPARISON FOR 1 X .080 IN. TUBING, DEFLECTION VS CYCLES TO FAILURE
- - -

00 w
Longitudi na I stress (ksi)
• -
7or--------------------------------------------------------------------------------, Grumman 16PB-G 1 through -G8
60
50 \ \
'
' ' 40 '
30
\\ \\
Part I tests
Part II tests
•
{ -·-·-. ----· • { -·--··-. ------0
McDonnell Douglas 16PB-M 1 through -M8 Boeing 16PB-B 1 through -B8 Bishop 16PB-T1 through -4 [i>. Bishop 16PB-T5 through -7 ~
J,\,:\ . ~~ ------------------
~-•• 0
-----~-----
Bishop texture-controlled tubing per XBMS 7-234A, made on best-effort basis
Sames as [!:::>. Except additional chemical milling done by Bishop to improve the OD surface finish
20L------~-~--~~--~~~L-------~-----~~-L-~~~~-------L----L-~~~~~~~
104 105 106 107
Cycles to failure
FIGURE 35.-FLEXURE FA TIGUE COMPARISON FOR 1 X .080 IN. TUBING, LONGITUDINAL STRESS VS CYCLES TO FAILURE

•
QJ
"0 ::;
.':::' 0. E "' QJ
:0 ::; 0 "0
c 0 .B QJ -QJ
0
1.80.----------------------------------------------------------------------------------------------,
1_60
1.40
1.20
1.00
•
00 0 \
' ' ' ' ' ' ' '
Part I tests
Part II test 1=-==---=: ----· -------- 0
Grumman 6RB-G1 through -G8 McDonnell Douglas 6RB-M1 through -M8 Boeing 6RB-B1 through -88 Superior 6RS-1 through -8 f1:::> Superior 6RST-1 through -8l:Z:>
[!::>-Superior texture-controlled tubing per XBMS 7-234A, made on best-effort basis
[}:::::>-Superior texture-controlled tubing per XBMS 7-234 made on best-effort basis
• ,.~ca-. • ". ' ~~ ......... ........... ~ ............
,~....... ~ .....
•
........;: .......... .......
~ --- ~ ~ ----------- ----------.~~ .. ----------------~--------......
---------·--- -.. ·~---
Cycles to failure
FIGURE 36.-FLEXURE FATIGUE COMPARISON FOR 3/8 X .020 IN. TUBING DEFLECTION VS CYCLES TO FAILURE
-
• 0 --(3)
•o --(2)
-

• • ..
65
60
V> .:.t.
V> V>
~ +-' V>
.'!! +-' c: 55 ~ C1> ..... E ::J
~ u
50
45
- -
., p,, I '"" { - - ~-=-
• Grumman 6RB-G1 through -G8 ., • McDonnell Douglas 6RB-M1 through -M8 \~ • Boeing 6RB-B1 through -88
• Superior 6R S-1 through -8 ~ \ Part II tests ------- 0 Superior 6RST-1 through -8 \
\ \ ~Superior texture-controlled tubing per
\ XBMS 7-234A, made on best-effort basis
• ·~·· -...........,, • [!::::>-Superior texture-controlled tubing per ". ~ XBMS 7-234 made on best-effort basis ,,, .....
~ ' ' ~ ' ............ . ,~,, ----' ' ~ '
~ ....... --~------------------' ' •
' ..........
...........
' ............
".......... ........... ....._ __ ..... ~ ---
• -- ·--•
Cycles to failure
FIGURE 37.-FLEXURE FA TIGUE COMPARISON FOR 3/8 X .020 IN. TUBING CIRCUMFERENTIAL STRESS VS CYCLES TO FAILURE
•• (3)
•• (2)
APPENDIX A PROPOSED TUBE SPECIFICATION XBMS 7-234A
,
)
•
87

r-------------------------~~----------~-----------------------
1. SCOPE
2.
a. This specification covers T1-3Al-2.5V aeaaleas tubing in the cold worked and stress relieved condition. The tubing is intended for use in Type I and Type II hydraulic systems per MIL-H-544o and at temperatures not exceeding 6ooF.
b. This specification required qualified products.
REFERENCES
Except where a specific issue is indicated, the issue of the following references in effe~ on the date of invitation for bid shall form a part of this specification to the extent indicated herein.
a. AMS 2249 - Chemical Check Analysis Limits, T1 tanium and T1 tanium Alloys
b. ARP 6o3 - Impulse Testing of Hydraulic Hose Assemblies, Tubing, Coils, Fittings and Similar Fluid Systems Components
c. ARP 1258 - ~lification of HYdraulic Tube Joints to Specified Flexure Fatigue Requirements
d. ASA B46-l - Surface Texture (Surface Roughness, Waviness and Lay)
e. AS'IM B338-65 - Specification for Seamless and Welded Titanium Tube for Condensers and Heat Exchangers.
.#> AS'IM E-8 - Tension Testing of Metallic Materials ....
g. AS']lllt E-120 - Methods of Chemical Analysis for Titanium and Titanium Al.loys
h. ASTM E-146 - Chemical Analysis of Zirconium and Zirconium Base Alloys
1. BAC 5423 - Penetrant Methods of Inspection
BY W.E. Quist & W.J.i'.Spurr TITANIUM 3Al-2. 5V SEAMLESS TUBIBG FOR HYDRAULIC SYSTEMS, COLD \IK)JICID & STRESS RELIEVED
CHECKED _________ _
ENGINEERINC ------1--------------- -·-- _____ _ QUAL. CONTROl IOEING ------MATERIEL lA TERIAL SPECIFICl TION
PROPOSED
IMS 7-234A
PAGE 1 ~- ----------------~---------------~
88 1'\BI,.ILJ&I 1ao•111P
f
f
f
t'
('
f'
•

•
•
2.
3.
3.1
3.1.1
3.1.2
(Continued)
j. BAC 54 39-2 - Ultrasonic Inspection of Tubing
k. MIL-H-5440 - HYdraulic Systems, Aircraft, T,ypes I and II, Design, Installation, and Requirements for
1. MS 33611 - Tube Bend Radii
MATERIAL REQUIREMENTS
GENERAL
Tube Hollows
a. Material used to manufacture tube hollows shall multiple melting consumable electrode practice. stage shall be melted in vacuum. One stage may inert gas under slight pressure.
be produced by At least one
be melted in
b. Preparation procedures and inspection criteria for tube hollows shall be reviewed and approved by The Boeing Company or procuring agency.
c. The metallurgical condition of tube hollows shall conform to a fine grained uniform microstructure.
d. The I.D. and O.D. of the tube hollows shall be free from cracks, seams, laps, laminations, tears, and similar defects as determined by visual, and ultrasonic inspection methods per sections 6.l.a, and 6.3. Tube hollows shall be fluorescent penetrant inspected on the O.D. per section 6.2, and shall meet inspection requirements of BAC 5423 Category C. Ultrasonic inspection shall conform to the requirements of BAC 5439-2, Class C-10.
Finished Tubes
a. All finished tubes shall be produced from tube hollows that meet the tube hollow requirements of this specification.
b. Tubing shall be of uniform quality and condition and shall be free from cracks, seams, laps, laminations, tears, pits, and grinding or sanding marks as tvell as other.defects.which do not conform to the limits given in Section 3.10.
c. The metallurgical condition of each tube shall be fine grained equiaxed microstructure with no evidence of Widmanstatten structure as determined by the method in Section 6.l.b •
BMS 7-234A PAGE ____ 2 _______ 89

90
(Continued)
d. The final reduction operation shall be performed by plug drawing - preferably (not leas than 5~ wall reduction) or rod drawiDg [I) (not less than 10~ wall reduction) to the finiahed size. Free einkiDg or tube rolling to the final aize shall be prohibited.
e. All finished tubes shall be penetrant inspected on the O.D. in accordance with Section 6.2 and ultrasonically inspected in accordance with Section 6.3. TUbe wall thickness of 0.046 and under shall meet Claas A-2 standards. TUbe wall thickness of greater than o.o46 shall meet Claaa B-3 standards.
3.2 CHEMICAL COMPOSITION
Chemical compoai tion ahall conform to the requirements of Table I when analyzed per Section 6 .lf.. ltYdrogen, oxygen and nitrogen shall be certified for each lot fl> . Check analysis shall be per AMS 2249.
TABLE I - CBDUCAL COMPOSITION
ELEMENT WEIGllT PERCENT
Aluminum 2.5 - 3·5
Vanadium 2.0 - 3·0
Iron o. 30 (-.x.)
Carbon 0.05 (max.)
ltYdrogen 0.015 (max.)
Oxygen 0.12 (max. )
Nitrogen 0.02 (max.)
Other Elements, Total o.4o (max.) IT> Titanium Rem.inder
Reed not be reported. A:tly individual element ahall aot exceed 0 .10~.
3 • 3 HRAT TREA'DCDT
All tubiDg shall be cold worked and atre•• relieved at a miniaum teJIII!!£&ture of 7001 for not leas than 30 ainutea.
l};> Free &inking of 2% maximum is permissible after rod drawing. C[> A lot ~. defined as tubing of the same diameter
and wall thickness m.de froa one beat of material, proceaaed in a sillilar manner and stress relieved together.
BMS 7-234A PAGE_""'"3 ___ _
Cl
('
•
•

•
3.4 MECHANICAL PROPERTIES
Material Condition
Annealed Tube Hollow
Cold Worked & Stress Relieved Tubes
The room temperature mechanical properties of tube hollows and finished tubing shall conform to the requirements of Table II when tested in accordance with Section 6.5. The properties of finished tubing shall be determined on one specimen per 1000 teet of tubing in each lot with a minimum of three specimens per lot. Testing shall be done using the full cross-section of the tubing.
TABLE II MECHANICAL PROPERTIES
Ul t . Tensile Strength (ksi)
90 (min) 110 (max)
125 (min)
Yield Strength at 2~ Of'fset
(ksi)
75 (min) 95 (max)
105 (min)
Elong. in 2 in. (~)
R =
Strain Ratio: R
onf . wr In -Ln UUO· ~
10.0 5/8 & under - .6 min. over 5/8 - 1.0 min.
3.5 FLARE TEST
One specimen for each ten (10) tubes in each lot with a minimum or five (5) specimens taken from different tubes shall be tested per Section 6.6. The tubing shall be capable of being flared to a minimum of 1.2 times the original diameter withoutcra~ing or tearing of the material.
3. 6 HYDROSTATIC PRESSURE RESISTANCE
Three (3) specimens from each lot shall be tested per Section 6.7. The tubee shall exhibit no leaking, cracking, or permanent set exceeding 0.002 inch per inch of diameter.
3. 7 FlATTENING TEST
A.DX Ht2 8· R 1
One specimen tor each ten ( 10) tubes in each lot with a minimum ot five (5) specimens taken from different tubes shall be tested per Section 6.8. The tubing shall show no evidence of cracking or tearing when examined at 5X magnification.
BMS 7-234A PAGE __ 4 ___ 9_1

92
3.8 BENDING TEST
One specimen per 1000 feet of tubing in each lot with a minimum of three (3) specimens per lot shall be tested per Section 6.9. The tubing shall show no evidence of cracking, open sanding striations or tearing when examined at 5X magnification.
3.9 RESIDUAL STRESS
Three (3) specimens from each lot of tubing shall be tested per Section 6.10. The tubing shall not have more than 15 ksi residual hoop stress.
3.10 SURFACE CONDITION OF FINISHED TUBES
3.11
3.11.1
3.11.2
a. One specimen from each of ten (10) tubes from each lot shall be tested per Section 6.l.b. If there are fewer than 10 tubes in the lot, each tube shall be examined. Outside and inside surfaces of tubing shall be free from a brittle layer (alpha-case).
b. Surface roughness of tubing shall not exceed 32 RHR on the inside and outside surfaces. Grinding, buffing, and polishing of the surface is not acceptable following the final reduction operation. The as-drawn O.D. surface shall have a minimum of 0.002 inches removed by chemical milling. The appearance of the O.D. surface (at 20X) shall not display residual sanding or grinding marks nor pitting (from the chemical milling operation) in excess of the examples shown in Figure 1. The I.D. of the tube shall show a uniform matte finish and shall be achieved by grit blasting a minimum of 0.0005" from the surface followed by a chemical milling operation to remove an additional 0.0005" minimum. No additional abrasive treatments shall be applied.
c. Tubing containing any type of defect greater than 0.002 inches in depth shall be rejected.
TOLERANCES
Wall Thickness Tolerances
The wall thickness tolerance of the tube hollows shall not exceed ± 10.0%. The wall thickness tolerances of finished tube shall not exceed ± 7. 5% or ± 0 .002" whichever is greater.
Outside Diameter Tolerance
Outside diameter tolerances for tubing shall be as specified in Table III. These tolerances include ovality.
BMS 7-234A PAGE __ 5 ___ _
t!
f

(a) Unacceptable degree of residual grinding and sanding marks on chemically milled tube.
20X
(b) Limit of acceptability for residual grinding and sanding marks on chemically milled tube.
20X
(c) Limit of acceptability forpitting from the chemical milling operation.
20X
FIGURE 1.-THESE PHOTOGRAPHS ILLUSTRATE ACCEPTABLE AND UNACCEPTABLE OD SURFACE FINISHES FOR Ti-3AI-2.5V TUBING.
93

94
3.11. 2
3.11. 3
(Continued)
TABU: III
0. D. TOLERANCES
Nominal Outside Diameter (Inches)
up to .093
.094 to .187
.188 to .499
.500 to .999
1. 000 to 1. 499
1.500 to 2.000
Straightness Tolerances
Diameter Tolerances (Inches)
+ .002, - .000
+ .003, - .ooo
+ .oo4, - .ooo
+ .005' - .000
+ .007' - .ooo
+ .010, - .000
Tubing shall not deviate from straightness by more than 0.025 inch per foot length nor more than 0.125 inch in any five foot length.
4. QUALIFICATION
a. All requests for qualification shall be directed to a Materiel Department of The Boeing Canpany 1 which will request data and samples when desired for qualification purposes. In general, data indicating compliance with all requirements of this specification for a minimum of 3 different tubing sizes from two different beats will be required.
b. After review of supplier data or Boeing tests, the supplier will be advised as to whether product approval has been granted. Qualified products will be listed in the EMS Qualified Products List.
c. No changes in raw material or methods of manufacture shall be made without notification and prior written approval. Aequalification of the revised material may be required and a revised supplier designation may be requested. Qlalified products will be listed in the BMS Qualified Products List.
BMS _ __,7.._--2...._34 .... AL...-_ PAGE_7_·_. __ _
f'
•
•

•
4. (Continued)
d. HYdraulic performance tests may be conducted to decide whether desired changes in surface condition, tube processing or other requirements conform with the intended use as stated under {1) Scope. As a minimum, the conventional impulse and flexure tests as required for tubing assemblies per ARP 6o3 and APR 1258 shall normally be conducted.
5. QUALITY CONTROL OF TUBE HOLroWS & FINISHED TUBES
5.1 SUPPLIER QUALITY CONTROL
a. Unless otherwise stated on the purchase order, the supplier shall furnish three (3) copies of a test report containing test data showing conformance to the requirements of this specification.
b. The test report shall also include the purchase order number, Boeing Material Specification number (including revision letter), heat number, lot number, size and quantity of tubes from each lot and & statement that all requirement• of this specification have been met.
c. The supplier shall maintain processing records for not less than five (5) years for all material including starting stock certification, number and amount of each tube reduction, Quality Control inspection and any other information which may influence the quality of the end product.
Non-proprietary processing information shall be made available to The Boeing Company on request.
5.2 PURCHASER QUALITY CONTROL
ADX 3492 B·R 1
a. Purchaser Q.lali ty Control shall perform tests to insure conformance to the requirements of Sections 3.1.2.e, 3.4, 3.10.b, 3.10.c and 3.11.
b. Purchaser Quality Control Department shall review supplier test reports and may conduct additional tests as deemed necessary to assure that tubes meet the requirements of this specification.
c. Complete records shall be maintained by Purchaser Q..ality Control Department and will be made available to The Boeing Company on request.
BMS _ _._7-....;;;2......,34_A __ 8 95 PAGE ____ _

96
6. TEST METHODS
6.1 SURFACE CONDITION
a. Each tube hello~ and finished tube shall be visually inspected for compliance ~ith surface condition requirements per Section 3.l.l.d and 3.1.2.b.
b. Specimens of the finished tube shall be exami:aed in full cross section metallographically at a magnification of 500-750X for microstructure and evidence ot a brittle surface layer (alpha case). The specimens shall be etched in an aqueous solution containing 1 volume percent hydrofluoric acid and shall conform to the requirements of 5.10.a.
c. The finish of the inside and outside surfaces of each tube shall conform to the requirements of Section 3.10.b as defined by ASA E46-l.
6. 2 PENETRANT INSPECTION
Tube hollo~s shall be inspected per BAC 5423 category C and finiahed tubes shall be inspected per BAC 54231 category B to meet the requirements of Sectiona 3.1.1.d and 3.1.2.e.
6. 3 ULTRASONIC INSPECTION
a. All tube hollo~s and finished tubing shall be inspected for inside and outside defects per the procedures of BAC 5439-2 and Sections 3.1.1.d and 3.1.2.e tor all types and orientations of defects including longitudinal, transverse and herring bODe. The tubing shall be inapected by scanning in both direction• tor longitudinal and transverse defects it t~o transducers are used. If tour transducers are used and the transducers are positioned from oppoaite directions, the tubes need only be so&aaed in one direction. Pbr herringbone type detect inspection in finished tubes the tranaducer(s) shall be pcaitioned ~ith herringbone reference standard per J.l'igure 1.
b. For finished tubes, the standard notches shall be Clasa A-2 per BAC 5439-2 tor ~all thicknesses less than 0.046 and Class B- 3 tor ~all thicknesses 0.046 and greater. For tube hollo~s, the standard notches shall be Class C-10.
BMS_ ...... 7_-=23.._4=A=--- PAGE_g ____ _
A.DX lU2 B·RI
(!
f!
('
•
'
•

•
t- ~ .. ~ 2" -
Dimensions of notches shall be per BAC 5439-2, except direction shall be 45° to tube longitudi a1 axis.
A-A
FIGURE 1 HERRINGBONE REFEPENCE NCYrCHES
6.4 CHEMICAL ANALYSIS
a. Each heat shall be analyzed for conformance to the requirement ot Section 3.2. The tubing supplier may use raw material certification except for oxygen, hydrogen, and nitrogen analysis which must be determined after final processing ot the tube.
b. Chemical composition for all elements except hydrogen shall be determined using ASTM E-120. Analysis for hydrogen shall be performed using the hot extraction method described in ASTM E-146. Limits for check analysis shall be according to AMS 2249. Any other analysia having equivalent or better accuracy and precision than the above methods may be used provided they are approved by The Boeing Company, Quality Control Department. Analysis for oxygen content shall be performed by a technique having a standard deviation on acc~acy of 50 ppm when compared to an acceptable standard.
6.5 TENSION TESTS
ADX 34!12 B·R 1
The specimens ahall be tension tested in accordance with ASTM E-8 and shall meet the requirement of Section 3.4. The strain rate shall be .003 - .007 inch/inch/minute through 0.2;, offset plastic strain, and then increased to .075 - .125 inch/inch/minute to failure.
If a diapute occurs between the purchaser and supplier over the yield strength values, a referee test shall be performed on a machine having a strain rate pa.aer, using a strain rate of .005 inch/inch/minute through the yield strength •
BMS_....:..7_-2_,.3'--4A __ PAGE l_o ___ 9_7

98
6.5 (Continued)
The strain Ratio (R) shall be deterai.Ded from the tube tension test specimens as follows:
R = OD W f • T- r
Ln- - l.Jll
OD0
W0
Where OD = average outside diameter W = average wall thickness f = final dimension after testing o = original dimension before testing
The dimensions o:t' the tube shall be measured to an accuracy o:t' + 0.0002". On tested specimens these measurements shall be taken
in the necked down region approximately half way between the fracture surface and the point where uniform elongation ends.
6.6 FLARE TEST
The specimens ahall be flared per ASTM B338-65 to meet the minimum flaring requirements specified in Section 3. 5.
6.7 PRESSURE TESTS
a. Jtrdrostatic pressure tests sb&ll meet the requirement• specified in Section 3.6. Specimens :t'or testing shall be at leaat 10 inches long and shall be hydrostatic pressure tested to a pressure determined by the formula:
P • rty rl - d2
rl- + d2
in which P • hydrostatic test pressure (p.s.i.)
d • maximum permissible inside diameter (D less twice the minimum permissible wall thickness, in inches).
D • maxiaum permissible outside diameter (NOminal O.D. plus diametrical tole~ce, in inches).
:t'ty = ainimum yield strength per Table II.
b. Each speciaen shall be subjected to two {2) pressure applications with the calculated pressure to be maintained for at least two (2) minutes during each cycle.
BMS 7-234A PAGE___::_----
• B·R
c:
•
•
•

6. 8 FlATTENING TESTS
Specimens of the full section of the tube not less than two inches in length shall be cut from the tubes. The tube specimens shall be flattened between parallel plates under a gradual load applied perpendicularly to the longitudinal axis until the distance between the plates is not greater than that specified in Table IV. After examination of the outside surfaces, the samples shall be split longitudinally and the inside surfaces examined. The inside and outside surfaces shall be free from cracks, tears, breaks or opened die or polishing marks when examined at 5X magnification.
Outside Diameter to \vall Thickness Ratio, OD/t
10 or less 11 to 16 17 to 30 31 to 50
Distance Between Plates Where t = Wall
Thickness
7t 12t 15t 17t
TABLE IV - FIA'r:rENING FACTORS
6.9 BENDING TESTS
Bending tests will be conducted to meet the requirements of Section 3. 8.
The specimens shall be bent through 18o degrees at room temperature about a suitable bending block having a tube centerline radius three times the outside diameter of the tube. An appropriate mandrel or tube filler shall be provided to restrict flattening to a value that meets the requirements of MS 33611.
6.10 RESIDUAL STRESS
ADX l4t2 B·R l
.Residual stress measurements shall meet the requirements specified in Section 3.9. Specimens tor testing shall be at least 3 times the tube diameter in length.
The specimen diameter shall be measured before ( D0 ) and after ( DJ.) making a longitudinal saw cut normal to
BMS _....~....7 --=2""-34=A=---- PAGE_l2 ____ 9_9

100
6.10 (Continued)
1·
8.
the measured diameter. Tbe cut shall be made using a sharp hack saw blade. The residual stress shall then be determined using the following formula:
S = E r =T--~"'!1~-
where: E = 14.1 X 10⁶ psi
'-\ = o. 31
t = wall thickness
1 ) I>]_
D0
= o. D. before splitting
Til= O.D. after splitting
REJECTION AND RETEST
a. Failure of a specimen to meet the test requirements shall be cause for rejection of the lot which it represents.
b. At the discretion of the inspector a retest may be permitted. One specimen from each of five (5) different tubes shall be tested to replace each failed specimen of the original sample.
c. If any of the retest specimens fails to meet the applicable test requirements, the entire lot which is represented shall be rejected with no further testing permitted.
MATERIAL IDENTI:P'ICATION
8.1 MARKIBG MATERIAL
The marking fluid shall not be soluble in water or oil, but shall be removable in a suitable hot alkaline cleaning solution without rubbing. Tbe marking shall be sufficiently stable to withstand normal handling, and shall have no deleterious effect on the tubing or its perforance. Esterbrook ( Qado) Flo-Master ink or an equivalent halogen-free marking ink is reco~~~~~ended.
8.2 TUBilll
Tubing shall be marked with the followiDg information, which shall be gro~d and shall be repeated at intervals not to exceed two (2) feet.
Bus 7-234A "'_......;....~-- PAGE l3 · ------
AOX U!tZ B·R 1
f)
«i
•
•

8.2 (Continued)
a. Boeing Material Specification number, including the applicable revision letter.
b. Nominal tube diameter and wall thickness (in inches)
c. Heat Number
d. U:>t Number
e. Supplier's name, trademark, or other designation
9· PACKAGING AND MARKING
a. The article container shall be ligibly marked with the following:
(1) Supplier's name
(2) Description of contents. (Dtmensions in inches)
(3) Quantity of tubes
(4) Purchase order number
(5) Boeing Material Specification number, including the applicable revision letter
( 6) Heat Number
(7) U:>t Nuaber
b. Packagin8 shall be suitable for storage and shall be adequate to assure safe delivery.
c. Each tube shall be individually packaged in such a manner that it will not make contact with any other tube.
BMS _ _,_7 -.....;;2......,34.....;;A.;;....___ PAGE __ l4 ___ Io_I

t
•
APPENDIX B
STRESS FORMULA, ANALYSIS, AND NOMENCLATURE*
Characteristic curves were determined for fatigue evaluation showing deflection vs cycles and stress vs cycles. A typical S-N diagram for titanium is shown on figure B-1, which demonstrates the dependency of stress ( amax), and life (N), on stress ratio (R). To construct valid S-N curves for the test sections, the pressures were adjusted to predetermined values such that at any single amplitude deflection (8 SA) stress ratios would be maintained constant.
Figure B-2 shows the M0
and M 1 relationship. The stress formula, analysis, geometry (figures B-3 and B-4) and diagrams showing typical cyclic stress (figure B-5) are included.
8.1 NOMENCLATURE
r
t
R
E
v
M
p
1/>
A.
1/1
kp
The following nomenclature is used in the analysis:
=
=
=
=
=
=
=
=
=
=
mean cross-section radius of curved pipe, in.
pipe wall thickness, in.
bend radius of curved pipe, in.
moment of inertia of pipe cross section = 1rr3t/in. 4
modulus of elasticity, psi
Poisson's ratio
applied moment, in.-lb (Mi in-plane; M0
out-of-plane)
internal pressure, psi (subscript p denotes value of a factor with internal pressure)
circumferential location angle
tR/r2-J I - v2 = hY 1 - v2, flexibility characteristic
PR 2 /Ert, parameter related to pressure
flexibility factor
*E. C. Rodabaugh and H. H. George, "Effect of Internal Pressure on Flexibility and StressIntensification Factors of Curved Pipe on Welding Elbows," Transactions of ASME.
103

om = stress due to applied moment, psi (om1longitudinal; Orne, circumferential) .,
6 = tube loaded end deflection, in. (6sA single amplitude imposed deflection; c5 mm angular mismatch deflection, 6LG linear gap deflection).
Op = Circumferential stress in straight pipe due to internal pressure = Pr/t (psi)
G = Shear modulus (psi) C1
T = Torsion due to force, V (in.-lb)
m = Moment due to virtual force, (in.-lb)
fJ y = Effective moment arm, in.
X,Y = General coordinate axes
!2 = Total developed centerline length of test specimen, in. f!
J = Polar amount of inertia= 27Tr3t
H = In-plane force (lb) at loaded end of tube
v = Out of plane force (lb) at loaded end of tube
tv = Torsion due to virtual force (in.-lb)
•
Illustration showing nomenclature
104 t

•
B.2 ANALYSIS:
The following tube parameters are used.
o Straight tubing:
I= 1rr3t J = 27Tr3t
o Curved tubing:
where
kp = 5 + 6 x2 + 241/1 and d = -----'-3'::-----5 + 6 x2 + 241/1 1 5 + 6 x2 + 24l/l
Using those tube parameters and tube geometry as shown:
y
I '\\
~ 5SA~5SA
For in-plane bending
and
M· = +Hy l -
Sec. A-A
• R Y, Y plane
(1)
(1-A)
105

and
106
For out-of-plane bending:
±o~A V=
J.(!MMdl +( .(!T tydl
0 EI J0 JG
For pressure stresses:
2 ( r in r2 apc(in)=P2 2 l+~)
r out - r in r in
For flexural stresses:
In-plane bending; longitudinal stress:
kp Mir 3d} a = 1 +
MLL l(l-v2) 2
dl sin - 2 sin 3
In-plane bending; circumferential stress:
Out-of-plane bending; longitudinal stress:
Out-of-plane bending; circumferential stress:
(2)
(2-A)
(3)
(3-A)
(3-B)
C1
= 3r d1 cos 2 (4)
(5)
f
(6)
(7)
•
•

•
In the above equations for stress due to flexure, where ± is shown the plus sign applies to inside wall surface and the minus sign applies to outside wall surface.
Then total stress on any element is given by:
€ oc =Ope+ OM cor oM.c (circumferential stress) 0 l
(8)
f oL = oPL + oM Lor oM L (longitudinal stress) 0 0
(8-A)
It is shown above that for a given tube geometry, tube wall stresses, due to flexure, are a function only of pressure and tube end deflection. For the tube end deflections shown above moments, and resulting flexural stresses, are periodic, of constant amplitude, and the phase angle between Mi and M0 is 90° (fig. B-2) .
107

·v; -I<:
X
"' E b V> V>
~ ..., (/)
108
70r-------------~--------------------------------------------~
60
40
30
20
/Stress ratio (R)
O.e
105
Alllowable cycles (N)
FIGURE B-1.- TYPICAL S-N DIAGRAM AND STRESS RATIOS FOR TITANIUM
f
f
Cl
•

(+)
.0
c
+-' 0 c Q)
E 0
::2: (-)
Section A-A
Trace of tube t_ during rotation
a (rad)
FIGURE B-2.-M0 AND M; RELA TIONSH/P
109

--0
f I
Dtmens\Ons in inches
Tube failure location I refl
A· A I Enlarged View)
9 Angle from bend tangent point to fadure locat•on
• An~e measured counter clockwise from neutral ax1s
\ .:,
Oo
rf
0
'b
~ " 'b
FIGURE 8-3.-NOMENCLA TURE AND DIMENSIONS FOR STRESS AND FAILURE ANALYSES FOR 1.0 X .080 IN. SPECIMENS
- e -
c...,
\ •'\ /

,
•
•
Tube rotat10n
D~mens1ons in inches f) Angle from bend tangent
point to failure locat1on I& Angle measured counter
clockwiSe from the neutral axis
Tube
A-A (Enlarged View)
FIGURE 8-4.-NOMENCLATURE AND DIMENSIONS FOR STRESS AND FAILURE ANALYSES FOR 3/8 X .020 IN. SPECIMENS
11 1

One cycle
80 V'l ~
V'l 70
V'l <ll
60 '-.... f!
V'l
"' 50 .... c 40 <ll ..... --<ll
30 r -E ::J 20 O"mean u .....
(eq. 3) u 10 4!
mean
. O"min 6 Stress rat1o ( R) = -- = -= 0.10
O"max 60
0
Time
For 3/8 x .020 ln. Specimens f
One cycle
50 O"max
·;;; 40 ~
V'l 30 V'l <ll
20 .... V'l - O"mean
Cii 10 c "0 0 ::J ....
O"mean ·c, -10 c (eq-38) 0
O"min _J -20
O"min -20 Stress ratio (R) = --= -= -0.40
O"max 50
-30 Time
For 1.0 X .080 In. Specimens
FIGURE 8-5.- TYPICAL STRESS DESIGN CRITERIA
112

•
•
APPENDIXC
BOEING TEST REPORT T6-5722-3 "METALLURGICAL EXAMINATIONS OF MISCELLANEOUS Ti-3Al-2.5V TUBES AND TUBE HOLLOWS IN SUPPORT OF
DOT CONTRACT DOT -F A-SS-71-12 PHASE I, TASK 6, SUBT ASK 1" DATED 7-25-72
113

)
• "' • ~
a • t
REV SYM
THE 11111'1~1; COMPANY
COMMERCIAL AIRPLANE DIVISION RENTON, WASHINGTON
DOCUMENTNO._T_6_-_5_7_2_2-_3 __________ __
TITLE: Metallurgical Examinations of Miscellaneous Ti-3Al-2.5V Tubes and Tube Hollows in Support of DOT Contract DOT-FA-SS-71-12; Phase 1, Task 6, Subtask 1.
ISSUE NO. ----- TO:
APPROVED BY
APPROVED BY
MODEL Contract
R. A.
lDATE)
f'-S-12-
t~ tj· /~,.
IOATEI
•••,N•JNo. r6-5722-3 PAGE 1
115
+-

,... • 0 I ..
..,
-... ..._ .. .; a: 0 0 • ,... ... 0
2 • -
TABLE OF CONTENTS
LIST OF TABLES
LIST OF FIGURES
REFERENCES
SUMMARY
PART I - CRYSTALLOGRAPHIC TEXTURE AND STRUCTURE DETERMINATIONS ON Ti~3Al-2.5V TUBING RECEIVED FROM THE SUPERIOR TUllE CO.
SUMMARY
INTRODUCTION
RESULTS AND DISCUSSION
Cry•tallographic Texture
Microstructure '
FIGURES
ATTACHMENTS A & B
PART II - CRYSTALLOGRAPHIC TEXTURE DETERMINATIONS ON Ti-3Al-2.5V TUBING AND TUBE HOLLOWS RECEIVED FR~ THE ZIRCONIUM TECHNOLOGY (ZIRTECH) AND WAll QIANG COMPANIES • ALBANY, OREGON
SUMMARY
INTRODUCTION
Page
5
6-7
8
9
I-1
1-1
I-1
1-1
1-1
I-3
1-4 -I-10
I-11-I-13
Il-l
Il-l
Il-l
RESULTS AND DISCUSSION Il-l
FIGURES II-4-II-9
ATIACHMENT A II-10
PART III - R-VALUE DETERMINATIONS ON FIVE Ti-3Al-2.5V COLD WORKED III-1 AND STRESS RELIEVED TUBES RECEIVED FROM THE BISHOP TUBE CO.
SUMMARY III-1
INTJ.lODUCTI~ ril-l
RESULTS AND DISCUSSION
PART IV - THE EFFECT OF AGING AT 450°F ON THE STRENGTH OF Ti-3Al-2.5V COLD WORKED AND STRESS RELIEVED TUBING
SUMMARY
INTRODUCTION
RESULTS AND DISCUSSION
III-1
IV-1
IV-1
IV-l
IV-1
oL_ ________________________________________________________________________________________ ~
116
REV SYM II#IJITIN#I NO. T6-5722-3
PAGIE 4

)
t
,.. • 0 I
" -,
-" .... .. .., It 0 0 • ,.. " 0 0
•
LIST OF TABLES
NUMBER TITLE
I-1 Crystallographic Texture of Various Ti-3Al-2.5V Tubes
11-1 The Crystallographic Texture of Ti-3Al-2.5V Tubea and Tube Hollows
111-1 R-Value Calculations for Ti-3Al-2.5V CWSR Titanium Tubes Manufactured by The Biahop Tube Co.
IV-1 Mechanical Properties of Aged and As-Received Ti-3Al-2.5V CWSR Tubea
PAGE
1-2
11-2
111-2
IV-1
-0~--------------------------------------------------------------------------_J
117 REV SYM
5
.... , •• NO. T6-5722-3
PAGI: +-

" • 0 I .,
.,
-... ' .. .., a: 0 0 • ... ... 0 0
•
tnJMBER
I-1
I-2
I-3
1-4
1-5
1-6
I-7
II-1
ll-2
Il-3
LIST OF FIGURES
TITLE
Pole figure for tube A. This partially finished tube was 0.555" x 0.0375" in size and had undergone 4 of 8 planned bench draw operations.
Pole figure for tube B. This partially finished tube was 0. 743" x 0. 054" in size and had undergone 2 of 4 planned bench draw operations.
Pole figure for Tube Hollow 1-30. This sample was 0.875" x 0.095" in size and was made by RMI was the Superior Tube Co.
Pole figure for Tube Hollow 2-30. This sample was 0.875" x 0.097" in size and was extruded at Harper for the Superior Tube Co.
Pole figure for tube 3-30. This finished tube was 0.500" x 0.036" in size and was made by the Superior Tube Company from the Harper Tube Hollow 2-30. See Figure I-4
A lap or tear that was hollow; specimen 2-30. to result from a large hollow.
present in the Harper tube This condition is considered
grain size in the extruded
Microstructure of RMl ,and Harper Tube Hollows. These photos show typical equiaxed transformed 8 structures for Ti-3Al-2.SV titanium.
Pole figure for Specimen 1; (T4-054-131C). This tube was 0.500" x 0.029" in size and was fabricated in five tube reducing operations from a 2.5" x 0.180" tube hollow.
Pole figure for specimen 2; (T4-018-030). This tube was 0.5" x 0.029" in size and was fabricated in four tube reducing operations from a 2.5" x 0.180" tube hollow.
Pole figure for specimen 3; (T4-002-CONR-l). This tube was 0.375" x 0.022" in size and was fabricated in five tube reducing operations from a 2.5" x 0.180" tube hollow.
PAGE
1-4
1-5
1-6
I-7
I-8
1-9
1-IU
Il-4
11-5
II-G
0~--~----------------------------------------------------------------------------~ 118
REV SYM i•o. !6-5722-3
PAGE 6
f
fl

t
t
•
.... .. 0 I .,
-,
-.... ' .. .; a: 0 <> .. . ' 0
" ..
NUMBER
ll-4
ll-5
Il-6
LIST OF FIGURES (Cont'd)
TITLE
Pole figure for specimens 4; (T4-059-233A). This tube was 0.375" x 0.022" in size and was fabricated in five tube reducing operations from a 2.5" x 0.180" tuLe hollow.
Pole figure for specimen 5; (N-Code 3). This specimen was from the nose end of a 14 foot long extruded tube hollow and was 2.5" x 0.450" in size.
Pole figure for specimen 6 (1'-Code 3). This specimen was from the tail end of the 14 foot long extrusion from which specimen 6 (T-Code 3) was taken. This specimen was 2.5" x 0.450" in size.
PAGE
11-7
II-8
ll-9
-(1~----~------------------~---------------------------------------------------------J
119
REV SYM
. .. 0 I .,
-.
·-... ' .. " rr 0 0 .. ... ... 0
~ ..
REFERENCES
1. Structures Staff-Materials Metallurgical Laboratory Job Numbers 46SP and 480P.
2. Structures Staff-Materials Metallurgical Laboratory Job Number 13Q and 51Q.
3. Structures Staff-Materials Metallurgical Laboratory Job Number 52Q.
4. Structures Staff-Materials Metallurgical Laboratory Job Number 71Q.
-oL_--------------------------------------------------------------------------------------~
120
REV SYM I T6-5722-3
.IIIIND -NO.
PAGE 8
I'
(

,
•
' 0 .. .. ~
0 c
• REV SYM
SUMMARY
Teat reports T6-5722-l, -2, and -3 au.aarizee all aetallurgical investigations performed on Ti-3Al-2.5V tubing evaluated in support of DOT Contract DOT-FA-SS-Phase 1, Taak 6, Sub-task 1. Report -1 covers tubing stu.di.ed during the initial screening evaluation of the contract. The primary eaphalis vas 011 3/8" Dia. x 0,020" vall and 1.0" Dia. x .080" wall tubing which had been given various I.D. surface treataents. In addition, a 3/8" Dia. x 0.020" wall tube was included which was produced to pos1e11 an optimum crystallographic texture. Report -2 covers all tubing procured for the final evaluation phaae of the contract. .The tubing, principally 3/8" Dia. x .020" wall and 1.0" Dia. x .080" vall, waa MDufactured on a best effort baaia to the propoaed material apecification XBMS 7-234A. This specification incorporated !~roved raw .. terials, procesaing (including texture) and quality auurance provisions. The improved tubing was primarily utilized for the evaluation of various types of joints, Report -3 covers four miscellaneous investigations that were performed to generate fundamental technology on the metallurgical aspects of tube processing and properties. These included evaluations performed on finished and partially finished tubea and tube hollows from various tube manufacturers as well as an in-house heat treatment study,
Four separate and independent inveatigatione are presented in this -3 report. Each study is presented as a separate entity, including its own SUBIII&!'Y, They are as follows:
PART I - CRYSTALLOGRAPHIC TEXTURE AND STRUCTURE DETERMINATION ON Ti-3Al-2.5V TUBII'G STOCK RECEIVED FRCJ.f SUPERIOR TUBE COMPANY.
PART II - CRYSTALLOGRAPHIC TEXTURE DETERMINATIONS ON Ti-3Al-2.5V TUBING AID TUBE HOLLOWS RECEIVED FROM THE ZIRCONIUM TECHNOLOGY ( ZIRTECH) AlfD WAH CHANG COMPANIES, ALBANY, OREGON.
PART III - R-VALUE DETERMIBATIORS OR FIVE Ti-3Al-2.5V COLD WORKED AND STRESS RELIEVED TUBES RECEIVED FROM THE BISHOP TUBE CCI4PANY.
P.ART IV - THE EFFECT OF AGING AT 450°F ON THE STRENGTH OF Ti-3Al-2. 5V COLD WORKED AID STRESS RELIEVED TUBING.
This teat report is principally intended to document data generated during the course of the investigation and addresses itself only briefly to the more general application of the data or philosophy of testing •
•• ,,N. NO. T6-5722-3 PAGt
121
~
... ... 0 I
"' ...
... ' .. .; ([
0 a ... ... .. 0 0
...
PART I - CRYSTALLOGRAPHIC TEXTURE AND STRUCTURE DETERMINATIONS ON Ti-JAl-2. SV TUBING STOCK RECEIVED FROM TilE SUPERIOR TUBE CO.
SUMMARY
Crystallographic texture determinations have been perfonned by X-ray diffraction techniques on two tube hollows and three finished or partially finished Ti-3Al-2.5V tubes. TI1e tube hollows were extruded by RMI and ITT Harper in the a - B and 6 phase ranges respectively, but nevertheless exhibited very similar textures. The finished and partially finished tubes conformed to the relationships previously noted; namely that relatively large diameter thin walled tubes possess a better texture (basal planes in a more radial orientation) than do the smaller diameter, thicker walled tubes.
INTRODUCTION:
The Superior Tube Company, Norristown. Pa., has submitted several samples of Ti-3Al-2.jV tubine for evaluation of crystallographic texture and microstructure. Two samples were from tubing that had been pat'tially processed using somewhat unconventional processing schedules as outlined in Attachment 1. Two other samples were from tube hollows that had been received from ITT Harper in one case and RMI in the other. A final sample was taken from a finished tube made from one of the Harper tube hollows, (See Attachment 2). The purpose of this investigation was to help establish the effect of processing on crystallographic texture and microstructure so that a better understanding of these parameters can be developed. ·
RESULTS AND DISCUSSION
Crystallographic Texture
Tubes used during the present investigation are outlined in Table 1- •
The results of the X-ray pole figure determinations are shown in Figures I-1 through I-5. (Also see reference 1). Samples A and B exhibited typical tubing texture with sample B having a slightly improved radial orientation of basal plane poles relative to tube A. The considerably reduced wall thickness and only slightly reduced diameter of tube B, compared to A, combine to make the improved texture of tube B the expected situation.
-o~--~-------------------------------------------------------------------------7
122 T6-5722-3 REV S)'M
PAGE I-1
•
('

•
~ .. ·o I
" '
" ,, ..
Table I-I - Crystallographic Texture of Various Ti-3Al-2.5V TUBES
* Ident. Tube Heat Manufacturer No. No.
A
b
1-30
2-30
3-30
Size
.555"x.0375" Superior
• 743"x. 054" Superior
.875"x.095"
• 875"x.097"
.500"x.036"
RMI
ITT Harper
SuperiorHarper
Angle Comments
35"
30445D-06 45°
295611
295611 56"
Partially finished tube; 4 of 8 bench draws comp.; 48% CW; Final tube size -.375"x0.020"(projected).
Partially finished tube; 2 of 4 bench draws comp.; 47% CW; Final tube size -.625" x .040'' (projeeted)
Tube hollow received by Superior from RMI; Annealed •
Tube hollow received by Superior from Harper; Annealed at 1350"F.
Finished tube processed by Superior from the l~rper Tube Hollow -2-30. Annealed at 1350°F
*The angle between the centroid of the basal plane pole peak and the 0 degree pole measured along the 270° axis; pole figure analysis.
The tube hollow samples 1-30 (RMI) and 2-30 (Harper) displayed very simila~ textures even though the manufacturing procedures for these products are thought to be somewhat different. Harper tube hollows are extruded (bare) in the all Beta (B) region (posaibly as high as 2200"F) and RMI tube hollows are extruded (clad in steel) in the a-S region. The RMI product was extruded as a 2-5/8" x .375" wall tube and cold reduced in three steps,including three anneals,to the .875" x .095" size that was shipped to Superior. The ITT Harper tube hollow was extruded to a 2" ;< .095" size and tube reduced at Superior to the .875" x .095" 'ize.
Attachment 1 states that the R ratio of the RMI tube was approximately 0.6 whereas that of the Harper tube was 1.8, a large and significant difference. The X-ray analysis would certainly not support th.is difference in R values, i.e. the R-value results indicate a very different texture and the pole figures a very similar texture.
"'-----------------123
+-I
T6-5722-] . NO. REV SYM
PAGE l-2

~ .. 0 I .,
..,
-" ' ... " I[
0 0 • " " 0 ~
• 0
•
124
REV SYM
Sample 3-30, which was prepared from the Harper tube hollow 2-30, exhibited a leas favorable radial texture than did the starting stock. As the wall thickness was reduced from .097" to .036", with only a moderate diameter reduction, this deterioration in texture wss not expected and can not be easily explained at present. The ratio of ~all reduction to diameter reduction corresponds to a T ratio* of 1.47 which is thought to enhance the development of radial texture.
The reasons for these apparent differences are not fully understood at present although the poor surface finish present on the RMI tube is thought to be at least partially responsible.
Microstructure
A microstructural examination of the two tube hollows was performed in addition to the texture examination. The liarper hollow possessed a very poor surface finish and also contained some laps or tears. An example of this condition is shown in Figure I-6. These tears are considered to occur as a result of a very large grain size in the extruded tube hollow. The microstructure of the RMI and Harper tube hollows are shown i.n Figure I-7. Both hollows show a typical microstructure of equiaxed alpha phase.at this stag~~a their processing.
T: w
Wo
••• ,Nil NO. T6-5722-3 PA
,r
f
(
•

,.. • 0 I • ,
-... ... .. .; I[
0 0
• ,.. ... 0
2 •
I
• .5000
•• 0000 2 t.ooao , u.oooo
:5 1.5000 • 20.0000
• 2.0000 9 25.0000
JOI NO 4a5~ lAMPL~ 0.555 O.D.X0.0S75 W CATE 11/IS/11 •ADIAfiON CU AT SS KV 21 MA COU~TE• TUBE P~OP AT 1.95 ~V ILITa I H IV [NTUNC( 5 H tV •tC[J·vJN' (t.l(ift.~((ll ILM.OLS[N aCAM •AT[ t ~If/MIN 72 AL~HA/MIN COOOl, HKL
' 4.0000 0 30.0000
~HA 50 lAIC 30, Wlt.~DOW CALIIIlATrON IA-PL[ IJLVEil
.ANDOM INTCNSJTr 451.0 ~CAl 10t.tt4 CALC CAT[ ll/29/11
Figure 1-1 Pole figure for tube A. 0.555" x 0.0375" in size bench draw operations.
'Ihb partially finished tube was and had undergone 4 of 8 panel
al_ __________________________________________________________________________________________________________ ~12;;s
6DEIND INO lu-J/2~-) REV SYM PAGE T -I..

.. .. 0 I • ..,
-,. .... .. u I: 0 0 • .. .. 0 2 •
I
• .1000
•• 0000 2 1.0000 7 ... 0000
1 I.SOOO • 20.0000
• 2.0000 t 25.0000
SAN~L[ 0.7•! O.~.XO.OS• W DATE ltlt!/11 IADJATJON CU AT 3! •v 28 NA COUNT[A TUB[ ,AOP AT t.95 KV ILITI I H tV (NTA~NC[ 5 H I V AEC[JVJN'- [NGJN[£~ A.H.OLSEN eCAN IAT( I 'SIINJN 72 AL,HAINJN COOOZI H•L 'HA I. lAS[ !0, WJHCOW CALJIAATJOH SAN'L£ SILVER
' •. oooo 0 50.0000
lANDON IIIIT[NSITY i •st.O KUJ ISZ.OZt CALC DAT£ ttiZ911t
Figure 1-2 Pole figure for tube B. This partially finished tube was 0.743" x i0.054" in size and had undergone 2 of 4 planned bench draw operoationa •
-0~~------------------------------------------------------------------------------------------------------------J 126
REV SYM 61111ND NO. T6-3 722-3
,f
!.
f

,.. • 0 I
"' ...
-,.. ' • " 1: 0 0 • ,... ,... 0 0
•
II I
I
.5000 •. coco
2 1. 0000 7 u. 0000
C>
' • l.OOOO 4.0000 e zo.oooo 0 30.0000
JOI Ill"· AICP
IACIATIOIII CU AT ,, ~V
SLITS l H ZV £~T~A~C(
SA~PL£ t-30 t•rr '''''Z Zl ~A COU~T(~ TU9£ PROP AT 1.95 ICV
SCAN lliAT£ I PSI/WIN
'HA '· V lA$[ 8AIIICOW INT[IIItiTY
' H IV ~(((IVIN' (~,f~E(~ ~.H. ~LS[N 72 ALPHAI~IN
lO. V WINC'='W •• 9.0
cooo~, ~~ L CALILRATICN !A~FL[ !ILY(R
KCAI t•6.ft~ CALC =AT( 0111~1fZ
Figure I-3 Pole figure for tube hollow 1-30. This sample was 0.875" x 0.095" in size and was maJe by RMI for the Superior Tuue Co.
al_ ______________________________________________________ ~~--f12D7
1"6-5722-) REV SYM 6DEIND NO
PAGE:

~r-~------~~====~------------1 .. 0 I ..
.,
;:: ' •
I
• .,000
•• DOOO
...
2 1.0000 7 u .0000
f
l ·1.SO!JO
8 zo.oooo • Z. OOGO g 25.0000
JOI N~. •lOP SANPL[ !~50 DATE 11111Z
! •.OO!lO o .so.oaoo
IADJAfJON CU Af 35 •v ll NA COUNT£~ TUSE PROP AT 1.95 ~V
ILJTS l H lV [NTR4NCE ' H IV ~ECEIVIN~ EN~lNEER R.H. OLSEN SCAN IAT[ I PSI/NlN 11 ALPHA/~IN IOOOZl HKL PHA 5. V B.AU JO. V WINCOW CALIBRATION 5ANPLE SILVER lANCON INTENSITY ••t.O l(AI 136.559 CALC CATE OlllZ/12
" Figure 1-4 Pole ficure for tube l"~ollow 2-30. This s.ample was 0.875" x ~ 0.097" in size and wa&l extruded at Harper for the Superior £ Tube Co • ... 0
2 • . OL__._...__._ __ _._...__._ __ _._ ____ _.__._---------.----.--------.------------------.----------~
128
REV SYM No. 1"6-5722-3 ·6DEIND
PAGE I-7
f
f!
•

• 0 I ..
I I I
!
I ( I I i i
I ~!
0 0
\
.!000
•. oooo 2 I • O!JOO
r u. oaao l 1 • ~ G0!J
8 ZD.GOOO ' 2.0000 9 25.~000
5 4.000!)
0 3J.'J~OO
JOII H.,, A80P 'SANPL!: 3-!0 !:ATE: l/6172
~ACJATIOH CU AT !S ~V 28 NA COUNTE~ TUB( P~OP AT 1.9, KV SliTS 1 W 2~ (NTNANC£ 5 M I V "!:CE:l¥fJN~ E:N~IN((R R.H. OLS(N SCAN RATE I PSI/NJN !Z ALPHA/WIN 100021 HKL
PMA 5. V SAS( !~.Y WINC~W CALI8~ATION SA~PL( SILV(R .ANCON JHT(NS/Tr ''9.0 KIAI · 15•.~0~ CALC CAT( OIIIZITZ
Pole figure for tube 3-30. This finished tube t.:as 0.500" x 0.036" in size and was made by thl' Superior Tube Co. from the Harper Tube Hollow 2-30. See Filjure 1-4.
al_ ______________________________________________________________________ ~l29
1 . T 6-) 7:? 2 - 1
611EING Nl) REV SYM ---- --~----
PA(ol 1- ~

130
20X
(a)
50 X
(b)
FIGURE 1-6.-A LAP OR TEAR THAT WAS PRESENT IN THE HARPER TUBE HOLLOW; SPECIMEN 2-30. THIS CONDITION IS CONSIDERED TO RESULT FROM A LARGE GRAIN SIZE IN THE AS-EXTRUDED TUBE HOLLOW.
4

. '
. : ~.
,tc ' ... ~· ' ~ ,"c • j( ...
RMI tube hollow 500X
(a)
ITT Harper tube hollow 500X
(b)
FIGURE 1-7.-MICROSTRUCTURE OF RMI AND HARPER TUBE HOLLOWS. THESE PHOTOS SHOW TYPICAL EOUIAXED TRANSFORMED f3 STRUCTURES FOR Ti-3AI-2.5V TITANIUM.
131

5UP!:RIOR TUE'-E COI'I.PANY ·NORRISTOWN. PA. •19404
r·-- ·--- ·- ... ···---1 I
2 I 5 A 1\ 1 . 7 ~ l f ll'!:..llfY~«. ~I0~&60·tlo4t0/641t
T£.Lt.¥ 083·•Z'J4
L._ ---- ·---·- ·-. -- -------·--
October 13, 1911
Mr. Don Goehler 15612 Southc~sl Tenth Avenue Bellvue, Washinetun 9HOOo
Dear Don:
Here <>.r~ two samples t~.kcn from your test lots about halr way Lhru the drawing schcoule sequencP.:
I. .555 x .0375" ~7all piece:
This was cut frcm the lot destined to finish at .375 x .020 Wnll. This piece represents the lot :'ltter co·~rJ.eting four of a total of e:if,ht bend! draw~. Sa~r-le ccnJiti.c.n is a:;<lrawn (ap~roxim~lely 4G'/, ccld ~1ork) u:1.d picklc.l. I~ vou ,.:~r-~: ,.":\ ~9"\.,~~~1.j ,,:~ ·~~~ ,_?.::0"!' f-::· ~. ~!~'''.!".: ?'" !:~~!..-. !:~!~:.:~
relieving would be do~~ at 850°F.
11 •• 743" x .CS4" wdl:
(Destined fur .625 x .040 11 t-:) This size piece represents the lot after com~lction of two of a total of fqmr bench draws. Sample condition i5 as dr<J\nt (approximately 47% cold work) and pickled. Lnneali~g is a$ in I.
If you have further q·JI!Stions, please call. I 1I!l. vr-ry sorry for the delay on your .lots and \-Till ::u:;h then thru as fn.st as possible.
Best tegardz,
SUPEKIOR TUBE CC~.J'MJY
t1 (·/ . .., ~' <..i ·"" ,:.. __ .- .... T. W. Re..::s, Dcvelq.::nc:::r.t }~ctall,Jr~ist.
T\JR:vn
Cnc.
133
!6-5722-3
Page: 1-11

r·-· SUPER iOH 1 U DE CO~~ PANY • NORRISTOWN. PA. • 19404
.ZI'·~?:S,.l070
,.LL~TYrE ~l0·f."'G0·6•IO/C•tl
TI:LIX Ou 1· .4Z7 .. L_
134
M:-. fh~1 C::;c~l~r
15(•12 ~i(;t;•::.~~~.::;t 'l\.:TLth /we. Bell•-"-..·\~~, \..'..l:.:;l,ina::e:n 93CC3
tiear lJo•·:
I;over:ber 12, 1971
Ar:. part of yc:ur. tc:-::t\o,i:'e prog!':t~, I thot•~.~lt it ~1£~it be of intere~t to send sr. .-~ of our ~t;;~ t·ti~:~ r.::.·..r L~tt!ri.J.l 1md 11. desc.:d.pt".N& of i.tn histC":-y. As a r. ·~ult, here .;n:-~ s.::.;-.:>les of t~o di£rcrent n.::"';..l: .... ·~s, I'~:.L ~~~rpcr ~nd
ru~. b:-.:h .. :: the .875 X .C9.5 si~e. (Your test lots "~ere t:.r1cle frc-..:l f.!-11 ~te:r.i.;.l).
B~d.-rot~d: ----1-t:---Superior buy::; stock frc~ I'!ii at a si::e of ,C/5 x .0:3 l1. l!e u~::er~!:;;::·.d th-:t ! · :·! pn.ductf: tl-;~ s s:l."'c hy eAtrudi n:; a hollo;.: <1:: 1.-5/~/; r.:: :~ 3/r:.:• ~1 fol.lc-;.~-: J. by l:·i:r~.:! cole tub~ rr-6.,J.c:ti.~·!~~ \: .... o:.~ ~~!-.:;) c.nct :·:'~·.~.a~~. (:·-..' . ...:- ~r ... :'_:"":)!.:rc·a•:/ t~kC "" t·;~.fl fl'c>.r:er~<Ll, ••s C".!C~'''~~d. P.!t~~: '="'=~~:!.J.e
clor~:;:tio;, U~;il).~ ::i:i~ fo::.t'!'"Ul<-.: ~- t.rP.ir. i,::.t5 () <= R • Ln (ll OD) IL~• (A~1), r.t&O".ied a value of oral~· 0.6. Ue consider ~ value of 1.0 re&pect~ble but would prefEr 1.5 to 2.0.
BAr-PErt: Becsugc tttc r:a st~-::k sholled n low R value, Superior decided to buy an U!l-c:l:::.ruded hollow and tube reduce inhouse. A hc£ovy usll ~lnr.kn.::sc l:~s orccrcd tc) pe::- iit priL~rily '~all reductiQ~ (c chc:~r~c~cTi::t:ic ,;e feel in i~:~r-ortant in gail.::..ng h5.~:t P. va.i.t:e5) c.~,.~if-~ processin~.
The stock ~·ns e6:~ :uncd to 2" :: 3/8 W anc! tel!(; reduced t\Tlce to r;;-'ch t~1e .875 x .095" size. TI1e :R \-"!llue of this stodt u~s c.pproximatcly 1.8.
We cat•.r.ot explain ,;1ty t~p P..~~~ _::·v.::?lue is so much l~'cr since st:o.rt:int; size's for bo~h lot!; nrc not t•·:t 0:: .. 1 t.::rl~~t. We co know tn~t r.::t e-:..trc.:es a cl;,Q. billet (ter.;pcrntu~~ n::~t tr.nc\:•i) &no l!~r~·ar pusheR b"'H' i probc.oblr in the all b~ta rL~l~u. Per~~ps th~~ is a factor.
We want~J to use tl!!s liarr~r ttcck for rour test p~c;·~cm, hopefully to giv~ v. •.·cry stro1~?. t:':~ttu'I'c, txt A~ yet! !:••o·.; the s;:oc:k <!rri.ved tno 1'1te. 'l'hc t.::-.:t bc~t t:ai.oo:'~ I c-::.:t o::f.::r i:: n £.::; ··r·~ tu!Jc .1t .;,no x .GJ6" ·,;:>..11 dr~1· .. \:(· .. :n i.t fiv•: k-c;lcll rr , .•.. _,;; ~0~1:; icr Gr-. .. ~n r..s .•: •. ,.,. •.1 ~IJ.1.lt•ut,on
of ll<.:lT :.·. 1\c note d.~ ... ~· 1 ,;.:· . .-~ .<:-/) • •·~1 .Jl-:!, L:t. ~.- ..... ~.;:· C.:;·.:~:"l~:cli 1.0
1.3. ', :.:3 \' .. ·. UI!L"'.j'<.:C:tl:"i ·.:: ( 1 l::·l-:~~\1 -. ~<· (it..:-ti.l·.'~;' :.:1!. :IL · , i::. : ••
We tld.; u •. ~:: po;:.i,,;y t:i~; ... 1:• c,rlt-; .. _,.LJ . .:,;, i& n>~ •li. .. ~~ fn,,, ~.c) t.>
'li6-5 722-3 rar,c: 1-12
1.

ATTAClll-1ENT A
SUrEnJOR TUO~ COMPANY • NORRISTO'NN, PA. 19404
Sub; ct: l!-;·. D.:·1 c~'·=-~·,l·:or 11/12/71. . --.:.· -~----------------·~
(b) zho·~-:.1 belo·..1 due to the shearir.g distortion. ~!~ocint:ed t:ith rod dr£i.\.:ing.
7*·--~·-:--.-;--·! J' 'j ··•
; I • I : as tube recluc~=>d
(b)
/mr·-... ) ·:-.-;<)~ -f~ (<t") a ... r:cer fi\"-" -' .. ·· .. · -.~-,. V··~-..... · ·-·--'-~;..~~co , ,.;. \,.;. ..~
If tbiG is the case, it V:lu,.d apper.r that a tu'!-.c rr.rivced tube t:rl rht have S\fl inhennt '-'~vc.~::.'l~~ 1n dcvd~0~-:1g ~trr>:-·:-~ fvvor='~l~ t---~ 1:t•?-t>~,
61th. ~~ .. 1~ t~<.l'! d;;·.'l·,,;u tu·nc \r.lould ctlU b.:: qu!.te i=.~.~tU<! 1n th~:! t;:,_,:-:_~·-·;;rs~
dire: don. ., .·.
If any question3 ariNe :sbc1ut the pl.C.Cef;: ing b~stol:r fc,r eiti~ct' yot·r te~t.lots or the acco_:::;panyinc Sa•.:ples, plellse co::t::!cf us.
, • TWR:gtil
Best regar~s,
-i
I_ .. ..J
(.-,). ·' ·. ~ . r- ·- ' T. W. Recs, Davc,lopJ:tent l!r~tallurgist
135
!6-5722-3 Page I-13

" .. 0
I
"' ~ PART II - CRYSTALLOGRAPHIC TEXTURE DETERMINATIONS ON Ti-3Al-2.SV TUBING
-,._ ' .. " tr 0 0 .. ,._ .. 0 0 ..
AND TUBE HOLLOWS RECElVED FRCM THE ZIRCONIUM TECHNOLOGY {ZIRTECU) AND WAH CHANG COHPANIES, ALBANY, OREGON
SUMMARY
Crystallographic texture determinations using computerized x-ray pole figure techniques have been performed on two Ti-3Al-2.5V samples from a single Wah Chang tube-hollow {head and tail end), and on fC?ur pieces of Ti-3Al-2. 5V tubing that had been processed by somewhat different procedures. The nose end of the tube hollow demonstrated a good radial texture wereas the tail end exhibited a greatly deteriorated crystallographic texture. The partially finished tubes demonstrated improved texture as the ratio of the wall thinning reduction to outside diameter reduction increased. No effect of other processing variables was noted.
INTRODUCTION
Crystalloeraphic texture stucj~es were made by X-ray diffraction on four pieces of Ti-3Al-2.5Y cold work and stress relieved (CWSR) tubing that was received from Zirtech. These samples represented four different processing schedules ~t were derived by using two sizes of starting stock {2.5" x 0.350" and 2.5" x 0.180") and processing them to two finished sizes; 0.5 dia. x 0.029" wall and 0.375'' dia. x 0.022" walL One of the processin~ schedules involved four reduction passes and the remaining schedule, five passes. See Attachment A for details of the processing. All tubes were made on Pilger tube reducing mills.
Texture studies were also performed on two pieces of a Ti-3Al-2. 5V tube hollow that was made by \-.'ah, ,Chang Co. for Zirtech. One sample was from the nose end (N) and the other was from the tail end (T) of a - 14' long extrusion. This tube hollow was as extruded {..w 1300°F) and was 2.5" dia. x 0.450" wall in cross section.
RESULTS AND DISCUSSION
The results of the crystallographic texture study are shown in Figures II-1 through 11-6 and Table II-1. See also Reference 2.
-c~--------------------------------------------------------------------------------~
136 REV SYM
T6-5722-3 NO.
PAGE II-1

I
l.
2.
j.
:..
5.
6.
Table Il-l - The Crystallographic Texture of Ti-JA1-2.5V Tubes and Tube Hollows
Specimen Size Number Supplier (O.D." X Wall Thick") Condition 0 Angle*
(T4-054-1JlC) Zirtech 0.5" X 0.029" ? 52°
(TR-018-0JO) Zirtech o. 5'' X 0.029" ? )80
(Ti<-002-CONR-1) Z i rtech 0.)75" X 0.022" ? !,4 0
(TR-OSCJ-233A) Zirtech 0.375" X 0.022" ? 49°
2.5" 0.450" • (N Code 3) ~Jah Chang X As-extruded 0 ** (T - Code 3) Wah Chang 2.5" X 0.450" As-extruded )llo ***
* The angle between the centroid of the basal plane pole peak and the 0 degree pole along the 270° axis, pole figure analyais.
~• Peaks were on the 0 and 180° axis, but were strongly basal.
*** Very elongated peak (ridge) along the 270° axis.
A general pattern that has been noted in previous Boeing studies, as well as in the literature, is that a favorable orientation of basal plane poles develops during processing when diameter reduction ia mintaaand wall reduction is maxima. This pattern was found to be followed exactly in the finished tubes obtained from Zirtech as will be noted by comparinr, tubes 1 and 2, and 3 and 4. The tubes fabricated from the thicker wall starting stock (2 and 3) had the most favorable texture in both ca~es examined.
Comparaion of finished tubes that had been processed from the same starting stock indicated that the smaller diameterthinner wall tubes had about the same texture as the largerheavier walled tube. The incremental differences in the diameter and wall thickness between the two tube sizes apparently compensated for each other with respect to crystallographic texture considerations. Compare Figures II-1 and Il-4, and II-2 and II-3. The number of reductions used to produce the finished tube did not appear to have a major effect on the te~ture developed in the tubes.
~I ~I
!1'--------------.J REV SYM ... , ..
I T6-5722-3
• NO.
PAGE I I-2
137
+-

.... .. 0
I
"' ,
~ rc 0 0 ., .... .... J
0 .,
The tube hollow specimens produced by Wah Chang exhibited somewhat different textures. The nose end of the extrusion. which would be expected to undergo a minimum amount of deformation demonstrated an unusually "good" texture with a strong radial orientations of basal planes. See Figure II-5. The tail end of the extrusion (Figure II-6) exhibited an elongated ridge of basal plane poles along the 270° axis (steriogram) with its centroid at approximately 0 a 50°. This texture was considered to be inferior to the nose end sample (Figure II-5) but was not so bad as to prevent a tube manufactured from this section from having a satisfactory texture. The texture differences between the nose and tail end of the extruded holl01o1 were thought to be different enou~h to cause substantial differences in the texture of similarly processed finished tubes however.
-OL_------------------------------------------------------------------------------------~
138
REV SYM I T6-5722-3
.lll!fTINQ . NO.
PAGE I I-3

... .. 0 I .. .,
-... -..I .. , .;' I[
0 0 .. ~
~
0 0 ..
1 .sooo • 1.0000
2 t.OCQO 1 u.occo
3 1.5000 • 20.0000
4 2.0000 9 25.0000
5 4.0000 0 30.0000
J01 NO. Ul IACIATION CU AT 3! ~V ILITS 2 H ZV ENT~ANCE ICAN AAT[ J PSJ/klN PHA S. Y BASE IANDOM JNTENSJTY
SAMPLE T•·054·13!C DATE l/2.172 28 ~A COUNTER TUBE FROP AT 1.95 KY 5 H S V ~ECEJYJNG ENGJNEE~ ~.H. OLSEN
72 ALPHA/MJN (0002) HKL 30. V WINCOW CALIC~ATION SAkPLE SJLVE~
421.0 KCA) !29.687 CALC CAT( 02/14/12
Figure II-1 Pole figure for !;pecimen 1; (T4-0S4-131C). This tube "-'38
0.50011 x 0.029" in size 1nd was fabricated in five tube reducing opet .. tions from a 2.5" x 0.180" tube liollm.' •
REV SYM BOEING I NO. TIJ-5722-3
PII.GIE. TT_/.
139

~~--------------~~~~~------------~ .. 0 I
"' ...
-~ ... .. " I(
0 0 .. .. .. 0 <· .. -
1 .saoo I I.ODDD
z s.oooo ., u .oooo
3 1.~000
• 20.0000 ' 2.0000 9 25.0000
101 NO. I!G SAMPLE T4-D18-030 DATE 1/21/72
5 4.0000 0 30.0000
IADIATION CU AT 55 KV 28 NA COUNTER TUDE PROP AT 1.!5 KV SLITS 2 H ZY ENTRANCE 5 H 1 V ~ECEIVING ENGINEER A.H. OLSEN ICAN RATE l P$1/HI" 72 ALPHA/MIN (0002) H~L
'HA S. Y 8ASE 30. V WINCOW CALIBRATION SAMPLE SILVER .ANOOM INTtNSITf 421.0 K(A) 109.860 CALC DATE 021!4112
Figure II-2 Pole fig~re for specimen 2; (T4-018-030). This tube was O.S"x 0.029" in size and was fabricated in four tulle reducing operations from a 2.5" x 0.180" tube hollow.
ol_ ______ ~-----------------------------------------------------------------------------------~ 140
REV SYM BOEING .-.o.

.. .. 0 I • ,
-.. .... • 13
IC 0 C> .. .. .. 0
2 .. 0
•. .sooo • t.ooao
2 s.aooa 1 ~ u.oooa
3 1.5000 • zo.aooa
4 2.0[;00 9 25.00[;0
JOI NO. 131 SAMPLE T4-002-CONR-1 CAT[ 1/21172
5 4.0000 a 3a.oooo
IACIATION CU AT 35 KY 28 MA COUNTER TUBE FROP AT 1.95 KV ILITS 2 H 2V ENT~ANCE 5 H 1 V ~ECEIYINC ENCINEER R.H. OLSEN ICAN RATE S PSI/MIN 7Z ALP~A/MIN (00021 HKL PHA 5. Y BASE 30. Y WINCQI CALIBRATION SAMPLE SILVER IAHCOM INT[NSITf 4Zt.O KCAJ 110.801 CALC CAT£ 02114/72
Figure II-3 Pole fieure for specimen 3; (T4-002-CONR-l). This tube was 0.375" x 0.022" in size and was fabricated in five tube reducing operations from a 2.5" x 0.180" tube hollow •
WEV SYM .D.IINO NO T6-5722-3
PAGE ll-6
141
+-

~ .. 0 I .. ,
-.... .... .. . , I[
0 0
" .... ....
"' 0
"
t .5000 • 1.oooo
2 s.oc;oa 7 u .oooo
3 :.soaa ' 20.0000
.. 2.0000 9 25.0000
5 ~.oooo
0 30.0000
JOI NO. S31 lAMPL£ T4-059-233A DATE 1121172 RADIATION CU AT 35 KV 28 MA COUNTER TUBE PROP AT 1.95 KV ILITS 2 H 2V ENTRANCE 5 H tV RECEIVING EN,INEER R.H. OLSEN ICAN RAT£ J PSJIMJN 72 ALPHA/MIN (0002) HKL PHA 5. V BAS£ ,0, V WJNCOW CALIBRATION SAMPLE SILVER lANDO" INTENSITY ~2J.O KCA) 136.081 CALC C4TE 02114172
Figure ll-4 Pole figure for specimen 4; (T4-059-233A). This tube was 0.375" x 0.022" in size and was fabricated in five tube reducing 1 operations from a 2.5" x 0.180" tube hollow •
-ol_---------------------------------------------------------------------------------------~
142
REV SYM I T(,-572~-J IIIIEIND -NO.
y. ,
ti

~~------~--~~~~~~--------, .. 0 I ..
...
-... .... • .; I[
0 0 • ... ... 0
!? ..
2 s.oo~a
. 1 !U.OCO:l ' 1:~a~o a za.ocoo
SAMFLE N-COtE 3
c z.oooo 9 2~.0000
1 c.oooa 0 30.0000
UCUTJ'jU CU AT H «V 2~ ..,A (lji.HIT(Ii TUB( F"ljfl AT 1.9~ ltV S~JT5 t H 2Y (foTUNt::t 5 1-4 2 V li(CEIVHIC. EII,JN((R ILH.OLS(N SCAN U1'( l FSJ/totiN 12 JLF.,.A/Mifl COQ02l HKL
'NA '· V USE HJ. V 'oiHt~r..oW ULID!;ATJijtl !-loiPLE SILVER IAHC~N lNY(NSlTY ~]],Q ltCA) 11.511 CALC CAT( 0l10ZI12
F:lgure II-5 Pole figure for specimen 5; (N-Code 3). This specimt•n was from the nose end of a 14 foot long extruded tube hollow and w-.a 2. 5" x 0. 45011 in size.
-~------------------------------------------------------------~1~43
REV SYM 611EIND +-NO. H-'i722-3
PAGE I I-R

~r------------------------------------=~--~~=-~--~==~~------------------~---------------, • 0 I ..
.,
-... ' .. .; rr: 0 0 • ... ... 0 0
•
I
' 2 !.aaoo ., u.cc.o~
3 2.,Ci'.i0 • 20.00Ci.:l
4 2.0000 9 25.000~
5 •• coco 0 30.00GO
IUCfi.U~~ Cv H 35 tr.Y ltl .. , COUNTEIO TUEE F5CCF AT 1.85 ltV ··st.Jt5 2 tf ZV ('IHI<I. .. ([ ' t1 1 Y IO(C(! VI.N<i [NC.It:EEiiF..H.IjlS[N
ION JiA r! I F$1/loll N 7ZALFHAII'JN (0w02l HKt. ,..,-,. U. Y !AS[ U.v ldl'l!:rJW CALII!R-Trr.h S.l"'FLr. SILV£1\
I.U.•t'-:.M hft:4SIU' 394.0 ltCAI t1z.::' c.tL~ CAT[ ~41ZC/72
Figure II-6 Pole figure for specimen 6 (T-Code 3). This ~>pcdmen was from the l.ail end of the 14 foot lonr. extrusion frum \.•ld ch apecimen 6 (T-Code 3) was taken. This specimen was 2.5" x 0.450" in size.
-0~----------------------------------------·--------------------------------------~----_J 144
REV SYM I Tn-5722- J
.IIEIND -NO.
P&.t..F ,. ..,. n
(!

•
. ATTACHMENT A
The Boeing Company Commercial Airplane uivision P.O. Box 3707 Seattle, Washington 98214
ATIN: Mr. M.J •. Hartman,
Dear Mr. Hartman:
December 16, 1971
We are sending to you, under separate cover, two different size tube samples for your p1anned texture investigations. The pa~ schedules app 1 i ed were as fo 11 o~1s: ·
1. 1/2" O.D. X 0.029" ,, a. Lot No. T4-054- 131 C
Pass Schedule: l .5" X 0. 180"--4- 1 .88 11 X 0.135 11
1.88:' X U.l35::~l.3d;: X 0.067" 1.3811
X 0.087"-+-1.00 11 X 0.057"
1.00" X 0.057"----+ 0. 750" t. 0.041" 0.750" X 0.041'~ 0.500'' X O.U29"
b. Lot No. T4-018-030 Pass Schedule: 2.5 11 X 0.350" ' 1.625" X 0.200" 1.626" X 0, 200--• 1.00" •X. .0.0.95" 1.00" X 0.095"-+ 0. 75,5" X 0.06811
0.755 X 0.068"~0.500" X 0.029" 2. 0.375" O.D. X 0.022"W
a. Lot No. T4-002-00NR-1 Pass Schedule: 2.5" X 0.350" ) 1.750" X 0.205" 1.750" X 0.205"~ 1.2!50" X 0.143" 1.250" X 0.143"~ 0.840" X 0.08311
0.840" X 0.083"-:> 0.571" X 0.0365" 0.571 11
X 0.0365"~0.37511
X 0.022"
b. Lot No. T4-059-233A Pass Schedule:
145 't6-5722-3 P~ge II-10

N1UM TECHNOLOGY CORPORATION ATIACHNENT A
16/mds
2 . 5" x o. 1 eo" & 1 . 7 50" x o . 1 3 7" 1.750 11 X 0.137"~ 1.250" X 0.095" 1.250 11 X 0.095'~0.840" X 0.054" 0.840" X 0.054"->0.567" X 0.032" 0.56r X 0.032"~ 0.375" X 0.022 11
)~;;;;· · Dr. Ivan Baksa~~
Quality Control Manager
cc: C.E. Forney W.W. Stephens
146 T6-5722-3 Page II-11

... .. 0 I .. ,
-... ' • " a: 0 0 .. ... ... 0
5! ..
PART Ill - R-VALUE DETERMINATIONS ON FIVE Ti-3Al-2.5V COLD WORKED AND STRESS RELIEVED TUllES RECEIVED FROM THE BISHOP TUBE CO.
SUMMARY
Five Ti-3Al-2.5V cold worked and stress relived tube tensile specimens from the Bishop Tube Co. have been evaluated for crystallographic ~exture using R values determinations. All values were aoderate to low. having a range of 0.494 to 1.052. The relatively large diameter. thin walled tubes generally displayed the most preferred texture. a predominately radial orientation of basal plane poles.
INTRODUCTION
Five Ti-3Al-2.5V cold worked and stress relieved (CWSR) tube tensile epecimens from the Bishop Tube Co. were submitted to The Boeing Company for evaluation of crystallographic texture. The evaluation technique used was an R value determination as outlined in XBMS 7-234A. This type of evaluation i~ obtained by making tube diameter and wall thickness measurements~ tefting and after testing at approximately 1/4 to 1/2" from the fracture surface. The following fo~la has been used;
R • ln
RESULTS AND DISCUSSION
o.D.f
O.D. 0
~ ln w f
w 0
The diameter and wall thickness measurements made for the five tubes are shown in Table III-1 together with the calculated R values. (See Refer~nce 3).
The R value calculation& indicate that Tube No, 1 (large diameter-moderate wall thickness - 1.0" x .048") possessed a more preferred crystallographic texture than the 3/4" and 3/8" tubes that were tested. The results are in agreement with previous observations Lilat large diameter,rclatively thin wall tube has a more radial texture (preferred) then do smaller diameter.relatively thicker walled tube. The data indicates that Tube No. 6 had the highest R ratio of all the tubes tested, but the measurement accuracy on this 1/4" x 0,017" tube is considered to be poor because of the small 6 values involved.
All R values are somewhat lower than expected considering the eize ranges of the subject tubea. This could be a result of (1) relatively thin walled starting stock. (2) imperfect measurement techniques. or (3) overoptiaistic expectations on R value numbers. Uata accumulated to data indicates that all these ftelll8 may be responsible in part. Item 1, in particular. must be more thoroughly investigated .
.. 0~--------------------------------------------------------------------------------~
147 REV SYM •1111N• NO. T6-5722-3 +-

., ~
" "' ..... 1-1'4 .... f N
0~ .-tOO 7r4..'J OFCIG.a/71 J l6-047 XI - ..------------------~-----------------m ~ < 00
-------------------------------,
(I'
-< ~
I I I z !=' >-i a-I
V1 ...... N N I
w
Tube Number
1
2
3
4
5
TABLE III - 1 - R-VALUE CALCULATIONS FOR TI-3Al-2.5V CWSR TITANit~ TUBES MANUFACTURED BY THE BISHOP TUllE CO.
Tube Wall Thickness Outsi4e Diameter
Size Before Test After Test Before Test After Test (Inches) w - in. w - in O.D. - in O.D.f -in
0 f 0
1.0" X .048" 0.0485 0.0454 1.0015 0.9352
3/4" X .040" 0.0396 0.0365 0.7515 0.7102
)/4" X .040" 0.0400 0.0366 o. 7489 0.7168
3/8" X • 020 0.0196 0.0181 0.3777 0.3598
1/4 11 X , 017 0.0167 0.0158 0.2512 0.2370
-
R Value
1.038
0.695
0.494
0.606
1.052

I
I I
~I ~-I '~
:,:,
l'ART IV - THE EFFECT OF AGING AT 450°F ON TilE STRENGTH OF Ti-3Al-2. SV COLD WORKED AND STRESS RELIEVED TUBING
SUMMARY
The strength properties of 1" dia. x 0.033" wall Ti-3Al-2.5V cold worked ar.d str~ss ~elived titanium tubes have been examined with respe~t to t11e effect of aging at 450°F. A tube was exposed for 112 hours and ita properties compared to a standard unaged sample. No changes in strength or ductility were noted.
INTR.ODUCT 1 ON
Some fatigue data has suggested that Ti-3Al-2.5V cold worked and stress relieved (CWSR.) tubing is unstable at 450°F. The purpose of this investigation was to determine if 112 hours of aging at 450°F would cause an appreciable change in the ultimate and yield strength properties of 1.00" dia. x .033" wall Ti-3Al-2.5V CWSR. tubing. A change in these mechanical properties would indicate general instability of this heat treatment condition at 450°F and would suggest that more stringent limitations be imposed on proposed high temperature applications of this material.
RESULTS AND DISCUSSION
The tubing uaad in this investigation was as follows:
Tube: Condition:
Ti-3Al-2.5V per XBHS, 7-234A Cold Worked & Stress Relieved
Producer: R..M.I. Size: 1.00" x 0.033" Heat No. : H. T. 304042-22 Thermal Treatment: 450°i - 112 hours
The mechanical test rcflults are shown in Table IV-1.
TABLE IV-1 - Mechanical Properties of Aged and As-Received Ti-3Al-2.5V CWSR Tubes.
Condition
b Received
After Heat Cycle
UTS (ksi)
139.0
138.5
YTS (kd)
116.9
116.8
Elongation %
16.0
15.0
-0~--------------------------------------------------------------------------------------------------~
REV SYM -IIN•I•o. T6-S722-J PAGE: IV-1
149
+-

~I I i I !
,,
The results of these teats indicate that no degradation of .. chanica! PfOperties takes place in Ti-3Al-2.5V CWSR tubing during shert time exposure at 4so•F. (See Reference 4). Extended times at these temperatures may cause some reduction in strength but the present data would indicate that any effort of this type would be minimal. This investigation does not eliminate the possibility that fatigue behavior at 450°F, or after exposure at 4S0°F, may be ill affected in some manner but the prospect of >:hia happening is considered minimal ..
~
(·~--------------------------------------------------------------------------------~ 150 REV SYM -IINIII•o. T6-5722-3
PAGE IV-2
4
•