Embed Size (px)
Citation preview
UNCLASSI FIED
D4 3 8 0 1
EFENSE DOCUMENTATION CENTERFOR
SCIENTIFIC AND TECHNICAL INFORMATION
CAMERON STATION. ALEXANDRIA. VIRGINIA
UNCLASSIFIED
NOTICE: When government or other drawings, speca-fcations or other data are uaed for any pitryoeother than in connection with a definitely relatedgovernment procurment operation, the U. B.Government thereby incurs no responsibility; nor anyobligation whatsoever; and the fact that the Govern-ment may have forfulated, furnished, or in any waysupplied the said daings, specifications, or otherdata is not to be regarded by implication or other-vise as in any manner licensin6 the holder or anyother person or corporation, or conveying any rightsor permission to manufacture, use or sell anypatented invention that may in any way be relatedthereto.
0)~ AGARDograph 70A
< GA
AGARDograph
cjcL:j
FLOW VISUALIZATION IN
WIND TUNNELS USING
C) INDICATORS
Compiled by
R. L. MALTBY
1111111 I
APRIL 1962
N-0 OTSNO~~3 0r 4ANZT
AGARDograph 70
NORTH ATLANTIC TREATY ORGANIZATION
ADVISORY GROUP FOR AERONAUTICAL RESEARCH AND DEVELOPMENT
(ORGANISATION DU TRAITE DE L'ATLANTIQUE NORD)
FLOW VISUALIZATION IN WIND TUNNELS
USING INDICATORS
APRIL 1962
Copldby
R.L. frlt, n
Royal Aircraft Estbliluacut. Bedford. Rgland
This 18 one of a series of publi,'.tion8 b~y the AGMR - NATOV Fluid Dynamics Panel.
Professor Wilbur C. Nelson of The University of Michigan is the Lditor.
533.6.071.3
FLOW VISUALIZATION IN WIND TUNNELS
USING INDICATORS
compiled by
R.L. Maltby*
PREFACE
Throughout the history of aerodynamic and hydrodynamic research it has been neces-sary to devise methods of making the flow visible to the experimenter so that he mayunderstand its general nature before proceeding with detailed measuremcut or mathema-tical analysis, As the knowledge of the subSect had advanced and the demands of air-craft design have changed new methods of flow visualization have had to be developed;the use of smoke and tufts for the study of separated flows, chemical and evaporativetechniques for the identification of boundary layer tr.nsition, electric sparks forthe measurement of velocity profiles, and so on. Most methods involve introducingsome disturbing influence as indicators into the air flow and quatitative measure-ment becomes suspect. but these difficulties .re avoided in the pure optical methodswhich play such a large part in investigations on compressible flows. These opticalmethods have been discussed by Holder, North and Wood in AoAflDograph 23 ad thepresent AOARDograph i intended to exmine aome of the other flow visualizationtvuulqueb iu current use in British wind tunnel practice.
Many of the techniques which are well established have already been fully describedand a bibliography of these descriptiosa is included in Part V. Other techniqueswrhich have been devised and developed over the last few years to deal with currentproblems - particularly in relation to the understanding of separated flow resists -have not always been described In as such detail as they deserve. Indeed, since they
must be regarded only an a means to an end. few who make use of them have troubled toexamine their validity or to understand the phyasial principles invnlvcd. This isparticularly true of two of the most valuable methods for Investigating three-dimensional flow structures, namely the vapour sereaa .'chnique and the surfaue oilflow technique and the authors hate therefore concentrated on these problems ratherthan on including detailed descriptions of teohniques already adequately describedelseahere.
A Bibliography of indicator techniques Is given in Part V which is intended togive references ever the whole range of indicator techniques, particularly thosetechniques which are already well eatablished. Reference numbers given in the testare prefixed with the Part numbar to distinguish them from BibliograVhy items.
The AWAMugrash IF based on four papers already published ky the Loyal AircraftEstablisharnt. Section 1.2 ad Part IV uivs also bean pibllibed in the Journal ofFluid Mechanics.
R Roy l Atrcraft EstablItchent, iedfor'. England
ii'
CONTENTS
Page
PREFACE
LIST OF FIGURES
PART I
TIF SURFCF OIl, FLOW TECHNIQUE-
L.C. Squire. R.L. Maltby. R.F.A. Koatiog and A. Stanbrook
PART It
CHiNIQtFS FOR LOCATING 11OUNDARY
LAMYE TRANSITION "5
PART III
SN;0KE TECHNIqUES FOR USE IN LONSPEIED WIND TUNNELS
R.L. maltby and .IFA. hea(ing 83
PART IV
VEI.U)PENT OF THE VAPO1R SCREENMtETIIOD OF 1:,OI1 VISI AI.IZ710N IN A
3 FT 4 : FT StPE.lRSONIC wlint TI:NNFI,
I. WcGror.or III
PART I
BIB I OGILAPHfY I1G5
U0STRIBUTION
LIST OF FIGURES
PART I Page
Fig.1. 1 Co-ordinate system 50
Fig. 1.2 Variation of the thickness of the oil sheet at a
stagnation point 50
Fig. 1.3 Variation of the ratio H(= bilte) with a and y51
Fig.1.4 Variation of the ratio u L01 with at and -y5.
Pig. 1.5 Variation of the skin-fiiction or, a surface for differentvalues of the parameter >. 53
Fiu. 1.6 Oil strPamlne pattern on a yawed wing 54
Fig. I.7 Percentage reduction in apparent separation distatnce fordifferent oil shout thiclineatioa (h.Q) and aerofoilchords with 8pood 5
Fig. 1.8 Surface flow patternv on A !-I delta wing at a !d 5(chrytiene. kenittene. U-V lit) 54$
Flig. 1. 9 Surface flow pattern on yawed wing. Indlication of vortexbroakdown 5
Pig. 1. 10 Surface flow pattern. Formation of wavelets infiocculant mixture 5'!
Vi 61, 1. 11 Lutails of mobiieeetar M8
Fig.1. 12 Typical wobilomoter ras,.ltst on TIQ. - oil mixture 38
Fir'. 1 13 Thec effect of sui additive on a mixture of TIO, andkoroee 59
Fig. 1. 14 Photographic data for use in RAS lqw speed wind tuncia 60
Fig. 1. 1$ Flow 09~ delta winzc. ii - 200. lmvblack-kemone 81
Pig.L.16 Tranwit ion wedaes shown by TiO, -keriiwene mixture 61
Fis.. 1? Surface flow on portion efI 25r' swept wing( Willo, In U-V I ight) 62
Pi6.1. 18 SU1RtCIP flow pattern on 550 swept wing.(Anthracceu-kerof.e-ne. U-V l ight) 63
Page
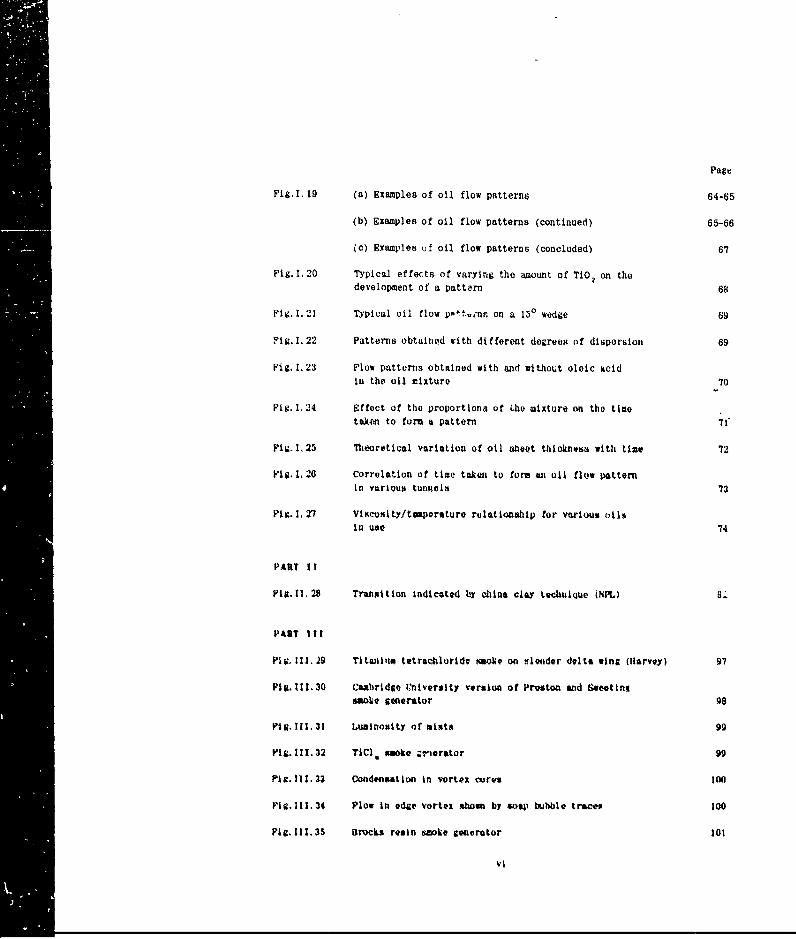
Fig. I. 19 (a) Examples of oil flow patterns 64-65
(b) Examples of oil flow patterns (continued) 65-66
(c) Examples uf oil flow patterns (concluded) 67
Fig. 1.20 Typical effec.ts of varying the amount of TiO. on the
development of a pattern 68
Pig. I.21 Typical oil flow p'"tt:nr on a 15° wedge 69
Fig. I.22 Patterns obtained with different degrees of dispersion 69
Pig.I.23 Plow patterns obtained with and without oleic acid
in the nil mixture 70
Fig. I. 24 Effect of the proportions of Lho mixture on the timetak~er to form a pattern 71"
Pig.1,25 Theoretical variation of oil shoot thickness with time 72
P1A. 1. 26 Correlation of time taken to form an oil flow patternin various tunneis 73
Pli. i. 27 Vitsctsity/tmperature relationship for verio.us ollaIn use 74
PART I I
PFi. II. 28 Transition indicated by chia clay i tec nique (PL)
PART III
Pig. 111.29 Tittntirmp tetrachloride smoke on sleader delta wing (larvey) 97
Pia. I.30 Cambridge Vniverslty veraloa of Prusta and Sw eting"",~e sonerator 98
Pi. 111.31 Ltminosity of mists 99
Pig .11.32 TICI. smoke r'ierator 99
Pig. 11.33 Ondensation in vortex curva 100
Pig.111.34 Plow in edge vortex show by wap bubble tracts 100
Pig. 111.35 Otrucks resin sooke generator 101
V1
Page
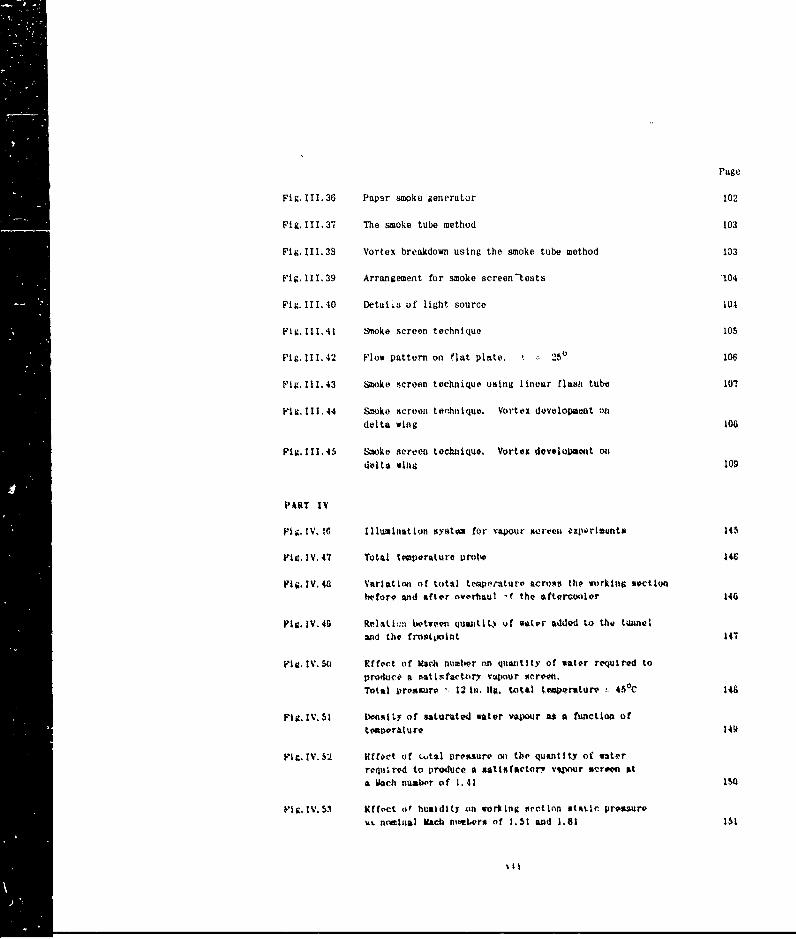
Fig. 111.36 Paper smoke generator 102
Fig. 111.37 The smoke tube method 103
Fig.III.38 Vortex breakdown~ using the smoke tube method 103
Fig. 111.39 Arrangement for smoke screen-tests '104
Fig. 111.40 Details of light source 104
Fig.III,41 Siioke screen technique 105
FIg.1II.42 Plow pattern on flat plate. t . 50 100
F'ig.III.43 Smoke screen techniquo using linear flua tube 107
Fic. 111.44 Smoke screen tehnique. Vortex development oitdelta winig 108
Pig.III.45 Smoke screen teehaiquo. Vortex development ontdelta Wiftit 109
PART IV
vi j. IVJ1 Illumination syatox for v'apour screen 4x.perients 145
Fig. IV. 47 Totl tmperature prot 1
F14.1v.48 Varlationi of total temperature 1kcrosa th. working sectitmboforv and after civortiul f~ the aftercolor 140
Pi i. IV. 40 Rlatit~ vetween quantity Uf water W~ed to the tunnel
and the froeLtoint 147
Vi 6, I . So Wfert of Mfach numtwer on qjuantity of water required toproduco a win~factory vtmpour scre-M.Total Prosouire - 21n. INg. total tompqroture 45 0C 349
Fig.IV.5l 11m."t Of saturated water Vpor as a function oftemperature I 44
FICA.V.52 Itffeet of t..tai vres-wure n the quantity of waterre'qui red to produci- m natinfat'tory ripaur screen at
a Wich numbewr a f 1. 43 M
Fla. IV. 53 IKffect of husidity sin vivr~ing mection atntic pressure%L% nomlinal Rich nivebers of 1.51 and 1.81 351
Page
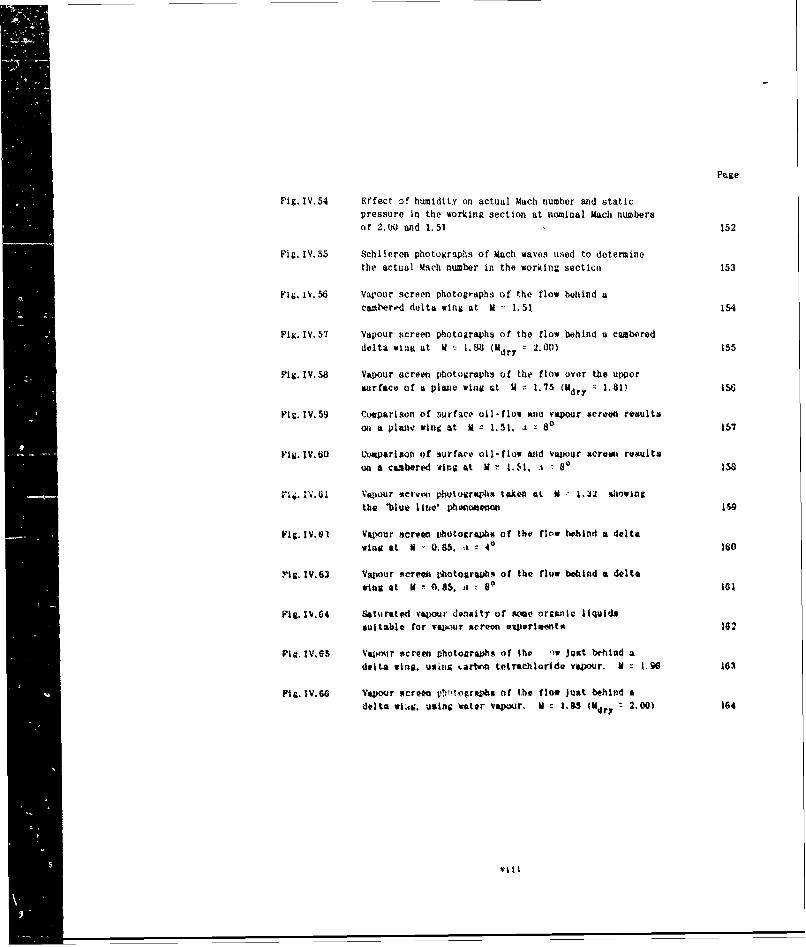
Fig.IV.54 Effect of humidity on actual Mach number and staticpressure in the working section at nominal Mach numbers
of 2.0JO and 1.51 152
Fig.IV.55 Schlieren photographs of Mach waves used to determinethe actual Mach number in the working section 153
Fig.1V.56 Vapour screen photographs of the flow behind acambere d delta wing at M = 1.51 154
Pi. IV. 57! Vapour sicreen photographs of the flow behind a cambereddelta wing at M 1.88 (Mdry 7 2.00) 155
Pig. IV.58 Vapour screen photographs of the flow over the uppersurface of a plne, wing at M z 1.75 (Mdry 7 1.81) 156
Pig. IV. 59 Cosparlson of urfscce oil-flow and vapour screen resultson a plaICw wing at M N 1.51, t So 157
Fig. MV,60 Coa arison of surface oil-flow wlid vapour screen rewultson a combered 'tire at M , 1.51. & 80 138
Vi I. 01.0 Vapour stern4i phtosrs;h take* at W N 1,3u showingthe 'blue Ilne, Plienoanon 149
Fig. IV.I Vapor scrven vhototraph# of the flow bohindt a deltawine at A " 0.,65. t , 40 I60
FIg. AV.63 Va ur rr(t otograA,.4 of th. flow behind a deltawing at M n 0.85. a - SO 101
Fti. SV.04 saturated vapour dvnxity of sme organic liquidssuitable for vapour screon oaperloonto 162
Pit. IV.e5 Vapnxir screwv photoaraphs of the .1w Just behind adel.a wine. usnir .art m totrachbloride vapour. W, 1.96 16,
PiC, IV.66 Vapour *cren 'hntograph of the fio just behind adelta wL-. using *ater vapour. M = 1.8 (MAdry 2.00) 164
vill

PART I
THE SURF~ACE OMt VIO' TIZCUIN!QII
CONTENTS
Page
LIST OF FIGURES 4
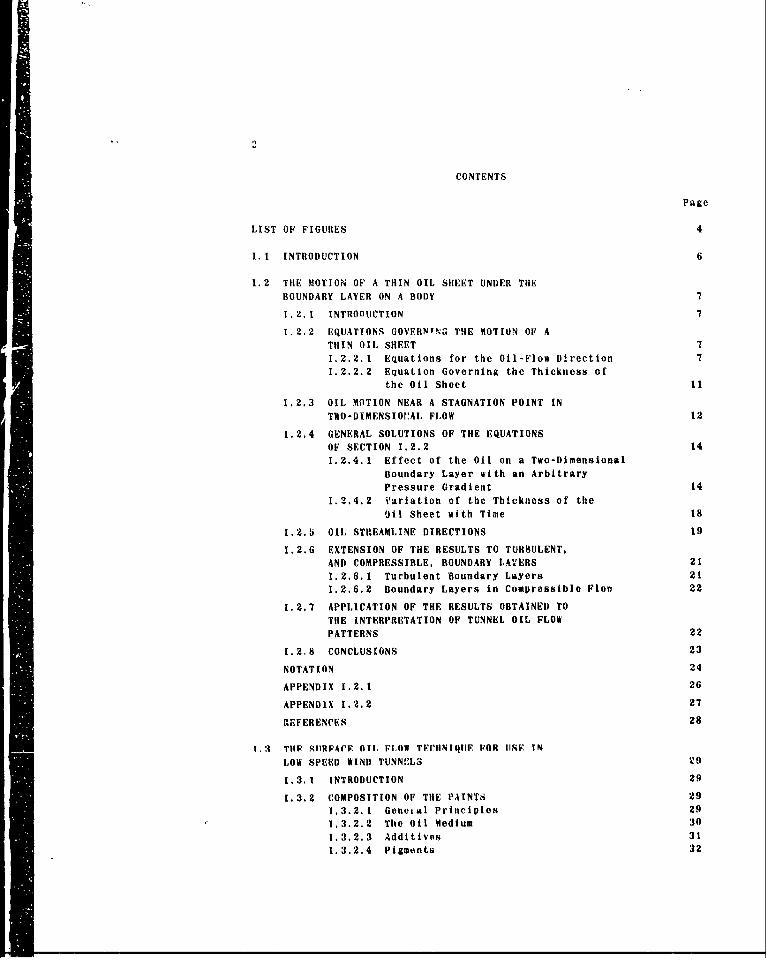
1.1 INTRODUCTION 6
1.2 THE MOTION OF A THIN OIL SHEET UNDER THE
BOUNDARY LAYER ON A BODY 7
1.2.1 INTROnUCTION 7
1.2.2 EQUATIONS GOVERNING THE MOTION OF A
THIN OIL SHEET 7
1.2.2.1 Equations for the Oil-Flow Direction 7
1.2.2.2 Equation Governing the Thickness of
the Oil Sheet 11
1.2.3 OIL MOTION NEAR A STAGNATION POINT IN
TWO-DIMENSIOVAL FLOW 12
1.2.4 GENERAL SOLUTIONS OF THE EQUATIONS
OF SECTION 1.2.2 14
1.2.4.1 Effect of the Oil on a Two-Dimensional
Boundary Layer with an Arbitrary
Pressure Gradient 14
1.2.4.2 Variation of the Thickness of the
Oil Sheet with Time is
1.2.5 OIL STREAMLINE DIRECTIONS 19
1.2.6 EXTENSION OF THE RESULTS TO TURBULENT.
AND COMPRESSIBLE, BOUNDARY LAYERS 21
1.2.6.1 Turbulent Boundary Layers 21
1.2.6.2 Boundary Layers in Compressible Floe 22
1.2.7 APPLICATION OF THE RESULTS OBTAINED TO
THE INTERPRETATION OF TUNNEL OIL FLOW
PATTERNS 22
1.2.8 CONCLUSIONS 23
NOTATION 24
APPENDIX 1.2.1 26
APPENDIX 1.2.2 27
REFERENCES 28
T.1 T1IE SIIRFACF L, FIOW TFClINIQIIF FOR 11SF IN
LOW SPEED WIND TUNN!iLS V9
1,3.1 INTRODUCTION 29
1.3.2 COMPOSITION OF TIlE PAINTS 29
1.3.2.1 GenetAl Principles 29
1.3.2.2 The Oil Medium 30
1.3.2.3 Additives 31
1.3.2.4 Pigments 32
3
Page
I .:1.:1 APPLICATION OF PAINTS 34
1. :1. 4 RECIPEs 34
1. I. .3 PIIIOtURAFHI I RUMING 35
I:.3.6 INTERPRETATION OF OIL FLOW PATTERNS 36
H0 1 IRE UNES 38
1.4 ll .4'REE OIL FLOW TECHNIQUE FOR USE IN1HhtH NPEEID WIND TUNNELS 39
1.4. I 1NTROIUCTION 39
1 4. 1 FPFRIiENT4I, STUDY OF TIE DEVELOPMENT
(IF THE PATTERN 391.4.2. Effect of the Pigment Concentration 391.4.2.2 Oleic Acid Additive 401.4.2.3 The Thickness of the Oil Sheet 42
1,4. A COMPARISON OF TIlE VARIOUS FORMS OFTHE TEC 'NIQUE 421.4.3.1 General Comments 421.4.3.2 Correlation of Running Times 44
1.4.4 U0LTIPLE PkTTERNS DURING A SINGLE RUN 45
1.4.N CONCLUDING REMARKS - REIOMMENUED MIXTURE 45AII'PE*tIX~g 1.4.1 4
EIF IEN E 49
FIUll*N 50
4
LIST OF FIGURES
Page
Fig.I,1 Co-ordinate system 50
Pig. 1.2 Variation of the thickness of the oi sheet at a
stagnation point 50
Fig.1.3 Variation of the ratio H(= b/) with a and 'y 51
Fig.!.4 Variation of the riattlo --a )with a and 52\ o h% aZ /
Fig. I.5 Variation of the skin-friction on a surface for different
values of the part.neter y . 53
Fig. 1.6 Oil streamline pattern on a yawed wing 54
Fig.1.I7 Percentage reduction in apparent separation distance for
different oil sheet thicknesses (h0 ) and aerofoil
chords with speed 55
Fig. 1.8 Surface flow patterns on A : 1 delta wing at a = 150
(chrysene. kerosene, U-V light) 56
Fig. 1.9 Surface flow pattlrn on yawed ing. ndication of vortex
breakdown 57
Fig.I.10 Surface flow pattern. Formation of wavelets in
ilocculent mixture 57
Fig. 1. 11 De'.ails of mobilomoter 58
Pig. I. 12 Typical mobilometer results on TIOg - ail mixture 58
Pig. I. 13 The effect of an additive on a mixture of TIO: and
kerosene 59
Fig. I. 14 Photographic data for use in RAE low speed wind tunnels 60
Pig.I.15 Flow 450 delta wing. a : 20'. lampblack-korosene 61
Fi. 1. Is Trazaltlu .vuuIu slikiwn 4y TiOl - xerosene mixture 61
Pig. . 17 Surface flow on portion of 250 swept wing
Mvglo' in U-V light) 62
Pig.J.18 Surface flow pattern on 55e swept wing.
(Anthracotae-keroeno U-V light) 63
N' 5
Page
Fig. 1. 19 (a) Examples of oil flow patterns 64 -65
(b) Examples of oil flow patterns (continued) 65- 66
(c) Examples of oil flow patterns (concluded) 67
Fig.I.20 Typical effects of varying the amount of TiO 2 on the
development of a pattern 68
Fig. I. 21 Typical oil flow patterns on a 150 wedge 69
Fig. I. 22 Patterns obtained with different degrees of dispersion 69
Fig. I. 23 Flow patterns obtained with and without oleic acid
in the oil mixture 70
Fig. I.24 Effect of the oroportions of the mixture on the time
taken to form a pattern 71
Fig. 1.25 Theoretical variation of oil sheet thickness with time 72
Fig.I,26 Correlation of time taken to form an oil flow patternin various tunnels 73
Fig. I. 27 Viscosity/tomperature relationship for various oils
II use 74
6
PART I. THE SURFACE OIL FLOW TECHN!q!JF
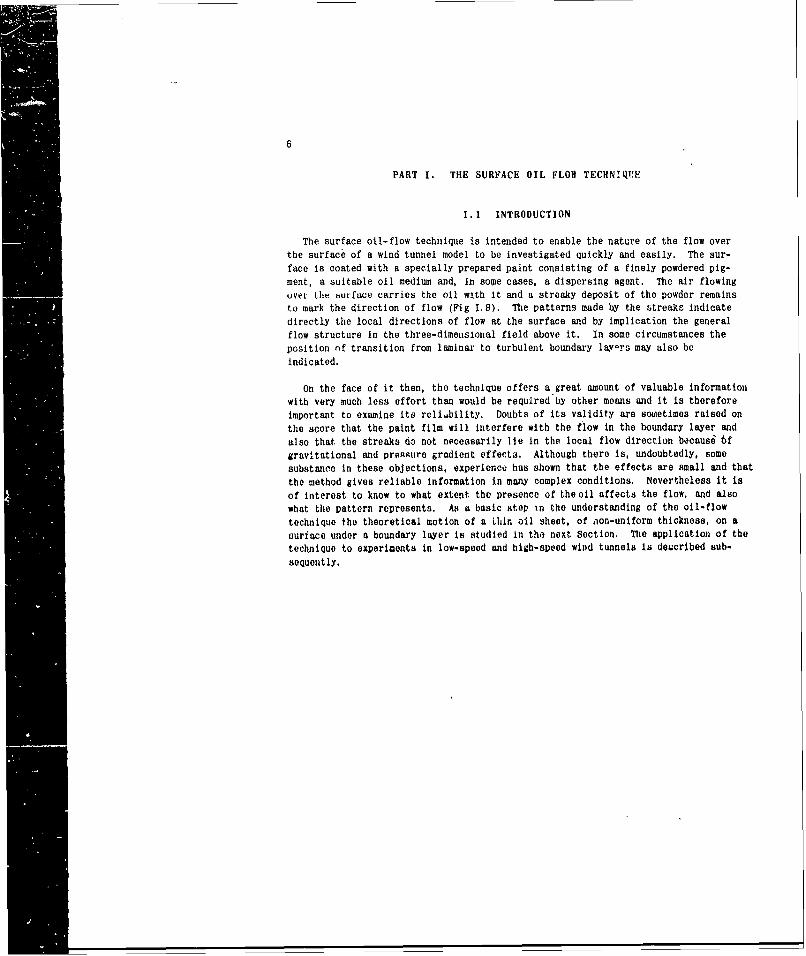
1.1 INTRODUCTION
The surface oil-flow technique is intended to enable the nature of the flow overthe surface of a wind tunnel model to be investigated quickly and easily. The sur-
face is coated with a specially prepared paint consisting of a finely powdered pig-ment, a suitable oil medium and, in some cases, a dispersing agent. The air flowing
ivee the burface carries the oil with it and a streaky deposit of the powder remains
to mark the direction of flow (Fig 1.8). The patterns made by the streaks indicatedirectly the local directions of flow at the surface and by implication the general
flow structure in the three-dimensional field above it. In some circumstances theposition nf transition from laminar to turbulent boundary la~vrn may also beindicated.
On the face of it then, the technique offers a great amount of valuable informationwith very much less effort than would be required by other means and it is thereforeimportant to examine its reli.bility. Doubts of its validity are som~etimes raised on
the score that the paint film will interfere with the flow in the boundary layer and
also that the streaks do not necessarily lie in the local flow direction beocaus 6fgravitational and pressure gradient effects. Although there is, undoubtedly, some
substance in these objections, experiencu has shown that the effects are small and that
the method gives reliable information in many complex conditions. Nevertheless it is
of interest to know to what extent the presence of the oil affectd the flow, and also
what the pattern represents. As a basic step in the understanding of the oil-flow
technique the theoretical motion of a Lhin oil sheet, of aon-uniform thickness, on a
surface under a boundary layer is studied in tho next Section. The application of the
technique to experiments in low-speed and high-speed wind tunnels is deucribed sub-
sequently.
7
1.2 THE MOTION OF A THIN OIL SIEET U!DFR TIlEBOUNDARY LAYER ON A BODY
L.C. Squire
1.2.1 INTRODUCTION
The main parameter in the problem is the ratio of the viscosity of the fluid in theboundary layer to the viscosity of the oil. The solutions obtained are valid for allvalues of this ratio likely to be found in practice. Numerical results have been pro-duced for infinite wings with velocity distributions outside the boundary layer of theform U = ax or U = P, -/31x. The parameters have been related to typical pressuredistributions and are calculated in Appendix I. 2. 1.
The numerical methods apply for incompressible laminar boundary layers; Lhe exten-sion of the results to compressible and turbulent layers is discussed in Sention 1.2.6.
1.2.2 EQUATIONS GOVERNING THE NOTION OF A THIN OIL SHEET
1.2.2.1 Equations for the Oil-Flow Direction
The thickness of the oil sheet, h , is a function of surface position and time.It is gennrally not greater thn about 0.05 in., and in the following analysis will beassumed to be of the same order as the boundary layer thickness. Then the motion of theoil is governed by the equations of slow viscous motion:
u2 = V 2 I p,t 2 , Tx (I. I)
2 P
av. - VV 2v 1 P2 (1.2)
w2 2V1'w Ip (1.3)
together with the continuity equation
au av iw
X z5+ i+T =0. (1.4)
The co-ordinate system, and velocity components are defined in Figure 1. 1. The suffix 2refers to motion in the oil and suffva n snd I rAeffr to ?rPP-RtrPsm nnd oi rldnrylayer flow :Iespectively. The boundary conditions are (i) that the oil velocitios areequal to those in the boundary layer at the surface of the oil, (ii) that the v.s-cous stresses in the oil and the air are also equal at the oil/air surface, and(iii) that at the body surface the oil is stationary. These conditions may bewritten:
ul = u2; v, = v2; w, = ww at z =
(1.5)u:=v2 w, 0 at z0 J
8
1 2 3 -
'U 2L- 2 at z =h. (1. 6)
Equations (1.1) to (1.3) will now be simplified by order of magnitude considerations.taking account of two small quantities, the boundary layer thickness. 5, and the ratio
of the viscosities of air and oil, ~--( .say)
Ry standard boundary layer theory,
1and ar
Thus by Equation 1I.6),
D..2. and L-i are 0 -I
At' z = 0 , u2 and v, are zero,. thus within the oil u, and v, are 0(X) theirderivatives with respect to x and y are also of the same order.
awFrom tho continuity equation, it then follows that 7 it; 0X) anid, since
2- 0 at z=0 , that w 2 is 0(X S) . Differentiating the continuity equation
with respect to z then shows that WW2 is 0f.-)a-2
The order of the terms !2 2L2wl now be considered. It has already bcon*t a il
shown that i',,v, are 0(N) ,and so their influence on the boundary layer will besmall. In thia~ case Equations (1.1) to (1.6) represent the motion of an oil shoetunder a steady boundary layer, in which the only variation woith time enters throughthe boundary conditions (1.6) and (1.6), since h is a function of time. Thereforethe derivatives under consideration may be written
002 1u,0 dh av2 aV dh
at N. dt- a5t -5h dt
dh dh au2 av~At the edge of the layer w, -, thus - is 0(S M) while -, - have the(it cit
au avisame order as -? . LL- , namely 0(T Thus the time derivatives of u, and V.1z 3
For the derivation of thitt boundary condition see Apperdli 1.2.2.
For the ratnue of oill utied lit tunnels X~ leg lin the range 10O2 to10
9
are 0(W) . Similarly, the derivative L is 0(A 2
8). When the orders of theat
terms in Equation (1.3) are considered it is found that the pressure change throughthe oil layer is 0( 8) . Thus the pressure may be regarded as constant through theoil layer, and since by standard boundary layer theory
Po(x,y) = p1 (xoy)
then
P,(xY)= P 1 (xY) po(x.y) . (1.7)
If Equations (1.1) and (1.2) are now divided by L,2 , the pressure terms may he
written (remembering P0 pl)
:
~I aP2 ap ar po
-X -- -- (1.8)
ap a - ,
ii. ay lit t' I PO(.
By boundary layer theory 8 ip 0(o-) while by Bernoulli's equation -- and- P, axpo are 0() . Thus the pressure terms in Equations (1.8) nd (1.9) are 0
Equations (1. 1) and (1.2) msy now be simplified by retaining terms of the hlighestorder only, when they become
a2 - PIa
In Equations (1.10) and (1.11) the pressure terms are known from the external flow sothat the e,'uat ions are ordinary second order equations for u, and v . Theseequations must be solvvd, ln conjunction with the boundary layer equationa
): D du 1d uUl ' I a ---- y
,
a Se 6 (1.12)*
•S" (i{ oto~ oil 1)&& 10.
10
3v1 ap D r (1.12)*
--x!+ 1DY +w z P , ay.1 3-*
Du v ~WI + I = 0
to satisfy the boundary conditions (1.5) and (1.6). A simple iterative approach usedhere. is to find solutions of Equations (I. 10) and (I, 11) satisfying the conditions
-2 ua = = 0 at z = 0
and
A A,2 at zh =
The third condition is then satisfied by finding a solution of the boundary layerequations such that at z = h , u, = (u2)z-h I vi = (v2)z.h I . where (u,) ,.h and(v,),., are found from the solution of the oil flow equations. This process is
iterittive siace U and T) depend on (u) nd (v2)Z.h . HoweVer.
since these velocities are OfX) the changes in and k , are also
small and so the process ahou)d converge quickly.
By direct Integration of Equations (I.10) and (1.11) solutions which satisfy thetwo boundary conditions are:
((±.,14)
At the oil surface, z t h
Equatlons (1. 12) uand (I. 3) apply only for a flat aurfRcu. but thOy may be used on %lightlycurved aurface*. On mra hlghly eurvd sutface .tho full equations must be u*d (seeRef. 1.2.4),
he boundary toncditim - * W1 ahou alao b Wilaed but as v Is O(k.$) this cdi-
tion is reploced hy - - I at z - h
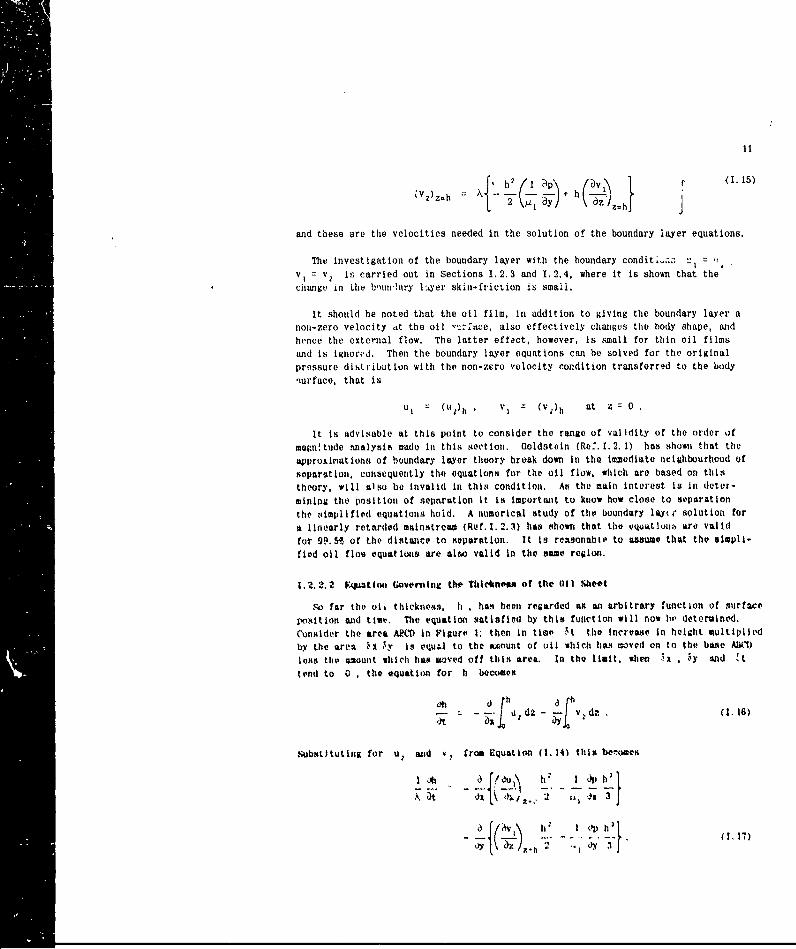
'~z~~h {h'(~' zr 1. 15)
1.
and these are the velocities needed in the solution of the boundary layer equations.
The investigation of the boundary layer with the boundary conditi'a.Z _-, = %
v, = v2 is carried out in Sections 1.2.3 and 1.2.4, where it is shown that thechunge in Lhe bounlnry b1yer skin-frivtion is small.
It should be noted that the oil film, in addition to giving the boundary layer a
non-zero velocity tt the oil "::aee, also effectively changes the body shape, andhence the external flow. The latter effect, however, is small for thin oil films
and is ignor?d. Then the boundary layer equations can be solved for the originalpressure distribution with the non-zero velocity condition transferred to the body-iurface, that is
u, =(u) V, = (v)h at z = 0
It is advisable at this point to consider the rango of validity of the order ofmagnitude analysis made in this section. Goldstein (Re!.1.2.1) has shown that the
appruxinations of boundary layer theory break down in the immediate neighbourhood of
separation, consequently the equations for the oil flow, which are based on thistheory, will also be invalid in this condition. As the main interest is in deter-
mining the position of sepnration it is important to know how close to separation
the simplified equations hold. A numerical study of the boundary lay'" solution fora linearly retarded mainstrem (Ref. 1. 2,3) has shown that the vquatiolln are valid
for 99.5 of the distance to separation. It is reasnnable to assume that the simpli-fled oil flow equations are also valid in the same region.
I.2.2. .ation WVerni t th h irhaekn, um of the Oil Meet
so far the olt thickness, h , has been regarded aS an arbitrary function of surfaceposition and time. The equation satisfied by this function will now be determined.
Consider the area ACD in Figure h: then In tifae ,t the Increase in height multiplied
by the area Ix Sy is equal to the *Aount of oil which has moved on to the base A1M
less the amount Which has Moved off this area. In the limit. when ,A N 'y and "t
tond to 0 . the equation for h bocodis
-- I d2 vd? (1.16)
Substituting for u, and v, from Equation (1. 14) this be"oes
I~~~~~ ~ ~ ~~ 3h , 1iJ. , .- I ph
O(1 017)
12
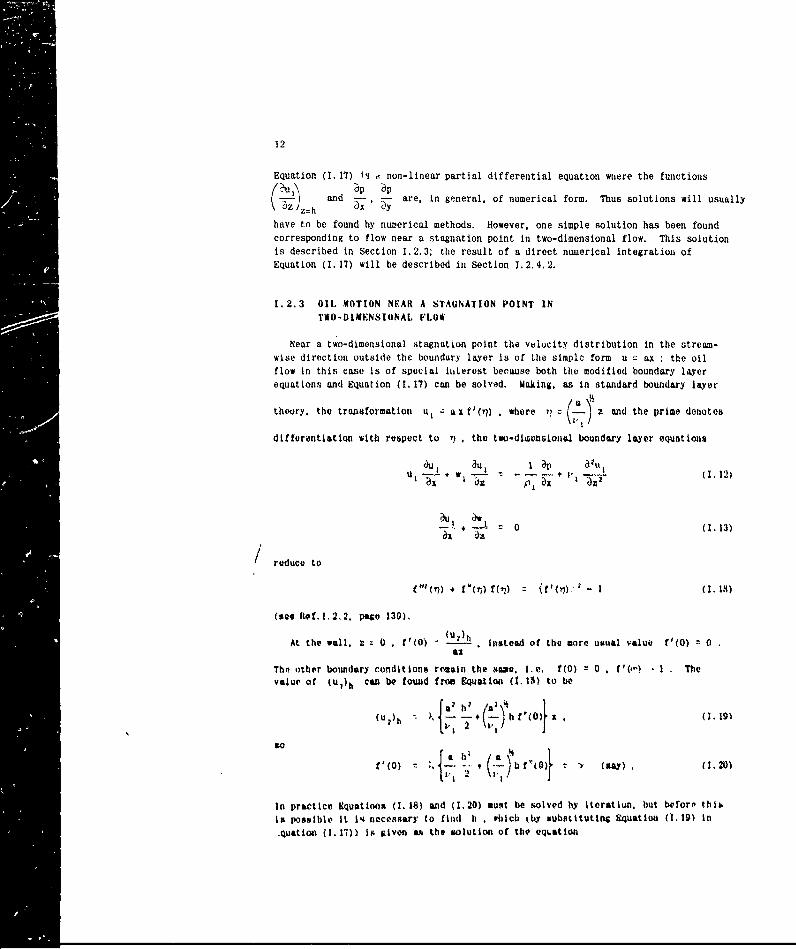
Equation (I. 17) is e non-linear partial differential equation where the functions! u, p pr ,- and op , are, in general, of numerical form. Thus solutions will usually
have tn be found by nuzerical methods. However. one simple solution has been found
corresponding to flow near a stagnation point in two-dimensional flow. This solution
is described in Section 1.2.3; the result of a direct numerical integratiou of
Equation (1.17) will be described in Section 1.2.4.2.
1.2.3 OIL MOTION NEAR A STAGNATION POINT IN
TWO-DIMENSIONAL FLOW
Near a two-dimensional stagnation point the velucity distribution in the stream-
wise direction outside the boundary layer is of Lhe simplc form u = ax : the oil
flow in this case is of special iLerest because both the modified boundary lxyer
equations and Equation (I. 17) can be solved. Maki g, as in standard boundary layer
theory, the transformation u - ax f'(77) . where -, L) z and the prime denotes
differentiation with respect to r, the two-diwc sional boundary layer equations
au au I ap 32
u u A W11%I LL(.2
-I0 (1.13)al a
reduce to
(ao Refl..2.2, page 139).
At the wall, x : 0 . f'(O) - I * instead of thu anro usual valuo f'(O) : 0as
The other boundary conditions retain the some, I.e. f(O) 0 . V(-) - I Thevalue of (uO)h can be found fron Equation (I10) to be
(u dh ( h (0(0)f a *(I. l91
f'(O) ;, . * ( f'b O) - (nay) . (1.20)
In practice kquatlnon (I. 18) and (1,20) must be solved by Iteration, but twfor, this
is possible it 14 necessary to find h , which thy substituting Equation (0. 19) in
.quatioll (1. 17)) is given as the solution of the oqLation
13
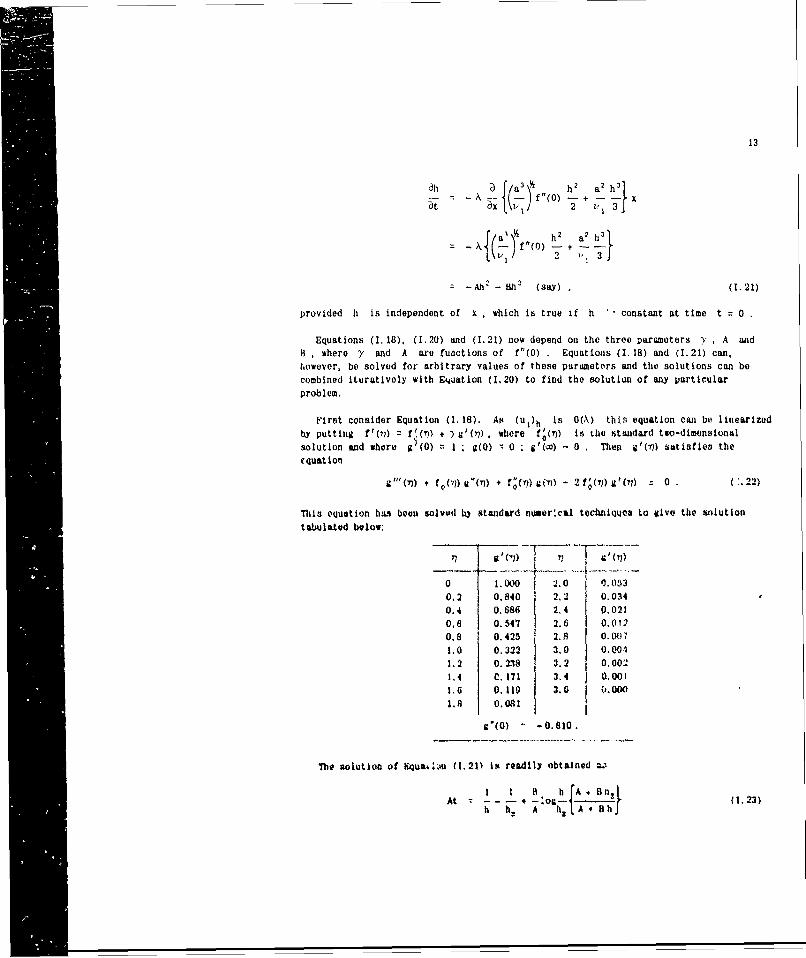
Ih - A f'(O) - . x
2 3}
-Ahn - Bh1 (say) . (I.21)
provided h is independent of x , which is true if h - constant at time t 0
Equations (1.18), (1.20) and (1.21) now depend on the three parameters - , A and
8 , where - and A are functions of f"(0) . Equations (I.18) and (1.21) can,
however, be solved for arbitrary values of these parameters and the solutions can be
combined iteratively with Equation (1.20) to find the solution of any particular
problem.
First consider Equation (1. 18). As (u1 )h is 0('\) this equation can be linearized
by putting f'(7) = f'()l + ) I(i) , where f.0() is tile standard two-dimensional
solution and where a (0) = I . g(0) ': 0 . g() - 0 . Then g'(T) satisfios theequation
g "(77) + f g'(r)UNT) + o(n)gi) - 2 f'( ) g'(T i 0 . (.22)
This equation has been solvod b* standard nuaer.cal tchnilques to givo the *)lution
talulated below:
0 1.00 1 2.0 0.053
0.2 0.840 2.2 0.034
0.4 0.686 2.4 0M021
0.6 o.547 2.6 0.01?
0.8 0.425 2.8 0.001
1.0 0.322 3,0 0. 04
1.2 0.238 3.2 0.0021,4 C.I71 3.4 0.001
1.0 0.11 3.6 (J. 0O01.8 0.0qI
V'(0) -0.810.
The aolution of &qu&4. m (1.211 is readily obtained a.'
t t o -A Bnz (Il.)
At h - A huL, A BbJ
14
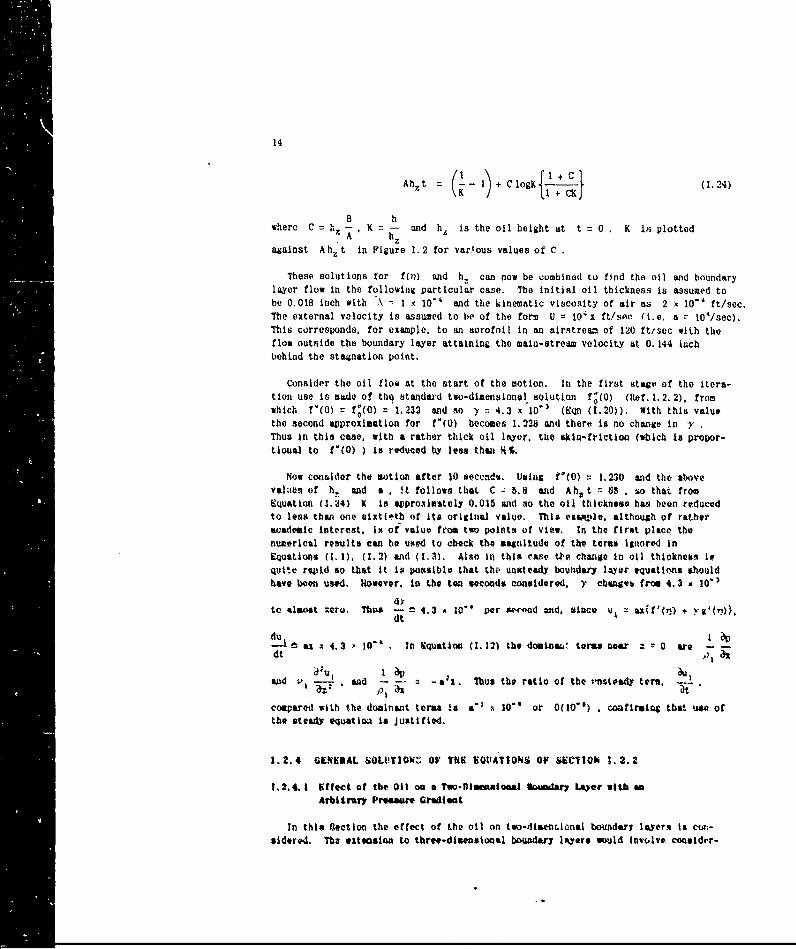
Ah t ( I )+ ClogK{kX 0I.24)
B hwhere C = hz A-. K - and h4 is the oil height at t = 0 . K is plotted
.A hagainst Ah, t in Figure 1.2 for various values of C
These solutions for f(n) and h. can now be combined to find the oil and boundarylayer flow in the following particular case. The initial oil thickness is assumed to
be 0.018 inch with \ I x 10°" and the kinematic viscosity of air as 2 x 10
" ft/sec.
The external velocity is assumed to be of the form U =- 104x ft/,se (i.e. a - 10'/sec).This corresponds, for example, to an aerofoil in an airstream of 120 ft/sec with the
flow outside the boundary layer attaining the main-stream velocity at 0. 144 inch
behind the stagnation point.
Consider the oil flow at the start of the motion. In the first stage of the itera-tion use is made of thQ standard two-dimensional solution fi(0) (Ref. 1.2. 2), fromwhich f'(0) = f0(O) ='1.232 and so y
= 4.3 x 10
" (M~n (1.20)). With this value
the second approximation for t"(O) becomes 1. 238 and there is no change in -y
Thus in this case, with a rather thick oil lavor, the skin-friction (which Is propor-
tioual to fV(O) ) is reduced by leas that 4%.
Now coauider the motion after 10 soccds. Using f'(0) 1.230 and the abovevaltie of h. and a . !t follows that C -' 5.8 and Ahrt = 65 . so that from
Equation (l,24) X i a.pro, mately 0.015 and so the oil thickness has been reduced
to less than one sixtietb of its original value. This oexangle, although of rather
academic interest, in of value f' om two points of vIow. In the first place the
numerical results can he us ed to check the magnitude of the teras ignored In
Equations (M, 1). (M.2) and (M.3). Also i this case t4Oe change In oil thickne"s isqittte rapid so that It is possible that the, unsteady bounda y layer equations shouldhave boen used. However. in the ten seconds considered, ) cbzgtb from 4.3 a 10")
dy
to al 43t ero. Thus-- n a 4.3 * 1." 2r b- ad. since u, = e(r(7e) r 0 Yjre00.
dt p x
and v, ad i - ax. Thus the ratio of the i§tely tern.
compared with the dominant terms is a" . I0"* Or 0(10-) . confirming that use ofthe steady equatioa is Justified.
1.2.4 GiENERAL SOLUTION.*. OF TOR E11QATIONS Of SECiION 1. 2.2
1.2.4.1 Effect of the Oil on a Two-Dimemaiaal 0-osdary LWar with m
Arbitrary Prouaure Graliet
In this Section the effect of the oil on too-dismn.ianal bDundary layers i cm,-sidered. The exteasloa to three-dimensionai boundary lyer* would involve cousidrr-
15
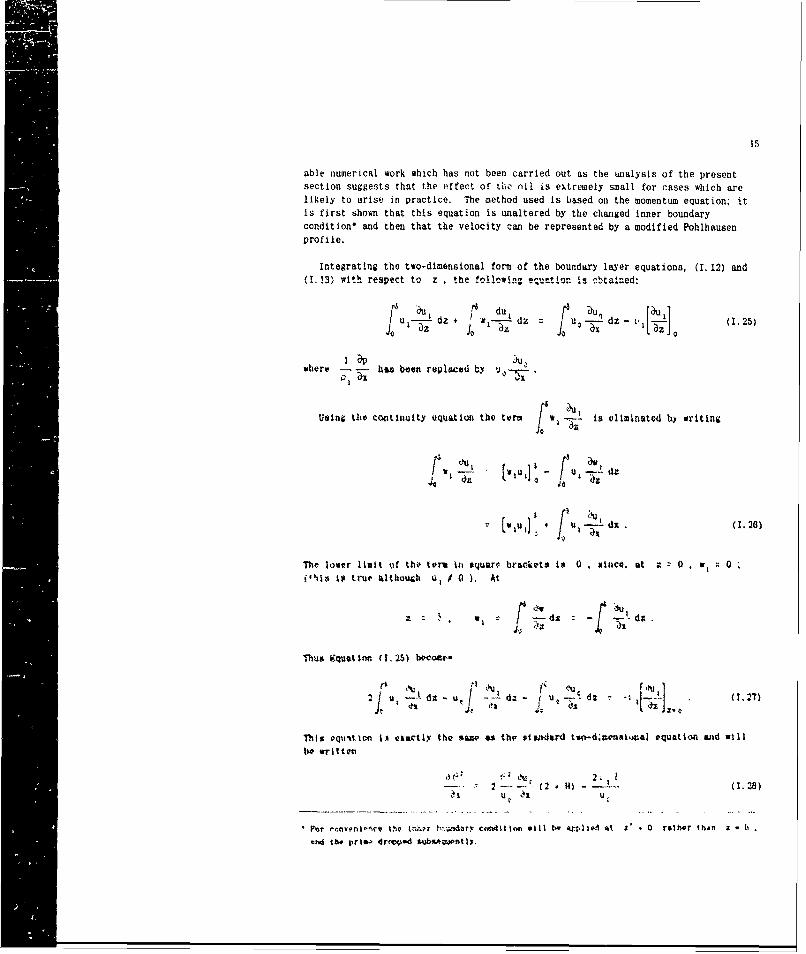
able numerical work which has not been carried out as the analysis of the present
section suggests that the 'offect of thic nil is extremely small for cases which are
likely to arise in practice. The method used is based on the momentum equation; it
is first shown that this equation is unaltered by the changed inner boundary
condition* and then that the velocity can be represented by a modified Pohlhausen
profile.
Integrating the two-dimensional form of the boundary layer equations, (I. 12) and(I. 13\ with resp"ect to z ,the following equttion is btaincd:
dz + It du1 10 u dz 1 - (1.25)0
where I-'D has been replaced by u - .
Using tite continuity aquation) the tarm *I -j is eliminated by writing
40
[,,q'o t ,;
~¢
riv lower limit of tho toe In wcqu5ro br"d ts to 0 wince. at z 0 W, 0N'him 1 true although 4 i 0 ). At
Thus ftiatlmo (1.25) beoot
2 1U, -1 d~t - U -4z7(.7
iTi equ-ttion 1. ewactly the ,ise as the s~lderd tu'-4t,.Wrdi equation arod will
b uwritteu
2 (2 - 28ut ' x u
P~r rv."r~nt)1w t.'v Ni %r afdry ccsattio vill t- 4.elIP. at ;t' 0 rather than a 11I
16
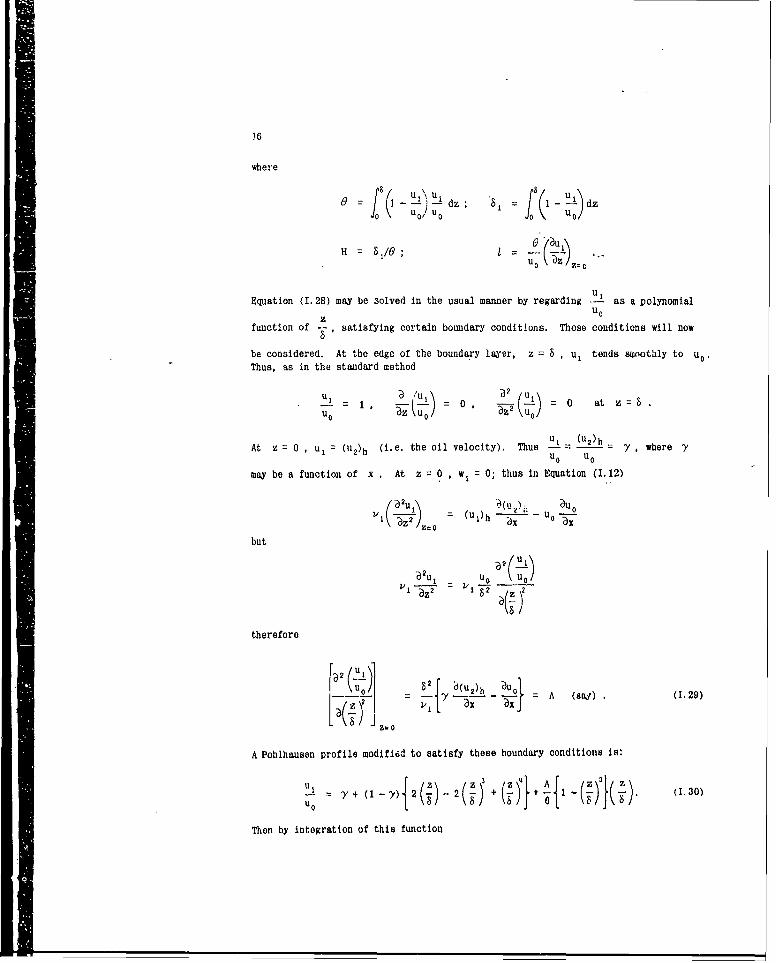
where
IY - -- dz 1 8(1 -
Ho,= uo = Uo
u1
Equation (1.28) may be 3olved in the usual manner by regarding --- as a polynomial
z U
function of -, satisfying certain boundary conditions. These conditions will now
be considered. At the edge of the boundary layer, z = S u, tends smoothly to u0 .
Thus, as in the standard method
-- = I .0 -- o at z5
At z = 0 , u = (u2)h (i.e. the oil velocity). Thus L u 2 = - , where Yu0 u0
may be a function of x . At z = 0 , w, = 0; thus in Equation (1.12)
1(U)h x u°
but
-3 (uUI\
1 152 -( z 2
therefore
D 'Uo0 82 2(U)h 0Ly - = A (sa) . (1.29)
A Pohlhausen profile modifivd to satisfy these boundary conditions is:
-= 0+ (1 - ) 2( .. 2( + j + I - ( . (1.30)
Then by integration of this function
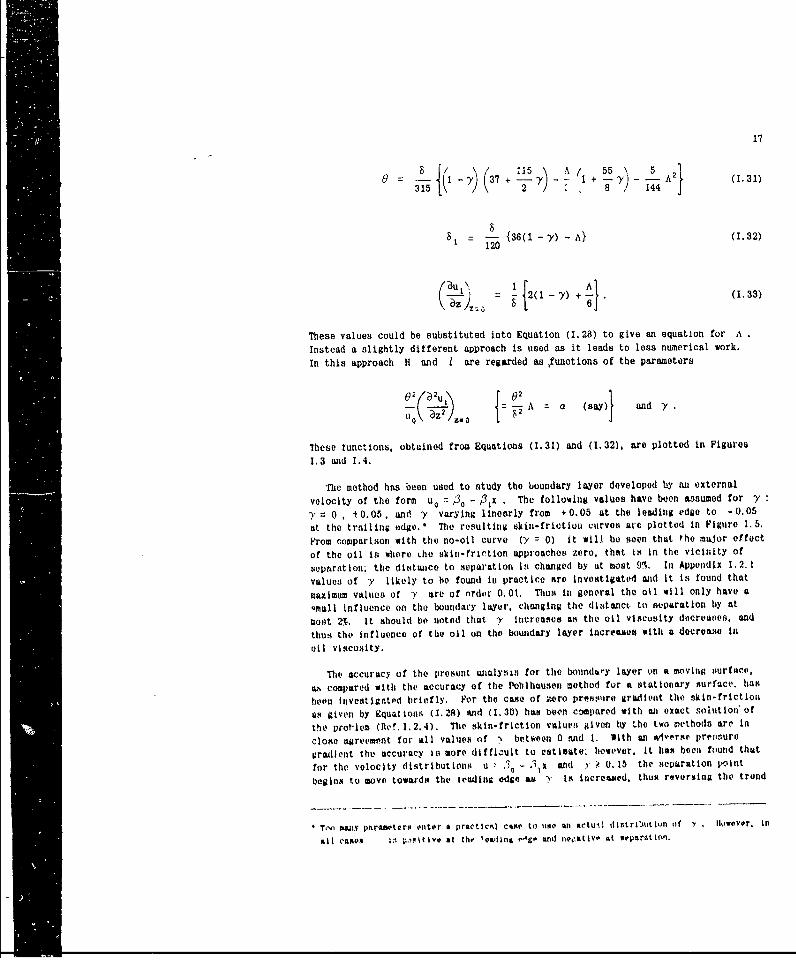
17
8 {( Y I 37+ -- + - A2} (1.31)
8 {36(1 - Y) - A} (1.32)120
-1z 20 - Y(-) + Al (1.33)
These values could be substituted into Equation (1.28) to give an equation for A
Instead a slightly ditferent approach is used as it leads to less numerical work.
In this approach H and I are regarded as ,functions of the parameters
02 Dul 02 ad
-i -w -TA (say)} ad
These functions, obtained from Equations (1.31) and (1.32), are plotted in Figures
1.3 and 1.4.
The method has been used to study the boundary layer developed by an external
velocity of the form u, r 3, - Olx . The following values hive beon assumed for "
y = 0 , t0.05, and 'y varying linearly from +0.05 at the leading edge to -0.05
at the trailing edge.* The resulting skin-friction curves aire plotted in Figure 1.5.
From comparison with the no-oil curve (y = 0) it will be seen that the major effect
of the oil is where the skin-frintion upproachos zero, that is in the vicinity of
separstion; the distance to separation is changed by at most 9%. Ili Appendix 1.2.1
values of y likely to lie found Iii practice are investigated mid it is found that
maximum values of -y are of order 0.01. Thus In general the oil will only have a
emall influence on the boundary layer. changing the distanct to separation by at
most 21., It should be noted that -Y increases as the oil viscusity docreases, and
thus the Influence of the oil on the boundary layer Increaus with a decrease in
oil viscosity.
The accuracy of the present analysis for the boundtay layer on a moving surfte.
compared with the accuracy of the Poohilhausen method fur a stationary surface. has
boon invostligated briefly, For the coe of zero preisplire graditint the skin-frictlon
as given by Equations (M. 2$) Knd (1. 30) has been comtpared with an exact solution' of
the prot-lm (Ref. 1.2.4). The skin-friction valuts given by Lhe two me'thods are In
close agreement for all values of N between 0 mid 1. 11th i wivers' lprennurv
gradielnt thL, accuracy in more difficult to estimate however. It ling been found that
for the velocity distributions u - 30 - .,ax and y 0.15 the separation point
begins to move towards the ieading edge as y is increased. thuN reversing the trend
T,-o aanv paraa'torg enter a practicil cAe to uwo an actu1l distriution of -Y . hIowevor. in
ill camon i. t livao at e tar loviinw ..- and line.itivv at reparatifnn.
18
shown in Figure 1.3 for / < 0.05 . This forward movement of separation Is contraryto the expected physical dction of the moving surface and suggests that the Pohlhausenmethod becomes less accurate for large values of y/ .
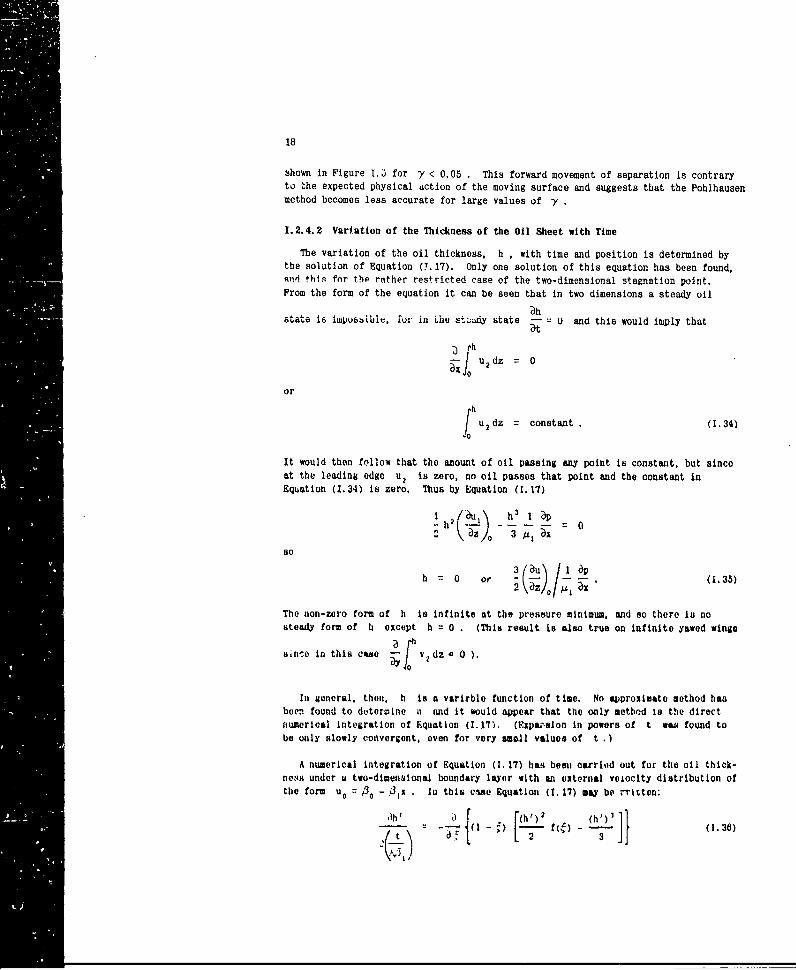
1.2.4.2 Variation of the Thickness of the Oil Sheet with Time
The variation of the oil thickness, h . with time and position is determined bythe solution of Equation (.17). Only one solution of this equation has been found,.t. d this for thp rnther restricted case of the two-dimensional stagnation point.
From the form of the equation it can be seen that in two dimensions a steady oilb h
state is iwpubbibi, fw- in the study state - = 0 and this would imply that
- ]u 2 dz = 0
or [hu 2 dz = constant. (1.34)
-i
It would then follow that the amount of oil passing any point is constant, but sinceat the leading edge u2 is zero, no oil passes that point and the constant inEquation (1.34) is zero. Thus by Equation (1.17)
I h /2 u1 \ h3 I Dp• -- h ,-/,o =
2 3z - 3 0x
so
h 0 or 3 I a (1.35)2 \ Z- /I M1
The non-zero form of h Is infinite at the pressure minimum. and 8o there is nosteady form of I except h = 0 . (This result is also true on infinite yawed wings
s6|ico in this cLse 5yf vdz o 0).
In general, then. h Is a varirble function of time. No approximate method hasbeen found to determine o and it would appear that the only method is the directnumerical integration of Equation (1.17). (Expa;-:lon in powers of t was found tobe only slowly convergent, oven for very small values of t .)
A numerical integration of Equation (I. 17) has beeo carriod out for the oil thick-ness under u two-dimensional boundary layoer with an external veiocity distribution ofthe form uo = 3 0 - .3 ,x • In this c.uo Equation (1. 17) may be r-ritton:
(I- 0 f - 11(1.30)m2
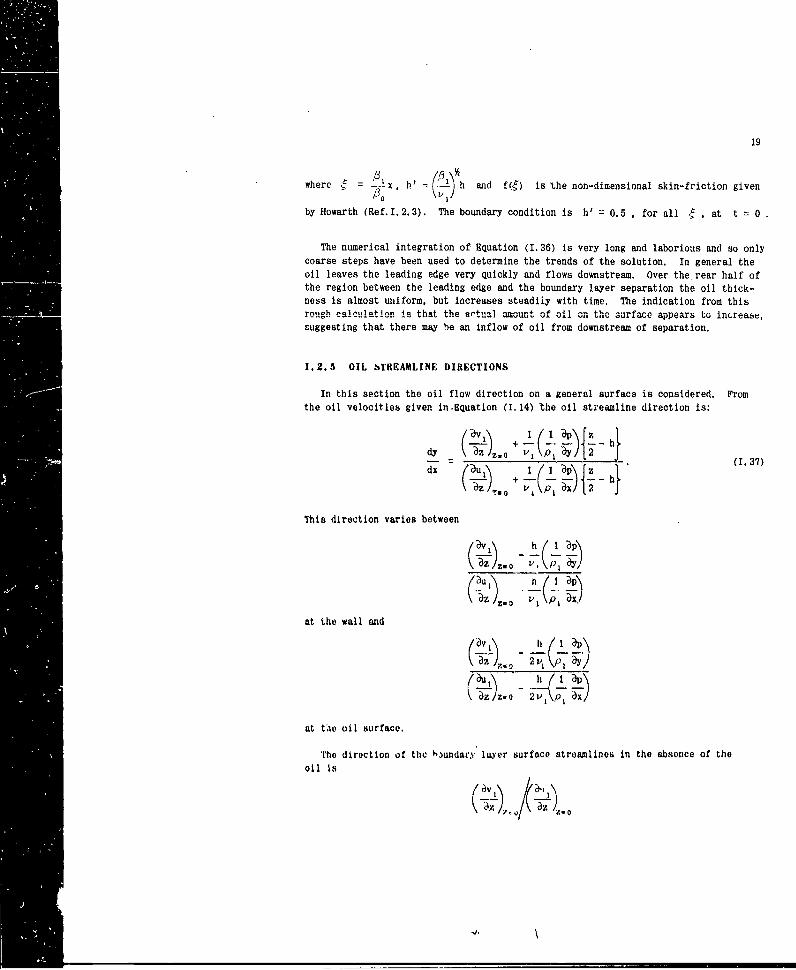
19
where $h and f( ) is 'the non-dimensional skin-friction given30 P1
by Howarth (Ref.I.2.3). The boundary condition is h' = 0.5 , for all , at t = 0
The numerical integration of- Equation (1.36) is very long and laborious and so onlycoarse steps have been used to determine the trends of the solution. In general theoil leaves the leading edge very quickly and flows downstream. Over the rear half ofthe region between the leading edge and the boundary layer separation the oil thick-ness is almost uniform, but increases steadily with time. The indication from thisrough calculation is that the n.tu] amount of oil on the surface appears to increase,suggesting that there may he an inflow of oil from downstream of separation.
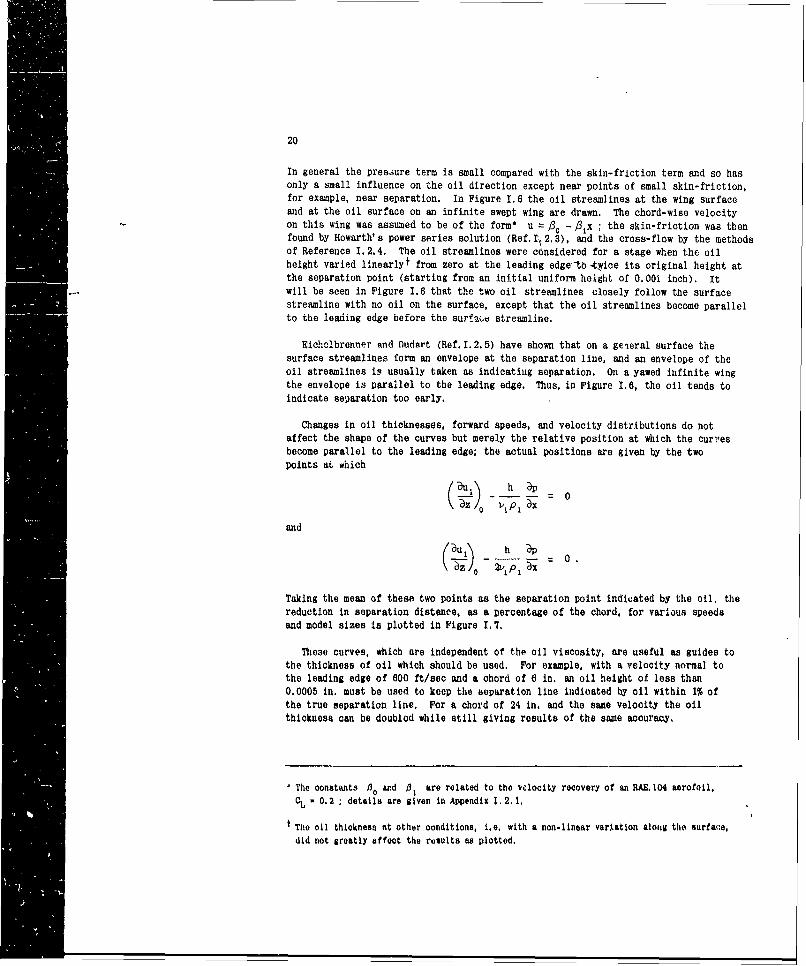
1.2.5 OIL STREAMLINE DIRECTIONS
In this section the oil flow direction on a general surface is considered. Fromthe oil velocities given in-Equation (1.14) 'the oil streamline direction is:
/ z ~ v N1 I a n \ haI
vdy \ Z/z~o + /2 hdy 'a V 1 P1
(I. 37)dx (Ui..0 z
This direction varies between
- h(z 0
at the wall and
(-; 2t~ pa(aul h 1
at the oil surface.
'he direction of the h)undary layer surface streamlines in the absence of theoil Is
3_
\z ! 4
20
In general the pressure term is small compared with the skin-friction term and so hasonly a small influence on the oil direction except near points of small skin-friction,for example, near separation. In Figure 1.6 the oil streamlines at the wing surfaceand at the oil surface on an infinite swept wing are drawn. The chord-wise velocityon this wing was assumed to be of the form* u =,80 -,3,x ; the skin-friction was thenfound by Howarth's power series solution (Ref. I 2.3), and the cross-flow by the methodsof Reference 1.2.4. The oil streamlines were considered for a stage when the oilheight varied linearlyt from zero at the leading edge-t o-tice its original height atthe separation point (starting from an initial uniform height of 0.00I inch). Itwill be seen in Figure 1.6 that the two oil streamlines closely follow the surfacestreamline with no oil on the surface, except that the oil streamlines become parallelto the leading edge before the surfao streamline.
Eichclbrenner end Oudart (Ref. I.2.5) have shown that on a geieral surface thesurface streamlines form an envelope at the separation line, and an envelope of theoil streamlines is usually taken as indicating separation. On a yawed infinite wingthe envelope is parallel to the leading edge. Thus, in Figure 1.6, the oil tends toindicate separation too early.
Changes in oil thicknesses, forward speeds, and velocity distributions do notaffect the shape of the curves but merely the relative position at which the curtesbecome parallel to the leading edge; the actual positions are given by the two
points at which ( u3uo h Dz -p1 x 0
and
0 .
Taking the mean of these two points as the separation point indicated by the oil, thereduction in separation distance, as a percentage of the chord, for various speeds
and model sizes is plotted in Figure I.
These curves, which are independent of the oil viscosity, are useful as guides tothe thickness of oil which should be used. For example, with a velocity normal tothe leading edge of 600 ft/sec and a chord of 6 in. an oil height of less than0.0005 in. must be used to keep the separation line indicated by oil within 1% ofthe true separation line. For a chord of 24 in. and the same velocity the oilthickness can be doubled while still giving results of the same acuracy.
The constants 00 ad 0, are related to the velocity recovery of an RAE. 104 aerofoil,CL - 0.2 ; details are given in Appendix 1.2.1.
The oil thickness at other conditions, i.e. with a non-linear variation alonig the surfase,
did not greatly affect th results as plotted.
21
1.2.6 EXTENSION OF THE RESULTS TO TURBULENT,ANDCOMPRESSIBLE, BOUNDARY LAYERS
I. 2.6. 1 Turbulent Boundary Layers
So far the analysis has been confined to laminar layers since the calculation ofthe boundary layer in this case is relatively simple. In this section the flow under
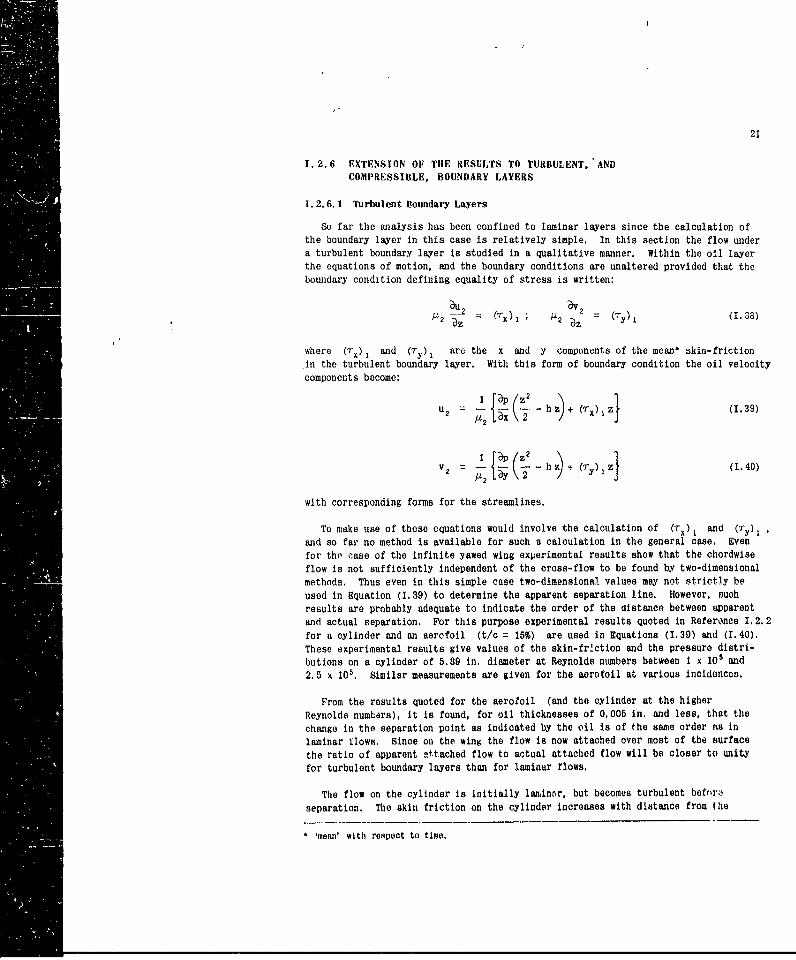
a turbulent boundary layer is studied in a qualitative manner. Within the o.1 layerthe equations of motion, and the boundary conditions are unaltered provided that theboundary condition defining equality of stress is written:
I I - 2 ; / . = ) (.38)
where (T) 1 and (7-y), are the x and y components of the mean* skin-friction
in the turbulent boundary layer. With this form of boundary condition the oil velocity
components become:
u2 = TX( 2- - h z)+ (rx)iz (I.39)
V2 = -4 -A - h + (7Y)Iz (1.40)
with corresponding forms for the streamlines.
To make use of these equations would involve the calculation of (rX) and (T.),
and so far no method is available for such a calculation in the general case. Even
for tho case of the infinite yawed wing experimental results show that the chordwiseflow is not sufficiently independent of the cross-flow to be found by two-dimensionalmethods. Thus even in this simple case two-dimensional values may not strictly be
used in Equation (1.39) to determine the apparent separation line. However, suchresults are probably adequate to indicate the order of the distance between apparent
and actual separation. For this purpose experimental results quoted in Reference 1.2.2for a cylinder and an aerofoil (t/c = 15%) are used in Equations (1.39) and (1.40).These experimental results give values of the skin-friction and the pressure distri-
butions on a cylinder of 5.89 in. diameter at Reynolds numbers between I x 105 and
2.5 x 10. Similar measurements are given for the aerotoil at various incidences.
From the results quoted for the aerofoil (and the cylinder at the higher
Reynolds numbars), it is found, for oil thicknesses of 0.005 in. and less, that the
change in the separation point as indicated by the oil is of the same order as in
laminar flows. Since on the wing the flow is now attached over most of the surface
the ratio of apparent attached flow to actual attached flow will be closer to unity
for turbulent boundary layers than for laminar flows.
The flow on the cylinder is initially laminor, but becomes turbulent befcra
separation. The skin friction on the cylinder increases with distance from the
-mean' with respect to time.
22
stagnation point, reaches a maximum near the minimum pressure point, and then decreasesagain. At transition the turbulence causes the skin-friction to increase again, before
it finally becomes zero at the separation point. At the lower Reynolds numbers the skin
friction at transition is quite low, whereas the pr6ssure gradient is quite large, andsubstitution of the quoted values in Equation (1.39) shows that u2 could be zero atthe transition point for an oil thickness of about 0.005 in. So on a yawed cylinderthe oil streamlines could form an envelope at the transition line. In the absence ofany other information this pattern could be erroneously interpreted as a laminarseparation followed possibly by a turbulent reattachment.
1.2.6.2 Boundary Layers in Compressible Flow
In Section 1.2.2 it has been shown that the velocity is very much smaller in theoil than in the external flow, thus even in cases where the external flow is super-sonic the oil flow is still governed by the equations of slow viscous motion, andthe solution is as in Equation (1.14). It thus seems probable that the oil patternwill be similar to that discussed in Section 1.2.5 for incompressible flows. However,the flow may now be complicated by the presence of shock waves. The pressure risethrough a shock may be sufficient to separate the boundary layer (Ref. I.2.6) and theinferences made about the oil motion in the region of separation in Section 1.2.5 willalso apply to such shock induced separations. In Section 1.2.5 it was shown that nearseparation the oil velocity becomes zero before the boundary layer skin-friction is
zero, and in this case, also, the oil may be expected to indicate an earlier separa-tion. For a linear adverse pressure gradient it has been shown that the oil indica-
tion underestimates the distance to separation by, at most, 5%. As the upstreaminfluence of the shock wave in the boundary layer is of the order of one hundredboundary layer thicknesses, it would appear that the ei,. 4 indicated separationwill be of the order of 5 boundary layer thicknesses.
Another effect at higher speeds is that of aerodynamic heating, and heat transfer.In general the heating will change the oil viscosity and so the ratio X will becomea variable depending on the state of the boundary layer. However, provided thischange in X is not too great, the main effect on the oil pattern will be small
since, as shown in Section 1.2.5, the actual pattern is independent of oil viscosity.
1.2.7 APPLICATION OF THE RESULTS OBTAINED TO TIlE INTERPRETATION OFTUNNEL OIL FLOW PATTERNS
In this Wcport the motion of a thin oil sheet has been studied, as the first stage
in the understanding of the oil-flow patterns obtained in model testing. If the oilactually moved as a sbeet the resultant oil pattern would supply only limited indica-
tbn of the oil motion: the only features to be seen would be separation, where theoil would pile up up-stream, and regions of high skin-friction, auch as under a vortex.where the surface would be nleared of oil. Generally in practice the oil, although
applied as a sheet, moves in filaments, which provide more 0.otailed Information on thedirection of the oil motion. The motion of these filaments depends on a different setof equations to those considered in this Report. However, the mechanism of the motionis probably similar; that is, the resultant force acting on the oil is a balancebetween the pressure gradient outside the boundary iayer and the stress due to theboundary layer skin-friction. Thus it may reasonably be supposed that the description
23
of the oil film motion also applies qualitatively to the motion of the filaments, and
that the orders of magnitude of the changes in separation point are similar in bothcases. Stalker (Ref.I. 2.7) has studied the mechanism which results in the formation
of the filaments, and by order of megnitude considerations shows that these filaments
do in fact follow the surface streamlines except near separation.
1.2.8 CONCLUSIONS
A sohttlnn has heen nhtainpi fnr the motinn nf A thin nil qhept mnving- nn a surface
under the influeoce of a boundary layer. The following deductions are made from the
analysis.
(a) The motion of the oil relative to the boundary layer
The oil follows the boundary layer strface streamlines except near separation where
it tends to form an envelope upstream of the true separation envelope. This early
indication of separation is expected to occur for both compressible and incompres-sible flow; it is less marked for turbulent than laminar layers. The distance by
which separation is apparently altered depends on the oil thickness, and the model
size, but it is independent of the oil viscosity (provided this viscusity is much
greater than the viscosity of the fluid of the boundary layer).
(b) The effect of the oil flow on the motion of the boundary layer
This effect is very small in most practical cases but increases as the oil
viscosity decreases.
(c) Interpretation of the oil pattern at low Reynolds number
Results at low Reynolds number should be treated with caution as transition could
be erroneously interpreted as separation.
24
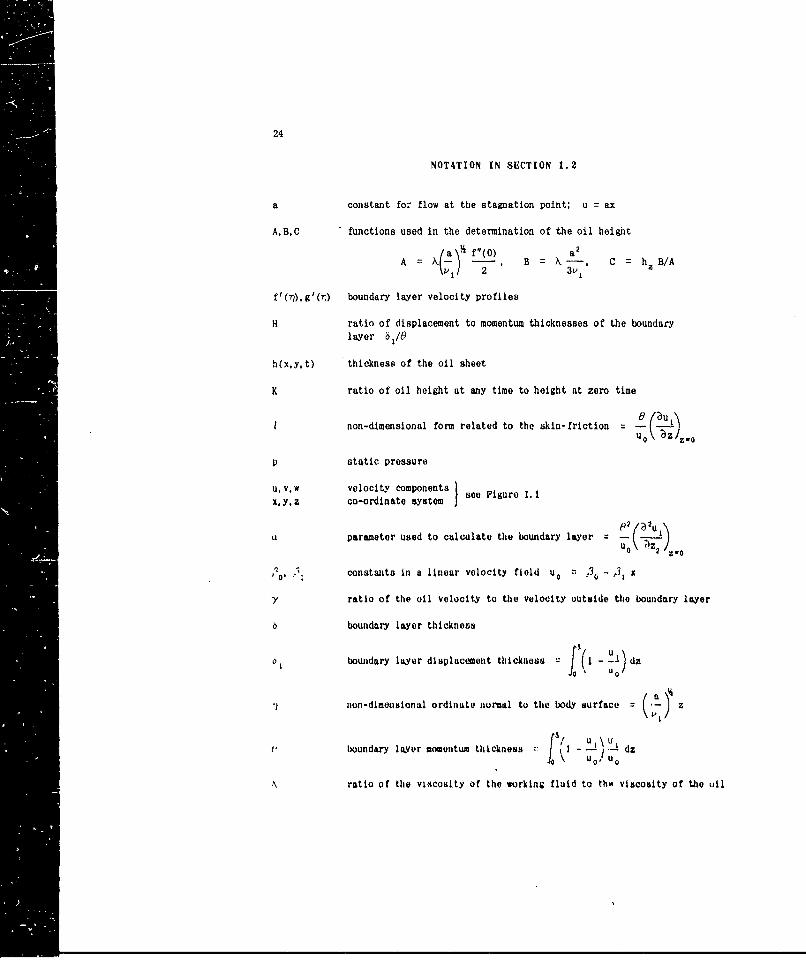
NOTATION IN SECTION 1.2
a constant for flow at the stagnation point; u = ax
A.B.C " functions used in the determination of the oil height
/a ft(0) a2A B = X.- , C = hz B/A(V1 2 3vi
f'(7),g'(T) boundary layer velocity profiles
H ratio of displacement to momentum thicknesses of the boundarylayer 6,/0
h(x,yt) thickness of the oil sheet
K ratio of oil height at any time to height at zero time
non-dimensional form related to the skin-friction = 0 -(yu
Uo z Z.0
p static pressure
u v, vw velocity components sX.y.z co-ordinate system
aparameter used to calculate the boundary layer
c "' constants in a linear velocity field uo = .30 31 1
ratio of the oil velocity to the velocity outside the boundary layer
6 boundary layer thickness
o boundary layer displacement thickness -( 1 - dzUO ]
non-dimensional ordinato normal to the body surface = z
boundary layer momentum thickness I - u 2 u- d
0 u) U0 d
A ratio of the viscosity of the working fluid to tho viscosity of the oil
25
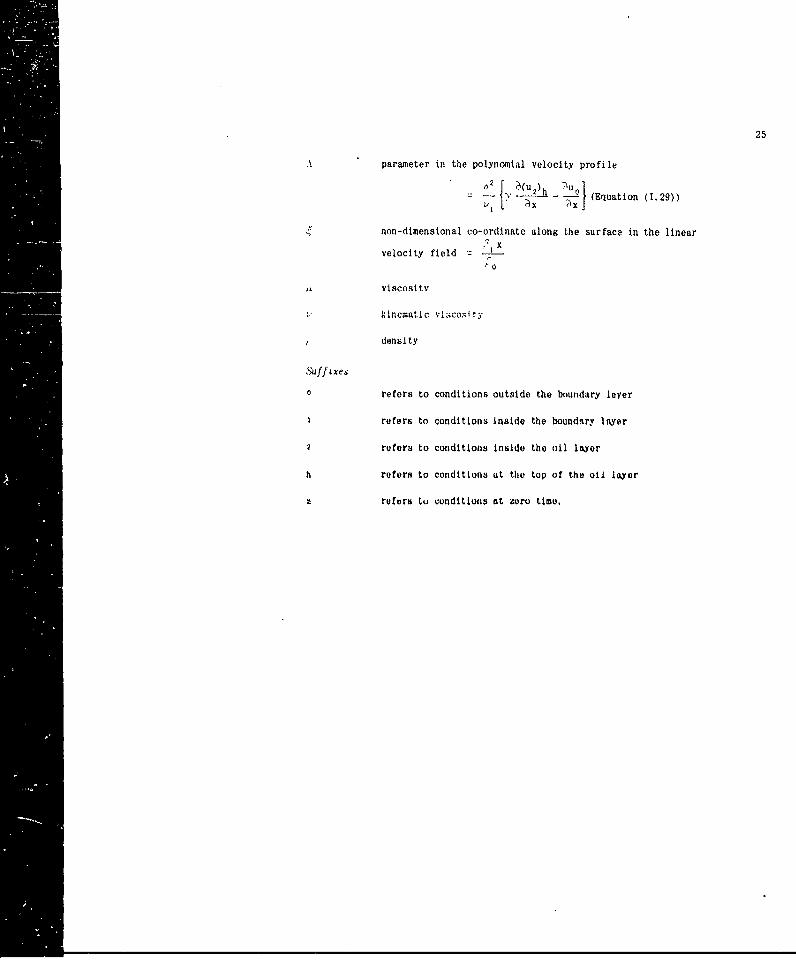
A parameter in the polynomal velocity profile
j 2) h '_2 (Equation (1.29))
non-dimensional co-ordinate along the surface in the linear
velocity fieldto
a viscosity
hincmatic viLicosity
density
$4!~xe0 refors to conditions outside the boundary layer
I refers to conditions inside the boundary layer
? refers to conditions inside the nil layer
h refers to conditions at the top of the oil layer
a refers tu conditions at zero time.
26
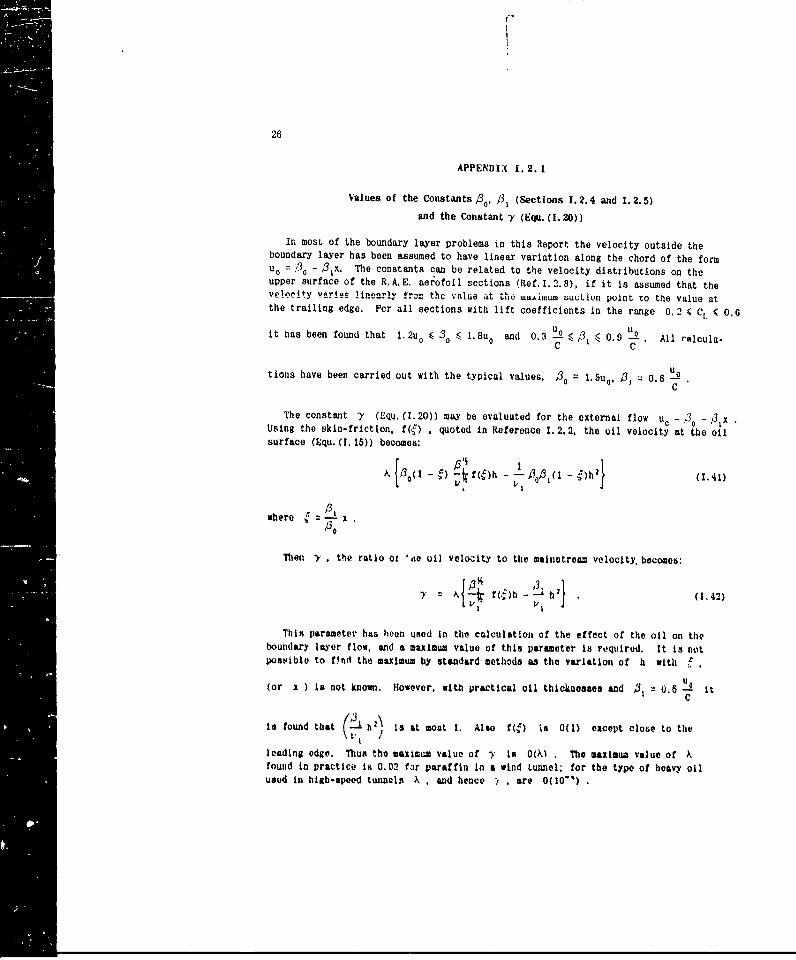
APPENDIX 1.2.1
Values of the Constants 3 /3, (Sections 1. 2.4 and 1. 2.5)
and the Constant y (Equ. (1.20))
In most of the boundary layer problems in this Report the velocity outside theboundary layer has been assumed to have linear variation along the chord of the formUo -"3 - 3x. The constants can be related to the velocity distributions on theupper surface of the R.A.E. aerofoil sections 'Ref.I.2.8), if it is assumed that thevelocity varies linearly from the value at the ,uuimtuu jucLion point to the value atthe trailing edge. For all sections with lift coefficients in the range 0.2 4 CL 4 0.6
it has been found that 1.2u, 0 1.8u o and 0.A ll "RiculC C
tions have been carried out with the typical values, 3. = l.5UoB, = 0.6C
The constant -Y (Equ. (1.20)) may be evaluated for the external flow u - 30 - xi xUsing the skin-friction, f() * quoted in Reference 1.2.2, the oil velocity at the oilsurface (Equ. (I. 15)) becomes:
where x ./3 0
Then y the ratio ot 'oe oil velocity to the mainstream velocity, becomes:
" = &- h (1,42)I I
This parameter has been used in the calculation of the effect of the oil on theboundetry layer flow, and a maximum value of this parameter is roquired. It is notpossible to ftd the maximum by standard methods as the variation of h witi, .
(or x ) is not known. However, with practical oil thicknesses and .31 = 0.6 -- itC
is found that ( h) is at most I. Also i(s) la 0() except close to the
leading edge, Thus the maximum value of y Is 0(W . The maximum value of Xfound in practice is 0.02 far paraffin in a wind tunnel; for the type of heavy oiluse4 in high-speed tunneli , . and hence ? , are 0(10')
27?
APPENDIX 1.2.2
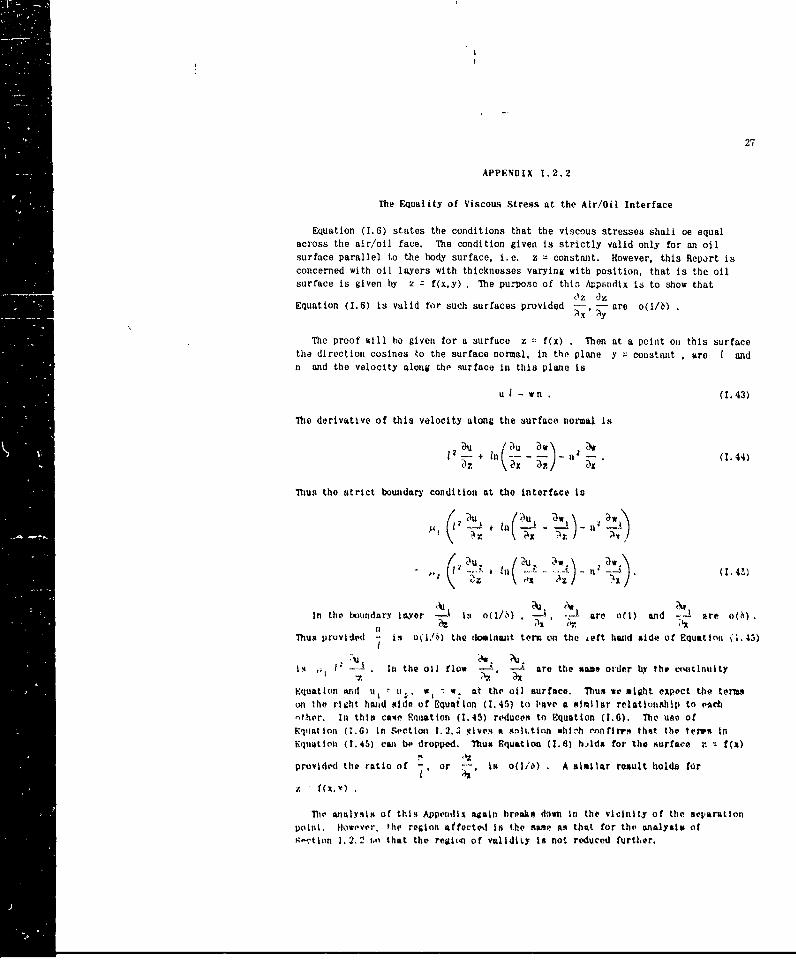
The Equality of Viscous Stress at the Air/Oil Interface
Equation (1.6) states the conditions that the viscous stresses shall oe equalacross the air/oil face. The condition given is strictly valid only for an oilsurface parallel to the body surface, i.e. z =constant. However, this Rep.,rt isconcerned with oil layers with thickneosses varying with position, that is the oilsurface is given by z zf(x~y) . The purpose of this Avpandix is to show that
')z dzEquation (1.6) is valid for such surfaces provided -. - are o(1/6)
Ax 'AY
The proof will be given for a surface z = NOx . Thon at a point oii this surfacethe direction cosines to the surface normal, in the plane y constant *are I andit and the velocity along the surface lin this plane is
u I - wn . (1.43)
Thie derivative of this velocity along the surface normal it;
fu 'u 2tw wI -- + III- - n2
(1.44)
Thus the strict boundary condition at the interface io
I -U .In i- I -i :7 T \4x xI'
1. /~ W
x1 )x
in the boundary layer is o~l/) . * are oti) and s aro o(6)
Thus provided is o(i/ei) tho dominant teric on the Aeft hand side of Equation (143)
Is h . it the oil flow ~± are the aazle order by tht cotinuity
Equation antd ui u.. w1 w-I at the oil surface. Thus we might expect the ter=soit the right hand side of Eq~uation (1.45) to i'avi a slitilar relationship to Pitch-thor. lin this cawe Eqetation (1.45) roduces to Equation (1.6). The une of
E'juat Ion (1.6) in soction 1.2.2 gives at it-il.tion 01:1ih motfirrs that the tervit inFquittonh (1.45) ean tip dropped. Thus Equation (1.6) hjI,1 for the siurface r. f(i)
provided tile ratio of or -,Is o(2/a) . A similar result holdsa for
'te ainlysis of this Appondix again hireaks dnwii in the vicinity of the seiparutionpoint. Iiowevi'r, th rerion affected is the Rar its that for the analysis of9- otlon 1.2.2 t~n that the regiont or validity Is not reduced furth~er.
28
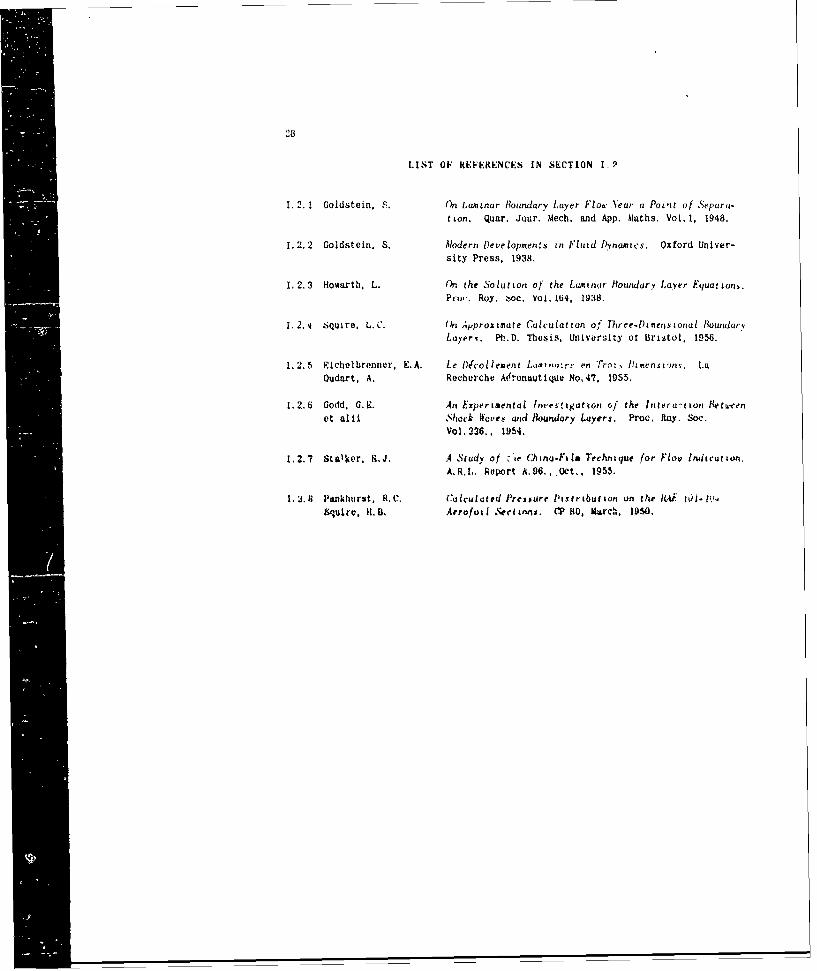
LIST OF REFERENCES IN SECTION I.9
I. 2. 1 Goldstein, S. On L inar Boundary Layer Flo Year a Point of Separa-tton. Quar. Jour. Mech. and App. Maths. Vol.!, 1948.
1.2.2 Goldstein. S. Alodern Developmens in Fluid D.yna'ics. Oxford Univer-sity Press, 1938.
1.2.3 Howarth, L. On the Solution of the Lamtn,.r Boundary Layer 'quattons.Pzu. Roy. boc. Vol. IbI, 1938.
1.2.4 squire, L.C. On Approziate Calculation of Three-[tmensional BoundarYLayerv. P..D. Thesis, University ot Bristol, 1956.
1.2.5 Elchelbrenner, E.A. Le l)Scoltement La, ...r -t en Trot-s !)ens-u'ms. La
Oudart, A. Recherche Aifronautique No, 47. 1955.
1.2.6 Godd. G.k. An Expertaental Inestgatton of the Intera-tton Bet-weenet alil Shock Wcves and Boundary Layers. Proc, Roy. Soc.
Vol.226, 1954.
1.2.7 Stalker. R.J. A Staudy of 'ie china-F il Technique for Flov buitcaottn,A.RL. Report A. 96.. Oct,. 1955.
1.3.8 Pankhurst. R.C. (olculoud Pressure Vistrtbutt an on the /1i - Wl- vi.Squire, It.H. Arofotl Sectians. (!P 80, Miaxt. 1950.
29
1.3 THE SURFACE OIL FLOW TECHNIQUE FOR USEIN LOW SPEED WIND TUNNELS
R.L. Mltby and E.F.A. Keating
1.3.1 INTRODUCTION
In Section 1.2 it has heon shnwn that there Is good reason to expect that the flowot a thin layer of oil under a boundary layer will be in the direction of the boundarylayer streamlines except in the immediate neighbourhood of areas of se....rted flowmnd, furthermore, there is only a very small effect cf the oil flow on the motion ')fthe boundary layer. The maiii problems in the experimental technique are to selectand apply a paint whicrn will leave a clearly defined pattern of streaks to indicatethe direction of fl ~w of Its oil medium in the particular conditions of test aindto Interpret the pattern~ in terms of the three-dittinaional flow structure.
Although piatterns o4Jil r visual study can be achieveLd fairly A'asily, It isquite difficult to produce patterns of ousistently good photographic quality. Sincethe valuo of an experitmnt is enormously -ihanced when el.)ar permanent records areavailable for =_ rrlcd conzside.%mtl.n und ejinsultation, the extra effort -@essary toproklueo patterus of the highost quality is fully Justified. Unfortunately theconditionts of toot and the vaterials available vary so much between olie laborator-yand another that refineentsw In the tochni.4, have takorn on a very personAl characteraud in atwnsphore of *aYstiqu@' reminiscenit of 'hauite cUlsine' has growu up In thepireiiratn of pIntt' and the Interpretatiur, ot pattertn. In examininig variou.srecipes in uso one is Invariably fwced with the protilm of assessing th , exactcoining of aubjective quallLito. such a strekiness,,. runninios%, clarity and spread -
a pirtblem vbInh is familiar to rhoolo-gists atd paint. tehniooists. In factOr. Scott-Blair in his tv(* 'A qurvvy of GontraI anil Applied Rhoology' found Itnocestacy to writo a ciedieatltun in the fo'lowing torus:
"'nits hivtk lit dedicatedi to 13111 - till) in every land wherever he msy be.whe they wtrit to krov what to do next, tbe7 vtontl for 11111. 11111 aqtppestho stuff In his fingera. sniffs It. "Ifts It It?. his car. and sQuneeso a&ain.Thon he looks via# and a 1O.K., or oeve It "~other ton minutes'. -
If In the following jpnrazarphw there is- a Wac of provision In tVe instructions.it Ig hcmtitc precision R~pusrvai' n ho Inconsistent wit' 'he problem; at least It Isito for the o~ r and. no doubt, for th~so of the, rekders who ark, also not painttechologltizt. For those wishing to use any tec~iniQuv 01hih Involves an electnt ofcraft te besxt advice is alviv to learn by watching Bill.
k'
1.3.2 V011POSITION OV TUE PAIXTS
1.3.2. 1 Gimrral Priumel e
The object In to prepare a tmaint of such rnnsimtency that, under thp conlitionRprevailing In the test, It will run with the surface oil flow andl loave behknd mtreaksoif ptcwent I-Iieatlng the9 direct ion of flow. T1w rattern wade by the streat muit t;#
30
bold enough to be examined and photographed easily and yet fine "nough to record allsignificant detail (eig.I.8). Ideally the paint should not begin to run until thedesired wind speed has been reached and after a convenient time of running, thepattern should be sufficiently dry to be unaffected by gravity after the air flowhas stopped.
The process leading to the formation of streaks can be studied by applying paintto the window of a wind tunnel and watching the motion from the other side of theglass with a microscope. The clearest patterns are formed by a silting process behindsmall concentrations of pigment in the paint, The paint flows round those concentra-tions and some of the pigment is subsequently deposited in the wakes behind them.The deposits continue to grow into long streaks in the direction of flow as morepigment is deposited behind the conuentrations until all the oil has been blown fromthe surface. The fully developed pattern is then left on the surface in a reasonablydry condition.
If the composition of the paint is slightly different, the process described byStalker (Ref. 1.3.1) can be observed. Hers U-shaped wavelets form in the oil andtravel slowly in the stream dircctlon. The pigment is deposited from the tails of theU, and since the wavelets tend to form roughly one behind another, the streaks arereinforced with the passage of subsequent wavelets. If the paint is too stiff thewavelets become large and a coarse pattern is formed from which it is difficult todisperse the oil. When there is a large variation of surfaue shear over the surfaceof the model it will be difficult to choose a paint consistency to give uniforrresults with this method (Fig.I. 10) and it is usually better to mix a paint whichwill silt easily.
The stiffness of the paint ,d the formation of streaks depends on the size of theparticles in the pigment and the forces of attraction between them (Ref.I.3.2) aswell as the viscosity of the oil, Materials for pigments applied as crystals orother large particles require to be ground and sifted to the correct size and thosesupplleo as very fine powders may tend to form conglomerations (floes) in the oil,the size of which must be controlled by the use of additives (see 1.3,2.3).
Large pigment particles or large flocs tend to produce bolder streaks if thethickness of the oil layer is sufficient to keep them in motion during the siltingprocess. In conditions of high shear the oil thickness is reduced rapidly and thiswill determine the maximum usable particle size.
1.3.2.2 The Oil Medium
The choice of the oil medium for use with a particular pigment is determined bythe time that is allowed for the pattern to dovelon in the prevailing conditions ofair flow and surface shear. The factors aff ng the rate of flow are the s),infriction, the thickness of the oil sheet, thu ooundary layer thickness, the oilviscosity, the p , ,nent content and the properties of the pigment in suspension.However the major factors appear to be the oil viscosity and the skin friction andit is nuggasted in Sec'.io, 1.4 th-t the approximate time to complete a pattern can 1-eindicated by 36,000 -j oil/T where - is the skin friction at the trailing ndvo.The oils normally used are, in ascending order of viscosity: kerosene, light dieseloil end light transformer oil. With one of these oils it is usually possible to mix
31
a satisfactors paint which will start to flow at about 75% of the test speed andDroduce a fully developed pattern in about 2 minutes.
Although a mineral oil is most commonly used as a medium, water containing awetting agent such as household synthetic detergent is in occasional use. Theprincipal advantage is that it is a cleaner material to handle but it makes it verymuch more difficult to control the quality of the pattern,
1.3.2.3 Additives
The need to use an additJ'r in some paints to control the size of the flocs leadsto difficulties and uneezt~LLtI !.; In thu techlilque partly because of the greatsensitivity of the suspension to small quantities of additive and partly because ofthe variable chemical nature of the oils and the additives themselves. Ithe followingsimple account of oleic acid used as an additive in a titanium dioxide-kerosene paintillustrates the principles,
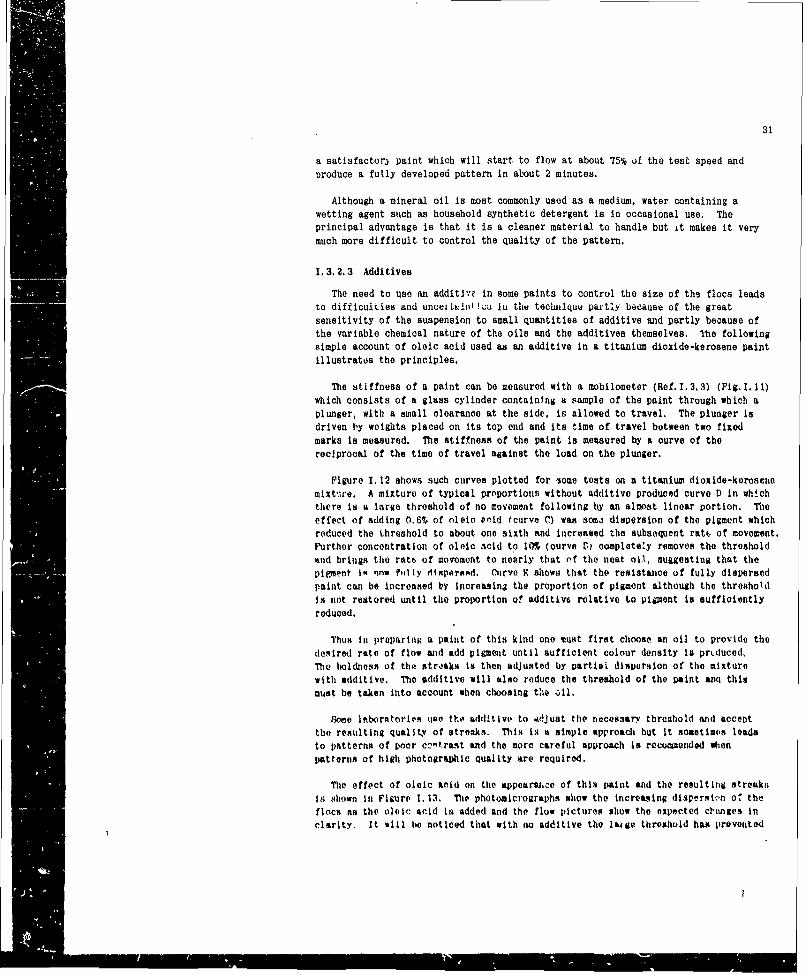
The stiffness of a paint can be measured with a mobilometer (Ref.I.3.3) (Fig.I. ii)which consists of a glass cylinder containing a sample of the paint through which aplunger, with a small clearance at the side, is allowed to travel. The plunger isdriven ty weights placed on its top end and its time of travel between two fixedmarks is measured. The stiffness of the paint is mesured by a curve of thereciprocal of the time of travel against the load on the plunger.
Figure 1. 12 shows such curves plotted for some tests on a titanium dioxide-keroseiiemixt~iro. A mixture of typical proportions without additive producoed curve D ill whichthere Is a large threshold of no movement following Ily an almost linear portion. Thleeffect of adding 0.6*o of oleic £'eid (curve C) was so. dispersion of thu pigment whichreduced the threshold to about one sixth and increased the subsequent rat6 of movement.Further concentration of oleic acid to I0M (curve V) coiplete'y removes the thresholdKnd brings the ratb of movement to nearly that of the neat oil, muggesting that thlepi~ment in now ftlly disporapd. Curve F. shows that the resistance of fully dispersedpaint can be increased by increasin4 the proportion of pigment although the thresholdis not restoredl until the proportion o!' additivai relative to pigment is sufficientlyreduced.
Thus in preparing a paint of this kind one -oust first choose an oil to provide thledesired rate of flow and add pigment until sufficient colour density is pr~duced,The baldness of tho strdaks is then adjusted by partial dispursion of the mixturewith additive. The additive will ealso reduce the threshold of the paint Wi thismust be taken into account when choosing the .,11.
Boase lftboratories use tho additivo to acjust the neces-itry threnhold and acceptthe resulting quality of streaks. This is a simple approach but It sonetimes leadsto patterns of poor c, -rast and thle more careful approach io ratxundod whenpatterns of high photographic quality are required.
Tile effect of oleic acid on the appearance of this paint and the resulting streaksIs mhown in Nire T. 13. Tile photomici'ographs show the increasing (iispersivn o. theflocs ats the oleic acid iH added and the flow picturos shlow the expeted cbnne5 inclarity. It will be noticed that with no additive the lige threshold has iprovented
32
flow except in the Ereas of high shear. With an excess of additive, the dispersed
pigment provides a finely detailed pattern but of poor contrast.
Flocculation is affected by the mutual attraction of particles carrying electriccharges generated in suspension in the dielectric medium. The additives control the
extent of flocculation by modifying the charges and may eithEr increase or decrease
it depending on the constituents of the paint. For instance linseed oil will causemild flocculation of 'ayglo' pigment in diesel oil, yet will disperse titanium
dioxide.
Of the many possible additives oleic acid and linseed oil give excellent results
in the various paints iii ouuui us ,3.J being ieadily available, they ard to berecommended. Nevertheless they are crude products which vary in ti'eir chemical com-
position when new and oxidise when stored, trial and error methods are inevitable
when they are used.
A more detailed account of additives and their effects will be found in References
1.3.4 and 1.3.5.
1.3.2.4 Pigments
The pigment must be chosen to have the correct flow characteristics as already
described and to make a clear pattern against the background provided by the model.
Thuts a white powder like titanium dioxide or chins clay would be used on a dark model
ann A blaek powder like lawpblack on a light model. Fluorescent pigments illuminated
with ultra-violet light can provide a high contrast pattern irrespective of the bek-
ground colour and they give very high qumlity photographs without difficulties. The
properties of some coamon pigments are listed below.
Ti tantum dioxide (Ti Od)
This is the whitest of pigments used by paint manufacturers and is at the same
time the most opaque; it is therefore suitable for making high contrast patterns ona dark background. It is Ion toxic and reasonably clean to use.
The particle size in material supplied for paint manufacture is about 0.2 micron
although the powder used for medical purposes is somewhat coarser. It flocoulates
when suspended in minoral oils and requires an additive for partial dispersionof the floes in order to produce clear streaks.
n ta clay (Kuoiuu)
This In a coeplex mineral which in a pure form ir. a hydrated slicate of alumina(Al10 - 2 810 .211P0). When dry it is white but when wetted with en oil of about thesame refractive index it becomes transparent. For this reason China clay-oil patternshave to be dried thoroughly 1-fore they become clear excapt in the special case where
an indication of transition is required. Hlote the luminar zegion re"Ins wet and theturbulent region is driod.
f.omrblack
iampblack is a common greyish carbon pigment with a baisin particle diameter of
or,ler 0. 1 micron. ,s normally supplied the aggregated particles are much larger wnd
33
these neither disperse nor flocculate appreciably in an oil suspension although oleic
acid has a small effect in reducing the boldness of the pattern.
Carbon black pigments can be obtained with very much smaller basic particle sizesand a blacker appearance. It is possible that better results may be obtained withthese in conjunction with f, suitable additive.
Anthracene M C,411o
This is a fluorescent hydro-carbon derived from coal tar. It is supplied .n thsform of grey crystals or powder and must be ground and sifted to the correct particlesize. It is a variable product -nd the c lour of fluorescence, which depends on the
impurities present, varies from blue to green. The paint appears colourless innatural light and the pattern must be observed in ultra-violet light.
-hrysene C aH 12
This material is similar to anthracene except that it is more consistent in qualityand fluoresces blue with greater energy than anthracene. Unfortunately chrysene is acarcinoxen and therefore there is so" ri sk of enoer if it tA liad as a pigmont with-out protection to the skin.
"Dayglo" pigsents,
These %re the pigments used in the manufeacture of fluorescent paints and printinginks and they are believed to be composed of a resin dyed with fluorescent colours.The particle size of the powder is about 1 micron and is suitable for the productionof fine patterns without the use .f additives. The patterns are clearly visibln innatural light and photograph very well in ultra-violet light. Paints made with Dayglo&ro particularly easy to uss and are to be recommended. The pigments may be obtainedin a range of colours of which 'Saturn Yellow' and 'Neon Red' are the ast suitablefor visual works and 'Saturn Yellow' for monochrome photography, The ret and yellowmay be used together to show regions of flow mixing.
The pigment can also be obtained in pea-sized chunks which mAy be ground in aball mill to produce powders of larger partiole sizos.
Layglo pigments are marketed in Amrica by
Switzer Bros., Inc.,Clovoland,
Ohio.
and in Wngland by
D-- e & Co. Ld.,1-2 Sugar House Lane,
Strat ford.tondoa, E. 15.
34
1.3.3 APPLICATION OF PAINTS
The application of the paint to the surface of tha model is a simple matteralthough care is needed to produce the best results.
The surface must first be thoroughly wetted with the medium by rubbing it with a
soaked rag. On large surfaces the paint is best applied with a domestic roller,preferably of the foam plastic type. The roller is loaded with paint in the usualway but it is applied to the model with its axis slewed slightly to the direction of
motion. By this means an even film is produced and the old p4ttern from a previoustest is erased. A final finish i gives by a light application of the roller. Sometrials will be required to determine the correct thickness of the coating.
When a brush is used, an even coating is produced if it is moved in small circles
rather than with the conventional painting motion.
1.3.4 RECIPES
With the foregoing principles in mind the following three recipes are suggested asa basis for adaptation to local conditions.
(1) Simple bix
Use as pigment anthracene, chrysene*. Dayglo pigment or coarse lampblack. Grindand sift the pigment if necessary to a mean particle size in the range 1 to 10 microns
and mix with about ttree times its weight of oil and store in a bottle. The pigmentsettles rapidly and the bottle must be shaken before use. No additives are required.
Apply the mixture as described in Section 1.3.3. If the roller absorbs too muchoil dilute the paint with more oil.
This mixture keeps indefinitely and is very easy to use except that there is verylittle control on the boldness of the streaks.
(2) Flocculent mix
Mix together thoroughly 1 part by weight of titanium dioxide with 3 parts of oil,This may be done with a brush but more consistent results are obtained if a laboratory
stirrer is used. Add a few drops of oleic acid or linsee oil and make a test run.If the pattern is too coarse use more additive. If it is too fine, the proportion ofadditive must be reduced but it must be remembered that the sl-e of smaller models
will impose a limit on th boldness of the patterns. If the paint does not run use
an oil of lower viscosity, increase the wind speed or add neat oil.
The paint should be made shortly before use since it deteriorates in storage.
The paint ip an old pattern need not be removed for each test but the surface must
be restored wich a roller containing oil only since the amount of additive is linkod
See medical note in Section 1.3.2.4.
35
with the pigment rather than the oil. After a few tests the surface should be cleaned
with a rag soaked in oil containing an excess of additive.
(3) Titanium dioxide wash
Mix together thoroughly 1 part by weight of titanium dioxide, 1 part linseed oil
and 4 parts oil. Here the pigment is almost fully dispersed and a very fine pattern
of low contrast is produced which is suitable for photographing only on small modelsalthough it is useful for visual work when transition must be determined at the same
time-as the flow pattern.
The paint keeps well in an airtight bottle.
1.3.5 PHOTOGRAPHIC RECORDING
The main difficulty in photographing patterns in normal light is to avoid highlightsarising from reflections and uneven lighting. With evenly diffused lighting and a
slow, high-contrast emulsion there are no special precautions required in taking
photographs of high quality white patterns on black models. If the model is coloured,the contrast is improved if a suitable filter or an emulsion insensitive to the back-ground colour is used. Thus a model finished in natural wood colour is best
photographed with an 'ordinary' emulsior, that is one sensitive to blue only.
If the model ca:i be taken out of the wind tunnel, lighting becomes easier. The
model with a lampblack pattern illustrated in Figure 1.15 was removed from the windtunnel mnd placed in a tent made of white fabric. The tent was illuminated from out-
side and produced a uniform lighting effect on the model.
With a fluorescent pattern illuminated only by ultra-violet light, the difficulties
connected with the appearance of the surface of the model and with reflections areovercome. The tunnel is blacked out and the fluorescence is excited by a lamp*emitting the mercury 365OR line.' Only the pattern is seen, both the model surface
and the background remaining invisible. Reflections of the light source in the
surface are eliminated by fitting an ultra-violet filter (Wratten 2B) to the cameraand the visible fluorescence is photographed on a medium speed panchromatic plate
(Ilford F.P.4). Although the exposure time is quite long, it cannot be shortened byusing a faster plate because of the greater reciprocity failure, and similar
difficulties are found with colour emulsions,
The intense blue fluorescence of chrysene** allows an 'ordinary' emulsion to be
used without loss of speed. Negatives of brilliant quality are obtained which can beprocessed under a red safe light (Fig.I.8).
In order to avoid the long exposure times required with fluorescent pigments an
electronic flash tube can be used instead of a continuous burning lamp if a window of
An ordinary U-V 'sun ray' lamp Is suitable.
Sue medical note in section 1.3.2.4.
36
Wood's Glass (sometimes called blackglass) is fitted to the gun. The flash fector isreduced because only the ultra-violet content of the flash is transmitted; forinstance, a 100 Joule unit used with 'Saturn Yellow' gives a flash factor of about
10 with 50 ASA film. Colour photographs are easily obtainable in this way.
Ultra-violet light is injurious to the eyes and suitable glasses must be worn whenit is being used.
Figure 1.14 gives the photographic data used in the 13 ft x 9 ft low speed wind
tunnel at the Royal Aircraft Establishment, Bedford.
1.3.6 INTERPRETATION OF OIL rvLW PATTERNS
The objections that are raised against the surface oil flow technique are oftenthe result of careless interpretation or attempts to read too much into the details
of the pattern. It is, of course, impossible to give detailed instructions in inter-pretation as it must depend on a thorough understanding of aerodynamic features ofthe model under test. Some exampfes of flow patterns are discussed below to assist
in the recognition of common flow conditions but it must be remembered that under
different circumstances they might appear in a different form. In the notes givenbelow, familiarity with the aerodynamics of separated flow regimes is assumed.
Clarification will be found in Reference 1.3.6.
Figure 1. 16 shows the flow pattern on a swept wing at 00 incidence made with atitanium dioxide flocculent paint. The difference in appearance between the laminarand turbulent regions can be seen, especially in the turbulent wedges from the
disturbances near the leading edge where the high shear has led to fine streaks.
Figure 1.17 shows the flow on part of a 250 swept wing at three angles of incidenceusing Dayglo and ultra-violet light. At a = 20 there is a laminar separation andreattachment at about the half-chord position. In the separated region there is an"
accumulation of paint which has been drifting slowly towards the tip, leaving a clear
area on either side. At several places turbulent wedges have broken t.hrough theseparation area and some of the accumulated oil is drifting towards the trailingedge through these gaps. The large V-shaped pattern near the inboard end of the wing
is the wake from a supporting wire.
At z 6o the laminar separation region and reattachment are visible at theleading edge of the wing and the turbulent boundary layer nearer the trailing edgois beginning to drift 'jwards the tip,
At (' 10o there is still a laminar separation region with roattachment at theleading edge and there is now a turbulent separation near the trailing edge. Thesurface flow airoction behind this separation is forwards from the trailing edge.The wake from the suppnrting wire is having a large local effect on this flow.
The main features associated with vortex flows from edge separetions are illustratedby the flow over a flat, sharp.edged Jolta wing with tan aspect ratio of 1. The
pattern in Figure 1.8 is produced by chrysone and kerosene photographed in ultra-violet light. The coiled vortex sheets springing from the separations along the
37
leading edges produce the characteristic 'herring-bone' patteri.. on each side of thecentre-line. The suction peak on the wing surface associated with the vortex above,lies close to the point of inflexion of the S-shaped lines in the herring-bone
pattern. The point of inflexion is often closer to the leading edge than a casualinspection may suggest. Measurements of surface flow direction by other methods onthis model confirned that the streaks gave a reliable indication.
The secondary separation line is indicated by the dark line outboard of theherring-bone pattern. In the early stages of the development of the pattern thisregion contained an accumulation of paint and it appeared then as a white line. Asthe development progressed, this accumulation was blown off the trailing edge leavingthe wing surface hare as it is in the photograph, Regions of separation hre, there-fore, indicated either by white patches or dark patches according to the conditions
and the state of development of the pattern.
Outboard of the secondary separation line is a region of secondary flows including
a further separation line.
In flow regimes of this kind the shape of the secondary separation line can oftengive indirect indications of the state of flow elsewhere, For instance, a transition
from laminar to turbulent flow on the surface of the middle of the wing is sometimesaccompanied by a sudden outboard bend of the secondary separation lines. Also, duringa study of the breakdown of the vortex core, it was noticed that there was also a
change in direction of the separation line. Figure 1,9, which illustrates thispheuomion, is tlotv ui ev~wple of the poor pattern which is obtained when the size of
particles of pigment (in this ease anthracene) is too large.
The part-span vortex flosy on a 550 swept wing at a = 80 is illustrated inFigure 1,18, In this case the secondary separation line is white bo.use the paint
has not cleared away. At a = 160 on the same wing the vortex flow has spread allalong the leading edge. Under the vortex, the angle of sweepback of the surface flowis less than that of the wing trailing edge. At a point further inboard, the surfaceflow is tangential to the trailing edge and a new vortex forms from the trailing edgeoutboard of this point, When this happens, oil which has accumulated on the trailingedge is drawn over the surface of the wing in a curved line and this line is often avaluable indication that the new vortex has formed. The herring-bone patternassociated with this vortex is sometimes found on the upper surface near the trailingedge, but this is not very evident in Figure 1.18.
On wings with highly swept edges the vortex flow breaks down near the tips at highangles of incidence and a forward flow on the surface results. The incidence at whichthis breakdown occurs decreases with the sweep angle and it is a comon feature of theflow on wings of moderate sweep. Figure I. 15 shows the surface flow pattern obtainedwith lampolack and kerosene on a 45U delta wing at a = 200 . The vortex flow isclearly shown noar the front of the wing but, nearer the tip, the flow is mainly in aforward direction which leads to a rotating flow in the surface plane. The ctntre ofthe rotation is usually plainly marked and indioates the rearward extremity of the
normal vortex flow.
38
LIST OF REFERENCES IN SECTION 1.3
1.3.1 Stalker, R.J. A Study of the China-Clay Film Technique for Flow
Tndication. Australia ARL Report A96, 1955.
1.3.2 Remington, J.8. Pigments, Their Manufacture, Properties and Use.
Francis. W. Leonard Hlill Ltd., London, 1954.
1.3.3 Perry, J.H. Chemical Engineers'lHandbook. McGraw-Hill, 1941.
1.3.4 Chatfield Paint and Varnish Manufacture. Newnes, 1955.
1.3.5 Sagarin Cosmetics, Science and Technology. IntersciencePublishing Inc., New York, 1957.
1.3.6 Thwaites, B. Incompressible Aerodynamics. Oxford University Press,1959.
39
1.4 TIHF SURFACE OIL FLOW TECHNIQUE FOR USE IN HIGH SPEEDWIND TUNNELS
A. Stanbrook
1.4.1 INTRODUCTION
The principles of the surface oil flow technique in high speed wind tunnels aresimilar to those for low speed tunnels (Section 1.3) but more emphasis is placed onthe choice of the oil medium to suit the running time required. Again, the exactcompositions of the paint mixtures used in various laboratories nave individual
characters based on the local conditions and the personal preferences of theexperimenters concerned. The purpose of this Section is to collate the experiencefrom separate tunnels, tn explain variations in the technique and to provide a guidefor the development of oil mixtures for specific purposes.
Typical examples of oil flow patterns from a high speed tunnel are presented inFigure I. 19. Figure I. 19(a) shows the types of pattern obtained when the flow.separating from the leading edge, forms either a bubble or a vortex. The third photo-graph shows the appearance of transition in oil flow patterns. (Comparisons betweenoil flow and sublimation visualization of transition position are discussed inReference 1.4. 1; the sublimation technique is described further in Reference 1.4.2.)Figure I. 19(b) shows flow deflection, and separation, at shock waves, together withthe appearance of a tip vortex. The uppermost photograph in Figure I.19(o) shows atypical result of the application of too much oil mixture. During the run oilaccumulated behind the separation line and formed a blob which stood up from the wing.As the tunnel flow was stopped this blob collapsed and the oil spread over an
appreoiable region on the wing, obliterating details of the flow.
The other three photographs in Figure I. 19(c) show various stages in the developmentof oil patterns. The first shows an early stage at which the ff,aments are Justforming. In the second, filaments have formed but are run..!.;,, together to form riversof oil which are obsouring detail. The third was tAken after tih eumpletion ut thissame run. when the rivers had flowed downatream, off the model, and a large amount offine detail could be observed.
1.4.2 EXPERIMENTAL. STUDY 01? THE DEVELOPMENTOF TIlE PATTERN
1.4.2.1 Effect of the Pigment Concentration
To provide background intormation on the importance of precise proportions of Uieoil mixLure, a series of testm wea made on a wedge of 150 total angle and 2.5 in,chord in a 3 in. square supersonic wind tunnel with a short starting time(approximately 3 seconds). The oils referred to in this and in other parts of thenote are classified in Appeodix 1.4.1.
40
Figure 1.20 shows a typical* graph of the variations of the time taken to form apattern with the proportion of titanium dioxide to a given oil/oleic acid mixture by
volume", at a free stream Mach number of 1.4 (a local Mach number on the wedge of
1.12) with atmospheric total temperature and pressure. It will be seen that therewas a minimum concentration of pigment below which no filaments were observed, thelimit being lower with turbulent flow (for which the skin friction is higher). Above
this minimum a filament pattern was observed. The time tPken for the pattern todevelop was independent of the pigment concentration up to a certain limit, abovewhich the time increased rapidly. At the lower concentrations, the pattern formedwas eventually lost as the oil mixture moved downstream and off the model. The time
takpn fnr this tn happen alzo incrc' d with picnt concentrativn ms;, ihuu appet'redto be a limit above which some trace of the pattern remained on the model indefinitely.
Typical photographs, shown in Figure 1.21, compare the development of the patternwith both laminar and turbulent boundary layers for one particular oil mixture.
These photographs show 1 in. wide chordwise strips of the wedge.)
1,4.2.2 Oleic Acid Additive
The function of oleic acid as an additive to titanium dioxide prints to controlthe boldness of the filament lines by controlling the degree of .ag,lation of theparticles is discussed in Section 1.3.2. The following tests made in the 3 in.sujuvi,,n' tuitul illustrate the effects under high speed flow conditions.
Figure 1,22 shows flow patterns obtained on the wedge in the 3 in. tunnel usingmixtures containing different amounts of dispersing agent. The uppermost patternwas obtained with no dispersing agent (3 ccs O-109 oil + 2 cc8 Ti 2). The skin
friction in the laminar flow region was too low to move the coagulated oil sheet.However, irregularities in th,, oil shoet caused transition further downstreua andthe higher akin friction was sufficient to move the oil. The second Ojotograph showsa pattern obtained with a small amount of oleic acid present (I drop in 3 cos OM-108oil + 2 ccs Ti07), with which at acceptable filament pattern was obtained, Sincethe further addition of sufficient olsic acid to ensure compl1ts dispersion of thepigment would probably have altered the viscosity, a proprietary oil of the same
viscosity containing the highest available proportion of detergent additive (ShellRimula 30) was used. The result is shown in the third pattern in Figure 1.22.
Since dispersion was complete, the pigment particles were each uompletely separateand no filaments were. observed.
it 13) sLen from the uppermost pattern in Figure 1.23 that ihere the #kin frictionis high onn)ufh (e.g. n the turbulent boundary layer) it is possible for an oilmixture not con.aining oleic acid to flow. In the particular cane shown inFigure 1.22 the filament pattern is indistinct. Figure 1.23 shown a comparlsonbetwcen flow patterns on a wing from mixtures with ad without oloic acid (1 drop in
* Thea. results ar. for OS-108 oil but tests with other oils show vuriatlooa Vimllar In typo.
Volume of titanlus dioxide rafers to thi loosoly packed powder as scooped from the jar.Its dinsity has been found to be aproslastely 0.75 ga/cc., coa*red with the true decaityof titanims dioxide of 3.8-4.2 Wa/cc.
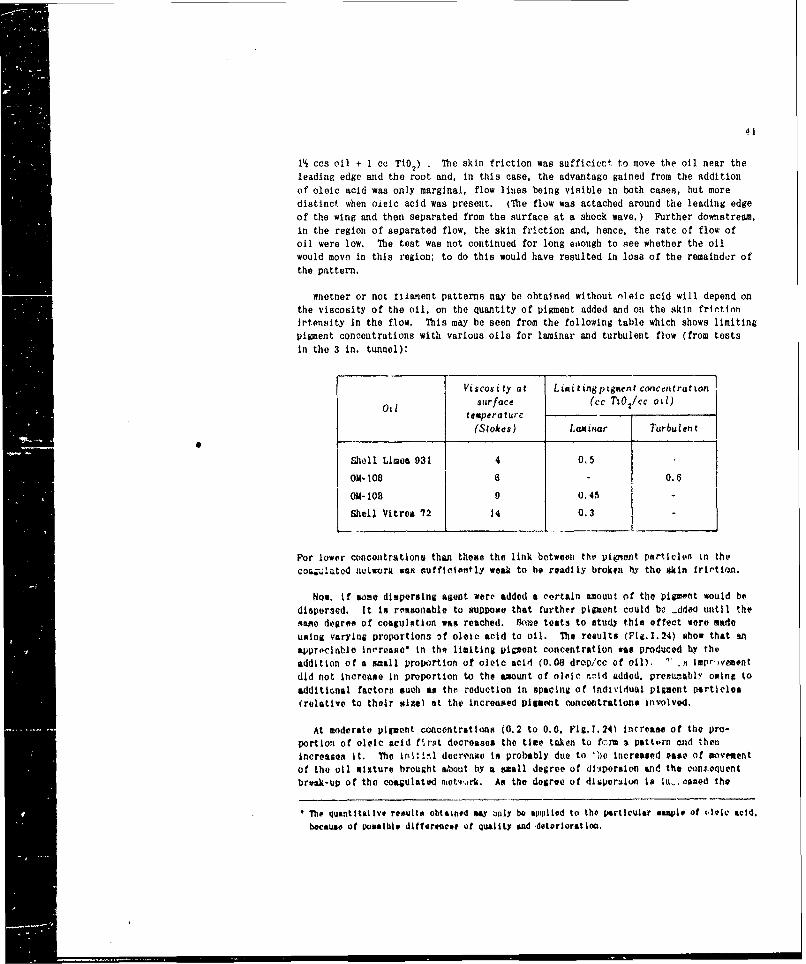
Iccs oil + I cc TiO2) .The skin friction was sufficier. to move thp oil near theleading edge and the root and, in this case, the advantage gained from the additionof oleic acid was only marginal, flow lines being visible in both cases, but moredistinct when ojeic acid was present. (Ibe flow was actached around the leading edgeof the wing and then separated from the surface at a shock wave.) Further downstream,in the region of separated flow, the skin friction and, hence, the rate of flow ofoil were low. The teat was not continued for long etiough to see whether the oilwould move in this region: to do this would have resulted in losa of the remaindar ofthe pattern.
wnetner or not filamnent patterns may be obtained without oleic acid will depend onthe viscosity of the oil. on the quantity of p~igment added and on the skin frintionir'tonrsity in the flow. This may be seen from the following table which shows limitingpigment concentrations with various oils for laminar and turbulent flow (from testsIn the 3 in. tunnel):
- Vscos I'y at L ii~gpzgaent concentration 1
O surface (cc Tt0 2/cc Oil)temperaturc
(Stokes) Laminar Turbulent
Shell Limes 931 4 0.5
OM-108 6 - 0.13
014-108 9 0.415 -
Shell Vitre& 72 14 0.3-
For lower concent rations than these the link between tho pigment particles in thecor,;atoi network waNs uffiniantly weak to he readily broken by the skin frirtion.
Now, If some dispersing agent were added a certain amount of the pigment would bedispersed, It to reasonable to suppose that further pigment could be ..dded until thesame degree of couguisatian was reached. &oae tests to study this effect were madeusing varying proportions of oloic acid to oil. The results (iFig.1.24) show that ana4ppre-cat.,le Increase' In thq limiting piotent concentration was produced by theaddition of a aill proportion of oleic acid (0.08 drop/ cc of oil). -~ As ipr~veientdid not increa~se in proportion to the amount of olric -id4 added. presumablY owing toaddlitonal factors such to the reduction in spacing of Individuail pigment particle*(relative to their size) at the Increasied pigment ooncentrat tons Involved.
At moderate pigment concentrations (0.2 to 0.6, Fig. 7.24) increase of the pro-portion of oleic acid P'rst decreases the tice taken to fcrm a patte'rn and thenIncreases It. Tho ifizi.1n decr'eame in probably due to -,)e Increased ease of movemtentof the oil mixture brought ab~out by a maall degree of dli.iperajon and the con~koquentbreak-up of the coagulated nietvark. An the degree of dlspierwsits I& li_~ i'aned the
*Tho quantitative results obtatntd say jsiy be apiipi lvd to the particular owml# of C-elc acid.because of possible diftorencee of quality sad delterioration.
42
size of the coagulated elusters of particles decreases and more time is requirsd forthem to collect tog,.Xher into filaments.
The discussion above shows that oleic acid may be used to extend the workable rangeof pigment concentratic's. However, it is no. advisable to use a mixture which isnear to the limiting pigment concentration, since the limit depends upon the actualskin friction intensity. With a complex flow pattern the range of skin friction wouldbe large, from very high values in the regions scoured by vortices to very low valuesin the neighbourhood of separation. Then, if a mixture with n pigment concentrationnear the limit-were used it is probable that there would be extensive regions 'n whichthe skin friet!r.'. itensit wa±s insufficient to brcit up thz: coi-- nct-work ofpigment particles.
1.4.2.3 The Thickness of the Oil Sheet
Some tests were made with various initial thicknesseVMW M 1 6fi the wedge, usingpairs of feeler gauges and a straight-edge to 'scrape' the oil shoet tn a rpn~ihrodthickness. No variation in the Lime taken to develop a filament pattern was observedover the range of thicknesses from 0.0005 In. to 0.005 in. It was also found thatthe. normal application of oil mixture used in the tests was approximately 0.002 ill.thickL.
The distribution of oil film thickness oviir a surface ditring the runniog period Isgiven by Equatlon (1. 17) which liay be solved1 numerically for laminar and tturhulentflow oil a tao-dimensional flat plate asumivig that the presence of the oil does notaffect the surface skin-friction Intensity. Calculations have been made for theconditions of the teats in the 3 inl. tunnel described In Section 1,4.2.1 and forInitial thickniesses of the oil sheet (if 0.005 in. and 0.001 in. The results aremnown in Figure 1.25 in the form of thickness distributions across U,)# sedges atvariouit times after the :itart of the motion.
It will he *@on that the oil sheet thickno'sis varies aboiut five tises as fast forthe turbulent boundary layer as for the lamiiear, and that atter about .10 seaconds forlaminar flow (and 6 teoenldn for tturtulent flow) the thickness is virtually indepsndent(if the Initial thickness.
The photographs reproduced In Figure 1.21 were takan at varioun times In thedavvlonset1 of the oil fi lament*. In the laxinar flea pattern at 4 smute fi lamentshave formed 3/4 in. from the leading edge while at 24* ainutes there are C.#enIsove-r the cintire chord. Filaments!owud over 0.8 of the chard In minute ofturbulent flow. Coaparlion with the theoretical thickness distributions at thecorreatponding points and tine# sugsts that In thege tests the filaments formed whenthe whoet thickness a" approxizately 0.0002 In. (Irrespoctive of the Initialthickness of the oil sheet).
1.4.3 CONPARlSON OF TREI VAGILU V09149~OF THE TECHilquI
.. 31 Gmeral Commta
&'ee genepai vcmmet# PAay be mde fro* inf,~rvA&U,iNi .. VVIIM h) the staffs ofvarious tunnels.
43
The majority of the mixtures used have from 2/'5 to 2/3 cc pigment/cc of oilalthough concentrations varyl., from 1/5 to 3 are also in uce. (The stiffer mixeshave been used where it is required to limit the movcment of the pattern during tunnelshut-down. The tlmC3 taken are not comparable with those for the more common pro-portions.) Titanium dioxide is used fairly consistently as pigment - it is, after all,the whitest pigment available. Antimony dioxide has teen tried (by Lee and Berry ofthe National Physical Laboratory) with less satisfactory contrast in the results.Lampblack I-, used in low speed tunnels, but appears to have been used little in highspeed tunnels (the only case found wan in some early tests b,, Fairbain in an inter-mittent tunnel at Armstrong MThtworth Aircraft). Another vigment in use 01)yIgglesden (Ret.1.4.5) of the Royal Aircraft Establishment) is Prussian Blue (supplied,in paste form, ready mixed with qhell Camnea 35 oil by Hienry Stuart, Sons & Co., asNicrometer' brand engineer' s blue marking). Fluorescent powders have been used inlow speed tunnels, and could also be used in high speed tunnels provided that theiruse was restricted to large models (becauie of the large particle size).
The choie of oil 14 largely determined by tunnel running conditions. Furinstance, a lght oil or hydraulic fluid would be used in afr-intermittent tunnel toreduce the time taken to torm a Pattem, !e.g, O&1-I5 is used in an intermittent tunnel-iat Armstrong Whitworth Aircrait). On the other hand, a heavy oil would be used in atunnel which takes ak long time to reachi operating covnditions, to lenguthen the timetaken to form a pattern andi hence to iii the effect on the oil flow of the incorrectrunning conditions (e.g. Sliel Nmansa V1 oil has been used in tl.e j it and 8 ft tunnelsat the Royal Aircraft ~rml~~n.Bedford). In tunneI5 where the temperature Inrised to tivid moisture eoridonwstin (e.r. De fHavilland Aircraft, Fllish tZilectricAviationl and lundloy Page) a siliconet fluid In renerally used in place of oil. Th Ishas the advantage of Avoiding exceSsiva viscoity at atmospherie, temperature, therebyir"aIng applie'Aioo of the mix~ora casier. Castor oil has been usedI (in the 8 ftA6 ft tunnel at the Royal Aircraft E~tablisharnt) on metml models wit an extroaelyhigh istondfrd of surface finish. froublo waft exporIencod with otb~r oil6 on thaoem4els. castor oil was tried bocu"w otf ita hi1h ahasim~ to metal suraces.
Oleic acid in used to limtit :oagulatkon In nearly fill ciis, although it hast notbe-Ns aocenary to rdd anty dispersin; agent to mixtures baised on nature) animal orvogtallp oils (Oitch as castor oil) sinco %ufMiciemt fiitty neldn iro rv. resnt "n thceolits. In soa cases, diwuersins agents have bions itnittod froe =ixturvn batmed onmareral oils asd somp form tit pat-tern has been producod. Hlowtiver, the atasird ofthe paittern .-ould possibly have been i~prnved by the addition of olele aid. Inother casAs. the, oll viscosity has been varipd by blonding two oils. one of whichalreadity containt a dispersing agent. They were bat always mixed in the same pro-I~ort~on and the cortwequeot variation In the detree of disitefaonr reii'aliui in tL4standard. of liattprn forced not being ropeatible. It would be prefe-rable in sueh acase to choose two oils, neither of which coutains additive.
ilr varying the degree n! .coaculation (i.Q. changing the rplative proTortionx tifpigmeoit and dispersinr wgent) It is pssibie to ailtor thv smize of tho filaamin-% -vnd,hence. the scalo of the rattern. M3u4, a greaitor degree o! coagulat ion in neeusaryoi liArge modoels thin on smaller twsilm.
The x=Hrlst sirt of filanont toi be attained is dtetrmined by the rosolut!.rn oftthe ph- Tograx.oir syntod used and IrY the' method to be urail for the reproduction of tho
44
results, if any. Although considerably more fine detail may be obtained on a largemodel than on a small one, this may be useless if it cannot be recorded.
Cleansing of the surface of the model with solvent and rubbing over with oil isheld by some to be essential for the production of good oil flow patterns while othersconsider it to be completely unnecessary. Whether it ie essential or not, it doesserve the useful purpose of removing finger-prints (which may be acidic) ano ofproviding a clean, uniformly oily surface. No one considers cleaning to be necessarybetween the individual runs of a series of oil flow studies, respreading of themixture with. nossibly further a.plicaton of th oil ...xture being sufficient ilthis case.
The method of application varies between spray, paint-roller, brush and handaccording to the viscosity of the mixture and the size of the model. The thickermixtures %re applied by hand and it is thought that the rubbing action of the fingeron the surface improves the initial dispersion of pigment.
1.4.3.2 Correlation of Running Times
In addition to providing detailX of the oil mixtures used in their tunnels, thevaricus staffs were invited to quote times for the formation of flow patterns on
typical models. The data provided are for a ia;ge variety of tunnels, varying fromlow speed to high supersonic speed and including both intermittent and continuous
running. They apply to models of wings and of wing/body combinations. Totaltemperatures vary from 150C to 140 0C. The oils used range from kerosene to steamcylinder oils and include silicone fluids.
In Figure 1.26 these running times are correlated in terms of tte parameter
Aolj/qcf
where Aoil is the viscosity of the oil
q is the dynamic head
cf is the ]ocal skin friction coefficient,
which has the dimension of time and which is implicit in the theoretical treatmentin Section 1.2). It may also be recalled that the time taken for a pattern todevelop was found (experimentally, with eome further theoretical justification) to beindependent of the initial thickness of the oil sheet.
For the correlation, the oil viscosity hs been takcn at the eurface recoverytemperature for zero heat transfer (Ref.I.4.3), while the local skin friction
coefficient, cf , has been calculated at the trailing edge of a rypical chord,using Cope's data for flat plates (Ref.1,4.4) at the free stream Mach number. Itwill be seen that the correia.ion is reasonable, the majority of the data lying inthe range
t =(36, 000 ±12.,000) (0 Il)
(Note that in Figure 1.26, for convenience, the ordinate is measured in minutes whilethe abscissa is measured in seconds.)
45
Results for the flow on the simpl1 flat wedge in the 3 in. tunnel are also plottedin Figure 1.26 (as filled points). The times quoted are for the initial formation offilaments, which then remained on the wedge for a considerable time (seeSection 1.4.2,1). The fact that these times (t - 7500 /Loil/qcf) are minima initself accounts for them being less than the general values 'quoted, where time hasbeen allowea to ensura that the pattern is fully established. Further, in the generalcase the skin friction will differ from the flat plate value, being higher in someregions and lower in others. Consequently, it is to be expected that filaments willform quickly in some regions (e.g. beneath strong vortices) while in others theformation will be delayed and time has to hA allnwod fnr tha pmttern to develop in
all regions.
1.4.4 MULTIPLE PATTERNS DURING A SINGLE RUN
Various attempts have been made to obtain more than one oil flow pattern during a
single run. It has been found to he possible in certain cases, given some pro-knowledge of the type of flow patterns that are going to be obtained. For example itis helpful to know in advarace that at one of the incidences to be tested, there willbe a major flow separation o. the wing. If this is then solented as the firstcondition (and a suitable condition chosen to follow) sufficient oil may be left on
the wing to be redistributed in the later condition. It is also possible to inter-pose a dissimilar pattern between two similar patterns at different conditions inorder to ensure that the second of the like patterns is freshly obtained. Thismethod has been used by Ormerod in studies of the vortex flow over slender winga,where the pattern changes little with Mach number at fixed incidence.
Multiple patterns may also be used successfully when studying one particular andlocalisd feature of the flow. For example (Rof.,.4.6), In obtaining the Mach numberand flow deflection boundary for shock-induced separation of the boundary layerseparated and attached flows were investigated ato-nuptly and the type of flow was
clear even though fine details wore confused by traces from earlier patterns.
For permanent records in all those cases it is. of course. essential to be able tophotograph tlie flvw pattern' during the run.
4.4.5 C ONCLUOINts REMAKa3 - RECON~rNUEiO MIXTURE
From a correlation of avaliable jata on the oil flow technique it is possible torecoaend the following prcotiuro for the determination of a oil mixture.
(1) Toe running time to develop a pattern is first decided, by consideration of theoperating conditiein% of the tunnel.
(2) This time is divided by 36.000 to give an approxlmat value for the parameter' Oi /qc f .
(3) A value of qcf , calculated %L U. traiiinv edge of a typical chord frcnmboundary layr theory ftr a flat platv, Is used to determine the roquired ,il
viscoaity at the ttmix-ruture of the, surface. With simple models, or if the ctrteet
46
lowest value of qcf on the model is used, this may under-estimate the viscosityrequired (Section 1.4.3.2).
(4) A suitable oil may be chosen from Figure 1.27. or similar data.
(5) The mixture should contain from 2/5 to 2/3 parts of titanium dioxide powder to
1 part of oil (by volume or weight, since the densities are almost identical).
(6) The amount of oleic acid, or other dispersing agent, must be determined byexperiment, since the factors involved are so variable (e.g. the oleic acid maydeteriorate, the oil may already contain a dispersing agent or, in some cases, adispersing agent may be unnscessary).
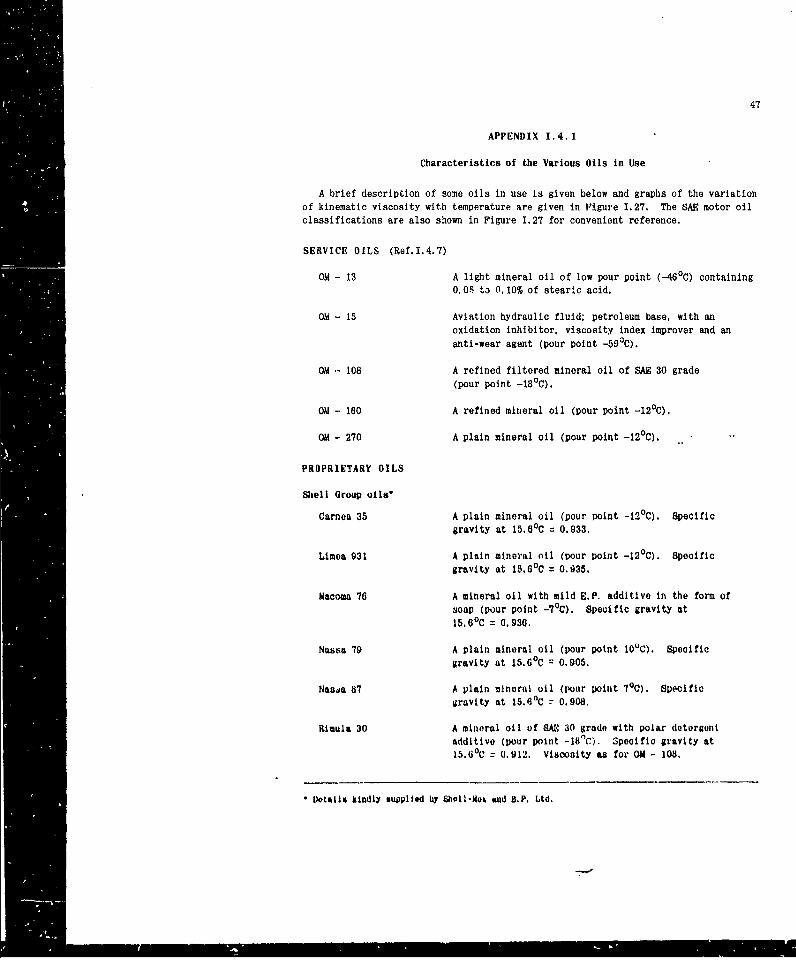
APPENDIX 1.4.1
Characteristics of the Various Oils in Use
A brief description of some oils in use is given below and graphs of the variationof kinematic viscosity with temperature are given in Figure 1.27. The SAE motor oil
classifications are also shown in Figure 1.27 for convenient reference.
SERVICE OILS (Ref.I.4.7)
OM - 13 A light mineral oil of low pour point (-46°C) containing0. 0. t3 0. 10% of stearic acid.
OM - 15 Aviation hydraulic fluid; petroleum base, with an
oxidation inhibitor, viscosity index improver and ananti-wear agent (pour point -590C).
OM - 108 A refined filtered mineral oil of SAE 30 grade(pour point -18°C).
ON - 160 A refined mineral oil (pour point -120C).
OM - 270 A plain mineral oil (pour point -120 C).
PROPRIETARY OILS
Shell Group oils'
Carnea 35 A plain mineral oil (pour point -120C). Specificgravity at 15.60C = 0.933.
Limea 931 A plain mineral nil (pour point -12°C). Specificgravity at 15.6 0C = 0.35.
Macoma 76 A mineral oil with mild E.P. additive in the form ofsoap (pour point -7OC). Specific gravity at15.60 C = 0.936.
Nassa 79 A plain mineral oil (pour point 100 C). Specificgravity at 15.6 0 C = 0.905.
Nauja 87 A plain mineral oil (pour point 70 C). Specificgravity at 15.60C - 0.908.
Rimula 30 A mineral oil of 8A 30 grado with polar detergentadditive (pour point - S8('). 3pecific gravity at15.60C = 0.912. Viscosity as for ON - 108,
Detals kindly suppllod by Shall-Mox aud B.P. Ltd.
48
Vitrea 72 A plain mineral oil (pour point -7')C). Specific gravityat 15.6 0C = 0.880.
Edgar Vaughan & Co.Ltd., Oils
EVCO Medium turbine oil Specific gravity at 15.60C = 0.880.
EVCO NPL 4 (No details available).
OTHER OILS
Various vegetable oils, -'ich as Pastor oil and linseed oil, are in use. They all
contain fatty acids.
Various paraffins are in use.
SILICONE FLUIDS (Ref.I.4.8)
Midland Silicone MS 200/500 cs 1 Dimethyl silicone fluids
MS 200/1000 cs with characteristically high
MS 200/12,500 ca I viscosity index.
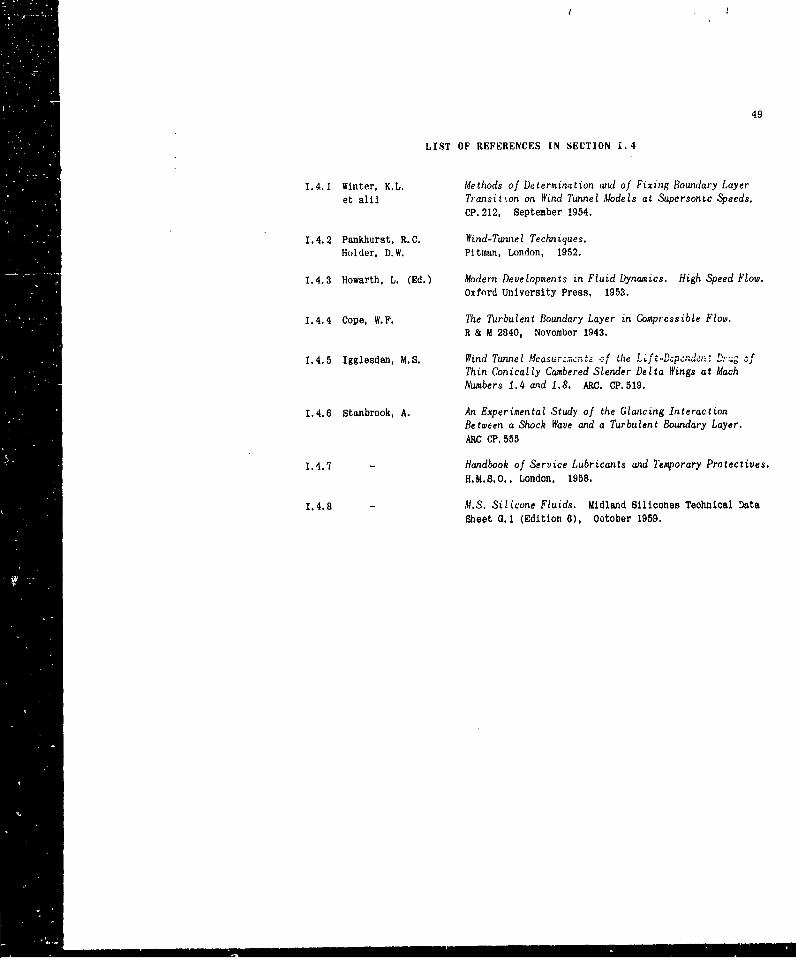
49
LIST OF REFERENCES IN SECTION 1.4
1.4.1 Winter, K.L. Methods of Determination and of Fixing Boundary Layeret alii Transitton on Wind TunnelilModels at Supersontc Speeds,
CP. 212, September 1954.
1.4.2 Pankhurst, R.C. Wind-Tunniel Techniques.Holder, D.W. Pitman, London, 1952.
1.4.3 Howarth, L. (Ed.) Modern Developments in Fluid Dynamics. High Speed Flow.Oxford University Press, 1953.
1.4.4 Cope, W.F. 'The Turbulent Boundary Layer in Compressible Flow.R & MA 2840, November 1943.
1.4.5 Igglesden, M. S. Wind Tunnel Mcsr lt~o theLWDpdz r fThin Conically Cambered Slender Delta Wings at MachNumbers 1.4 and 1.8. ARC. CP.519.
1.4.6 Stanbrook, A. An Experimental Study of the Glancing InteractionBetween a Shock Wave and a Turbulent Boundary Layer.ARC CP. 555
1.4.7 - Handbook of Service Lubricants and Temporary Protectives.H.MP. 5.0., London, 1958,
1.4.8 - M.S. Silicone Fluids. Midland Silicones Technical DataSheet 0.1 (Edition 6), October 1959.
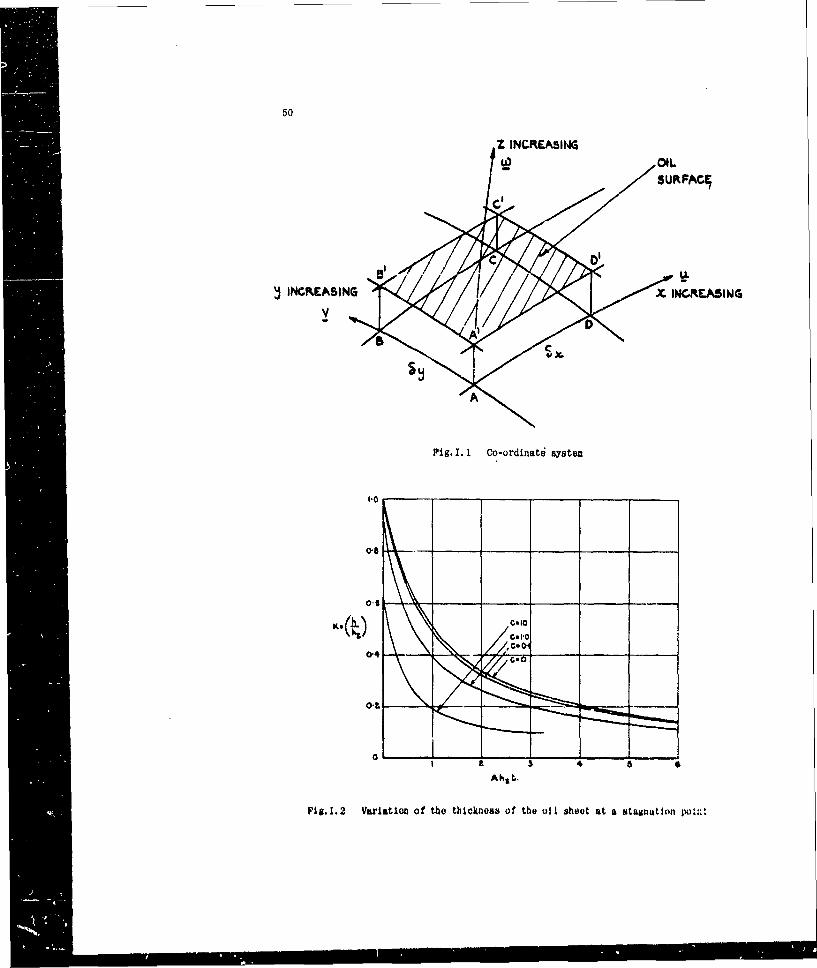
50
I'A'
10
0~4
00 0
Fig.1.2 varlatioc of the tbickness of the oil aheoot at a stagnation o~
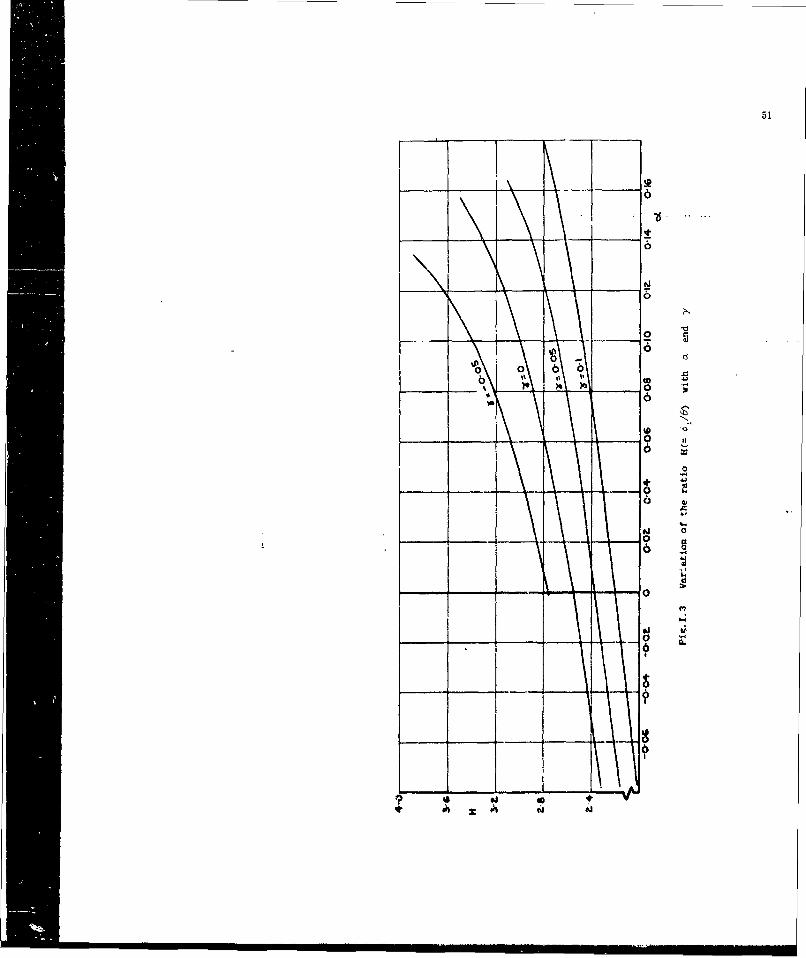
51
________ I0
4.0
0
26
0 - do 0 b b
I) 4-'), )~ ___ 0 ~
9. 6
0o6 ~
4. 4)
-- 9 ~o ~'
4)
9.5 0o
L.
0
K
N
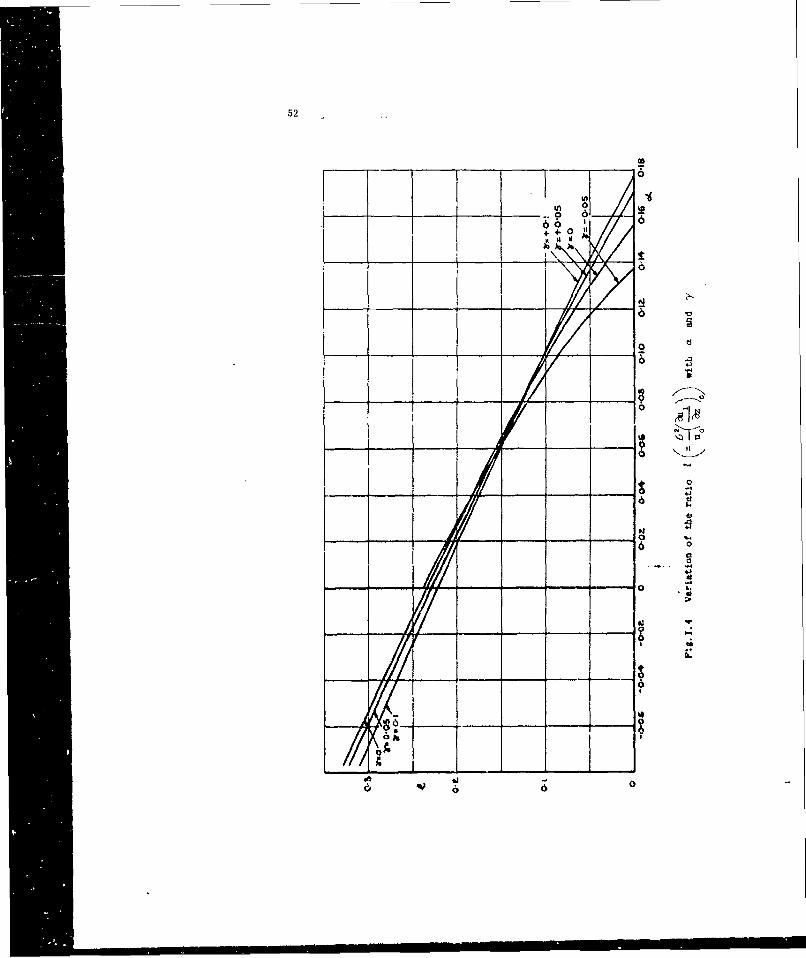
52
_.066 i 6
+ 0 J%.
TT- YN. o
_ 9.... I-
/-¢ , 'I
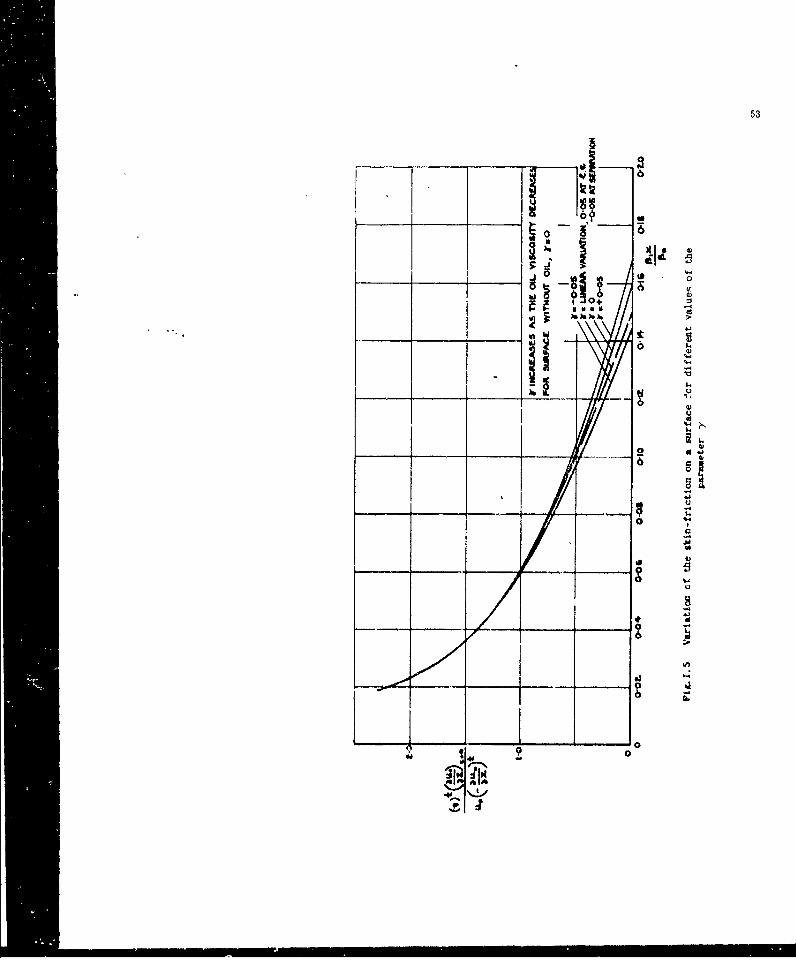
53
-- t-1, '5
t "i-f . I
"
---1 0
u4
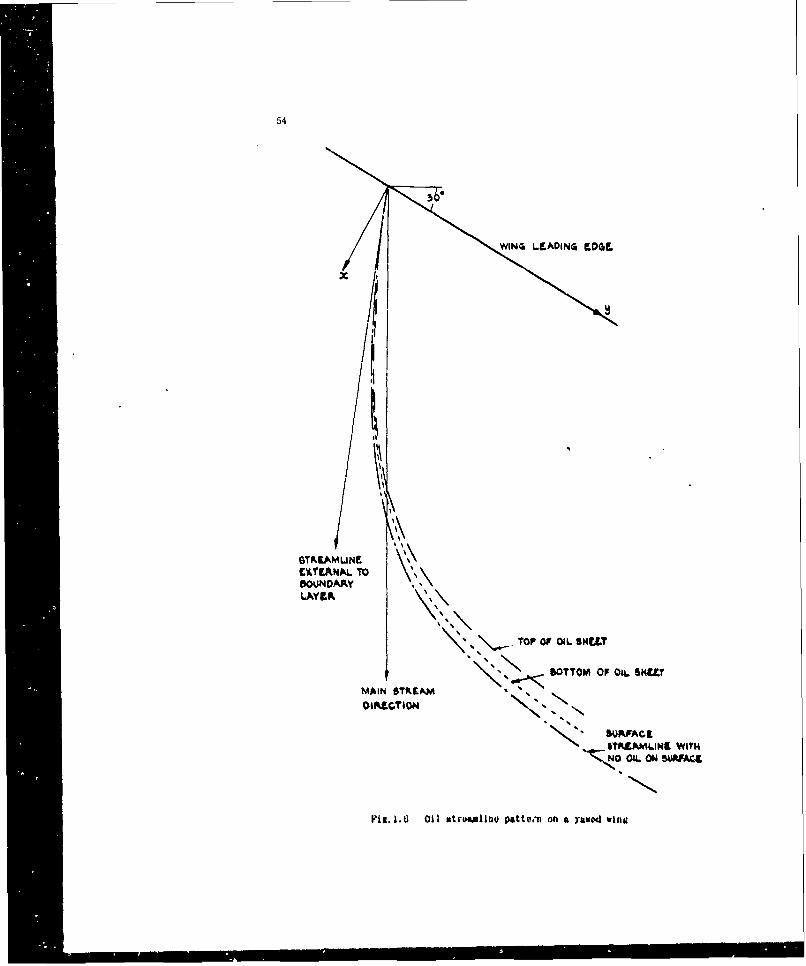
54
WING LEA0INQ FLG
STPkEAMLINEVATEANAL. TOBOUNDARYLAYCA
TO 04 OIL SHULT
MAIN &P.CAMBOTTOMI OF Ok. SHUT
DIAZC.TION
I oOLON SUNFML
Piu. 1.6 11i atrwolino pattem on a yasod vwitu
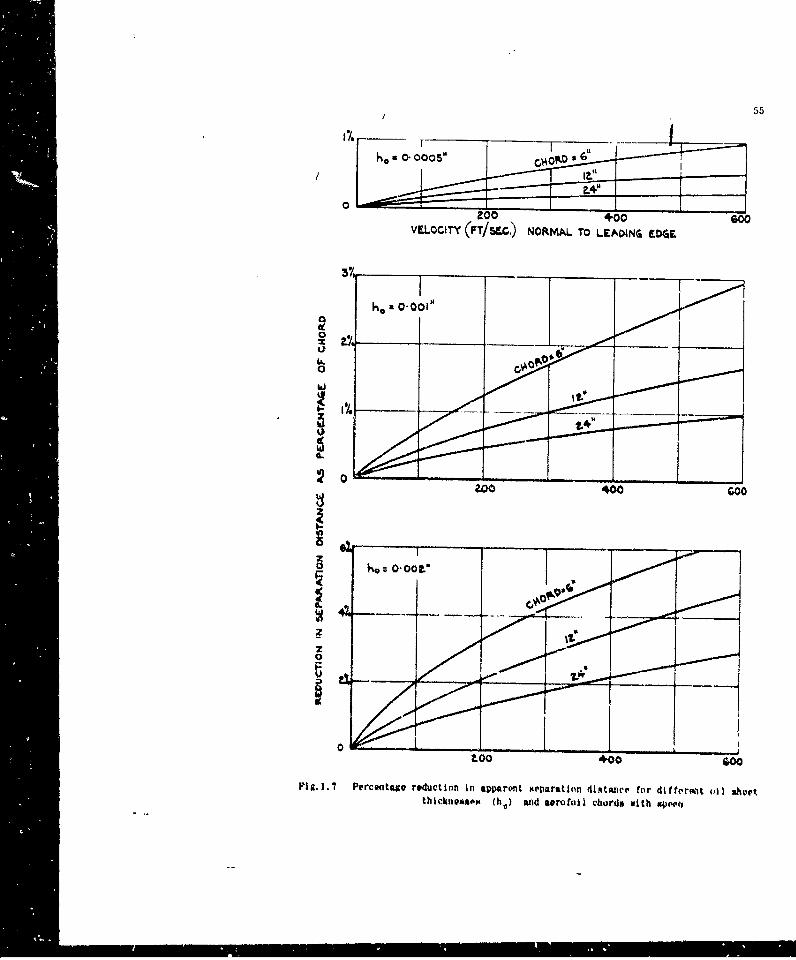
1 55
0
VELOCITY (FT/S&C.) NORMAL TO LEAWiNG EDGE
K.- 0,001,
0
0.oO
too +00
Fia.1.7 Percmitsue reduction In apparenit rn'varatinn dI.4tstnr for dittir~t vi1 a*h'etthickneaM.',I (hd R) wd aerotall churds with apn-Pt,
Fit. 1.e Surtav'e flow pattvms oa A =I dolt& wins at a m 15 (crhKsfle. keroscetu-V liht
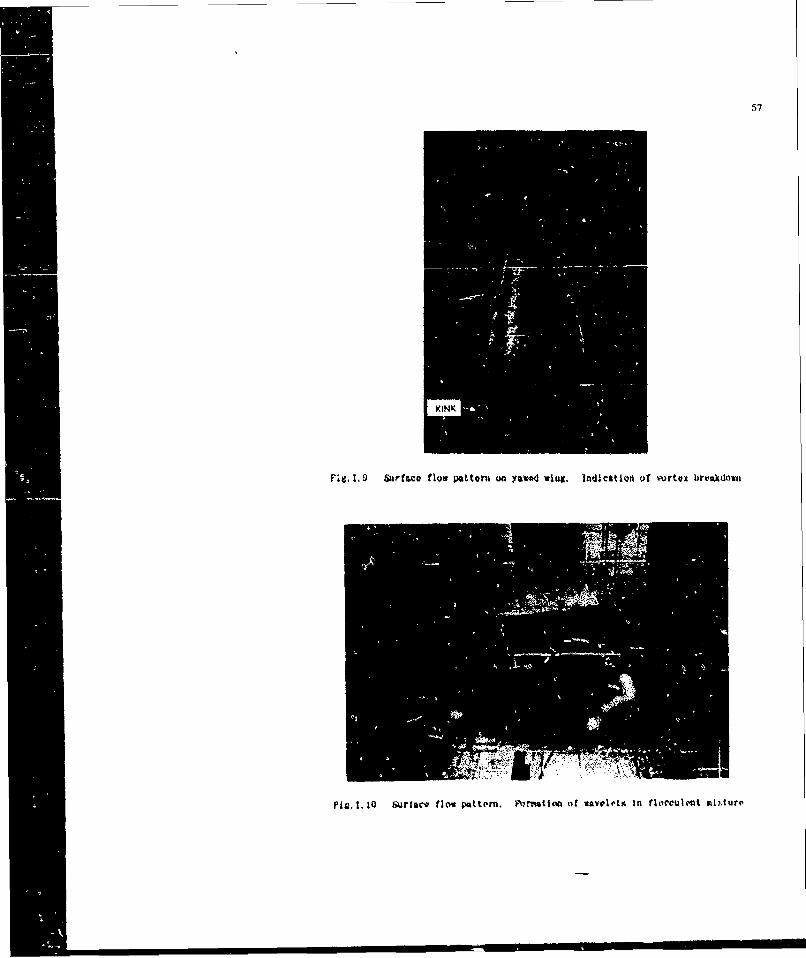
57
XINK
Fa &rft~a flow patten on yaw.oj tviu. lnd'cattlQn of ivortqx broktdown
Fig.1. 10 SuTIev flot pattern. orLmtIon of waslt In flo~culit m13.turv
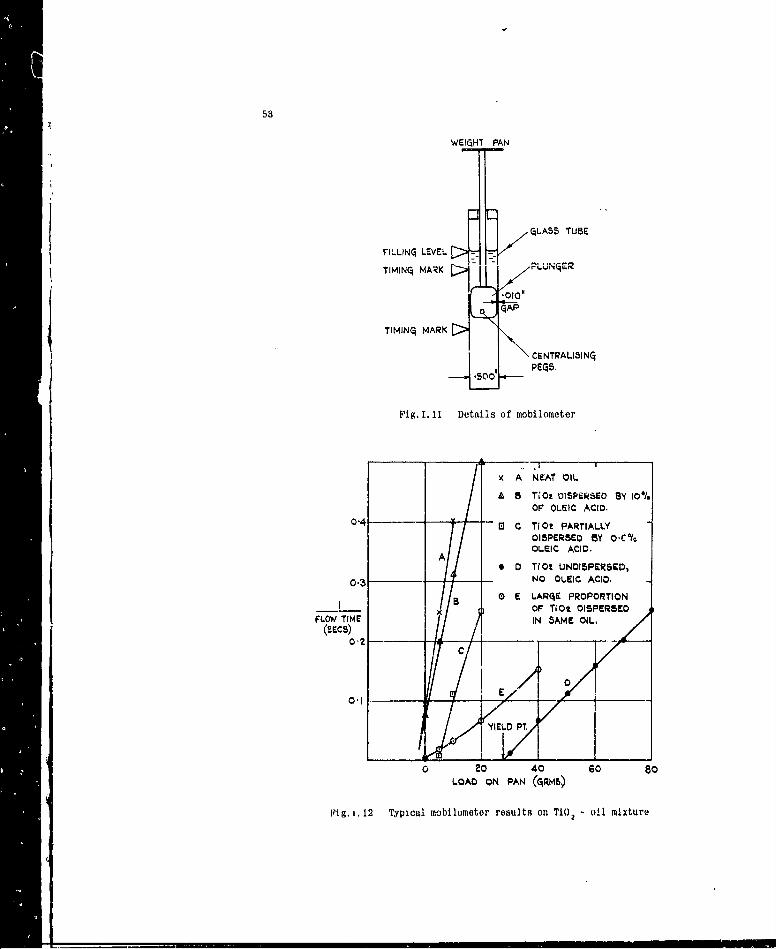
58
WEIGHT PAN
-ILAS5 TUBE
FLLINq LEVEL -
TIMINq MARK U-q
qAP
TIMINq MARK
CENTRALI5INq- PEGS.
Fig. I. 11 Details of mobilometer
x A NEAT OIL
A 5 TiO DISPRSED BY 10%OF OLEIC ACID.
0.4 0 C TIOt PARTIALLY
DISPERSED SY OC%OLEIC ACID.
A 0 TiOt UNDISPERSED,03 NO OLEIC ACID,
0 CLARGE PROPORTION_ _OF TiOt DISPERSED
FLOW TIME IN SAME OIL.
0'0
0.1
YIEj.DPT
0 2o 40 so 80LOAD ON PAN (;RMS)
Pig. t. 12 Typical mobilumeter reaults on TiO 2 - oh1 mixture
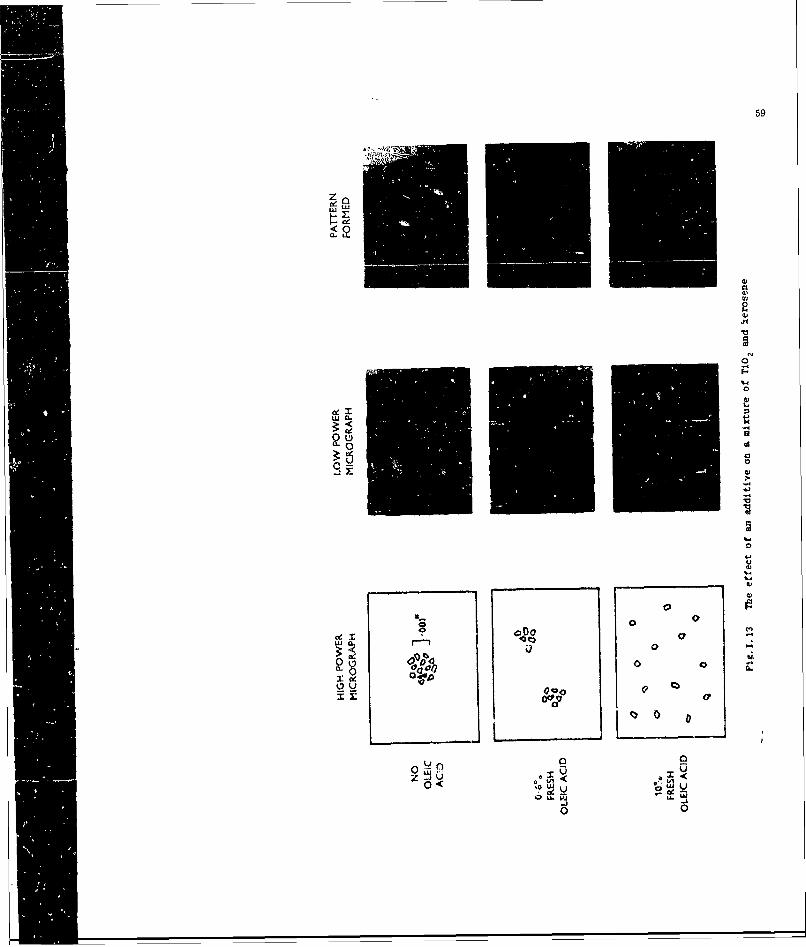
59
0 u
a
0
00
00
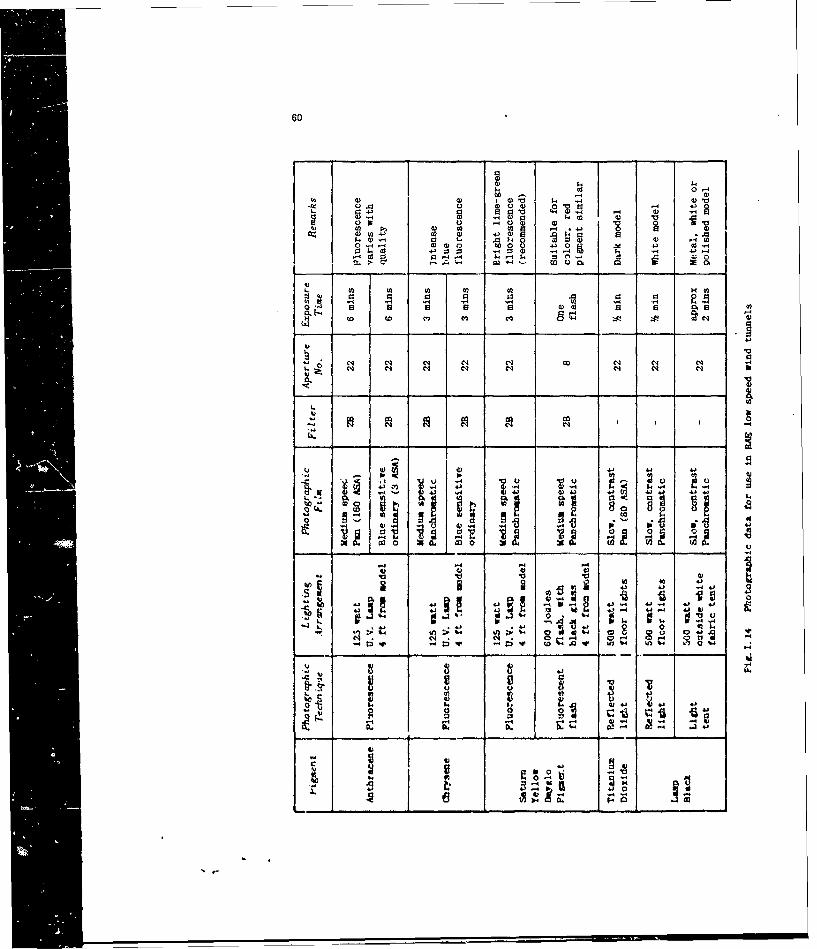
60
C) ) QO CD 4-'L a4- --z CO 4
CO 40 0
k 1-4 wO .0
COCO CO C) +)O .2 4. S4
4-'q .4 C N4~ cq co 4-4--N., N44L N O
0~ 0
CS -wS (aS In ~C
4,1
t -
-00
N N N N eS N N o
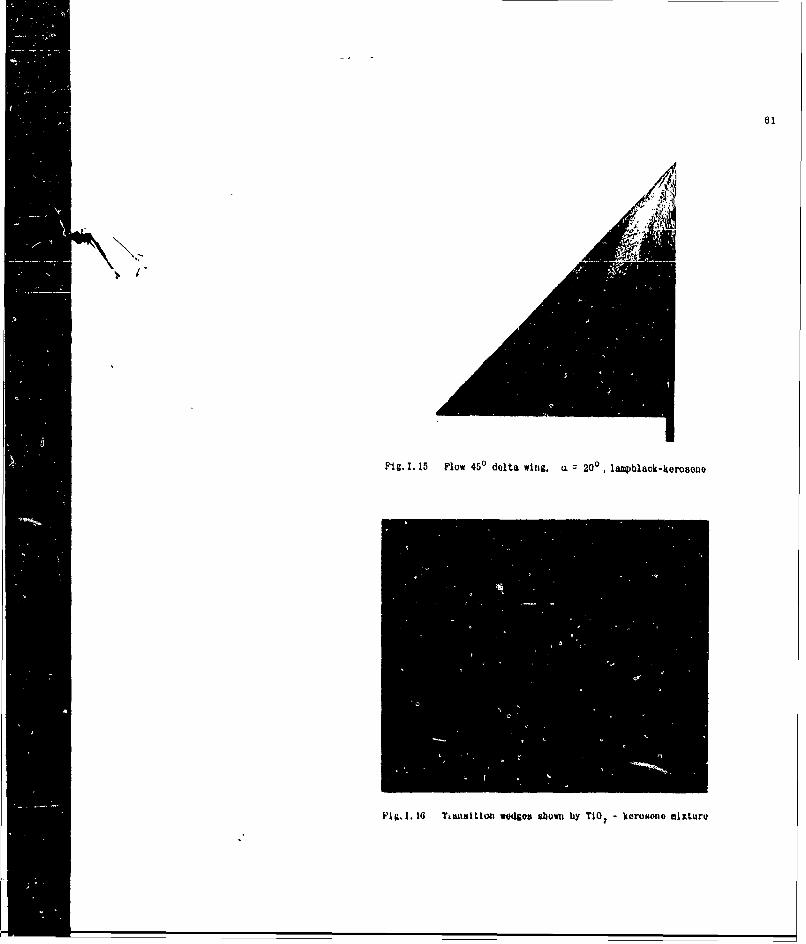
61
Fig. 1. 15 Flow 450 delta wing, aL 200 , ampblaok-korgono
p1ig. 1. 16 Tasltiou wedges sbown by TiO~ : korosocmitturo
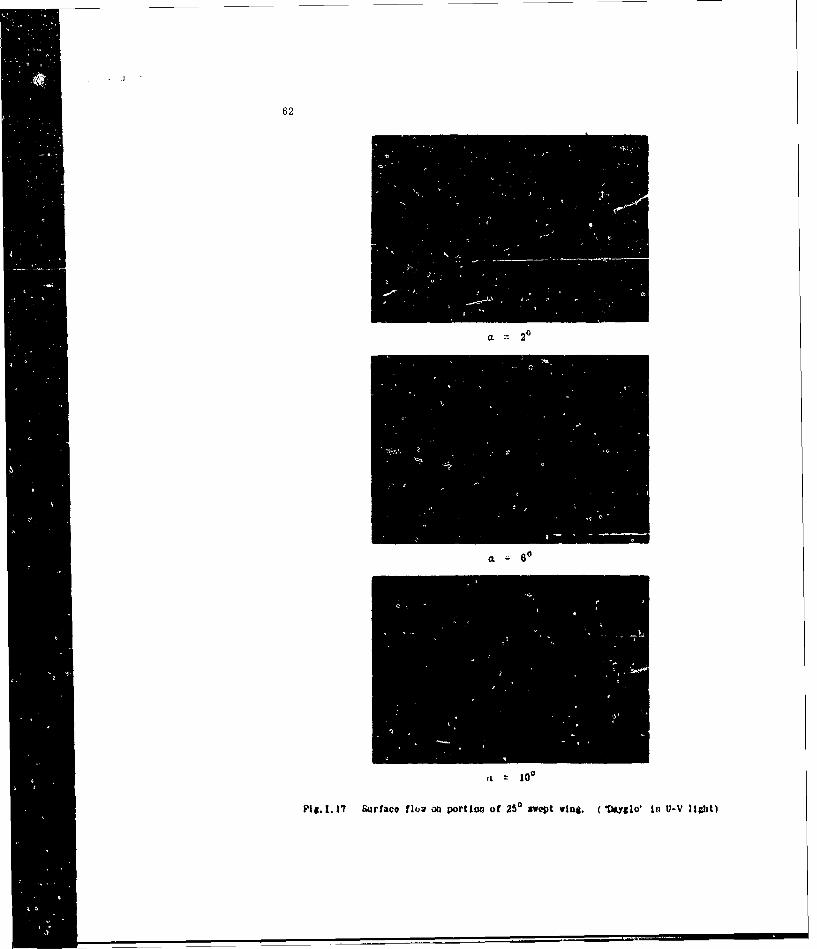
62
a 20
aL 6
a ll
Fig. 1. 17 Surfce fho on portion of 250 swept wing. C tyglo' In U-V light)
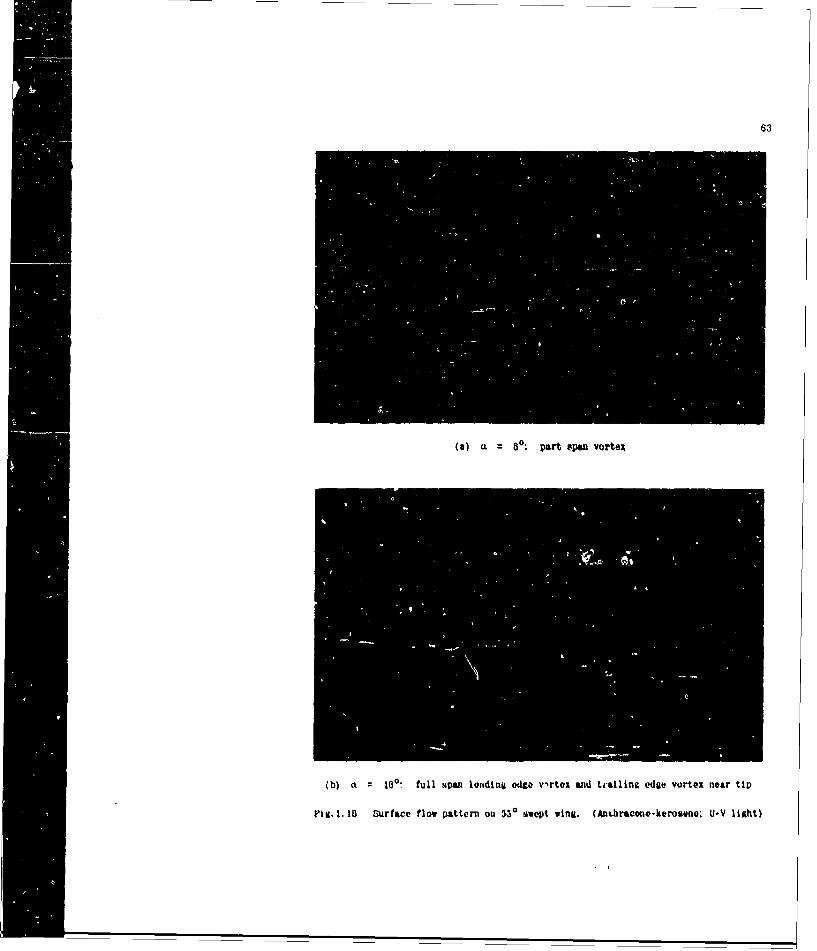
63
(a) a 80: purt *~pan vortex
(b) a 100: full mpmn 1ondWa edge v'rtex and trailing~ edge vortex near tip
Fla.~ 1. 18 Surface flow patterni on $5 swept wing. (Anbracen-kero~tne. U-V liaht)
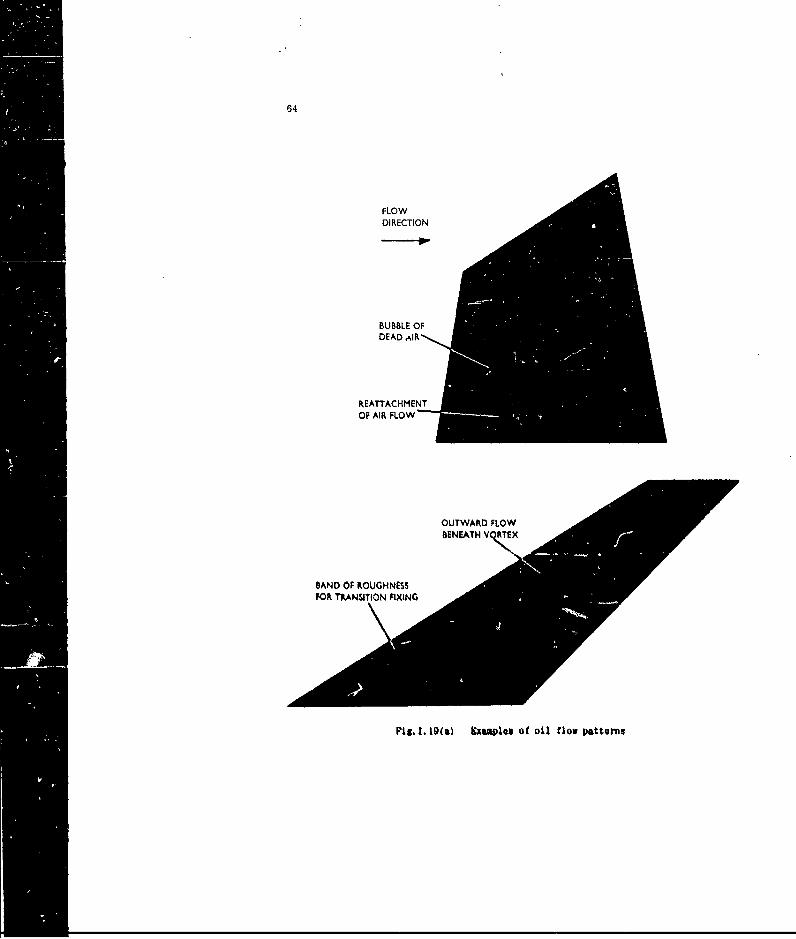
64
FLOW
BUBBLE OF
REATTACHMENTOF AIR FLOW
Pig. 1. 19(c) 9mmap" of oil flow pattern5
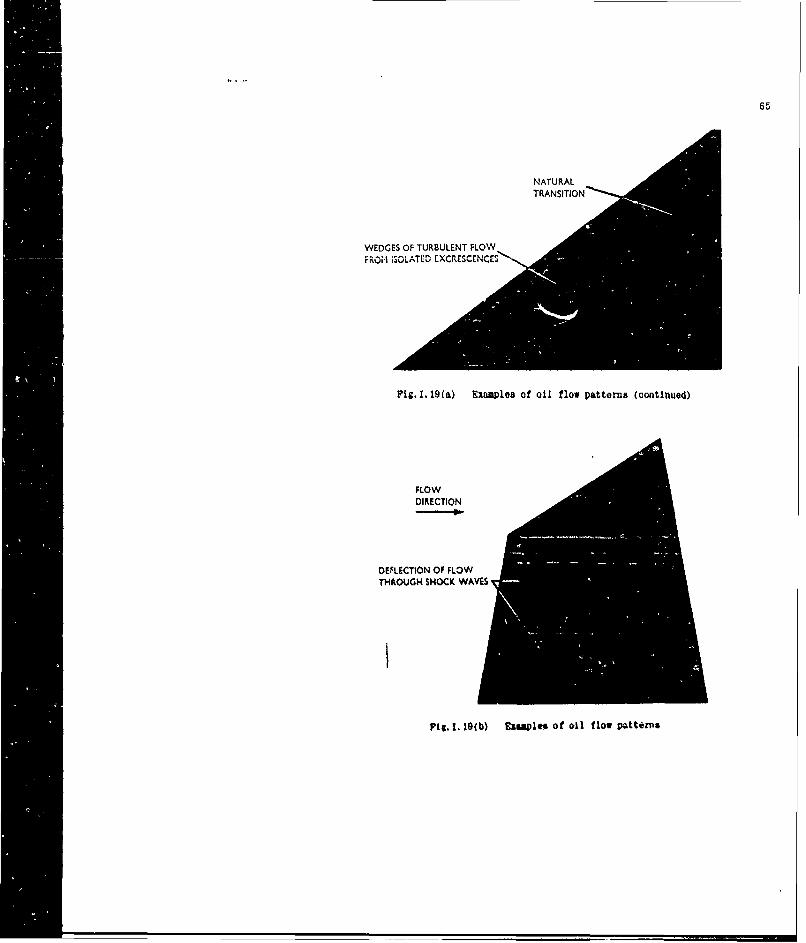
65
NATURALTRANSITION
WEDGES OF TURBULENT FLOWFROM iSOLATED EXCRESCENCES
Flg.I. 19(a) Examples of oil flow patterns (continued)
FLOWDIRECTION
DEFLECTION OF FLOWTHROUG$ SHOCK WAVES
Pig.I.19(b) EIWIaple of Oil flow pWtterna
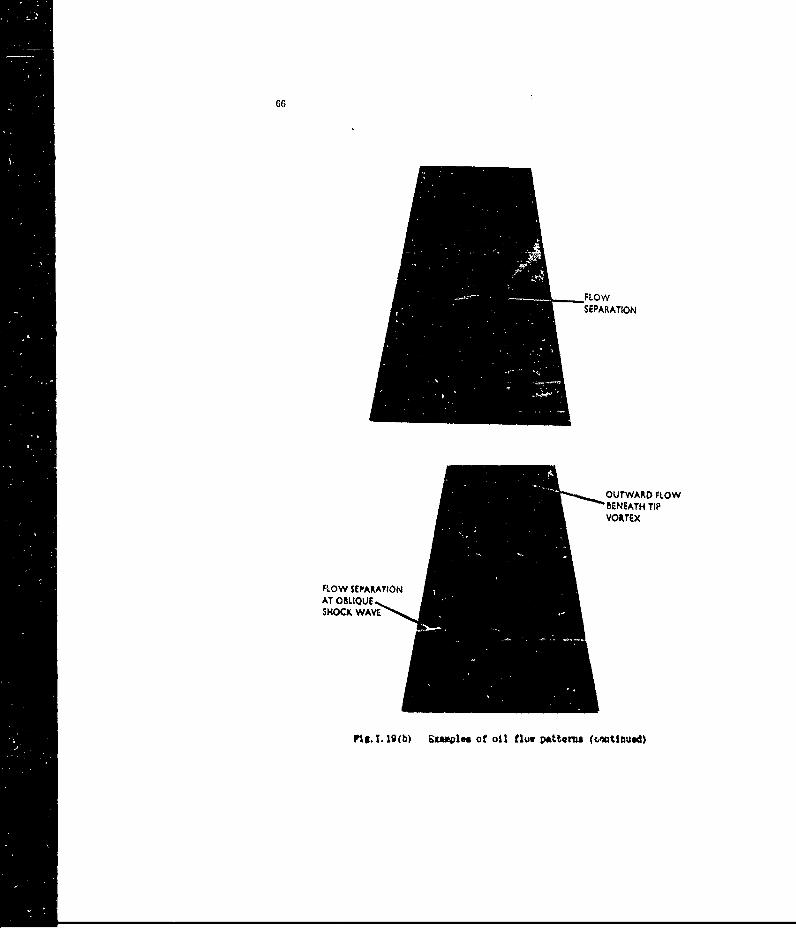
66
SEPARATION
OUTWARD FLOW
FLOW SEPARATIONAT OBIQUE
Pig. 1. 19 (b) &xwales of oil flow pattqus (vtulued)
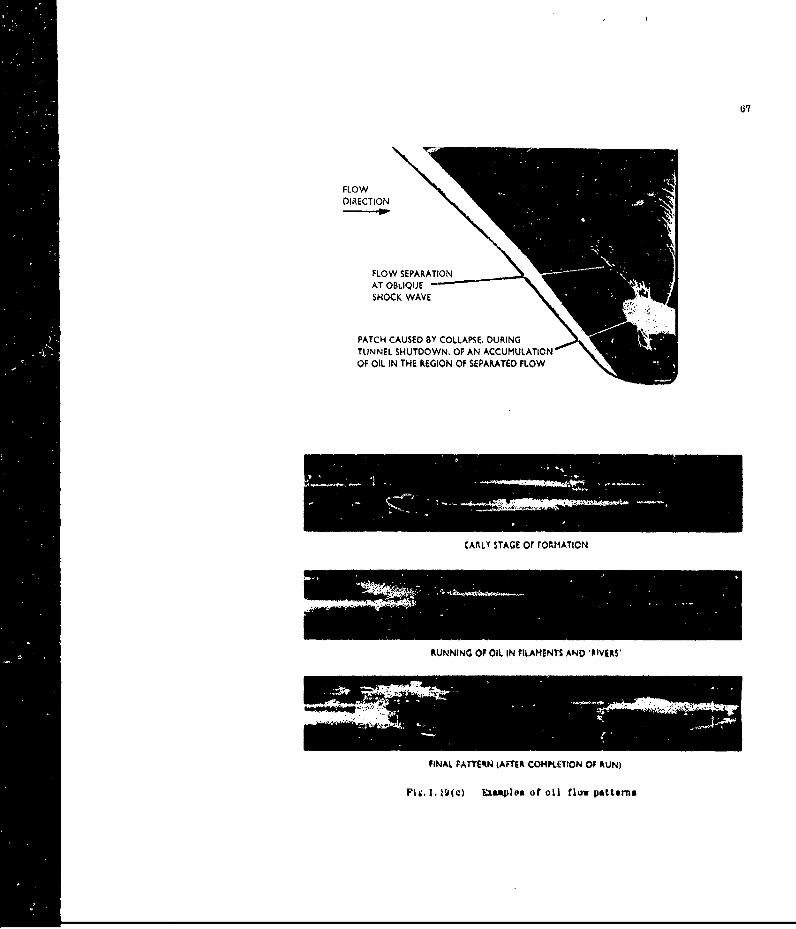
67
FLOWDIRECT ION
FLOW SEPARATION
PATCH CAUSED BY COLLAPSE, DURINGTUNNEL SHUTDOWN, OF AN ACCUMULATIONOF OIL IN THE REGION OF SEPAR.ATED FLOW
CAftLY STAGE or roftMATION
RUNNING OF OIL IN PILAMENTS AND 'AIVERS'
FINAL PATTEV.N jAFTEft C044P1~fTtON Of RUN)
Pis. 1.19I(c) Elvaa1016 of oil flow patLtrna
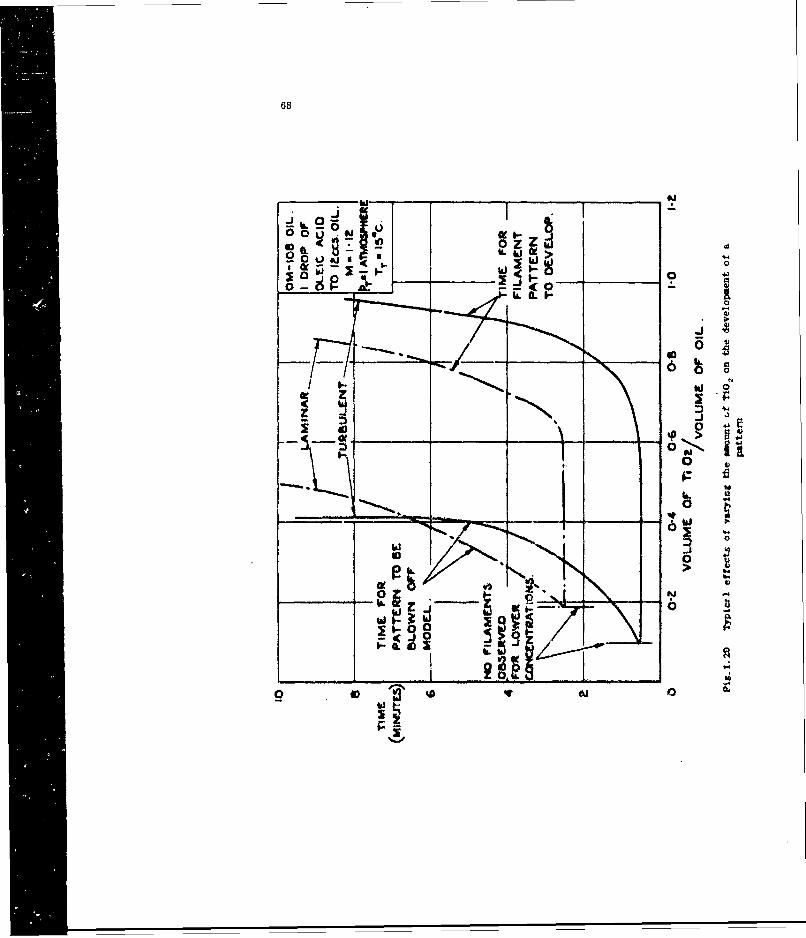
68
U01-
0 u o0
&4. ! llU
o oU. If
OD -
de.
OI
'S0
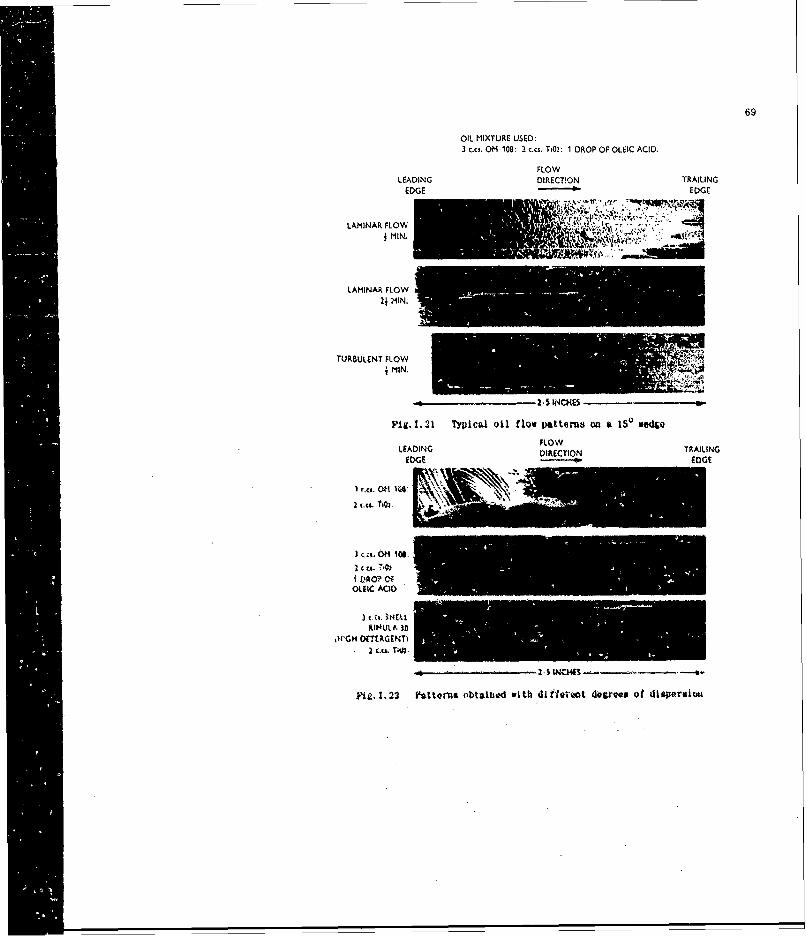
69
OIL MIXTURE USED:3 cc. OM-108: 2 c.cs. T02: 1 DROP OF OLEIC ACID.
FLOWLEADING DIRECT!ON TRAILING
EDGE EDGE
LAMINAR FLOW '
MIN.- Be
LAMINAR FLOW
~2j .tIN.
TURBULENT FLOWMIN.
I INCHES
Pg 1. 21 Typicea oil flow patters on a 150 vedo
FLOWLEADING DIRECTION TAIL NG
EDGE EDGE
JtI OM 10:
I 74t
OtEIC ACID
K114ULA 30jrGH DM TtGENT)
. .... ..... .-- s. 1 -. - .-
pig. . 22 tt tes tlbtlitd with ditiolgt 4egrves of dswrtiou
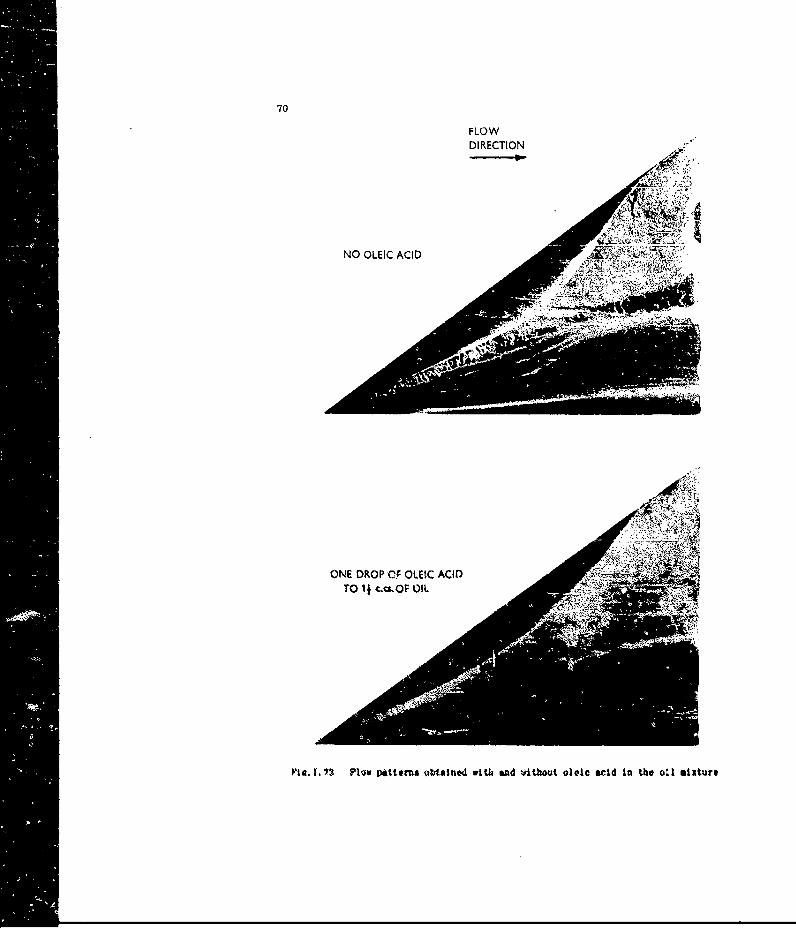
70
FLOWDIRECTION
V-INO OLEIC ACID
aI. 1. 73 Flow piaters ibtained wMlA and 4itbAwt oloic acid in the o-1 mixture
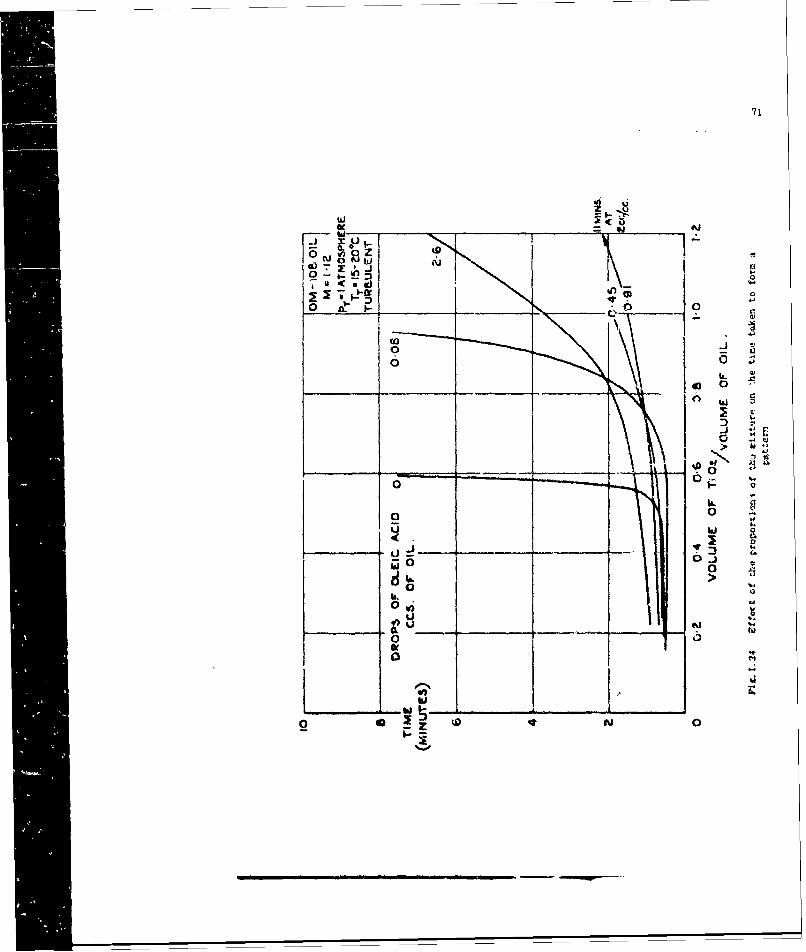
71
0!0
0 V)
oD -,
boo
0 ztj0
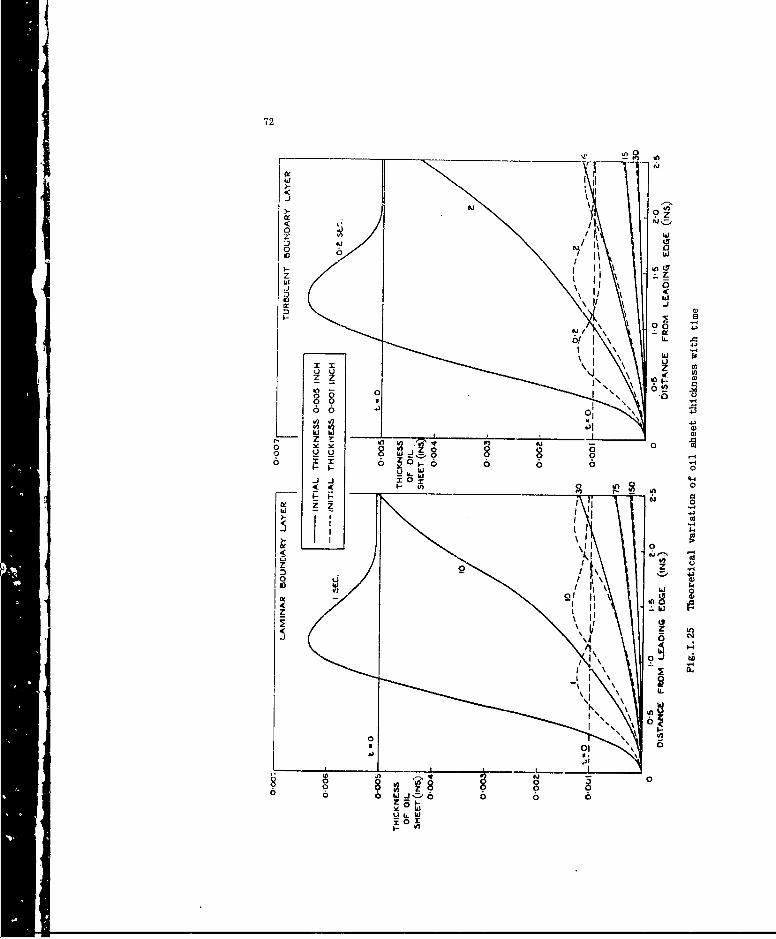
72
(Y
9z
LO
w I
00--
00
44
W(1
0 14 0
X 0 "- 0 0w 0i
OfOwI
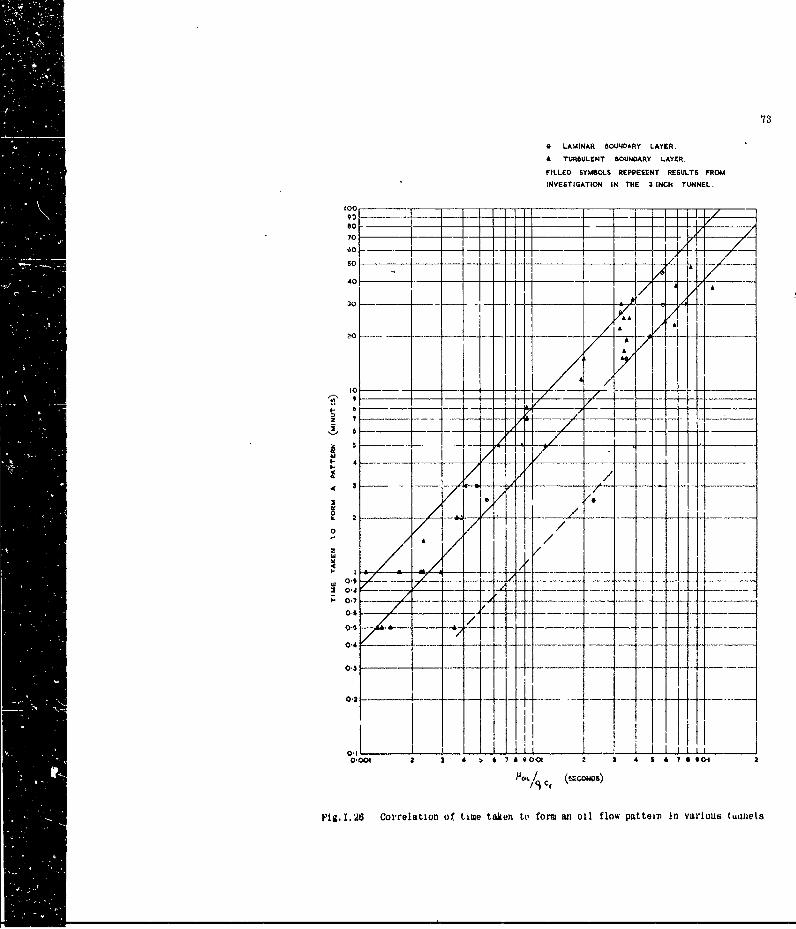
73
0 LAWINAR BOUNDARY LAYER.
* TURBULENT BOUNDARY LAYER.
FILLED SYMBOLS REPPESENT RESULTS FROM
NVESTIGATION IN THE 3 INCH TUNNEL.tobc
40 - lii--i
0-- ,-----.--
10
/A
IC ------ _ ----
S"
"-_L0.z -------,
O.- -- - -- - - - ----
0-
.IIo.,
_ _
I I - lg
0
14' A__
A.A A
AL V
6 ~ .4..4 .---
3 - -- - - - . -
0:~ z__ _
00I 3~ 47$O I 4 S£ S9A
Pi..8 Creaino ietknt otsa i lwpteI nvrostinl
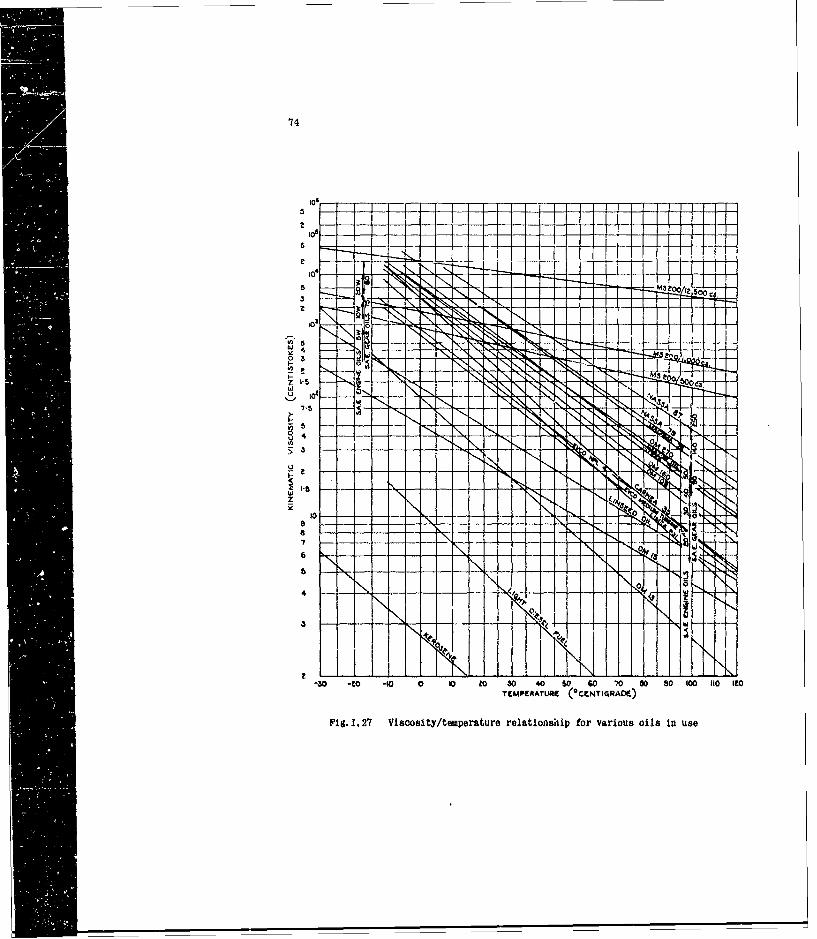
74
5 -- - M A4
eoo/IZ 5
000
z
61 N
3
-30 -to -10 0 10 to 30 40 GO SO 70 00 80 100 110 [toTEMPERATURC (CENTIqRADE)
Fi&. 1.27 Viscosity/temperature relationiiip for various oils in use
PART 11
TECHNIQUES FOR LOCATING BOUNDARY LAYER TRANSITION
76
CONTENTS
Page
LIST OF FIGURES 77
TECHNIqUE9 FOR LOCATING BOUNDARY LAYER TRANSITION 79
REFERENCES 81
FIGURE 82
77
LIST OF FIGURES
Page
Fig. II.28 Transition indicated by china clay technique (NPL) 82
79
PART I. TECHNIQUES FOR LOCATING BOUNDARY LAYER, TRANSITION
Apart from the methods described under the sections dealing with smoke techniquesand surface oil flow techniques, several methods have been devised for locating theposition of boundary layer transition by chemical ano evaporative means. Descriptionsof a number of these methods are given in Reference II.1 and attention is drawn tolists given there and in Reference Ii. 2 of various toxic materials which had previouslybeen suggested fnr use as indicators.
In current low speed practice only the 'china clay' and the 'liquid film' methoisare in common use.
The 'china clay' method is described in detail in References II.1 and 11.3.Briefly, the model is coated with a deposit of china clay (kaolin) which appears whitewhen dry. When sprayed with a volatile liquid of about the same refractive index(such as methyl salicylate*) the coating appears transparent. The liquid on the part
of the model subjected to a turbulent boundary layer is evaporated more quickly andthe white appearance is restored behind the transition line M&.11-28).
This method is particularly useful when many successive indications with a high
degree of clarity are required on the same model but for occasional measurements thepreparation of the surface is too lengthy. For rough indications a paste composed ofchina clay and kerosene spread on the surface of the model with the finger.- las giveu
excellent results although the comparatively uneven surfces which results . ,,etimosgives rise to transition wedges.
The liquid film technique is f-equently emloyed when a quick indication oftransition is required in the courso of a wind tunnel test. A volatile oil is wiped
onto the surface of thi. modal with a swab so that it is covered with a thin film-The film ovaporatea more quickly in the turbulent region and t*Uc transition line conreadily be seen in the reflections from the surface. The indication is clearer on amatt black surface and the contrast can be increased by dusting the unovaporated areawith a white powder such as french chalk.
It is convenient to holu in the laboratory a stock of kerosene distillationfractions so that a suitable oil can be chosen for the test conditioos, the heavierfractions being suited to higher speeds. Indication of the position of the transitionline is sometimes mad'i clearer if a transition wed , is created artificially by asmall protrusion placed in the laminar regions for this purpose.
In aigh speed wind tunnels the evaoration technique has now been almost completelydiscarder in favour of sublimation methods (Ref.II.4) whore a solution of % suitablesolid in a highly volatile liquid is sprayed onto the model. Indication of the stateof the boundary layer is then shown hy the different rtes of sublimation of the
solid deposit in different flow regimes.
in practice kerosene works well, and this gives the 'advantage that variaus disttllh,titu
rrmir"tlos oan be used au requirt.d.
80
Azobenzene has been generally used in continuous supersonic tunnels and more rapidindicators like acenaphthene and hexachiorethane have been used in transonic andintermittent tunnels. Acotone or petroleum ether are suitable solvents.
These sublimating solids as well as some others like diphenyl are toxic substancesand precautions must be take during application to avoid ingestion and contact withthe skin.
A lisL or alternative materials is given in ieterence lIl.b.
LIST OF REFERENCES IN PART 11
J1.1. Pankhurst, P.C. Wind Tunnel Technique; An Account ol ExperimentalHolder. D.W. Methods n Low and High Speed Wind Tunnels.
Pitman. London, 1952.
11.2. Merewether, E.R.A. A Note on the Toxic Effects of Some COemicalset alil Previously lictuucnded ' ' for U- "n W-rd Tunnel Tccjhique
and on Vapour and Gas Explosion Risks in Wind Tunnels.A. R.C. R. & M. 2198, 1946.
11.3, Richards, E.J. The China Clay Method of Indicating Transition.Birstall. F.H. A.R.C. R. & M. 2126, 1945.
11.4. Winter, K.G. Methods of I)etermtnation ana of ixtng Boundary Layer
et alii Transition on Wind Tunnel Modils at Supersonic peeds.
A.R.C. C.P. 212. AGARD AG l/P7, 1954.
1U.5. Main-Smlith, J.D. Chemval Solids as I)iffustble Coatng Films for Visual
Indication of itoundary Layer rransitian in Air andWater. A.R.C. R. & M. 7755, 1950.
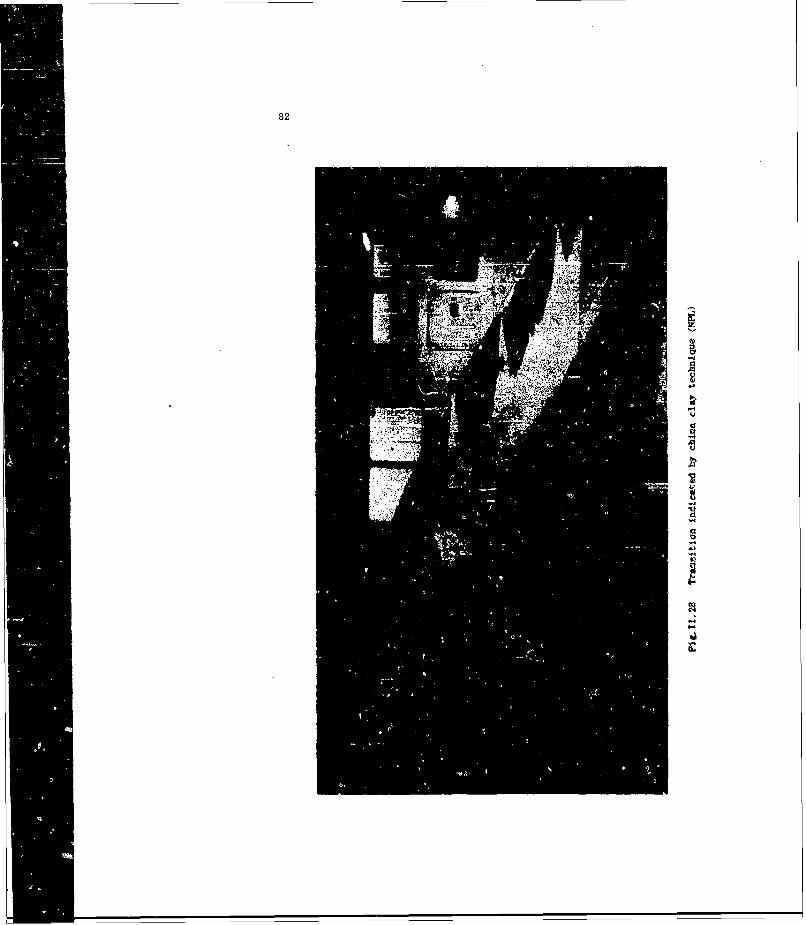
82
: mri
CU

P4R~T I3I1
SMOKE TECHNIQUES F~OR USE IN LO0W SPEED WID TUNNELS
84
C~ONTE.NTS
Page
LIST OF FIGURES 85
111.1 INTRODUCTION 87
11112 Q!L SMOKE 8'?
111.a a - BROXONAMHTALENF VIST 88
111.4 TITANIUM R.#LRO
111.5 WATtil VAPOUR 9
111.0 800P llVsfLps 9
llf.'? )VA94 no RIN smoke 90)
SME, aVflK UP1 CKLIAAObk OATERlaUt
~E SN-~.1JAT.O~OF ViOaT1X TYPEeb)4t NsPARATIONS 9It ?. I The qlaflut tube metkuts4
I11.9.2 tht ;1604 scec4 7culiue '.3
M*PKIES4CUS 96
~ 1~,UW~97
LIST OF FIGURES
Page
Fig. 111. 29 Titanium tetrachloride smoke on slender delta wing (Harvey) 97
Fig. II. 30 Cambridge University version of Preston and Sweetiugsmoke generator 98
Fig.. 111Y 34* 9f .''L 99
Pig. 111.32 T101 smoke r~rtr99
Pig. I1..23 Condensation in vortex cores 100
Pig. 111. 34 Flow in edge vortex showni by sosw bubble traues 100
Pig. 111.35 Brooks resin smoke generutor to!
Via. 111.30 PapE-. -Aoke gen.rator 102
pig. 111.37 The woke tube method 10*
Pigiz.t 4 Von-ox brestdotn using the smoke tube method A03
PM. i1. 39 Artflgteaft for saoke scroui tests 104
V14, 111.40 Ohtakfis of llab~t souteo*1 104
P1 g. 111. 42 Zmc~o Avtsvtoiew. ie:4
FL&. 111.42 Flow pmtttn on (Ilgt III ttC. 350 100
F4.111.43 &make screen tectinique using linear flasb tube 107,
Pic.111.*4 &&*ke rict"-Pn teconique. Vortex develupaent -ndolts wint; 503
~tg. 111.45 Swkscrre techniquo. Vortex devo'o t ondelta wing 102
87
PART 111. SMSOKE TECHNIQUES FOR USE~ IN LOW Si'LbA WIND TUNNELS
R.L. Maltby and R.F.A. Keating
111. 1 INTRODUCTION
Smoke tunnels, which are wind tunnels designed exclusively fir flow visualizationtests using smoke, can give unrivalled prssentations of the ontire flow field aroundu model. Thiese wind tzuonols operate at very low speeds and elaborate precautions aretaken to achieve a non-turbulent flow so that the smoke streams which are introducedin front of the model remain e~;ydefined. iue,;alse the Reynolds number availableis necessarily viery low, smoke tunnels are of limited value for my etigatinji flowseparation phenomena.
Pujll and detailed dtsserlptioiui of thtis specialized technique &re given inReferences 111.1, 111.2 and 171.3 anid the present paper will deal specifically withtho use% cf smoke in ordinary low-ispeed wind tunnels.
The choice of at suitable smoke iA not ovs.m for It should be dense anud white, non-toxic and non-corrosivo as well as non-cluir;lne and non-co~ndensing. It musit be safeiuid niwlo to genftrate anti must not is4sue Into the sirstrvam with sufficient velocityto disturb th~e experinental tionditions. It should be no)ted that many types of chemicalsmoke generutor diined for signalling and for military Pur"oAaa are corrorsive andcontair. totle, oretnl-t etya- 1heir use In not roemsuded In a confined apacee althoughtheret stay be no suitable alternative xhon very large volumps of #Asoe are required.in -,ch cases adequate pruovEtioa for the obsoers~v must be provided.
All sok techiniquov depend on the quality o.f thu lightitit availsibli in the windtunnel: In fact it in not uniusal for Skepatterns shitch are Invisible In generallightint, to reveal irortant details of the flow ier properly lit (i.112)I! the weeka patten has to he photographed thp problem of lighting beoaes even oreimportant and ca'.v rust alvays be talien to entueo that tlie bestt illumlination Isavaillable In oach set of circumstances.
111.2 all1. 910OWE
The w,4% cumecn xe~hol of obtaining Amoke. for 'nd tunneje% in by tht' vAporl7ation1
of a :Cncra! oil such~ as kerospne. An a~aratus eiosigned to produ"e A mhtantialquantity of kerosene itmoke to described in detail Ir. Refernces& 111.4 and ITI.S. Oil.4upplied from a rexervoir Is boiled in a glasis tube .Mch ia heated vlectiealy.'Me %-Apor Issuen from a uxall orifice at the 9:0c of the tot* weru It iawets itremsof air 4plitering froe the Aide" of a mining v(-ssel fouing a dense whit.. saoke. TheejwA-e is thou fed Io the wind ts-w,iol working ioct~kon tthmroui tubes,
The kerosene smokte lit nn-corrosive and non-toxic altough there Is some risk offire or explosiron If 'he gien~rat r is miat0nt~id. The swite ttis to codea. n thewallsi of tubts convvying it to thn model ad. if the geiretater -=.tot 1,e platoi caoseto the sodel, the voitu~n of -moke eitted way 1be air-arsointirg. Th-c appsiatutbecomes wesity to handle unl'~st it in quito ree free ias ati Ii. xmell of a larctei-nttwptrat ion of maklc !s unj~lanat.
88
A particularly compact and reliable oil smoke generator (Fig. THI. 30) has beendeveloped in the Mechanical Engineering Laboratories at Cambridge University. This isa self-enntained unit to supply a small smoke tunnel and it incorporates a blowerfrom a hair dryer to provide its air supply.
Small amounts of kerosene smoke can be generated at the surface of a wing
(Ref.III.6). An asbestos pad soaked in kerosene is set into the surface of the wingand is heated electrically so that smoke can be generated at the points of interest.
For instance, it can he produced along a spanwise line and can be used to give anoverall indication nf boundarT layer transition.
111.3 a - BROMONAPTHALFNE M':T (CIO H7 Br).
Smoke techniques are reasonably simple to operate at low wind speeds but there is
always difficulty in producing sufficient smoke to be visible at higher speeds. In
the course of research on axial compressors at the National Gas Turbine Establishment,
a special technique was required to make the flow visible at about 500 f.p.s.(Ref. 111. 7). A study of the 'arparent luminosity' of mists composed of refracting
droplets (Fig. III. 31) showed that a tenfold improvement could be obtained over
kerosene smoke if a mist with a refractive index about 1.G5 can be used.
a - bromonaphthalene mist has a suitably high refractive index and an apparatus,
similar in principle to the oil smoke generator, has been designed to produce it.The temperature of the vapour needs careful control and an elaborate boiler isrequired.
Satisfactory photographs have been taken at 500 f.p.s. with a high intensity argon
discharge light source.
a bromonaphthalene and similar compounds are toxic substanr-v Rnd the mist mustnot be inhaled.
111.4 TITANIUM TETRACILORIDE (TiCl4)
Titanium tetrachlorlde (Titanic chloride) is a liquid which, in the presence of
moist air, produces dense white fumes consisting of titanium dioxide and hydrochloricacid, The fumes are therefore highly corrosive and irritant,
Despite these serious disadvantages, titanium tetrachloride is frequently used when
a smoke trace is required with the minimum of preparation. The liquid is mixed with
an equal quantity of carbon tetrochloride (Cl ('I,) to minimise the formation of solid
deposits. It can be applied to the surfaces of models in drops or streaks by means
of a glass rod dipped in the mixture. A stream of smoke issues from the droplets
until they have completely evaporated leaving a solid deposit on the model, 1iolydetailed smoke patterns are easily obtained in suitable lighting; for example
Figure ilI.29(a) and IU.29(b) show the noiling up of the vortex sheets springing
from the separation at the edge of a slender delta wing. In Figure III,29(a) the
vortex core is well defined but in Figure II1.29(b) the model has been yawed and the
f.low in the vortex core breaks down.
89
A continuous stream of smoke can be obtained by using th" simple apparatusillustrated in Figure 111.32. Air is blown gently through a bottle containing amixture of titanium tetrachloride with carbon tetrachloride and the fumes-are delivered
through a glass tube to the model. There is a tendency for a solid deposit to form atthe nozzle which quickly blocks the flow unless it is cleared frequently.
Titanium tetrachloride smoke is only suitable for ery low wind speeds of the orderof 5 f.p.s.
111.5 WATER VAPOUR
If the relative humidity of the air in a wind tunnel is high the water vapour willcondense in areas where there is sufficient drop in temperature. This sometimesoccurs near the cures of the vurties £rum the edges of a slender wing and it Rives aclear indication of the vortex paths (Fig, I11.33). The proeass can be encouraged bythrowing water into the wind tunnel settling chamber before the test. The tubular
appearance of the vapour in Figure 1i1. 33 is discussed in Sectiou 111.9.
Water introduced into high velocity jets issuing from a wing in an airatream will
atomise into a mist which can be used to trace Lbj paths of the Jets.
111.6 SOAP BUBBLES
Although a strolam nf sosp hbbles can hardly be described as a smoke. it isconvenient to mention the method here sincO it performs a similar function. Thebubbles can ba produced from a mixture of a liquid synthetic detergent (such as'Teepol') and glycerine. A piece of wire bent to tom it 4 inch diameter circle with
a handle is dipped into the mixture and is then held iii a slow airstream. The windpl-A In narefully adjusted so that a stream of b'ibbes forms from the liquid film
on the wire and can be made to flow over a model for a few seconda. If they areilluminated by a spotlight from further downtream and photographed with a longexposure, the paths of the bubbles will appear as white lines. PFigure 111.34 illus-tratos the flow over a sharp-edied delta wing using this method.
A soap solution can sometimes he used to locate arlan of separtted flow at high windspeed IV feeding it through tubes lediu; to holes in the modal uied for pressureplotting. bibbles will form on the wirface and will be blown away except when theyfora at holes In a region of separation. In such a reiioa they will congregate andmark the area of zero velocity.
90
111.7 VAPORIZED RESIN SMOKE*
A compact electrically fused pyrotechnic generator (F'ig.III. 35) which produces adense stream of white smuke has been developed especially for -use in wind tunnels uDto a speed of about 50 f.p.s. The smoke is non-toxic, non-clogging, has an in-offensive odour but Is slightly corrosive to bare steel. The composition of thecontents of the generators has not been divulged by the manufacturers but it isbelieved to be based on the vaporization of a resin. Some ammonium chlorate ispresent. and, since this is an unstable substance, the generators munt be stured awayfrom heat.
ItI.8 SMOKE FRO% CELLULOSE MATERIALS
The smokes from smouldering cellulose materials such as wood, tobacco or paper havebeen in use for many years and they offer one of the simplest methods of producinglarge quantities of smoke for long periods with a simple control of volume. Thesesmokes tend to contain large quantities of tarry matter which may be deposited on thesurfaces of the model and the wiind tunnel unless they are previously filtered out.Unfortunately the volume of smoke is much reduced by such filters because thevisibility of the smoke areliets on the presence of water droplets. Furthermore theproducts of combustion of cellulose materials can contain a substantial proportion ofcarbon monoxiae and carp must be taken to ensure that the atmosphere In the laboratoryis not contaminated to a dangerous level,
Smouldering paper produces a very dense smoke withoutL aii excessive amouint of tarrymatter if* the burning conditions are carefully oontrolled, A suitable smoke generatoris illustratod In Figure 111.36 with which rolls of paper towelling are used as fuel.It coinsists of two cubstantial steel cylinders 12 in, high, one of 12 In. diameter,the combustion chamber, andi another of S in, diameter which is a separator to reovethe loe volatile products of combustion. both cylinders are fitted with lids whichare bolted down firmly to make a good seal.
The omhustion 1hamber lot fitted with au air supply pipe at the bottom and also aplug through which the paper ts Ignited. Inside the chamber, the air supply pipe individed into three smaller pipes arranged to distribute the Incoming air. Theseparator Is connected to the comtbustion chamber by a large pipe which is easilyacceanible for cleaning. The stmoke supply pipe to the tunnel is coitn~tMo' to the topof the separator.
It is Important to keep the temperature of combustion low in order to misimise theamount of tar priduced and to extend the duiration of the smoke production. The correct
*Vporieed resin amok. gecerators aro marketed "s trocks Udle Book Gonirat)r' Met. flS or$120. the number In the reference Indicating the time of burelna in secoonds. They ma bWobtained from:
Brooks Fireworks Cu. I.td,.11"01l 1lhenttad,
IRrtfordshlre,ftsaad.
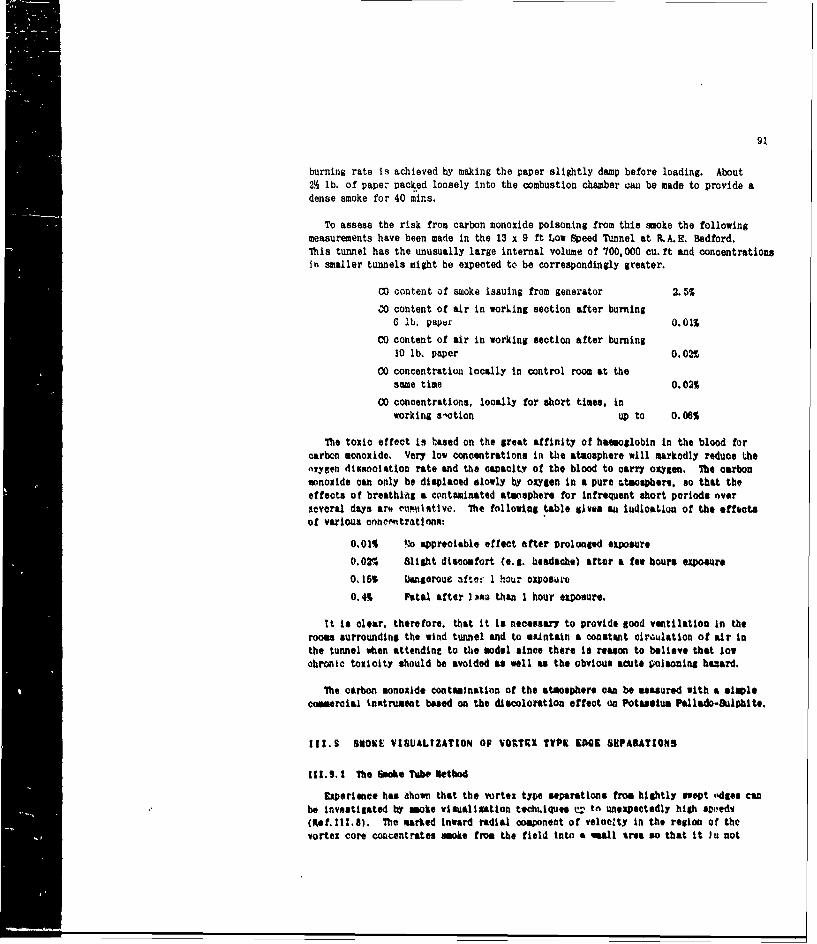
91
burning rate is achieved by making the paper slightly damp before loading. About2 lb. of paper packed loosely into the combustion chamber cnn be made to provide adense smoke for 40 irs.
To assess the risk from carbon monoxide poisoning from this smoke the followingmeasurements have been made in the 13 x 9 ft Low Speed Tunnel at R.A.E. Bedford.This tunnel has the unusually large internal volume of 700,000 cu. ft and concentrationsin smaller tunnels might be expected to be correspondingly greater.
co content of smoke issuing from generator 2.3
C0 content of air in working section after burning6 lb. papur 0.01%
CO content of air in working section after burning10 lb. paper 0.02
CO concentration locally in control room at thesame time 0.02%
CO concentrations, locally for short times. in
working sation up to 0.06%
The toxic effect is based on the great affinity of haamoglobin in the blood forcarbon monoxide. Very low concentrations in the atmosphere will markedly reduce thenxygen dasociation rate and the capacity of the blood to carry oxygen. The carbonmonoxide can only be displaced slowly by oxygen in a pure atnosphere, so that theeffects of breathivg a contaminated atmosphere for infrequent short periods overseveral days ar eturitatlvo. Te following table gives an iudioatlon of the effectsof various coneomtraton
0.01% to appreciable effect after prolonged exposure
0.02% Slight discomfort (e.g. headache) after a few hours exposure
0. 16% langeroue after I hour cxpos&ie
0.4% Fatal after I sa than I hour exposure.
It Is clear, therefore, that it is necessary to provide good ventilation in therooms surrounding the wind tunnel and to maintain a constant circulation of air inthe tunnel *ten attending to the model since there is reason to believe that lowchronic toxicity should be avoided as well as the obvious aicte poisoning haard.
The carbon monoxide contamination of the atmosphere can be masured with a simplecommercial tnatrument based on the discoloration effect on Potassium Pallado-ailphite.
I t& SOOKE VISUALtZATION OF VOTAX TYPE EOG SEPARATIONS
111.9.1 The Smoke Tube Rethod
Cxperience has ahown that the vortex type separations from hbihtly swept ,sges canbe Investigated by smoke visualization techiiquea u to unexpectedly high spiveds(Ref.11.8). The marked inward radial component of veloelty in the region of thevortex core concentrates mose fro the field into a al trea so that it It not
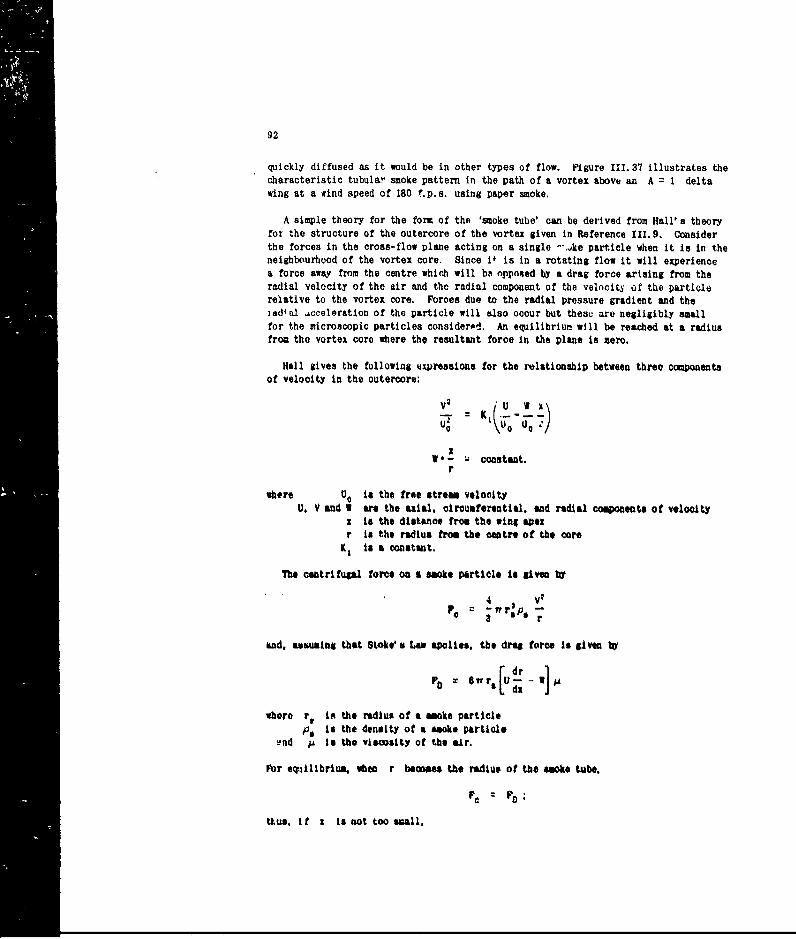
92
quickly diffused as it would be in other types of flow. Figure II. 37 illustrates thecharacteristic tubula smoke pattern in the path of a vortex above an A = I deltawing at a #ind speed of 180 f.p.s. using paper smoke.
A simple theory for the for of the 'smoke tube' can be derived from Hall's theoryfor the structure of the outercore of the vortex given in Reference 111.9. Considerthe forces in the cross-flow plane acting on a single '.ke particle when it is in theneighbourhood of the vortex core. Since if is in a rotating flow it will experiencea force away from the centre which will be nppnRed by a drag force arising from theradial velocity of the air and the radial component of the velncit" of the particlerelative to the vortex core. Forces due to the radial pressure gradient and thezad'al acceleration of the particle will also occur but these are negligibly smallfor the microscopic particles considerod. An equilibrium will be reached at a radiusfrom the vortex core where the resultant force in the plane is zero.
Hall gives the following expressions for the relationship between three componentsof velocity in the outercore:
V2W
We- constant.r
where Uo is th. free stres velocityU. V and V are the axial. circumferential, and radial cosonents of velocity
a is the distance fro the wing apexr Is the radius from the emtr* of the core
KI is a constant.
The centrtfual force on a smoke particle is given by
4 V2
S= -r.' p.--
and. assuming that Stoke'a La apolies the dreg force Is given by
PC Tr.[Ud!d: - V )A
where r. is the radius of a moke particleP0 Is the density of a smoke partiole
"nd pA I the viscosity of the air.
For eo.4rllbriu. when r beoum the radius of the smoke tube.
pe f aD o
.-- _thus, It a Is act too wall.
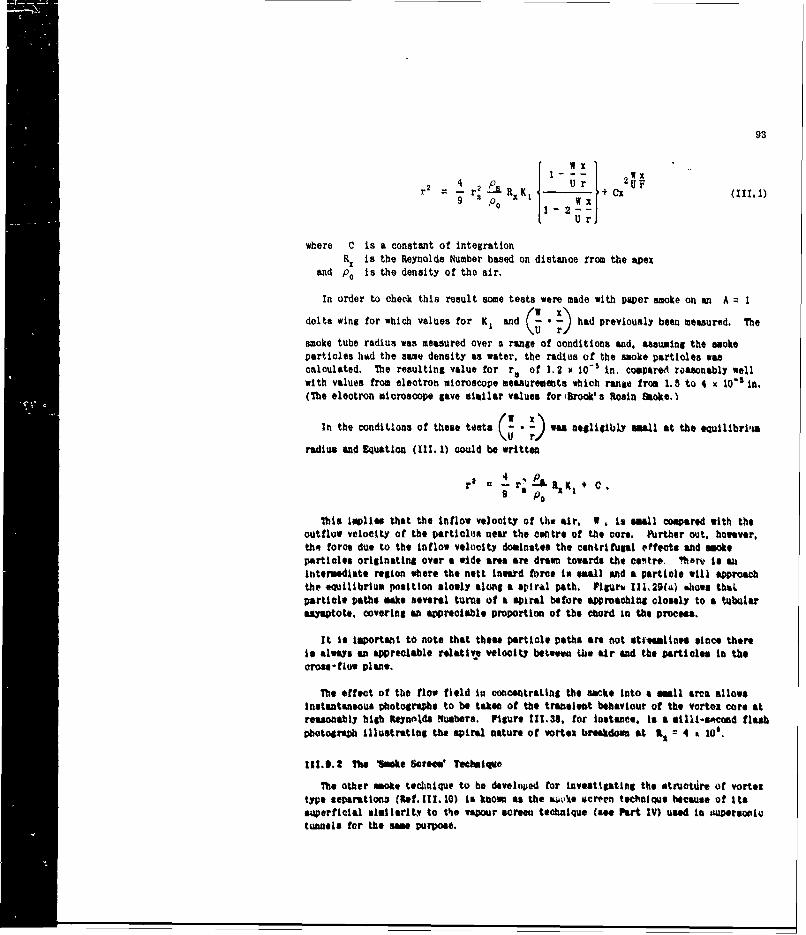
93
W XiI - -- I WX
r 2 = 4 r 2 s X U r(ii,9 3 P0 X 2~~ W x(1.
U rl
where C is a constant of integrationRx is the Reynolds Number based on distance from the apex
and p0 is the density of the air.
In order to check this result some tests were made with paper smoke on an A 1
delta wing for which values for K, and .1 had previously been measured. The
smoke tube radius was measured over a range of conditions and. assuming the smokeparticles had the same density as water, the radius of the smoke particles wascalculated. The resulting value for ra of 1. 2 x 10- in. compareA reasonably wellwith values from electron microscope measurements which range from 1.5 to 4 x 10" in.(The electron microscope gave similar values for 'Brook's Rosin Smoke.
In the Conditions of theetest. -- was negligibly small at the equillbrl'ia
radius and Equation (1ll. 1) could be written
r r'r -&it + C.
9 aP 0
This i plies that the inflow velocity of t .h air. W is small compared with theoutflow velocity of the partielus near the centre of the core. Purther out. however.the force due to the inflow velocity dominates the centrifugal effects and imoteparticles originating over a wide area are drawn towards the costre. ,tar is anintermediate region where the nett Inmrd force i emal and a particle will approachthe eqilibrium posltion slowly along a spiral path. Pigurv I11,29(u) alows th"Lparticle path# make several turns of a spiral before approaching closely to a tubularasymptote, covering an appreciable proportion of the chlord in the process.
it is Imoortant to note that the" particle paths are not stramlInte since thereIs always an appreciable relative velocity betwew the air and the particles in thecros-fiow plane.
The effect of the flow field in concentrating the seke Into a small area allowsInstantaneous photographs to be taken of the transient behaviour of the vortex core atreasonably high Wnolda Numbers. Pigure U11.30, for instance. is a villl-40od flashphotograph Illustrating the spiral nature of vortex breakdoon at It, M 4 . 10'.
ll.1.2 11.l "kne Sctfm* Teoluqve
The other moke LcltunIqU to be developed for lnvestgating the strueture of vortestype separations (bef.II.lO) is known ma the & ,ts screen technique because of itssuperficial similarity to the vapour scren technique (se Part IV) ued in %upersolutunnels for the sme purpose.
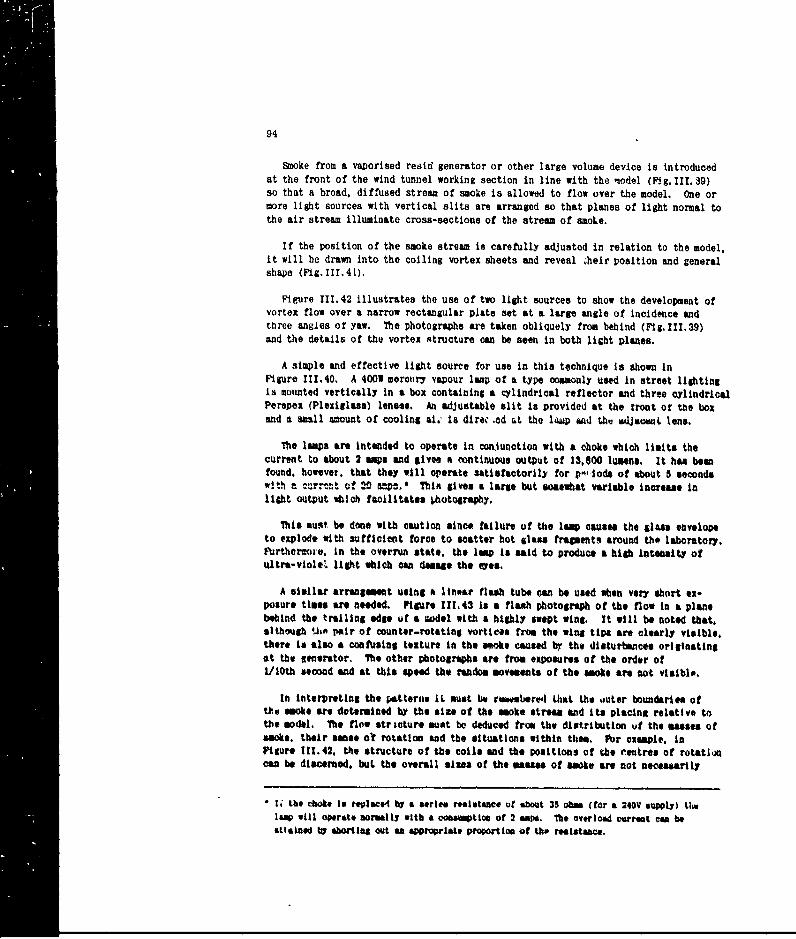
94
Snoke from a vaporised resid generator or other large volume device is introducedat the front of the wind tunnel working section in line with the Model (Fig. III.39)so that a broad, diffused stream of smoke is allowed to flow over the model. One ormore light sources with vertical slits are arranged so that planes of light normal tothe air stream illuminate cross-sections of the stream of smoke.
If the position of the smoke stream is carefully adjusted in relation to the model,it will be drawn into the coiling vortex sheets and reveal heir position and generalshape (Pig.III.41).
Figure 111. 42 illustrates the use of two light sources to show the development ofvortex flow over a narrow rectangular plate set at a large angle of incidence andthree angles of yaw. he photographs are taken obliquely from behind (Pig.111.39)and the details of the vortex structure can be seen in both light planes.
A simple and effective light source for use in this technique is shown InFigure 111.40. A 400W merctiry vapour lump of a type commonly used in street lightingis mounted vertically in a box containing a cylindrical reflector and three cylindricalPerspex (Plexiglass) lenses. An adjustable alit is provided at the front or the boxand a small amount of cooling ai. is direc ad at the lap &ad the wdjacwet lens.
The lamps are intended to operate in conjunction with a choke which limits thecurrent to about 2 upa and gives itDontinuous output of 13,600 lumens. It has beenfound, however, that they will opsrate satisfactorily for pVloda of about B secondswith a current of 20 amp.* Ibis gives a large but oamewhat variable increase inlight output thich facilitate Whotography.
This must be done with caution since failure of the lam cuases the gilas envelopeto explode with sufficient force to scatter hot glass frament around the laboratory.Furthermore. in the overrun state. the Imp is aid to produce a high intensity ofultra-vole'. light whico damage the eyes.
A sisilar arrangament using a linear flesh tube cam be used when very short ex-posure times are needed. Pigurt 111.43 is a flash photogrsph of the flow in a planebehind the trailing edge of a 6odtl with a highly swept win$. It will be noted that,although Uin pair of counter-rotating vortices from the wing tips are clearly visible.there is also a confusing teature in the awoke caused by the disturbances originatingat the Xenerator. The other photographs are from exposures of the order of1/10th second and at this speed the random movements of the smoke are not visible.
In interpreting the petterits IL must be rtavabere1 that the outer boundaries ofthe smoke are determined by the aims of the smoke stream and its placing relative tothe modal. The flow stricture must bo deduced trom the distribution uf the mses ofsmoke, their sense o rotation and the situations within the. Ibr example, inPigure 11.42. the structure of the coils and the positions of te neetres of rotationcan be discerned, but the overall alias of the egast of smoke are not necessarily
* 1; the choke is replace4 by a series resistance of ubout 3S ohm (for a 240V supply) tlilamp will operate normally with a Watotioo of 2 amp. "e overload corret cam beattained by Worti out Am appropriate PtOportift of th resisatne.
95
significant. Ibis difficulty is resolved by obterving the patterns during the tebt
or by making cine records. As pointed out in Section III.. 1, the coiled structureof the smoke indicates the surfaces formed by the coiling particle paths rather than
the stream surfaces.
Figures 111.44 and 111.45 give examples of the use of the technique in studyingthe flow over a slender wing. The development of the vortex system is traced froma plane near the apex of the wing to one several chords downstream.
96
LIST OF REFERENCES IN PART III
III. I. Hazen, D.C. Operating Characteristics of the Princeton University
Finley. H.1. 14 x 2 in. Swoke Tunnel. Princeton University,Dept. of Aero. Digineering Report No.225.
Ill. 2. Hazen, D.C. Smoke Flow Studies Conducted at Princeton University.Lohnert, R. F. Princeton University. Dept. of Aero. Engineering
Report No. 290.
I1. 3. Hazen, D.C. Operating Characteristics of the Princeton UniversityLehnert. R.F. 2 x 36 in. S oke Tunnel. Princeton University.
Dept. of Aero. Engineering Report No. 299.
III. 4. Pmkhurst, R.C. Wind Tunnel Technique: An Account of Experiaentul
Holder. D.W, Methods in Low and ligh Speed Wind Tunels.London, Pitman, 1952.
III. S. O'Neill, P.,O0. A Generator Constructed in Metal for Proiin %alIlkiantities of Paraffin Soke. [.6. . R. N.P.L./Awro/340,
1957.
U1. 6. Bergh, I. On the Visualization of Loainar Boundary toyer
Bergh, B. van den Oscillations and the rmsition to Turbulent Flow.Z. Ansew. Path. Phys. 9b(1958) 5/6 (Marob a5t),pp. 97- 104.
Ill. 7. Davldson. I.1. An Improved Method of Flow Vieuoliation by Jflctedet aiti Liitt. ftpubliabed M.O.A. Report AM 12371.
lit. 8. Maitby. .L. Sot Maosureetents of LeaIng Edge Vortex Positions onet *lit a Delta l*ag Wecilat iS in I1ea. UnpublIshod IL0.A.
keport.
lt!. 9. ail. M.O. A Theory for the Core of a Leading fde Vortex.tUapubliahd M.O. A. Roport ARC. 260.
II1. 10. MlLtby, R. L. Low Speed Flow Studies of the Vortex Pat tam# AboveNeodem. 0.l. Inclined Slender odie. Using a New Smoko TecMt.que.
AlC. 10541. 1950. th9ublished M.O.A. Report.
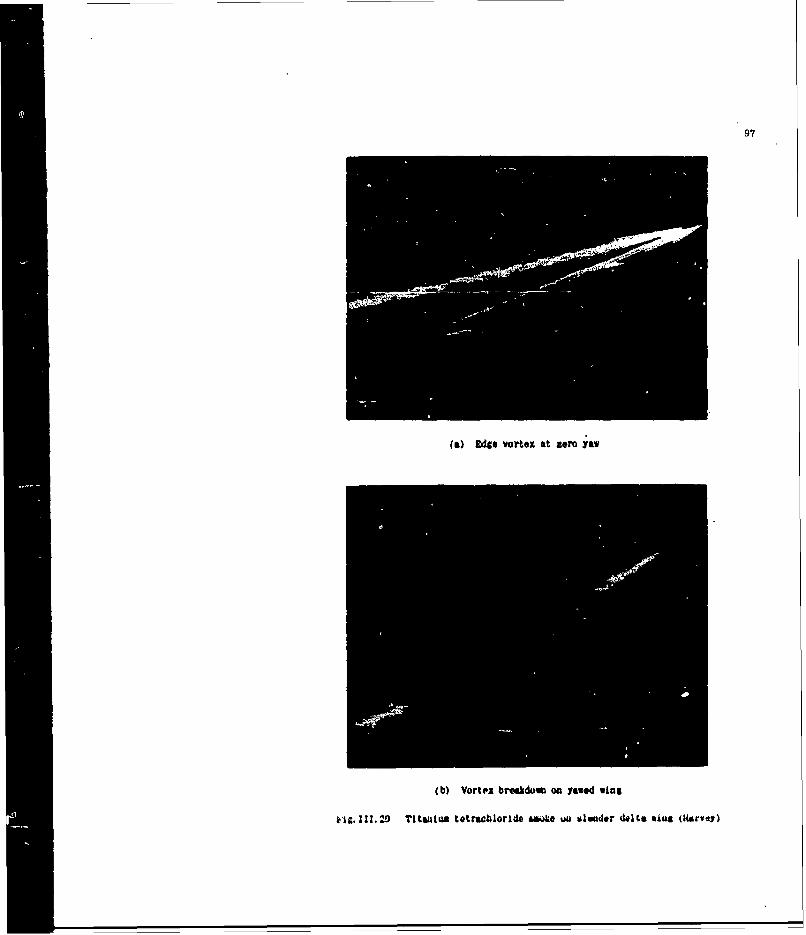
97
(a) Eda. vortex at zero yaw~
(b) Vortex brakdouw on need wing
Il.2 itanium tatrilorlde a~k uu *louder doltsa win* (liarvty)
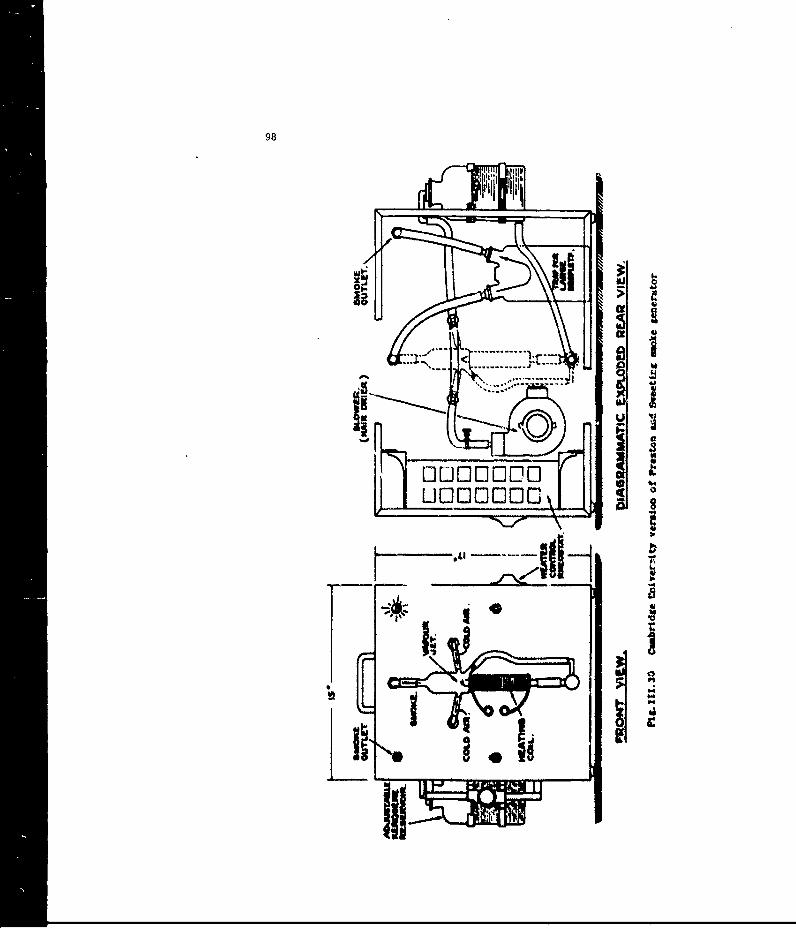
98
0 >
I *1
_ _ _ _ _ _ _ _ _ __" .:4':- .. . ..U000(o
0
uoooI,Zl
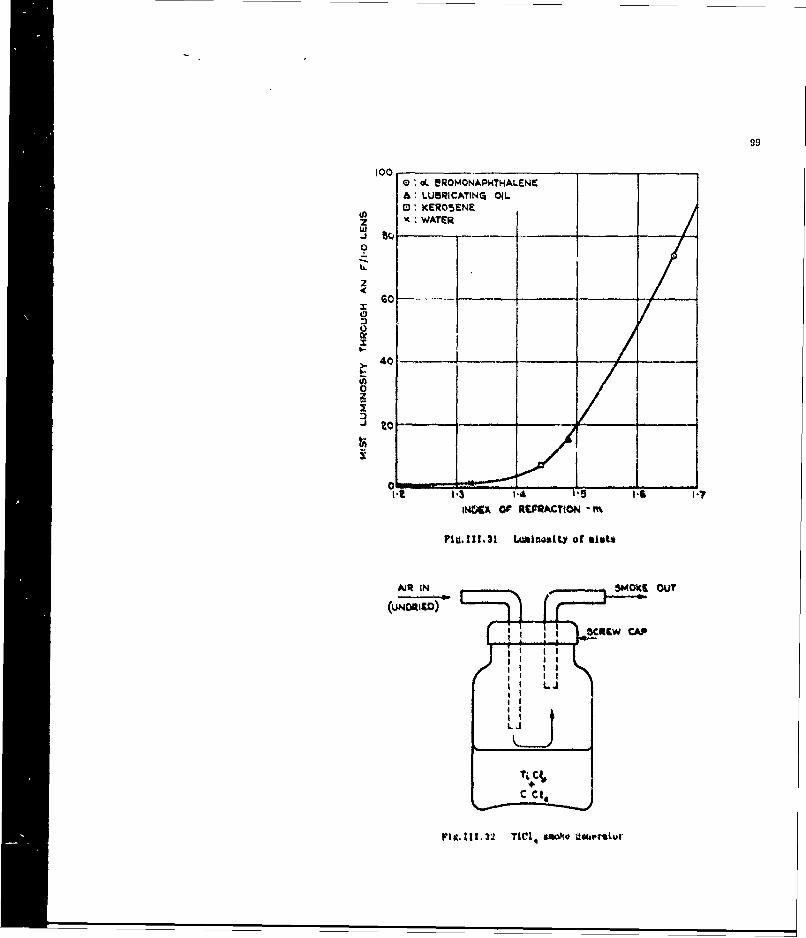
99
0 1. CLLROMONAPH4THALENIC
A: LUISRICATtNrq OIL~WATER
L
zGO
0
V)0z
It 13 1-4 '.5 1.
woex OP' REFRACtION
pit.XU.31 LI~iliy of *lst#
(UNORItO)
LJ
Ti Cj
Vit.1.3 T~, o~ :armu
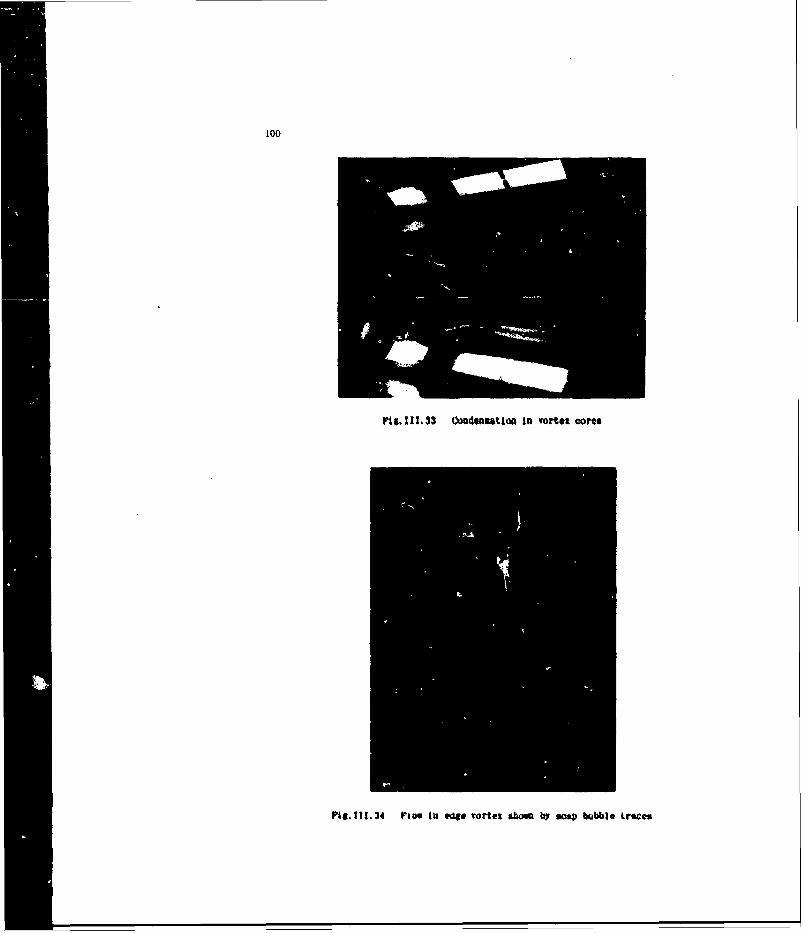
100
P4g,111,33 ~Odeasation In vortu: cores
Pit. tit.34 Paoe in oft* vortex sbom by sooW bubble traces
101
U
aS
4t4
S
9?,4
I''a
A
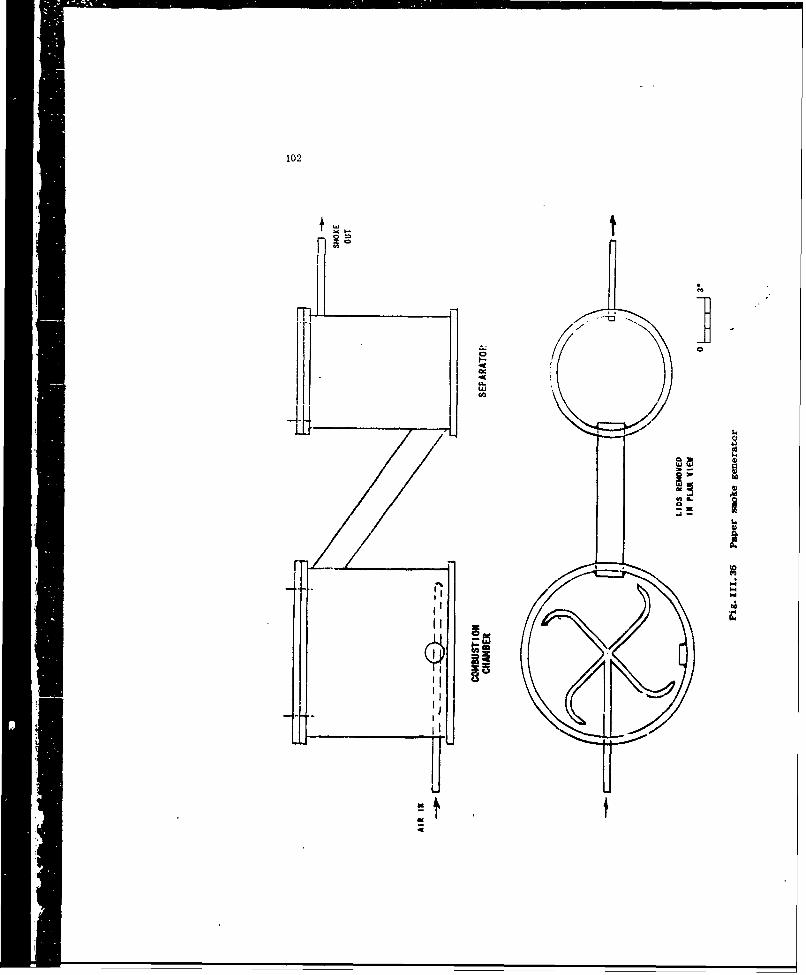
102
I
C',IL~1~" 0
w
-144 2..0
i.4-
Is-IFl I-I
I 4II
II
-- JIt.
t
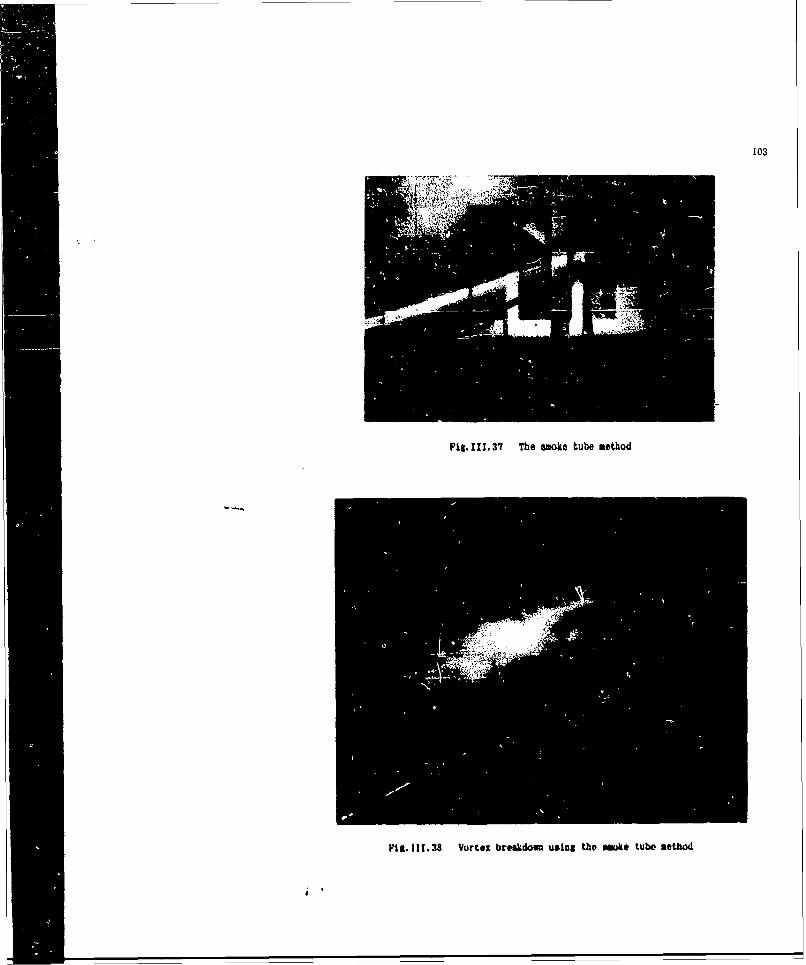
103
Fig. 11. 37 The emoke tube method
Pig. ZI?.38 Vortex breakdown using the mok*# tube sethod
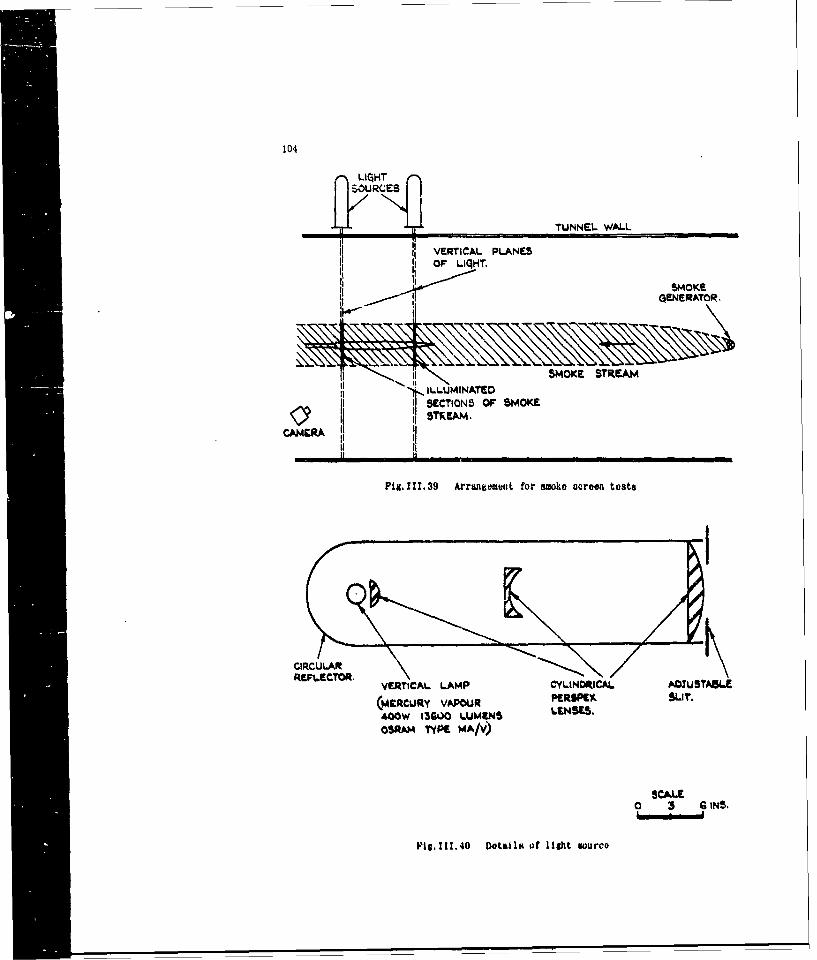
104
LIOHT
R " TTUNNEL WALL
VERTICAL PLANESOF LIqHT.
SMOKE
SMOKE STREAMSILLUMINATED
ii SECTIONS OF SMOKE
CAMC tlII , , . .
PFi. II1.39 Arraneueuat for amko screen tosts
CIRCUILARREFLECTOR.
VERTICAL LAMP CYLINCRICAL. DUTB.
(MERCURY VAPOUR PERIME~ SLIT.400W 13600) LUMIENS LISS
OSRAM TYPE MA/V)
SCALE0 3 ,GINS.
Pil.111.40 Details of light source
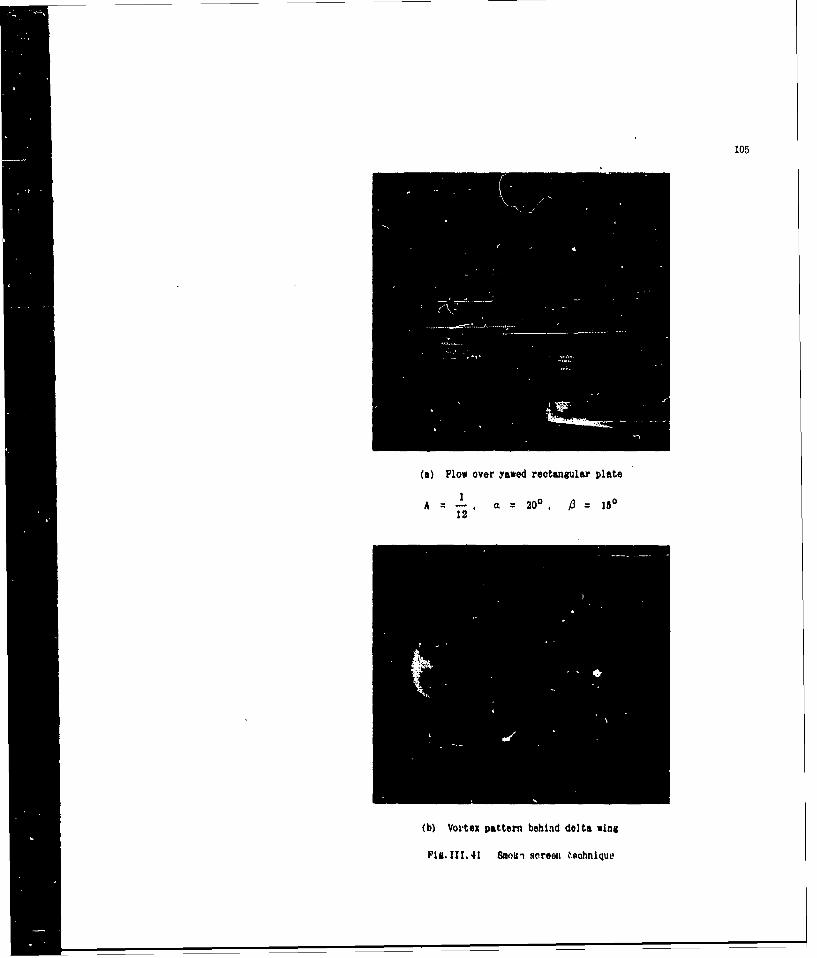
105
(a) Flow over yawed rectangular plate
1A - a 200, 3 = 15012
(b) Vortex pattern behind delta wing
Pig.III.41 Samok moreen .oechnique
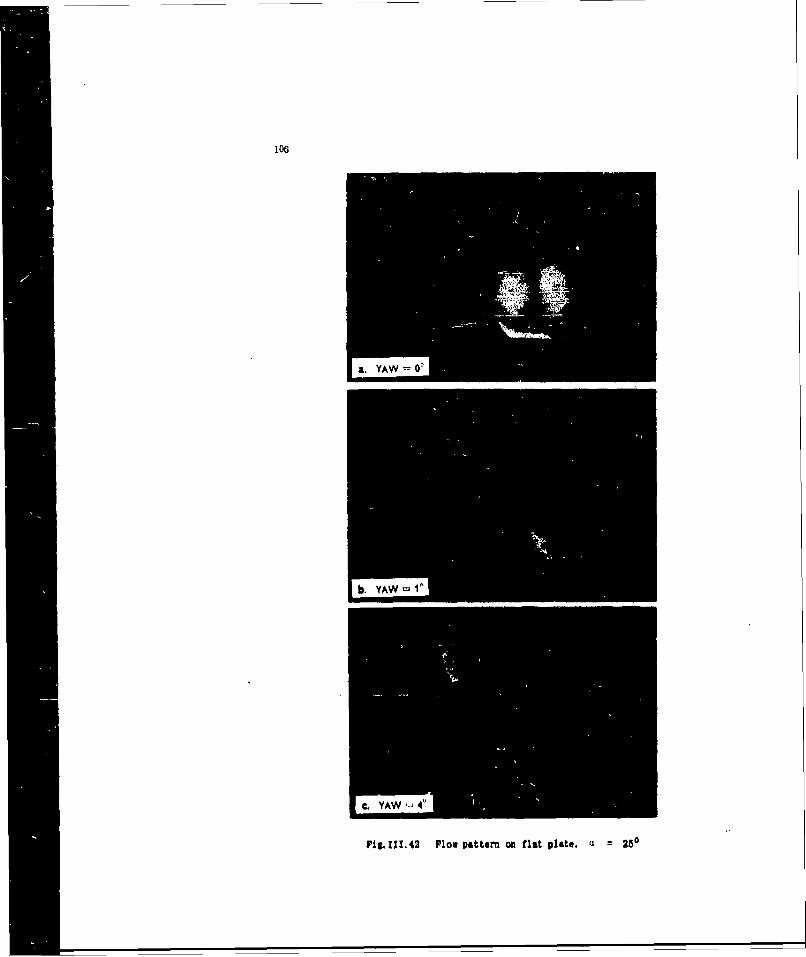
106
Pis. 111. 42 Flow pattern on flat plate. U 250
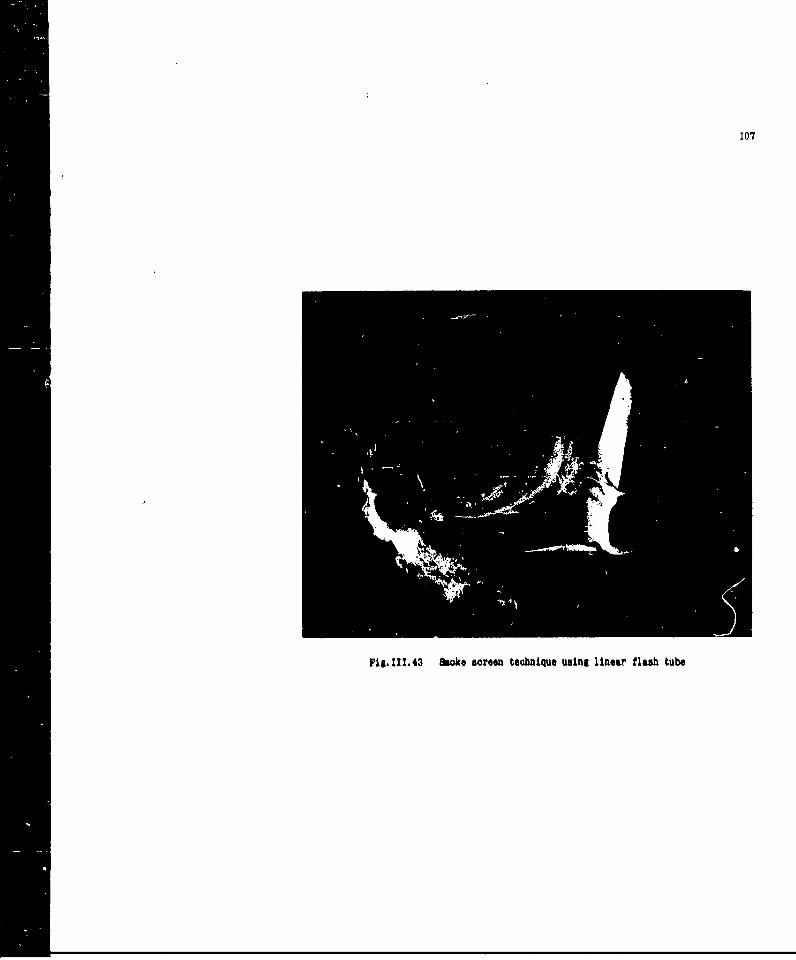
107
Pig. 11L43 ake creen technique using linear flash tube
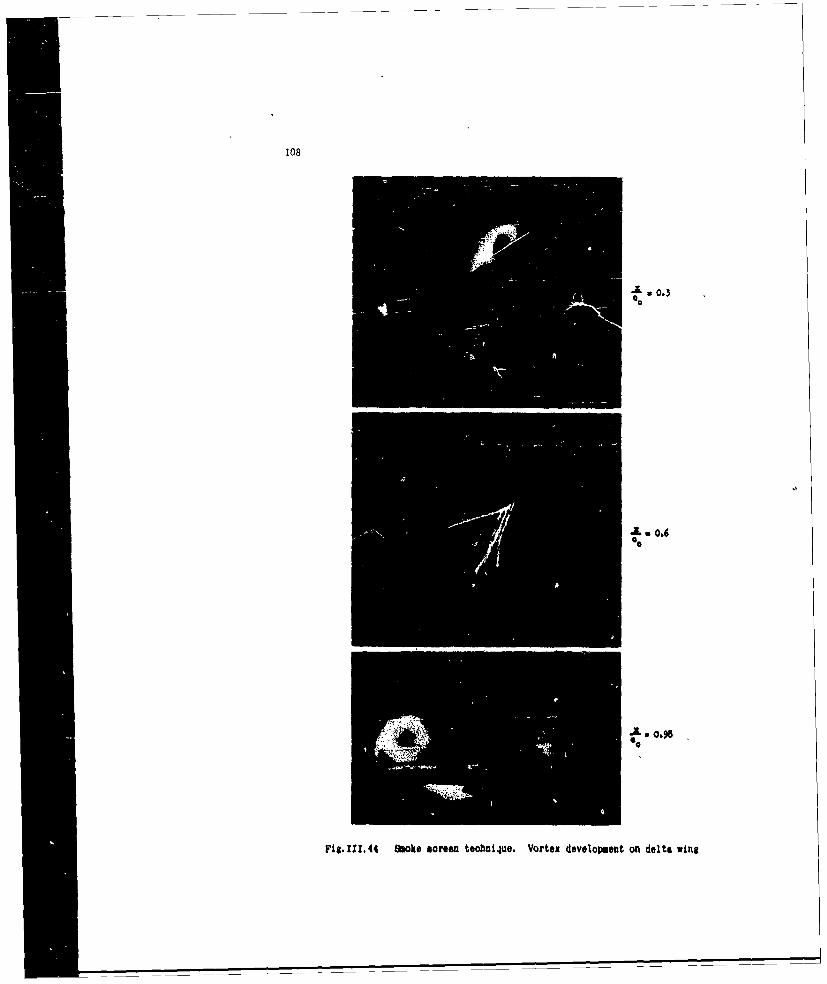
108
a0 0.3
0.6
JL 0.
Fig. III.44 Smoke soreen teobni4ue. Vortex development on delta wing
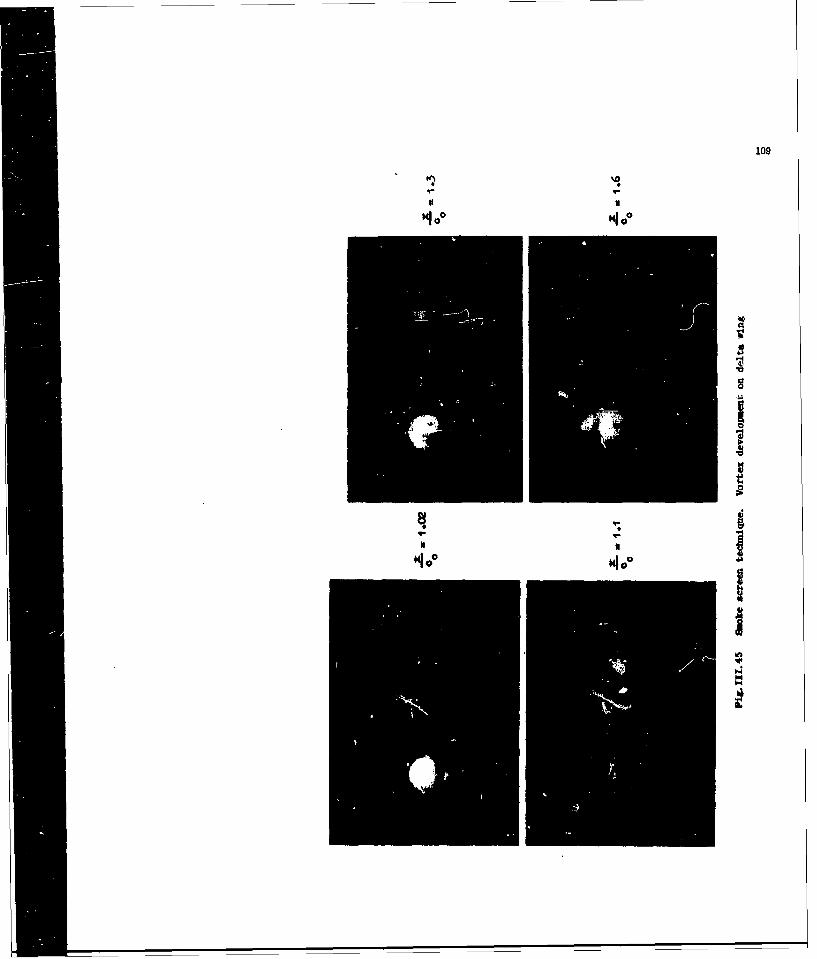
109
9- 9-
N U
41o0 141.0
0
1I
0
8 '- I;*
9. 9. 1* U
14j0 ~4~o
AI4.
PART IV
DEVELOPMENT OP THE VAPOUR SCREEN METHOD
OF FLOW VISUALIZATION IN
A 3 PT x 3 FT SUPERSONIC TUNNEL
112
CONTENTS
Page
LIST OF FIGUREE 113
IV.1 INTRODUCTION 115
IV.2 EXPERIMENTAL EQUIPMENT 115IV.2.1 The Wind Tunnel 115IV.2.2 Optical System 116
IV.2.3 Photographic Equipment 116
IV,3 EXPERIMENTAL TECHNIQUE 117IV.3.1 Humidity Control 117IV.3.2 Temperature Control - Effect of
the Aftercooler 117IV.3.3 Photographic Details - Determination
of the 'Optimum Fog Density' 118
IV.4 EXPERIMENTAL RESULTS AND DISCUSSION itsIV.4.1 Scope of Tests iisIV.4.2 Presentation of Humidity Results 119
IV.4.3 quantity of Water Required to Producea satisfactory Vapour Screen 1t9
IV.4.4 Physical Appearance and uharacteristics
of the Vapour Screen 12tIV.4.5 The Mechanism of Condensation 124IV.4.6 Effect of Humidity on Working Section
Static Pressure and Mach Number 125
IV.5 SOME TYPICAL VAPOUR SCREEN PHOTOORAPHS 126IV.3.1 Flow Behind a Cambered Wing at Two
Different Mach Numbers 126IV.5.2 Flow Over the Upper Surface of a Plane
Wing at M ; 1.75 18IV.5.3 Comparison of Surface Oil-Plow and Vapour
Screen Techniques on Two Wings at M 1.1 I8
IV.5,4 An Interesting Phenomenon at M = 1.32 129
IV.6 THE FORMATION Of THE VAPOUR SCREEN PICTURE 130
IV.7 THE VAPOUR SCREEN AT SUBSONIC SPEEDS 132
IV.8 USE OF LIQUIDS OTHER THAN WATER FORVAPOUR SCREEN PRODUCTION 133
IV.9 CONCLUSIONS 13s
APPENDIX IV.I 137
APPENDIX IV.Z 141
REFERENCES 143
FIGURES 145
113
LIST OF PIGU7ES
Page
Fig. IV. 46 Illumination system for vapour screen experiments 145
Fig.IV.47 Total temperature probe 146
Fig.IV.48 Variation of total temperature across the working sectionbefore and after overhaul of the aftercooler 146
Fig.IV.49 Relation between quantity of water added to the tunneland the frostpoint 147
Fig. IV. 50 Effect of Mach number on quantity of water required toproduce a satisfactory vapour screen.Total pressure =12 in.lHg, total temperature =450C 148
Fig.IV.51 Density of saturated water vapour as a function oftemperature 149
Fig. iV, 5 Effect of total pressure on the quantity of wate~rrequired to p. oduce, a satisfactory vapour screen ata Mach number of 1.41 ISO
Pig. IV.53 Effect of humidity on working nection static pressureat nominal Mach ntunbtrs of 1.51 And 1111 131
Fig, IV. 54 Effect of humidity on sictual Mach numbor and staticpressure in the workintg section at nominal Mach numbersof 2.00 and 1.51 152
Fig. IV. 55 Schlieren photographs of Mach waves used to determinethe actual Mach number in the working section 153
Pig. V. 58 Vapour ocreen photographs of the flow behind acambered delta wing at M ::1.51 154
Pig. IV. 57 Vapour acreon photographe of the flow behind a cambereddelta wing amt M =1.88 (Mdry :2.00) 15
Pig. IV. 58 Vapour screen photographs of the flow over the uppersurface of a plane wing at M 1.75 (Mdr 1.81) 156
rig.IV.69 Coiparisom of surface oil-flow and vapour screen results~on a plane wing at U: 1. 51, ,, -, 80 157
Ptg.IV.GO Comparison of aurface oil-flow and vapour sceen resultsen a cambered wing at M N 1.51. 80 158
114
PagA
Fig IV.61 Vapour screen photographs taken at M = 1.32showing the 'blue line' phenomenon 159
Fig.IV.52 Vapour screen photographs of the flow behind a deltawing at M = 0.85, a = 40 160
Fig. IV.63 Vapour screen photographs of the flow behind a deltawing at M :: 0.85. a.= 80 161
FIg.IV.64 Saturated vapour density of some organic liquidssuitable for vapour screen experiments 162
Pig. XV.65 Vapour screen photographs of the flow Just behind adelta wing. using carbon tetrachloride vapour. M = 1.96 163
Pig. IV.66 Vapour screen photographs of the flow Just behind adelta wing, using water vapour. M = 1.88 (Ndry = 2.00) 164
PART TV. DEVELOPMENT OF THE VAPOUR SCREEN METHODOF FLOW VISUALIZATION IN
A 3 FT x 3 FT SUPERSONIC TUNNEL
I. McGregor
TV. I INTRODUCTION
Use has occasivnally been made of the so-called 'vapour screen' method of flowvisualization in supersonic win tunnels (Refs.IV. 1 to IV. 5 for example). Theprinciple of the method is very simple. The tunnel is run with mist air, and as theair expands through the supersonic nozzle into the working section it cools. and themoisture condenses out to form a fog. This Is then illuminated by a narrow bea" oflight perpendicular to the axis of the tunnel. Anty disturbance in the cross-flowplane, such .s that caused by a model at incidence, disturbs the uniform 4istributionof fog particles in the plane of the vapour screen, and hence the amount of lightscattered by the fog. In particular, wakes and vortices from wings and bodies appearas (lark 'holes' in the screen. However, very little informatior a hitherto beenavailable concerning such aspects of technique as the humidity required to produce asatisfactory screen at different Mach numbers and how this is influonced tor Suchfactors as tunnel pr..saure and temperature, or of the offects of the coadenlsin vapouron the flow in the working section.
This paper doeribes an investigat ion made in the 3 ft x 3 ft supersonic tunnel atthe Royal Aircraft Establishment, Bedford. to oaino thq suitability of the methodfor providing information concerning the structure of separated flow areas near windtunnel models. The investigation Included the developoent of a technique which pro-vided an Improved resolution of detaIl over a rsage of Mach numbers.
IV.2 RQURIEI.I~IPOR&NT
IV.2. 1 The Vied TWAei
The I ft * 3 ft tumol Is described In foreoe lYG,. but a brief dcocription tsgiven here since certain aspects of Its design are Important in connecton with thovapour screen technique. The tunnel Is conetinuous runninig. with a Working section3 ft *quare. tnd supersonic Mach numbers between 1.3 and 2.Q are generated by a serieof intaribsangeable blocks that form a sini-sidesi nottle upstream of the Workingsection. The tunooi to driven by two centrifugal cortssors In aerie*. lb. totalpro*s'rr" t-i I varied h ,tveen 3 In. and CO in. or Ili by smeo of a compressor-evtcv'ator !(,. finl'o)a arreseomnts consist of (a) an Antercooler between the tocompressor states, and (b) Out attelcODOle. With a rather treater capacity thatt tMeIntercooler. situated In the salim section or the tunl Imediately before f , con-traction. The floe of water through the Intorcoolot Is continuously variable, butonly coarse control of' the atrreoler Is possible. D.ying of the air In the tunnelis effectedl by hy-passing a fraction of the air through driers charged with mille-gelwhich are connected actufss the second stage of the coompresor. The quantity tif airpassiiog throuxh tho driers is controlled tv a motorised flap valve, and with the driersin reen.,ahlw coni "niibne a humidity -~rrcspoad1in to rost-point of about -40 0C
116
Is obtained after 10 to 15 minutes running. The total volume of the tunnel ist approximately 45.000 ft3. and this humidity represents about 0.3 lb of water vapour
remaining in the tunnel ctircuit.
IV.2.2 optical system
It was considered that to produce a good vapour screen picture the illuminRstionsystem should provide a beam of light that was (a) as intenue. as possible. (b) narrow,with little variation in width across the working section. and (c) sharp-edged, witha minimum of stray light entering the tunnel.
The light sourcre selected was a 1000 watt high prezsure mercury vapour lamp with anetective length of 7.5 in. and an external diamteter of approximately 0.5 in. 1Teproblem was to produce a beam of lighit that would satisfy *h above requiremeints.The simplest arrangement - at slit with the lamp behind it -was rejected on thegrounds that to produce a suitable beam would have entailed placing the lamp it least2 ft behind the slit. and this would cause an excessive loss of Illumination. Adatate using cyllndrli-al lonses was text examined, but it was considered that theIntensity oi tlluminatiuo would ;let be materially butter than that givat by a simpleslit when the heam was stifartory in other rospeetts.
The arrangemnt finally adopted wade use of one of the mirror* from the tunneldSehlilren systoet. and proved to be very effeetive. Yt f 1 shown In Fig u re IV. 46. The32 lit. diameter cotn-ave mirror with a focal length of 4 netrems was used to produce antlimrgi of the light wo In the contra of the ftirkingx soction. To redue the widthOMd lateral spread of the W".n a IU 0. 1 in. wide was plamed just in fronit of thetamp andi thr. sides of the airror awaked. leaving an effective area of mirror 32 Wn t10 In. TIS a .lz en praluced a shar-edged beam of light approximately 0.1 iS n.wide t# q) In, high In the 'etrr of the wnrlting setiton. NOtt the height wtd -vicLh ofthe tia" Increased slightly a*AY from the cetr* line. but ,vsa at the windos thuwidth of the hem wat only ahopt 0.5 In. No measureMnt of the beam Intensity inabsolute terms ws attomptc4, but a sltple comparative test with a rhotographicexposurv meter Indicated thftt at the centre of Mhe tunitel the intensity of Illuminationwas comparable with that of direct sunlight.
It was not feasible to Now# the mirror bo(O~ardit and forwards to tradi the be"n oflItot al-og the workins seetlon. this wait acctvaplIMMe by rotatinit the mirrorabout Its vertical iait. As a rvniult. the bee. *r perpenciinlse to the centro lineof the tonnet in only one position, but the mxim deviation of thew beam from the
rt'e4dcfula? did aWl eaceed 20.
The vxasist voy li-u phologratih the vs;%uur screeni lis cbvirtuily fro the side ofthe tunnel. Howver. whilst this lis mdcqiaatv for miac rurnosts, the screen lAninovitably viewed at an applro'clablo angle.. anrl It is difficult to locate the positionoaf any vortices that *Ay be piro-snt rolaivs' to th. mol. It Iis also unsitahleit the flow over the sturface of a wing lis being studied. Pnr fhrn ramsons it wasdecrided to pliotograp the screen from dir"Mty dowustreaa (Riefs. IV. 4 ad IM..A reotely controlled camera was useod, mounted at lCle root of the aeodoi stingt&'k#Dott. The coxera. stici a; driven by rloawrk, tAy. 49eat ivea srn4rutim~ei
117
I in. square on standard 35 mm film. The shutter was operatedyby a solenoid mountedalongside the camera, but it was not possible to alter the focus from outside the
tunnel.
The wing of a model remnte from the light snurne is in a shadow cast by the sting
or body, so that in general it is necessary for the field of view of the camera cocontain only the body and the wing panel nearer the light source. The camera was
therefore fitted with a telephoto lens of 7.5 cm focal length, which gave a field ofview approximately 10 in. square at a position corresponding to the trailing edge of
a typical 3 ft tunnel model, and the camera was mounted at a small angle to the centre
line of the sting to enable the wing tip of the largest model to be included in the
picture.
The camera and its operating solenoid were housed in a cowl constructed from brass
sheet, with a plate glass window 0.25 in. thick to protect the lens. However, thiscowling caused considerable blockage and it proved impossible to start the tunnel atM = 1.3, hut. no trouble was experienced at higher Mach numbers.
IV.3 EXPERIMENTAL TFCHNIQUE
* .3. 1 Humidity Control
In Reference IV.3, condensation in the working section was brought about by running
the tunnel with atmospheric air without any drying. The quantity of water containedin such air can vary very considerably from day to day, and it is necessary to be ableto exercise careful control of the humidity if optimum results are to be obtained.
The procedure evolved for the present tests consisted of running the tunnel at thedesired total pressure with the driers in circuit for a period of about 15 minutes.The driers ere then switched out, vnd a measured quantity of water injected into thetunnel. In all the work so far undertaken the tunnel has been run at a total pressurebelow atmospheric, and the water was simply sucked in through pressure tappings in the
tunnel wall. In early experiments, water was admitted to the maximum section of thetunnel just before the contraction, but this proved unsatisfactory, as, I i air havinga low, velocity there, water tended to collect on the floor of the tunnel and evaporateonly slowly. For all subsequent tests water was admitted into the diffuser, where
vaporisation was almost instantaneous.
IV.3.2 Temperature Control - Effect of the Aftercooler
For the first few tests the tunnel was run in the normal manner with both theintercooler and aftercooler in operation. However, it was found that the fog produced
in the working section was extremely patchy and irregular, some parts being practicallydevoid of any condensation, while in others there were streamers of thick fog. Thissuggested that the temperature distribution across the working section was tunevegi, so
a total temperature probe was constructed to measure the distribution. The probe,which is shown in Figure IV.47, consisted cf a tube mounted across the centre of theworking sention with a number of thermocouples arranged along its leading edge. 7he
result of a typical survey is given in Figure IV.48, which shows a temperaturedifference of some 200C between the 'hotspot' near the centre of the tunnel and the
colder air at the sides. Overhaul of tha attercuoler effeuLed some impruvement in
118
the temperature distribution, but oaly a slignt impruvement in the distribution of fog
resulted, and it was considered to be still far too uneven to be acceptable.
The effect of switching off the aftercooler was then examined. This meant that,
apart from heat losses from the tunnel shell, the intercooler alone was responsiblefor cooling, which limited the power input if overheating %rs to be LVoided. As aresult the tunnel could only he run at 30 to 50% of the maximum total pressure. Theoverheating problem was most serious at the top end of the Mach number range, when
the mass flow of air around the tunnel circuit was low, but the pressure ratio acrossthe compressors high. However, it was found that this arrangement gave a perfectly
uniform fog in the working section, although it was first necessary to wait until thetunnel total temperature attained a reasonably steady value. For the first run ofthe day this warming-up period was of the order of an hour, but for subsequent runs10 to 15 minutes sufficed. The only disadvantage was that, as the intercooler wasalways operating at or very near maximum capacity, it was not possible to investigate
the effect of total temperature on fog formation.
IV. 3.3 Photographic Details - Determination of the 'tiim Fog Density'
Prom the photographic point of visw. the optimum tog density is a ccVroiubetween two conflicting requirements. If the fog is too thin, a long exposure time
is tieeded and there is a risk of light reflection from the model and the walls of thetunnel obscuring the low-contrast vapour screen picture. On the other hand, if the
fog is too thick, there is excessive scattering of light by the fog between the planeof the vapour screen and the camera lens which results in a very 'grainy' picturewith blurred detail.
A series of testa was therefore carried ouL with fogs of different densities.photographing the vapour screen picture produced by a model at incidence over a rangoof exposure times from 5 to 80 sees. The camera was set an aperture of f/4 and FP 3film used. Beat results were obtained with what appeared to be a quite thin fog asviewed from the side of the tuonel. The corresponding exposure time was 20 seem.
Light reflection from the model wa reduced by painting it with caera black andstray light entering the working section was kept to a minimum by masking the sidewindows, leaving only a slit wide enough for the main light beam to enter.
The combination of long focal length lens (7,5 es) and wide aperture aetting (f/4)resulted in a depth of focus of only 10.8 in. at the range normally used (3 to 4 (t).however, it proved possible to take photographs with no detectable loss of clarity2 in. from the nominal focal point, so the screen oculd be photographed at axialpositions up to 4 in. apart without the ned for refocusing.
IV,4 EXPERINtUNTAL RESULTS AND OISCUSSION
IV.4.1 Scope of Te0s
Tests were made to determine the quatity or "ter reoquired to produrs. * [lto-Iraphically suitable vapour streen at Mach numtrs between 1.3 and 2.0. The effectst I humidity on the flow in the working section were also investigated wnd meavurea4. t
made of the static pressure ad Mae nualwv.
• 119
IV.4.2 Presentation of Humidity Results
The accepted practice is to present experimental results for tunnel humidity in anon-dimensional form, but in this case care is necessary if the results are not tv bemisleading. For example, although stagnation pressure was found to have some effect,the degree of condensation, and therefore of fog density, depends essentially on theamount of water present in the tunnel and not on the water/air ratio. It is thereforenot relevant to express the humidity in terms of lb of water/lb of air ( 'absolutehutnidity' ), as is normally done when condensation effects in wind tunnels are beingdiscussed and the amount of heat given up to the air by the vapour as it condenses isof prime importance. The stapnation relative humidity (the ratio of the actual vapourdensity to the density of sat.raed vapour at the same temperature) is independent ofstagnation pressure, but is a function of stagnation temperature, so this is alsounsuitable. A parameter which avoids these defects is the frost-point, which definesa unique relation between the quantity of water vapour and the volume of the tunnelwhich Is indepedentL or stagnutlon conditions. A curve showing the frost-point as a
function of the quantity uf water added to the nominally 'dry' tunnel is presentedin Figure IV.49. This was derived from data given on p.2304 of Reference IV.7, amean frost-point for the 'dry' tunnel of -410C having been assumed. A few experi-
mental measurements are included and these show quite good agreement with thetheoretical curve. However, the quantity of water-frost-point relationship islogarithmic in character and whilst very sensitive at low humidities, in the range ofinterest of these tests the sensitivity is only of the order of 20C change in frost-point per pint of water added. In view of this fact, and of the difficulty of makingreliable frost-point measurements, it was decided that the most straightforward wayto describe the humidity was directly in terms of quantity of water added to the'dry' tunnel, but scales showing the frost-point or absolute humidity (when theeffects of condensation on static pressure and Mach number are being considered) havebeen added to the figures where appropriate.
IV,4.3 Qmatity of Water Required to Produce a Satisfactory Vapour Screen
As described in Section IV.3.3, the optimum fog density was found by injectingmeasured quantities of water into the tunnel and photographing the resulting vapourscreen. Kxamination of the photographs then gave an optimum range of humidity.This detailed determination was only carried out at two Mach numbers, 1.51 and 1.81,and for other Mach numbers the range of humidity over which a satisfactory screen wasproduced was estimated visually. The results of these tests are presented inFigure IV. 50. The results for the various Mach number- were not obtained at exactlythe same total pressure and temperature, but are substantially correct for a valueof pt = 12 in. 11g and Tt r 450C , ('he effects of pressure and temperature arediscussed bclow.) It must be mentioned here that the Mach number quoted is thatdeveloped) by the nozzle with (dry air: above about M- 1.0 there is a markedhumidity effect on the flow and the actual Marh number when a vapour scr en ispresent is considerably less than with dry air.
Several points of interest arise from this curve. The limits of the humidityrange for a satisfactory vapour screen are a subjective matter not capahle of precisedetermlnpt4. hit *ven allowing for this. the range of humidity over which ,t sat i-factory screen is produced iN q..ite small: the humidity at which the fog dvilsitytonds to be too thick is only some 24 to 301 Rreater theji that where it tendt to hotoo thin. Secondly, there is the virv r'pld increase in humidity required a,. Mach
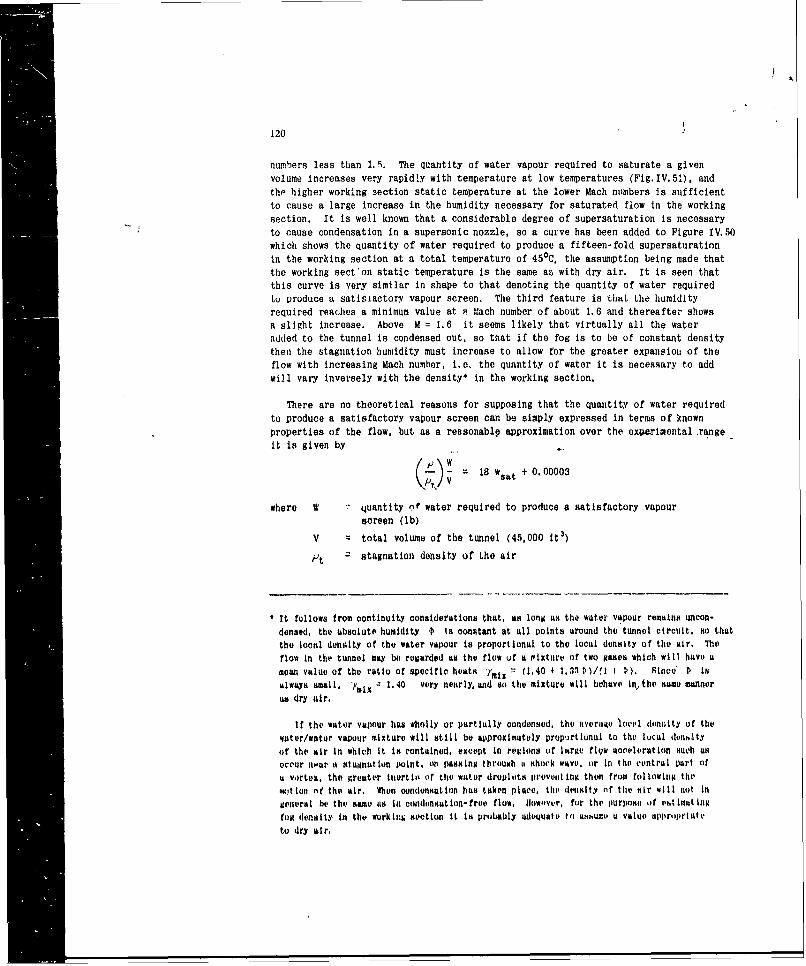
120
numbers less than 1.5. The quantity of water vapour required to saturate a given
volume increases very rapidly with temperature at low temperatures (Fig.IV.51), andth higher working section static temperature at the lower Mach numbers is sufficientto cause a large increase in the humidity necessary for saturated flow in the working
section. It is well known that a considerable degree of supersaturation is necessaryto cause condensation in a supersonic nozzle, so a curve has been added to Figure IV.50which shows the quantity of water required to produce a fifteen-fold supersaturationin the working section at a total temperature of 45 0 C, the assumption being made thatthe working sect'on static temperature is the same as with dry air. It is seen that
this curve is very similar in shape to that denoting the quantity of water requiredLu produce a satisiactory vapour screen. The third feature is that the humidityrequired reaches a minimum value at w Mach number of about 1.6 and thereafter showsa slight increase. Above M = 1.6 it seems likely that virtually all the wateradded to the tunnel is condensed out. so that if the fog is to be of constant densitythen the stagnation humidity must increase to aliow for the greater expansion of the
flow with increasing Mach number, i.e. the quantity of water it is necessary to addwill vary inversely with the density* in the working section.
There are no theoretical reasons for supposing that the quantity of water requiredto produce a satisfactory vapour screen can be simply expressed in terms of known
properties of the flow, but as a reesonablp approximation over the ex~orimental.range
it is given by
l 8 w But + 0.00003
where W quantity of water required to produce a satisfactory vapour
screen (lb)
V = total volume of the tunnel (45,000 t3 )
P t stagnation density of the air
It follows from continuity considerations that, as long as the water vapour remains uncon-
densed, the ubsolute humidity + ts constant at all points around the tunnel circult, so that
the local density of the water viour is proportional to the local density of the air. Theflow in the tunnel may be regarded as the flow uf a mixture of two gases which will have amean value of the ratio of specific heats Tmix 7 (1.40 4 1.33 t)/ 1 I S). since' P Inalways small, 'y,,, - 1.40 very nearly, and so the mixture will behave In,he sume mannerus dry air.
If the water vapour has wholly or partially condensed, the average loveil denuity of thewater/water vapour mixture will still be approximately propurtional to the local deneltyof the air In which it is contained, except In regions (if large flyw acceleration such asoccur n-ar a stusnat ion point, on passing through u shock wave, or In the central part ofa vortex, the greater Inertit or the water droplets preventing thm fros following the"tion mf the air, When ondensation has taken place, the dnonsity nf the sir 4ill not In
general be the sane its ti condonsatlon-free flow, lowover, for the purpose of estimat Itutfog density In the workiaLt section It It probably adequaute to a?.humt a value ap rprinteto dry air.
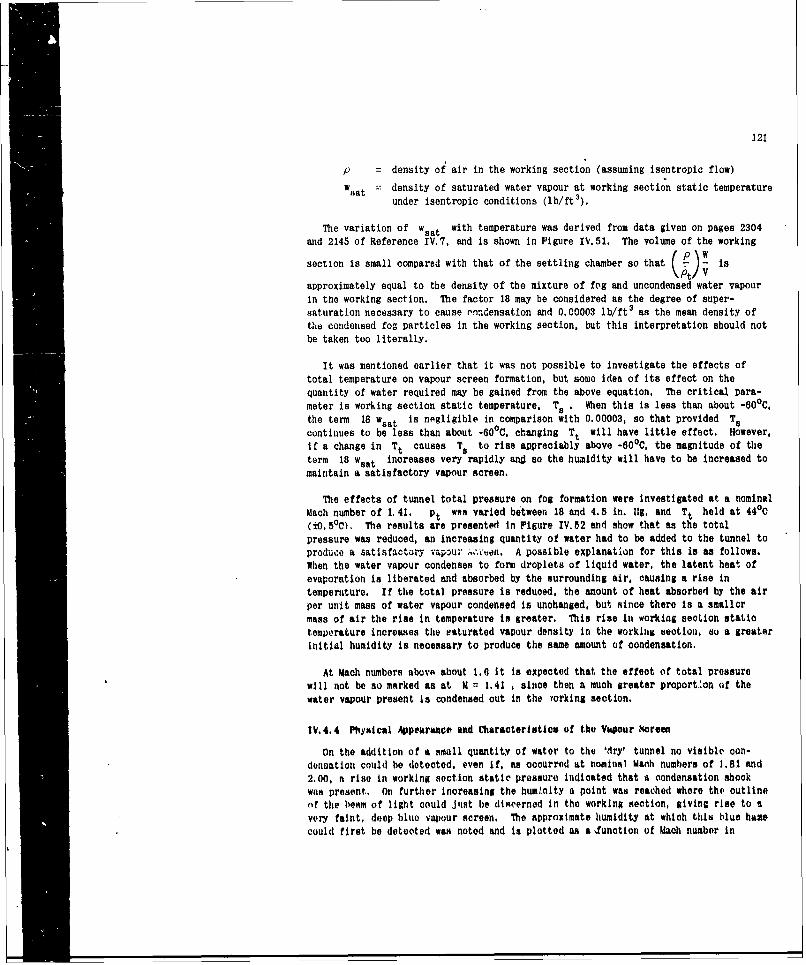
121
p = density of air in the working section (assuming isentropic flow)
Wsat density of saturated water vapour at working section static temperature
under isentropic conditions (lb/ft3).
The variation of wsat with temperature was derived from data given on pages 2304
and 2145 of Reference IV.7, and is shown in Figure IV.51. The volume of the working
section is small compared with that of the settling chamber so that (t!is
approximately equal to the density of the mixture of fcog and uncondensed water vapourin the working section. The factor 18 may be considered as the degree of super-saturation necessary to cause rnndensation and 0.00003 lb/ft
3 as the mean density of
the condensed fog particles in the working section, but this interpretation should not
be taken too literally.
It was mentioned earlier that it was not possible to investigate the effects oftotal temperature on vapour screen formation, but some idea of its effect on the
quantity of water required may be gained from the above equation. The critical para-meter is working section static temperature, T. . When this is less than about -600C,
the term 18 w8 at is nAgligible in comparison with 0.00003, so that provided T.
continues to be less than about -600 C. changing Tt will have little effect. However,
if a change in Tt causes T. to rise appreciably above -600C, the magnitude of theterm 18 west increases very rapidly ang so the humidity will have to be increased tomaintain a satisfactory vapour screen.
The effects of tunnel total pressure on fog formation were investigated at a nominalMach number of 1,41. pt wee varied between 18 and 4.5 in. 11g, and Tt held at 440C(±-.5 0 C). The results are presented in Figure IV.52 and show that as the total
pressure was reduced, an increasing quantity of water had to be added to the tunnel toproduce a satisfactory vapour ,ken. A possible explanation for this is as follows.When the water vapour condenses to form droplets of liquid water, the latent heat of
evaporation is liberated and absorbed by the surrounding air, causing a rise in
temperature. If the total pressure is reduced, the amount of heat absorbed by the air
per unit mass of water vapour condensed is unchanged, but since there is a smaller
mass of air the rise in temperature is greater. This rise in working seoLion static
temperature increases the saturated vapour density in the workin section., so a greater
initial humidity is necessary to produce the same amount of condensation.
At Mach numbers abovw about 1.6 it is expected that the effect of total pressurewill not be so marked as at M = 1,41 , since then a much greater proport'on of thewater vapour present is condensed out in the Yorking section.
IV.4.4 Phyaical Appearance and Charactertstica of the Vkpour Screen
On the addition of a small quantity of water to the 'dry' tunnel no visible con-densation could he detected, even if, as occurred at nominal Mach numbers of 1.81 and2.00, a rise in working section static pressure indicated that a condensation shook
was present. On further increasing the humnlty a point was reached where the outlineof the henm of light could Just be diseerned in the working section, giving rise to avery faint, deep blue vapour screen. The approximate humidity at which this blue hazecould first be detected was noted and is plotted as afunction of Mach number in
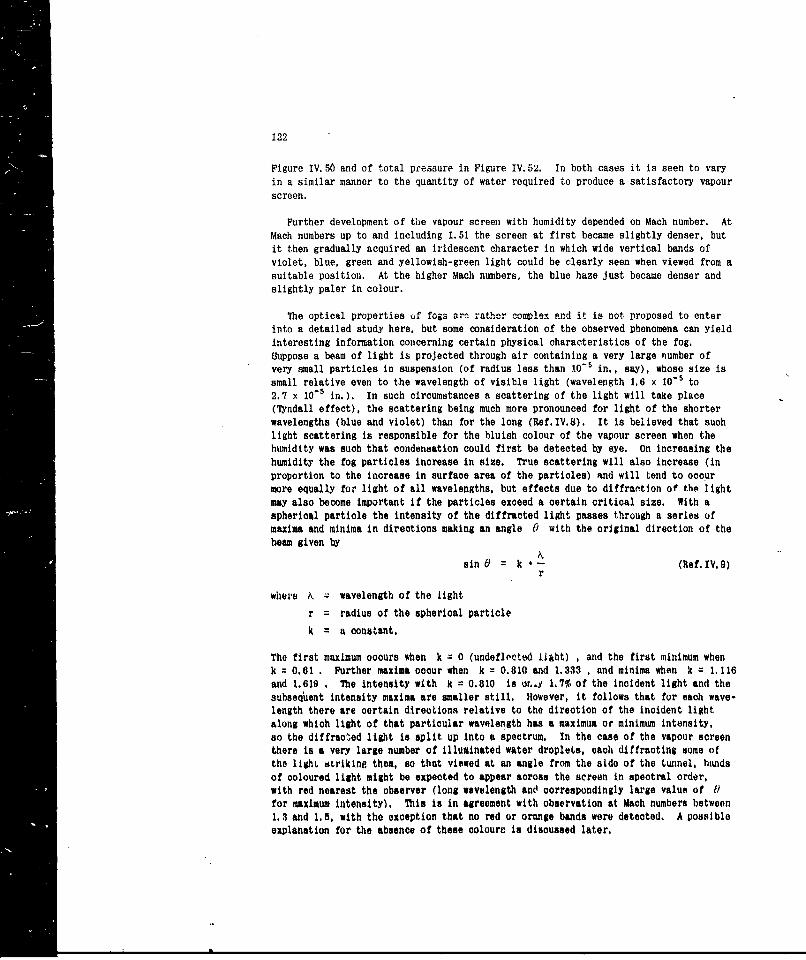
122
Figure IV. 50 and of total pressure in Figure IV. 52. In both cases it is seen to varyin a similar manner to the quantity of water required to produce a satisfactory vapourscreen.
Further development of the vapour screen with humidity depended on Mach number. AtMach numbers up to and including 1. 51 the screen at first became slightly denser, butit then gradually acquired an iridescent character in which wide vertical bands ofviolet, blue, green and yellowish-green light could be clearly seen when viewed from asuitable position. At the higher Mach numbers, the blue haze Just became denser andslightly paler in colour.
The optical properties i.f fogs airn rather complex and it is not proposed to enterinto a detailed study here. but some consideration of the observed phenomena can yieldinteresting information concerning certain physical characteristics of the fog.Suppose a beam of light is projected through air containing a very large number ofvery small particles in suspension (of radius less than 10-5 in., say), whose size issmall relative even to the wavelength of visible light (wavelength 1.6 x 10⁻⁵ to2.7 x 10's In.). In such circumstances a scattering of the light will take place(Tyndall effect), the scattering being much more pronounced for light of the shorterwavelengths (blue and violet) than for the long (Ref.IV.8). It is believed that suchlight scattering is responsible for the bluish colour of the vapour screen when thehumidity was such that condensation could first be detected by eye. On increasing thehumidity the fog particles increase in size. True scattering will also increase (inproportion to the increase in surface area of the particles) and will tend to occ 'urmore equally for light of all wavelengths, but effects due to diffrantion of the lightmay also become important if the particles exceed a certain critical size. With aspherical particle the intensity of the diffracted light passes through a series ofmaxima and minima in directions making an angle 0 with the original direction of thebeam given by
sinG kc (Ref.IV.9)r
where N wavelength of the light
r = radius of the spherical particle
k = a constant.
The first maximum occurs when k = 0 (undeflected 11aht) . and the first minimum whenk = 0.61 . Further maxima occur when k =0.810 and 1.333 . and minima when k = 1.116and 1.619 . The intensity with k = 0.810 is ot..j 1.7% of the incident light and thesubsequent intensity maxima are smaller still. However, it follows that for each wave-length there are certain direotions relative to the direction of the incident lightalong which light of that particular wavelength has a maximum or minimum intensity,so the diffrac.ad light is split up into a spectrum. In the case of the vapour screenthere is a very large number of illuminated water droplets, each diffracting some ofthe lighe striking them, so that viewed at an angle from the side of the tunnel, handsof coloured light might be expected to appear across the screen in spectral order,
with red nearest the observer (long wavelength anc correspondingly large value of 0for maximum intensity). This is in agreement with observation at Mach numbers between1.3 and 1.5, with the exception that no red or orange bands were detected. A possibleexplanation for the absence of these colours is discussed later.
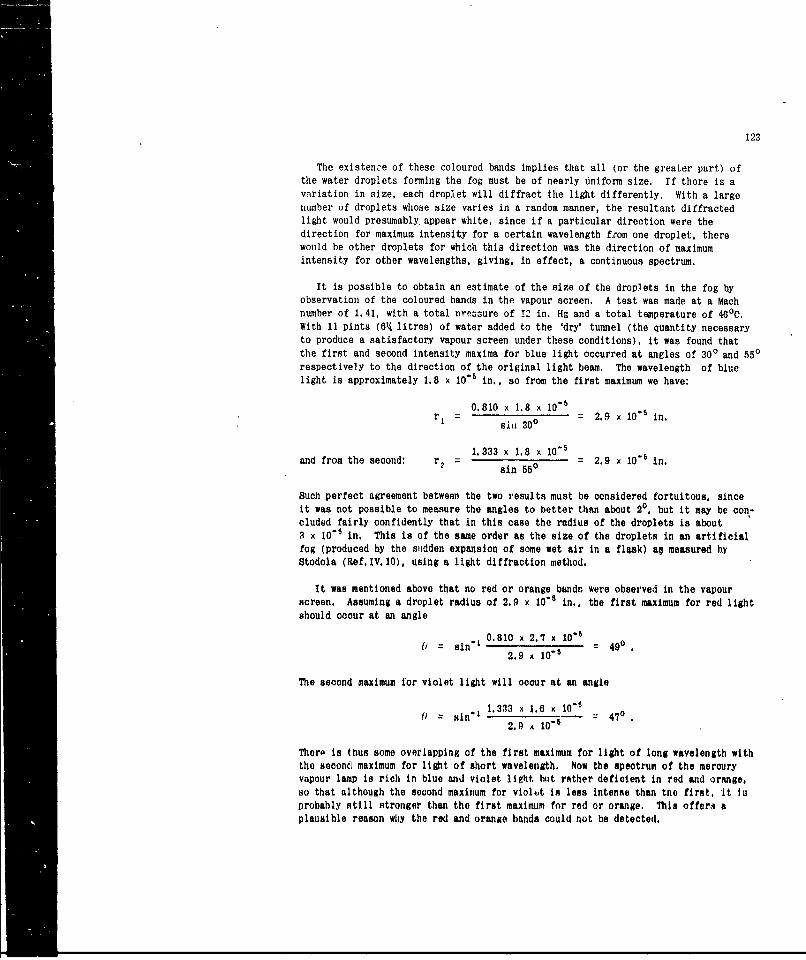
123
The existence of these coloured bands implies that all (or the greater part) ofthe water droplets forming the fog must be of nearly uniform size. If there is avariation in size, each droplet will diffract the light differently. With a largenumber of droplets whose size varies in a random manner, the resultant diffractedlight would presumably appear white, since if a particular direction were the
direction for maximum intensity for a certain wavelength from one droplet, therewould be other droplets for which this direction was the direction of maximumintensity for other wavelengths, giving, in effect, a continuous spectrum.
It is possible to obtain an estimate of the size of the droplets in the fog byobservation of the coloured bands in the vapour screen. A test was made at a Machnumber of 1.41, with a total nrezaure of !2 in. Hg and a total temperature of 460C.With 11 pints (61 litres) of water added to the 'dry' tunnel (the quantity necessaryto produce a satisfactory vapour screen under these conditions), it was found thatthe first and second intensity maxima for blue light occurred at angles of 300 and 550respectively to the direction of the original light beam. The wavelength of bluelight is approximately 1.8 x 10"5 in., so from the first maximum we have:
0.810 x 1.8 x 10 = xr' = 2.9sxI0" s in.sial 300
1,333 x 1.8 x i0"s
and from the second: r, = s= 2.9 x 10⁻⁶ in.m sin 550
Such perfect agreement between the two results must be considered fortuitous, sinceit was not possible to measure the angles to better than about 20, but it may be con-eluded fairly confidently that in this case the radius of the droplets is about3 x 10- 5 in, This is of the same order as the size of the droplets in an artificial
fog (produced by the sudden expansion of some wet air in a flask) a* measured byStodola (Ref.IV. 10), using a light diffraction method.
It was mentioned above that no red or orange bands were observed in the vapourscreen. Assuming a droplet radius of 2.9 x 10"6 in., the first maximum for red lightshould occur at an angle
0.810 x 2.7 x I06 41) _ sin'Z 400
2.9 x 10-'
The second maximum for violet light will occur at an angle
1) = sin' 1.333 x 1.6 X 10 6 470
2.9 A 10"
Therp is thus some overlapping of the first maximum for light of long wavelength withthe second maximum for light of short wavelength. Now the spectrum of the mercuryvapour lamp is rich in blue and violet light hut rsther deficient in red and orange,so that although the second maximum for violut in less intense than the first, It isprobably still stronger than the first maximum for red or orange. This offer., aplausible reason why the red and orange bands could not he detected.
124
With regard to the change in character of the screen between Mach numbers of 1.5and. 1.6, it seems probable that this is due to a change in the mechanism of con-densation, which rssults in a greater number of smaller particles being formed at thehigher MAch number so that dispersion of light by the fog remaains a true scatteringeffect without diffraction. In addition to this change in size, a change in thenature of the fog particles from water droplets to ice crystals is also likely,although the two effects are not related. It is known (Raf.YV. 11) that small droplets
of pure water can be supercooled to approximately -400C before freezing takes place
when cooled slowly. With droplets formed during the rapid expansion of saturatedwater vapour, an even greater degree of supercooling appears necessary, and Sanderand Damkhler (Ref.IV. 12) have shown that under such conditions a temperature ofapproximately -620C is required before ice crystals form. It may be that at theSe"low temperatures the vapour condenses directly into ice crystals without passing
through the liquid phase, bitt this point is uncertain. However, a temperature of-620C corresponds to the working section static temperature at a Mach number of 1.59
under isentropic conditions and with a total temperature of 450C. so that at thehigher Mach numbers the observed fog almost certainly consisted of ice crystals.
IV.4.5 IThe Mechanism of Condensation
A saturated or supersaturated vapour will condense only if there are 'condensationnuclei' present. These nuclei can be of two foras - minute particles of dust orother foreign matter, and nuclei which are generated spontaneously in the vapour by
random molecular aggregation. Nuclei of the former type are invariably present to agreater or lesse'r degree, but whilst groups of molecules are-continually forming in
any gas or vapour, they are unstable and immediately break up again and so cannotform condensation nuclei unless the vapour is heavily supersaturated. ften con-densation occurs on foreign nuclei, the number of droplets formed per unit volume islimited by the number of nuclei present, and the rate at which the vapour condensesis determined by the rate at which the droplets can grow, which in turn depends on
the degree of supersaturation, the rate of diffusion of vapour molecules onto thesurface of the droplets and the rate of transfer of the latent heat of evaporationaway from the droplets. On the other hand, with self-generated nuclei, the numberof nuclei per unit volume can reach astronomical figures when the vapour issufficiently supersaturated and condensation can take place extremely rapidly (con-densation 'shook'), leading to a very large number of minute droplets. These twocondensation processes and their relative importance in wind tunnels were firstdiscussed in detail by Oawatitsch (Ref.IV. 13), who concluded that in supersonictunnels the effects of foreign nuclei could be neglected. In the present case,
however, it is believed that at Mach numbers up to and including 1.51, condensation
is occurring principally on foreign nuclei and that only at higner speeds do self-
generated nuclei become predominant. The reasons leading to the adoption of thisconclusion are discussed at some length in Appendix IVM 1, It must be mphasisedthat this conolusion is only valid for the 3 ft tunnel for the particular conditions
under which it was operated, and does not necessarily apply in general. It is shown,for instance, that a reduction in total temperature considerably decreases theimportance of foreign condensation nuclei. The question of tunnel size is also con-sidered briefly and It is concluded that in a smaller tuinel a greater stagnation
humidity will ba necessary to produce the same density of fog in the working sectionat the sme total pressure and Mach number.
125
IV.4.6 Effect of Humidity on Working Section Static Pressureand Mach Number
Measurements were made of the variation of working section static pressure withquantity of water added to the tunnel at several Mach numbers, and the results,expressed as the ratio of the actual static pressure to the pressure with dry air,
P/Pdry , are presented for nominal Mach numbers of 1.51, 1.81 and 2.00 inFigures IV. 53 and IV. 54. The actual Mach number in tne working section was measuredat nominal Mach numbers of 1.51 and 2.00 by sticking strips of cellulose tape approxi-mately 0.003 in. thick on the top and bottom walls of the tunnel just ahead of thewindows. These generated very weak shock waves (effectively Mach waves), which werephotographed using the tunnel Schlieren system. The included angle between the twowaves (equal to twice the Mach angle) was measured from photographic enlargements andthe actual Mach number obtainea. The variation of actual Mach number with humidity
is shown in Figure IV.54. Some Schlieren pictures obtained at a nominal Mach numberof 2.00 are shown in Figure IV.55.
At Mach numbers less then 1.51 it is possible to obtain sufficient condensation toproduce a satisfactory vapour screen without affecting either the working section
static pressure or Mach nuober. In this Mach number range it Is believed that con-densation is occurring progressively on foreign condensation nuclei without acondensation shock. At the higher Mach numbers a condensation shock is clearly
present, and at a certain humidity the static pressure suddenly starts to increaseand the aorking section Mach number to decrease. The humidity at which the static
pressure diverges by 1% from the 'dry' value is a convenient indication of the onsetof the condensation shook, and this humidity is shown as a function of Mach number inFigure IV. 50 for a stagnation pressure of 12 in. Hg.
It will be noted from Figure IV. 50 that at M = 1.81 and 2.00 a condensation t,:!ock
occurs at a lower humidity than that at which fog is first visible In the wu'kingsection, whilst at Mach numbers less than 1.6 there may be visible condensat ton with-out a condensation, ahock. Thus, as has been previously pointed out by Oswatitsch(Ref. IV. 13), the appearance or disappearance of fog in the working section is not areliable guide to the presence or absence of condensation effeets.
Once a condcnnation shock is established, the working sec ion static pressure doesnot necessarily increase steadily with increasing humidity, At both M -- 1.81 and2.00 (Figures IV.53 and IV.54) there is a range of humidity soon after the con-densation shook forms over which the static pressure is constant, and at M = 1.51anl 1.81 at the maximum humidity investigated the rate of inerease of pressure withhumidity is again nearly zero. The reason for this is uncertain, but it may beassociated with the passage of a reflection of the condensation shock across thestatic pressure tappings, which are located in the sidewalls of the tunnel JuAt ahlen,of the windows, These shock reflections can be clearly seen in the Schlieren phot,-graphs, Figure IV. 55. At a nominal Mach number of 2.0 the actual Mach number in thecentre of the working section deoroases monotonically with inoreasing humidity anddoes not show any discontinuities. Vie rate of decrease of Mach number with humidityis greatiet Imediately after the condensation shook forms.
Making the assumption that the flow is one-dimensional and isimtropir before andafter the condensation shook, Monaghan (Ref. IV, 14) has derived the following
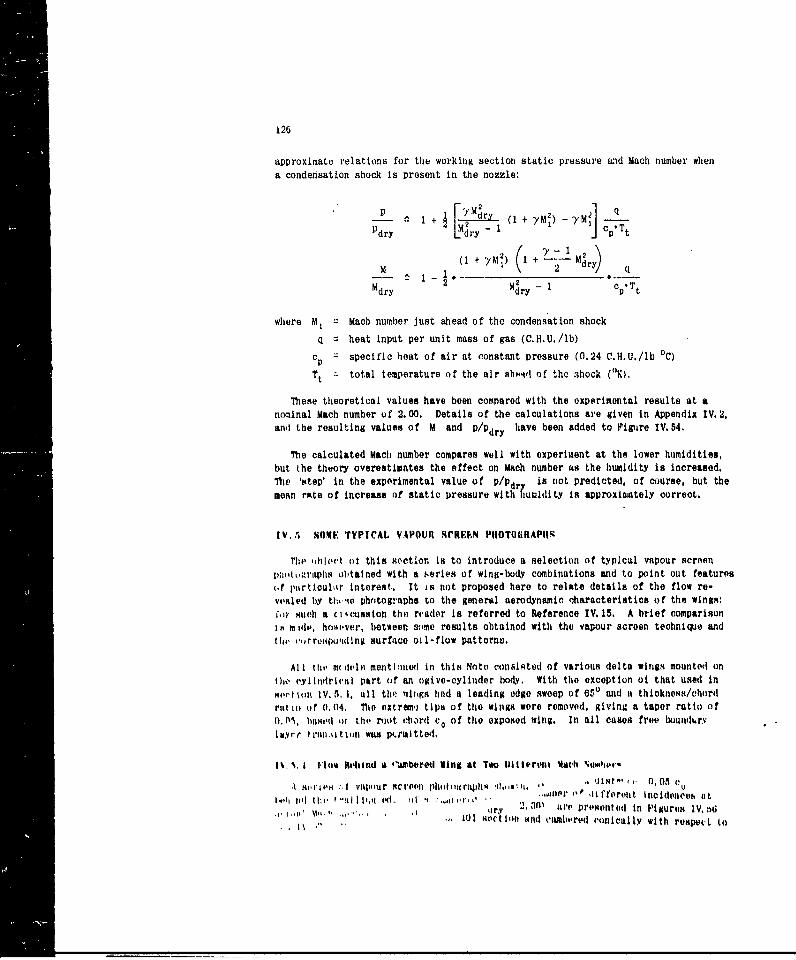
126
approximate relations for the working section static pressure nad Mach number whena condensation shock is present in the nozzle:
1-2 (1 yM ( + i*yM2) y)Pdr Mdry - c Tt
(1 + IM) + - M2rM 2 dr) q
Mdrydr
where M, = Macb number just ahead of the condensation shock
q = heat input per unit mass of gas (C.H.U./lb)
cp = specific heat of air at constant pressure (0.24 C.H.U./lb 0C)
Tt - total temperature of the air sht-id of the shock ("K).
These theoretical values have been compared with the experimental results at anoninal Mach number of 2.00. Details of the calculations are given in Appendix IV.2,and the resulting values of M and P/pry have been added to Figure IV.54.
The calculated Mach number compares well with experiment at the lower humidities,
but the theory overestimates the effect on Mach number as the humidity is increased.Thie Istep' in the experimental value of p/pdry is not predicted, of course, but themean rate of increase of static pressure with huaidity is approximately correct.
IV, S4OME TYPICAL VAPOUIR SCREFN PIIOTO(%RAPII.
The' ihli'et of this sction is to introduce a selection of typical vapour screenlIt,.rttpos btained with a teries of wing-body combinations and to point out featuresofr puirticulitr interest.. It is not proposed here to relate details of the flow re-
voaled by ti ,-tv photographs to the general aerodynamic oharacteristics of the wings:ior suh a i t iNston tho rcador is referred to Reference IV. 15. A brief comparisonis m idp, hos'ver, between sorme results obtained with the vapour screen technique andti, vrroiEOoQ;l ng surface oil-flow patterns.
All thi', e detIti mentioned in this Note consisted of various delta wings mounted oltihc cylidr'al part (it an ogive-cylinder body. With the exception of that used inmsi.t ln IV, 5, I, all th' witgs had a leading edge sweep of 65° and it thicknoss/chordrut in o f 0.04, The extrem-, tips of the wings wore removed, giving a taper ratio of0. 05, hiisic Ot lth, ro-ot (!hard co of the exposed wing. In all cases fro busundliury
iawyr triltl.kition was p .ri ttel.
1%.%. I low lehind a "amberedl Wing at Two Uifleruio 1sclh Numhoo,--,t lm i' m :,I vli iur screen llhcotcctirnlllisM tt,,rP' i , istn, . 0, I {'ci
.... 10-.er c l I firit Inc idicnleh litir ., it3'1 ' presented In lpiguros IV.:ct
., ,c I is Mc ..,,., ' . l() I s i anrd caml.erd volicallv with respu e L to, ic " '
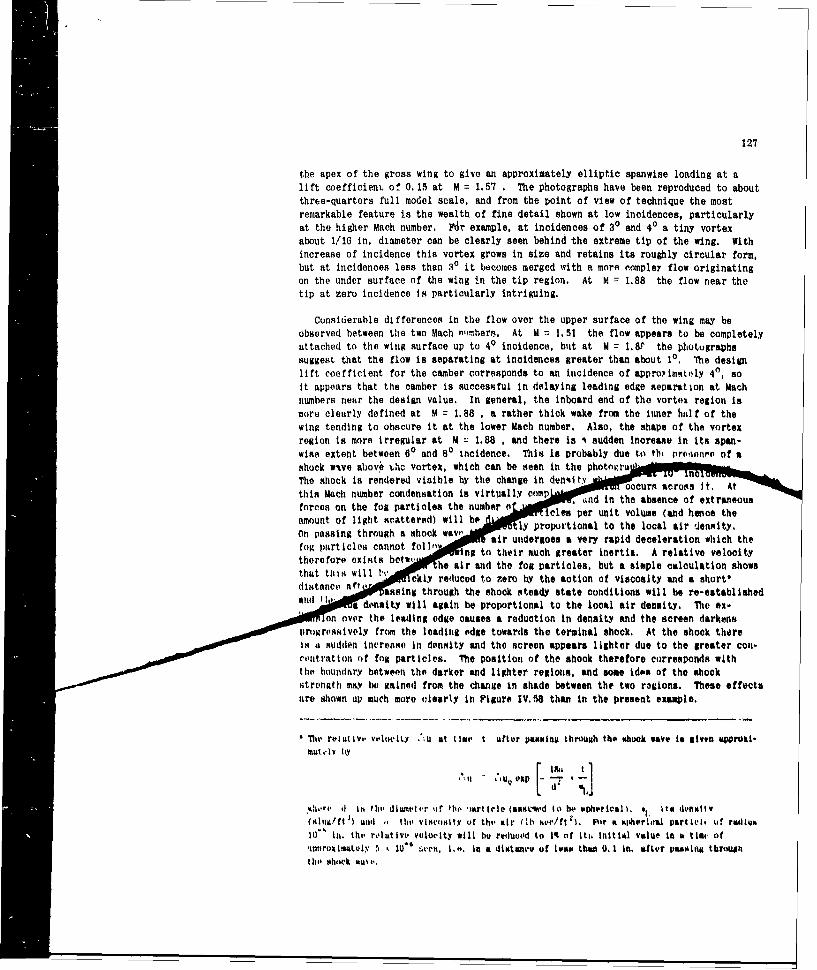
127
the apex of the gross wing to give an approximately elliptic spanwise loading at alift coefficienL of 0.15 at M = 1.57 . The photographs have been reproduced to aboutthree-quarters full model scale, and from the point of view of technique the mostremarkable feature is the wealth of fine detail shown at low incidences, particularlyat the higher Mach number. FMr example, at incidences of 30 and 40 a tiny vortexabout 1/16 in. diameter can be clearly seen behind the extreme tip of the wing. Withincrease of incidence this vortex grows in size and retains its roughly circular form,but at incidences less than 30 it becomes merged with a more tompley flow originatingon the under surface of the wing in the tip region. At M = 1.88 the flow near thetip at zero incidence is particularly intriguing.
Considerable differences in the flow over the upper surface of the wing may beobserved between the two Mach nbhers. At M = 1. 51 the flow appears to be completelyattached to the wing surface up to 40 incidence, but at M = I.8t the photographssuggest that the flow is separating at incidences greater than about 10. 'he designlift coefficient for the camber corresponds to an incidence of approyimately 40, soit appears that the camber is successful in delaying leading edge separation at Machnumbers near the design value. In general, the inboard end of the vortex region ismore clearly defined at M = 1.88 . a rather thick wake from the inner half of thewing tending to obscure it at the lower Mach number. Also, the shape of the vortex
region is more irregular at M z 1.88 , and there is i sudden increase in its span-wise extent between 60 and 80 incidence. This is probably due tit tbi nroionre of ashock wive above thc vortex, which can be seen in the photong _ 0The shock is rendered viaible by the change in denit.. oc ur a o T. At
this Mach number condensation is virtually comp it. 7tto nd in the absence of extraneousforces on the fog particles the number es per unit volume (and hence theamount of light scattered) will bp i y pro pr i volme an ,encety.Only proportional to the local air lennity.fog prticlos cannot fowi, air undergoes a very rapid deceleration which thetheefor xits cnot f Ing to their much greater inertia. A relative velocity.. th o xis illv he air and the fog particles but a simple calculation shows
e Of- ckly reduced to zero by the action of viscosity and a short*.#. - --" j assing through the shook steady state conditions will be re-established
a density will again be proportional to the local air density. The cx-on ovor the leading edge causes a reduction in density and the acreen darkens
progresively from the leading edge towards the terminal shock. At the shook thereis a sudden increase in density and the screen appears lighter due to the greater con-ctuntratiou of fog particles. The position of the shock therefore corresponds withOt hboundtiry between the darker and lighter regions, and some idos of the shockstrengtth my he Rained from the change in shade between the two r*Gions. Itese effectsare shown up much more clearly in Pigure IV,58 than in the present exmple.
'nl rehuttv, vloilty .' u at timi. t aftur pseing through tho ushock wave is alvt voroil-Mutely hy
Au At~ "U 1 t _ L ]t~,.v Ii hti di ote r of the )article (asat.i-d to be sphvrical. 61. its denwsity(tila/ft Unit . th, Vlcolty of th. sir (h sec/ft . ir i sherdleal oarttCli tf rwilue1O" tit. tht' r'iutivi, velocity will be reduced to l't of it. Initial value in a tIe, ofltnorolimately 5 i u' :;ccs, I.. in a distance of lva than 0.1 in. after Putieia throutsthow ghtkk wuii,..
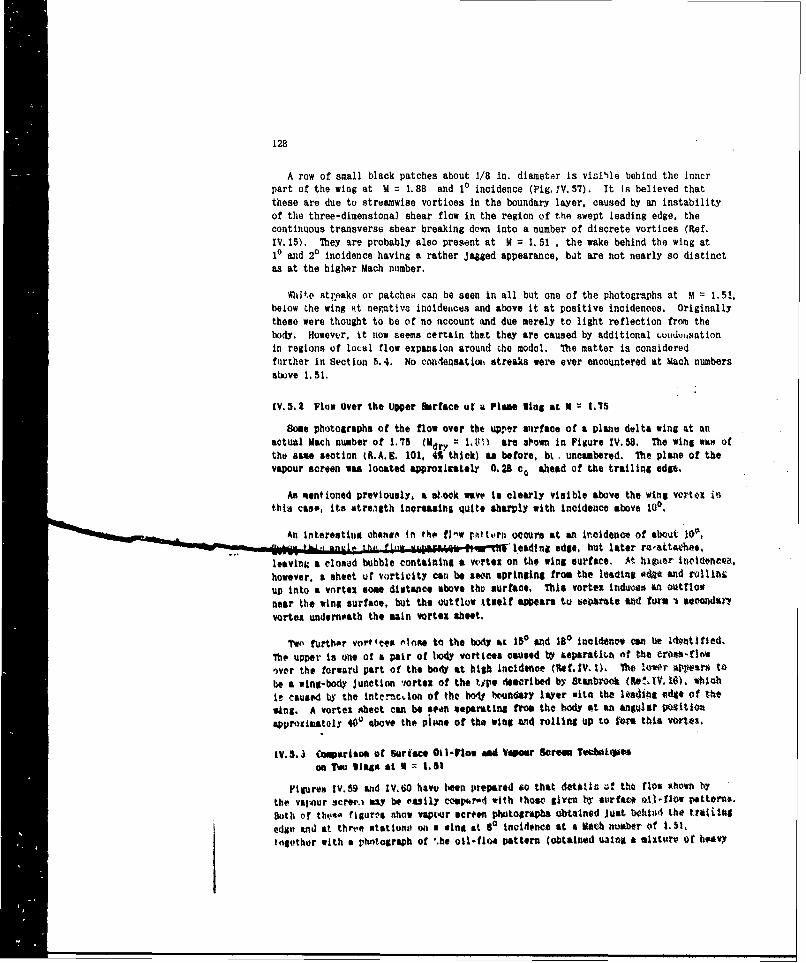
128
A row of small black patches about 1/8 in. diameter is visihle behind the Inncrpart of the wing at M = 1.88 and 10 incidence (Fig.IV.57). It Is believed that
these are due to streamwise vortices in the boundary layer, caused by an instability
of the three-dimensional shear flow in the region of the swept leading edge, the
continuous transverse shear breaking down into a number of discrete vortices (Ref.IV.15). They are probably also present at M = 1,51 , the wake behind the wing at
10 and 20 incidence having a rather jagged appearance, bdt are not nearly so distinct
as at the higher Mach number.
Ato streaks or patches can be seen in all but one of the photographs at m = 1.51,
below the wing Rt nega.tive incidenaces and above it at positive incidences, Originallythese were thought to be of no account and due merely to light reflection from thebody. 11owevvr, it now seems certain that they are caused by additional tiiduw.satlon
in regions of local flow expansion around he model. The matter is consideredfurther in Section 5.4. No condensatio, streaks were ever encountered at Mach numbersabove 1.51.
IV.5. 2 Flow Over the Upper Surface of a Plane Wing at N = 1.75
Some photographs of the flow over the uper surface of a plane delta wing at anactual Mach number of 1.75 Ndry .t1): are sown in Filure IV.58. The wing was of
the sate section iS.A.E. 101, 4% thick) u before, bt. uncmbered. The plane of the
vapour screen was located approximately 0.28 co ahead of the trailing edge.
As nentioned previously, a s.ock wave to clearly visible above the wing vortex in,this case, its streigth Increasing quite sharply with incidence above 100.
An interesting changs in the flw r.tttt, rn occurs at an incidence of about lep,
leading edge, but later r4-attalchas,
leaving a closed bubble containing a vvrtex on the wing surface. At htguer tnretancea,
however, a sheet of vorticitY can be awn springing from the leading ado and rollini
up into a vortex some distance above the surface. This vortex indwes an outflow
near the wing surface, but the outflow itself apears to epsrate and fore ' secondaY
vortex underneath the main vortex sheet.
?wn further vor"'eex rinse to the body ac 159 and 180 incidence can be 1d4ntifted.The upper Is one of a pair of ody vortices caused by teparatitti of the eross-flow
iver the forward part of the body at high incidence (Ief, VI.), the lawr wwtirs to
be a wing-body junction tortex of the type described by Stanbrook (R6!,iV.I(P. WI ch
ii caused by the intecnac.ion of the bo boun#ary layer wita the lea14ht e4de of the
wing. A vortex sheet can be aron separating froe the body at an angular poitiou
approximately 400 above the plsne of the wing ,td rolling up to form this vortex.
IV.S..l Comarieao of surfece Otl-Plow and Vowr Seree Tecbtafmwtean Two wiga at I = 1.51
Figures IV.59 and IV.60 havu teen prepared so that details uf the flow Ahole by
the val-our scree.i ony be veaily coophrd with those gitn y surface o1-f*low patterns.
11oth of the"" ficurne show vapteur screen photographs obtained just b0hit1 the trajtil
edge and at three atatione on a wtint at So incidence at a Mach nu wbr of 1.51,
together with a photograph of '.he oil-flo pattern (obtained uateg a mixttur of heavy
129
oil and titanium dioxide with a trace of oleic acid as anti-coagulant) at the sameconditions. The two wings used were the plane a)d cambereu '% thick delta wingsreferred to above, Figure IV. S9 showing the results for the plane wing.
The only significant differences shown by the oil-flow patterns are that on thecambered wing separation occurs slightly further aft of the leading edge, and there-attachment line Is slightly curved. However, the vapour screen pictures show thattho height and area of the vortax region and toe angle at which the flow separatesfrom the wing surface are appreciabty arsrter in the cnse of thf plate wing. Thevapour screen photographs on the cambered wing also hhow whaL a pear to be threesmail vorticea in the oundary tayer inboard of the main leading edge vortex. Thereis no indication of these vortices in the ell-flow pattern, and their origin isobscure. t hty wa alao be sxen in the photograph a? tie inodence In Figure JV,56.but there is no siuilar affect on the plane wing.
The position of re-attacment may be obtained with cwnai~israbla accuracy from theoil flciz patterni, atd this point has bo marked tm the vpr scre photorapafor the three stati os on the wing, (lose examination of the vaponar streta photo-
graph at the . #. c, station on the plane wit reveals thst th, flow imediatelyabove the wing may be divi de into thre parts - a black region er the outer partof the vial ahawed roug.ly like a sevent of a oirtl and *bleb appeara to he devoidat frig particles, a fre gion which extends as a narrow band abov the wing gurfacirn tt.e inbo rd 4Ad of the blhak re- 4a to t", bndy, md a thi right line rwingfrom the b"-y to th* leIO ng ed of the wing which torms an uper boundeir to boththe gre aWO black regions, it =rears that the MIT of ro-AttAchmaat Colnol~das" withthe inboard *Rd of the black regon, so It Ia*1 not r#aaonbl. to teoan Mhat the
itnd Wsae of this-rgonI ftrm$oftairly c-loty with those of tht acUIvaleadng cagi wortax, At the Oflir vapetr aeroo stations, end on Owe ctevred wins,it i# vrtuo§slY i*a"ible to diatinguia bewoe n thee two reion an thy w arus a atneLej dift region, Wot in ",neral rw-jattaehaemt cort at a aflwite* pt'Atioganear the ruit of infle.tia of the bri#ht line surrswdla the dark relfiui. Tbis1ln. mt the dark rgion oner the ite part of the wing 'hare the flo* Is attaced.ar* ctsrauetritie of rinits ObtAfte a t **h aobwA up to I.M. Above thits .p '
as &mo~ W Figures IVS tAd lVlt0. te imbwed end of what it awarcd to t* .hejelettin cdge fvox 1*itv zl sepi defined ant' there iW no contiptoo ark Wbc
0''*1 the Inner pat oft the wing. In setion V.$ It is 8tageeted tht Uist tliftndooc.ii *ht to tr3n, sefmltr tilte oit thq "og particles at the hither W-ob
At a14 early ataO Isf tbe petsat inreetigutina, tie fog foruatuo 1t tirhteruViOl nwsbef *", teios o~tM test vas boing perfaOttd at a -art uiosber -at InAs usua doiii lgUtn testa a endM was sounted In tve tua*e) *so 0--t in q Walittlth , "?.'* pkitirek r-etad *,- lutleod. As the tvak of liphtnabliaeflkrCthn aft behind the model a V4*t intrlattin MorOMsano emmvd. Ink aduilito tothe nol bAlack pV*tC# On the screen tenrAS"d W o lesE.U, t§ u~iscpat tfut Of bright blue lines *ovuepai. which a Tpasred V-t innate fvaceO thewr oatreotho scereeni aW heroie #WoiVInd with C!e *lnf rortiewn. It is 4C4 poSiblv It- * bi*A4A
*.o wite roitsrgtocso i. ttalcly aveapffle 0i. sinakingt MatUref !i e'ffectN - A..sttatrt in, bins, ei NA'SC ip se tridacfat taeksriroWa f arvooeen 'aIt violetl - buttOn a'hotorave la flgtsr M491 th.tC32 w#re urigtoall$c £whna un olour fiMS *%Ve a
130
good impression of the phenomenon, The model used was similar to those describedpreviously. hut fitted with a 550 leading edge sweep delta wing of R.A.E. 101 section.6% thick. The plane of the vapour screen was located approximately 9.5 in. (1.2 wingroot chords) behind the trailing edge of the wing. The blue lines were present evenat zero incidence. when they formed a roughly triangular shape behind each wing panel,with the apex towards the bodyu. With application of incidence, their shape changed.the upper side of the trianale becoming curved and the lover aide swinging round asif to unite with the *Ing vortex.
The lines from the body became rathur diffuse by about 70' inLidence. but two bluelobe-like shapes appeared in the screen on top of the sting an which the model wasmounted. With further increase of incidence the vertical height of the lobesincreased and their tips assumed a .4itian tinge. It was foutud that on moving thelight beam towards the model the main pattern of blue lines became fainter. and theydisapPemsd%* completely when the hoAm was about 6 in. from the trailing edge of thewing. The blue lobes above the fr40 at high Incidence potraisted, however, until thebount was ahead of the trailing edgev.
At the timp. the origin of thea blue line. was the Aub.ject of moch speculation. Noquite similar effect could be found *t other Mach nuqbers, although at M = 1.41 andl,$i blue lobes c-ould be seen at high Wnidtar.* when the light be"s was behind thewing trailint edge. The mtter was finally re~olved when a long, slender body ofrevolution lmna being testad at a Viseh number of 1.41. !he light beaw was locatedtowardis the rear of the body and the modlel happwneit to be at a considerable Incidencewhile water wavs being added to the tunnel. It was diverod that two fit bluetobes could be 4eon above the body in the Seth of the light been before the humiditywas sufficient to produce a visible voliour creen. It was therefore concluded thatthe blue colorttion was due to local conduensation. okused by flow tapssion in theimmediate vicinity of the model.
This explattatiou further confirmts the aeitanisa of condensation proposed inih'etion IV.4.5. So blue lines wert detoite utider atty codt'ons at a Vath numbergreater than 1. R1. Hiowever. condensation occurs at a condensation shock labove thismach nuober and the fno* is not supersaturated after the shock. It is therefore notpossible for additional cond~atienl~ to occur a! #Sr anol. At "'ch nuaberst up to andincluding 1.51 it in believed that the primary moodnsation occurs on foreign nucleiand only a fraction of the water vaws~r present In the working section Is condensedlout. Thr flow is sitilt wall tupersaturated aod secondary condensation tao ocr..Ur inany reltion litere espension Of the flow is suifficient to raIN* the local lovel ofsupersaturatilia above the oIritical value. In vivo iii the owaratveiv small sizeatote regiloaw causing additional condensation, it to probable that such condenalition
oce'urs on nelf-senel'ated nuclei. ibis implies that therbe ma be condmastloa shocksin the vicinity of the aodvl. but it io considered tbat the :m 0 : 1: :an tue overalI flow around the mdel is likely to be very smal.
tv.s TOR "411ATION OF "I .'PltVS SEUICVE PtCTUR9
The mechanism tw which a shock save In rendered visible bv t10 vapour P'rreft hasalready beft discussed in Soction u toSI. will not.,olsder briefly tither ways iowhich the unifor 41ttirf o In f f'i Particlose-i vlb e dlitturbeed sufficiently topri-lur# Ontinolible ehane" in the -amint of light seattercl lY the Ina,
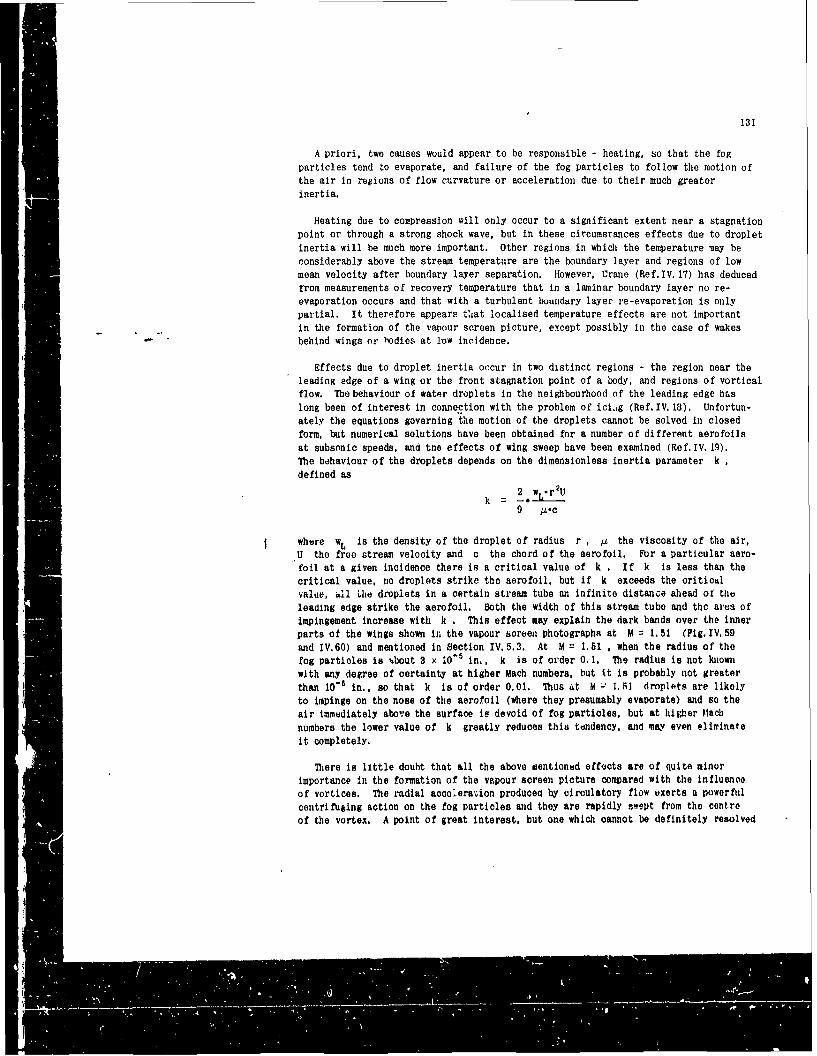
131
A priori, two causes would appear to be responsible - heating, so that the fogparticles tend to evaporate, and failure of the fog particles to follow the motion ofthe air in regions of flow curvature or acceleration due to their much greater
inertia.
Heating due to compression will only occur to a significant extent near a stagnation
point or through a strong shock wave, but in these circumsrances effects due to dropletinertia will be much more important. Other regions in which the temperature may be
considerably above the stream temperature are the boundary layer and regions of lowmean velocity after boundary layer separation. However, Crane (Ref. IV. 17) has deduced
from measurements of recovery temperature that in a laminar boundary layer no re-evaporation occurs and that with a turbulent boundary layer re-evaporation is onlypartial. It therefore appears t'iat localised temperature effects are not important
in the formation of the vapour screen picture, except possibly in the case of wakes" -behind wings or hodies at low incidence.
Effects due to droplet inertia occur in two distinct regions - the region near the
leading edge of a wing or the front stagnation point of a body, and regions of vorticalflow. The behaviour of water droplets in the neighbourhood of the leading edge haslong been of interest in connection with the problem of ici. g (Ref.IV.18). Unfortun-
ately the equations governing the motion of the droplets cannot be solved in closed
form, but numerical solutions have been obtained for a number of different aerofoilsat subsonic speeds, and tne effects of wing sweep have been examined (Ref. IV. 19).The behaviour of the droplets depends on the dimensionless inertia parameter k
defined as
2 w *r2Ukt = -
9 A.c
where wL. is the density of the droplet of radius r , ti the viscosity of the air,U the free stream velocity and c the chord of the aerofoil. For a particular aero-foil at a given incidence there is a critical value of k . If k is less than the
critical value, no droplets strike the aerofoil, but if k exceeds the criticalvalue, all Uhe droplets in a certain stream tube an infinite distance ahead of theleading edge strike the aerofoil. Both the width of this stream tube and the area ofimpingement increase with k . This effect may explain the dark bands over the innerparts of the wings shown in the vapour soreen photographs at M = 1.51 (Fig. IV. 59and IV.60) and mentioned in Section IV. 5.3. At M = 1.51 , when the radius of thefog particles is %bout 3 x 10"6 in., k is of order 0.1. The radius is not knownwith any degree of certainty at higher Mach numbers, but it is probably not greater
than 10- in., so that k is of order 0.01. Thus at M L' 1.5l droplets are likelyto impinge on the nose of the aerofoil (where they presumably evaporate) and so the
air immediately above the surface is devoid of fog particles, but at higher lachnumbers the lower value of k greatly reduces this tendency, and may even eliminateit completely.
There is little doubt that all the above mentioned effects are of quite minorimportance in the formation of the v.pour screen picture compared with the influenceof vortices. The radial aceelera, ion produced by circulatory flow exerts a powerfulcentrifuaing action on the fog particles and they are rapidly swept from the centreof the vortex. A point of great interest, but one which cannot be definitely resolved
132
from the present tests, is the relationship between the size and shape of a regionclear of fog with tnose of the vortex causing i.. The boundary of such regions isinvariably well-defined, but can a vortex possess such a boundary? This difficultyis removed if It is remembered that the vortices under consideration here are quitedifferent from the classical concept of an irrotational vortex in an inviscid fluid.They are essentially three-dimensional, rotational and viscous, produced by the
accumulation of vorticity shed from lines of boundary layir separation near theleading edge of the wing or from the body. From examination of large numbers ofphotographs, it is suggested that the black regions shown on the vapour screen arecaused by these rotational vortex cores, and the borndary of the region is a feirlyclose approximation to the boundary between the core and the outer irrotational flowfield, but a detailed survey of flow conditions is necessary before this can bedefinitely established.
IV,7 THE VAPOUR SCREEN AT SUBSONIC SPEEDS
All previous applications of the vapour screen technique have been restricted +osupersonic speeds, but there are no fundamental reasons why the method should not be
employed at the higher subsonic and transonic speeds provided a sufficiently largedrop in temperature between the settling chamber and working section can be achieved.Some tests were therefor" mdc to examine vapour screen production under theseconditions.
Ideclly. the use of a slotted or porous wall working section is necessary for suchan investigation, but this was impossible in the present instance since the transonicworking section of the 3 ft tunnel does not possess any apertures suitable for thepassage of the light beam. As an alternative, a flat top liner was used In the super-sonic working section, converting it, in effect. Oo a subsonic tunnel. 11his presentedno serious diisdvantage since the main purpose of these tests was to determine thelowest subsonic Rach number at which the vapour acreon technique could be usefullyemployed.
The tirst test was made tt M u 0.80 (based on the value of p/pt and uncorrectedfor constraint effects) with a totai pressure of 20 in. i1 nd a total temperature ofapproximately 400C. The same procedure was followed as in previous tests at super-sonic speeds. It was found necessary to Inject some 15 gallons of water before anadequatoly detnse vapour screen was produced. but the screen tended to thin once theflow of water Into the tunnel ceased. Iis was because the air no saturated at
stagnation conditions and condensation occurred on the tunnel walls and in other coolparts of the circuit. The trouble was cured by injecting water continuously Into thetunnel at a rate sufficient to make up for this condensation. However, in spite ofthe screen appearing reasonably wtisfactory when viewed fe the sid of the tunnel,attempts to photograph it from downstream were unsucwsAful. we picture being almastcompletely obseured by dense white patches caused by local condcai.twt. ... ,,i Limodel. An Impression was gained that the droplets frmin thv, fog were considerablylarger than thos sit hither speeds, and globuies of water could frequently 1W seens'remoing over the ourface of the model and colecting at the trailing odge of thewing and the base of the body.
A stocond test at V • 0.85 with the tsn total tempevluiv und pressure mu bef-ireproved Puch more mucrossful. Att In gallons of wator tore requirod to produce an
133
adequate vapour screen, which had the same iridescent character as at the lower super-
sonic Mach numbers. Some typical results are presented in Figures IV.62 Z.nd IV.63,which show the rolling-up of the vortex sheet at various distances behind a 650leading edge sweep delta wing at incidences of 40 and 80. At 40 incidence theresults are quite normal and the edges of the vortex sheet are clearly defined, butat 80 it is possible that the higher velocties inside the vortex region caused a drop
in temperature sufficient to cause condensation to occur at a greater rate than thefog particles could be jwept from the core of the vortex. At the must rearward
station there is a complete 'image reversal' effect, the vortex sheet appearing whiteon a relatively dark background.
Th conclusion drawn from these tests is that the lowest Mach number at which thevapour s4reen technique is praticable is approximately 0.85, but this may be rathertoo low if the shape of the model or the range of incidence over which it is to beexami~ied is such that flow expansion around the model causes excessive local con-densation.
IV.8 USE OF LIQUIDS OTHER THAN WATER FOR
VAPOUR SCREEN PRODUCTION
An undesirable feature of the vapour screen technique is that at Mach numbersgreater than about 1.6 a condensation shock occurs upstream of the working section ata humidity less than that neeessary to produce a satisfactory vapour screen, This
shook reduces the actual Mach number below the nominal for the nozzle, increases the
static pressure and may produce flow disturbances in the working section.
The condennatiot shock is caused by the sudden liberation of the latent heat ofevaporation when vapour condenses into liquid, and to first order the strength of the
shock and its effect ot, the flow are directly proportional to the amount of heat addedper unit mass of air. It in possible to reduce the strength of the shock for a givendegree of condensation by increasing the total pressure, but the improvement availableis strictly limited by the design of the tunnel. A more fundamental approach lies in
the uac af liquids which have a lower latent heat of evaporation than water. Now thelatent heat h and molecular weight m are related by h a m= C x Tb (Trouton' aRule). where Tb is the boiling temperature and C is a constant which has the value11 for :ubainteus which are -u.sciuciatod in both the liquid and vapor states. Itth'refore follows that a liquid of high molecuiar weight will have a lot, latent heatof evaporation. The advantage that could be gained from liquidu having a lower
"olling point is neligible in comparison with that availabie from the high values of
molocula" weight that are physically attainahle.
Tho tirtpurLies dvslrablu in a liquid whose use In contemplated for vipour screenpruduction can be suumaristli as follows. It must be (a) chemically stable. (b) ofhigh moleculi, weight, (c) of low toxicity. (d) non-corrouive, (e) non-inflamable,(f) prsoferably readily available comercially, and (g) have a saturated vapour densitysuch that (I) a sufficient quantity can be introduced before reL-hing saturation understagnation conditions, (it) an excassive quantity Ir not required to produce saturationat the working section static temperature. 1he number of liquids satisfying all theseconditions is quite wall and the most promising appear to be a group of organic
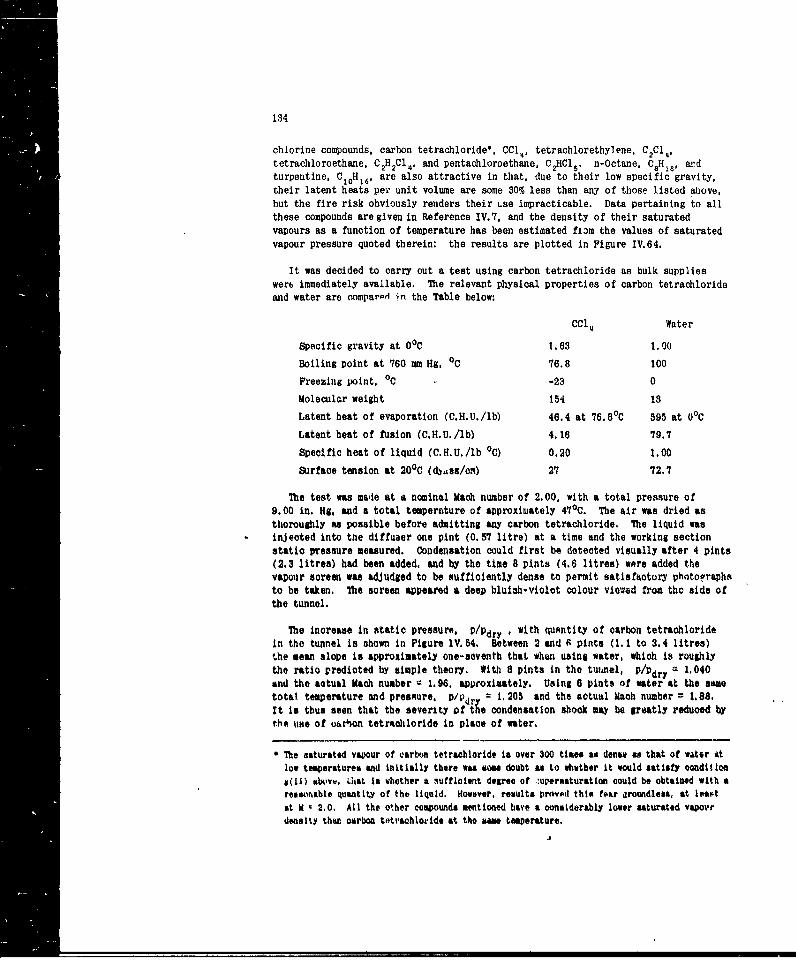
134
chlorine compounds, carbon tetrachloride*. CCI., tetrachlorethylene, C2Cl4,tetrachloroethane. C2H2CI, and pentachloroethane, C2HCl . n-Octane, CH81, ardturpentine. C1oH16. are also attractive in that, due to their low specific gravity,their latent heats per unit volume are some 30% less than any of those listed above,but the fire risk obviously renders their use impracticable. Data pertaining to allthese compounds are given in Reference V.7, and the density of their saturatedvapours as a function of temperature has been estimated f1om the values of saturatedvapour pressure quoted therein: the results are plotted in Figure IV.64.
It was decided to carry out a test using carbon tetrachloride as bulk supplieswere immediately available. The relevant physical properties of carbon tetrachlorideand water are comparad in the Table below:
CC14 Water
Specific gravity at 00C 1.63 1.00
Boiling point at 760 mm Hg, °C 76.8 100
Freezing point, 0C - -23 0
Molecular weight 154 18
Latent heat of evaporation (C.H.U./lb) 46.4 at 76.8 0C 595 at 00C
Latent heat of fusion (C.H.U./lb) 4.16 79.7
Specific heat of liquid (C.H.U./lb 0C) 0.20 1.00
Surface tension at 200C (d),es/of) 27 72.7
The test was male at a nominal Mach number of 2.00, with a total pressure of9.00 in. Hg, and a total temperature of approximately 470C. The air was dried asthoroughly as possible before admitting any carbon tetrachloride. The liquid wasinjected into tne diffuser one pint (0.57 litre) at a time and the working sectionstatic pressure measured. Condensation could first be detected visually after 4 pints(2.3 litres) had been added, and by the time 8 pints (4.6 litres) were added thevapour screen was adjudged to be sufficiently dense to permit satisfactory photog'raphsto be taken. The screen appeared a deep bluish-violet colour viewed from the side ofthe tunnel.
The increase in static pressure, p/Pdry , with quntity of carbon tetrachloride
in the tunnel is shown in Figure 1V.54. Between 2 and 6 pints (1.1 to 3.4 litres)the mean slope is approximately one-seventh that when using water, which is roughlythe ratio predicted by simple theory. With 8 pints in the tunel, P/Pdry = 1.040and the aotual Mach number L 1.96. approximately. Using 6 pints of water at the sametotal temperature and pressure, P/pdr = 1.206 and the aotual Mach number = 1.88.It Is thus seen that the severity of the condensation shook ma be greatly reduced bythe use of u&O on tetrachloride in place of water.
The saturated vapour of carbon tetrachloride is over 300 timee as dens# s that of water atlow temperatures and initially there was am doubt as to whvther it would satisfy condition1(L1) ,., 0 L4at Is whether a nufflcent degree of ..uperaturation could be obtained with aresumable quantity of the liquid. However, results prnvtt this toar Irondlme, at lea~tat M - 2.0. All the other compounds mentioned have a considerably lower saturated vapoerdensity thez carbon t'traohloride at the "me taerature.
i 135
Some photographs of the flow just behind the trailing edge of a 650 leading edgesweep delta wing with a 41 thick biconvex section obtained using the carbon tetrach-loride screen are presented in Figure IV.65, with the corresponding photographs using
water in Figure IV.66 for comparison. The general quality of the photographc is.,milar in the two cases, and the most noticeable difference is that with the carbon
tetrachloride screen (and higher working section Mach number) the shock wave visibleon top of the vortex at incidences of 60, 8o and 100 is located approximatelv 6% of
the semi-span further inboard.
IV.9 CONCLUSIONS
The vapour screen technique affords a simple and practical method of flow visuali-zation at supersonic speeds, and, with some limitatlons, may even he employed at Mach
numbers as low as 0.85. It is capable of providing much useful information about theflow over and behind wings and bodies, such details as vortices, vortex sheets, linesof flow separation or re-attachment and shock waves being rendered clearly visible.
A high standard of temperature uniformity over the working section is essential if
good results are to be obtained, and to achieve such a standard in the 3 ft tunnelentailed shutting off the aftercooler and running at reduced total pressure at a totaltemperature of 400 to 500C. Close control of the humidity is also necessary, the
procedure used consisting of running the tunnel with the driers in circuit to reducethe humidity to a low level (corresponding to a frost-point of about -40
0 C), switchingoff the driers, and then injecting measured quantities of water into the diffuser.
he humidity required to produce an optimum density of fog in the working section(from the point of view of obtaining the best photographs of the vapour screen picture)
is fairly critical, and is affected by Mach number, total pressure and temperature.With a total pressure of 12 in. Hg and a total tempArature of 450 C it was found that
the optimum humidity reached a minimum value at about M = 1.8 , increasing veryrapidly below this Mach number and rther slowly above it. At Mach numbers up to andincluding 1.51 (with the above conditions of temperature and pressure) the screen had
an iridescent appearance due to diffraction of the light beam by tho fog particles.An estimate of the size of the particles based on the position of the coloureddiffraction bands at M :: 1.41 gave the radius as approximately 3 x In " in.,
corresponding to a particle density of about 107 per cubic in, In this Mach numberrange it was possible to obtain sufficient condensation to form a satisfactory vapour
screen without affectiag either the working section static pressure or Mach number
and it is suitested that condensation occurred on foreign condensation nuclei.
At higher Mach numbers the vapour screen was pale blue in colour and the fog
probably consisted of ice crystals rather than water droplets. Condensation occurredat a condensation Rhnck in the nzle upstream of the working section, which increasedthe static pressure and donreased the Mach number in the working section. Ieatsw at anominal Mach number of 2.00 showed that the variation of Mach number and staticpressure with humidity agreed well with the first order theory of Monaghan at lowhumidities, but the theory was unduly pessimistic of the effect on Mach number in therange of humidity necessa' .o produce a atisfactory vapour screen.
The quality of the vapour screen picture was generally superior at Mach numberaabove 1.51, this being ascribed to the smaller size of the fog particles due to the
136
uii erenL mecnaiusm of condensation. At lower speeds the flow in the working sectionwas still supersaturated and patches of additional local condensation caused by flowexpansion around the model were frequently observed. Under certain conditions, andparticularly at M = 1.32 , these condensation patches or streaks formed an" intricatepattern superimposed on the normal vapour screen picture.
The adverse effects of the condensation shook on the flow at the higher Machnumbers may be alleviated by the use of liquids with a lower latent heat of evaporationthan water. A test at a nominal Mach number of 2.00 showed that a vapour screenpicture of a quality comparable with that obtained using water vapour could be pro-duced with carbon tetrachloride vapour. The actual Mach number in the working sectionwas 1.96. compared with a value of 1.88 when using water vapour.
137
APPENDIX IV. 1
The Mechanism of Condensation at Mach Numbers Less than 1.5
It is suggested in Section IV. 4.5 that, at Mach nv, bers up to and including 1.51,
condensation is occurring principally on foreign nuclei rather than on nuclei generatedspontaneously in the supersaturated vapour by random molecular aggregation. Sincethis is..tt variance with the commonly accepted view of the mechanism of condensationin wind tunnels at supersonic speeds, the matter will be considered in some detail.
We will first attempt to shL that the size of the droplets, as estimated fromobservation of the coloured diffraction bands at M = 1,41 , is of the same order as
that predicted theoretically on the assumption that a droplet starts to form around acondensation nucleus at the point in the nozzle where the water vapour is just
saturated and continues to grow on its passage down the nozzle by a process of dif-fusion of water vapour onto the surface of the droplet. To perform this calculationit is necessary to make an assumption concerning the variation of the density of the
uncondensed water vapour along the length of the nozzle. This variation is knownwhen there is no condensation, but is indeterminate once condensacion has startedunless the number of droplets is also known. Consequently, the calculated value of
the droplet radius must be regarded as a rough estimate only, but its order of
magnitude should be correct.
The equation governing the rate of growth of a droplet in a moving airstream is
given by Oswatitsch in Reference IV. 13 as
dr w - wsat D
dx WL u
where r = radius of the (spherical) droplet
x = axial coordinate
w = density of the uncondensed vapour surrounding the droplet
wsat = density of saturated vapour at the surface of the droplet
WL - density of the liquid forming the droplet = 62.4 lb/ft'
D = coefficient of diffusion of water vapour in air
u = velocity of the airstream,
This equation may be integrated to give
r2= 2 W-w~a PwL u
where I is the distance travelled by the drop since its formation. In the case of
the flow through a supersonic nozzle, all the quantities on the right hand side of thisequatilti (with the exception of w. ) are functions of x , but it may be shown thatin the Mach number range we are concerned with here (1.0 to 1.5 approximately) theratio P/u is very nearly constant, so that
138
- (-)- (W - Wsat) dx.WL
Unfortunately, the variation of (w - w ,t) with distance along the nozzle is in-determinate, but we can obtain a rough estimate of the d-oplet rqdiu-, by assuming asimple, plausible variation of (w - Wat) with x . For example, suppose we aasumethat (w - wst) increases linearly with x . We then have for the radius
r =f(-)±w t
Let us consider the case of M = 1.4 , with a total pressure pt of 12.0 in. Hg,a total temperature Tt of 450C, and with 12 pints (6.8 litres) of water added to thetunnel. The flow becomes just saturated at a point in the nozzle where the local Machnumber is 0.98, and in accordance with our initial hypothesis it will be assumed thatcondensation starts from this point. From Reference IV.6, the distance from thispoint to the centre of the working section, i.e. the distance I , is 9.5 ft. Thecoefficient of diffusion D is given by Oswatitsch as
D = 0.000225 * (T/273) . 8 ' .(30/p) ft/seo
so that the mean value of D/u between M= 1.0 and M = 1.4 is 0.93 x 10'6 ftfor the conditions specified above. The working section static temperature is -430 Cunder isentropic conditions, and from Figure IV.51 the corresponding density ofsaturated water vapour, w,,t , is 5. 1 x 10⁻⁶ lb/ft3 . If we assume that half ofthe water vapour has condensed at the working section, the actual density of theuncondensed vapour is
x 12 x -' 73 x 10- 6 lb/ft3 .
Inserting these v.lues in the equation for r gives a droplet radius of 3.8 x 106 in.,which is considered to be in quite reasonable agreement with the value of 3 x 10" 5 in.
estimated from observation of the coloured diffraction bands at M = 1.41 .
If we again assume half of the vapour to have condensed hy the time the workingsection is reached, and taking the droplet radius as 3 x 10"5 in., the number ofdroplets in this case t rks out at 101 per ou.in. Therefore if condensation isoccurring on foreign condensation nuclei, there must be at least this number ofnuclei present in the air in the tunnel. At first sight this may appear to be anexcessive number, but in fact is less than the number that have been measured inordinary room air, and is of the same order as that found in an urban atmosphere.We thus conclude that the size and number of the droplets are not inconsistent withthe proposition thiAt condensation is occurring on foreign nuclei.
The theory of molecular nucleus formation is hued on the kinetic theory of gases,and whilst complicated in detail, the results may be expressed comparatively simply.It is found that the rate of nucleus formation per unit volume depends on two
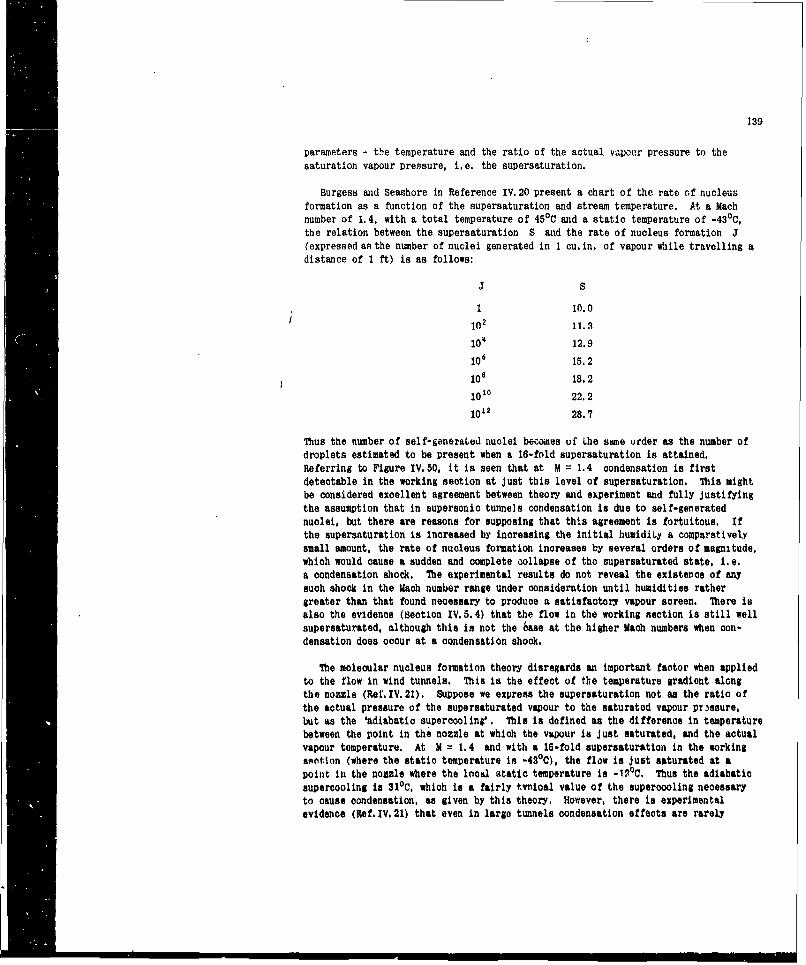
139
parameters - the temperature and the ratio of the actual vapour pressure to the
saturation vapour pressure, i.e. the supersaturation.
Burgess and Seashore in Reference IV. 20 present a chart of the rate of nucleus
formation as a function of the supersaturation and stream temperature. At a Mach
number of 1.4, with a total temperature of 45 0 C and a static temperature of -43 0 C,the relation between the supersaturation S and the rate of nucleus formation J(expressed as the number of nuclei generated in 1 cu. in. of vapour while travelling adistance of 1 ft) is as follows:
J S
1 10.0
102 11.3
104 12.9106 15.2101 18.2
101° 22.2
102 28.7
Thus the number of self-generaLed nuclei becomes of the same order as the number ofdroplets estimated to be present when a 16-fold supersaturation is attained.
Referring to Figure IV.50, it is seen that at M = 1.4 condensation is firstdetectable in the working section at just this level of supersaturation. This mightbe considered excellent agreement between theory and experiment and fully justifyingthe assumption that in supersonic tunnels condensation is due to self-generatednuclei, but there are reasons for supposing that this agreement is fortuitous. Ifthe supersaturation is increased by increasing the initial humidity a comparatively
small amount, the rate of nucleus formation increases by several orders of magnitude,which would cause a sudden and complete collapse of the supersaturated state, i.e.a condensation shock. The experimental results do not reveal the existence of anysuch shock In the Mach number range under consideration until humidities rathergreater than that found necessary to produce a satisfactory vapour screen. There isalso the evidence (Section IV.5.4) that the flow in the working section is still wellsupersaturated, although this is not the 6ase at the higher Mach numbers when con-densation does occur at a condensation shock.
The molecular nucleus formation theory disregards an important factor when appliedto the flow in wind tunnels. This is the effect of the temperature gradient alongthe nozzle (Ref.IV.21). Suppose we express the supersaturation not as the ratio ofthe actual pressure of the supersaturated vapour to the saturated vapour pr sure,but as the 'adiabatic supercooling'. This is defined as the difference in temperaturebetween the point in the nomzle at which the vapour is just saturated, and the actualvapour temperature. At M = 1.4 and with a 16-fold supersaturation in the workingsontion (where the static temperature is -430C), the flow is just saturated at apoint in the nozle where the local static temperature is -I 0C, Thus the adiabatic
supercooling is 310C, which is a fairly twnioal value of the supercooling necessaryto cause condensation, as given by this theory, However, there is experimental
evidence (Ref.IV.21) that even in large tunnels condensation effects are rarely
140
encountered 'with an adiabatic supercooling of less than 400C and in a small tunnelthis may rise to 600 or 700C or more. A change in the adiabatic supercooling Yrom310C to 400C represents an increase of over 100% in the supersaturation.
It is therefore considered that at the lower supersonic speeds the weighit ofevidence is against the theory that condensation is due to self-generated nuclei, andit appears that foreign nuclei are primarily responsible. It must be emphasised,however, that this conclusion is only valid for the 3 ft tunnel for the particularconditions of pressure and temperature under which it was operated, and will notnecessarily be true in general. For example, a reduction in total temperature whilekeeping the stagnation humidity constant will have little effect on the rate of growthof a droplet forming around a foreign condensation nucleus, but it will increase theadiabatic supercooling, thus greatly increasing the likelihood of self-generatednuclei dominating the condensation process. It might well be found that at a totaltemperature of 150C the presence of foreign nuclei is significant only at Mach numbersless than about 1.2.
The effect of a reduction in tunnel size is interesting. The shorter distancebetween throat and working section is obviously unfavourable to the growth of dropletson foreign nuclei, which tends to increase the supersaturation of the uncondensed
vapour, thus increasing the probability of molecular nucleus formation. However, thesteeper temperature gradient in the shorter nozzle increases the adiabatic supercoolingnecessary to cause condensation. It is therefore difficult to predict the effect of areduction in tunnel size on the mechanism of condensation, but it is certain that toproduce, at the same Mach number and total pressure, a vapour screen of equal density
in a small and in a large tunnel, then the stagnation humidity must be greater in theformer case than in the latter.
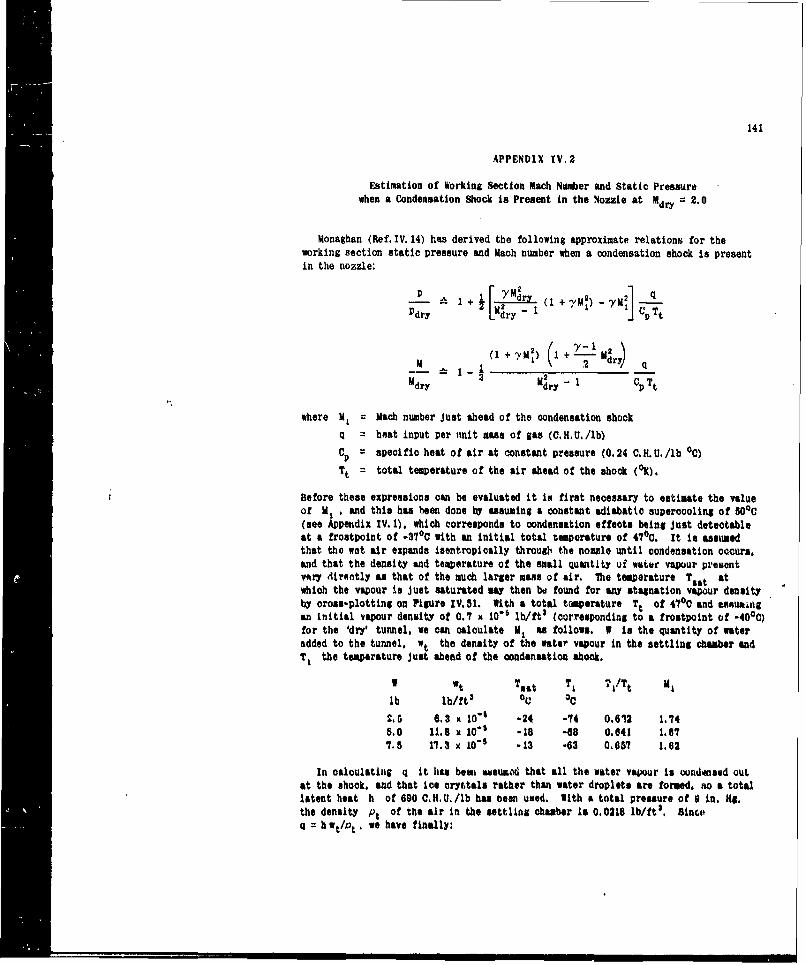
141
APPENDIX IV.2
Estimation of Working Section Mach Number and Static Pressure
when a Condensation Shock is Present in the Nozzle at Mdry = 2.0
Monaghan (Ref. IV. 14) has derived the following approximate relations for theworking section static pressure and Mach number when a condensation shock is presentin the nozzle:
Pry Mdry - (1 + 7M2) _ _yM]
7 m2 1-]
M ( I~y (1+2 dry) 4Mdry Mdry - 1 Cp T t
where M1 = Mach number just ahead of the condensation shock
q = heat input per nnit mass of gas (C.HU./lb)
Cp = specific heat of air at constant pressure (0.24 C.H.U./lb oC)
Tt = total temperature of the air ahead of the shock (°K).
Before these expressions can be evaluated it is first necessary to estimate the valueof MI , and this has been done by assuming a constant adiabatic supercooling of 500 C(see Appendix IV. 1). which corresponds to condensation effects being just detectableat a frostpoint of -370C with an initial total temperature of 470C. It is assumedthat the wet air expands isentropically throul the nozzle until condensation occurs,and that the density and teaperature of the small quantity of water vapour presontvery directly as that of the much larger mans of air. the temperature Test atwhich the vapour is Just saturated may then bd found for any stagnation vapour densityby oros-plottlng on Pigure IV. 51. With a total temperature Tt of 470C and asAumingan initial vapour density of 0.7 x 10⁶ lb/ft3 (correaponding to a frostpoint of -400C)for the *dry' tunnel, we can calculate M, as follows. I is the quantity of wateradded to the tunnel, wt the density of the water vapour In the settling chamber andT1 the temperature just ahead of the condensation shock.
V t Tsat T1 TI/Tt M 1,
lb lb/ft3 OV OC
2.5 6.3 X t0 -24 -74 0.612 1.745.0 11.8 x 10' -18 -68 0.641 1.677.5 17.3 x 10⁻¹ -13 -63 0.657 1.62
In calculating q it has bent .sumod that all the water vapour is anid-ansed outat the shook, and that ice cryLtals rather than water droplets are formed. so a totallatent heat h of 690 C.H.U./lb has been used. With a total pressure of 0 in. M1g.the density pt of the air in the settling chamber Is 0.0218 lb/ft3 . Since
Sh wt/p t . we have finally:
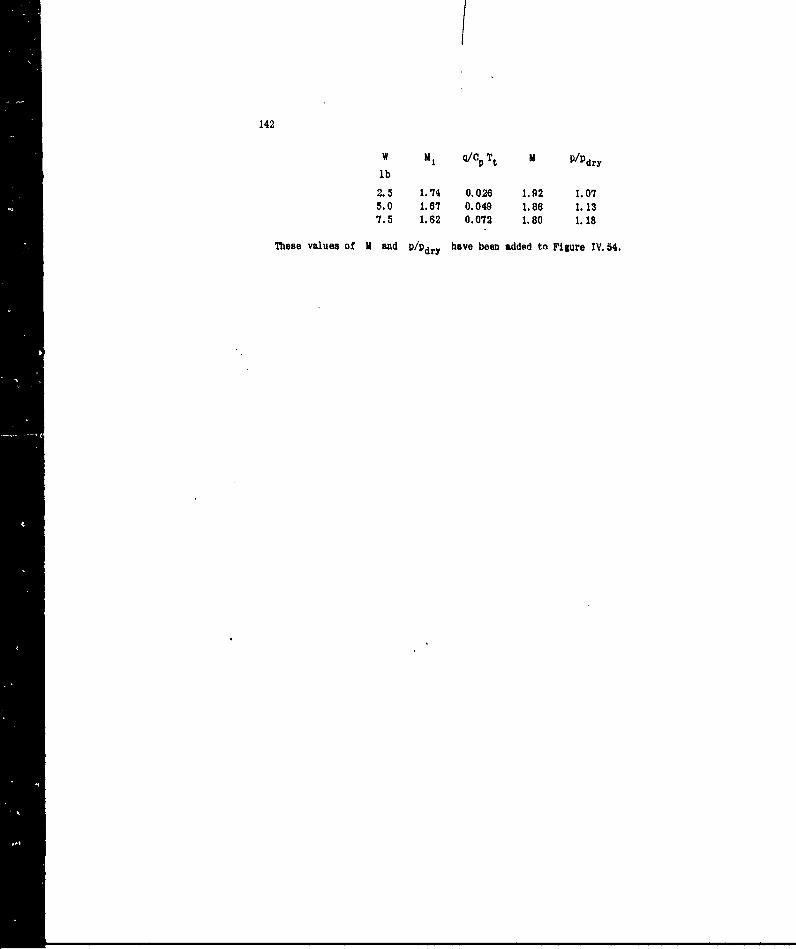
142
w MI q/CV Tt M P/Pdrylb
2.5 1.74 0.026 1.92 1.075.0 1.67 0.049 1.86 1.137.5 1.62 0.072 1.80 1.18
These values of M and P/Odry have been added to Fi1gure TV. 54.
143
LIST OF REFERENCES IN PART IV
IV. 1. Allen, H.J. A Study of Effects of Ytscosity on Flow Over SlenderPerkins, E.W. Inclined Bodies of Revolution. NACA Report 1048, 1951.
IV. 2 Gopcynaki, J.P. An Experimental Investigation of the Flow P'henomenaOver Bodies at High Angles uf Attack at M = 2.01.NACA./TIB 4848. Oct. 1955.
TV. 3. Hall, I.M, Exporiments with Inclined Blwit'.Nosed Bodies atet tlii Al. =2.45. ARC 19.479, F.M.2574, Aug. 1957.
IV. 4. Jorgensen. L.H. Elliptic Cones Alone and With Wingu ntt .SuersottieSpeeds. NACA Tech. Note 4045, Oct. 11~
IV. 5. Jorgensen. L. H. Inclined Bodites of Various Gross-Sctions at Su~pertonicSpeeds. NAATIL 6245. Nov. 19O8.
IV. 6. Morris. D.E. 4ibration of the low in the Ior..ing Sec tioy of thc3 ft x 3 ft Tunnel. National Aeronautical EstablialMeat.P.251. Sept. 1984.
IV. 7. Ho8duzi, C. D. Umjdbook of Chemis try MWd Phystes, 39th 911tion,(Sdltor) 1957 - 19%8. Cheical mibe NubIahlng Co., Clevistd.
IV. . Middleton. W.LL Visibility in Meteotology. Chapter 11. 2d Witioa.Ue1ter.1ty of Tormnto Press.
TV. 9. good. L W. Physical (4rt ice. 2nd Ilwiiv. The Maem"XIuzt O,.low York. 1911.
IV. 10. Stodols. A. Steaim end Gis turbtaos. %'W.! 1. dition,MOM-1011. 1427, PP,123-4.
IV. 11. Masoa. LJ. 7he ftystcs of ('NMIds. Onaoter IV, &aoction 4.3Claroan Preso, Oxtbrd. 1937.
IV. 12. sender. A. &zperseeuraft on tn th* 4xwitaneous foratimv of NucetIakdbhler, 0. in later Vapur. NACA Tc,. No. IM3, Wy. 1953,
V.13. Oaetltod. I. Forsattn of FoG tn fi Ta.unels ttd its InfI, ence onth.e Investilaticn of "1o4. Uaoill"Oahd WA Repcft.ARC 1134S.
IV. 14. Mo wan. IL . Tesis of lfuatdity ffecis an Flow ti o 'Wind Tunnel atMach Niaabera betvienl 2.4 Vt.~d 4. ARC Curret. PallorMe. 247. 1430.
TV.5 ISqtuir*. L.C. An EV.#rtAefal Ittesttn gmt of ft # OAirurjittc-t ofat .1ii ,&*e ilnt and CA*& -ed kv N I ta wings ,I At h ,Nzw.beri
from 0.70 to 2.0. OnPublialod WOA port. ARC 23110.
144
IV. 16. Stanbrook, A. Experimental Observation of Vor:, "es in Win&-BodyJanctionl. ARC R & M 3114, 195.
IV. it. cnl. J.RPW. The Effeji of Huidity on JLaminar Recovery TemeratureMeasuarents in Supersonic Flow of Air in Wzind Tuneis.ARC It At1 3215.
tIV. 18. lauert. N. A Method W Constructing the Paths of Raindrops ofDifferent Di eters moving in the Neigtbetrwe of01) a Circular Gylinder, (2) an Aerofoil, Placed in a(Miform Strea of Air: and a Deteraination of the Rateof Doposit of the Prop, an the Surface ad the Percentagtof Drop4 Caught. AC R a 2025. Nov. 140.
TV, 19, 1konsehL&L A Me vh4 for Daersvin Cioutbroplet Imlp fnj~assnn o*,&-opt ivtgs, NACA Torl. ftte 2931. Apr1l 1953.
IV, 2 . twrs . kt. Criterito for Condensation-Free Flow in Nprswiqushoc, ,L 7w"ie ls. NA Ich. R t &S 2818, Dae. I981.
IVA. L o14necw. U.J. G-n pt ion Lffets I and A .ir Dry ing ,ts om fot&pereOAnc Wind TWMIS. AcI JUXT IflG.
-- .. . "~~~.1, .. ..- "
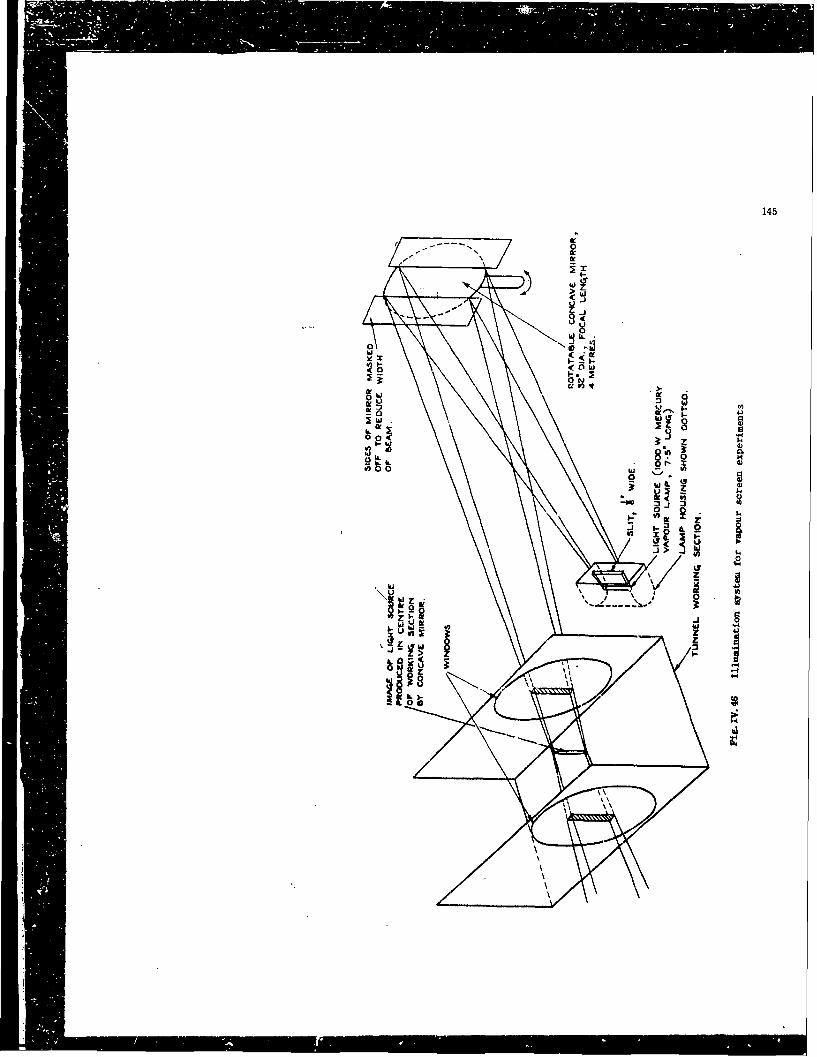
145
I ii(00
hih
00
;I o oWi - Iv-
(I42
000
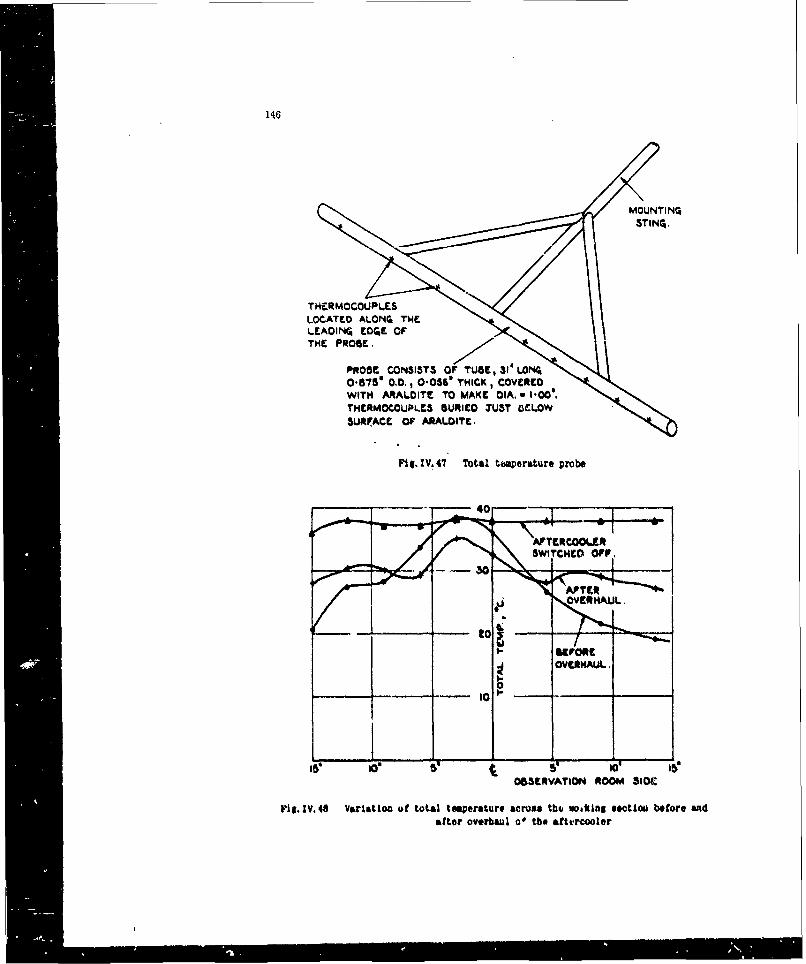
146
THERMOCOUPLECSLOCATEO ALONG T14ELEAGINQ ECOE OFTHE PROBE.
Fig. IV, 47 Total temperature probe
0
S IS
OBSERVATION ROOM 310C
Fig. IV. 48 Variation of total temperature across tht voilking section before andafter overhaul o' tbe afttreooler
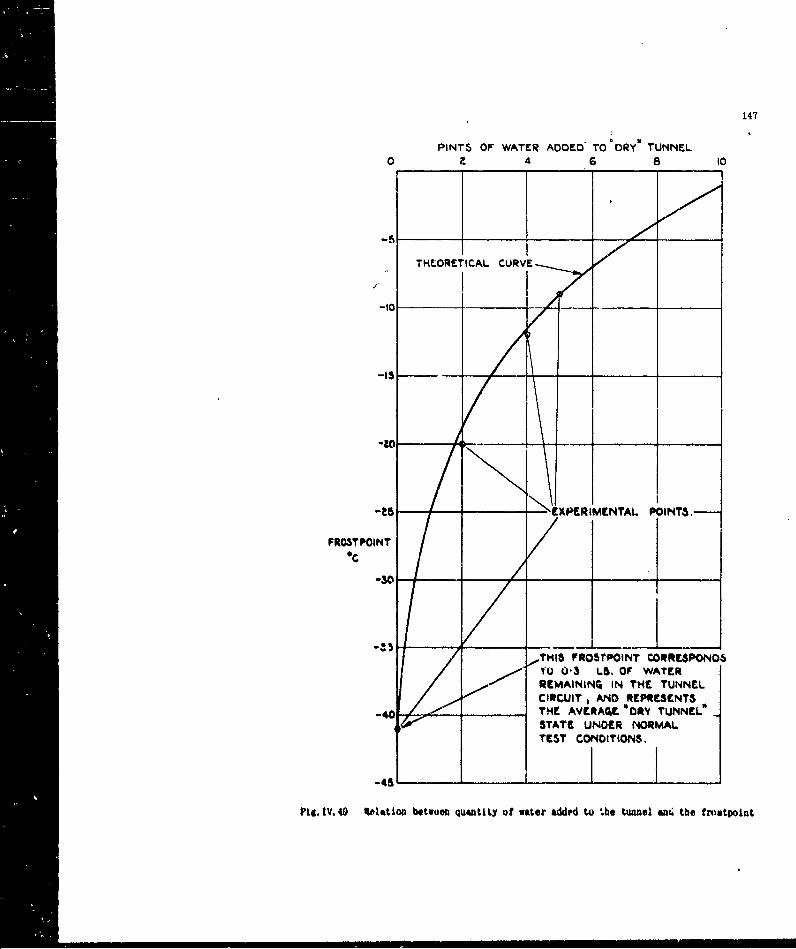
147
PINTS OF WATER ADDEO* TO" DRY" TUNNEL
E XC)PRIMENTAL PINTS,
FROSTPOINT
TMa ~FfOSVIOINT CORRESPONDSYQ 0,3 LbS. Of WATERREMAINING4 IN TH4E TUNNEL
COUTAND REPRESENTS,40,VF THE AVERtAr* 'DRY TUNNEL"
STATE UNDER NORMALTEST CONDITION6.
_ _3 A_ _ _. I IPit.!V.49 1110stion betwoma qumntlLy of water addcd to .he tunnel azu. the trioatpoint
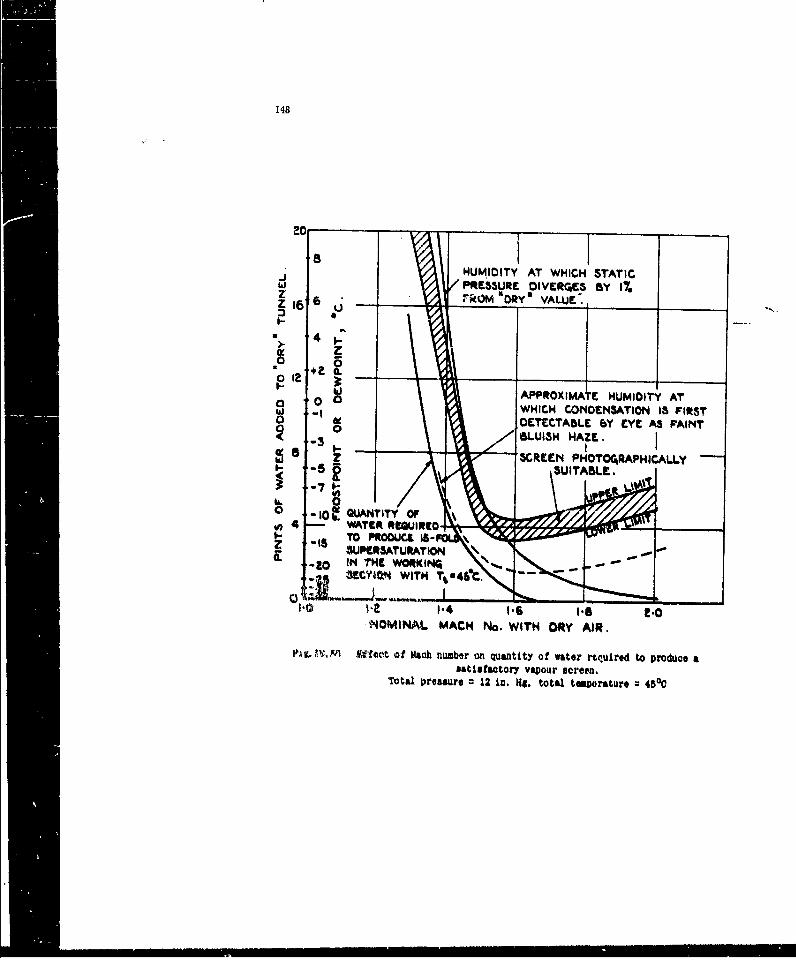
148
8 IlIUMIOITY AT WHICH STATIC
hi P"RESSURE OIVERE By 1%Z 16 6 rkom DRY VALUE.____ ___
I-
). 4 I0: z
0 i APPROXIMATE HUMIOITY Ao 0 0 WHICH C/ONSANTION I3 FIRST0 OETECTAILE by EYE AS FAINT
SCREEN PHOT0G4RAPHICALLY
S4 - WATER REGUIRCO
SUM4*~ WITH T.. 4 &l.
N4OkINAL MACH No. WITH DRY AIR.
t'~g.~V. -ftfac~t of Mitch number on quantity of water reulred to Producoe asatisfactory vapour screen.
Total Pressure. 12 in. HS. total toporature 450C
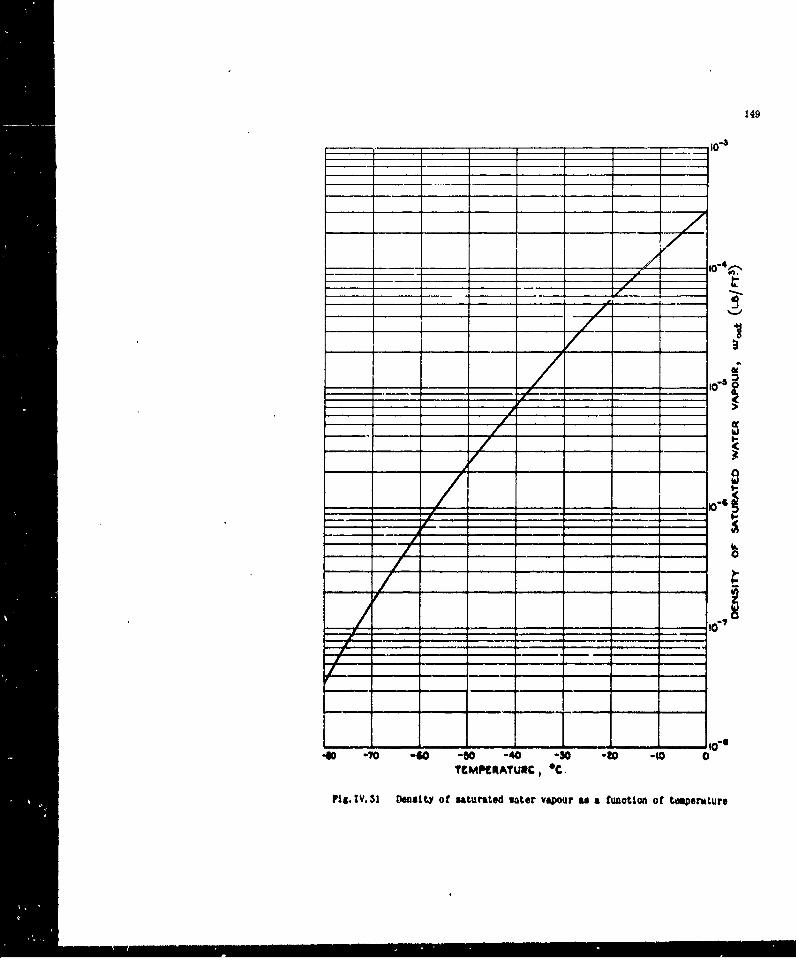
149
:al
TEMPCATU~t, &C.
Plg.VS1Density of aturated water vapour us a function ot tmperaturo
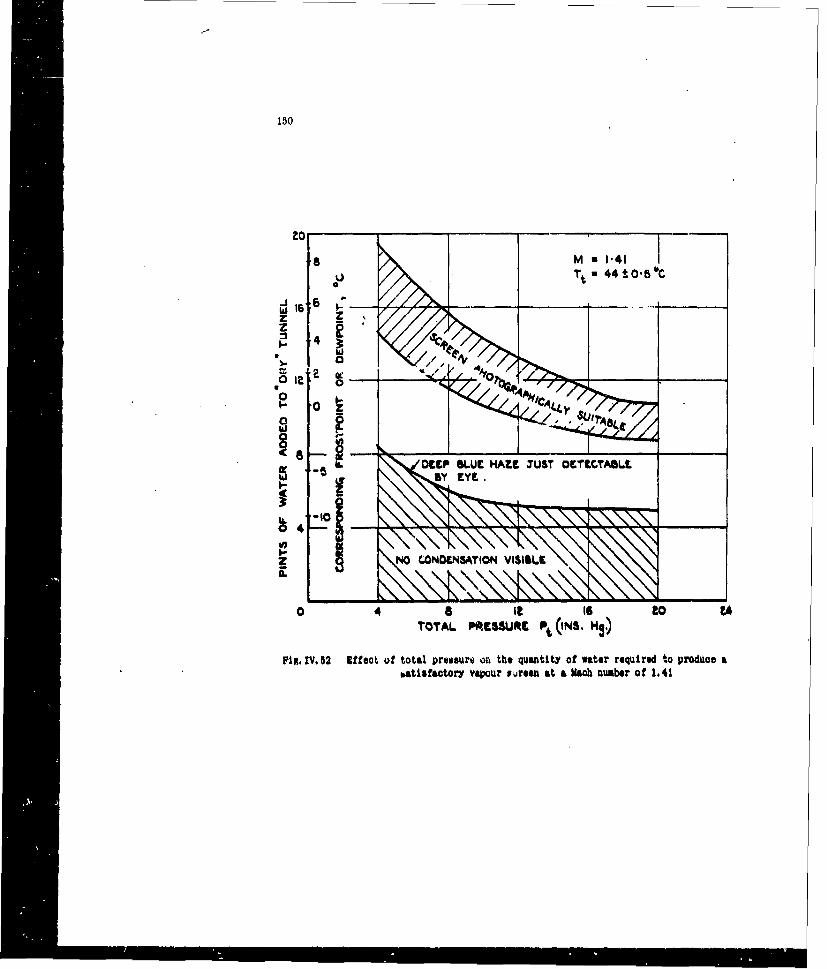
150
zs Mu 141
uTtu 44tO.&"C
z~-4
SV
oz
- , /OECP tLUr HAZE ZUST OCECTAOLL
0 4
NO CONOCNIAION VISISLE
0 4 5I
To-rAL POISSURE Pt(INS. 143)
Pix. IV. 52 Effet~ of total preuauri on the quantity of water required to produce abatisfactory vapur r~reen at a Mach number of 1.41
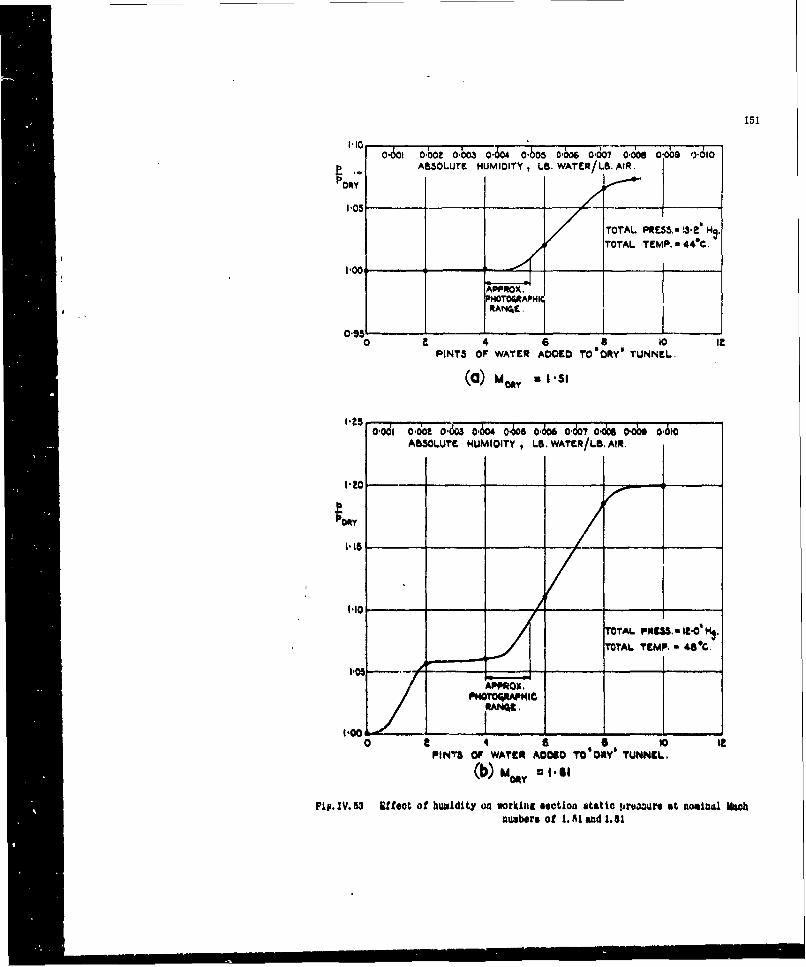
151
o..o6 o.oz o.o. 0o4 oS0.-oo o.o7 o.doe o a0 1>ooABSOLUTE HUMIOITY, LB WATER/LB. AIR.
TOTAL PRE3.-I'~ MI.TOTAL TEMP. - 440C.
1.00___ _ _
APPROX.'.HOTOr* wIC
O.951 10o 4 6 a 10 it
PINTS OF WATER AOOEO TO 'DRY' TUNNEL,
(a) Mo0 .,. * '
1 odiooo - o6oo o040 0 *do, oo o o0o o610AB3OLUTE HUMIOITY , LB. WATER/LB. AIR.- /t
TOTAL P*U. It.O' 14.TOTAL. TEMP. * 48*C.
0 -, 2 6 It
PINTS O WATER AO0O TOWIYW TUNNL.,
(b) MoRy a I. I
Fi. IV. 53 Effect of humidity on working section static pr3oaure at nomial Machnusbers of 1.51 and 1.81
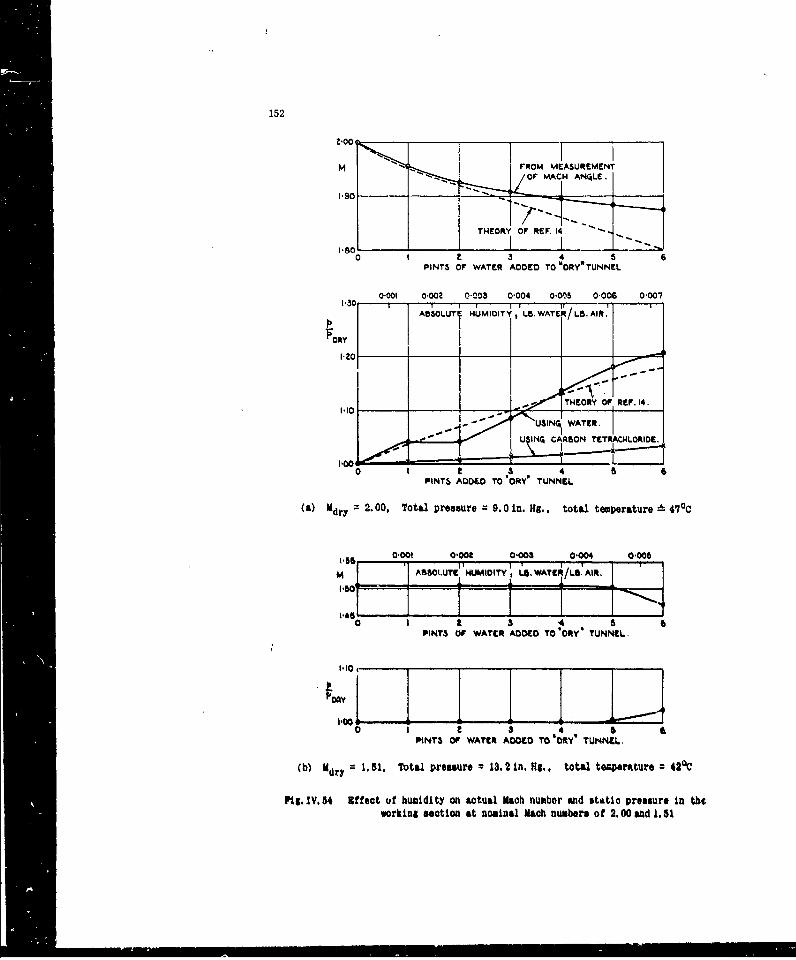
152
1-001
.90 "°° l :--T --THEORY OF EF 4 ""
0 1 I 3 4 S 6
PINT3 OF WATER AOOEO TO'ORY'TUNNEL
0.001 0.002 0.003 0-004 0*05s 0'006 0'007
A53OLUTE HUMIOIT , LS.WATE[/LB.AIR.
_-0-m .- THEORY' 01' REP. 14.
S0 1 t 3 4 5 6
PINTS ADOEO TO 'ORY' TUNNL
(a) Udry 2.00, Total pressure = 9.0 in. Hg., total temperature-- 47C0
0. 001 OOt 0,003 o004 0.0001-5 1 1,
iMI ASSOLUTE HUMIDITY, L.WATCA/LS.AIR.
0 . 4 0PINT& OF WATER ADODl TO RYay TUNNItL.
1.10,
0 I e 3 4 a 1PINTS OP WATCI AOOD TO 'RY* TUNNEL.
(b) Mdry = 1,51. Total preuure = 13.2 In. Hg., total teerture = 42 0 C
Pig. IV.54 Effect of humidity on actual Mach numbor and static pressure In theworking section at nominal Mach numbers of 2. 00 and 1.51
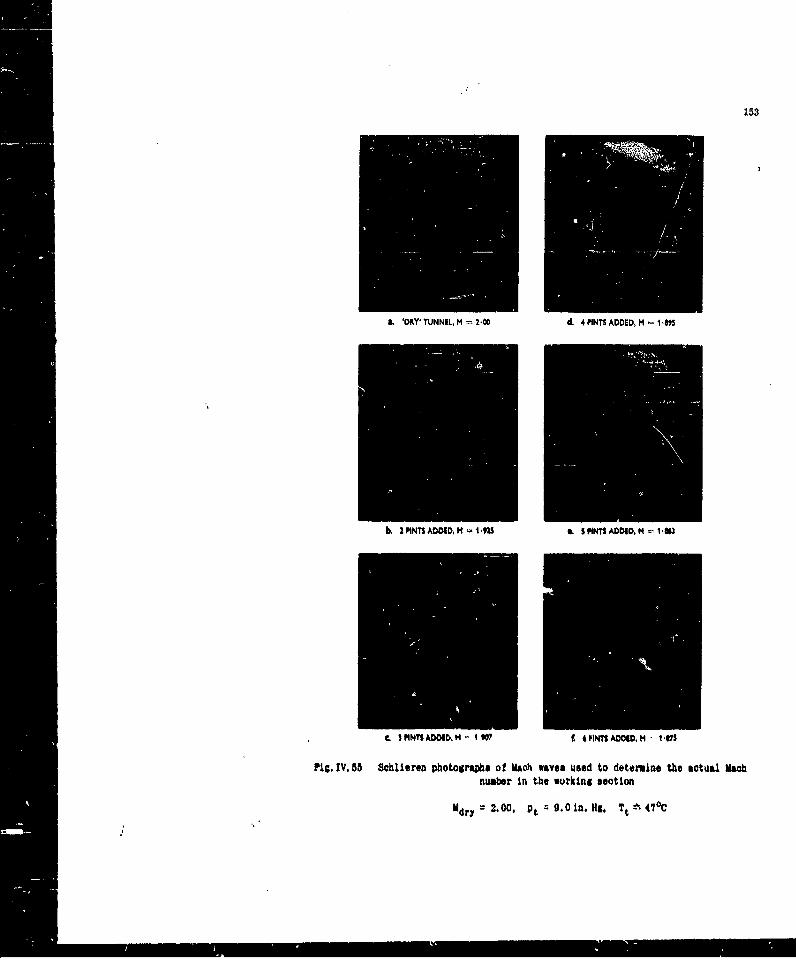
153
L 'DRY' TUNNEL, M =200 d. 4 PINTS ADDED, M = 1,095
b. 2PINTSADDD,N=1423 t, SPINTSADDID, M NIII
. SPINTSADOM o N 1W f. AN IAOOM, M - I S
Pig. IV. 55 Schlileren photograWhs of Mach waves used to determine the actual Machnumber in the working section
dr 11 2.00. pt = 9.0 in. H1, Tt h 47 0C
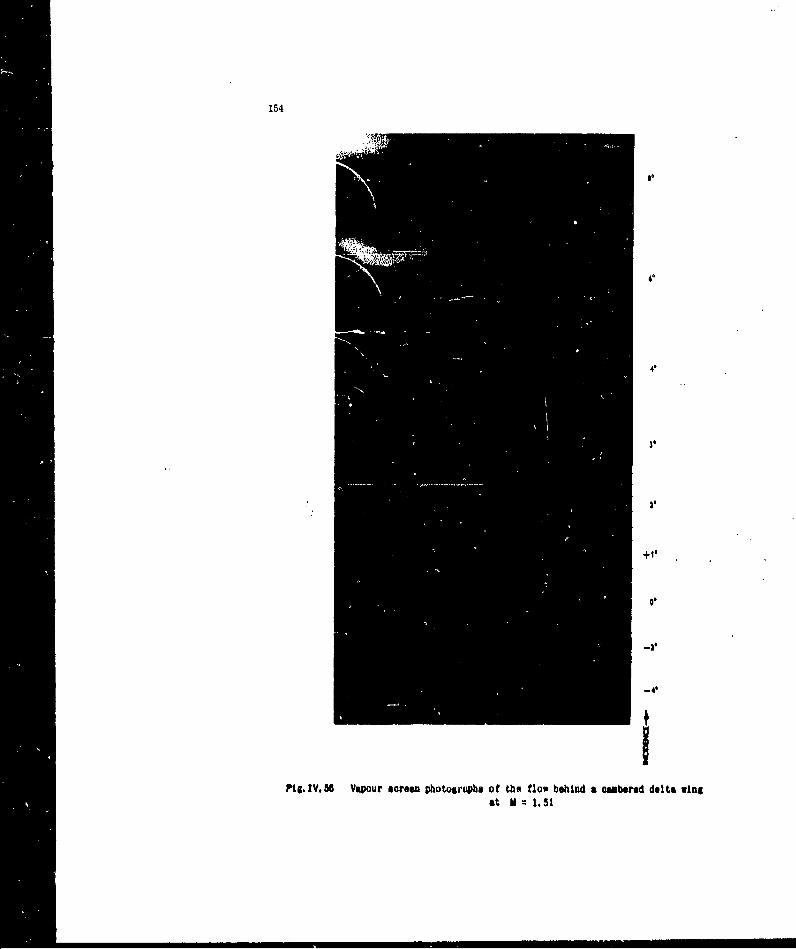
154
*
Fig.IV. 6 V~ourscren phtogrb f th flo behnd camereddea wn
at m 1.4,
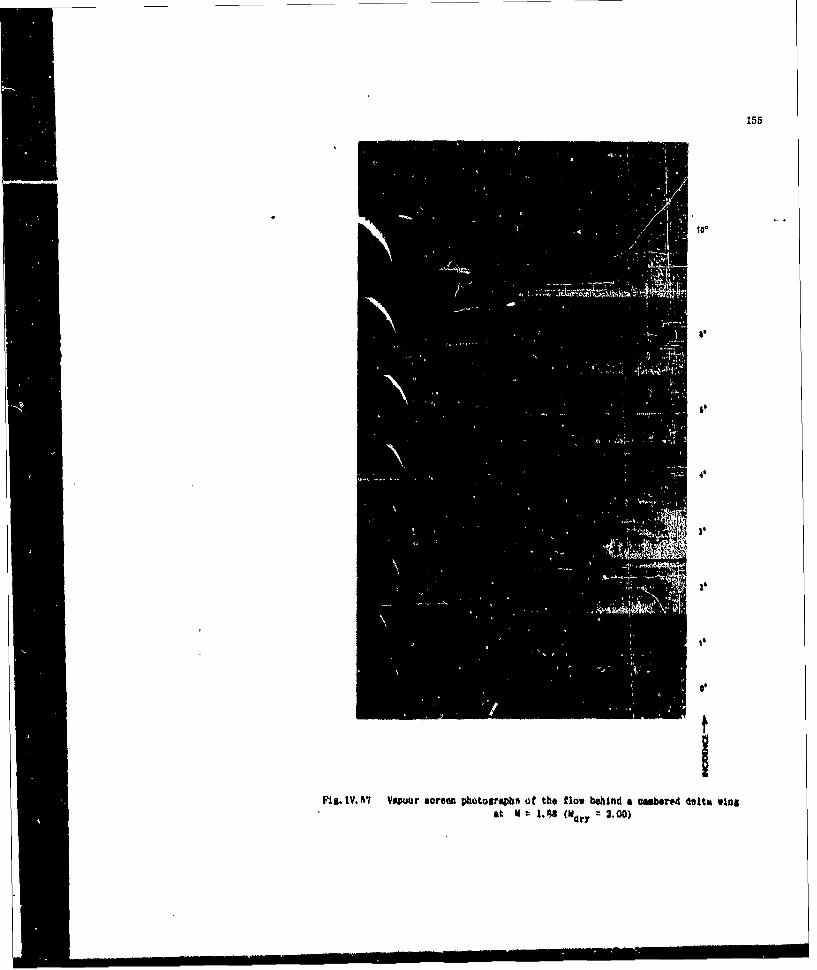
155
10
34
Pis. I V. K7 Vapour soreen photograpbwn of the flow behind a oamber#4 461t& winsat 1 .R PA N 2. 00)
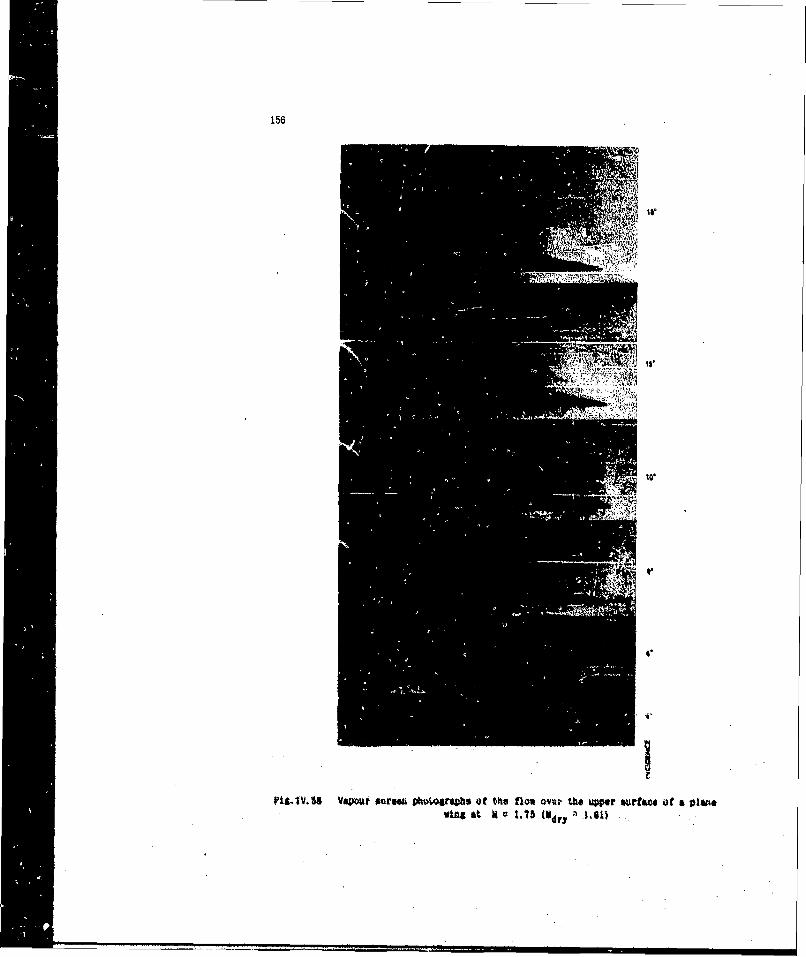
156
fit IV U apor sre"phvtimoobs ot the nlow om~ th* upor burtom af a vivo.Wing at U~ LIs (r -1.4)
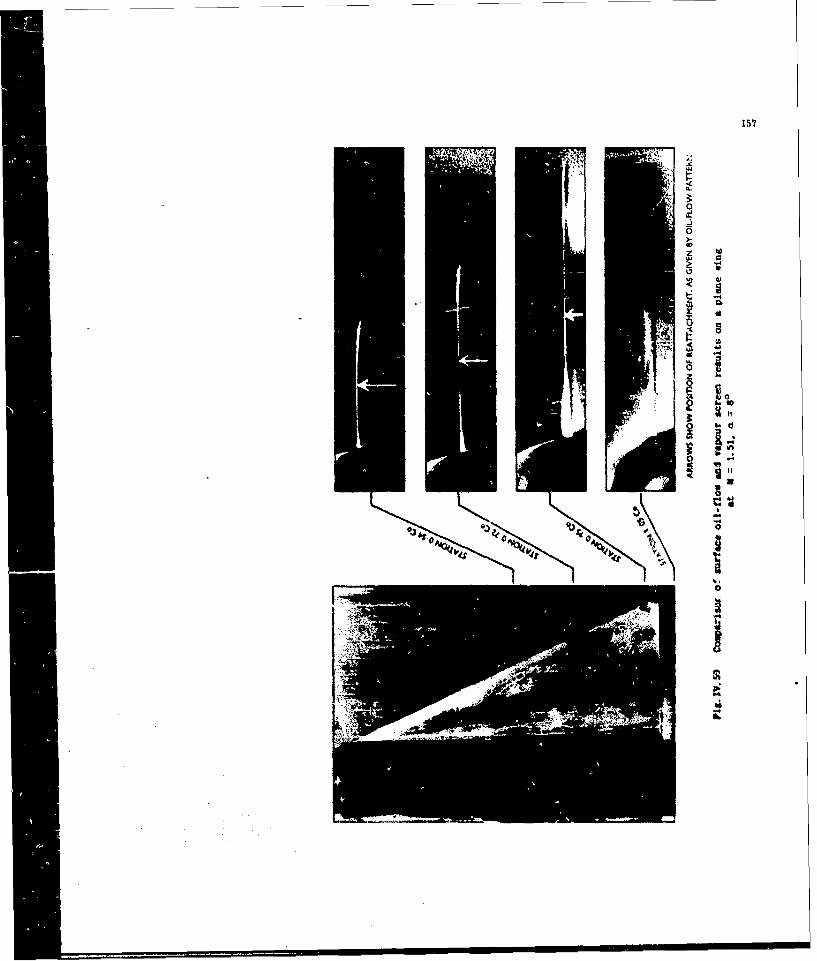
157
F00
b. t
ia -
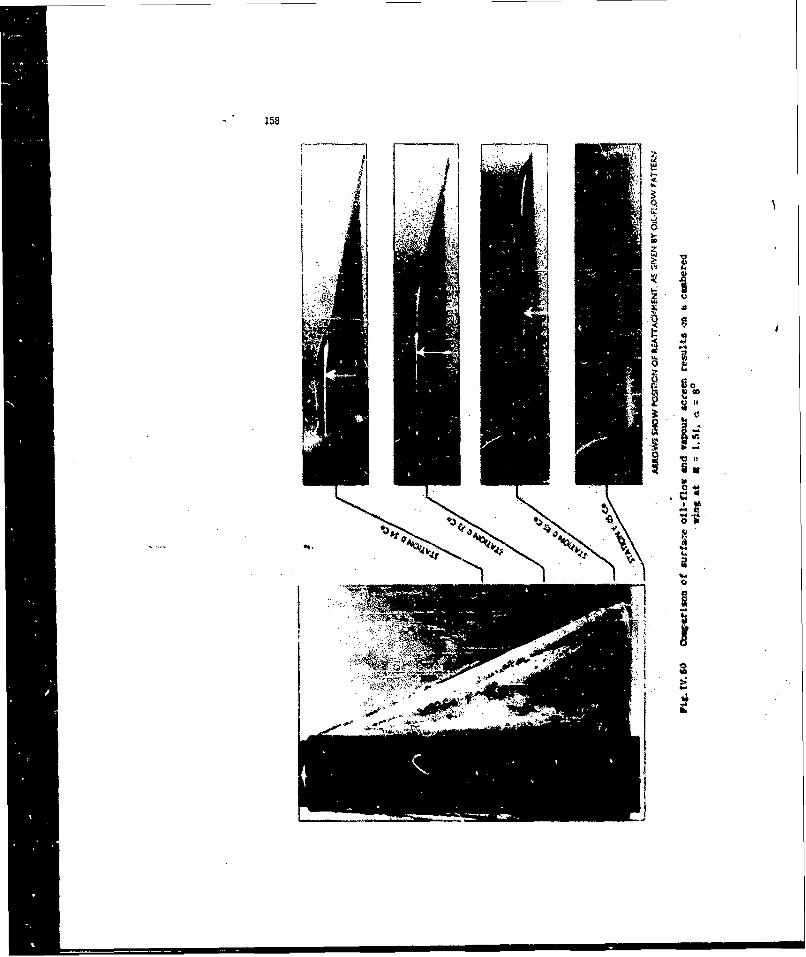
258
71 I
* I *
-40.1
I~.J t..
UzU,z i
j
2~ go
~
* ~
~
a
j
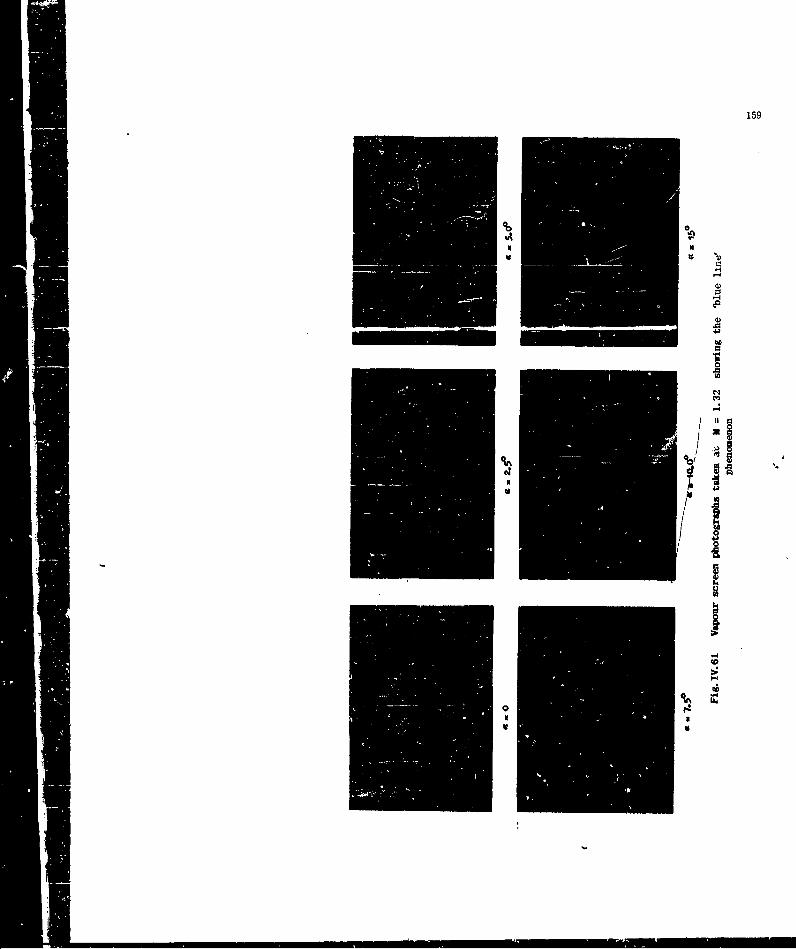
159
* N
J-
to
02
.0Co
:C
91% i ... ..
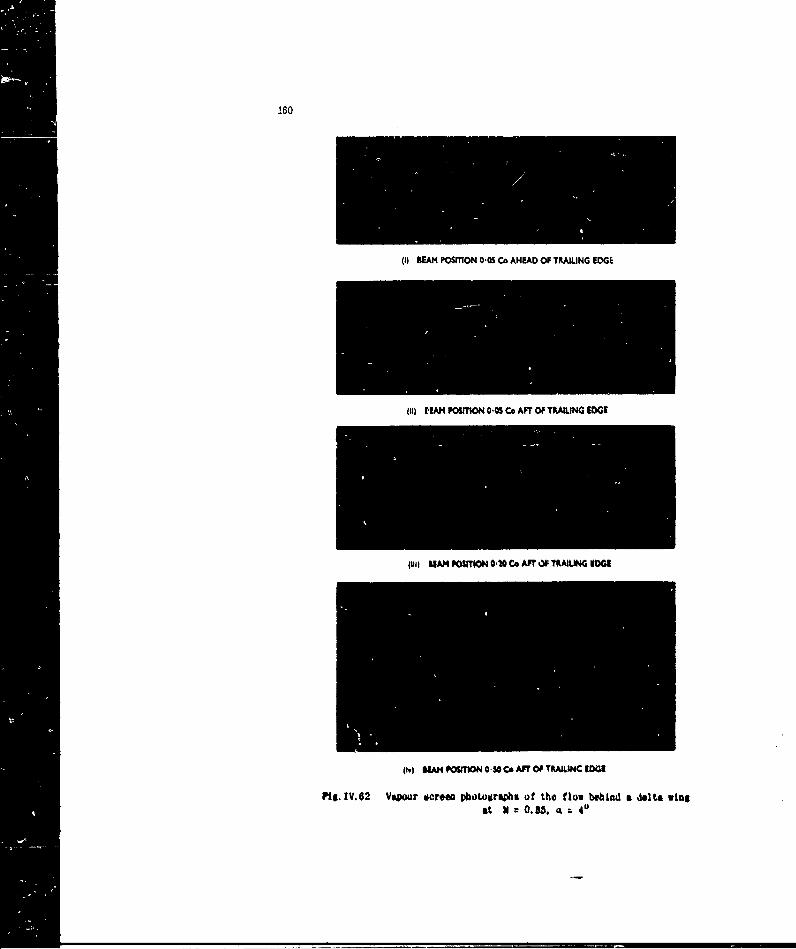
160
(1IRAM POSMTON 0-O5 Co AHEIAD OF TILING EDGE
(11) NAK POSITON .05 CO AFT OF TRAILING EDGE
(PI) NtAM POIION 0,20 Co AFT OF TRAILWI MMG
(1,) SIAM POSIONO05CC&AFT OP TPAIINC LOG
Fig. IV.62 Vapouzr ston photographs of tho flow behaind a delta wingat V 0.185. 4(0
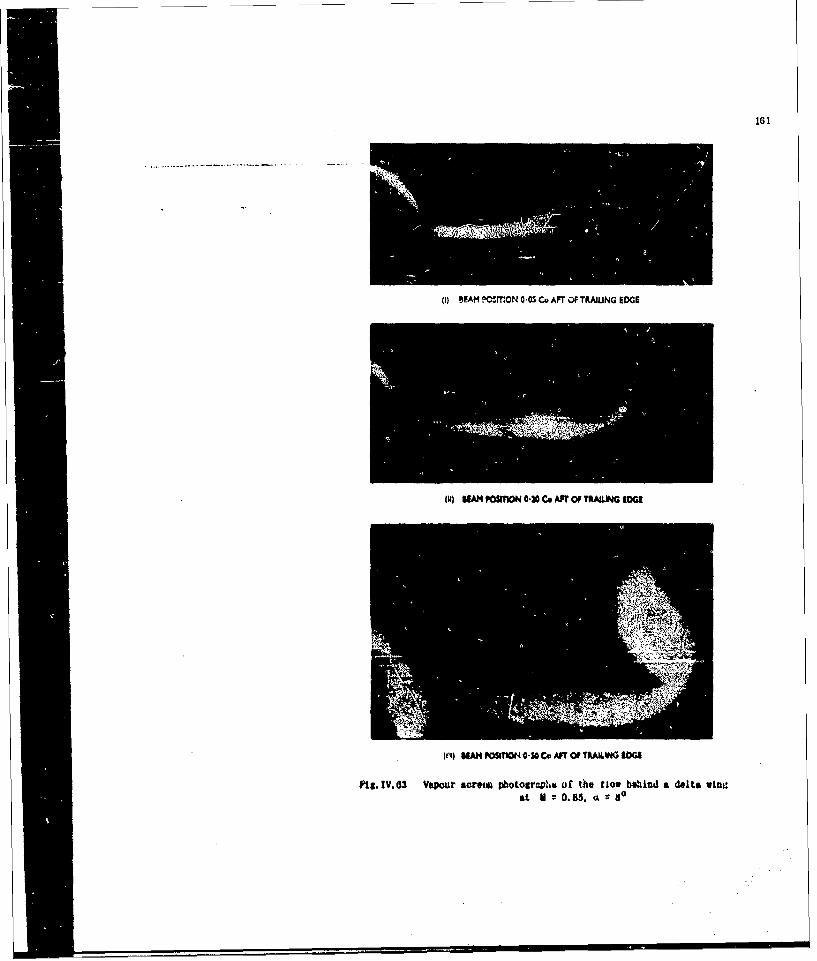
161
pI) BEAM PcerNw0-0SCcAFTOF TtALING EDGE
(mt umE nN P011W 46C.AFrT RANX0 06
piQ $EAN P06111040MjCpAFT#fAtiIGbG
pis. IV. 63 Vapour scoi photOgrovlhs Of the flow btdnud a dolta wing*kt M 0. 85, g so
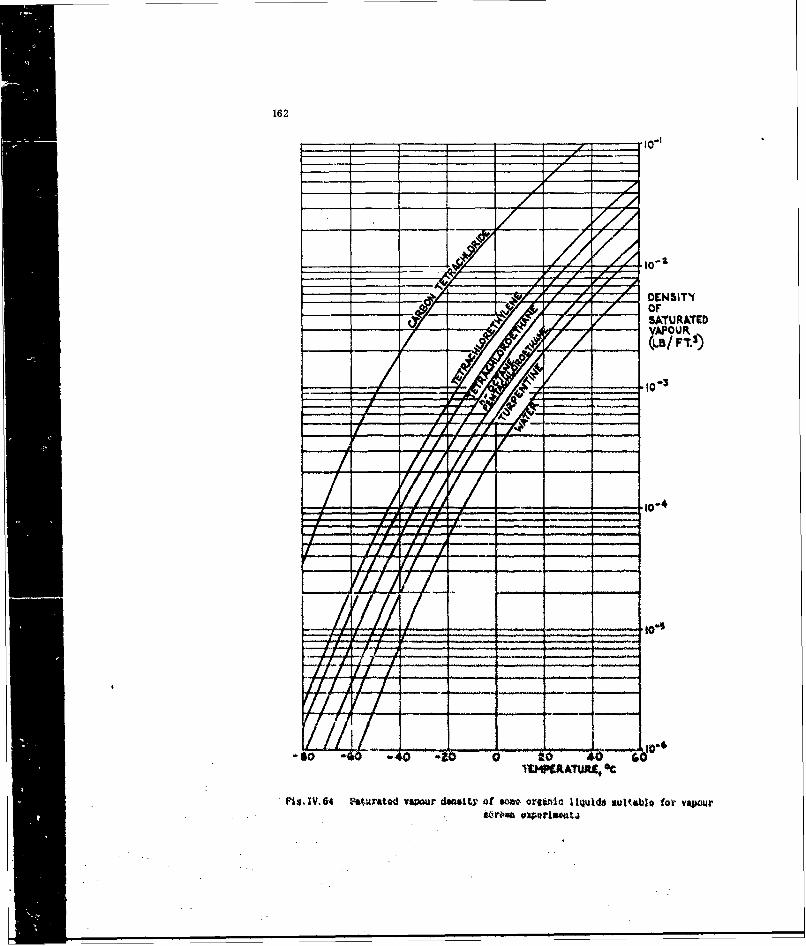
162
zz Ato-z
DENSITYf______OF
SATURATED
__AL_ FTp.3)
10-
Pisjj.IV. 84 ft~rittad vvNaur d*oIf. "u! Or at~c I iQuls mla eiIto for' vwOur
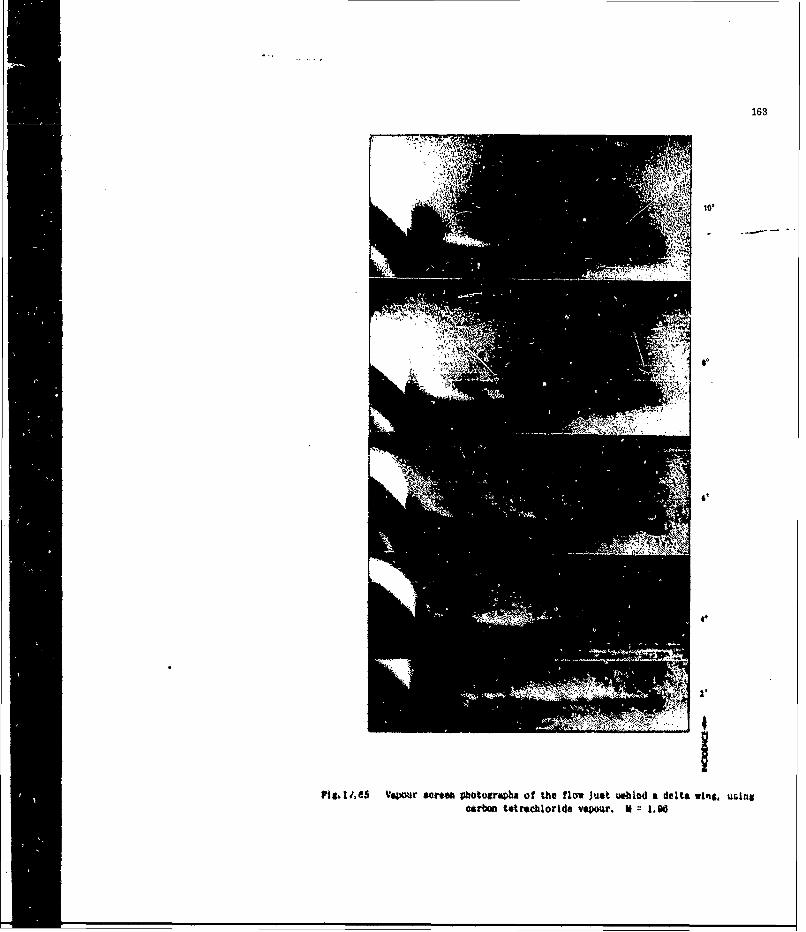
163
10,
Pic I i6 S Vapour scrtm O*btopraha of the flow Jut Wb~ind a delta wing,~ uranscarbon tetrachloride ve~mr. V = 190
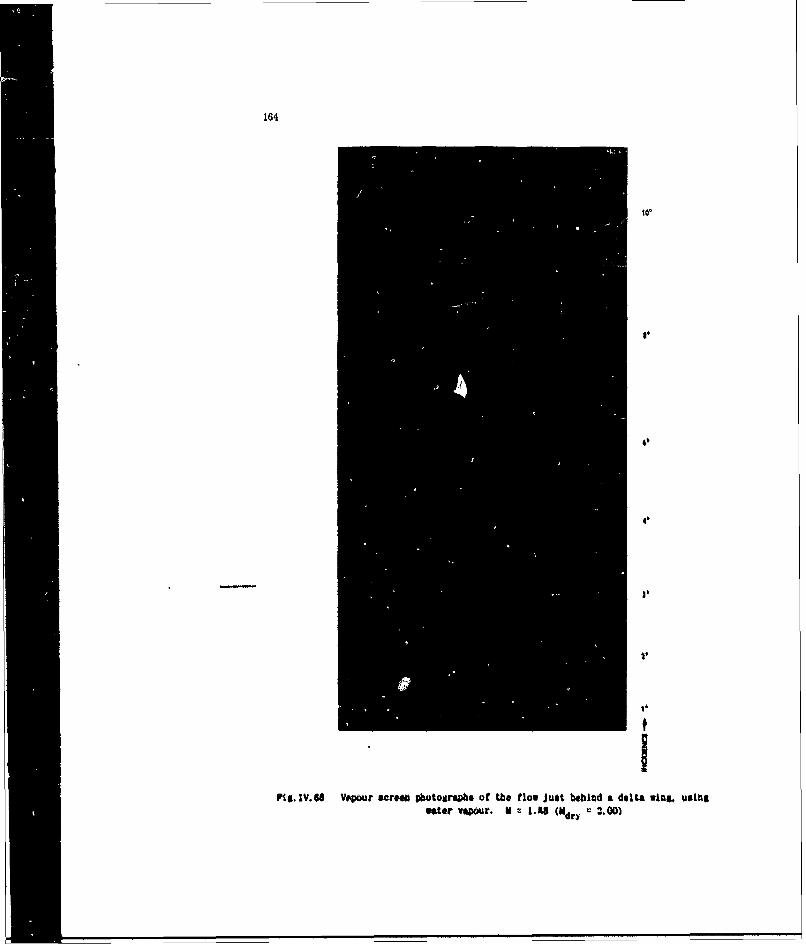
164
-it IV100vu ce btgrpeo h lwJs obn et ig snntorvav r. m= 148 (dryL 2 00
PART V
BIBLIOGRAPHY
166
CONTENTS
Page
V.1 INTRODUCTION 167
V.2 GENERAL REFERENCES 167
V.3 METHODS USING DRY ICE 168
V.4 METHODS USING OUST AND BALSA DUST 168
V,3 METHODS USING ELECTRIC SPARKS 168
V.6 METHODS USING OIL FLOW 169
V.1 METHODS USING SMOKE 170
V.9 METHODS tiSING TUFTS 178
V.9 METNODS USING VAPOURt SCREEN 175
V-10 TRANSITION MEASUREMENT I 76
167
PART V. BIBLIOG.APHY
V.1 INTRODUCTION
In Parts I to IV of this AGARDograph references .re made to papers which beardirectly on the subjects being discussed. These papers are listed at the end of eachsection. The list of papers given in the Bibliography is intended to give referencesover the whole range of indicator flow visualization techniques and particularlythose techniques which are too well established to be dealt with in the text. Itdoes not seem appropriate to attempt an exhaustive list in a paper with this titlebut a representative selectinn of papers in English has been chosen together with afew in other languages where they are known to contain additional information.
V.2 GENERAL REFERENCES
B. I July 1932Gough, M.N. and Johnson, E.Methods of Yinally Determning the Air Flow Around Atrplanee.NACA TN 425.(Streamera, lampblack and kerosene, fine powder and smoke)
5. 2 1933
Clark. K.W.Moethuds of Visualising Airflow with Observations on SeverO Airfoils inthe Wind 74mel,ARC 9 & 9 1532,(Tufts, smoke, chalk, lamblack and Lockspelsor' a method of absorbentpaper, lead hydroxide and sasolut sulpaldol
8. 2 1938Goldstein, 8. (Editor)Modern D&evloaento in Fluid bynanic, Vai.1. pp. 28-0 2.Oxford, Clararou Pros. 1938.
S. 4 November 1946Preston. JH.Visualization of unary Itayer Fbow.ARC R A U 2207, ARC 10,094.
8. 5 1952Pankhurst, A.C. and Holder. D.W.Wind Twnel Technigut: An Account of &Iprcaaeatal dizodas ta Lou ondil&h .Jeed Wn Tnnel.Piteau LmdoA. 19532.
B. 0 June 19S3BalInt. 2.Techniques of Flow gVsutlticttion: A Discussttn of the Fuidaam talt wtthatsWe *I ocftntques Used in Research.
Airraftt [.gLn..ring a (1WI) Jun*. tp. 161- 107.
168
B. 7 August 1955Perry, C.C.Visual Flow Analysis.Product Engineering August 1955, pp. 154- 161.
V.3 METHODS USING DRY ICE
B. 8 December 1953Sellerio, A.lapiego del Qhiaccio Secco nella Visualizzasione delle Corrent i d'Aria.(On the Use of Dry Ice for the Visualization of Atr Streas.)L'Aeroteonioa ;1 (195.1) 6 (December).. pp.398 -400.
V.4 METHODS USING DUST AND BALSA DUST
B. 9 Novemher 1950Taylor, M. K.A Beala-D ,t Technique for Airflow Visalisation md its 4pplication toFlow Through Model Helictopter Rotor* in Static 7hrust.NACA 7N 2220.
B,10 April 1955Smith, A.MH. 0. and Murphy, J. S.A Duet Method for Locating the Separation Point.Journma of the Aeronautical Scieno 21 (I5) 4 (April). pp.273. 274.
V.5 METHODS USING ELECTRIC SPARKS
5. 11 Jmnuary 1950Saheki, Y.( the Meaeureaent of Rtnd (Thnntl) Velocity (Dieribuitions) by theElectric Spark Method.National Research Oomoll. Coawa. Tech. T analatloo No. IT-100.(TIL No. P. 34167)
8. 12 January 1956Someiburg, N.J.A Method for the Meauremet of the Flow of Air by Mt... of a &rei. ofElectric Sparks.Maryland Univ. TN ON 68.A.R TN 95-3 . ALiTIA AD 6050, (TIL No.P.64M7).
IL 13 July 1957Hersog. J. and Wake, J. I.(areeer. tics of 0e Technique of Aerod)vwic Ineetigation by Memsof d'ectrc Speo..Mioyland Upiv. IN ON 105. U.S.A. A IN 57-31W. ASTIA AD 122.432.
169
B. 14 *%ril 1958Weake, J.R.Application of the Electric Spark Method to the Investigation of
Transonic Flow Past Airfoils and Airfoil Grids.
Maryland Univ. TN BN 128. U.S.A. AFSR 17 .58-304. ASTIA AD 154,214.
B. 15 January 1959Bomelburg. H.J., Herzog, J. and Weake, J.R.The Electric Spark Method for Qjantitoaive Measurements in Flowing Gases.
Maryland Univ. TN BN 157, U.S.A. AP(MR TN 59-273.ASTIA AD 212,707 (1Zo, ?.P.77300).
V.6 METHODS USING OIL FLOW
B.16 October 1938Abbott. I.H. and Sherman, A.Flow Observations with Tufts "I Lwpbiack of the StolIin# of FourTypical Airfoil Sections in the NAC4 Vartable#.-nsity Timel.NAOA 7N4 72.
B.17 Juue W VOosM, G.r, and Hills.,
ViaualuatiL, of the Flow at the Stoll on Vud Tuiel NoJel,.Uaublished VDA Uport AK 13899,(White oil, sodium iuabox oil - Duckhes 41 400 it, ud)
8.1 February 19MVMoni, L.R. and Cadwll, J.D.An Oil SprQy Tchniquw &iluble for Visual Trnonti Flow 0ibvarticn..IWIted Aircratt Corp.. U.S.A. W, DePt. Rot R-141074-ll.
6. 10 september IONRlaes, A. LSon* Note# on the Flow Pat terns Obse. ved over Various &epthack Wiigeat Low Mach N. (in the I.A.E. 10 x 7 ft tHi& peed Tu#eL).AN 17067. Vpubli0ed VDA Uwort.(TimoUa oxide techitQue)
L 20 October 1054Johavon, IL 1, md Imtall. LO.A Preiiainry Fiidt nue etipot~on of m O,1Flow Tectnique for Ar4l wVisuiaisotion.NACAl/4472. ,ALA 1I L414.4
.21 October 19S0ammechi. E,Boundary Layer Flw Vituolisattko teats in a Low. Velocity #&Ad TWWL.(In Italian).L' Arot.ecnica 36 (1956) S (Octobe4 pp.31S- 32.(Keroma* - arboh blaft)
8.22 1957Persoz, B. and Orenier, G.Enduits de Visualisatiton a Base de Corps Gras.La RecviercMv A~ronauti qua No.60 5eotember - October 1957, pp, 19 - 22.(Coating materials whiuh malt at temperatures of 300 or 400C.)
.23 March 1958Ogle, J.8.Mtraorar.dwa on the k~uoresceiat Oil Flows Visualizatiton System.Southern Cal'farvia Co-optuaive Wind Tutmel Project No.K-323.
*B. 24 MArch 1959Loving. 0. L. end Kataoff. 5,The Fluorescent-Oil Film Methed and Other Techniques for' Bowadary-LayerFlow visultzation.MAS/'IL/6310, NASA Mewo, 3-17-59L. AR~C 21W89.
*,Z August 1959Cartr. Lu".*vdel ,Uwaj in Mhe ARA Cdoperative Wnd Tumvi.ARA NY Nott 9
Th~e Akvo of g Phin Oil Shett under tir Niuadwsy toyer vft a &Joum Ftuld MeaaM. Val.11, M98. Pt 2, Juno,
17~ *July190
An Exportatn el S ta4 of th# (lwcin4 Inter ton Betveen a %ior* lo6ean Ihrb~dent sAkid~y Layar.
I.28 -Aaigust 1900
Pth &wfoce Oitl Pow# 7echique Vied in High fi~d1nd 1hmols.tllabltbod tWA fotep# AkC 22385.
8.9 Autubt 1080
VI.? U1ThOS USINO 810.5
L.30 iJnaar 1925Uryaa.. L.W, wtd Wiliss. D.K.Moctuw-us Flow Around th# EUga of a Bluff 06s tarle.A10 Kt & M M82.(S~k~E It 0.* MAMoalt 40bOt~dt U"4 to vis"Iftz tihe MlO..)
B. S1 I ebruary 1930Simmonds, L. F. G. And Dewey, N. 8.Wind Twunl Experiments with Circulasr Disks.ARC R & M 1334.
IL 32 MY 1930Simmnds, L. F.O~. and Dewey, N,&8Photographic Ileu.ards of-Flow in the Boundary Layer.ARC R &~ H 1335.(Vapouir of volatile liquids, smoke formed through ohernical combinationof two vapours, %An smoke pr'oduced bt thle cheminal action of vapour inthe presence of moist air.)
133 1031Thinner, T.M-)eaent of Smoke in the Bowidcry Layer 2f an Aarofoil Without and IhekSlot,ARC R & V M2
5.31 1932
Ar Flow, With Lkam~strateons n4. te Screen by Mewts of o,Royal Aonatl1#.s' aloty Jloual.3 (19U2) pp.451 -472.
ApO teat (on it N~ kith&); dos ii liti Ae AWd a "Eitude do# Quaw,
Pub~3eatlobs o e t TobuiQiues J%4 Uiknist~r* do P' Air We, 128.
1Appif h, A.Rlesult, from 4he Lieutan%, Forschungswuotalt flit Sege If tag %akv Thiivl.
"I ti ant.t± Steoety Jot ,va1 43 (1939) Saptabor. pp.5 6W-072,
4.37 1943'Otet. JAC Aa &u**tint. N.W.
w .;ivke a 4 .s -twt of Vtsua-ti~n *tag udary Layer Flow at Hthg~ Acynalds
*ka al .A~mutieAI ttooky Joumnl 4 (194) 3? (Ittch) po. 93 - 102.
Am Utft-t'd SwaIe Gmertiior for use in the l',sualitat ton c! Airflow.pjimb~~aiov leonnlary f'.-.r Flow at 14ik R*wods Number.OX AItM722. AW 7111.
PXY'fN{,n. J.H ,ir'bam~etl. O.K. and NWie. L.AM fm,rovrd &me.#d of Flow Visual tattao by Rekflecttd* Ltit.
172
B.40 September 1949Brotherhood. P. and Stewart. W.An Experimental Investigation of the Flow through a Helicopter Rotor inF::-:..- d Flight.
ARC R & M 2734.
B.41 March 1950Salter. C.Multiple Jet Ihite Smoke Generators.ARC 10296, 13004. ARW R & M 2657.
L 42 April 1951Meijer Drees. J. and Hlendal. W.P.The Fieid of Flow Through a Helicopter Rotor. Obtained fro* Wind 'runnel
Smoke Tests.NUL. Axtordam, Rep,.rt A.1205.Aircraft Engneorins L3 (1951) 266 (Apr11), pp. 107- 110.
(Describes apparatus used,)
8.43 19524Brown, P.N.M.An Americat ,eIW of Photographing Flow Patterns.
Sond Mlwast tm COnfermnne on Fluid MeohantcN pp. 119- 13.Aircraft Enineerinu 4 (1952) June, . 1 4 - 169.(Using a uoke tunnul.)
5.44 Auust 1952Ileral;. 11., I1sason, A.G. and Costello. OR,A Visualizaion StuJt of Secontdary Flows in scixNACA Report 1183. (orwarly NA Tk(1 /31t (NACA AM ES2P19)
ACA IN 2947. )({WLhoda used are tmoke trmces &iad hydrogea sulfide gu raeting wIth1ed carbonate. it lycerla.)
It S 1953Iflm. D.C. ani Finlay, Hl,&
Operaitnit CAaratertsttc of the 'rincetot ltterotty 14 a 2 ft AokeTLnel.Princeton UWi, DePt. Of Ato. ICOS. Report 225.
5.46 Polor uary 1954
It Thimel a rump, 4#1i' iutttuto 41 Costruaett Armtaawtt deli'Ot.-ttet fit NA.spoh., .rnt.rics 34 (194) I (rbruary). pp.16 - 22.
8.47 19411(noul tan. M.P.
7thorettcal Inestgatmtw n fhc Ptetrautcmatu.ot of L.t ,nefftcet"t t.-t
7-D/a.€ twial .k' Tunnelt,Prieatou Univ. Dept. of Apra. If1s. R ,pot 249.
173
B. 48 1954?Hazen, D.C. and Lehnert, R.F.Smoke Flow Studies (bnducted at Princeton Universtt'.
Princeton Univ.. Dept. Aero. Eng. Report 290. ASTIA AD 63022,
(TIL No. P.830 "5).
B.49 1955Hazen, D.C. and Lehnert, R.P.Operating Characteristics of the Princeton University 2 x 36 ft SmokeTunne 1 .Princeton Univ. Dept. Aero. Eng. Report 299.
B.50 1955Hazen, D. C.Some Results of the Princeton University Smoke Flow VisualizationProgram.Proceedings of the IAS-R.Ae.S. Fifth International Aeronautical
Conference, Los Angeles, 1955,pp.316 - 352.
IAS Preprint 555.
B.51 June 1956
Airflows Studied in Miniature Smoke-Jet Wind Tunnels.
Aero. Digest Jane 1956, pp.25 -39.
B.52 November 1956Maltby, R.L. and Peckham, D.H.Low Speed Flow Studies of the Vortex Patterns above Inclined SlenderBodies Using a New Smoke Technique.Unpublished M.A Report ARC 19541.
B.53 March 1957Bull, G.V. and Jeffery, C.B.Wake Visualization Studtes in the Aeroballistics Range.
Ballistics Res. Lab., U.S.A., Report 1005 pt,1,pp.127 -148.(Flow visualization by the interaction of hydrochloric acid andammonia hydroxide vapours.)
B. 54 October 1957
O'Neill, P..G.Generator Constructed in Metal for Producing Small QUantities of ParaffinSmoke.
NPE, Aero 1340.
B.55 February 1958
Lippiach, A.M.
Flow VLsuatization: An Amplification of the Aothor's Remarks made at theFifth International Aeronaautcal Conference, with Prints taken from Filmsof his .'udies.
Aeronautical Ehgineering Review 17 (1958) 2 (Februaryl, pp.24- 32.
174
B. 56 March 1158Bergh, H. and Berg. B. van denOn the Visualization of Laminar Boundary Loyer Oscillations and the
Transition to Turbulent Flow.
Z. Angew. Math. Phys. 9b (1958) 5/6 (March 25th), pp.97- 104.(Smoke with a stroboscopic light source.)
B.57 May 1958
Voir le sillage.
Air Revue May 1958, pp.272- 273.
(Evaluation of smoke techniiues.)
B. 58 November/December 1958LeManach, J. and Robert, E.Contribution of Visualisation to the Study of Low Velocity Flow in Modelsof Centrifugal Compressors.
MOA TIL/T. 5068. La Recherche Agronautiquo No.67. November- December. 1958,pp. 21 - 34.
(Methods of visualization include Hokftaflon powder floatiu on the surface
for the water compressors and kerosene smoke trail, for the air compressor.)
B.59 June 1959Cox, A.P.,,,, eunts f th.t Velocity at the Vortex Centre on an A.P.I Delta Wing
by Means of Smoke Observations.
ARC CP 511.
Muirhead, J.C.On the Inertial Lag of Tobacco Smoke Particles and the Effect of Small
Orifices on Shock Tube Flows.Suffield, Canada, Tech. Paper 167. (TIL No.P.84154).
B.61 November 1959Goddard, V.P., McLaughlin, J.A. and Brown, P.N.M.Visual Supersonic Flow Pattern, by Means of Smoke Lines.
Journal of the Aero/SpacO Sciences 26 (1959) 11 (November). pp.761- 762.
B. 62 August 19G0Maltby, R.L. and Keating, R.P.A.Flow Visualization tn Low Speed Wind Tunnels: Current British Practice.Unpublished MOA Report ARC 22373.
8.63 1962Maltby, R.L., Engler, P.B. and Keating. R.F.A.Some Measurements of Leading Edge Vortex Poitions on a belta Wing
Oscillating in Heave,Unpublished MOA Report.
B.64 May 1902Maltby, R.L,. and Whitmore, 0.Sm4)kc for Flow Visualtzatt(a, - A Warning.Journal R. Ae. Soc. Vol.66, N:%617, p.3;2f.
175
V.8 METHODS USING TUFTS
B.65 1928Haslam, J.A.G.Wool Tufts: A Direct Method of Discrimiiating Between Steady and TurbulentAirflow over the Wing Surfaces of Aircraft in Flight Applied to Explo-ethe Region of Effect of the Slot on a Bristol Fighter Wing.
ARC R & M 1209.
B.66 1932Melvill Jones, B. and Haslam, J.A.G.Airflow about Stalled and Spining Aeroplaites shoun by Cinematographic
Records of the Mo ements of Wool-Tufts.ARC R & M 1494.
B.67 October 1938Abbott. LH. and Sherman, A..'Fow Ob.grvations v,%th Tufts and Lampblack of the Stalling of Four TypicalAirfoil Sections in the NAqA Variable-Density Turnel.
NACA .I. 672.
B. 69 May 1952rird, J.D. and Riley, DR.Somte Experiments on Visualization of Flow Fields Behind Low-Aspect-RatioWings by Means of a Tuft Grid.
.IACA TN 2674.
8.69 July 1952Bird, J.D.Visualization of F'low Fields by Use of a Tuft Grid Technique,
Journal of the Aeronautical Soienoes 19 (1952) 7 (July), Pp. 481 - 485.
V,9 METHODS USINO VAPOUR SCREEN
1. "0 1951Allen, HJ. and Pcrkins, EW.A Study of Effects of Viscosity on Flow over Slender Inclined Bodies ofRevolution,
NACA Report 1048.
R.71 Angust 1967Hall., I.M., Roges, E.W.E, and Davis, B.M.Experiments with Inclined lunt -Nosed Bodies at Al = 2.45.ARP R & M 126 ARC 19,479.
(Viqvour-soroen tec.niquoa described in Appendix.)
B.72 Augtst 1960McIregor, 1.have lopmer , of the Vapour Sc~een Method of Flow Visualizatton in the 3 ftTunnel at RAE, Iedford.,Jonr. Fluld hieoS, Vol. II. 0..61, Pa 't, 4, 1)",
17G
V. 10 TRANSITION MEASUREMENT
5.73 April 1940
Richards, E.J. and Brown, T.W.Note on Methods of Determitiiig Transition on an Aerofoil in a Wind Tunnel.ARC R & M 205', ARC 4488.
(Lycopodium powder)
P. 74 July 1944Gray, W.E.A Chemical Alethod of Indicating Transition in the Boundary Layer.
ARC 8034. Unpublished MOA Report.(Starch Iodide - sodium thiosulphate - chlorine gas)
B.75 October 1944Gray, W.E, and Pringle, J.E.Note on Observattons of the Boundary Layer on a Fighter with Low DragWings. (King Cobra.)
ARC 8153. Unpublished MOA'4port.
B.76 March 1945Preston, J.H. and Sweetlng, N.R.Experiments on the Measurement of Tranition Position by Chemical Methods.ARC R & M 2014. ARC 8536,
0.77 Junc 1945Pringle, (I.F. and MalW-Smith, J.D.!Boundary Layer Transizion Indicated by Sblimation.
ARX 8892. Unpublished M0A Report.
B,78 August 1945Richarda, F.J. and Burstall, P,H.The China Clay Method of Indicating Transition.ARC R & MI, 2126, ARC 8867.
B.79 July 1948Holder, D.W.Transition Indication in the National Physical Laboratory 20 x 8 in.High joeed T1nnel.
ARC R & M 2079, ARC 8866.
B.a0 August 1946
Gray. W.E.
A Simple Visual Method of Recording Boundary Luyer Transition (liquidfilm).ARC 10028. Unpublished MOA Report.
177
B.81 December 1946
Merewether, E.R.A., Smith, J.H.F., Pankhurst, R.C. and Burstall. F.H.
A Note on the Toxic Effects of Some Chemicals Previously Recommended foruse in Rind Tmel Technique and on Vanour and Gas Explosion Risks inWind Tunnels.
ARC R & M 2198.(Lead compounds, nitrobenzene, nitrotoluene, chloronaphthanes and glycolsshould a1i bu avoided.)
B.82 1947
Pankhurst,% RC.Cautionary Note Regarding Some Chemicals for Transition Indication.
Royal Aeronautical Society Journal 51 (1947), pp.651 - 652.
B.83 1947Relf. Z.F.Nitt obn, ene Dangers (letter to the Editor).Royal Aeronai .!oal Society Journal 51 (1947 pp.69..
B. 84 January 1947Gray. W.E.Interim Note on Boundary Layer Transition Tests in Flight by the Chemical
'Me t hod.ARC 10233. Unpublished MOA Report.
B.85 April 1949Dando, R.C.A.Tuv M.O.-,d of f!!dvey I oyer Trmctin Tndicntinn % itnble for RoutineTests in Flight,
ARC 12531. Unpublished MOA Report.
B.86 March 1950Gazely, C.The Us of the China C:ay Lacquer Technique for Detecting Boundary !.ay.r
Transition.General Electric Co., U.S.A., Report No, R49A0530,
B.87 March 1950
Gray, W.E,Transition in Flight on a Laminar-Flow Wing of Low Waviness (King Cobra).Unpublisheo MOA Report ARC 13221.(Improvement in flight technique in connection with the chemtual methodsof indicating transition.)
B.88 may 1950Main-Smith, J.D.Chemical Solids as Diffusible Coating Filits for Visual Indication of
nodary Layer Transttion in Air and Water.
ARC R & M 'A755.
178
B.89 1951Wijker, H.Survey of Transition Point Measurements at the N.L.L. Mainly for Two
Dimensional Flow over a NAC 00(8 Profile.National Luchtvaartlaboratorium, Amsterdam, Ravort A. 1269.(Methods used are China olay. H26 and smoke.)
B.90 February 1951Stalder, J.R. and Slack. E.G.The Use of a Luminescent Lacquer for the Visual Indication ofBoundary-Layer Transition.NACA IN 2263.
B.91 August 1951Owen, P.R. and Owerod, AO.
Evaporation from the Surface of a Body in an Airstream (with particularreference to the chemical method of indicating boundary layer transition).ARC R & M 2875.
B.92 November 1951Murphy, J.5. and Phinney, R.E.Visualization of Boundary Layer Flow.
Journal of the Aeronautical Sciences 18 (1951) 11 (Novembf.r), pp.771- 772.( 'China film' technique, a hybrid of the 'hiia clay' and -liquid film'techniques.)
5.93 January 1952Britlnd, C.M. and Sibbald. P.A.Preliminary Flight Tests to Determine the Position of Boundary LayerTransition on a Large Aircraft. (Armstrong 1hitworth E9/44.)Unpublished MOA Report ARC 15142.
8.94 September 1954Winter, K.G., Scott-Wilson, J.8. and Iavles. P.V.Methods of Determination and of Fixing Boundary Layer Transition on WindTunnel Models at Supersonic Speeds.ARC CP 212AGARD AG 1W.(Sublimation and oil flow)
B.95 becombor 1954
Nurphy, J.8. and Sbith, A.M.O.Measurements of Shearing Stress by Means of an Evaporating Liquid Film.
Douglas Aircraft Co.. U.S.A., Report No. ES. 17813.
.96 July 1955
Atkins, P.B. and Trayford, R.S.A Method of Bowduary Layer Flow Visualhsation for Use in Flight.A.R.L., Australia, Plight Note 22.
(China clay method)
179
B. 97 October 1955Stalker, R.J,A Study of the China-fila Technique for Flow' Indication.
A.R.L., Australia, Report A96 (TIL No. 1.56984).
B.98 April 1950
Friedman. A.e.OCemiluninescence as a Tool in the Study of Liquid Flow Boundaries.Journal of Applied Physics 27 (1958) No.4. (April), p.417.
B,99 August 1956Stalker, R.J.A Note on the (Cina.filot 'Technique for Boundary Layer Indication.Royal Aeronautical Society Journal 60 (1956) 548 (August). pVP.543 - 544.
8.100 October 1957
Rygh. P.J. and Martin, R.E.The Use of Asobenzeno. to Provid4 a 'isua. Indication of Supersonic-Boundary.Layer Transition.California Institute of Technology Jet Prop. Lab. Prog. .port 20-135,ASTIA AD 159,889.
B.101 January 1958Cornillon, J.Extension de to Technique de LArgile dt (Aine & l'Etude dev Kcou'ementet des Echauffements de Paquettes en Rigime &4personique.Docadro January 1958, pp. 15 - 18.(Eatenasio of the china-cl*y technique)
B.102 November 1958Van der BlIek, J.A.Boundary Layer Transition on a 10degree Cone in the NAE 30 x 16 in.Wind Tunnel,NAR, Canada.. LR-232.
(Fluorescent lacquer technique, French chalk and keroseane and lampblackand kerosene methuda of visualization described)
DISTRIBUTION
Copies of AGAR publications may ba obtai.ded in thevarious countries at the addresseh given below.
On peutse procurer des exemlaire8 des publications
de PAGAIRf auz adresses suivaztus.
BELGIUM Centre National d'Etudes et dA Rseherches
BLGIQUE Aotruautiques11, rue d'ftont, Bruxelles
CANADA Director of Scientific Information ServiceDefense Research BoardDepartment of National Defense'A' Building. Ottawa, Ontario
DEM Military Research BoardDANEAIK' Defense Staff
Kastellet. Copenhagen 0
rIm O.N.E.RA. (Direction)25. Avenue de Is Division LecleroChit i I on-acua-sagneux (Seine)
OMAt Zentralatelle tNr Luftfahrt-AlMAWflR dokumentation und -informstion
ftcshem 27. Maria-Theresia Str. 21
Attn: Dr. N.J. Rutanberg
OCreek National Defense General StaffOR=X B. MDB
Athens
ICELAND Director of AviationISLW3 0a Pi ugrad
ReYkjavik
ITALY Uffiolo del Ceneral* IspettoreITALIC del Genlo Aeronautico
Ministero Difea AeronauticsRoma
LUwmOM Obtainable through Belgium
EI1LAND Netherlands Dolegation to AGARDPAYS BAS Michiel de Ruyterweg 10
Delit
NORWAY Mr. 0. BlichnerNORVEGE Norwegian Defence Research Establishment
KJeller per Lillestr~m
PORTUGAL Col. J.A. de Almeida Vim(Delegado Nacional do 'AARD')Direo~io do Servigo de Material di P.A.Rua da Escola Politecnica. 42Lisboa
TURKEY Ministry of National DefenceTIRQUIE Ankara
Attn. AGARD National Delegate
UNITED KINGDCM Ministry of AviationROYAUM UNI T.I.L., Room 009A
First Avenue HouseHigh HolbornLondon W. C. I
UNITED STATES National Aeronautics ahd pace AdinistrotionSTATS UNIS (NASA)
1320 H Street. N.W.Washington 23. D.C.
Pnnted by Ftchntcai :dsting and Re~rduction LidNarford flouse. 7-9 COarlot:e St. Loodow. V. 1.
P a. a 's
to Co
II T . f.
to I
a t00
.~ bl
ilot
- - 71SIiI!
!. I. - !
. i *
I iIA
zI0 t tZ ~
f ra
I-t
la - 2I4 r V -4
'IV
Ir -%
4.
.s
I " -V
4.
,.,
"..• • I ,. ..- .. . .. 3. - -... .. .
• -.. ,, ". ..,, .
I - . 0 ,