Embed Size (px)
Citation preview

Copyright © Editura Academiei Oamenilor de Știință din România, 2011Watermark Protected
Annals of the Academy of Romanian Scientists Series on Science and Technology of Information
ISSN 2066 - 8562 Volume 4, Number 1/2011 111
1University “Politehnica” of Bucharest, Automotive Engineering Department within the Faculty of Transports at the University, Bucharest, Romania, e-mail:[email protected]. 2University “Politehnica” of Bucharest, Automotive Engineering Department within the Faculty of Transports at the University, Bucharest, Romania, e-mail:[email protected].
UNCERTAINTY OF THE DISC BRAKE THERMAL STRESS
MEASURED BY THERMOGRAPHY
Ștefan VOLOACĂ1, Gheorghe FRAȚILĂ2
Rezumat. Lucrarea analizează posibilitatea evaluării incertitudinii de determinare a
emisivității și a solicitărilor termice ale discurilor de frână în cazul frânării intensive. Sunt
luate în considerare proprietățile materialului și soluțiile constructive ale discurilor de
frână. Distribuția de temperaturi a fost evaluată de autori prin simulare în laborator în mod
controlat; imaginile termice achiziționate au fost prelucrate cu un program de calcul
adecvat. Pentru o frânare intensivă (în mai puțin de 5 secunde) s-a ținut seama de faptul că
variația temperaturii discului este cuprinsă între 20 C si 200 C.
Abstract. The paper analyses the possibility of evaluating the uncertainty of determining
the emissivity and the thermal stress for a disc brake during an intensive braking. There are
taking into consideration the material properties and types of disc brake. The temperature
distribution was evaluated by the authors by simulating it in the laboratory, in a controlled
environment; the taken thermal images have been processed using adequate software. It has
been taking into account that the temperature usually varies between 20 C and 200 C (in
less than 5 seconds) for a disc brake at an intensive braking.
Keywords: Automotive engineering, disk brake, thermography, image analysis, experimental simulation, braking, radiation, thermal emissivity
1. Introduction
The thermal stress is a result of exterior constrains during temperature variation ΔT inside the disc brake, having no possibility to expand or constrict. It can be expressed as [1]:
1
ET
(1)
Where:
α – the linear thermal expansion coefficient of the disc brake material; aT T T , T – local disc temperature, Ta – ambient temperature,
E – Young modulus, ν – Poisson coefficient.
Deriving relation (1) with time, next relation is obtained:
( )1
d E d T
dt dt
(2)

Copyright © Editura Academiei Oamenilor de Știință din România, 2011Watermark Protected
112 Ștefan Voloacă, Gheorghe Frățilă
This emphasizes the high growing of thermal stress for a short time period of temperature high variation. Is expected an increase of existent stress inside the disc, during an intensive braking from high speed. Thermal stress is amplified by the presence on disc surface of small cracks, microparticles agglomerations etc. Those determine anomalies of thermal flux inside the disc brake [2, 3, 4]. The anomalies can be shown by thermograms taken by high performance thermal camera.
Usually temperature or radiation maps offered by thermograms are presented colorimetric to be easily interpreted by a human observer. For high quality thermogram, frames must be taken by thermal cameras in grey shades (figure 1). It’s mentioned that thermography is the only technique which permits the determination, from short distance, in real time, of disc brake thermal stress [5]. It has a series of disadvantages, not yet resolved, inside the interest zone:
Unknowing the emissivity of disc brake during experiments and forward the wrong setting of thermal camera – by setting the camera to a lower value of emissivity, the indicated temperature (the apparent temperature) will also be lower than real one [6, 7];
During braking, the emissivity varies nonlinear. It varies with factors like: environment humidity and temperature, surface state and the geometry of ventilated discs [6].
Problem raised by conversion algorithm of the disc brake emitted radiance into real temperature, which are implemented in thermal camera’s processor.
Emissivity variation is insignificant for materials with low reflectivity, at temperatures up to 200 C. For polished materials, with high reflectivity (disc brake material), emissivity has a considerable variation with temperature (especially at intensive braking with low possibilities of ventilation).
After author’s knowledge, there is not enough information regarding emissivity variation ε (T) with temperature T for disc brake. The main reason is the keeping the secret by producers over this variation. Due this, inside the paper are useful any values measured and published in literature:
From paper [8] the emissivity variation Δε/ε of a disc brake is around 0.85 at temperature of 200 C; by extrapolation, for temperatures under 200 C the value will be Δε ≈ ε (figure 2).
From paper [9] for a spectral domain 8-14 μm, polished cast iron used for disc brake, has emissivity of 0.21.
From paper [9] for a spectral domain 8-14 μm, polished cast iron used for disc brake, has emissivity of 0.21.

Copyright © Editura Academiei Oamenilor de Știință din România, 2011Watermark Protected
Uncertainty of the Disc Brake Thermal Stress Measured by Thermography 113
Fig. 1. Thermograms and histograms at the beginning and the end of braking
(from 100 km/h).
0 200 400 600 800 1000
0,36
0,38
0,40
0,42
0,44
0,46
0,48
0,50
0,52
0,54
0,56
0,58
Emisi
vitat
ea
Temperatura T[0C]
Fig. 2. Estimation of emissivity variation of a
disc brake in temperature domain (extrapolation made from paper [8]).
2. Approaching the idea
A temperature analyse was made to evaluate the certitude of emissivity determination, for two types of disc brakes (basic and ventilated disc brakes).
Other followed aim was the comparative determination of their vulnerability to thermal stress. It was possible by highlighting the spatial distribution of emissivity over disc brake surfaces.
Image processing was made by ImageJ [10] and radiance calculation by MBRC [Mikron Blackbody Radiation Calculator] software from Mikron (U.S.A.), specialized in thermal cameras.
For a grey body, like disc brake, the spectral emissivity εi (λ, Ti ) is the ratio of radiances of grey and black bodies at the same temperature Ti.
Considering the spectral domain [λ1, λ2] of thermal camera, which takes thermograms, the spectral emissivity is [11, 12, 13]:
2
1
( , )( )( , )
i ii i
CN i
R TT d
R T
(3)
A thermogram displayed, by a thermal camera, can be in grey scale Ng (monochrome) or colour (figure 2). For a fast results interpretation of thermograms the radiance was taken as a reference element, expressed by the colour index (intensity of grey). After paper [13], the radiance at a pixel level can be written as:
max minmin
max
( ) ( )( ) ( )i gi
g
R RR R N
N
(4)
Copyright © Editura Academiei Oamenilor de Știință din România, 2011Watermark Protected
114 Ștefan Voloacă, Gheorghe Frățilă
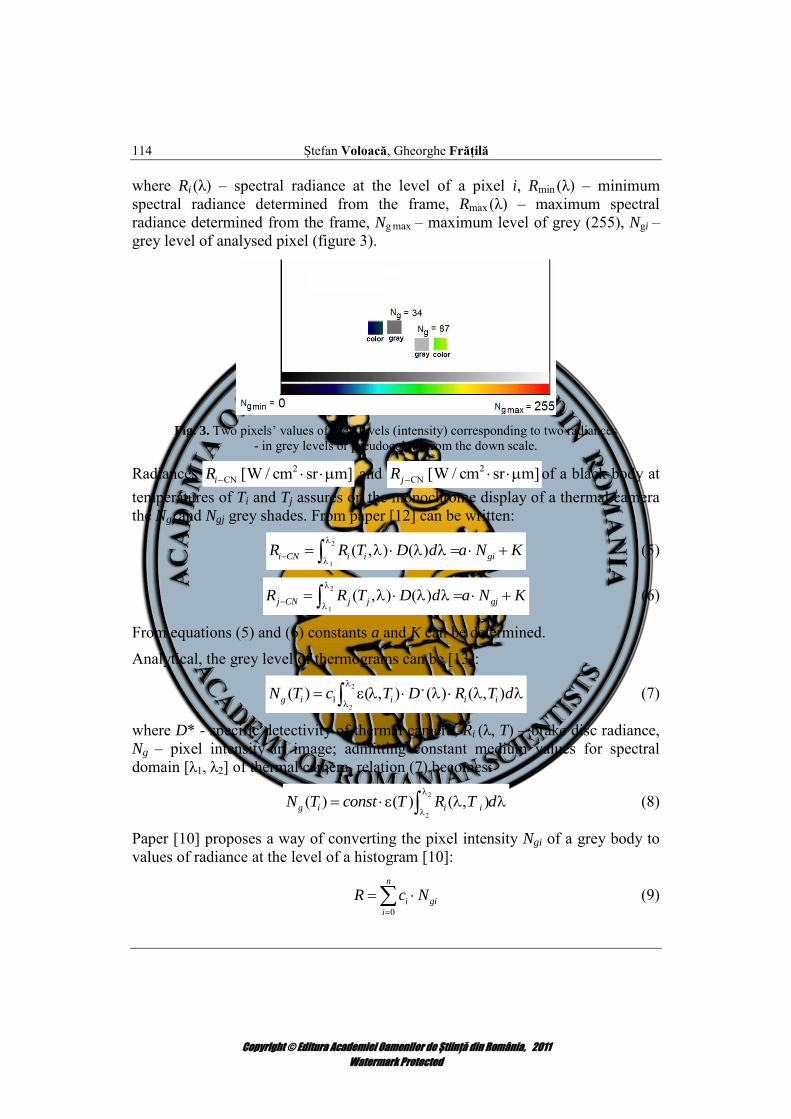
where Ri (λ) – spectral radiance at the level of a pixel i, Rmin (λ) – minimum spectral radiance determined from the frame, Rmax (λ) – maximum spectral radiance determined from the frame, Ng max – maximum level of grey (255), Ngi – grey level of analysed pixel (figure 3).
Fig. 3. Two pixels’ values of grey levels (intensity) corresponding to two radiances
- in grey levels or pseudocolour from the down scale.
Radiances 2CN [W / cm sr m]iR and 2
CN [W / cm sr m]jR of a black body at temperatures of Ti and Tj assures on the monochrome display of a thermal camera the Ngi and Ngj grey shades. From paper [12] can be written:
2
1
( , ) ( )i CN i i giR R T D d a N K
(5)
2
1
( , ) ( )j CN j j gjR R T D d a N K
(6)
From equations (5) and (6) constants a and K can be determined.
Analytical, the grey level of thermograms can be [13]:
2*
21( ) ( , ) ( ) ( , )g i i i iN T c T D R T d
(7)
where D* - specific detectivity of thermal camera, Ri (λ, T) – brake disc radiance, Ng – pixel intensity in image; admitting constant medium values for spectral domain [λ1, λ2] of thermal camera, relation (7) becomes:
2
2
( ) ( ) ( , )g i i iN T const T R T d
(8)
Paper [10] proposes a way of converting the pixel intensity Ngi of a grey body to values of radiance at the level of a histogram [10]:
0
n
i gi
i
R c N
(9)
Copyright © Editura Academiei Oamenilor de Știință din România, 2011Watermark Protected
Uncertainty of the Disc Brake Thermal Stress Measured by Thermography 115
where ci - the calibration coefficients. Thermal camera calibration is made by using a reference black body etalon and using Planck low to calculate radiation in the spectral domain of thermal camera [λ1, λ2] mentioned before. Taking into account Stefan-Boltzmann relation equation (3) can be written as [15]:
40
( )( ) i ii i
i
R TT
T
(10)
For a black body (CN) which is heated at the same temperature Ti, from relation (7) can be written:
( )( ) ( )( )
i ii i i CN i
i CN i
R TT T
R T
(11)
where Ri values can be determined by histograms calculated with (8). From here:
( )( )( ) ( )
( ) ( )gi i
i i i CN i
i CN i g CN
N TiR TT T
R T N Ti
(12)
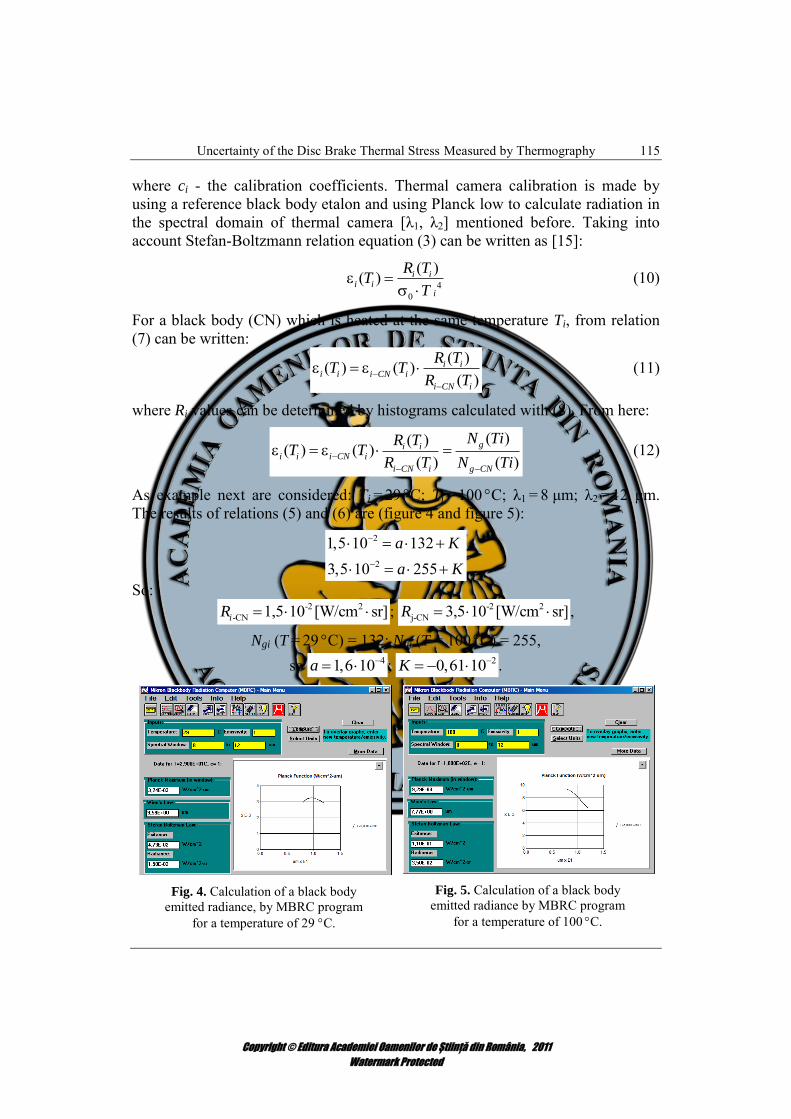
As example next are considered: Ti = 29 C; Tj = 100 C; λ1 = 8 μm; λ2 = 12 μm. The results of relations (5) and (6) are (figure 4 and figure 5):
2
2
1,5 10 1323,5 10 255
a K
a K
So: -2 2
-CN 1,5 10 [W/cm sr]iR ; -2 2j-CN 3,5 10 [W/cm sr]R ,
Ngi (T = 29 C) = 132; Ngj (T = 100 C) = 255,
so 41,6 10a ; 20,61 10K .
Fig. 4. Calculation of a black body
emitted radiance, by MBRC program for a temperature of 29 C.
Fig. 5. Calculation of a black body
emitted radiance by MBRC program for a temperature of 100
C.

Copyright © Editura Academiei Oamenilor de Știință din România, 2011Watermark Protected
116 Ștefan Voloacă, Gheorghe Frățilă
All the grey levels Ng were experimental determined, by using devices and methodology presented in the next chapter. Using relations (5) and (6) for the spectral domain 8 μm 12 μm, constants a and K and taking in consideration temperature domain 0 C200 C (specific temperature distribution for usual brake discs), are obtained next temperature, radiance and grey level variations for different emissivity values (figure 6a and 6b).
0 50 100 150 2000
2
4
6
8
10
R ()
=0,16+0,04T
Radia
nta
x 1
0-2
[W
/cm
2sr]
Temperatura discului de frana [0C]
a)
0 50 100 150 200
20
40
60
80
100
120
140
160
180
200
220
240
260
Ng=110+0,64T
Niv
el d
e g
ri N
g
Temperatura discului de frana T[OC]
b)
Fig. 6 Variation of radiance (a) and grey level (b) for a brake disc with different emissivities for temperature 0
C200 C.
Authors observed form drawn figure 6, for temperature of 0 to 200 C and a spectral domain of 812 μm, a linear regression can be used to determine radiance and afferent grey level (relation 5 and 6). More on the incertitude is less with a low value of emissivity (figure 7).
0 50 100 150 200
96,0
96,5
97,0
97,5
98,0
98,5
99,0
99,5
100,0
Ce
rtitiu
din
ea
ma
su
rarii em
isiv
itatii [%
]
Temperatura discului de frana T [0C]
Fig.7. Relative error of emissivity calculated with relation 10
)NN(s
211
1igigi
i
for 11 distinct values of temperature in the domain 0 C200 C
Unc
erta
inity
of t
he e
mis
sivi
ty m
easu
rem
ent,
[%]
Temperature of the brake disc, T [C]

Copyright © Editura Academiei Oamenilor de Știință din România, 2011Watermark Protected
Uncertainty of the Disc Brake Thermal Stress Measured by Thermography 117
Knowing the values a and K can determine the grey shades of a black body at any other temperature. Moreover, for a temperature domain 0 C200 C, taking into account the results presented in figure 6, the relation (5) can be written as:
( )i i giR a N K (13)
Theoretical, if the radiance value is calculated, can determine the temperature at the level of every pixel directly from the next equation [14]:
2
1
[K]ln 1
( )
i
i
KT
K
R
(14)
where K1 and K2 – calibration constants; they can be determined from figure 6 for temperature domain 0 C200 C.
Relations (13) and (14) practically permit from a taken thermogram to determine the temperature and emissivity, if grey shade of a grey body is known, and reverse.
This way, for example, for an unknown zone A from a brake disc thermogram with the shade Ng(T) = 214 and with a known temperature T, can be written:
84,0255214
Adisc ; 4 2 2214 1,6 10 214 0,61 10 2,81 10a K
From Planck low, for ε = 0,84 ; λ1 = 8μm; λ2 = 12 μm; results radiance -2 2
A disc 2,81 10 [W/cm sr]R .
Regarding thermal stress described by relation (1) it can be highlight in a thermogram which has a radiance collected by a thermal camera with spectral domain [λ1, λ2].
About the estimation of thermal stress uncertainty given by using apparent temperatures instead of real one (as a result of unknowing the emissivity), this can be experimental determined from recordings in real time during braking. For experimental evolution of emissivity one of next method can be applied [15]:
A part of disc surface can be heated to a known temperature (measured by a contact thermometer). The authors consider the value of used emissivity that can be determined with precision, by knowing grey intensity of recorded thermogram and calculating radiance by Plank law for that temperature.
An indirect method of emissivity determination by measuring the reflectivity, using a thermocouple for determining contact temperature (figure 12).
Copyright © Editura Academiei Oamenilor de Știință din România, 2011Watermark Protected
118 Ștefan Voloacă, Gheorghe Frățilă
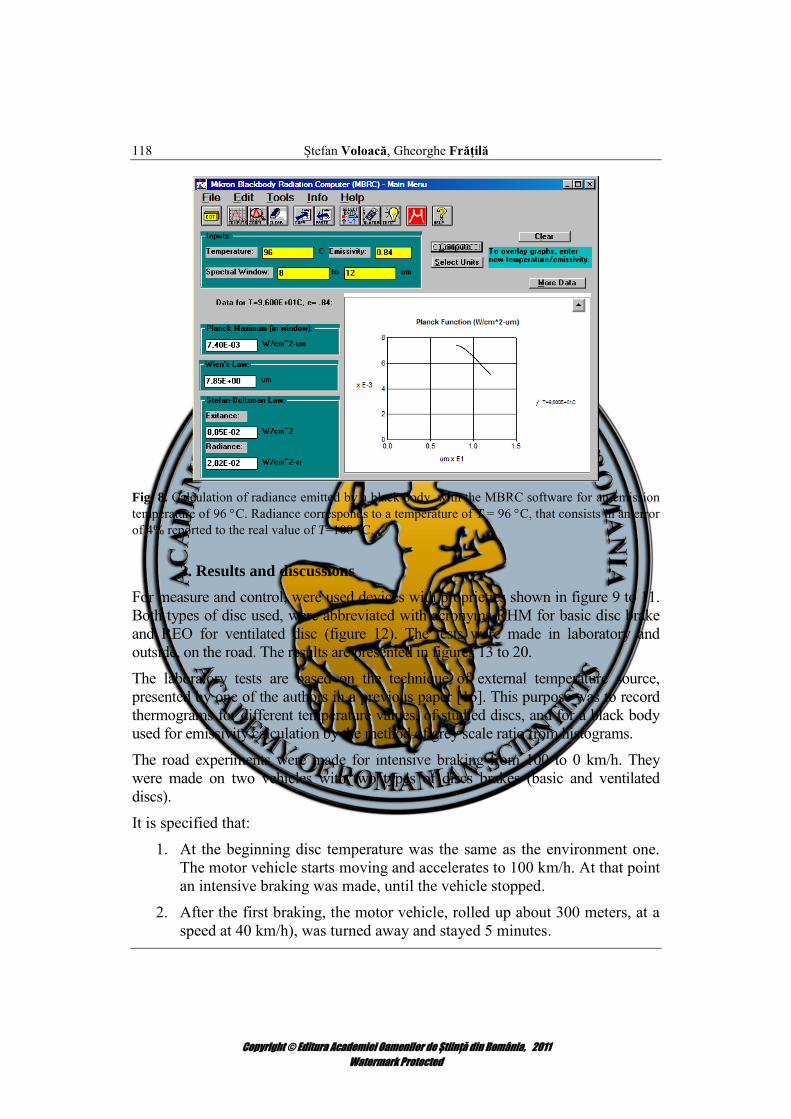
Fig. 8. Calculation of radiance emitted by a black body, with the MBRC software for an emission temperature of 96 C. Radiance corresponds to a temperature of T = 96 C, that consists in an error of 4% reported to the real value of T=100 C.
3. Results and discussions
For measure and control, were used devices with proprieties shown in figure 9 to 11. Both types of disc used, were abbreviated with acronyms RHM for basic disc brake and REO for ventilated disc (figure 12). The tests were made in laboratory and outside, on the road. The results are presented in figures 13 to 20.
The laboratory tests are based on the technique of external temperature source, presented by one of the authors in a previous paper [16]. This purpose was to record thermograms for different temperature values, of studied discs, and for a black body used for emissivity calculation by the method of grey scale ratio from histograms.
The road experiments were made for intensive braking from 100 to 0 km/h. They were made on two vehicles with two types of discs brakes (basic and ventilated discs).
It is specified that:
1. At the beginning disc temperature was the same as the environment one. The motor vehicle starts moving and accelerates to 100 km/h. At that point an intensive braking was made, until the vehicle stopped.
2. After the first braking, the motor vehicle, rolled up about 300 meters, at a speed at 40 km/h), was turned away and stayed 5 minutes.

Copyright © Editura Academiei Oamenilor de Știință din România, 2011Watermark Protected
Uncertainty of the Disc Brake Thermal Stress Measured by Thermography 119
3. A new intensive braking was made after the motor vehicle was accelerated to 100 km/h.
4. Again it rolled up about 300 meters and stopped with an easy braking.
Fig. 9. The black body Wahl standard source, with the characteristics: Temperature domain: 0-350 C; Constant of temperature: 2 C; Aperture diameter: 100 mm.
Fig. 10. Thermogram of the Wahl standard source obtained by a PathFindIR thermal camera. The working aperture is highlight.
Fig. 11. A view of PathFindIR thermal camera with next characteristics: Spectral domain: 8-12 μm; Radiometric resolution: 8 bits; Visual field: 40H30V); Geometric resolution: 6,6″.
a)
b)
Fig. 12. Disc brakes used in laboratory experiments (a - disc brake REO, b - disc brake RHM), with thermocouple mounted on measured surface.
Fig. 13. Images of black body aperture in grey shades, and their histograms
for temperature of 22 C and 200 C. Environment temperature 20 C.

Copyright © Editura Academiei Oamenilor de Știință din România, 2011Watermark Protected
120 Ștefan Voloacă, Gheorghe Frățilă
22 C 100 C 200 C
Fig. 14. Grey scale thermograms, of a disc brake, for three values of temperature. The calculated
emissivity based on grey scale ratio are: disc
46ε (22 C)= =0,34136
, disc
224ε (200 C)= =0,88255
. Those
two values are closed to image coordinates (grey level, radiance, emissivity) presented in figure 4b.
Fig. 15. Images of coloured thermograms of the brake disc presented in figure 13. They show
a good meshing of high temperature areas, but appreciation of temperature is less precise.
The experimental method verification was made using histograms and contrast of the profile (figure 16 and 17). The results were similar.
29 degrees 255 degrees
Fig. 16. The determination of emissivity difference by contrast based on histogram.
5,0252
126252)C255/C29( 00
.

Copyright © Editura Academiei Oamenilor de Știință din România, 2011Watermark Protected
Uncertainty of the Disc Brake Thermal Stress Measured by Thermography 121
Fig. 17. The determination of emissivity difference based on contrast.
250 125(29 C / 255 C) 0,5
250CT
.
Fig. 18. Basic brake disc at temperature of 100 C and its histogram for a polished zone.
185(100 C) 0,72
255disc .
As a result of rugose influence the emissivity grows compared to anterior fig. 18. Ru-gose particle conglomerate generates high temperature and high risk of thermal stress.
Fig. 19. Basic disc brake at temperature of 100 C and its histogram for an unpolished zone.
2480(100 ) 0.97255
Cdisc .

Copyright © Editura Academiei Oamenilor de Știință din România, 2011Watermark Protected
122 Ștefan Voloacă, Gheorghe Frățilă
Over laboratory experiments, were made tests on the road directly on the motor vehicle. This way was obtained thermograms from figure 20, at the end of braking, which were analysed.
a) Ventilated disc brake - REO. b) Basic disc brake - RHM.
Fig. 20. Temperature distribution and histograms for analysed zones for two types of disc brakes.
There is a variation of contrast (and of the emissivity).
Value of contrast from figure a) 255 136 0,46
255
,
and from figure b) 255 147 0,42
255
.
Taking care of relation (2), the first disc (ventilated disc) will have a smaller thermal stress than the second one (basic disc).
This fact shows the necessity of using ventilated discs on the motor vehicles, to reduce thermal stresses.

Uncertainty of the Disc Brake Thermal Stress Measured by Thermography 123
4. Conclusions
1. Emissivity of a disc brake can be evaluate with sufficient precision based on a limited number of grey levels of thermograms for values of temperature 0 to 200 C;
2. By analysing temperature distribution at the disc brake surface there can be evaluated risks of thermal stresses (internal stress for different braking regimes or discs);
3. A relative error of emissivity grows with the value of reflectivity (emissivity decreases) due to influence of parasite thermal recorded in thermograms;
4. The uncertainty of determining internal stress is higher with a low value of emissivity.
R E F E R E N C E S
[1] R. Limpert, Brake Design and Safety, pp. 151-153, in SAE International, 1999.
[2] Rahim Abu Bakar, Huajiang Ouyang, Lee Chiing Khai, Mohd Shahrulizam Abdullah, Thermal Analysis of a Disc Brake Model Considering a Real Brake Pad Surface and Wear, in International Journal of Vehicle Structures & Systems, Vol. 2, No 1, 2010, Chennai, Inde, ISSN 0975-3060.
[3] Pyung Hwang, and Xuan Wu, Investigation of temperature and thermal stress in ventilated
disc brake based on 3D thermo-mechanical coupling model, in Journal of Mechanical Science and Technology 24 (2010), pp. 81-84.
[4] Abd. Rahim Abu Bakar, Huajiang Ouyang,Lee Chiing Khai, Mohd Shahrulizam Abdullah, Thermal analysis of a disc brake model considering a real brake pad surface and wear, in International Journal of Vehicle Structures & Systems, Vol. 2, No 1, 2010.
[5] *** FLIR Thesa. Full Radiometric Software Suite For Lock-in Thermography Applications, in http://www.flir.com/uploadedFiles/Thermography/MMC/Brochures/T559247/T559247_en.pdf.
[6] H. Kasem, J. Thevenet, X. Boidin, M. Siroux, P. Dufrenoy, B. Desmet and Y. Desplanques, An emissivity-corrected method for the accurate radiometric measurement of transient surface
temperatures during braking, in Tribology International, Volume 43, Issue 10, October 2010, pp. 1823-1830.
[7] P. Eric, Whitenton Characterization of Uncertainties When Measuring Metal Cutting
Temperatures Using Infrared Radiation Thermography, in Thermosense XXXI, Proc. of SPIE Vol. 7299, 72990G·1, 2009.
[8] Jean Thevenet, Monica Siroux, and Bernard Desmet. Brake disc surface temperature
measurement using a fiber optic two color pyrometry, in 9th International Conference on Quantitative InfraRed Thermograpgy, 2-5 July, 2008, Krakow, Poland.
[9] ***Emissivity Values for Metals, http://www.raytek.com/Raytek/en-r0/IREducation/Emissivity TableMetals.htm

124 Ștefan Voloacă, Gheorghe Frățilă
[10] Michael D. Abramoff, Paulo J. Magalhaes, Sunanda J. Ram, Image Processing with ImageJ, in Biophotonics International, July 2004.
[11] A basic guide to Thermography, http://www.lirkorea.com/Landinstruments.net%20Website/ infrared/downloads/pdf/thermography_guide.pdf
[12] Krzysztof Chrzanowski, Non-contact thermometry. Measurement Errors.
[13] Holst, G. C., Electro-Optical Imaging System Performance, Fifth Edition, JCD Publishing and SPIE Press, Bellingham, Washington, 65-67(2008).
[14] D. Nohia, Applications of remotely sensed imagery to watershed analysis a case study of lake
Karoun catchment, Egypt, in Thirteenth International Water Technology Conference, IWTC 13, 2009, Hurghada, Egypt, pp. 1035-1049.
[15] Pavel Litos, Milan Honner, Josef Kunes, Thermography Applications in Technology Research.
[16] Catalin Spulber, Stefan Voloaca, Experimental determination of emissivity variation of a
brake disc by image analysis, in Annals of the Academy of Romanian Scientists, Series on Science and Technology of Information, pp. 61-71, 3, Number 2/2010.