Embed Size (px)
Citation preview
Press release Regulated information 8 February 2018 - 17:40 CET
Umicore Group Communications
VAT BE0401 574 852 Naamloze vennootschap – Société anonyme BE92 2100 0538 0623 Tel.: +32 2 227 71 11 Broekstraat 31 Rue du Marais
RPR/RPM Brussels 0401 574 852 Fax.: +32 2 227 79 00 B-1000 Brussels, Belgium Registered Office Broekstraat 31 Rue du Marais, B-1000 Brussels, Belgium E-mail: [email protected] www.umicore.com
Umicore announces record results, growth acceleration and capital increase
Record performance
Umicore set a record performance in 2017 on the back of strong growth in Energy & Surface Technologies.
• Revenues of € 2.9 billion (+9%) or € 2.8 billion (+16%) excluding discontinued operations
• Recurring EBITDA of € 599 million (+14%) or € 587 million (+18%) excluding discontinued operations
• Recurring EBIT of € 410 million (+17%) or € 398 million (+24%) excluding discontinued operations
• ROCE of 15.1% (versus 14.6% in 2016)
• Recurring net profit (Group share) of € 267 million (+15%) and recurring EPS of € 1.22 (+14%)
• Net debt at € 840 million of which € 690 million long term private debt
• Capital expenditures of € 365 million
The portfolio was considerably simplified with the divestments of Building Products, the European activities of Technical Materials and the large area coatings activity of Thin Film Products. This completes the portfolio realignment that was announced in 2015.
The Board of Directors will propose an increase of the gross annual dividend to € 0.70 per share at the Annual General Meeting on 26 April 2018 of which € 0.325 was already paid out as an interim dividend in August 2017.
Outlook for 2018
Umicore anticipates that it will approach already in 2018 its Horizon 2020 target of doubling recurring EBIT (from the 2014 base – excluding discontinued operations) to a level of € 500 million, driven by buoyant demand for cathode materials and the fast ramp-up of new production lines in South Korea and China. The Catalysis and Recycling activities will also continue to contribute to profit growth. This outlook assumes that current macroeconomic conditions continue to prevail.
Note: All comparisons are made with 2016, unless mentioned otherwise. In accordance with IFRS 5 no depreciation charges were recognized for the discontinued operations as from the second half of 2015. All Group KPIs include the discontinued operations, unless mentioned otherwise. Zinc Chemicals contributed six months in 2016 and Building Products until end September 2017 to the KPIs of discontinued operations, unless mentioned otherwise.
2/27
Growth acceleration
Rechargeable Battery Materials is powering ahead with a new investment of € 660 million in China and Europe that will bring total capacity to at least 175,000 metric tons by 2021.
Given this growth acceleration Umicore now sees an upside potential of some 35 to 45% compared to the original Horizon 2020 recurring EBIT target, while maintaining the 15%+ ROCE target at Group level. This assumes current macroeconomic conditions continue to prevail.
Capital increase
Umicore launches a capital increase of new ordinary shares through an accelerated bookbuild. The proceeds will be used to fund growth investments, particularly in cathode materials and will provide more financial flexibility to pursue potential acquisitions and partnerships that would further strengthen Umicore’s offering in clean mobility materials and recycling.
The new shares from the capital increase will be entitled to a dividend payment of € 0.375 corresponding to the balance of the gross annual dividend for 2017, subject to shareholders’ approval of a full year dividend of € 0.70 per share.
3/27
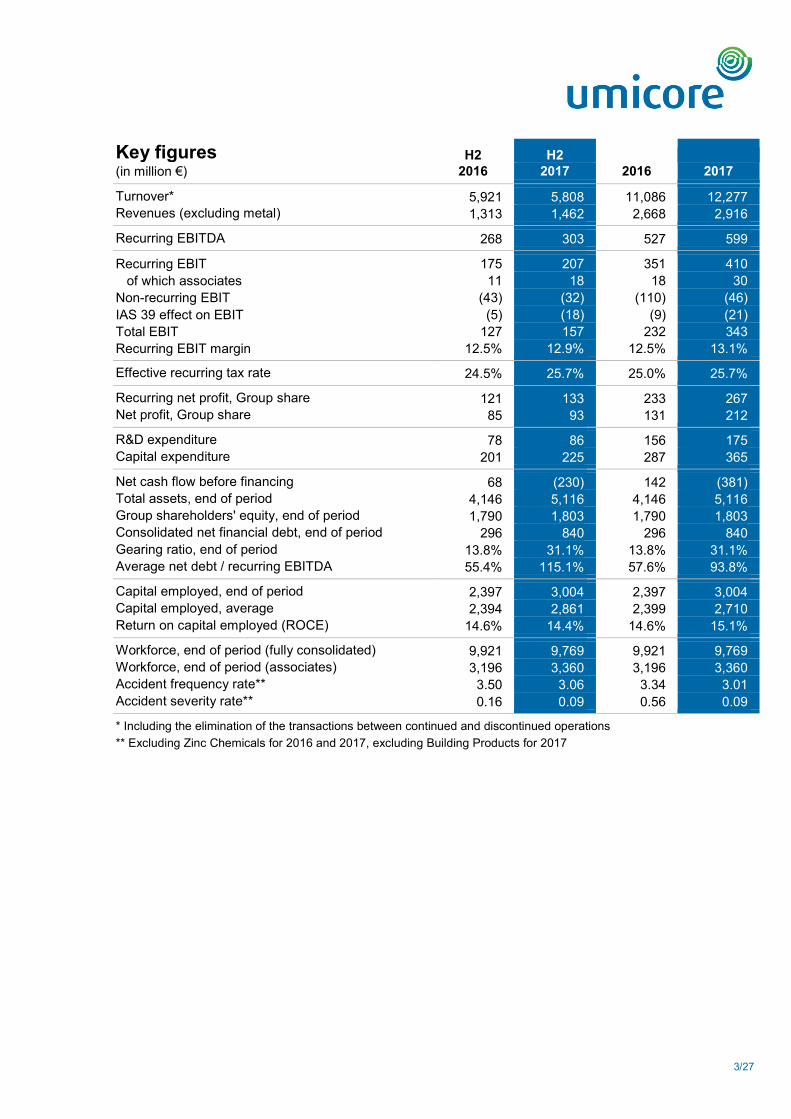
Key figures H2 H2 (in million €) 2016 2017 2016 2017 Turnover* 5,921 5,808 11,086 12,277 Revenues (excluding metal) 1,313 1,462 2,668 2,916 Recurring EBITDA 268 303 527 599 Recurring EBIT 175 207 351 410 of which associates 11 18 18 30 Non-recurring EBIT (43) (32) (110) (46) IAS 39 effect on EBIT (5) (18) (9) (21) Total EBIT 127 157 232 343 Recurring EBIT margin 12.5% 12.9% 12.5% 13.1% Effective recurring tax rate 24.5% 25.7% 25.0% 25.7% Recurring net profit, Group share 121 133 233 267 Net profit, Group share 85 93 131 212 R&D expenditure 78 86 156 175 Capital expenditure 201 225 287 365 Net cash flow before financing 68 (230) 142 (381) Total assets, end of period 4,146 5,116 4,146 5,116 Group shareholders' equity, end of period 1,790 1,803 1,790 1,803 Consolidated net financial debt, end of period 296 840 296 840 Gearing ratio, end of period 13.8% 31.1% 13.8% 31.1% Average net debt / recurring EBITDA 55.4% 115.1% 57.6% 93.8% Capital employed, end of period 2,397 3,004 2,397 3,004 Capital employed, average 2,394 2,861 2,399 2,710 Return on capital employed (ROCE) 14.6% 14.4% 14.6% 15.1% Workforce, end of period (fully consolidated) 9,921 9,769 9,921 9,769 Workforce, end of period (associates) 3,196 3,360 3,196 3,360 Accident frequency rate** 3.50 3.06 3.34 3.01 Accident severity rate** 0.16 0.09 0.56 0.09 * Including the elimination of the transactions between continued and discontinued operations ** Excluding Zinc Chemicals for 2016 and 2017, excluding Building Products for 2017
4/27
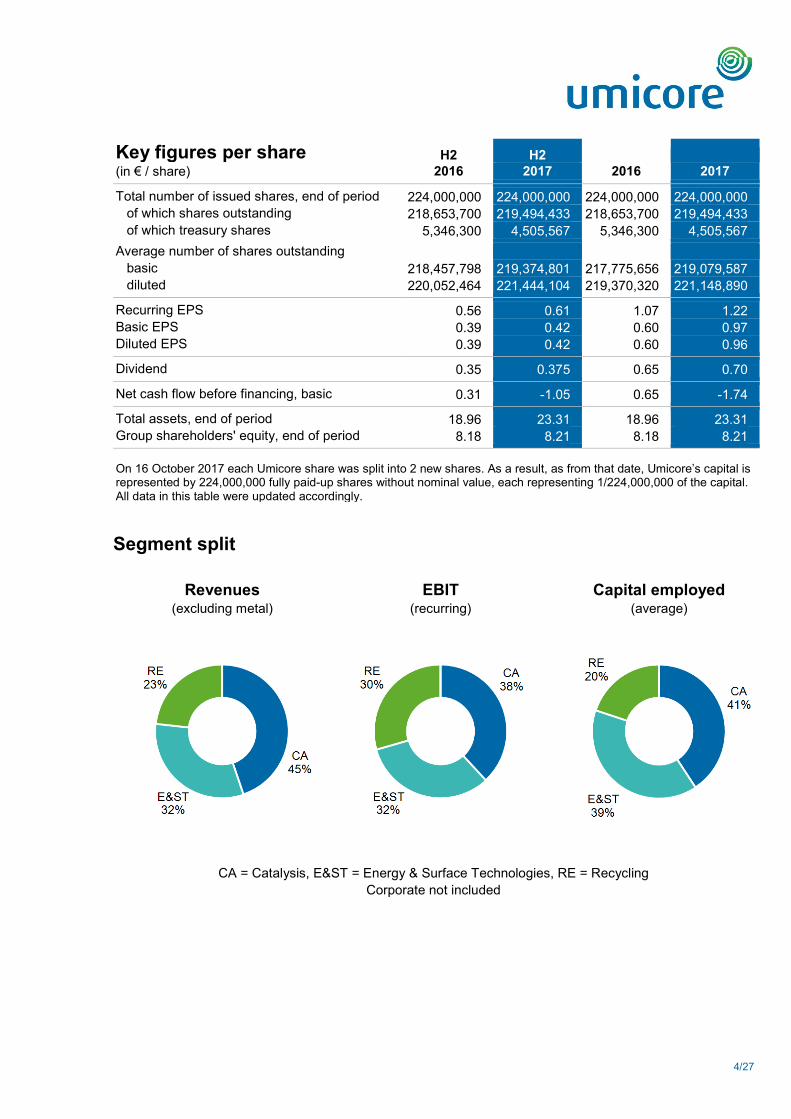
Key figures per share H2 H2 (in € / share) 2016 2017 2016 2017 Total number of issued shares, end of period 224,000,000 224,000,000 224,000,000 224,000,000 of which shares outstanding 218,653,700 219,494,433 218,653,700 219,494,433 of which treasury shares 5,346,300 4,505,567 5,346,300 4,505,567 Average number of shares outstanding basic 218,457,798 219,374,801 217,775,656 219,079,587 diluted 220,052,464 221,444,104 219,370,320 221,148,890 Recurring EPS 0.56 0.61 1.07 1.22 Basic EPS 0.39 0.42 0.60 0.97 Diluted EPS 0.39 0.42 0.60 0.96 Dividend 0.35 0.375 0.65 0.70 Net cash flow before financing, basic 0.31 -1.05 0.65 -1.74 Total assets, end of period 18.96 23.31 18.96 23.31 Group shareholders' equity, end of period 8.18 8.21 8.18 8.21 On 16 October 2017 each Umicore share was split into 2 new shares. As a result, as from that date, Umicore’s capital is represented by 224,000,000 fully paid-up shares without nominal value, each representing 1/224,000,000 of the capital. All data in this table were updated accordingly.
Segment split
Revenues (excluding metal)
EBIT (recurring)
Capital employed (average)
CA = Catalysis, E&ST = Energy & Surface Technologies, RE = Recycling Corporate not included
5/27
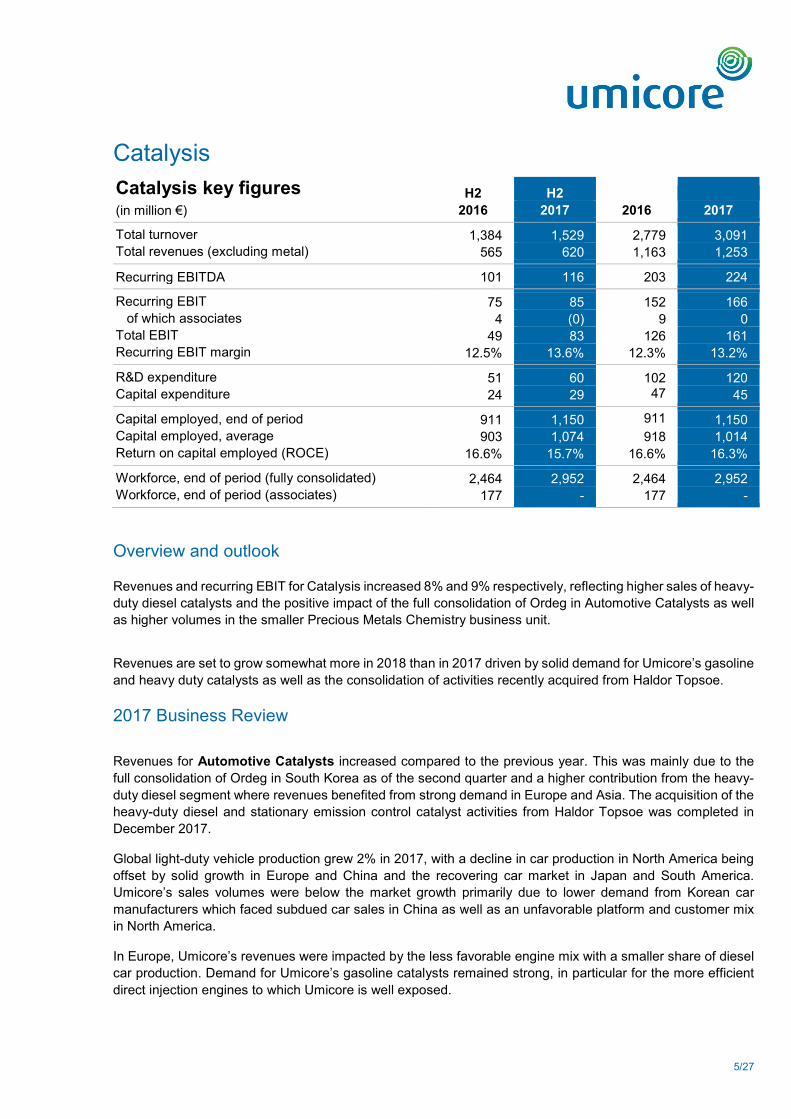
Catalysis Catalysis key figures H2 H2 (in million €) 2016 2017 2016 2017 Total turnover 1,384 1,529 2,779 3,091 Total revenues (excluding metal) 565 620 1,163 1,253 Recurring EBITDA 101 116 203 224 Recurring EBIT 75 85 152 166 of which associates 4 (0) 9 0 Total EBIT 49 83 126 161 Recurring EBIT margin 12.5% 13.6% 12.3% 13.2% R&D expenditure 51 60 102 120 Capital expenditure 24 29 47 45 Capital employed, end of period 911 1,150 911 1,150 Capital employed, average 903 1,074 918 1,014 Return on capital employed (ROCE) 16.6% 15.7% 16.6% 16.3% Workforce, end of period (fully consolidated) 2,464 2,952 2,464 2,952 Workforce, end of period (associates) 177 - 177 -
Overview and outlook
Revenues and recurring EBIT for Catalysis increased 8% and 9% respectively, reflecting higher sales of heavy-duty diesel catalysts and the positive impact of the full consolidation of Ordeg in Automotive Catalysts as well as higher volumes in the smaller Precious Metals Chemistry business unit.
Revenues are set to grow somewhat more in 2018 than in 2017 driven by solid demand for Umicore’s gasoline and heavy duty catalysts as well as the consolidation of activities recently acquired from Haldor Topsoe.
2017 Business Review
Revenues for Automotive Catalysts increased compared to the previous year. This was mainly due to the full consolidation of Ordeg in South Korea as of the second quarter and a higher contribution from the heavy-duty diesel segment where revenues benefited from strong demand in Europe and Asia. The acquisition of the heavy-duty diesel and stationary emission control catalyst activities from Haldor Topsoe was completed in December 2017.
Global light-duty vehicle production grew 2% in 2017, with a decline in car production in North America being offset by solid growth in Europe and China and the recovering car market in Japan and South America. Umicore’s sales volumes were below the market growth primarily due to lower demand from Korean car manufacturers which faced subdued car sales in China as well as an unfavorable platform and customer mix in North America.
In Europe, Umicore’s revenues were impacted by the less favorable engine mix with a smaller share of diesel car production. Demand for Umicore’s gasoline catalysts remained strong, in particular for the more efficient direct injection engines to which Umicore is well exposed.
6/27
In North America, Umicore’s revenues decreased somewhat more than the market. This was due to a delayed platform introduction along with a less favorable customer mix, as Umicore is relatively less exposed to the growing Asian car brands in the region. There was a strong recovery of the South American market and Umicore’s revenues were in line with the market growth.
In China, Umicore’s revenues grew well above the market as a result of a strong positioning with both global and domestic brands and in spite of the drop in demand for Korean car brands in the region. Umicore’s revenues continued to grow with Japanese OEMs globally and locally, supported by the strong recovery of the Japanese car market. In South Korea, Umicore’s revenues were subdued in an overall stagnating market, while in India and Thailand, revenues outperformed the market growth.
Demand is set to grow significantly in China and India due to the market expansion and the introduction of more complex catalyst systems to meet the upcoming China 6 and Bharat Stage 6 emission standards. Against this backdrop, Umicore has decided to substantially increase its catalyst production capacity in China and double capacity in India. The new capacity will come on stream at the end of 2019.
Revenues for Precious Metals Chemistry increased significantly compared to the previous year as a result of higher volumes across product groups. The acquisition of Materia’s metathesis catalyst IP and business portfolio, which was completed in January 2018, will enable the business unit to broaden its homogenous catalysts offer and expand its customer base.
7/27
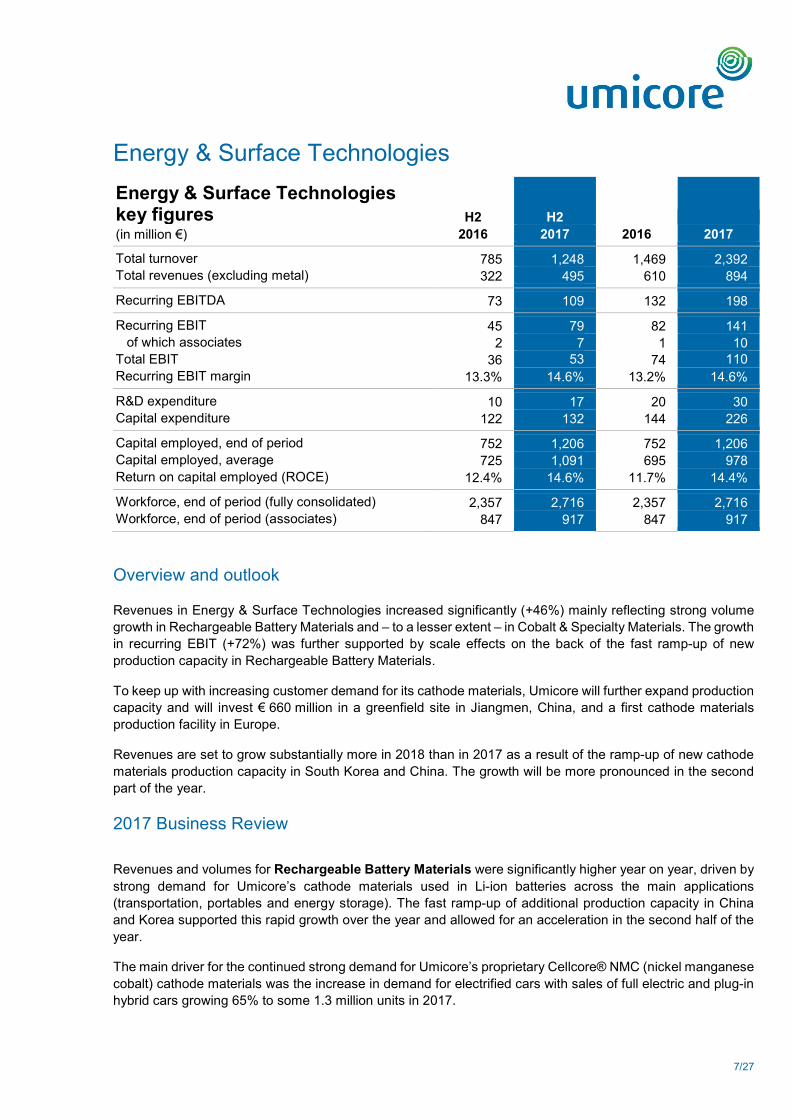
Energy & Surface Technologies Energy & Surface Technologies key figures H2 H2 (in million €) 2016 2017 2016 2017 Total turnover 785 1,248 1,469 2,392 Total revenues (excluding metal) 322 495 610 894 Recurring EBITDA 73 109 132 198 Recurring EBIT 45 79 82 141 of which associates 2 7 1 10 Total EBIT 36 53 74 110 Recurring EBIT margin 13.3% 14.6% 13.2% 14.6% R&D expenditure 10 17 20 30 Capital expenditure 122 132 144 226 Capital employed, end of period 752 1,206 752 1,206 Capital employed, average 725 1,091 695 978 Return on capital employed (ROCE) 12.4% 14.6% 11.7% 14.4% Workforce, end of period (fully consolidated) 2,357 2,716 2,357 2,716 Workforce, end of period (associates) 847 917 847 917
Overview and outlook
Revenues in Energy & Surface Technologies increased significantly (+46%) mainly reflecting strong volume growth in Rechargeable Battery Materials and – to a lesser extent – in Cobalt & Specialty Materials. The growth in recurring EBIT (+72%) was further supported by scale effects on the back of the fast ramp-up of new production capacity in Rechargeable Battery Materials.
To keep up with increasing customer demand for its cathode materials, Umicore will further expand production capacity and will invest € 660 million in a greenfield site in Jiangmen, China, and a first cathode materials production facility in Europe.
Revenues are set to grow substantially more in 2018 than in 2017 as a result of the ramp-up of new cathode materials production capacity in South Korea and China. The growth will be more pronounced in the second part of the year.
2017 Business Review
Revenues and volumes for Rechargeable Battery Materials were significantly higher year on year, driven by strong demand for Umicore’s cathode materials used in Li-ion batteries across the main applications (transportation, portables and energy storage). The fast ramp-up of additional production capacity in China and Korea supported this rapid growth over the year and allowed for an acceleration in the second half of the year.
The main driver for the continued strong demand for Umicore’s proprietary Cellcore® NMC (nickel manganese cobalt) cathode materials was the increase in demand for electrified cars with sales of full electric and plug-in hybrid cars growing 65% to some 1.3 million units in 2017.
8/27
Global demand for Li-ion rechargeable batteries used in electrified vehicles will continue to grow fast as automotive OEMs roll out their electrification strategy. Further strengthening of emission targets, particularly in China and Europe, is pushing OEMs to put more electrified models with longer driving ranges on the road. NMC is the chemistry of choice for batteries used in plug-in hybrid and full electric vehicles and demand for this chemistry is growing rapidly. Umicore is benefiting disproportionately from this trend due to its competitive offer of a wide range of high-quality transportation grade NMC-products, a unique ability to scale up fast, and the early qualification with a large number of cell manufacturers and automotive OEMs.
Umicore is expanding production capacity to cater for this buoyant demand and has managed to add somewhat more capacity than originally planned as part of the current € 460 million investment programme. The fast ramp-up of the new production lines has been showing benefits in the second half of 2017 and these effects will be more pronounced in 2018.
Considering recent customer and platform wins, the success of existing platforms and the ongoing qualification programmes, Umicore needs to further expand capacity to fulfill customer demand. Umicore will therefore invest an additional amount of € 660 million starting in 2018. The execution of the new investment programme will run through 2020 and entails the construction of a greenfield site in Jiangmen, China, close to the existing operation, with first production lines coming on stream in the second half of 2019. The programme also includes a first cathode material production site in Europe. The European project is in an advanced phase of preparation, with final site selection expected in the course of 2018 and production starting in the course of 2020.
Together with the ongoing expansion project of € 460 million, these investments will bring Umicore’s total production capacity in 2021 to at least 175,000 metric tons of cathode materials, including a sizable portion of Cellcore® high nickel-containing NMC grades.
In the shorter term, the market growth combined with the awarded business and fast ramp-up of new capacity imply that Umicore should reach 100,000 metric tons of sales of cathode materials in 2019.
The new flexible production lines will deploy Umicore’s leading process technology and be capable of producing a broad range of NMC cathode materials all certified for the most stringent automotive requirements. The investments will also allow Umicore to meet increasing demand for its high-energy LCO (lithium cobalt oxide) cathode materials used in high-end consumer electronics.
The new investment project will start contributing to earnings as from the second half of 2019 and will be value creating shortly thereafter.
Revenues for Cobalt & Specialty Materials were significantly higher year on year driven by volume growth and favorable market conditions across activities, in particular for the refining, recycling and distribution activities. Demand for nickel chemicals, precursors for battery applications and metal carboxylates was also strong. Higher revenues were also recorded for tool materials, partly reflecting the successful integration of the recently acquired activities in France.
Construction work to upgrade and expand the cobalt and nickel refinery in Olen, Belgium is well underway and the facility is expected to be commissioned in the second half of 2018.
Revenues for Electroplating increased materially compared to the previous year reflecting volume growth across activities. In particular, sales of precious metal based electrolytes and platinized compounds for electro catalytic applications benefited from strong demand from the portable electronics and electrochemical industries.
9/27
Revenues from Electro-Optics Materials were stable compared to the previous year, with higher revenues for finished infrared optics and substrates offset by a smaller contribution from the refining and recycling activities. Revenues for germanium tetrachloride remained stable.
Revenues from Thin Film Products increased year on year reflecting higher demand in both the large area coatings and the optics and electronics activities. On 20 October 2017, Umicore announced the sale of its large area coatings activity to its joint venture partner First Rare Materials Co., Ltd., the parent company of the Vital Group. The optics and electronics activities have been integrated into the Electro-Optic Materials business unit as of January 2018.
10/27
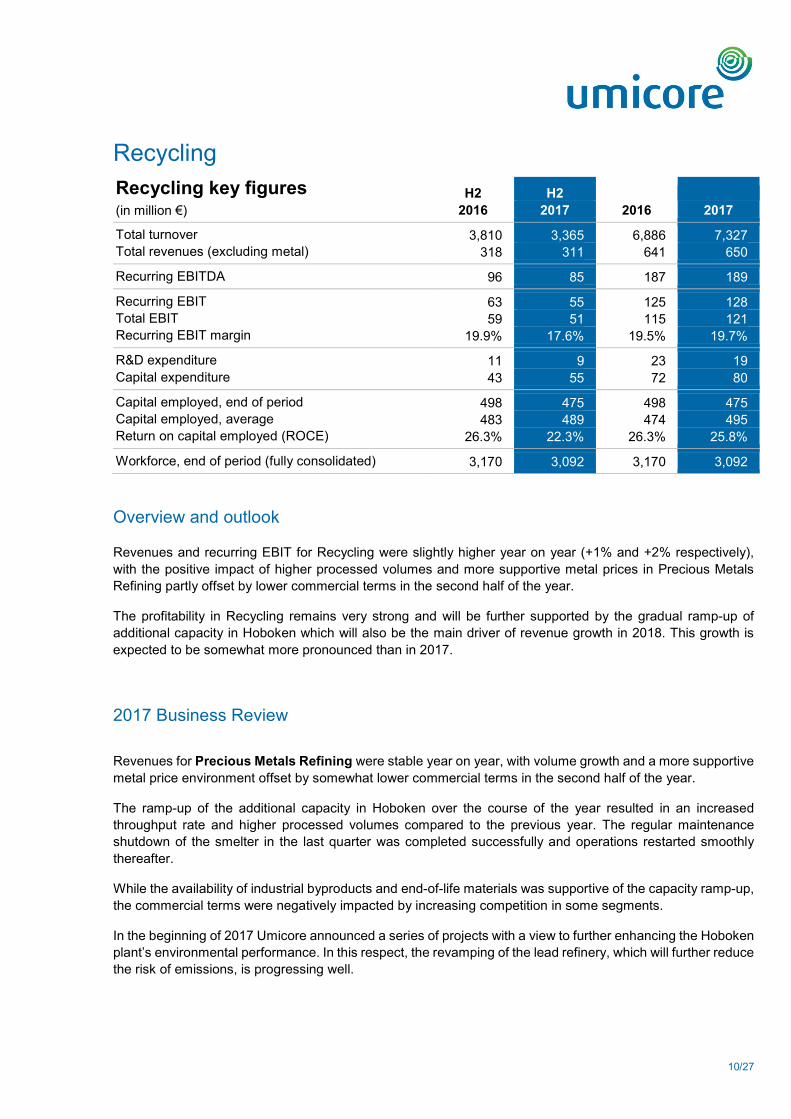
Recycling Recycling key figures H2 H2 (in million €) 2016 2017 2016 2017 Total turnover 3,810 3,365 6,886 7,327 Total revenues (excluding metal) 318 311 641 650 Recurring EBITDA 96 85 187 189 Recurring EBIT 63 55 125 128 Total EBIT 59 51 115 121 Recurring EBIT margin 19.9% 17.6% 19.5% 19.7% R&D expenditure 11 9 23 19 Capital expenditure 43 55 72 80 Capital employed, end of period 498 475 498 475 Capital employed, average 483 489 474 495 Return on capital employed (ROCE) 26.3% 22.3% 26.3% 25.8% Workforce, end of period (fully consolidated) 3,170 3,092 3,170 3,092
Overview and outlook
Revenues and recurring EBIT for Recycling were slightly higher year on year (+1% and +2% respectively), with the positive impact of higher processed volumes and more supportive metal prices in Precious Metals Refining partly offset by lower commercial terms in the second half of the year.
The profitability in Recycling remains very strong and will be further supported by the gradual ramp-up of additional capacity in Hoboken which will also be the main driver of revenue growth in 2018. This growth is expected to be somewhat more pronounced than in 2017.
2017 Business Review
Revenues for Precious Metals Refining were stable year on year, with volume growth and a more supportive metal price environment offset by somewhat lower commercial terms in the second half of the year.
The ramp-up of the additional capacity in Hoboken over the course of the year resulted in an increased throughput rate and higher processed volumes compared to the previous year. The regular maintenance shutdown of the smelter in the last quarter was completed successfully and operations restarted smoothly thereafter.
While the availability of industrial byproducts and end-of-life materials was supportive of the capacity ramp-up, the commercial terms were negatively impacted by increasing competition in some segments.
In the beginning of 2017 Umicore announced a series of projects with a view to further enhancing the Hoboken plant’s environmental performance. In this respect, the revamping of the lead refinery, which will further reduce the risk of emissions, is progressing well.
11/27
Revenues for Jewellery & Industrial Metals were impacted by subdued demand in the product businesses, particularly for silver investment coins. Production at Schöne Edelmetaal, located in the Netherlands, was discontinued in November 2017 and the company will henceforth focus exclusively on the sales and distribution of precious metals.
Revenues for Platinum Engineered Materials increased slightly on the back of higher demand for Umicore’s performance catalysts in a flat market. The construction of the facility in China to serve customers in the display market is on track to be commissioned in the second half of 2018. In line with Umicore’s drive for greater organizational simplicity and considering the operational and commercial fit, the business unit was integrated into Jewellery & Industrials Metals as of January 2018.
Revenues for Technical Materials were in line with the previous year, reflecting stable revenues for both brazing and contact and power technology materials. Margins increased materially due to the impact of cost reduction measures and a more supportive product mix. The sale of the European Technical Materials business to Saxonia Edelmetalle GmbH was completed on 31 January 2018. Umicore is assessing strategic options for its Technical Materials activities in other regions. These remaining activities have also been integrated into the Jewellery & Industrial Metals business unit as of January 2018.
The contribution from the trading activity in Precious Metals Management was higher year on year reflecting improved trading conditions for PGMs. The demand picture for the physical delivery of metals was mixed: investor interest for gold investment bars declined while order levels for industrial metals were higher.
12/27
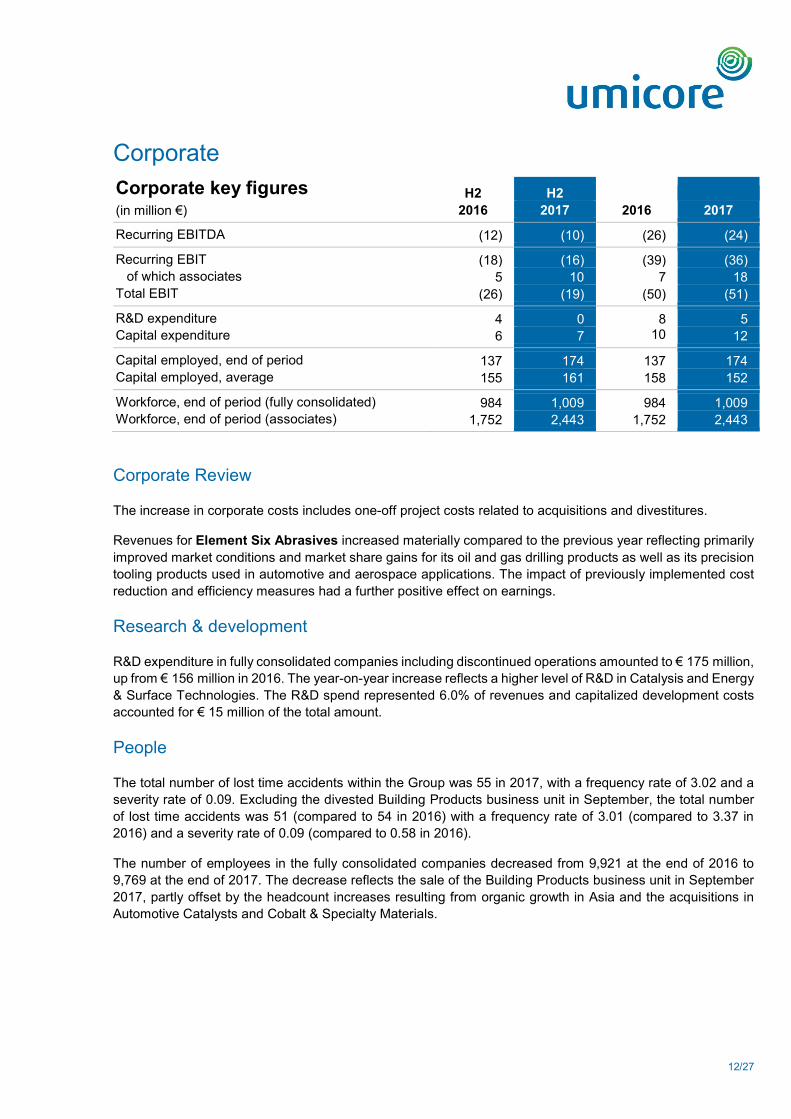
Corporate Corporate key figures H2 H2 (in million €) 2016 2017 2016 2017 Recurring EBITDA (12) (10) (26) (24) Recurring EBIT (18) (16) (39) (36) of which associates 5 10 7 18 Total EBIT (26) (19) (50) (51) R&D expenditure 4 0 8 5 Capital expenditure 6 7 10 12 Capital employed, end of period 137 174 137 174 Capital employed, average 155 161 158 152 Workforce, end of period (fully consolidated) 984 1,009 984 1,009 Workforce, end of period (associates) 1,752 2,443 1,752 2,443
Corporate Review
The increase in corporate costs includes one-off project costs related to acquisitions and divestitures.
Revenues for Element Six Abrasives increased materially compared to the previous year reflecting primarily improved market conditions and market share gains for its oil and gas drilling products as well as its precision tooling products used in automotive and aerospace applications. The impact of previously implemented cost reduction and efficiency measures had a further positive effect on earnings.
Research & development
R&D expenditure in fully consolidated companies including discontinued operations amounted to € 175 million, up from € 156 million in 2016. The year-on-year increase reflects a higher level of R&D in Catalysis and Energy & Surface Technologies. The R&D spend represented 6.0% of revenues and capitalized development costs accounted for € 15 million of the total amount.
People
The total number of lost time accidents within the Group was 55 in 2017, with a frequency rate of 3.02 and a severity rate of 0.09. Excluding the divested Building Products business unit in September, the total number of lost time accidents was 51 (compared to 54 in 2016) with a frequency rate of 3.01 (compared to 3.37 in 2016) and a severity rate of 0.09 (compared to 0.58 in 2016).
The number of employees in the fully consolidated companies decreased from 9,921 at the end of 2016 to 9,769 at the end of 2017. The decrease reflects the sale of the Building Products business unit in September 2017, partly offset by the headcount increases resulting from organic growth in Asia and the acquisitions in Automotive Catalysts and Cobalt & Specialty Materials.
13/27
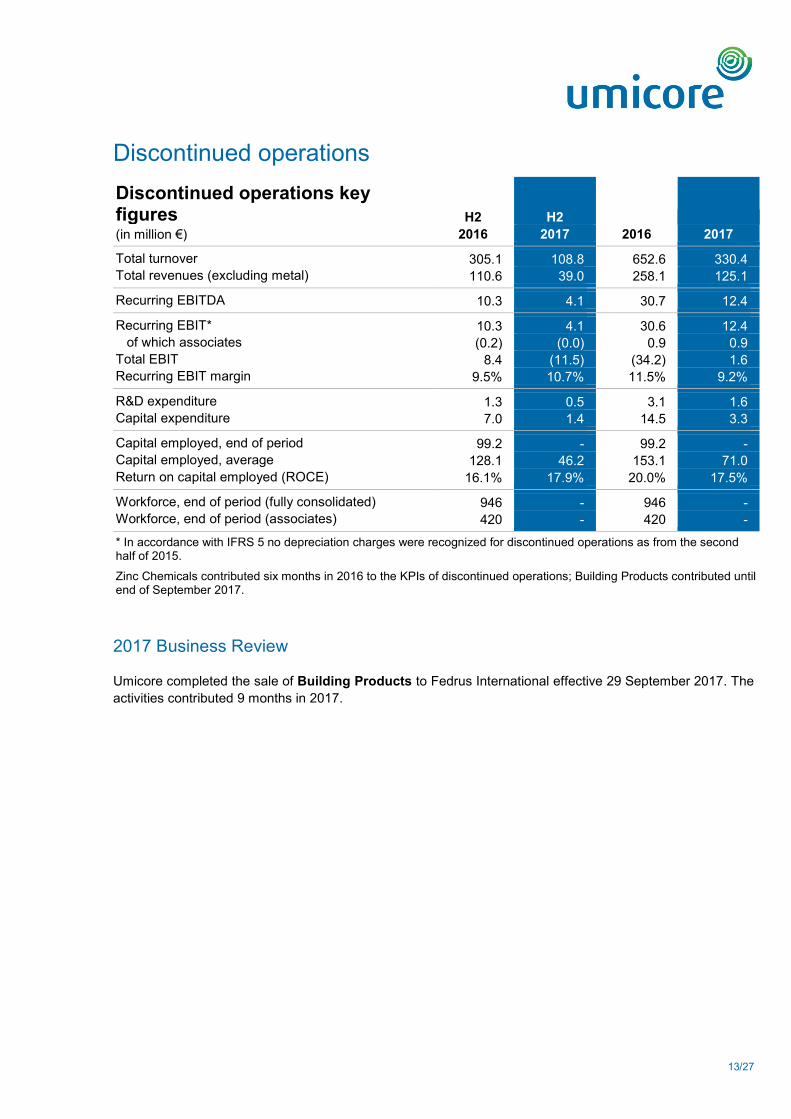
Discontinued operations Discontinued operations key figures H2 H2 (in million €) 2016 2017 2016 2017 Total turnover 305.1 108.8 652.6 330.4 Total revenues (excluding metal) 110.6 39.0 258.1 125.1 Recurring EBITDA 10.3 4.1 30.7 12.4 Recurring EBIT* 10.3 4.1 30.6 12.4 of which associates (0.2) (0.0) 0.9 0.9 Total EBIT 8.4 (11.5) (34.2) 1.6 Recurring EBIT margin 9.5% 10.7% 11.5% 9.2% R&D expenditure 1.3 0.5 3.1 1.6 Capital expenditure 7.0 1.4 14.5 3.3 Capital employed, end of period 99.2 - 99.2 - Capital employed, average 128.1 46.2 153.1 71.0 Return on capital employed (ROCE) 16.1% 17.9% 20.0% 17.5% Workforce, end of period (fully consolidated) 946 - 946 - Workforce, end of period (associates) 420 - 420 - * In accordance with IFRS 5 no depreciation charges were recognized for discontinued operations as from the second half of 2015.
Zinc Chemicals contributed six months in 2016 to the KPIs of discontinued operations; Building Products contributed until end of September 2017.
2017 Business Review
Umicore completed the sale of Building Products to Fedrus International effective 29 September 2017. The activities contributed 9 months in 2017.
14/27
Financial review
Non-recurring items and IAS 39
Non–recurring items had a negative impact of € 46 million on EBIT. Restructuring charges accounted for € 20 million and were primarily related to the sale of Thin Film Products large area coatings activity and the closure of its production site in Providence as well as the discontinuation of production activities at Schöne Edelmetaal in the business unit Jewellery & Industrial Metals. Other items consisted of a € 13 million capital loss on the sale of Building Products (taking into account that no depreciation charges on its assets were recognized as from the second half of 2015 in accordance with IFRS 5), an impairment of Umicore’s shareholding in Nyrstar of € 7 million and environmental provision charges of € 7 million. The impact of non-recurring charges on the net result (Group share) amounted to € 42 million.
IAS 39 accounting rules had a negative effect of € 21 million on EBIT and a negative impact of € 13 million on net result (Group share). All IAS 39 impacts are non-cash in nature.
Financial result and taxation
Net recurring financial charges totalled € 42 million, up compared to the previous year. Higher net financial debt, the drawdown of long term private debt and a higher amount of funding in local currency resulted in an increase of net interest costs.
The recurring tax charge for the period amounted to € 87 million corresponding to a recurring effective tax rate of 25.7% (vs 25.0% last year).
Cashflows
Cashflow from operations was € 218 million, including a € 284 million increase in working capital related to the business expansion, in particular in the Energy & Surface Technologies business group.
Capital expenditures totalled € 365 million, most of which is related to Umicore’s growth investments in clean mobility and recycling. The Energy & Surface Technologies business group accounted for over 60 % of this amount, reflecting in particular the ongoing investment programmes to increase production capacity in cathode materials.
Acquisitions accounted for a cash out of € 212 million and include the acquisition of the remaining 50% stake in Ordeg and of the stationary emission control and heavy duty diesel catalyst business of Haldor Topsoe in the Automotive Catalyst business unit as well as the acquisition of Eurotungstene in the Cobalt & Specialty Materials business unit. This cash out was only partly offset by divestment proceeds.
Financial debt
Net financial debt at 31 December 2017 stood at € 840 million, up from € 296 million at the start of the year, largely driven by Umicore’s capital expenditures and net working capital spending as well as the acquisitions in Automotive Catalysts and Cobalt & Specialty Materials. The amount includes € 690 million long term private debt placements in Europe and the United States. The average net debt to recurring EBITDA ratio corresponded to 93.8%.
Group shareholders’ equity stood at € 1,803 million resulting in a net gearing ratio (net debt / net debt + equity) of 31.1%.
15/27
Dividend and shares
On 16 October 2017 each Umicore share was split into 2 new shares. As a result, as from that date, Umicore’s capital is represented by 224,000,000 fully paid-up shares without nominal value, each representing 1/224,000,000 of the capital.
The Board of Directors will propose a gross annual dividend of € 0.70 per share at the Annual General Meeting on 26 April 2018. Taking into account the interim dividend of € 0.325 per share paid out on 29 August 2017 and subject to shareholder approval, a gross amount of € 0.375 per share will be paid out on 3 May 2018.
Umicore bought back 828,730 own shares in 2017. In the course of the year, 1,597,551 shares were used in the context of exercised stock options. On 31 December 2017 Umicore held 4,505,567 shares in treasury, representing 2.01% of the Group’s outstanding shares.
16/27
Statutory auditor’s note on the consolidated condensed financial information for the year ended on 31 December 2017
The statutory auditor, PwC Reviseurs d’Entreprises sccrl/PwC Bedrijfsrevisoren bcvba, represented by Kurt Cappoen, has confirmed that his audit work, which is substantially complete, has not to date revealed any significant matters requiring adjustments to the 2017 consolidated income statement, the consolidated statement of comprehensive income, the consolidated balance sheet, the consolidated statement of changes in the equity of the Group or consolidated cashflow statement included in this press release.
Sint-Stevens-Woluwe, 8 February 2018
PwC Bedrijfsrevisoren/Reviseurs d'Entreprises sccrl Represented by
Kurt Cappoen Registered auditor
Management responsibility statement
I hereby certify that, to the best of my knowledge, the Consolidated Financial Information of 2017 prepared in accordance with International Financial Reporting Standards, as adopted by the European Union, and with the legal requirements applicable in Belgium, give a true and fair view of the assets, liabilities, financial position and profit or loss of the Group and the undertakings included in the consolidation. The commentary on the overall performance of the Group from page 1 to 15 includes a fair review of the development and performance of the business and the position of the Group and its undertakings included in the consolidation.
Brussels, 8 February 2018
Marc Grynberg Chief Executive Officer
17/27
Consolidated financial information for the year ended on 31 December 2017
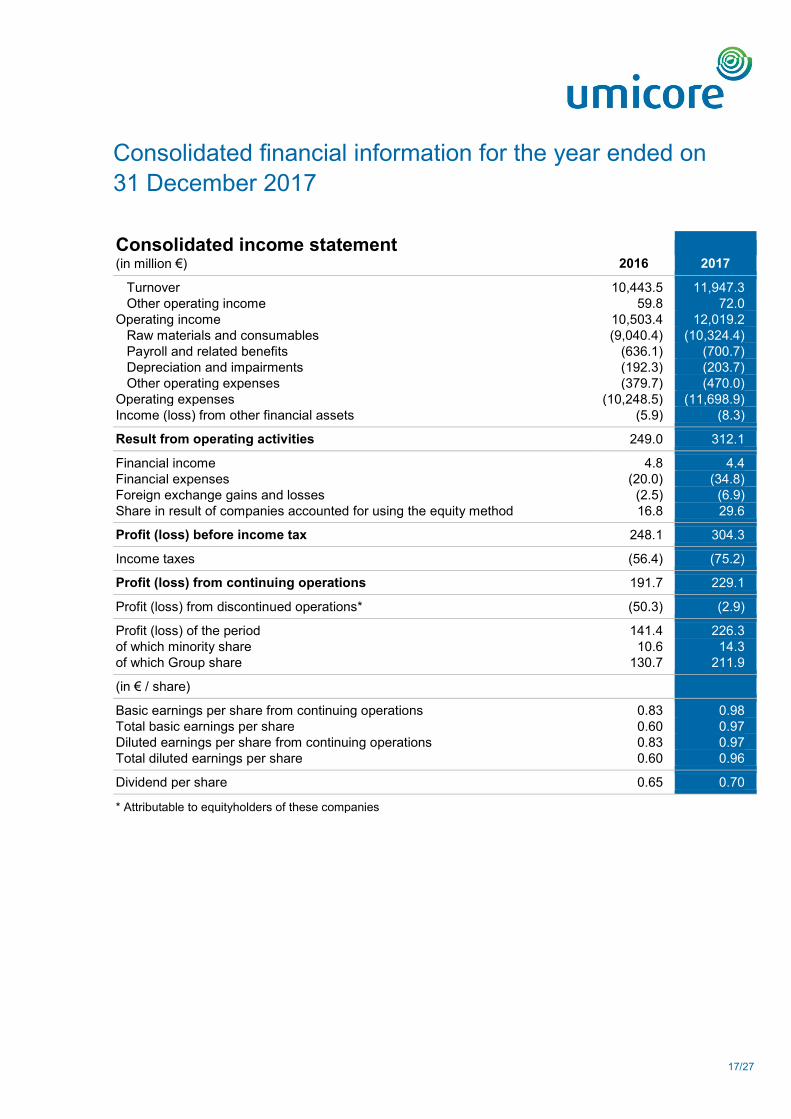
Consolidated income statement (in million €) 2016 2017 Turnover 10,443.5 11,947.3 Other operating income 59.8 72.0 Operating income 10,503.4 12,019.2 Raw materials and consumables (9,040.4) (10,324.4) Payroll and related benefits (636.1) (700.7) Depreciation and impairments (192.3) (203.7) Other operating expenses (379.7) (470.0) Operating expenses (10,248.5) (11,698.9) Income (loss) from other financial assets (5.9) (8.3) Result from operating activities 249.0 312.1 Financial income 4.8 4.4 Financial expenses (20.0) (34.8) Foreign exchange gains and losses (2.5) (6.9) Share in result of companies accounted for using the equity method 16.8 29.6 Profit (loss) before income tax 248.1 304.3 Income taxes (56.4) (75.2) Profit (loss) from continuing operations 191.7 229.1 Profit (loss) from discontinued operations* (50.3) (2.9) Profit (loss) of the period 141.4 226.3 of which minority share 10.6 14.3 of which Group share 130.7 211.9 (in € / share) Basic earnings per share from continuing operations 0.83 0.98 Total basic earnings per share 0.60 0.97 Diluted earnings per share from continuing operations 0.83 0.97 Total diluted earnings per share 0.60 0.96 Dividend per share 0.65 0.70 * Attributable to equityholders of these companies
18/27
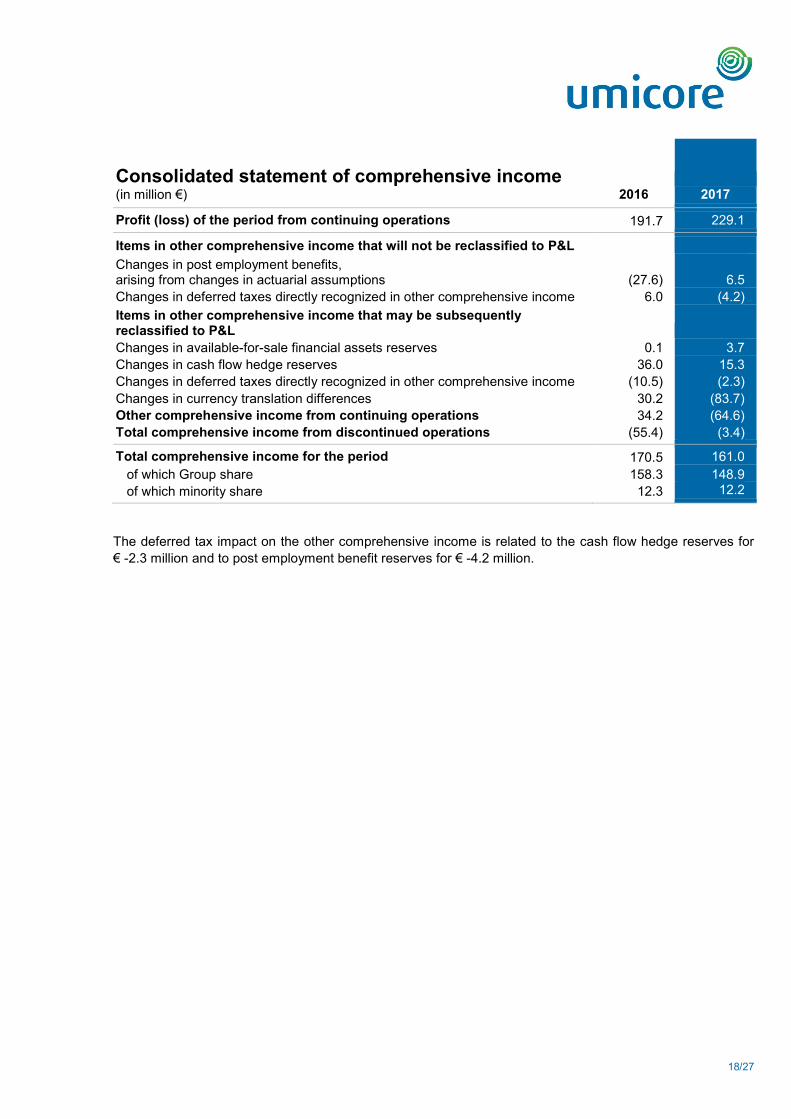
Consolidated statement of comprehensive income (in million €) 2016 2017 Profit (loss) of the period from continuing operations 191.7 229.1 Items in other comprehensive income that will not be reclassified to P&L Changes in post employment benefits, arising from changes in actuarial assumptions (27.6) 6.5 Changes in deferred taxes directly recognized in other comprehensive income 6.0 (4.2) Items in other comprehensive income that may be subsequently reclassified to P&L Changes in available-for-sale financial assets reserves 0.1 3.7 Changes in cash flow hedge reserves 36.0 15.3 Changes in deferred taxes directly recognized in other comprehensive income (10.5) (2.3) Changes in currency translation differences 30.2 (83.7) Other comprehensive income from continuing operations 34.2 (64.6) Total comprehensive income from discontinued operations (55.4) (3.4) Total comprehensive income for the period 170.5 161.0 of which Group share 158.3 148.9 of which minority share 12.3 12.2
The deferred tax impact on the other comprehensive income is related to the cash flow hedge reserves for € -2.3 million and to post employment benefit reserves for € -4.2 million.

19/27
Consolidated balance sheet (in million €) 31/12/2016 31/12/2017 Non-current assets 1,727.4 1,945.7 Intangible assets 305.3 328.8 Property, plant and equipment 1,070.4 1,301.4 Investments accounted for using the equity method 195.3 153.0 Available-for-sale financial assets 26.4 22.3 Loans granted 1.2 11.3 Trade and other receivables 11.1 14.1 Deferred tax assets 117.6 114.7 Current assets 2,164.8 3,170.0 Loans granted 14.8 1.7 Inventories 1,188.8 1,628.4 Trade and other receivables 844.3 1,335.7 Income tax receivables 32.5 36.0 Cash and cash equivalents 84.5 168.1 Assets of discontinued operations 253.5 - Total assets 4,145.7 5,115.7 Equity of the Group 1,848.0 1,862.6 Group shareholders' equity 1,829.0 1,803.0 Share capital and premiums 502.9 502.9 Retained earnings 1,560.0 1,584.4 Currency translation differences and other reserves (144.2) (202.5) Treasury shares (89.6) (81.8) Minority interest 58.4 59.6 Elements of comprehensive income of discontinued operations (39.4) - Non-current liabilities 491.3 1,168.8 Provisions for employee benefits 337.9 342.8 Financial debt 24.4 694.1 Trade and other payables 41.7 40.4 Deferred tax liabilities 6.9 3.5 Provisions 80.4 87.9 Current liabilities 1,661.5 2,084.3 Financial debt 400.8 313.9 Trade and other payables 1,161.4 1,639.8 Income tax payable 57.7 62.8 Provisions 41.7 67.8 Liabilities of discontinued operations 144.9 - Total equity & liabilities 4,145.7 5,115.7
20/27
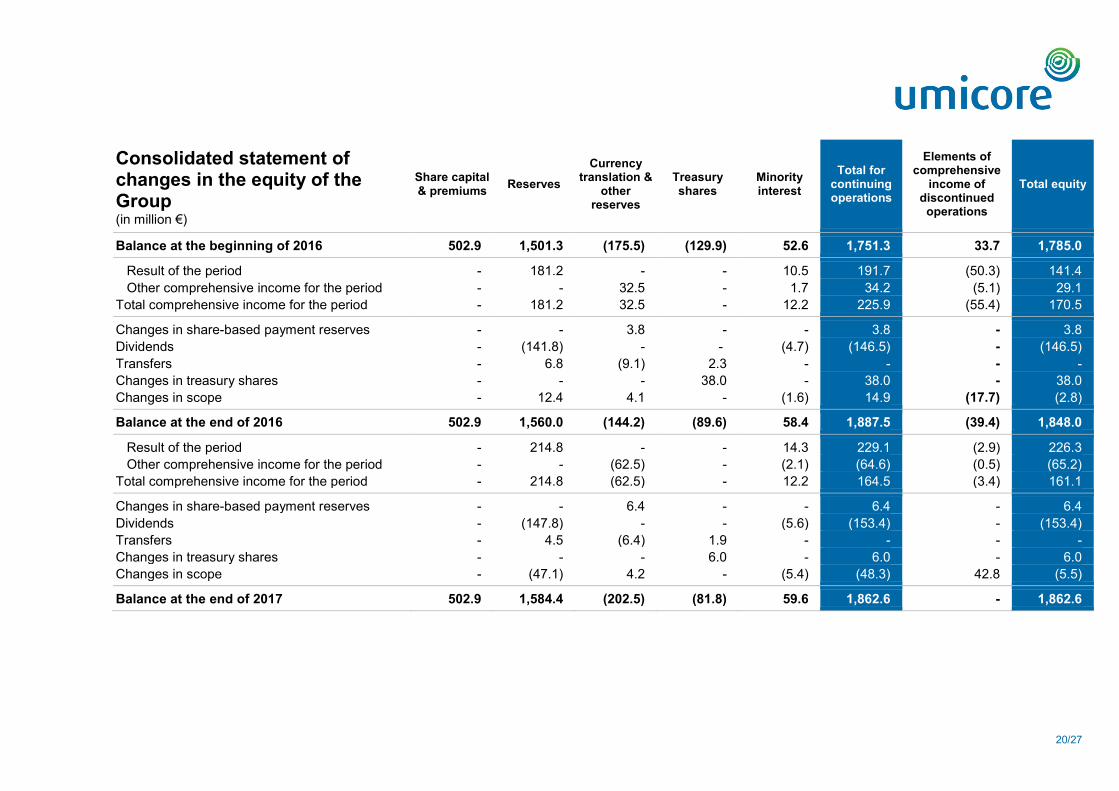
Consolidated statement of changes in the equity of the Group
Share capital & premiums Reserves
Currency translation &
other reserves
Treasury shares
Minority interest
Total for continuing operations
Elements of comprehensive
income of discontinued
operations
Total equity
(in million €) Balance at the beginning of 2016 502.9 1,501.3 (175.5) (129.9) 52.6 1,751.3 33.7 1,785.0 Result of the period - 181.2 - - 10.5 191.7 (50.3) 141.4 Other comprehensive income for the period - - 32.5 - 1.7 34.2 (5.1) 29.1 Total comprehensive income for the period - 181.2 32.5 - 12.2 225.9 (55.4) 170.5 Changes in share-based payment reserves - - 3.8 - - 3.8 - 3.8 Dividends - (141.8) - - (4.7) (146.5) - (146.5) Transfers - 6.8 (9.1) 2.3 - - - - Changes in treasury shares - - - 38.0 - 38.0 - 38.0 Changes in scope - 12.4 4.1 - (1.6) 14.9 (17.7) (2.8) Balance at the end of 2016 502.9 1,560.0 (144.2) (89.6) 58.4 1,887.5 (39.4) 1,848.0 Result of the period - 214.8 - - 14.3 229.1 (2.9) 226.3 Other comprehensive income for the period - - (62.5) - (2.1) (64.6) (0.5) (65.2) Total comprehensive income for the period - 214.8 (62.5) - 12.2 164.5 (3.4) 161.1 Changes in share-based payment reserves - - 6.4 - - 6.4 - 6.4 Dividends - (147.8) - - (5.6) (153.4) - (153.4) Transfers - 4.5 (6.4) 1.9 - - - - Changes in treasury shares - - - 6.0 - 6.0 - 6.0 Changes in scope - (47.1) 4.2 - (5.4) (48.3) 42.8 (5.5) Balance at the end of 2017 502.9 1,584.4 (202.5) (81.8) 59.6 1,862.6 - 1,862.6
21/27
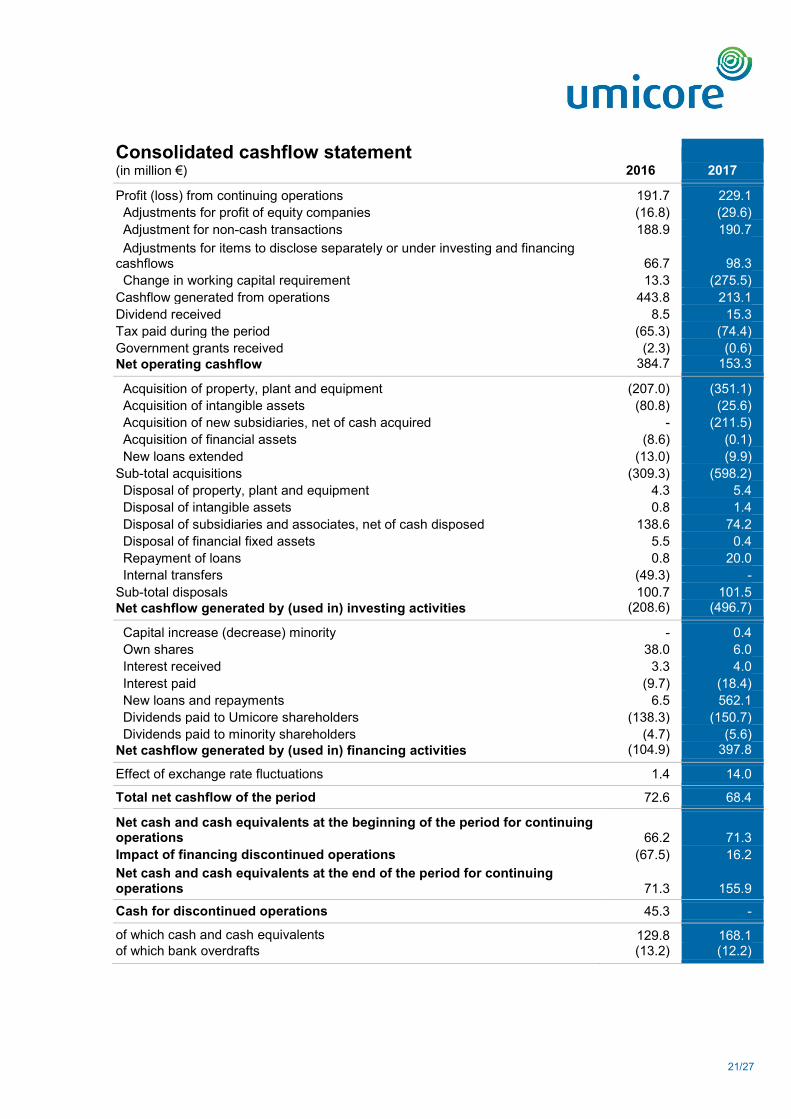
Consolidated cashflow statement (in million €) 2016 2017 Profit (loss) from continuing operations 191.7 229.1 Adjustments for profit of equity companies (16.8) (29.6) Adjustment for non-cash transactions 188.9 190.7 Adjustments for items to disclose separately or under investing and financing cashflows 66.7 98.3 Change in working capital requirement 13.3 (275.5) Cashflow generated from operations 443.8 213.1 Dividend received 8.5 15.3 Tax paid during the period (65.3) (74.4) Government grants received (2.3) (0.6) Net operating cashflow 384.7 153.3 Acquisition of property, plant and equipment (207.0) (351.1) Acquisition of intangible assets (80.8) (25.6) Acquisition of new subsidiaries, net of cash acquired - (211.5) Acquisition of financial assets (8.6) (0.1) New loans extended (13.0) (9.9) Sub-total acquisitions (309.3) (598.2) Disposal of property, plant and equipment 4.3 5.4 Disposal of intangible assets 0.8 1.4 Disposal of subsidiaries and associates, net of cash disposed 138.6 74.2 Disposal of financial fixed assets 5.5 0.4 Repayment of loans 0.8 20.0 Internal transfers (49.3) - Sub-total disposals 100.7 101.5 Net cashflow generated by (used in) investing activities (208.6) (496.7) Capital increase (decrease) minority - 0.4 Own shares 38.0 6.0 Interest received 3.3 4.0 Interest paid (9.7) (18.4) New loans and repayments 6.5 562.1 Dividends paid to Umicore shareholders (138.3) (150.7) Dividends paid to minority shareholders (4.7) (5.6) Net cashflow generated by (used in) financing activities (104.9) 397.8 Effect of exchange rate fluctuations 1.4 14.0 Total net cashflow of the period 72.6 68.4 Net cash and cash equivalents at the beginning of the period for continuing operations 66.2 71.3 Impact of financing discontinued operations (67.5) 16.2 Net cash and cash equivalents at the end of the period for continuing operations 71.3 155.9 Cash for discontinued operations 45.3 - of which cash and cash equivalents 129.8 168.1 of which bank overdrafts (13.2) (12.2)
22/27
Condensed segment information 2016 Catalysis
Energy & Surface
Technologies Recycling Corporate Eliminations
Total Continued operations
Discontinued operations Total
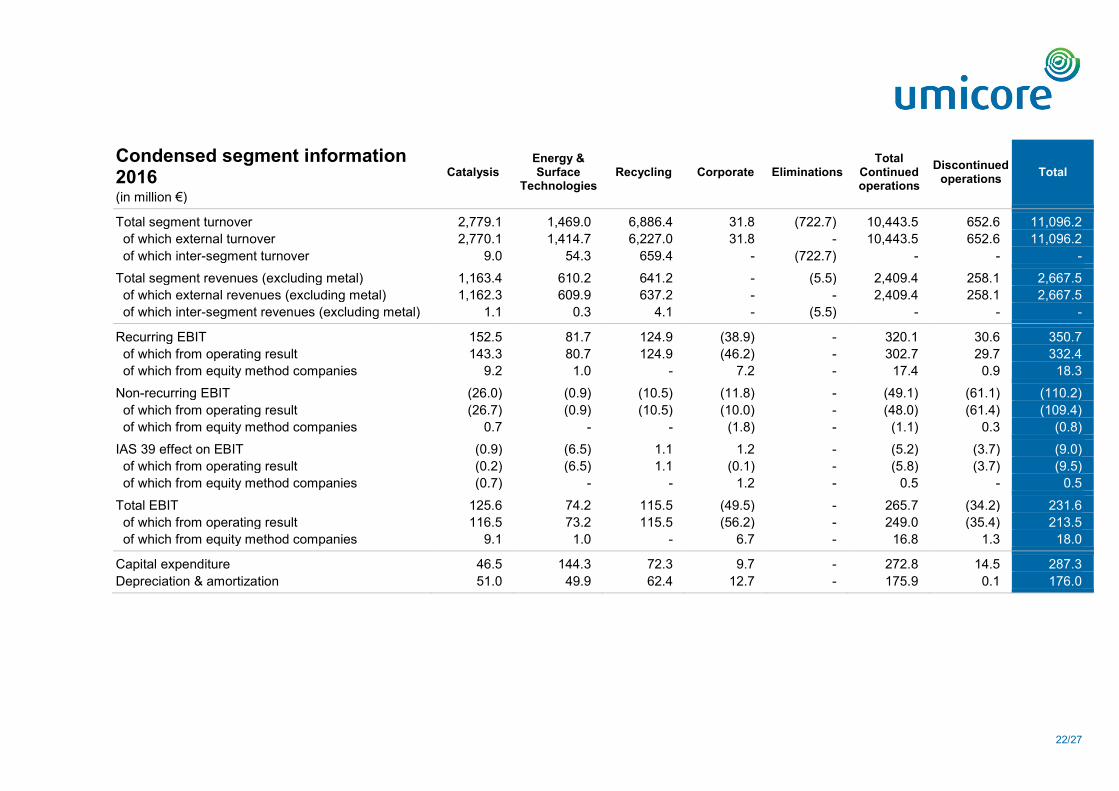
(in million €) Total segment turnover 2,779.1 1,469.0 6,886.4 31.8 (722.7) 10,443.5 652.6 11,096.2 of which external turnover 2,770.1 1,414.7 6,227.0 31.8 - 10,443.5 652.6 11,096.2 of which inter-segment turnover 9.0 54.3 659.4 - (722.7) - - - Total segment revenues (excluding metal) 1,163.4 610.2 641.2 - (5.5) 2,409.4 258.1 2,667.5 of which external revenues (excluding metal) 1,162.3 609.9 637.2 - - 2,409.4 258.1 2,667.5 of which inter-segment revenues (excluding metal) 1.1 0.3 4.1 - (5.5) - - - Recurring EBIT 152.5 81.7 124.9 (38.9) - 320.1 30.6 350.7 of which from operating result 143.3 80.7 124.9 (46.2) - 302.7 29.7 332.4 of which from equity method companies 9.2 1.0 - 7.2 - 17.4 0.9 18.3 Non-recurring EBIT (26.0) (0.9) (10.5) (11.8) - (49.1) (61.1) (110.2) of which from operating result (26.7) (0.9) (10.5) (10.0) - (48.0) (61.4) (109.4) of which from equity method companies 0.7 - - (1.8) - (1.1) 0.3 (0.8) IAS 39 effect on EBIT (0.9) (6.5) 1.1 1.2 - (5.2) (3.7) (9.0) of which from operating result (0.2) (6.5) 1.1 (0.1) - (5.8) (3.7) (9.5) of which from equity method companies (0.7) - - 1.2 - 0.5 - 0.5 Total EBIT 125.6 74.2 115.5 (49.5) - 265.7 (34.2) 231.6 of which from operating result 116.5 73.2 115.5 (56.2) - 249.0 (35.4) 213.5 of which from equity method companies 9.1 1.0 - 6.7 - 16.8 1.3 18.0 Capital expenditure 46.5 144.3 72.3 9.7 - 272.8 14.5 287.3 Depreciation & amortization 51.0 49.9 62.4 12.7 - 175.9 0.1 176.0

23/27
Condensed segment information 2017 Catalysis
Energy & Surface
Technologies Recycling Corporate Eliminations
Total Continued operations
Discontinued operations Total
(in million €) Total segment turnover 3,090.6 2,392.4 7,326.7 43.9 (906.3) 11,947.3 330.4 12,277.6 of which external turnover 3,068.3 2,333.7 6,501.4 43.9 - 11,947.3 330.4 12,277.6 of which inter-segment turnover 22.2 58.7 825.4 - (906.3) - - - Total segment revenues (excluding metal) 1,253.1 893.6 650.3 - (6.4) 2,790.6 125.1 2,915.7 of which external revenues (excluding metal) 1,251.8 893.3 645.5 - - 2,790.6 125.1 2,915.7 of which inter-segment revenues (excluding metal) 1.3 0.4 4.8 - (6.4) - - - Recurring EBIT 165.5 140.7 127.9 (36.3) - 397.9 12.4 410.3 of which from operating result 165.1 130.2 127.9 (54.2) - 369.1 11.5 380.6 of which from equity method companies 0.4 10.5 - 17.9 - 28.8 0.9 29.6 Non-recurring EBIT (0.4) (14.8) (2.7) (15.3) - (33.2) (13.0) (46.2) of which from operating result - (14.8) (2.7) (14.9) - (32.4) (13.0) (45.5) of which from equity method companies (0.4) - - (0.4) - (0.8) - (0.8) IAS 39 effect on EBIT (3.9) (16.2) (3.9) 1.0 - (23.0) 2.3 (20.7) of which from operating result (4.8) (16.2) (3.9) 0.3 - (24.6) 2.3 (22.3) of which from equity method companies 0.9 - - 0.7 - 1.6 - 1.6 Total EBIT 161.2 109.7 121.3 (50.6) - 341.6 1.6 343.3 of which from operating result 160.3 99.2 121.3 (68.8) - 312.1 0.8 312.9 of which from equity method companies 0.9 10.5 - 18.2 - 29.6 0.9 30.4 Capital expenditure 45.0 225.5 79.5 11.9 - 361.9 3.3 365.2 Depreciation & amortization 58.9 57.6 61.8 12.2 - 190.5 - 190.5
24/27
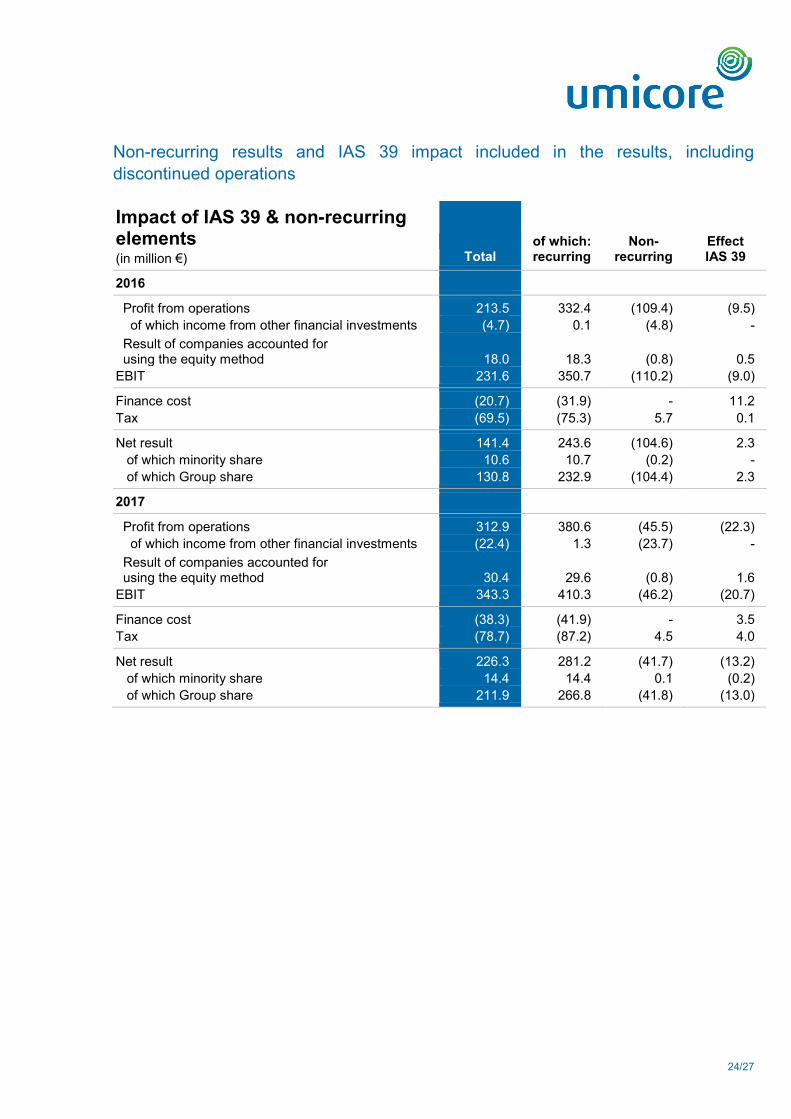
Non-recurring results and IAS 39 impact included in the results, including discontinued operations
Impact of IAS 39 & non-recurring elements of which: Non- Effect (in million €) Total recurring recurring IAS 39 2016 Profit from operations 213.5 332.4 (109.4) (9.5) of which income from other financial investments (4.7) 0.1 (4.8) - Result of companies accounted for using the equity method 18.0 18.3 (0.8) 0.5 EBIT 231.6 350.7 (110.2) (9.0) Finance cost (20.7) (31.9) - 11.2 Tax (69.5) (75.3) 5.7 0.1 Net result 141.4 243.6 (104.6) 2.3 of which minority share 10.6 10.7 (0.2) - of which Group share 130.8 232.9 (104.4) 2.3 2017 Profit from operations 312.9 380.6 (45.5) (22.3) of which income from other financial investments (22.4) 1.3 (23.7) - Result of companies accounted for using the equity method 30.4 29.6 (0.8) 1.6 EBIT 343.3 410.3 (46.2) (20.7) Finance cost (38.3) (41.9) - 3.5 Tax (78.7) (87.2) 4.5 4.0 Net result 226.3 281.2 (41.7) (13.2) of which minority share 14.4 14.4 0.1 (0.2) of which Group share 211.9 266.8 (41.8) (13.0)
25/27
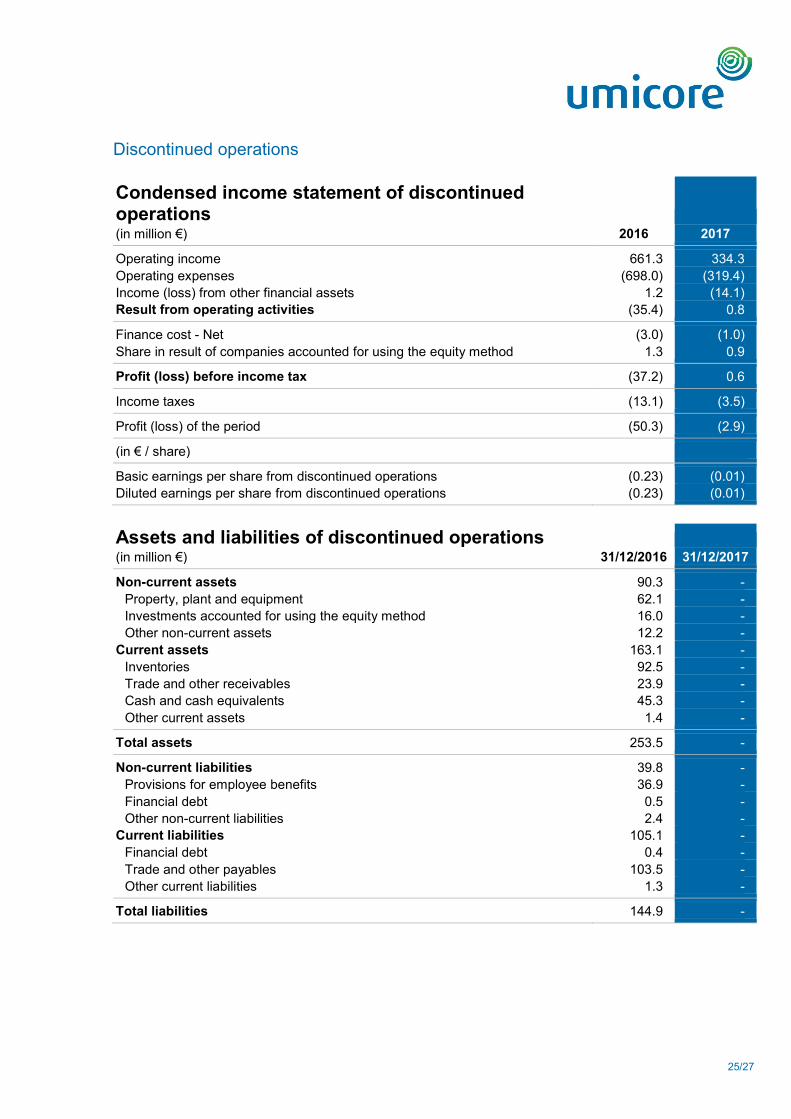
Discontinued operations
Condensed income statement of discontinued operations (in million €) 2016 2017 Operating income 661.3 334.3 Operating expenses (698.0) (319.4) Income (loss) from other financial assets 1.2 (14.1) Result from operating activities (35.4) 0.8 Finance cost - Net (3.0) (1.0) Share in result of companies accounted for using the equity method 1.3 0.9 Profit (loss) before income tax (37.2) 0.6 Income taxes (13.1) (3.5) Profit (loss) of the period (50.3) (2.9) (in € / share) Basic earnings per share from discontinued operations (0.23) (0.01) Diluted earnings per share from discontinued operations (0.23) (0.01) Assets and liabilities of discontinued operations (in million €) 31/12/2016 31/12/2017 Non-current assets 90.3 -
Property, plant and equipment 62.1 - Investments accounted for using the equity method 16.0 - Other non-current assets 12.2 -
Current assets 163.1 - Inventories 92.5 - Trade and other receivables 23.9 - Cash and cash equivalents 45.3 - Other current assets 1.4 -
Total assets 253.5 - Non-current liabilities 39.8 -
Provisions for employee benefits 36.9 - Financial debt 0.5 - Other non-current liabilities 2.4 -
Current liabilities 105.1 - Financial debt 0.4 - Trade and other payables 103.5 - Other current liabilities 1.3 -
Total liabilities 144.9 -
26/27
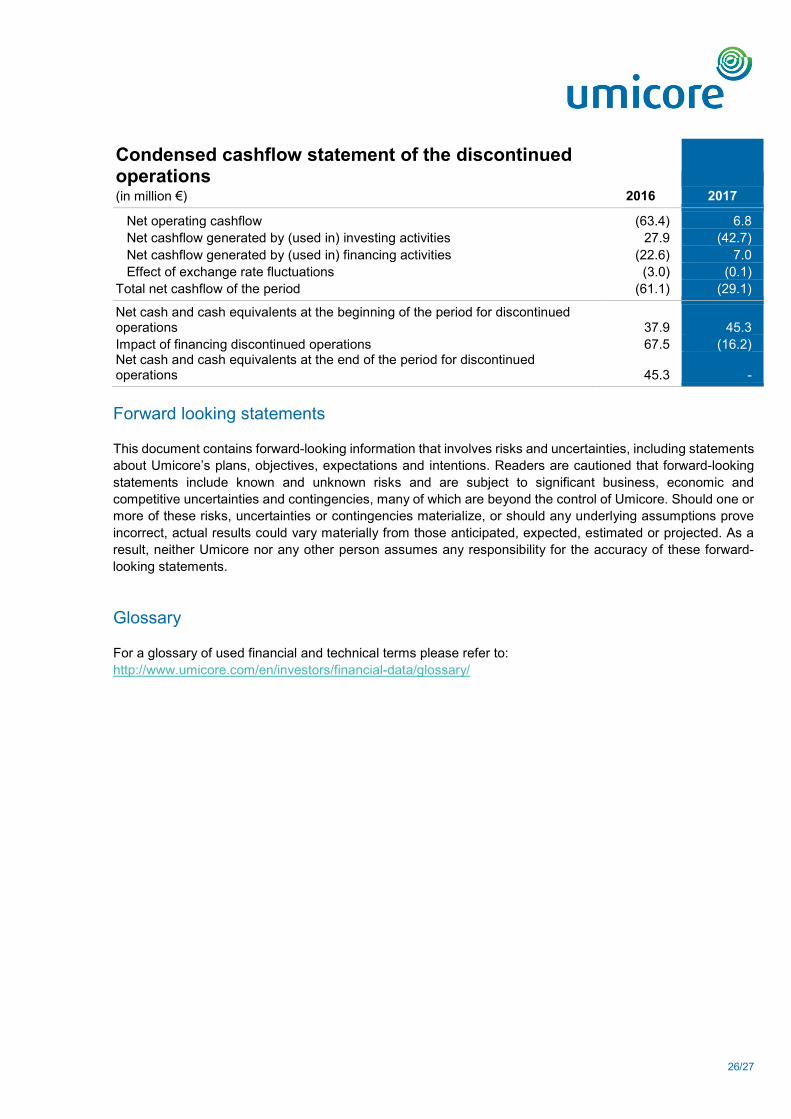
Condensed cashflow statement of the discontinued operations (in million €) 2016 2017 Net operating cashflow (63.4) 6.8 Net cashflow generated by (used in) investing activities 27.9 (42.7) Net cashflow generated by (used in) financing activities (22.6) 7.0 Effect of exchange rate fluctuations (3.0) (0.1) Total net cashflow of the period (61.1) (29.1) Net cash and cash equivalents at the beginning of the period for discontinued operations 37.9 45.3 Impact of financing discontinued operations 67.5 (16.2) Net cash and cash equivalents at the end of the period for discontinued operations 45.3 -
Forward looking statements
This document contains forward-looking information that involves risks and uncertainties, including statements about Umicore’s plans, objectives, expectations and intentions. Readers are cautioned that forward-looking statements include known and unknown risks and are subject to significant business, economic and competitive uncertainties and contingencies, many of which are beyond the control of Umicore. Should one or more of these risks, uncertainties or contingencies materialize, or should any underlying assumptions prove incorrect, actual results could vary materially from those anticipated, expected, estimated or projected. As a result, neither Umicore nor any other person assumes any responsibility for the accuracy of these forward-looking statements.
Glossary
For a glossary of used financial and technical terms please refer to: http://www.umicore.com/en/investors/financial-data/glossary/
27/27
For more information
Investor Relations
Evelien Goovaerts +32 2 227 78 38 [email protected]
Eva Behaeghe +32 2 227 70 68 [email protected]
Media Relations
Marjolein Scheers +32 2 227 71 47 [email protected]
Financial calendar
23 March 2018 Publication of the annual report 2017
26 April 2018 Annual General Meeting
30 April 2018 Ex-dividend trading date
2 May 2018 Record date for the dividend
3 May 2018 Payment date for the dividend
6 & 7 June 2018 Capital Market Days - South Korea
30 July 2018 Half year results 2018
7 February 2019 Full year results 2018
Umicore profile
Umicore is a global materials technology and recycling group. It focuses on application areas where its expertise in materials science, chemistry and metallurgy makes a real difference. Its activities are organised in three business groups: Catalysis, Energy & Surface Technologies and Recycling. Each business group is divided into market-focused business units offering materials and solutions that are at the cutting edge of new technological developments and essential to everyday life.
Umicore generates the majority of its revenues and dedicates most of its R&D efforts to clean mobility materials and recycling. Umicore’s overriding goal of sustainable value creation is based on an ambition to develop, produce and recycle materials in a way that fulfils its mission: materials for a better life.
Umicore’s industrial and commercial operations as well as R&D activities are located across the world to best serve its global customer base. The Group generated a turnover of € 12.3 billion (€ 2.9 billion excluding metal) in 2017 and currently employs 9,700 people.
Umicore will host two analyst and investor conference calls:
• Today, 8 February 2018, at 18:00 CET, Marc Grynberg, CEO, will highlight in brief some of the key messages contained in today’s press release announcing Umicore’s financial and operational results for 2017, discuss the rationale for the capital raising transaction referred to in the release, and comment on Umicore’s capital expenditure plans
• Tomorrow, 9 February 2018, at 09:30 CET: Marc Grynberg, CEO, and Filip Platteeuw, CFO, will comment, as usual, in more detail on the key messages contained in the press release. At that time, the lines will also be opened for questions.
Please visit: http://www.umicore.com/en/investors/financial-calendar/fyr2017en/


![TeaStore - performance-symposium.org€¦ · Dell DVDStore, ACME Air, Spring Cloud Demo, and morein our MASCOTS paper [4] Introduction. TeaStore. Use-Cases Conclusion. TeaStore: Micro](https://img.pdfslide.us/doc/110x75/5e9f6b4caaa64651467a600d/teastore-performance-dell-dvdstore-acme-air-spring-cloud-demo-and-morein-our.jpg)