Embed Size (px)
Citation preview
INFORMATION TO USERS
This manuscript ,has been reproduced from the microfilm master. UMI
films the text directly from the original or copy submitted. Thus, some
thesis and dissertation copies are in typewriter face, while others may
be from any type of computer printer.
The quality of this reproduction is dependent upon the quality of thecopy submitted. Broken or indistinct print, colored or poor quality
illustrations and photographs, print bleedthrough, substandard margins,
and improper alignment can adversely affect reproduction.
In the unlikely. event that the author did not send UMI a complete
manuscript and there are missing pages, these will be noted. Also, if
unauthorized copyright material had to be removed, a note will indicate
the deletion.
Oversize materials (e.g., maps, drawings, charts) are reproduced by
sectioning the original, beginning at the upper left-hand comer and
continuing from left to right in equal sections with small overlaps. Each
original is also photographed in one exposure and is included in
reduced form at the back of the book.
Photographs included in the original manuscript have been reproduced
xerographically in this copy. Higher quality 6" x 9" black and white
photographic prints are available for any photographs or illustrations
appearing in this copy for an additional charge. Contact UMI directly
to order.
UMIA Bell & Howell mtormanon Company
300 North Zeeb Road. Ann Arbor. MI48106-1346 USA313/761-4700 800:521-0600

THE INFLUENCE OF MICROFOSSIL CONTENT
ON THE PHYSICAL PROPERTIES OF CALCAREOUS SEDIMENTS
FROM THE ONTONG JAVA PLATEAU
A DISSERTATION SUBMITTED TO THE GRADUATE DIVISION OF THEUNIVERSITY OF HAWAI'I IN PARTIAL FULFILLMENT OF THE
REQUIREMENTS FOR THE DEGREE OF
DOCTOR OF PHILOSOPHY
IN
GEOLOGY AND GEOPHYSICS
MAY 1995
By
Janice Christine Marsters
Dissertation Committee:
Murli Manghnani, ChairpersonJames Cowen
Loren KroenkeJohanna Resig
Jane TribbleRoy Wilkens
UMI Number: 9532607
OMI Microform 9532607Copyright 1995, by OMI Company. All rights reserved.
This microform edition is protected against unauthorizedcopying under Title 17, United States Code.
UMI300 North Zeeb RoadAnn Arbor, MI 48103

ACKNOWLEDGEMENTS
In geology, a "superindividual" is defined as an aggregate of grains that
behaves as a unit in the fabric of a rock. I have been truly blessed by "super
individuals" among my family, friends and colleagues who, together, have
made this process possible and endurable. I now find myself faced with the
daunting task of acknowledging their gifts in a few words.
I thank my parents for their gifts of love and unconditional support.
They may not have understood some of the choices I made, but they have
always encouraged me (in words and through their own example) to do the
best I could in whatever the task. My father's innate common sense, his
ability to do anything he sets his mind and hands to, and his love of math
and science were wonderful to experience as a child, and have fostered in me
a deep reverence for discovery. My mother's persistent and thoughtful love
has been a steadying force all my life. I thank my siblings Dean, Stephen and
Dawn for all their phone calls. Our mutual love of geology makes us an odd
family! I thank my grandparents for their quiet faith in me, and especially
grandmother Anne MacDonald for all her letters that have kept me in touch
with my far-away home.
I thank my teachers for their gifts of knowledge and empowering
confidence in my abilities. I was blessed to have attended a small school
where female students were never discouraged from math and science.
I have a fond place in my heart for the late Allister Clark, my high school
principal and teacher who, perhaps partly because he had two daughters for
whom he wanted the world, challenged his female students to be the best
they could be. I thank Dr. Leslie Baikie, my master's degree chairperson at the
iii

Technical University of Nova Scotia, for suggesting I take on a project with
the marine geotechnical group at the Atlantic Geoscience Centre (Bedford
institute of Oceanography), thus spawning my love of marine geology.
I thank my colleagues in Canada for their gifts of mentorship and
friendship, and for showing by example what it is to love science (and also
how to survive those long days at sea on a research vessel). I especially thank
Kate Moran for sharing her joy of science, strength, and camaraderie (and
some good aerobics moves). I hope we solve puzzles together for a long time
to come! I thank Kate Jarrett for her assistance and laughter during testing in
the geotechnical lab at the Atlantic Geoscience Centre and Patricia Stoffyn for
assistance with SEM analyses. I thank David Mosher for his friendship and
off-the-wall humor during many cruises. I especially thank Larry Mayer for
suggesting that I come to Hawai'i and for caring how I did here.
I thank my colleagues at the University of Hawai'i for their gifts of
encouragement and acts of kindness. I thank Neil Fraser for his confidence in
me and for not letting me give up. I thank Alexander Shor for his support in
many guises. I thank my Ph.D. committee members, James Cowen, Loren
Kroenke, Johanna Resig, Jane Tribble, Roy Wilkens, and especially my
chairperson, Murli Manghnani, for their guidance, encouragement, and
constructive criticism. I thank Fred MacKenzie for his guidance as an early
member of my committee. I thank Don McGee for his assistance with SEM
analyses, John Balogh for assistance in the mineral physics laboratory, and
Johanna Resig and James Wilcoxon for the microfossil analyses used in this
dissertation.
I thank Loren Kroenke, Wolfgang Berger, and the scientific party of
ODP Leg 130 for their strong support of the physical properties program. I also
iv

thank the shipboard technical staff of the Ocean Drilling Program for their
efforts in obtaining good-quality samples. I am thankful for the opportunities
I have had through public funding: participation on Ocean Drilling Program
Leg 130 and post-cruise research, including consolidation testing and
microfossil analyses, were supported by USSAC funding.
I thank my coworkers and friends at Masa Fujioka & Associates,
particularly Masa Fujioka and Jennifer Kleveno, for their gifts of support
during this process. I know they lightened my work load considerably (by
taking more work upon themselves) during the last few months. Their
encouragement and confidence in my abilities made this a much easier task.
I thank my friends for their gifts of joy, kindness, and love. I thank my
friends at home in Canada, J. J. Jansen, Leah Clark, Laurel Clark, Anne
Ackerman, and Nancy Dyke for all their good thoughts and kind messages. I
am blessed to have had many good friends in Hawai'i whose kind thoughts
and wishes helped me through this task. In particular, I thank Amy Sheridan
and Eric Halter for their thoughtful caring. I thank Robin Brandt for dancing
hula with me in our living room when I couldn't think about science
anymore and for feeding me tea and scones. I thank Leolani Abdul for her
good humor and the sweetened condensed milk. I thank Johanna Resig for
art-full evenings and quietly reminding me I still had this to finish. And I
especially thank Michael Tanenbaum for his patient love and support, and
for being there when I needed him.
Finally, I thank my friends and fellow geology graduate students for
their gifts of insight and compassion and for sharing parts of the journey with
me. In particular, I thank Beth Jorgenson for sharing lots of guffaws and for
telling it like it is. I thank Frank Trusdell for many moments of joy and
v

laughter and for instigating my thoughts of Hawai'i as my home. I thank
Suki Smaglik for her many selfless acts of kindness and for sharing her love
of Hawai'i. And I especially thank Mary MacKay for her unwavering
encouragement, for always listening, and for dinner and companionship
during some of my late nights at the computer.
For me, the blessing has not been the completion of this work. It has
been having these cherished people, the "super individuals" of my life, share
the journey with me. Mahalo nui loa.
vi
ABSTRACT
This work is based on results from Ocean Drilling Program Leg 130,
which drilled the Ontong Java Plateau, a broad submarine plateau in the
western equatorial Pacific. The Ontong Java Plateau has a unique
combination of geographic location and bathymetry that makes it ideally
suited for paleoceanographic studies. This study addresses several aspects of
plateau sediment physical properties (e.g., porosity, velocity, acoustic
impedance, compression and expansion indexes, and rebound) within the
broad framework of establishing relationships between physical properties
and microfossil content and preservation.
Samples obtained in Hole 803D were analyzed to determine their
microfossil constituents. The resulting data are compared to shipboard
measured physical properties data to assess the relationships between small
scale fluctuations in physical properties and microfossil content. Impedance
was found to increase with increasing grain size and planktonic foraminifera
content. Variations in the coarse fraction constituents appear to have a more
significant effect on the physical properties than do variations in the fine
fraction constituents, though the fine fraction make up greater than 85% of
the samples by weight. Many of the seismic reflectors identified by shipboard
scientists could be related to changes in the relative percentages of microfossil
constituents.
The consolidation behavior of Ontong Java Plateau sediments was
observed to relate to sediment composition. In general, consolidation test
parameters from this study are consistent with those of other researchers for
sediments of similar carbonate contents. We found that both compression
vii
and expansion indices decrease with increasing carbonate content and with
increasing foraminifer content.
Rebound curves derived from consolidation tests on Ontong Java
Plateau samples yield porosity rebounds of 1% to 4% for these sediments at
equivalent depths of 200 to 1200 meters below seafloor (mbsf), The exception
is a radiolarian-rich sample that has 6% rebound. We combined the rebound
correction derived from the porosity rebound vs. depth data with the
correction for pore-water expansion to correct the shipboard laboratory
porosity data to in-situ values. The rebound-corrected laboratory data can be
used as in situ data in place of missing or erroneous downhole logging data.
viii
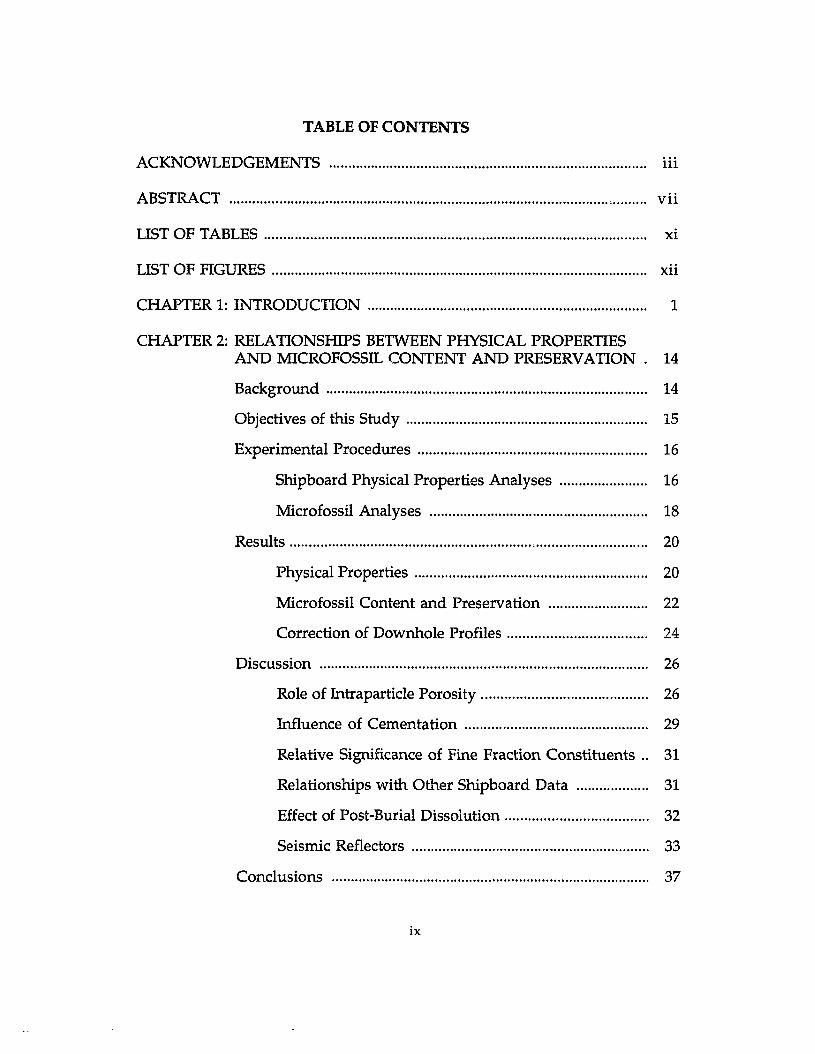
TABLE OFCONTENTS
ACKNOWLEDGEMENTS iii
ABSTRACT ,......... vii
LIST OF TABLES xi
LIST OF FIGURES xii
CHAPTER 1: INTRODUCTION 1
CHAPTER 2: RELATIONSHIPS BETWEEN PHYSICAL PROPERTIESAND MICROFOSSIL CONTENT AND PRESERVATION. 14
Background 14
Objectives of this Study............................................................... 15
Experimental Procedures 16
Shipboard Physical Properties Analyses 16
Microfossil Analyses 18
Results 20
Physical Properties 20
Microfossil Content and Preservation 22
Correction of Downhole Profiles 24
Discussion 26
Role of Intraparticle Porosity........................................... 26
Influence of Cementation 29
Relative Significance of Fine Fraction Constituents.. 31
Relationships with Other Shipboard Data 31
Effect of Post-Burial Dissolution 32
Seismic Reflectors .. 33
Conclusions 37
ix
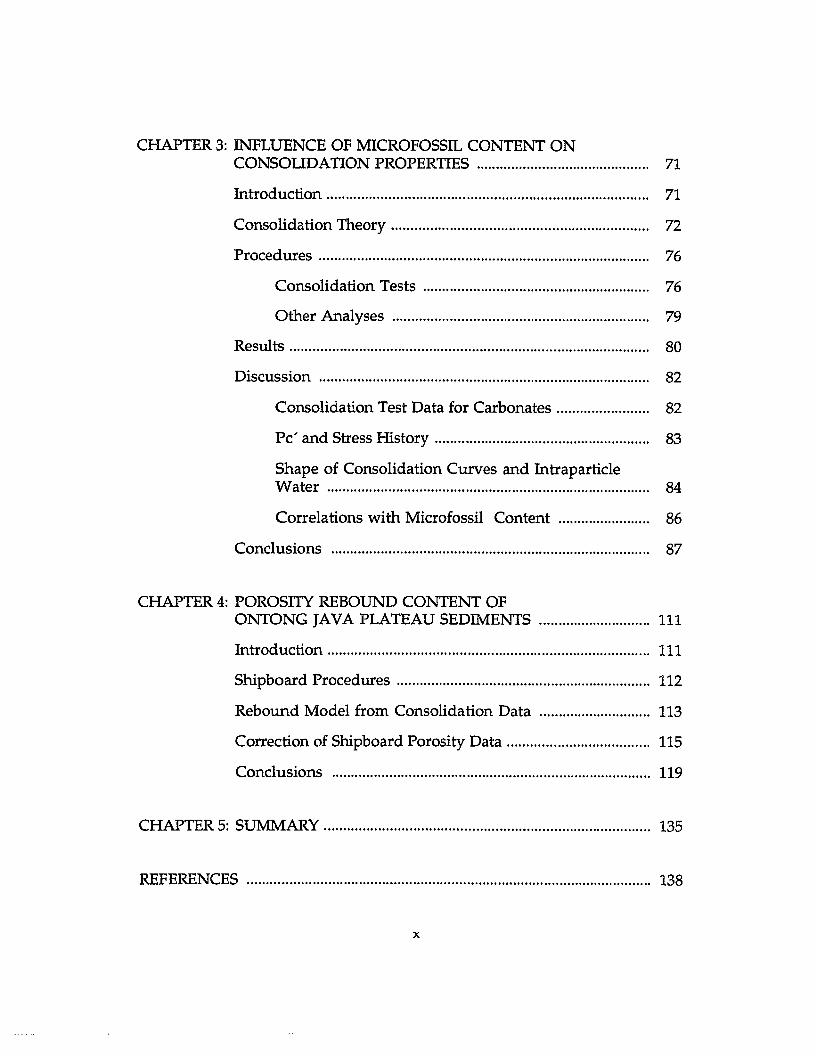
CHAPTER 3: INFLUENCE OF MICROFOSSIL CONTENT ONCONSOUDATION PROPERTIES 71
Introduction 71
Consolidation Theory 72
Procedures 76
Consolidation Tests 76
Other Analyses 79
Results 80
Discussion 82
Consolidation Test Data for Carbonates 82
Pc' and Stress History.................... 83
Shape of Consolidation Curves and IntraparticleWater 84
Correlations with Microfossil Content 86
Conclusions 87
CHAPTER 4: POROSITY REBOUND CONTENT OFONTONG JAVA PLATEAU SEDIMENTS 111
Introduction 111
Shipboard Procedures 112
Rebound Model from Consolidation Data 113
Correction of Shipboard Porosity Data 115
Conclusions 119
CHAPTER 5: SUM!vIARY . 135
REFERENCES 138
x
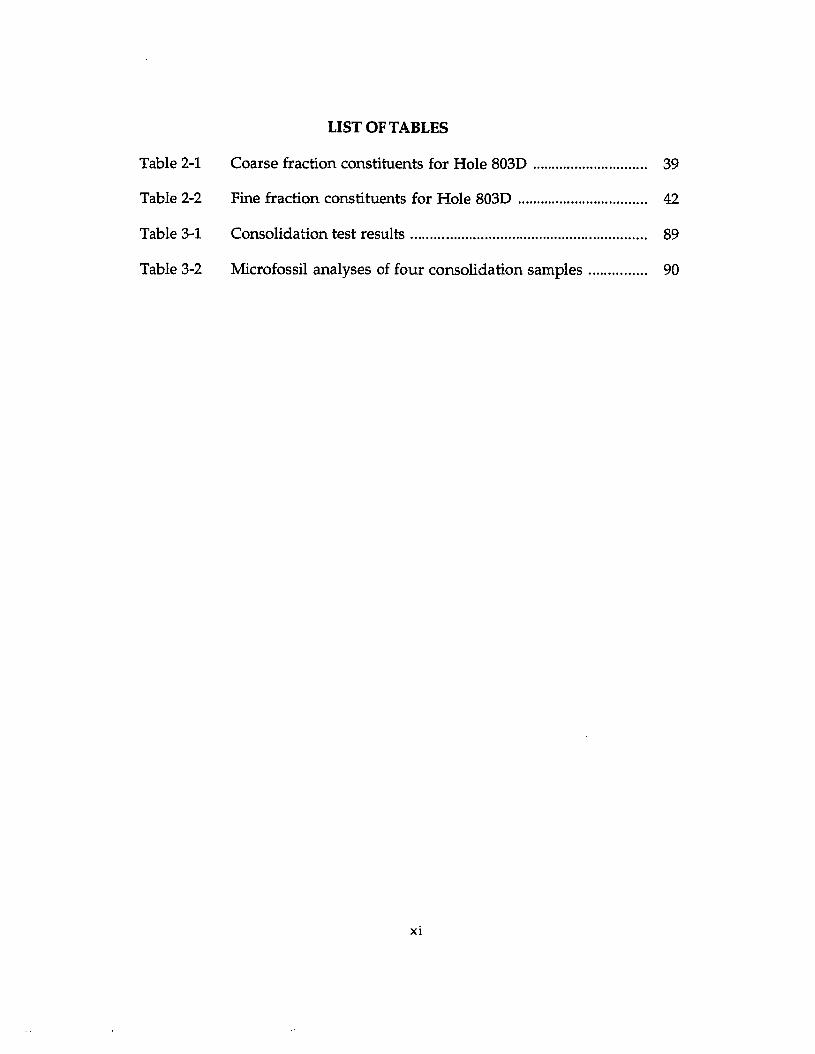
Table 2-1
Table 2-2
Table 3-1
Table 3-2
LIST OF TABLES
Coarse fraction constituents for Hole 803D 39
Fine fraction constituents for Hole 803D 42
Consolidation test results 89
Microfossil analyses of four consolidation samples 90
xi
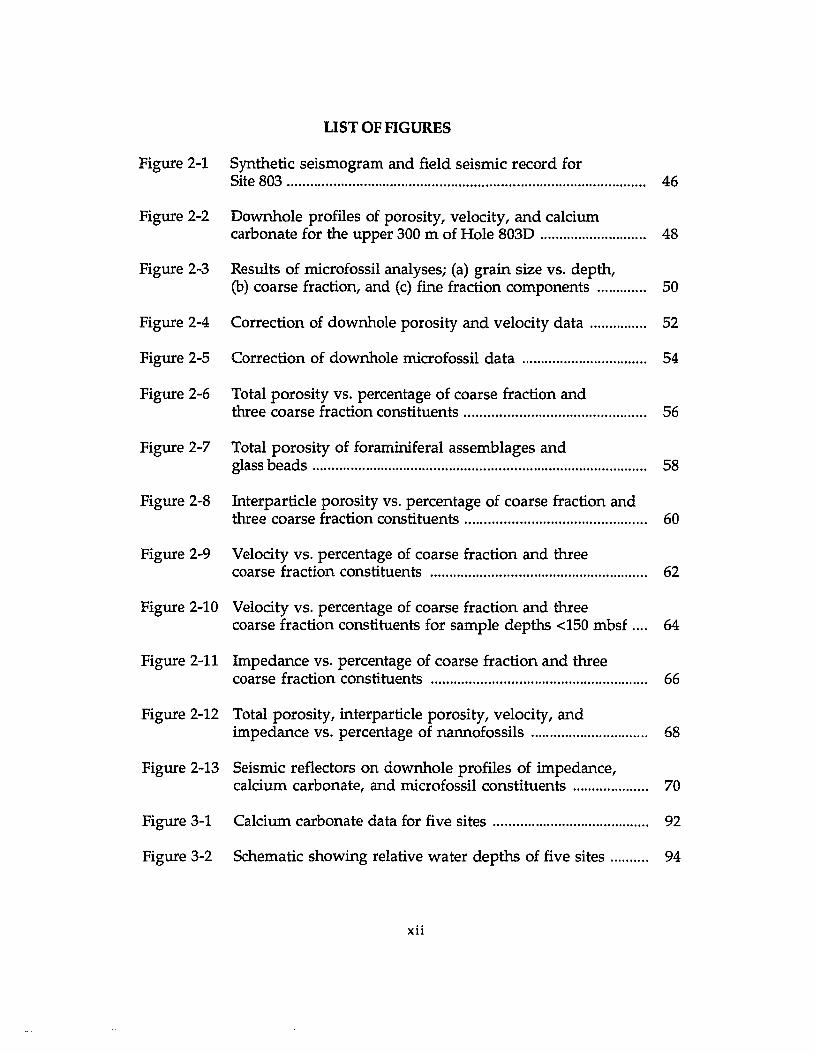
LIST OF FIGURES
Figure 2-1 Synthetic seismogram and field seismic record forSite 803 46
Figure 2-2 Downhole profiles of porosity, velocity, and calciumcarbonate for the upper 300 m of Hole 803D 48
Figure 2-3 Results of microfossil analyses; (a) grain size vs. depth,(b) coarse fraction, and (c) fine fraction components 50
Figure 2-4 Correction of downhole porosity and velocity data 52
Figure 2-5 Correction of downhole microfossil data 54
Figure 2-6 Total porosity vs. percentage of coarse fraction andthree coarse fraction constituents .. 56
Figure 2-7 Total porosity of foraminiferal assemblages andglass beads 58
Figure 2-8 Interparticle porosity vs. percentage of coarse fraction andthree coarse fraction constituents 60
Figure 2-9 Velocity vs. percentage of coarse fraction and threecoarse fraction constituents 62
Figure 2-10 Velocity vs. percentage of coarse fraction and threecoarse fraction constituents for sample depths <150 mbsf .... 64
Figure 2-11 Impedance vs. percentage of coarse fraction and threecoarse fraction constituents 66
Figure 2-12 Total porosity, interparticle porosity, velocity, andimpedance vs. percentage of nannofossils 68
Figure 2-13 Seismic reflectors on downhole profiles of impedance,calcium carbonate, and microfossil constituents 70
Figure 3-1 Calcium carbonate data for five sites 92
Figure 3-2 Schematic showing relative water depths of five sites 94
xii
Figure 3-3 Void ratio vs. effective stress for samples from Site 803 96
Figure 3-4 Void ratio vs. effective stress for samples from Site 804 98
Figure 3-5 Void ratio vs. effective stress for samples from Site 805 100
Figure 3-6 Void ratio vs. effective stress for samples from Site 806 102
Figure 3-7 Void ratio vs. effective stress for samples from Site 807 104
Figure 3-8 SEM images of consolidation samples 106
Figure 3-9 Compression index and expansion index vs.carbonate content 108
Figure 3-10 Compression index and expansion index vs.foraminifer content 110
Figure 4-1 Merged porosity vs. depth for Site 806 and generalizedlaboratory curve for calcareous sediments 122
Figure 4-2 Hole 8030 downhole porosity profiles 124
Figure 4-3 Rebound in % porosity change vs. pressure 126
Figure 4-4 Rebound in % porosity change vs. depth below seafloor ..... 128
Figure 4-5 Hole 8030 porosity data corrected for rebound and forseawater density.................................... 130
Figure 4-6 Hole 8030 downhole porosity corrected using combinedrebound and seawater-density correction 132
Figure 4-7 Hole 806B downhole porosity corrected using combinedrebound and seawater-density correction 134
xiii
CHAPTERl
INTRODUCTION
Overview
This work is based on results from Ocean Drilling Program (ODP) Leg
130, which drilled the Ontong Java Plateau (OJP), a broad submarine plateau
in the western equatorial Pacific. Specifically, this work examines the
influence of microfossil content on the physical properties of calcareous
sediments from the plateau.
Geologic Setting
The Ontong Java Plateau is the largest oceanic flood basalt plateau in
the world (Figure 1-1), with an approximate area of 1.5 million km2
(Mahoney, 1987). Based on drilling results on the Ontong Java Plateau as
well as field geological sampling on the island of Malaita, the Ontong Java
Plateau apparently began to form prior to 120 Ma (Tarduno et al., 1991;
Mahoney et al., 1993a; Mahoney et al., 1993b), probably along a west
northwest-aligned spreading ridge. Pelagic sediments were deposited on the
plateau, and a shift from Austral to Tethyan assemblages at about 100 Ma
reflects the northward movement of the plateau.
In late Oligocene time, the southwestern part of the plateau apparently
encountered the Outer Melanesian (North Solomon) subduction zone,
ending subduction of the Pacific plate beneath the Outer Melanesian Arc
(Kroenke et al., 1986; Yan and Kroenke, 1993). Subduction ceased in the early
Miocene (about 25 Ma) when the convergent boundary shifted elsewhere,
1
with subduction resuming south of the Solomon Islands region in the late
Miocene (about 10 Ma), forming the New Britain-San Cristobal Trench.
Eastward subduction of the Indo-Australia plate beneath the Pacific
plate brought about the subsequent collision of the Woodlark Spreading
Ridge with the Solomon Islands Arc (about 4 Ma), leading to the elevation
and folding of the southwestern margin of the Ontong Java Plateau (Kroenke
et al., 1986; Resig et al., 1986). The Malaita Anticlinorium was formed in
conjunction with the overthrusting of the Solomon Islands Arc by plateau
oceanic crust.
Paleoceanographic Objectives of PDP Leg 130
Previous investigations in the central equatorial Pacific identified a
series of seismic reflection horizons synchronous over a large area of the
central equatorial Pacific seafloor. These reflection horizons appear to
correlate with major reorganizations of the oceanic circulation system (e.g.,
the initiation of northern hemisphere glaciation, the closing of the Tethys,
ice buildup in Antarctica, the opening of the Drake Passage) that are the
result of tectonic, climatic, and oceanographic processes (Mayer et al., 1985,
1986). The specific response of the equatorial sediment system to these major
paleoceanographic reorganizations is the increased dissolution of calcium
carbonate, and the impedance contrasts caused by these major dissolution
events result in seismic horizons.
While these events are useful from a seismic or stratigraphic
perspective, the complete removal or severe condensation of the section that
results from such dissolution over most areas of the central Equatorial Pacific
2
makes the detailed evaluation of paleoceanographic indicators at these
critical times virtually impossible. Therefore, although there is clear
evidence for a series of major paleoceanographic events, their expression as
dissolution events precludes the examination of many of the key parameters,
e.g., isotopes, faunal changes, chemical tracers, etc., that can be used to
characterize the paleoceanographic change.
The Ontong Java Plateau, however, has a unique combination of
geographic location and bathymetry that makes it ideally suited for detailed
paleoceanographic studies. Firstly, the plateau is presently, and has been for
a good part of its history, located near the equatorial zone of high production
of biogenous sediments. More importantly, the surface of the plateau has
stood above the carbonate compensation depth (CCD) throughout most of its
history. This combination of high production and bathymetry has resulted
in the accumulation and preservation of a thick (approximately 1 km)
sequence of pelagic carbonate sediments of Mesozoic and Cenozoic age that
has not been subjected to pervasive dissolution. The bathymetric
relationships extant today appear to have remained constant throughout the
history of the plateau (Resig et al., 1976). Although there is considerable
evidence for disturbance, and even mass wasting, of plateau sediments along
the margins of the Ontong Java Plateau (Berger and Johnson, 1976), much of
the central plateau exhibits virtually undisturbed sections, indicated by a
layer-cake stratigraphy (Mayer et al., 1991).
One of the objectives of ODP Leg 130 was to drill a series of equatorial
sites running from the top of the plateau to near its base, traversing nearly
2000 m of depth range in a relatively small geographic area, and sampling
3
sediments exposed to both deep and bottom water masses (upper and lower
deep waters). The sediments sampled would have been produced under
nearly the same surface-water conditions and thus in the same pelagic rain.
Sediments sampled along this transect would not be subject to many of the
variables normally associated with pelagic sedimentation (i.e., productivity
and latitudinal gradients) and would provide an ideal opportunity to
evaluate the vertical distribution of a range of parameters.
Four of the five sites drilled during ODP Leg 130 (Sites 803, 804,805,
and 806) form a depth transect down the northeast flank of the plateau
(Figure 1-2), bracketing a depth interval of 2500-3900 m. Within this depth
range, changes in dissolution gradients are most pronounced (Berger and
Johnson, 1976; Berger and Mayer, 1978). These dissolution gradients
correspond to differences between sites in microfossil content and
preservation, with considerable effects on physical properties and seismic
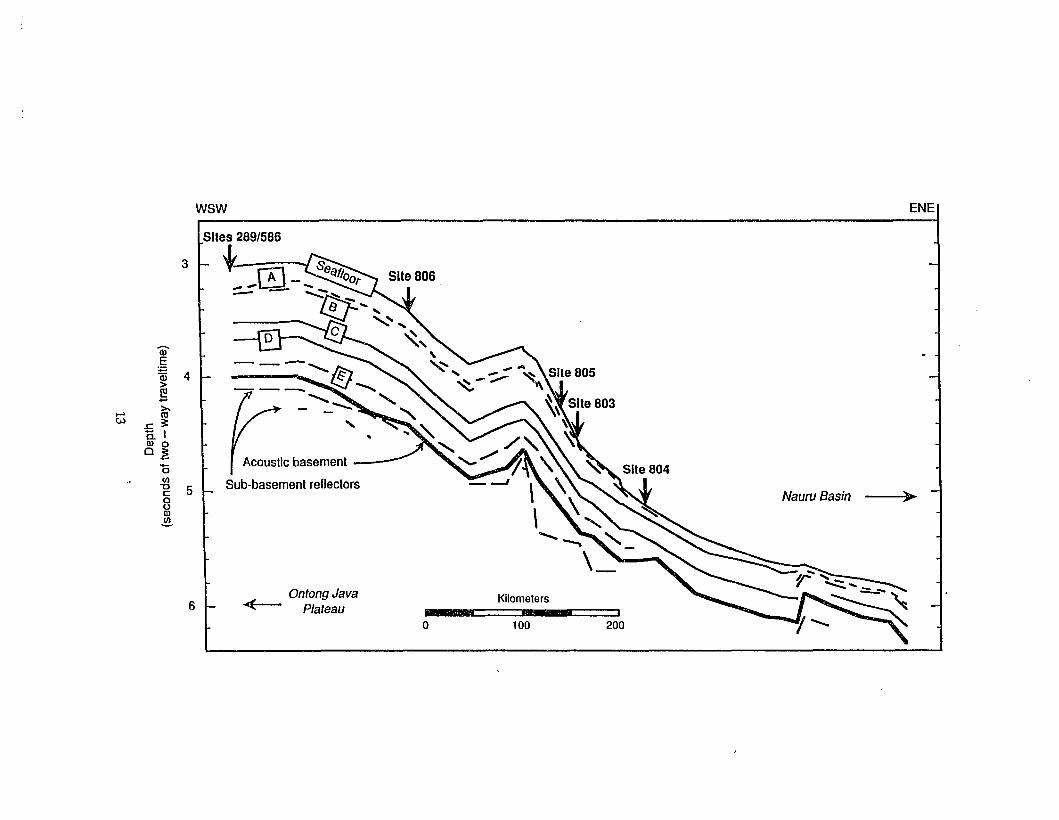
reflectors (Berger and Johnson, 1976; Berger and Mayer, 1978). A schematic of
the northeast flank of the Ontong Java Plateau, showing the relative
locations of drill sites in the depth transect and distinct seismic reflectors
(labeled A through E), is presented as Figure 1-3.
physical Properties and Paleoceanographic Events
An important key in the interpretation of seismic reflectors and other
changes in physical properties as paleoceanographic events is an
understanding of the relationships between dissolution events and physical
properties. Previous studies have suggested a link between the measured
4
physical properties of calcareous sediments and microfossil content and
preservation.
Johnson et al. (1977) found that the mean grain size of carbonates
decreases at deeper depositional sites on the periphery of the Ontong Java
Plateau, primarily because of the increased dissolution of foraminifera at
greater water depths. They found that deeper water sediments have lower
sound velocities and lower shear strength. Mayer (1979) studied eastern
equatorial Pacific sediments and found that low carbonate contents
corresponded to low densities, which he attributed to the relatively low
density of silica, which made up a significant portion of the sediments with
low carbonate contents.
This dissertation addresses several aspects of sediment physical
properties (e.g., porosity, velocity, acoustic impedance, compression index,
and rebound) within the broad framework of establishing relationships
between physical properties and microfossil content and preservation.
Earlier versions of two of the chapters have been previously published, as
detailed below. Previously published material has been reorganized to
provide a common abstract, introduction, and reference list for this
dissertation to reduce repetition. Some additional material has also been
included that was not part of the previously-published papers.
Chapter 2, entitled "Relationships between physical properties and
microfossil content and preservation," examines these relationships for
calcareous ooze samples from Site 803. Downhole profiles of porosity and
velocity show general trends with depth. Imprinted on these trends are a
number of small-scale fluctuations, with depth frequencies on the order of
5
meters or tens of meters. This study was initiated to determine if a
measurable link between sediment composition and measured physical and
acoustical properties could be determined. The samples from Hole 803D
obtained for the shipboard determination of index properties were retained
for the shore-based analysis of microfossil constituents.
Chapter 2, entitled "Relationships between physical properties and
microfossil content and preservation," was previously published as a 1993
paper of the same name by J. C. Marsters, J. M. Resig, and J. A. Wilcoxen
(Proceedings of the Ocean Drilling Program, Scientific Results, p. 641-652).
J. Marsters performed the physical properties measurements, analyzed the
data, and was the primary author of this previously-published manuscript.
Chapter 3, entitled "Influence of Microfossil Content on Consolidation
Properties of Ontong Java Plateau sediments", examines the consolidation
behavior of Ontong Java Plateau sediment samples from the five sites drilled
during ODP Leg 130. The effects of microfossil content and preservation, in
particular the relative percentage and preservation of whole foraminifera, on
consolidation behavior is discussed. Some of these consolidation data were
previously published in a 1993 paper entitled "Consolidation Test Results
and Porosity Rebound of Ontong Java Plateau Sediments," by J. C. Marsters
and M. H. Manghnani (Proceedings of the Ocean Drilling Program, Scientific
Results, p. 687-693).
Chapter 4, entitled "Porosity Rebound of Ontong Java Plateau
Sediments," uses rebound data from the nineteen consolidation tests to
correct shipboard physical property laboratory data to approximate in-situ
conditions. The effects of microfossil content and preservation on rebound
6
behavior is discussed. An earlier version of this chapter was included in the
Marsters and Manghnani (1993) publication cited above. J. Marsters analyzed
the data and was the primary author of the previously-published
manuscript.
Finally, Chapter 5 provides a summary of this work and discusses its
relationship to other recent studies of Ontong Java Plateau sediments and
calcareous sediments elsewhere. Directions for future research are also
suggested.
7
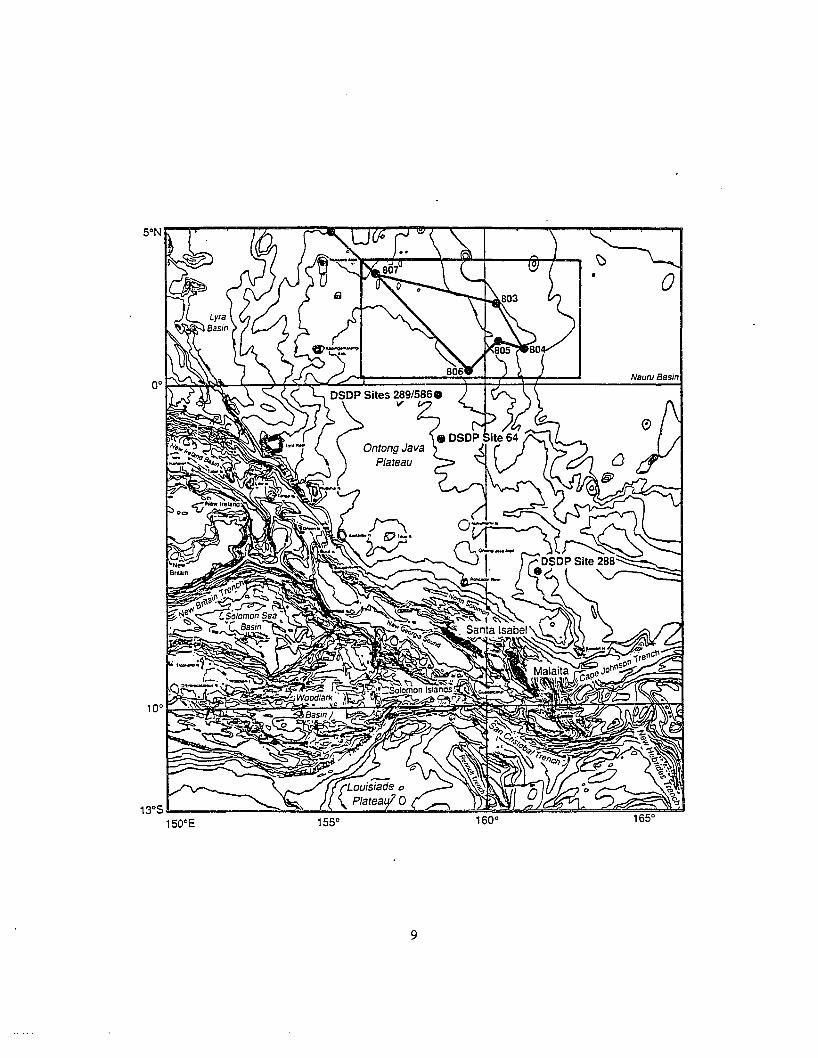
Figure 1-1. Location of the Ontong Java Plateau in the western equatorial
Pacific, showing the placement of drilling sites (after Kroenke et
al., 1983; Mammerickx, 1984). Box shows Leg 130 sites. Contour
interval is 500 m.
8
9
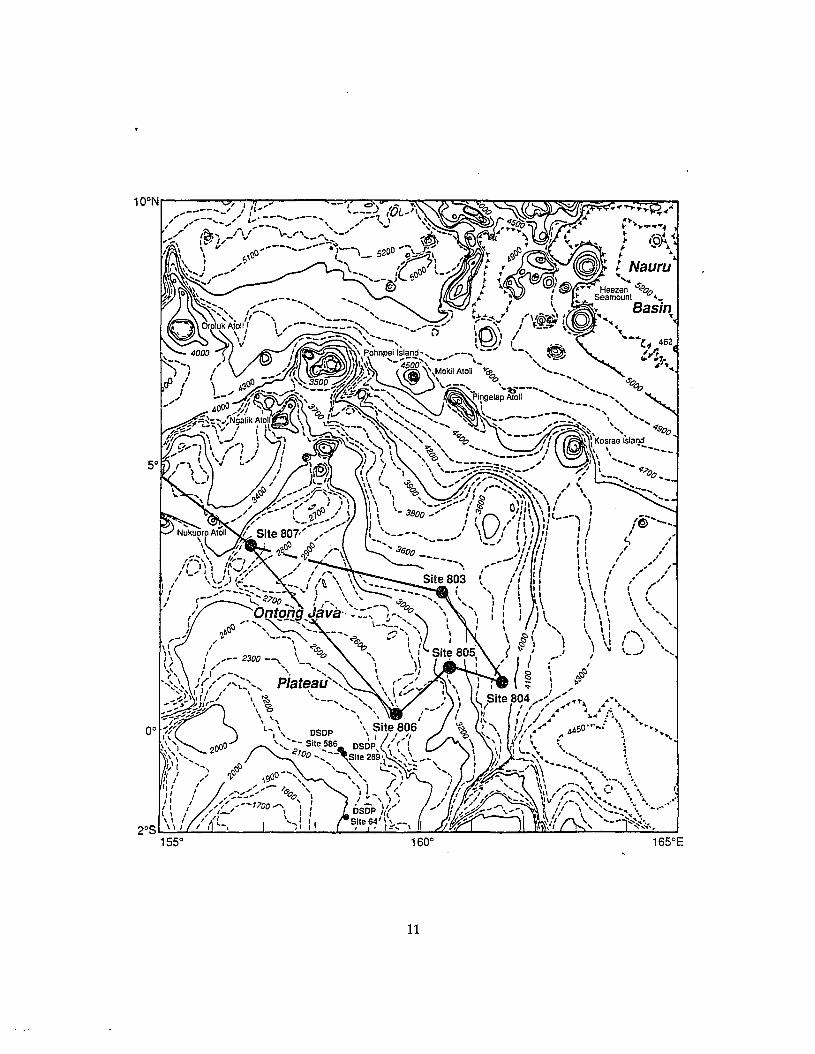
Figure 1-2. Bathymetry, in meters, of the northwestern part of the Ontong
Java Plateau (after Kroenke et al., 1983; Mammerickx, 1984). The
locations of the Leg 130 sites (Sites 803-807) together with
previous DSDP drilling sites are shown.
10
r 1600
11
Figure 1-3. Simplified acoustic stratigraphy for the flank of the Ontong Java
Plateau (Kroenke et al., 1991), and approximate locations of Sites
803 to 806 (the paleoceanographic depth transect).
12
......C>J
3
QlE~ 4
~in'
..c ~iiiQ) 0O~
'0UI
-g 58Q)
~
6
wswSites 269/586
..Acoustic basement
Sub-basement reflectors
OntongJava+- Plateau
o
Kilometers
100 200
Nauru Basin
ENE
"-~
CHAPTER 2
RELATIONSHIPS BETWEEN PHYSICAL PROPERTIESAND MICROFOSSIL CONTENT AND PRESERVATION
Background
During ODP Leg 130, shipboard scientists (Kroenke et al., 1991)
generated synthetic seismograms at each drill site using corrected laboratory
velocity and density data merged with the downhole log velocity and density
data. These data were used to calculate acoustic impedance (the product of
velocity and density) and reflection coefficients (the rate of change of the
acoustic impedance). The reflection coefficient profile was convolved with
the water-gun seismic source signature measured on the site survey cruise to
generate a synthetic seismogram for each site. The model is further described
in Kroenke et al. (1991) and Mayer et al. (1985).
A comparison of the synthetic seismogram (filtered with the same
filter parameters as the field record) with the field seismic profile collected at
Site 803 (Shipboard Scientific Party, 1991a) reveals an excellent match
between the two (Figure 2-1). Significant reflectors are clearly identifiable on
both the synthetic seismogram and the field record. Shipboard scientists
concluded that this correlation between the field seismic record and the
synthetic seismogram indicated that the traveltime-to-depth conversion was
fairly accurate (close examination reveals that the model-determined
velocities are about 1.2% too high). Given an acceptable traveltime-to-depth
conversion, shipboard scientists attempted to explain the origin of some of
the reflectors at Site 803 based on preliminary shipboard data.
14
Shipboard scientists (Shipboard Scientific Party, 1991a) identified 11
major reflectors or reflector packages (labeled 3-1 through 3-11) on the field
record at Site 803 (Figure 2-1). The selection of these reflectors was based on
their amplitude and lateral coherency within the immediate area of Site 803;
no effort was made to select regionally correlatable reflectors. In addition,
three reflectors (3a-3c) that are large-amplitude events on the synthetic record
but are less well-defined on the field record (at least at the exact location of
Site 803) were identified. Reflectors were not picked in the upper 30 ms of
the seismic record because of the disrupting effect of the outgoing pulse.
In most cases, a major reflector could be associated with a change in
the merged laboratory/downhole log acoustic impedance (Shipboard
Scientific Party, 1991a). Shipboard scientists (Shipboard Scientific Party,
1991a) used Site 803 preliminary shipboard physical properties (i.e., density,
velocity, and acoustic impedance) , lithologic (i.e., grain size and carbonate),
and biostratigraphic (Le., microfossil content) data to speculate on the cause
of the reflectors.
Objectives of this Study
This study was undertaken to determine if downhole fluctuations in
physical properties could be directly related to variations in microfossil
content and preservation and, subsequently, paleoceanographic events. We
wanted to (1) examine empirical relationships between physical properties
and microfossil content; and (2) examine the speculated causes of the
previously discussed seismic reflectors by analyzing variations in microfossil
content at reflector depths.
15
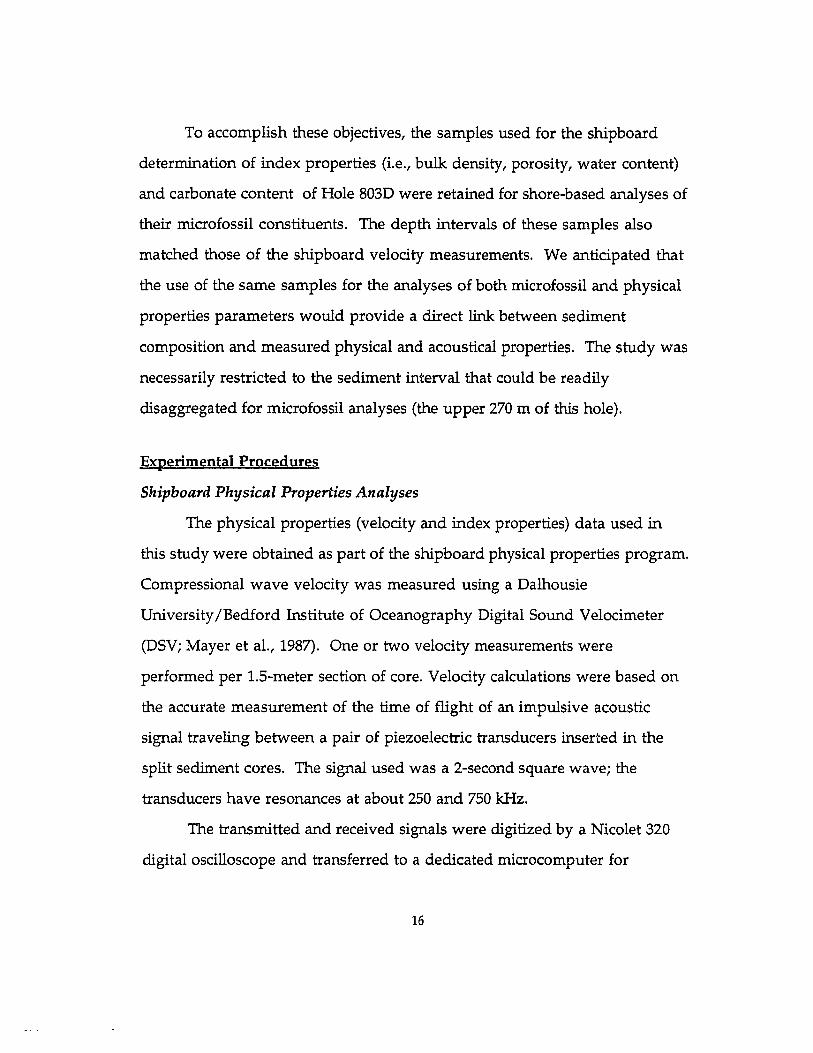
To accomplish these objectives, the samples used for the shipboard
determination of index properties (i.e., bulk density, porosity, water content)
and carbonate content of Hole 803D were retained for shore-based analyses of
their microfossil constituents. The depth intervals of these samples also
matched those of the shipboard velocity measurements. We anticipated that
the use of the same samples for the analyses of both microfossil and physical
properties parameters would provide a direct link between sediment
composition and measured physical and acoustical properties. The study was
necessarily restricted to the sediment interval that could be readily
disaggregated for microfossil analyses (the upper 270 m of this hole).
Experimental Procedures
Shipboard Physical Properties Analyses
The physical properties (velocity and index properties) data used in
this study were obtained as part of the shipboard physical properties program.
Compressional wave velocity was measured using a Dalhousie
University/Bedford Institute of Oceanography Digital Sound Velocimeter
(D5V; Mayer et al., 1987). One or two velocity measurements were
performed per 1.5-meter section of core. Velocity calculations were based on
the accurate measurement of the time of flight of an impulsive acoustic
signal traveling between a pair of piezoelectric transducers inserted in the
split sediment cores. The signal used was a 2-second square wave; the
transducers have resonances at about 250 and 750 kHz.
The transmitted and received signals were digitized by a Nicolet 320
digital oscilloscope and transferred to a dedicated microcomputer for
16
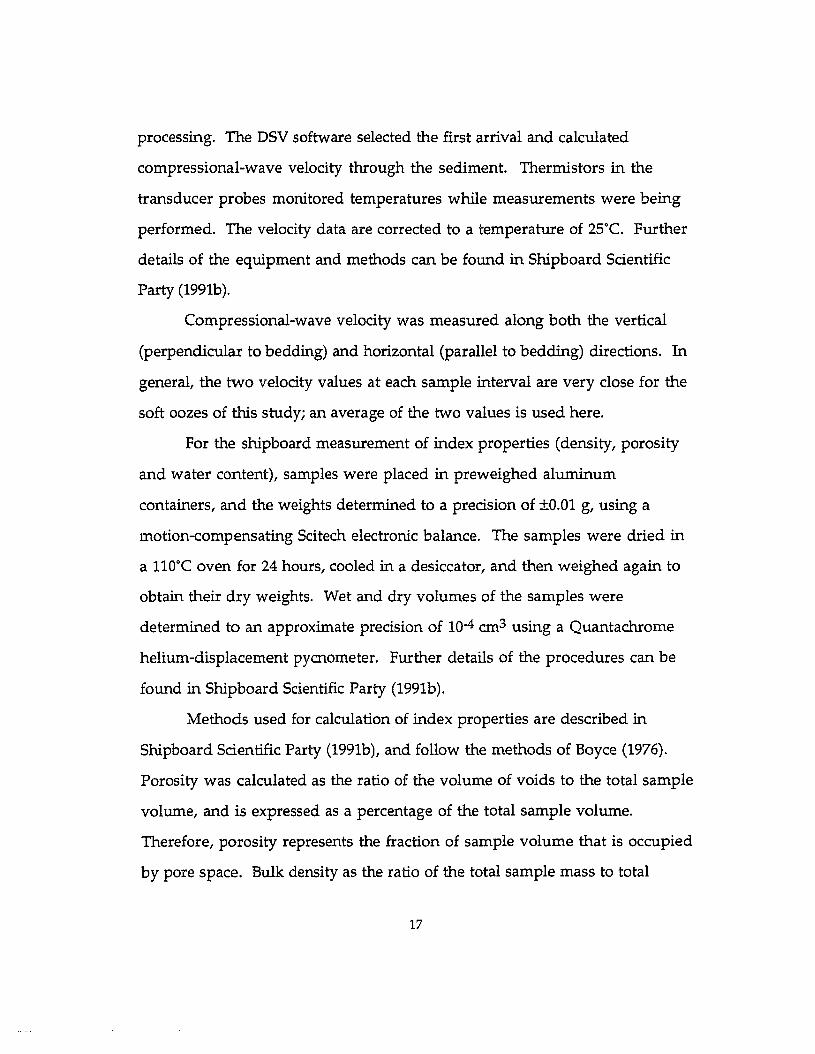
processing. The DSV software selected the first arrival and calculated
compressional-wave velocity through the sediment. Thermistors in the
transducer probes monitored temperatures while measurements were being
performed. The velocity data are corrected to a temperature of 25°C. Further
details of the equipment and methods can be found in Shipboard Scientific
Party (1991b).
Compressional-wave velocity was measured along both the vertical
(perpendicular to bedding) and horizontal (parallel to bedding) directions. In
general, the two velocity values at each sample interval are very close for the
soft oozes of this study; an average of the two values is used here.
For the shipboard measurement of index properties (density, porosity
and water content), samples were placed in preweighed aluminum
containers, and the weights determined to a precision of ±O.01 g, using a
motion-compensating Scitech electronic balance. The samples were dried in
a 110°C oven for 24 hours, cooled in a desiccator, and then weighed again to
obtain their dry weights. Wet and dry volumes of the samples were
determined to an approximate precision of 10-4 cm3 using a Quantachrome
helium-displacement pycnometer. Further details of the procedures can be
found in Shipboard Scientific Party (1991b).
Methods used for calculation of index properties are described in
Shipboard Scientific Party (1991b), and follow the methods of Boyce (1976).
Porosity was calculated as the ratio of the volume of voids to the total sample
volume, and is expressed as a percentage of the total sample volume.
Therefore, porosity represents the fraction of sample volume that is occupied
by pore space. Bulk density as the ratio of the total sample mass to total
17
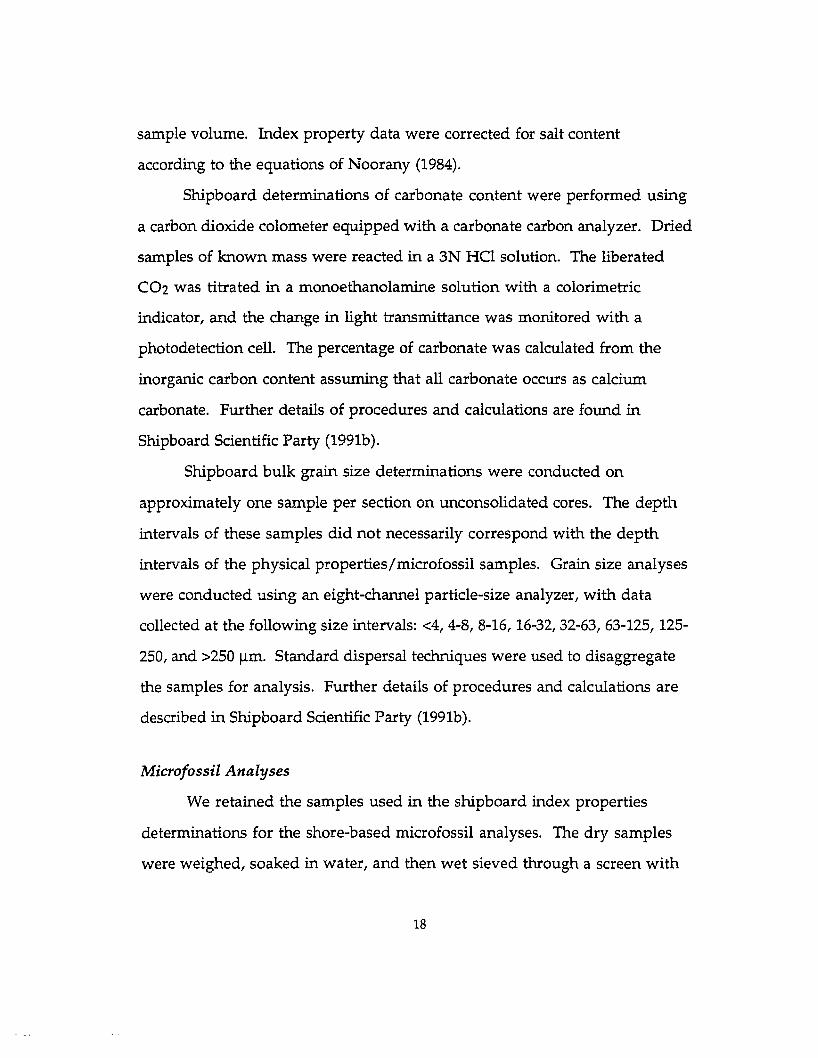
sample volume. Index property data were corrected for salt content
according to the equations of Noorany (1984).
Shipboard determinations of carbonate content were performed using
a carbon dioxide colometer equipped with a carbonate carbon analyzer. Dried
samples of known mass were reacted in a 3N HCl solution. The liberated
C02 was titrated in a monoethanolamine solution with a colorimetric
indicator, and the change in light transmittance was monitored with a
photodetection cell. The percentage of carbonate was calculated from the
inorganic carbon content assuming that all carbonate occurs as calcium
carbonate. Further details of procedures and calculations are found in
Shipboard Scientific Party (1991b).
Shipboard bulk grain size determinations were conducted on
approximately one sample per section on unconsolidated cores. The depth.
intervals of these samples did not necessarily correspond with the depth
intervals of the physical properties/microfossil samples. Grain size analyses
were conducted using an eight-channel particle-size analyzer, with data
collected at the following size intervals: <4,4-8,8-16, 16-32,32-63, 63-125, 125
250, and >250 !lID. Standard dispersal techniques were used to disaggregate
the samples for analysis. Further details of procedures and calculations are
described in Shipboard Scientific Party (1991b).
Microfossil Analyses
We retained the samples used in the shipboard index properties
determinations for the shore-based microfossil analyses. The dry samples
were weighed, soaked in water, and then wet sieved through a screen with
18
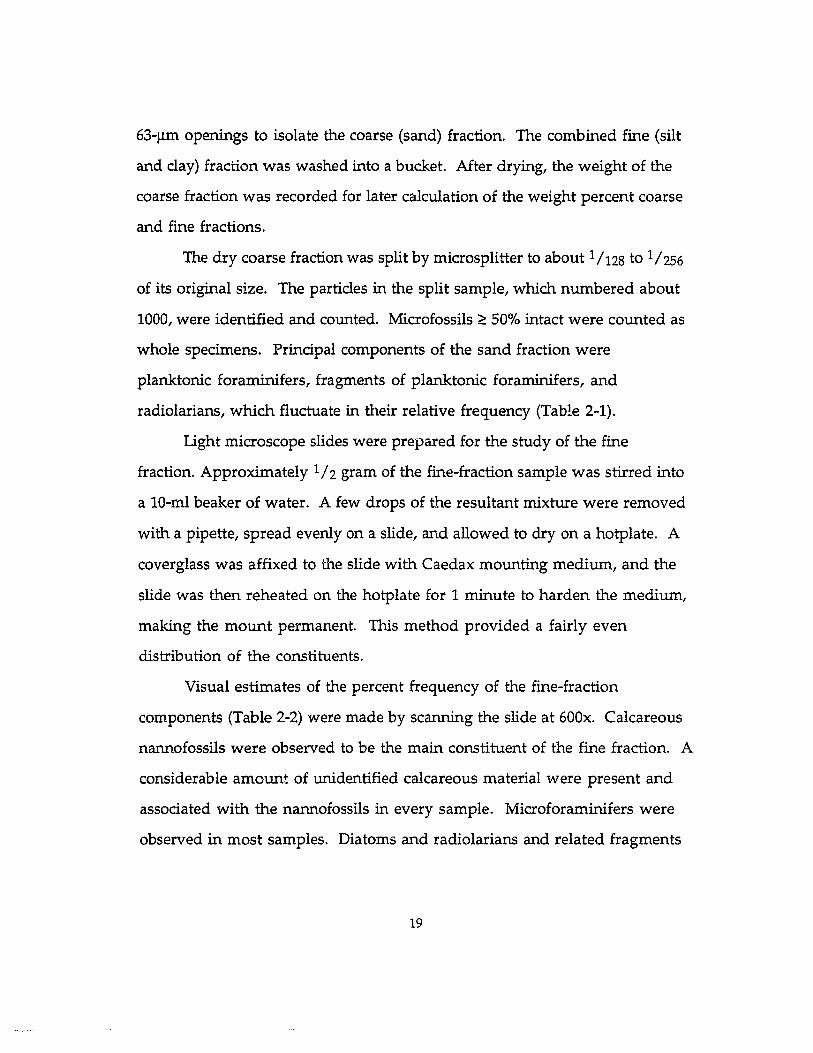
63-~ openings to isolate the coarse (sand) fraction. The combined fine (silt
and clay) fraction was washed into a bucket. After drying, the weight of the
coarse fraction was recorded for later calculation of the weight percent coarse
and fine fractions.
The dry coarse fraction was split by microsplitter to about 1/128 to 1/256
of its original size. The particles in the split sample, which numbered about
1000, were identified and counted. Microfossils ~ 50% intact were counted as
whole specimens. Principal components of the sand fraction were
planktonic foraminifers, fragments of planktonic foraminifers, and
radiolarians, which fluctuate in their relative frequency (Table 2-1).
Light microscope slides were prepared for the study of the fine
fraction. Approximately 1/2 gram of the fine-fraction sample was stirred into
a 10-ml beaker of water. A few drops of the resultant mixture were removed
with a pipette, spread evenly on a slide, and allowed to dry on a hotplate. A
coverglass was affixed to the slide with Caedax mounting medium, and the
slide was then reheated on the hotplate for 1 minute to harden the medium,
making the mount permanent. This method provided a fairly even
distribution of the constituents.
Visual estimates of the percent frequency of the fine-fraction
components (Table 2-2) were made by scanning the slide at 600x. Calcareous
nannofossils were observed to be the main constituent of the fine fraction. A
considerable amount of unidentified calcareous material were present and
associated with the nannofossils in every sample. Microforaminifers were
observed in most samples. Diatoms and radiolarians and related fragments
19
were relatively common in some samples. Overall, very little organic carbon
or unidentified minerals were present in the fine fraction.
The fine-fraction samples were checked for evidence of dissolution
and precipitation of calcite. Dissolution appeared to be insignificant in the
fine fraction. Preservation of the nannofossils was indicated as moderate
(Table 2-2) if some of the discoasters were coated with secondary calcitic
growth. Overgrowth did not appear to affect the coccoliths.
Samples of the fine fraction were also checked for age based on the
calcareous nannofossils. From this examination, we concluded that
reworked sediment was not a factor in the samples studied.
Results
Physical Properties
Downhole profiles of porosity, compressional wave velocity and
calcium carbonate content for the upper 300 m of Hole 803D are shown in
Figure 2-2. The profiles of porosity and velocity show general trends of
decreasing porosity and slightly increasing velocity with increasing depth.
These general trends are caused by increasing compaction of the sediment
column with increasing overburden.
Measured porosities for Hole 803D decrease at a fairly constant rate
with depth from near 75% at the seafloor to near 53% at 300 meters below
seafloor (mbsf). Bassinot et al. (1993a) concluded that mechanical compaction
is the major compaction process acting throughout the entire ooze-chalk
section down to about 600 mbsf, based on the lack of marked change in the
20
trend of the downhole porosity profile. The high-porosity spike in the 803D
profile at 181.20 mbsf corresponds to an approximately 0.5 em thick ash layer.
Measured downhole velocities in Hole 803D remain fairly constant
near 1550 meters per second (m/s) to approximately 140 mbsf. Between
approximately 140 mbsf and the bottom of the studied section at 300 mbsf,
measured velocities show more variability, fluctuating between 1,500 m/s
and 1,650 m/s. Shipboard scientists (Shipboard Scientific Party, 1991a) noted
that cementation began to be observed in the sediment column around 150
mbsf. The change in the velocity profile below this approximate depth likely
indicates the role of cementation in increasing compressional wave velocity,
due to increasing rigidity of the sediment fabric.
Measured calcium carbonate contents in these sediments are in the
range of 85 to 95%. CaC03 contents increase from about 85% near the
seafloor to around 90% at 50 mbsf, while CaC03 contents between 50 and 300
mbsf remain fairly constant with depth, fluctuating between 90% and 95%.
There are two low-carbonate excursions observed in the downhole profile.
The two low-carbonate spikes at 146 mbsf and at 181.20 mbsf correspond to
two ash layers, one of which was previously discussed for the porosity data.
Independent of the downhole trends, a number of small-scale
fluctuations with depth frequencies on the order of meters or tens of meters
are imprinted on the porosity, velocity and carbonate profiles (Figure 2-2).
The relationship of these small-scale fluctuations to differences in
microfossil content was the focus of this study.
21
Microfossil Content and Preservation
Grain size vs. depth for the samples analyzed is shown in Figure
2-3A. The fine fraction «63 urn) makes up more than 90% by weight of most
of the samples. The samples from the upper 50 m, however, contain 10% to
30% coarse particles (>63 urn).
The components of counted coarse particles are shown in Figure 2-3B.
Four components total more than 98% of the total coarse particles; the other
components of the coarse fraction are not plotted. "Planktonics" refers to
planktonic foraminifers with tests estimated to be ~50% intact. "Foraminifer
fragments" refers to both planktonic and benthic foraminifers with tests
estimated to be <50% intact. The planktonic fragments were estimated to
comprise 98% of the total fragments (i.e., the occurrence of benthic
foraminifer fragments was estimated to be 2%). Both an increase in the
frequency of radiolarians and/or an increase in the frequency of foraminifer
fragments and entire benthic foraminifers are recognized as a sign of
dissolution of carbonate in the sand fraction.
Numerous fluctuations were present in the relative percentages of the
major constituents. However, some general trends were observed.
Radiolarian content increases downcore; the samples near the surface
usually contain less than 5% radiolarians. The radiolarian content of the
majority of samples below 150 mbsf is greater than 50%. The percentage of
foraminifer fragments generally decreases downhole, from values greater
than 80% near the surface to less than 40% below 120 mbsf. The general
downhole trend of increasing radiolarian to foraminifer fragment ratio
presumably represents a gradual lowering of the lysocline over the time
22
interval represented by these sediments. The present-day deeper lysocline
results in less dissolution and a lower radiolarian to foraminifer fragment
ratio.
Planktonic foraminifers exhibit no general depth trend; this implies
that dissolution is sufficient to affect the relative number of fragments (and
the associated fragments to radiolarian ratio), but not to result in a significant
decrease in the frequency of whole foraminifers. Fragments appear to be the
particles most susceptible to complete dissolution following burial.
Imprinted on the general downhole trends observed in the coarse
fraction profiles are fluctuations of higher planktonic foraminifer content
and lower radiolarian counts (e.g., 138-145 mbsf and 190-198 mbsf). These
small-scale fluctuations in microfossil content presumably represent
variations in CaC03 dissolution caused by short-term changes in the depth of
the lysocline.
Nannofossils are the primary constituents of the fine fraction, usually
numbering greater than 80% of the fine particles (Figure 2-3C). Foraminifer
fragments generally number less than 5% of the fine fraction; unidentified
calcareous particles number between 5% and 10%; diatoms, radiolarians, and
unidentified siliceous particles generally number less than 3% of the fine
particles.
No obvious trends with depth were observed for the fine fraction
constituents. However, one notable interval occurs between 205 and 220
.mbsf, in which the number of various siliceous particles increases to a total
of approximately 20% of the fine particles. This interval corresponds to one
of higher radiolarian content in the coarse fraction and presumably
23
represents increased dissolution of CaC03 prior to burial (Le., a shallower
lysocline).
Correction of Downhole Profiles
Two types of signal are seen in the downhole physical properties and
microfossil data, namely (1) downhole depth trends due to compaction of the
sediment column (physical properties) or due to long-term changes in the
depth of the lysocline (microfossil content); and (2) small-scale fluctuations
presumably caused by short-term variations in dissolution. The intent of
this study was to examine the second signal, i.e., the relationships between
small-scale fluctuations in physical properties and microfossil content.
Therefore, we have corrected downhole data to remove the effects of the first
signal, i.e., compaction and long-term dissolution trends.
Second-order polynomial curves were fit to each physical property
dataset, as shown for the examples of downhole porosity and velocity data in
Figure 2-4. The curve-fit value of either density or velocity at the shallowest
sample depth was assumed to represent the "original" (uncompacted) value
(represented by the solid vertical line) and the shipboard data are corrected by
the difference between this uncompacted value and the curve fit value for
each sample depth. For example, the adjusted porosity (66.8 %) at 270 mbsf
equals the measured porosity (53.8%) plus the difference between the fit
porosity (55.8%) and the "uncompacted" value (69.5%).
We used the described procedure to subtract the effects of compaction
from the depth trends in all of the physical properties parameters utilized in
this study, i.e., porosity, velocity, and acoustic impedance. We have assigned
24
arbitrary values to the corrected data, so that they are not confused with the
measured physical properties data. For example, corrected porosities range
from a% to (a+25)%. This procedure to remove compaction effects assumes
that the compaction of the sediment column in the upper 300 m can be
approximated by the polynomial curve applied. This assumption is probably
an oversimplification, as some zones exhibit different consolidation
behavior dependent on their constituents (Chapter 3). However, the
polynomial approximation is suitable for our purposes.
Foraminifer fragments and radiolarians also show marked trends with
depth that likely result from post-depositional dissolution (Figure 2-5). We
have corrected the data for these two constituents employing the methods
used to correct for depth trends due to compaction in the physical properties
data. Corrected foraminifer fragment and radiolarian data are plotted vs.
depth in Figure 2-5. For each parameter, we have applied a polynomial fit to
the actual data and then shifted the data by the difference between the fit and
the "pre-dissolution" microfossil content (represented by the solid vertical
line). As was performed for the physical properties data, we have assigned
arbitrary values to the corrected microfossil data, so that they are not
confused with the measured data.
Planktonic foraminifer data were also corrected, although the slight
change in the measured data with depth makes the correction much less
significant than for the other two microfossil parameters. Application of
these corrections to all three microfossil parameters assumes that observed
downhole dissolution trends can be approximated by a polynomial fit.
25
Discussion
Role ofIntraparticle Porosity
Previous studies (e.g., Hamilton et al., 1982; Bachman, 1984) have
found that relationships between porosity and other properties, including
velocity, grain size, and CaC03 content, are difficult to establish for calcareous
sediments with high CaC03 contents. We have also found this to be true in
our study of Ontong Java Plateau sediments. Plots of porosity vs. weight
percent of coarse particles and versus abundance of individual microfossil
constituents (Figure 2-6) show no obvious relationships between porosity
and these parameters.
The difficulty in establishing relationships between porosity (or
density) and velocity, carbonate content, or microfossil content is largely
because of voids in the microfossil tests. Many authors (e.g., Schreiber, 1968;
Morton, 1975; Johnson et al., 1977) have found that relationships between
porosity and other physical properties are complicated by the fact that the
microfossil tests are hollow and produce higher porosity sediment than
similar-sized solid particles. Several studies (e.g., Gallagher, 1967; Johnson et
al., 1977; Hamilton et al., 1982) have indicated that calcareous sediments react
to the passage of sound waves as if they were composed of solid, rather than
hollow, particles. However, the methods used in the laboratory to determine
index properties measure the total sample void space.
This phenomenon results in a difficulty in determining relationships
between the index properties and other parameters in this study; it has also
plagued the studies of others. For example, Hamilton et al. (1982) found that
porosity and density are good indexes to velocity in the deep, eastern
26
equatorial Pacific, where calcium carbonate contents are lower, but they
found no usable relationship between velocity and density or velocity and
porosity in Ontong Java Plateau sediments. Hamilton et al. (1982) also found
little relationship between percent CaC03 and sound velocity or percent
CaC03 and bulk density for Ontong Java Plateau sediments. They found that
impedance has a linear relationship with saturated bulk density in the
eastern Pacific samples, but that the plateau samples diverge markedly from
this trend.
The total porosity is made up of intraparticle porosity, defined by
Choquette and Pray (1970) as porosity within individual grains or particles,
and interparticle porosity, defined as the porosity between particles (i.e.,
matrix porosity). In terrigenous sediments, consisting predominantly of
solid particles, porosity increases with decreasing grain size (Schreiber, 1968;
Johnson et al., 1977). As the grain size of foraminifer-rich sediments
decreases, and the number of broken or severely corroded tests increases,
intraparticle porosity is converted to interparticle porosity. However, total
porosity (as measured by shipboard procedures) remains fairly constant.
An estimate of interparticle porosity is needed for correlation with
acoustic and other properties (Bachman, 1984). Correction of total to
interparticle porosity is difficult because few estimates of that portion of the
porosity contributed by hollow foraminifers are available. Bachman (1984)
performed a study measuring the porosities of glass beads and foraminifers
of the same grain diameters (Figure 2-7). He classified the difference in the
two porosities for the same grain size as intraparticle porosity. Bachman's
27
work indicated that intratest voids can increase total sediment porosity by
44% at test diameters of 0 phi, and by 35% at diameters of 4 phi.
Urmos (1991) estimated intraparticle porosity for the Ontong Java
Plateau sediments of our study. These estimates of intraparticle porosity
were derived from analyses of porosity-velocity cross plots of downhole
logging and shipboard data. Urmos assumed that different porosities in
samples of the same velocity were the result of different amounts of
intraparticle porosity. We have used these estimates of intraparticle porosity
to calculate interparticle porosity for our samples.
Plots of interparticle porosity vs. percent coarse fraction, planktonic
foraminifers, foraminifer fragments, and radiolarians are shown in the four
plots of Figure 2-8. A comparison of these porosity vs. microfossil plots with
those of Figure 2-6, plotted as the same scale, show that the interparticle
porosity data exhibit considerably less scatter. The calculated interparticle
porosity vs. percentage coarse fraction shows a clearer relationship with grain
size than is observed with total porosity (Figure 2-6). Although the range of
porosities is small, a relationship of decreasing interparticle porosity with
increasing grain size is observed, similar to the relationships observed for
porosity and grain size in other sediment types (Johnson et al., 1977).
A relationship of decreasing interparticle porosity with increasing
number of whole planktonic foraminifers is also observed (Figure 2-6).
These relationships of interparticle porosity and grain size are anticipated, as
the volume of matrix (i.e., interparticle porosity) should decrease as the
relative percentage of large grains, namely whole planktonic foraminfers for
28
these sediments, increases. A relationship of increasing interparticle porosity
with increasing radiolarian content is seen in the plot of these parameters.
These relationships between interparticle porosity and microfossil
content may have been better-defined using another method of estimating
interparticle porosity, such as analyses of sample SEM images, or a statistical
estimate based on the observed number of intact microfossil tests.
Influence of Cementation
Plots of compressional-wave velocity vs, weight percent of coarse
particles and versus abundance of individual microfossil constituents
(Figure 2-9) show considerable scatter. The downhole velocity data showed
significantly more fluctuation below 150 mbsf (Figure 2-2). Shipboard
lithologic descriptions (Shipboard Scientific Party, 1991a) note a transition
from soft to stiff ooze at approximately 150 mbsf, coincident with incipient
carbonate cementation. A seismic reflection horizon is also located at this
depth (Shipboard Scientific Party, 1991a), which corresponds to the
approximate depth of a significant change in the relative numbers of the
coarse fraction microfossil constituents (Figure 2-3B). Since even a small
amount of cementation significantly increases rigidity, and thereby velocity,
velocity in the deeper sections is likely more affected by cementation than by
sediment constituents. Velocity data in stiffer oozes may also be affected by
increased measurement error due to cracking of the sediment upon insertion
of the DSV transducer probes (Bassinot et al., 1993b).
Plots of velocity vs. coarse fraction microfossil constituents for the
upper 150 mbsf (Figure 2-10) show a somewhat clearer relationship between
29
velocity and the microfossil parameters. Therefore, the significant scatter
observed in the velocity plots of Figure 2-9 is somewhat a result of scatter in
the data from depths below 150 mbsf.
Velocity vs. grain size (Figure 2-10) for samples in the upper 150 m
exhibits a relationship of increasing velocity with increasing grain size, as
observed in other studies (Schreiber, 1968; Mayer, 1979; Hamilton et al., 1982).
Johnson et al. (1977) also found that lower sound velocities and shear
strength corresponded to lower mean grain size of Ontong Java Plateau
surface samples. Our data show that increasing velocity corresponds to
increasing planktonic foraminifer content and decreasing foraminifer
fragment and radiolarian content (Figure 2-10). Therefore, our data indicate
that increased dissolution corresponds to a decrease in velocity. This
observation is in keeping with Johnson et al. (1977) who found that velocity
decreases with increasing water depth (i.e., increased proximity to the CCD
and, therefore, increased dissolution).
Finally, by using these restrictions on the calculated impedance, i.e.,
bulk density calculated from interparticle porosity and velocity data for the
upper 150 mbsf to exclude the effects of cementation on velocity, we can plot
impedance versus microfossil parameters (Figure 2-11). We observe a
relationship of decreased impedance with decreased grain size; this
relationship was also observed by Berger and Mayer (1977) for calcareous
sediments. Relationships of slightly increasing impedance with increasing
planktonic foraminifers and slightly decreasing impedance with increasing
radiolarian content (Figure 2-11) reflect the relationships observed between
these microfossil parameters and porosity and velocity.
30
Relative Significance of Fine Fraction Constituents
An interesting result of this study is that no relationships were found
between physical properties parameters and variations in the individual fine
fraction «63 urn) constituents. Plots of porosity, interparticle porosity,
velocity, and impedance (Figure 2-12) versus nannofossil content show no
apparent relationships. It appears that any variations in the physical
properties as a result of changes in microfossil constituents are controlled by
changes in the relative percentages of the coarse fraction constituents.
As indicated by the data shown in Figure 2-3B, the relative percentages
of the fine fraction constituents fluctuate very little compared to the relative
percentages of the coarse fraction constituents. Therefore, while the fine
fraction constituents make up greater than 80% of the total sample by weight,
fluctuations of the fine fraction constituents are minimal in these high
carbonate sediments. The fluctuations that are observed also correspond to
fluctuations at the same depth interval in the coarse fraction data, and it
appears that the coarse fraction fluctuations control the physical properties.
Relationships with Other Shipboard Data
We also examined other physical shipboard data (such as grain size
and smear slide data) and post-cruise data (such as SEM photographs) to
determine if these data could be used in our study. We found that sediment
even a few centimeters away from our study samples could exhibit extremely
different physical properties and microfossil constituents than those
measured for our samples. It is apparent that the variations in downhole
physical properties and microfossil content occur at such a high frequency
31
with depth that relationships can only be established by looking at these
parameters for the same samples.
Effect of Post-Burial Dissolution
An issue to be addressed in relating seismic reflectors to preservation
as a result of shifts in the lysocline is the degree of dissolution that occurs
after burial. In a sediment system so highly saturated in CaC03, it is possible
that only minor, if any, dissolution of buried tests would occur until
overburden pressures became high enough for pressure solution at grain
contacts (may occur at the ooze-chalk transition), In addition, post-burial
dissolution and reprecipitation of calcite cement appears to be somewhat
related to the diagenetic potential of the sediment at burial (Schlanger and
Douglas, 1974). However, Berger and Johnson (1976) concluded that the
depth dependence of the number and spacing of reflectors suggests that
dissolution in the water column and at the sediment-water interface is the
primary agent controlling the profiles.
Preservation in this study was judged as moderate if some of the
discoasters were coated with secondary calcite growth. Overgrowth did not
appear to affect the coccoliths. Preservation is described as good in the upper
125 m; below that depth, it ranges from moderate to good. It appears that the
dissolution responsible for the fluctuations in microfossil content in the
sediment column occurred predominantly in the water column and at the
sediment-water interface.
32
Seismic Reflectors
Berger and Mayer (1977) concluded that the origin of seismic reflectors
must be tied to lithologic changes that cause quasicyciic impedance contrasts.
While our study has provided relationships between physical properties and
microfossil constituents, we are also interested in linking seismic reflectors
observed in these sediments (Shipboard Scientific Party, 1991a; Mosher et al.,
1993) to lysoclinal cycles. The identified seismic reflectors at site 803 are
superimposed on downhole profiles of impedance, porosity, calcium
carbonate, percentage coarse fraction, and percentage of three individual
coarse fraction constituents (planktonic foraminifers, foraminifer fragments,
and radiolarians) in Figure 2-13. Shipboard scientists (Shipboard Scientific
Party, 1991a) used Site 803 preliminary shipboard physical properties (i.e.,
density, velocity, and acoustic impedance), lithologic (i.e., grain size and
carbonate), and biostratigraphic (i.e., microfossil content) data to speculate on
the cause of the reflectors observed at Site 803. We have expanded that
analyses by including our microfossil content data.
In the central and eastern equatorial Pacific, physical properties
changes are directly linked to changes in carbonate content (Mayer, 1979;
Mayer et al., 1993). However, for most sediments of the Ontong Java Plateau,
variations in carbonate content are not large enough to cause changes in
porosity or velocity. Instead, porosity and velocity fluctuations appear to be
related to changes in grain size, which in tum are related to dissolution or
winnowing events (Mayer et al., 1993).
Shipboard scientists (Shipboard Scientific Party, 1991a) determined that
reflector 3-1, the youngest reflector identified, was associated with a small but
33
rapid increase in bulk density that corresponds to a carbonate content
maxima and a large increase in mean grain size. The high carbonate content
and large grain size associated with reflector 3-1 were suggested (Shipboard
Scientific Party, 1991a) to indicate increased preservation that results from
the greater abundance of whole foraminifer tests. Reflector 3-1, at 2.6 Ma,
was suggested to be related to fluctuations in carbonate preservation in the
western equatorial Pacific and possibly linked to the initiation of Northern
Hemisphere glaciation (Shipboard Scientific Party, 1991a).
The microfossil data (Figure 2-13) indicate that the reflector lies just
below a zone of increased microfossil preservation, indicated by a high at
25.52 mbsf in percentage sand and planktonic foraminifers, and a low in
foraminifer fragments. However, the microfossil data suggest that the
reflector is actually within a zone of transition from preservation to
dissolution, as the planktonic foraminifer content decreases quickly over the
interval from 25.5 to 33.1 mbsf.
Shipboard scientists (Shipboard Scientific Party, 1991a) suggested that
reflector 3-2, at 3.3-3.4 Ma, was also associated with a carbonate content
maxima, therefore indicating increased preservation of carbonate. No
shipboard grain size measurements were made over the interval of reflector
3-2. This reflector was suggested to be related to fluctuations in carbonate
preservation in the western equatorial Pacific and possibly linked to
increased activity of North Atlantic Deep Water (NAD'\V) (Mayer et al., 1986).
However, our data indicate that this reflector characterizes a dissolution
event, corresponding to local minima in carbonate content, planktonic
34
foraminifers, and foraminifer fragments, and local maxima in radiolarians
(in both the coarse and fine fractions).
Shipboard scientists proposed that the grain size decrease and
carbonate minima associated with Reflectors 3-a and 3-b (at 4.3 and 5.0 Ma,
respectively) represent periods of enhanced dissolution, associated with
peaks in carbonate preservation in the Atlantic, with the 5.0-Ma event
possibly related to the isolation of the Mediterranean (the Messinian
interval). Our microfossil data do not provide conclusive evidence
regarding the nature of these reflectors, as the nearby microfossil samples
were all at least 3 meters from the reflector depth.
Shipboard scientists proposed that Reflector 3-3, at 153 mbsf (8-8.1 Ma) ,
is characterized by low carbonate content and a grain size maximum, and
that this relationship between carbonate content and grain size indicate the
removal of nannofossils by current winnowing. The winnowing indicated
as the cause of the Reflector 3-3 was suggested to be a regional phenomenon
as it did not appear to correspond to a time of major paleoceanographic
change (Shipboard Scientific Party, 1991a). However, our data indicate that
Reflector 3-3 corresponds to a sharp decrease in grain size, with planktonic
foraminifers decreasing rapidly from 55.8% of the coarse fraction at 145.17
mbsf to 1.7% at 154.69 mbsf. A corresponding sharp increase in the relative
percentage of radiolarians in the coarse fraction indicates that this is a
dissolution event. We also observe a decrease in velocity at this depth; this
general relationship of decreasing velocity with decreasing grain size is
reported in the literature and is supported by our data (Figure 2-10).
35
Reflector 3-c, at 183 mbsf (9.72 Ma), was believed by shipboard scientist
to represent a dissolution signal characterized by low carbonate content,
small mean grain size, and low velocity. This reflector lies immediately
below an ash layer that results in marked lows in impedance and carbonate
profiles (Figure 2-13). Reflectors 3-c, apparently a dissolution event, was
suggested to be coincident with a reflector extant throughout the central
Pacific that has been linked to global oceanographic events and, in particular,
major changes in NADW circulation (Mayer et al., 1986).
Reflector 3-4, at approximately 215 mbsf (12.3-12.5 Ma), was determined
to suggested by shipboard scientists to a velocity, density, and carbonate
minimum, whereas grain size data appeared to be ambiguous (i.e.,
undergoing a small change from fairly coarse- to fine-grained sediments).
Similarly to Reflector 3-c , Reflector 3-4 was suggested to be a central Pacific
dissolution event linked to global oceanographic events and, in particular,
major changes in NADW circulation (Mayer et al., 1986).
Our microfossil data do not provide conclusive evidence regarding the
nature of reflector 3-4; the microfossil data indicate a transition zone with
increasing foraminifer fragment to radiolarian ratio. The ooze-chalk
transition was placed by shipboard sedimentologists several meters below
Reflector 3-4. This transition is clearly seen in the sharp change in slope of
both the velocity and density curves (Figure 2-2), resulting from increasing
cementation. It is possible that variations in cementation, rather than grain
size and microfossil constituents, control the impedance contrasts that would
result in reflectors at this depth.
36
Reflector 3-5, at approximately 240 mbsf (15.8 Ma), was suggested to be
related to the rapid changes in velocity in this part of the section, resulting in
high-frequency changes in the degree of cementation. However, shipboard
scientists found it difficult to speculate on the origin of these velocity
changes, as the carbonate and grain size data in this depth interval were
limited. Our microfossil data indicate that the reflector also corresponds to
sharp decreases in the relative percentages of planktonic foraminifers and
foraminifer fragments, and a sharp increase in radiolarian content.
Reflector 3-5 lies at the end of a major hiatus (Shipboard Scientific
Party, 1991a) that was suggested to correspond to a widespread hiatus Keller
and Barron (1983) linked to major changes in ocean circulation and seismic
events (Mayer et al., 1986). The large contrast in age across this stratigraphic
break was suggested to result in a rather sharp jump in the state of
induration of the sediment and thus the velocity and density structure. Our
microfossil data indicate that this reflector is also characterized by a
dissolution event.
Deeper reflectors and reflector packages were also discussed by the
shipboard scientists, although correlations to grain size and carbonate data
appeared to be less definable. Deeper reflectors may be related to changes in
cementation, rather than to fluctuations in grain size or microfossil content.
Conclusions
Relationships between sediment microfossil content and physical
properties are observed. However, the role of intraparticle porosity in these
highly calcareous sediments makes the use of index properties data as
37
habitually determined on the ship inappropriate. Calculation of interparticle
porosity provides relationships between interparticle porosity and
microfossil constituents or grain size. Strong relationships are not observed
in this study because of the small range of values for most of the physical
properties parameters, including porosity, for this site. In addition, the
scatter observed in these data could likely be reduced with better estimates of
interparticle porosity.
Velocity data below 150 mbsf show significant scatter,likely due to the
influence of incipient cementation near this depth. Clearer relationships are
observed for velocity data for depths shallower than 150 mbsf. Using the
corrections for interparticle porosity, impedance data for samples in the
upper 150 mbsf were found to increase with increasing grain size and
planktonic foraminifera content.
The fine fraction « 63 urn) constituents make up greater than 85% of
the samples by weight. However, no relationships are observed between
variations in fine-fraction constituents and variations in physical properties.
It appears that the variations in the coarse-fraction constituents have a more
significant effect on the physical properties.
Many of the seismic reflectors identified by shipboard scientists could
be related to changes in the relative percentages of microfossil constituents.
For sediment below the ooze-chalk transition, fluctuations in cementation,
rather than fluctuations in grain size or microfossil constituents, may result
in impedance contrasts and seismic reflectors.
38
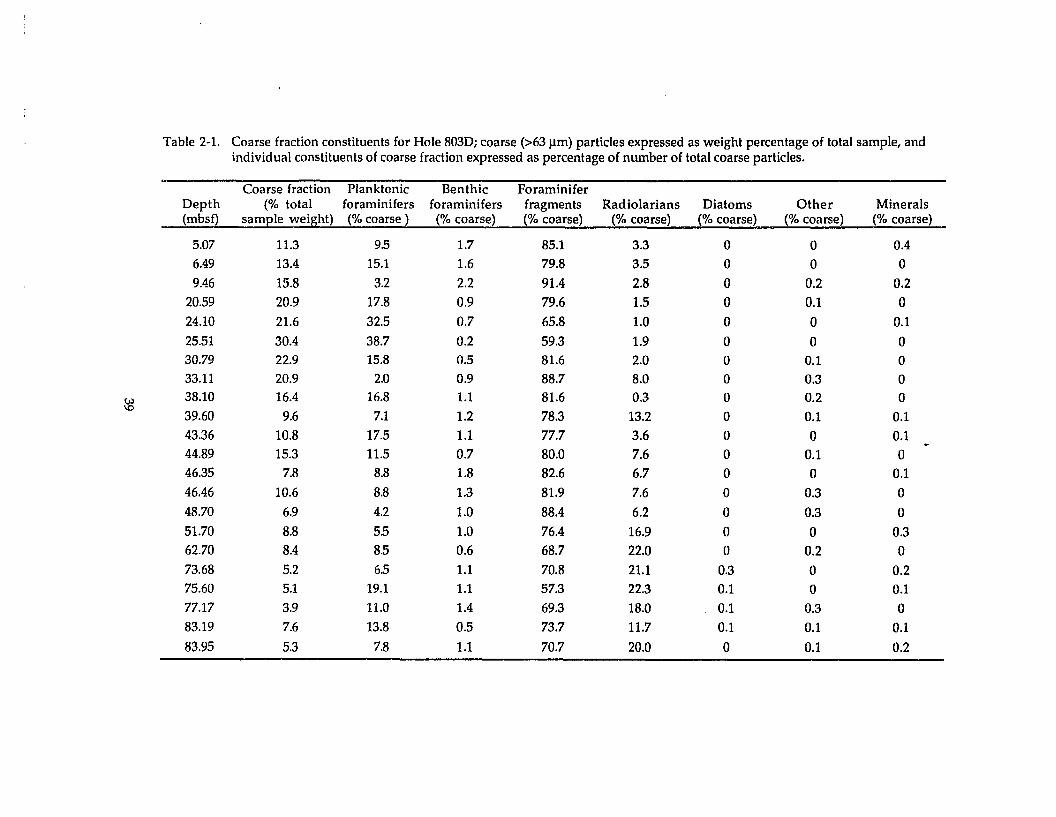
Table 2-1. Coarse fraction constituents for Hole 8030; coarse (>631lm) particles expressed as weight percentage of total sample, andindividual constituents of coarse fraction expressed as percentage of number of total coarse particles.
"Coarse fraction Planktonic Benthic Foraminifer
Depth (% total foraminifers foraminifers fragments Radiolarians Diatoms Other Minerals(rnbsf) sample weight) (% coarse) (% coarse) (% coarse) (% coarse) (% coarse) (% coarse) (% coarse)
5.07 11.3 9.5 1.7 85.1 3.3 a 0 0.4
6.49 13.4 15.1 1.6 79.8 3.5 0 0 0
9.46 15.8 3.2 2.2 91.4 2.8 0 0.2 0.220.59 20.9 17.8 0.9 79.6 1.5 0 0.1 0
24.10 21.6 32.5 0.7 65.8 1.0 0 0 0.1
25.51 30.4 38.7 0.2 59.3 1.9 0 0 030.79 22.9 15.8 0.5 81.6 2.0 0 0.1 033.11 20.9 2.0 0.9 88.7 8.0 0 0.3 0
IJJ 38.10 16.4 16.8 1.1 81.6 0.3 a 0.2 0\0
39.60 9.6 7.1 1.2 78.3 13.2 a 0.1 0.143.36 10.8 17.5 1.1 77.7 3.6 0 a 0.144.89 15.3 11.5 0.7 80.0 7.6 0 0.1 046.35 7.8 8.8 1.8 82.6 6.7 0 0 0.1
46.46 10.6 8.8 1.3 81.9 7.6 0 0.3 a48.70 6.9 4.2 1.0 88.4 6.2 0 0.3 051.70 8.8 55 1.0 76.4 16.9 0 0 0.362.70 8.4 8.5 0.6 68.7 22.0 a 0.2 073.68 5.2 6.5 1.1 70.8 21.1 0.3 0 0.275.60 5.1 19.1 1.1 57.3 22.3 0.1 0 0.177.17 3.9 11.0 1.4 69.3 18.0 0.1 0.3 083.19 7.6 13.8 0.5 73.7 11.7 0.1 0.1 0.1
83.95 5.3 7.8 1.1 70.7 20.0 0 0.1 0.2
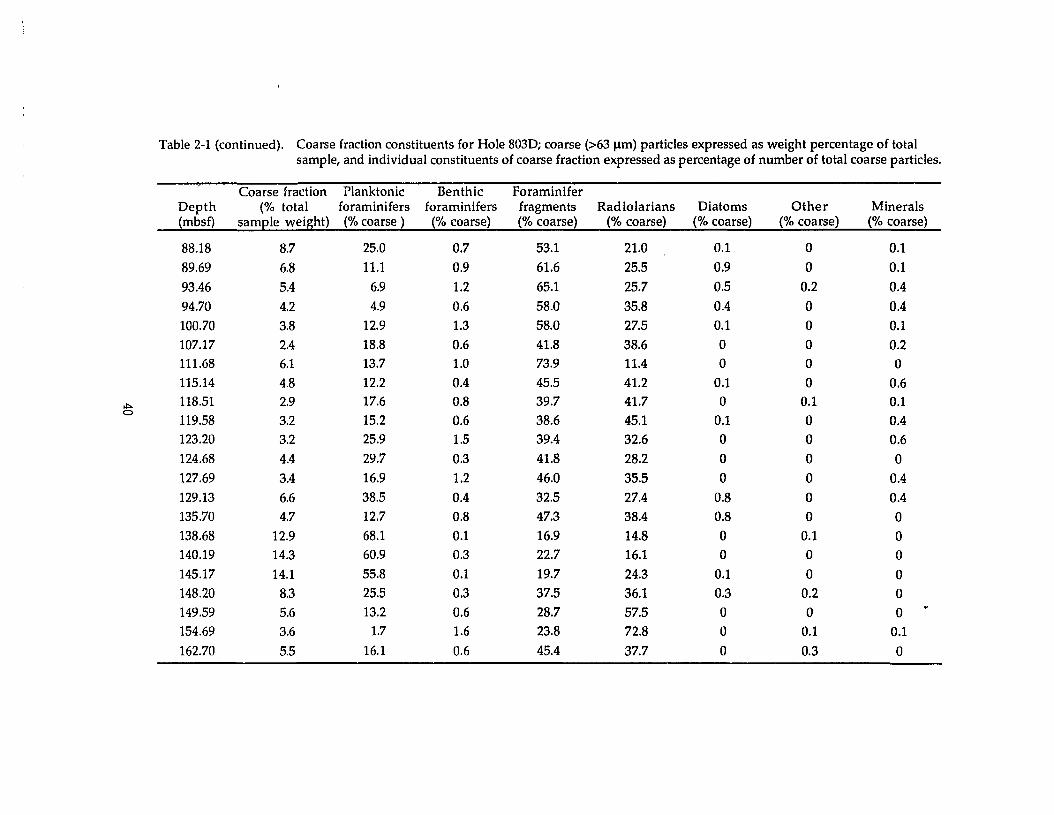
Table 2-1 (continued). Coarse fraction constituents for Hole 8030; coarse (>63 urn) particles expressed as weight percentage of totalsample, and individual constituents of coarse fraction expressed as percentage of number of total coarse particles.
Coarse fraction Planktonic Benthic ForaminiferDepth (% total foraminifers foraminifers fragments Radiolarians Diatoms Other Minerals(mbsf) sample weight) (% coarse) (% coarse) (% coarse) (% coarse) (% coarse) (% coarse) (% coarse)
88.18 8.7 25.0 0.7 53.1 21.0 0.1 0 0.1
89.69 6.8 11.1 0.9 61.6 25.5 0.9 0 0.1
93.46 5.4 6.9 1.2 65.1 25.7 0.5 0.2 0.4
94.70 4.2 4.9 0.6 58.0 35.8 0.4 0 0.4
100.70 3.8 12.9 1.3 58.0 27.5 0.1 0 0.1
107.17 2.4 18.8 0.6 41.8 38.6 0 0 0.2111.68 6.1 13.7 1.0 73.9 11.4 0 0 0115.14 4.8 12.2 0.4 45.5 41.2 0.1 0 0.6
""- 118.51 2.9 17.6 0.8 39.7 41.7 0 0.1 0.1a
15.2119.58 3.2 0.6 38.6 45.1 0.1 0 0.4123.20 3.2 25.9 1.5 39.4 32.6 0 0 0.6
124.68 4.4 29.7 0.3 41.8 28.2 0 0 0127.69 3.4 16.9 1.2 46.0 35.5 0 0 0.4
129.13 6.6 38.5 0.4 32.5 27.4 0.8 0 0.4135.70 4.7 12.7 0.8 47.3 38.4 0.8 0 0138.68 12.9 68.1 0.1 16.9 14.8 0 0.1 0140.19 14.3 60.9 0.3 22.7 16.1 0 0 0
145.17 14.1 55.8 0.1 19.7 24.3 0.1 0 0148.20 8.3 25.5 0.3 37.5 36.1 0.3 0.2 0149.59 5.6 13.2 0.6 28.7 57.5 0 0 0154.69 3.6 1.7 1.6 23.8 72.8 0 0.1 0.1
162.70 5.5 16.1 0.6 45.4 37.7 0 0.3 0
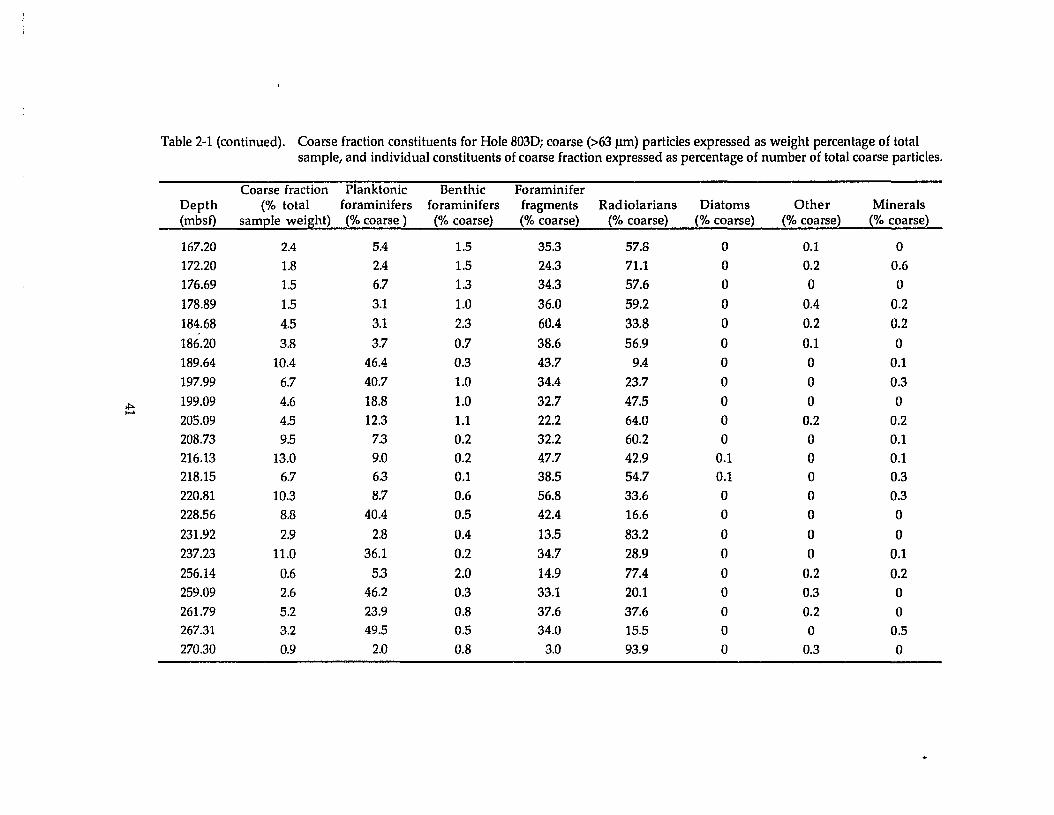
Table 2-1 (continued). Coarse fraction constituents for Hole 8030; coarse (>63 11m) particles expressed as weight percentage of totalsample, and individual constituents of coarse fraction expressed as percentage of number of total coarse particles.
Coarse fraction Planktonic Benthic ForaminiferDepth (% total foraminifers foraminifers fragments Radiolarians Diatoms Other Minerals(mbsf) sample weight) (% coarse) (% coarse) (% coarse) (% coarse) (% coarse) (% coarse) (% coarse)
167.20 2.4 5.4 1.5 35.3 57.8 0 0.1 0
172.20 1.8 2.4 1.5 24.3 71.1 0 0.2 0.6
176.69 1.5 6.7 1.3 34.3 57.6 0 0 0
178.89 1.5 3.1 1.0 36.0 59.2 0 0.4 0.2
184.68 4.5 3.1 2.3 60.4 33.8 0 0.2 0.2
186.20 3.8 3.7 0.7 38.6 56.9 0 0.1 0189.64 10.4 46.4 0.3 43.7 9.4 0 0 0.1
197.99 6.7 40.7 1.0 34.4 23.7 0 0 0.3
~199.09 4.6 18.8 1.0 32.7 47.5 0 0 0.....205.09 4.5 12.3 1.1 22.2 64.0 0 0.2 0.2
208.73 9.5 7.3 0.2 32.2 60.2 0 0 0.1216.13 13.0 9.0 0.2 47.7 42.9 0.1 0 0.1218.15 6.7 6.3 0.1 38.5 54.7 0.1 0 0.3
220.81 10.3 8.7 0.6 56.8 33.6 0 0 0.3228.56 8.8 40.4 0.5 42.4 16.6 0 0 0
231.92 2.9 2.8 0.4 13.5 83.2 0 0 0237.23 11.0 36.1 0.2 34.7 28.9 0 0 0.1
256.14 0.6 5.3 2.0 14.9 77.4 0 0.2 0.2259.09 2.6 46.2 0.3 33.1 20.1 0 0.3 0
261.79 5.2 23.9 0.8 37.6 37.6 0 0.2 0267.31 3.2 49.5 0.5 34.0 15.5 0 0 0.5270.30 0.9 2.0 0.8 3.0 93.9 0 0.3 0
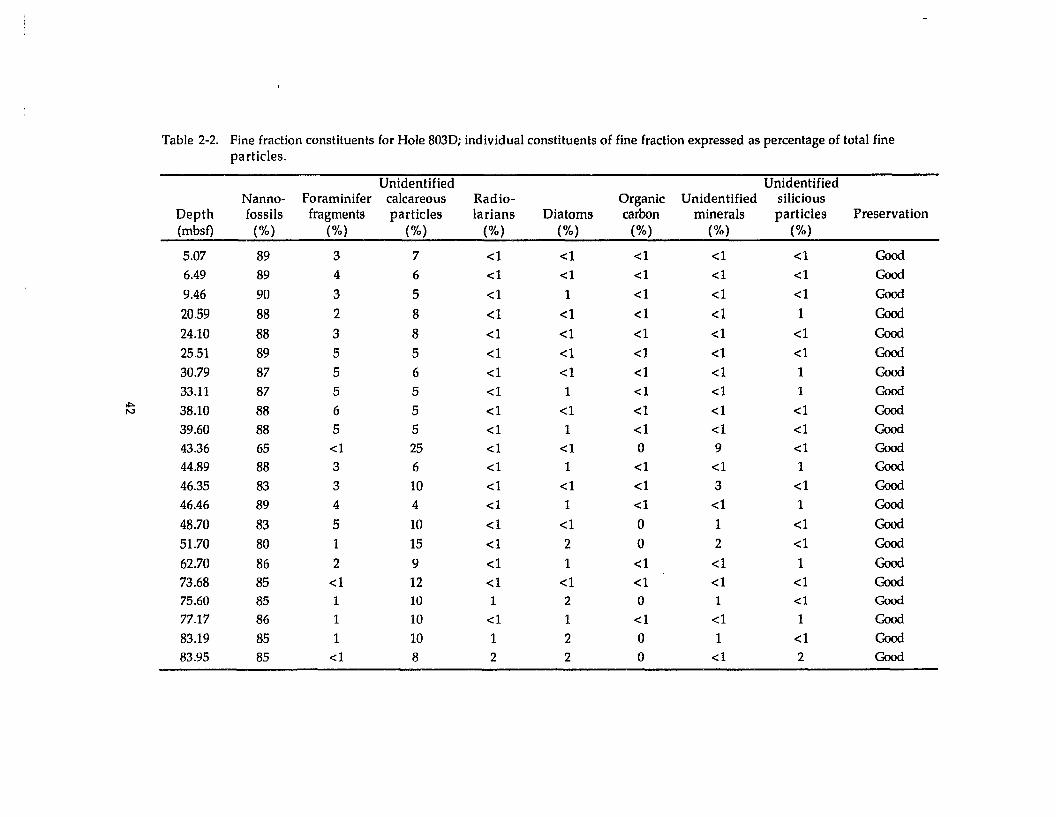
Table 2-2. Fine fraction constituents for Hole 8030; individual constituents of fine fraction expressed as percentage of total fineparticles.
Unidentified UnidentifiedNanno- Foraminifer calcareous Radio- Organic Unidentified silicious
Depth fossils fragments particles larians Diatoms carbon minerals particles Preservation(mbsf) (%) (%) (%) (%) (%) (%) (%) (%)
5.07 89 3 7 <1 <1 <1 <1 <1 Good6.49 89 4 6 <1 <1 <1 <1 <1 Good
9.46 90 3 5 <1 1 <1 <1 <1 Good
20.59 88 2 8 <1 <1 <1 <1 1 Good24.10 88 3 8 <1 <1 <1 <1 <1 Good25.51 89 5 5 <1 <1 <1 <1 <1 Good
30.79 87 5 6 <1 <1 <1 <1 1 Good33.11 87 5 5 <1 1 <1 <1 1 Good
>1>038.10 88 6 5 <1 <1 <1 <1 <1 GoodN
39.60 88 5 5 <1 1 <1 <1 <1 Good43.36 65 <1 25 <1 <1 0 9 <1 Good44.89 88 3 6 <1 1 <1 <1 1 Good
46.35 83 3 10 <1 <1 <1 3 <1 Good46.46 89 4 4 <1 1 <1 <1 1 Good
48.70 83 5 10 <1 <1 0 1 <1 Good
51.70 80 1 15 <1 2 0 2 <1 Good
62.70 86 2 9 <1 1 <1 <1 1 Good73.68 85 <1 12 <1 <1 <1 <1 <1 Good75.60 85 1 10 1 2 0 1 <1 Good
77.17 86 1 10 <1 1 <1 <1 1 Good
83.19 85 1 10 1 2 0 1 <1 Good83.95 85 <1 8 2 2 0 <1 2 Good
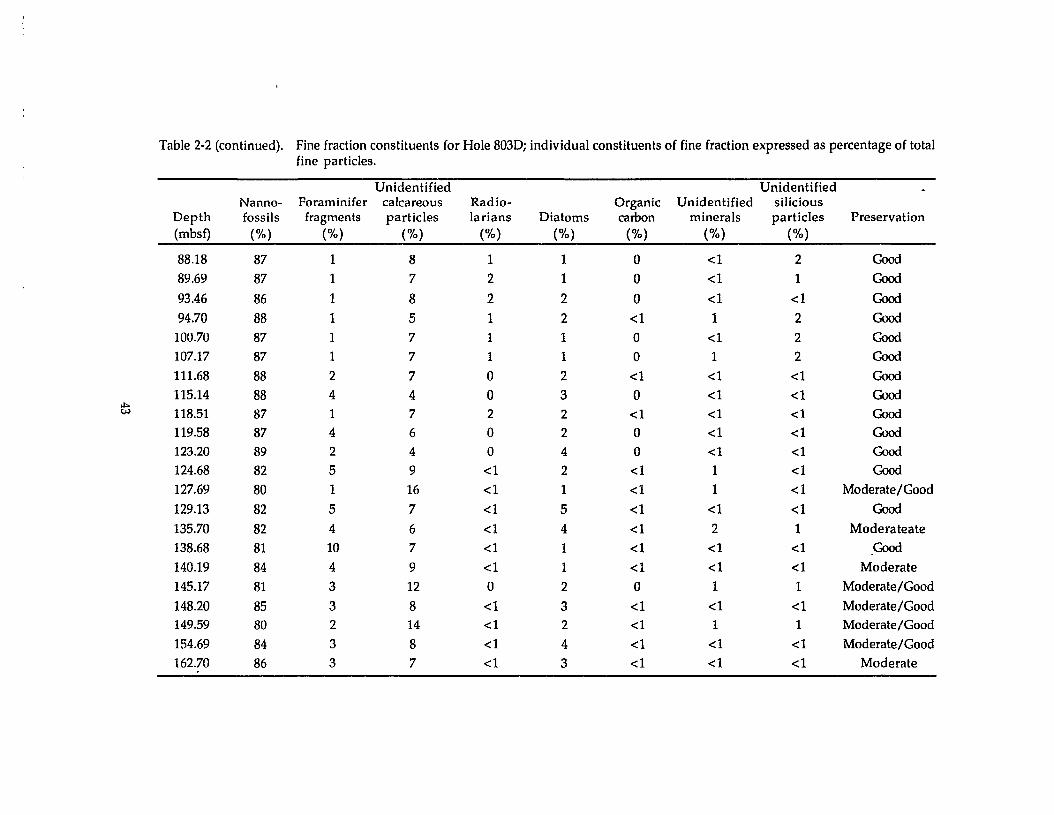
Table 2-2 (continued). Fine fraction constituents for Hole 803D; individual constituents of fine fraction expressed as percentage of totalfine particles.
Unidentified UnidentifiedNanno- Foraminifer calcareous Radio- Organic Unidentified silicious
Depth fossils fragments particles larians Diatoms carbon minerals particles Preservation(mbsf) (%) (%) (%) (%) (%) (%) (%) (%)
88.18 87 1 8 1 1 0 <1 2 Good
89.69 87 1 7 2 1 0 <1 1 Good
93.46 86 1 8 2 2 0 <1 <1 Good94.70 88 1 5 1 2 <1 1 2 Good
100.70 87 1 7 1 1 0 <1 2 Good107.17 87 1 7 1 1 0 1 2 Good
111.68 88 2 7 0 2 <1 <1 <1 Good
115.14 88 4 4 0 3 0 <1 <1 Good"'"~ 118.51 87 1 7 2 2 <1 <1 <1 Good
119.58 87 4 6 0 2 0 <1 <1 Good123.20 89 2 4 0 4 0 <1 <1 Good124.68 82 5 9 <1 2 <1 1 <1 Good
127.69 80 1 16 <1 1 <1 1 <1 Moderate/Good
129.13 82 5 7 <1 5 <1 <1 <1 Good135.70 82 4 6 <1 4 <1 2 1 Moderateate
138.68 81 10 7 <1 1 <1 <1 <1 Good
140.19 84 4 9 <1 1 <1 <1 <1 Moderate
145.17 81 3 12 0 2 0 1 1 Moderate/Good
148.20 85 3 8 <1 3 <1 <1 <1 Moderate/Good149.59 80 2 14 <1 2 <1 1 1 Moderate/Good
154.69 84 3 8 <1 4 <1 <1 <1 Moderate/Good
162.70 86 3 7 <1 3 <1 <1 <1 Moderate
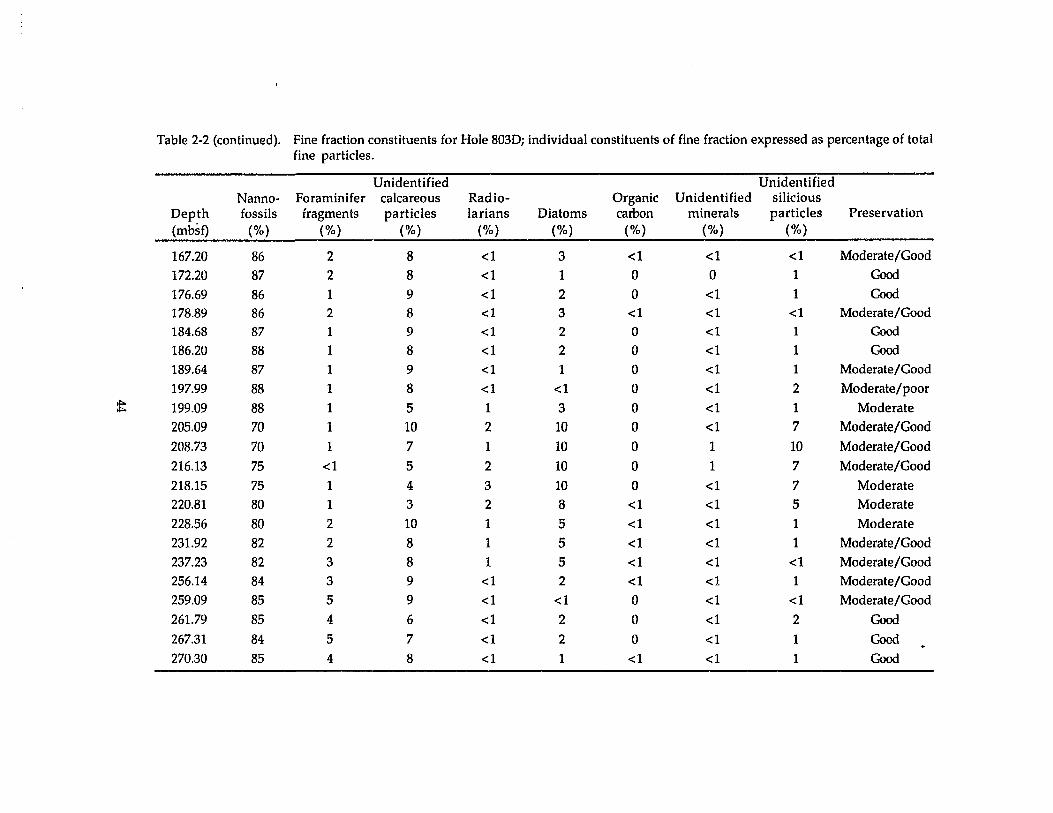
Table 2-2 (continued). Fine fraction constituents for Hole 8030; individual constituents of fine fraction expressed as percentage of totalfine particles.
Unidentified UnidentifiedNanno- Foraminifer calcareous Radio- Organic Unidentified silicious
Depth fossils fragments particles larians Diatoms carbon minerals particles Preservation(mbsf) (%) (%) (%) (%) (%) (%) (%) (%)
167.20 86 2 8 <1 3 <1 <1 <1 Moderate/Good
172.20 87 2 8 <1 1 0 0 1 Good
176.69 86 1 9 <1 2 0 <1 1 Good178.89 86 2 8 <1 3 <1 <1 <1 Moderate/Good
184.68 87 1 9 <1 2 0 <1 1 Good
186.20 88 1 8 <1 2 0 <1 1 Good
189.64 87 1 9 <1 1 0 <1 1 Moderate/Good
197.99 88 1 8 <1 <1 0 <1 2 Moderate/poor
t 199.09 88 1 5 1 3 0 <1 1 Moderate
205.09 70 1 10 2 10 0 <1 7 Moderate/Good
208.73 70 1 7 1 10 0 1 10 Moderate/Good
216.13 75 <1 5 2 10 0 1 7 Moderate/Good
218.15 75 1 4 3 10 0 <1 7 Moderate
220.81 80 1 3 2 8 <1 <1 5 Moderate
228.56 80 2 10 1 5 <1 <1 1 Moderate
231.92 82 2 8 1 5 <1 <1 1 Moderate/Good
237.23 82 3 8 1 5 <1 <1 <1 Moderate/Good
256.14 84 3 9 <1 2 <1 <1 1 Moderate/Good
259.09 85 5 9 <1 <1 0 <1 <1 Moderate/Good
261.79 85 4 6 <1 2 0 <1 2 Good267.31 84 5 7 <1 2 0 <1 1 Good270.30 85 4 8 <1 1 <1 <1 1 Good
Figure 2-1. Synthetic seismogram (center) flanked by field seismic record for
Site 803. Labels 3-1 through 3-11 and 3-a through 3-c correspond
to identified seismic reflectors.
45
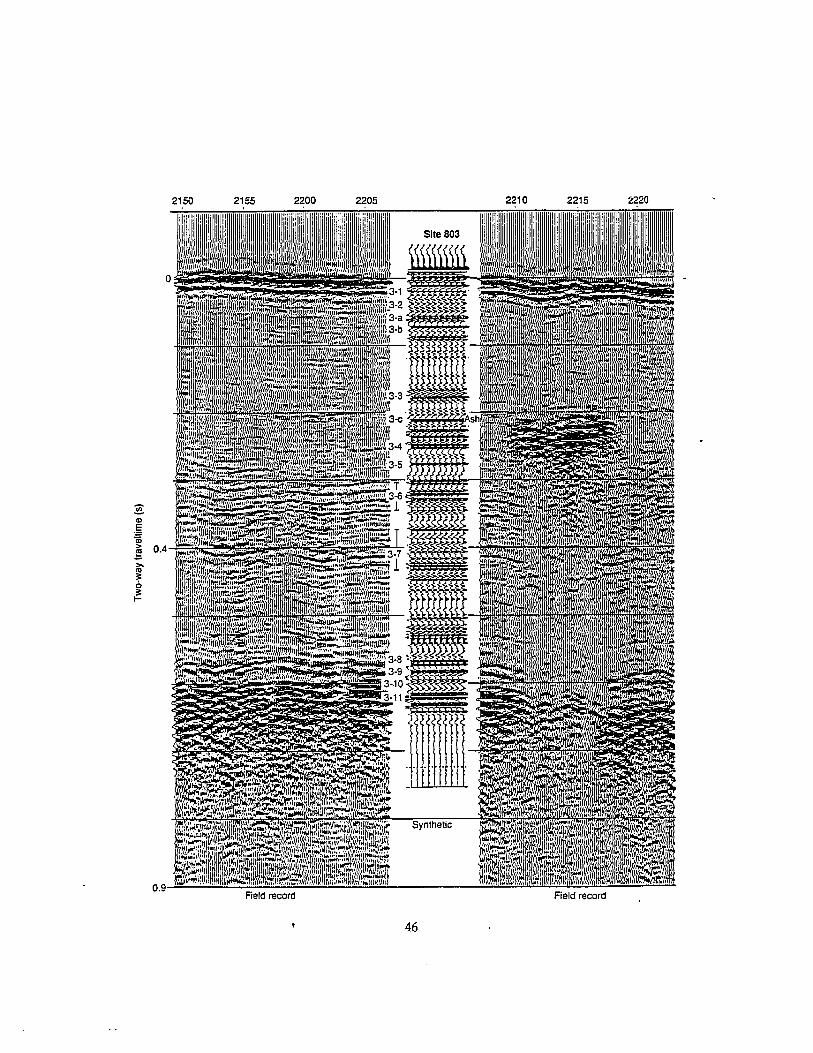
2150 2155 2200 2205 2210 2215 2220
Field recordField recordO.9'-:::---'"'"'-'=~=:';;"::::==
eCI>
,§a;> 0.4~>.
'"~6~
46

Figure 2-2. Downhole profiles of porosity, compressional-wave velocity,
and calcium carbonate for the upper 300 m of Hole 803D.
47
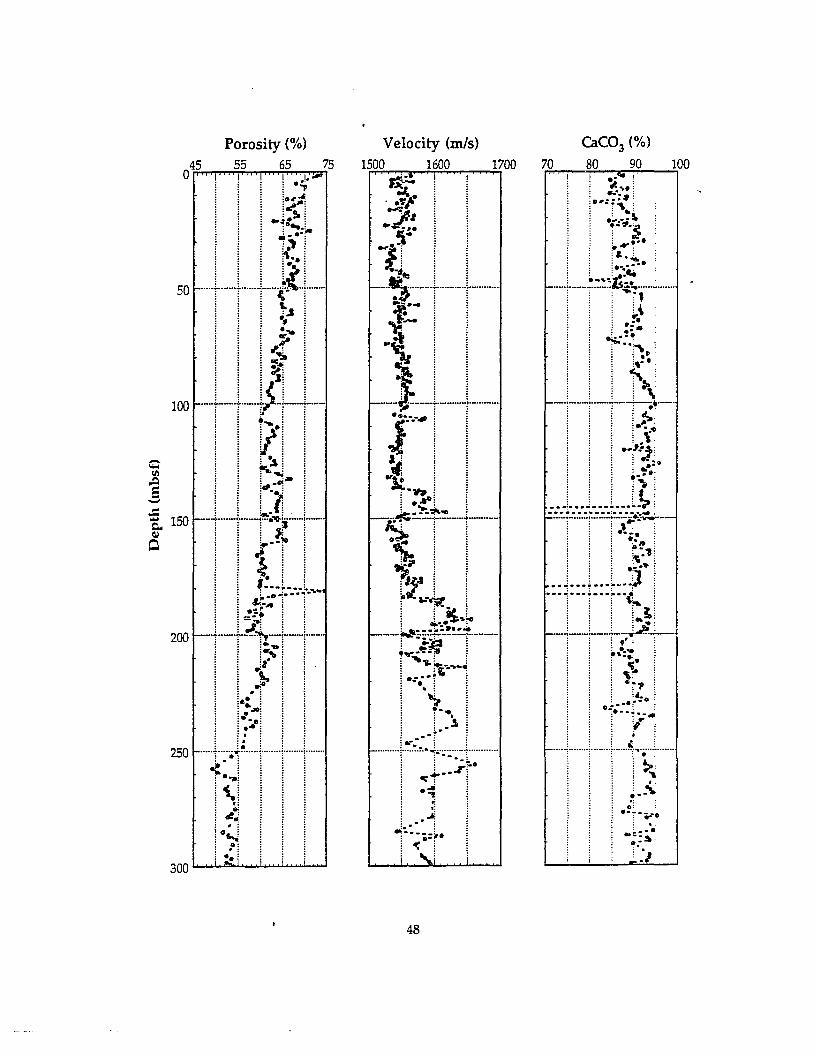
50
csco, (%)
80 9070
Porosity (%)
55 65 75
! I ! ·f~
100 ~_.L...l.._..i>_]__L.__.
I i ~i I
i 1 { 1 i: : -: : :
i l: i ; ~
250 ~····~·:j~·····1"·······I········I········
l~l ! ! !: e: : : :i ~~ iii: .: : : :
IG~ I I I
150
48
Figure 2-3. (A) Grain size vs. depth for the samples analyzed in this study.
Coarse (sand-sized) fraction is the percent by weight retained on
a 63-~m sieve. (B) Relative percentages of the four major
components of the coarse fraction. (C) Relative percentages of
the fine fraction constituents.
49
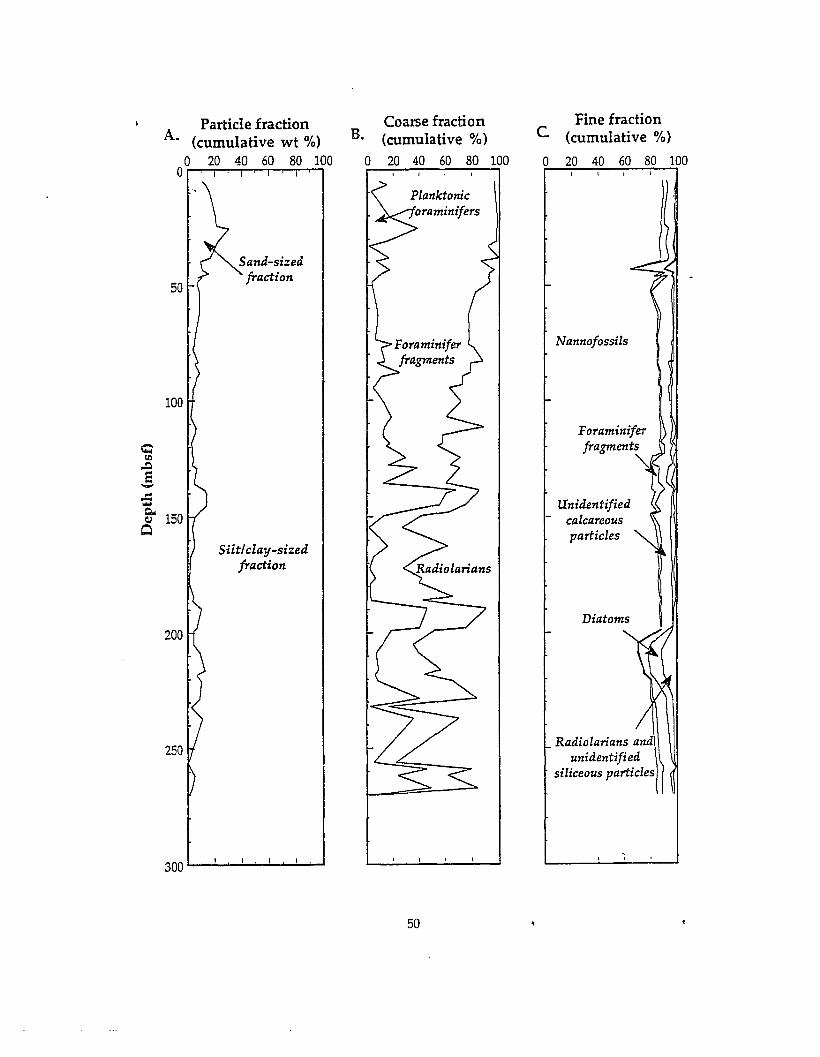
Diatoms
Foraminiferfragments
Fine fraction(cumulative %)
20 40 60 80 100
Unidentifiedcalcareousparticles
Nannofossils
Radiolarians andunidentified
siliceous particles
o
cCoarse fraction(cumulative %)
20 40 60 80 100oB.
Sand-sizedfraction
Silt/clay-sizedfraction
50
Particle fractionA. (cumulative wt %)
o 20 40 60 80 100O,......,.--r--.--,...-,.-,......,...;r-,.~
100
..r:..go 150Q
.....CI.l,.Q
E-
50
Figure 2-4. Correction of downhole porosity and velocity data to remove
the general depth trend caused by sediment compaction effects.
Shown are measured data (dashed line) and corrected data
(heavier solid line). Adjusted data (bottom scales) are reported
in increments of an arbitrary number plus % porosity or m/s
velocity, to differentiate corrected from measured data.
51
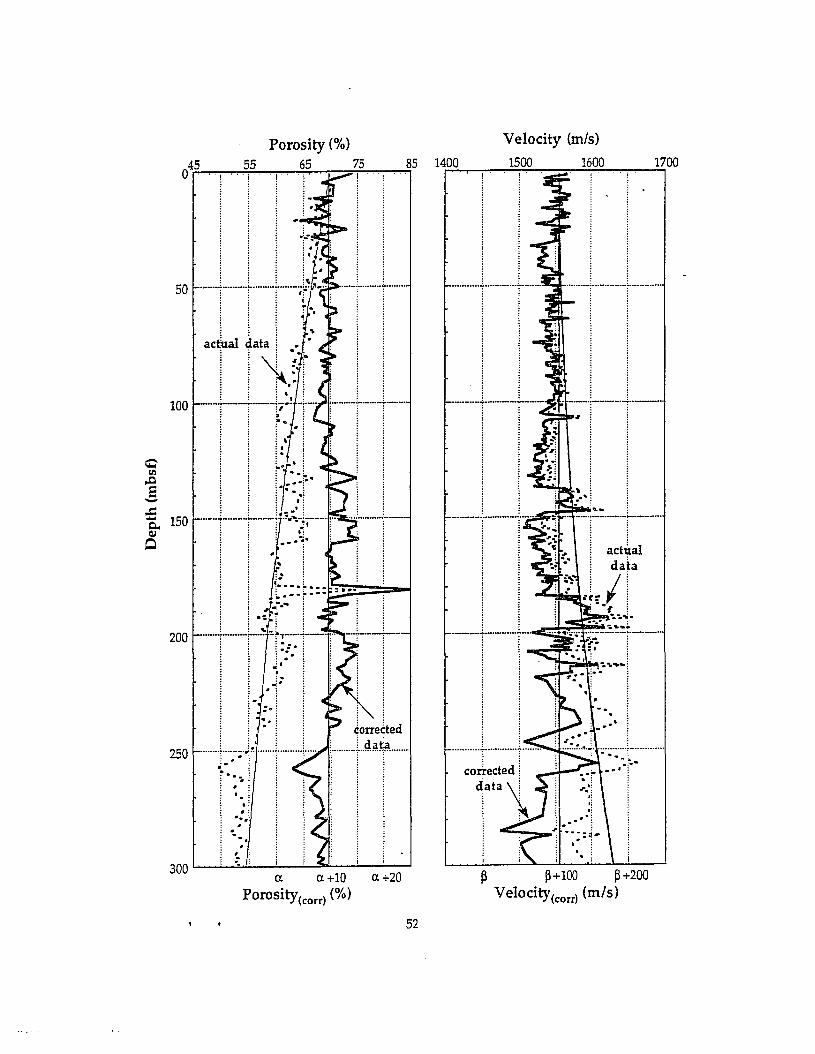
1700
. .T-
...........~ ~ .
Velocity (m/s)
1500 1600
... ~
------__.~t···:~.," :, :..
~ ~+100 ~+200
Velocity(carr) (mls)
••••••••••• "=" &O ••~ ••••••••
140085
a +20
Porosity (%)
65 75
a a+10Porosity(corr) (%)
50
250
200
100
150
52
Figure 2-5. Correction of downhole microfossil data, i.e., foraminifer
fragments and radiolarians, to remove the general depth trend
caused by dissolution effects. Shown are measured data (dashed
line) and corrected data (heavier solid line). Adjusted data
(bottom scales) are reported in increments of an arbitrary
number plus % microfossils, to differentiate corrected from
measured data.
53
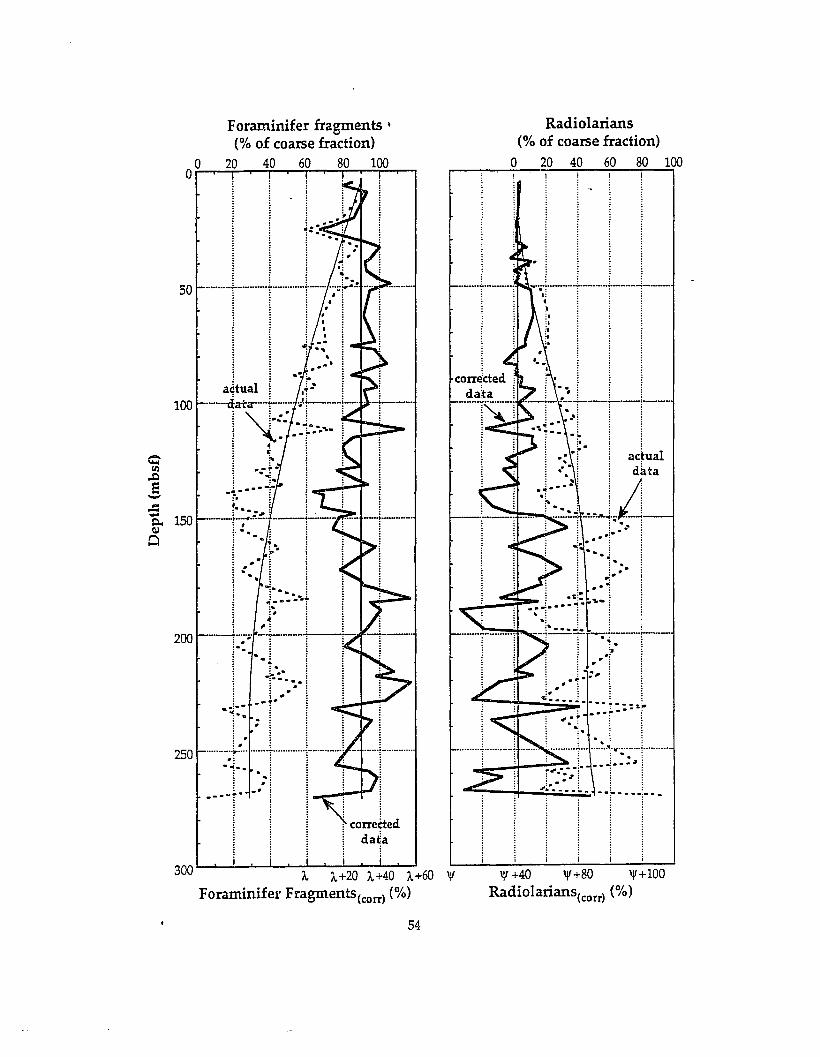
50
100
--CI.l.0e-..c....
1500.. sll.lQ
200
250
I.. 1..+20 1..+40 1..+60Foraminifer Fragments(corr) (%)
54
Radiolarians(% of coarse fraction)
o 20 40 60 80 100
'I' +40 'I'+80 'I'+100Radiolarians(corr) (%)
Figure 2-6. Total porosity vs. percentage of coarse fraction and three coarse
fraction constituents (planktonic foraminifers, foraminifer
fragments, and radiolarians).
55
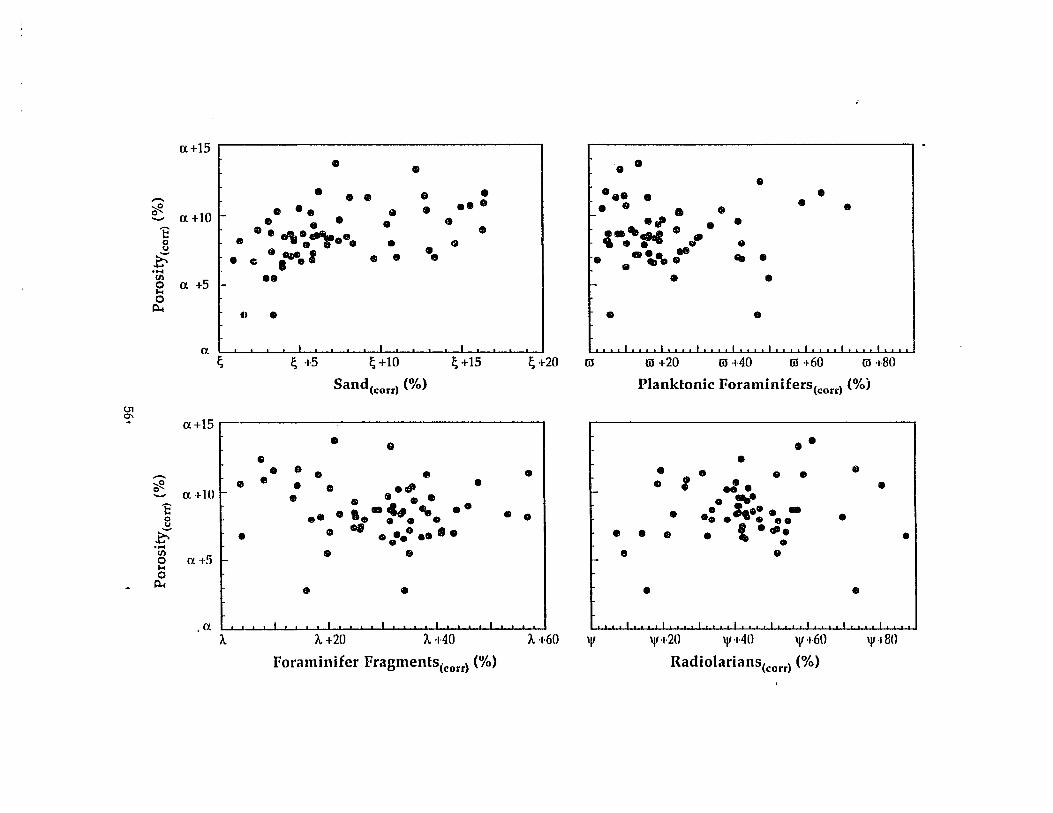
0.+15I • • • ..
•• • • e • -.. • •- •• 0 •~ • •• 0 • • • • • •0 0.+10- • • - • 0' • ••t \I. e\.~ e • '.'!'4 G ,0 • •• 0 • CI .. .. •u• e (i ...... , ·0£ fl • . .-\.-.. "- •....
til0. +5 •• • •0
I-c0
Pot
J0 •
1 L~ ,J 0 " 0 I 0 0 0 0 I 0 0 0 0 I 0 0 .: I 0 0 0 0 I 0 0 , 0 I 0 , 0 0 I, I , , I , , I , , , . . I I , I I ,
~ ~ +5 ~+1O ~+15 ~+20 {jJ m+20 m+40 {jJ +60 (jJ +80
Sand(corr) (%) Planktonic Foraminifers(cord (%;
010-
0.+15 ,• • • •
• •• e • • • •I • • • •- •?f? • • .. .41 • • .I • •- 0. +10 • • • •• .~-c -ec, -- •• . ~....... • •0 e· · '. . . . • ••• • •• •u
• 08 .0 .1. l·-·£ • • • • •.... e.- . . -til
0.+5 • • • •0I-c0
Pot
on [0 0 0 • I 0 ,~ , I , , , • I , ~, , I , , , , I , ••• 1 t"",,~ ,',' ,,' ,.""""""""" ,~" IA 1..+20 1.+40 1.+60 'I' '1'+20 'I'+40 'I' +60 'I'+80
Foraminifer Fragmenls(corr) (%) Radiolarians(corr) (%)
Figure 2-7. Total porosities of foraminiferal assemblages and glass beads.
Vertical lines indicate 95% confidence limits associated with the
plotted point. The internal porosity, or intratest porosity, is the
difference between the porosities of foraminifers and glass beads
for particles of the same diameter. Taken from Bachman (1984).
S7
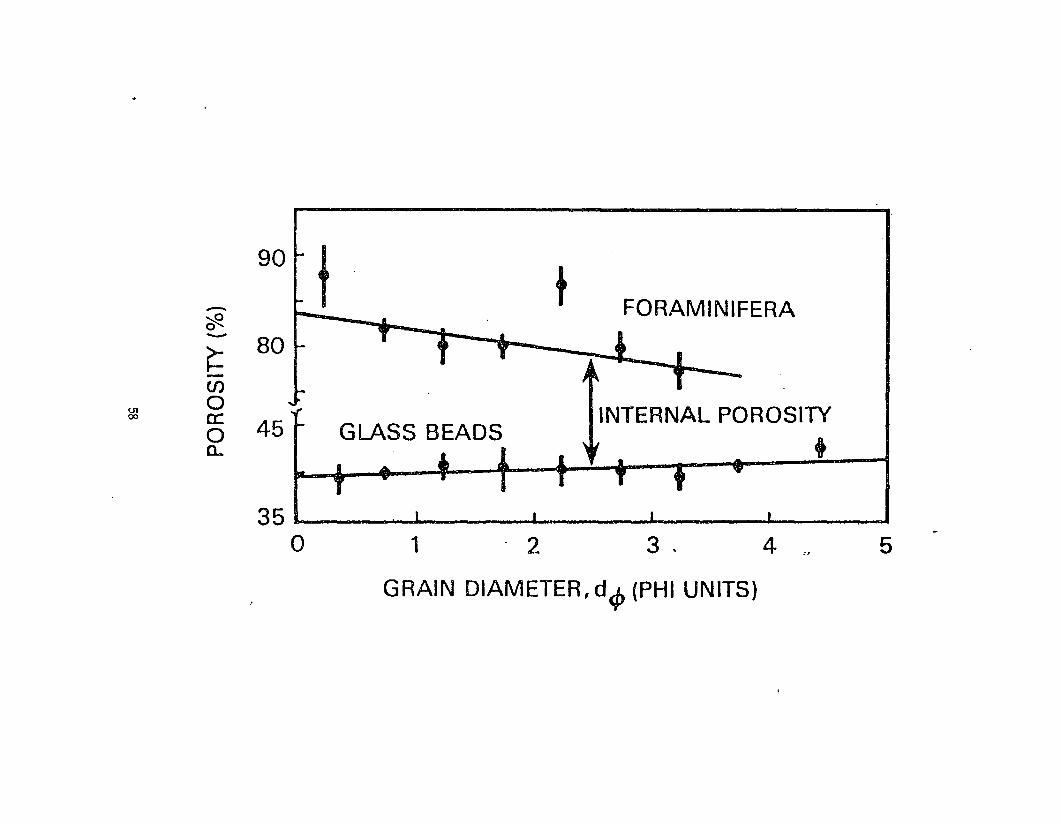
-90 t- t t
*'l- FORAMINIFERA
-~
80-en
OJ 000 0::
45 f0 GLASS BEADSilNTERNAL POROSITY
a.. .. I - +
51 . 2 3 , 4
GRAIN DIAMETER, del> (PHI UNITS)
35 I , I I I I I
o
Figure 2-8. Interparticle porosity vs. percentage of coarse fraction and three
coarse fraction constituents (planktonic foraminifers,
foraminifer fragments, and radiolarians). Lines through the
data are least-squares fit, with equations shown.
59
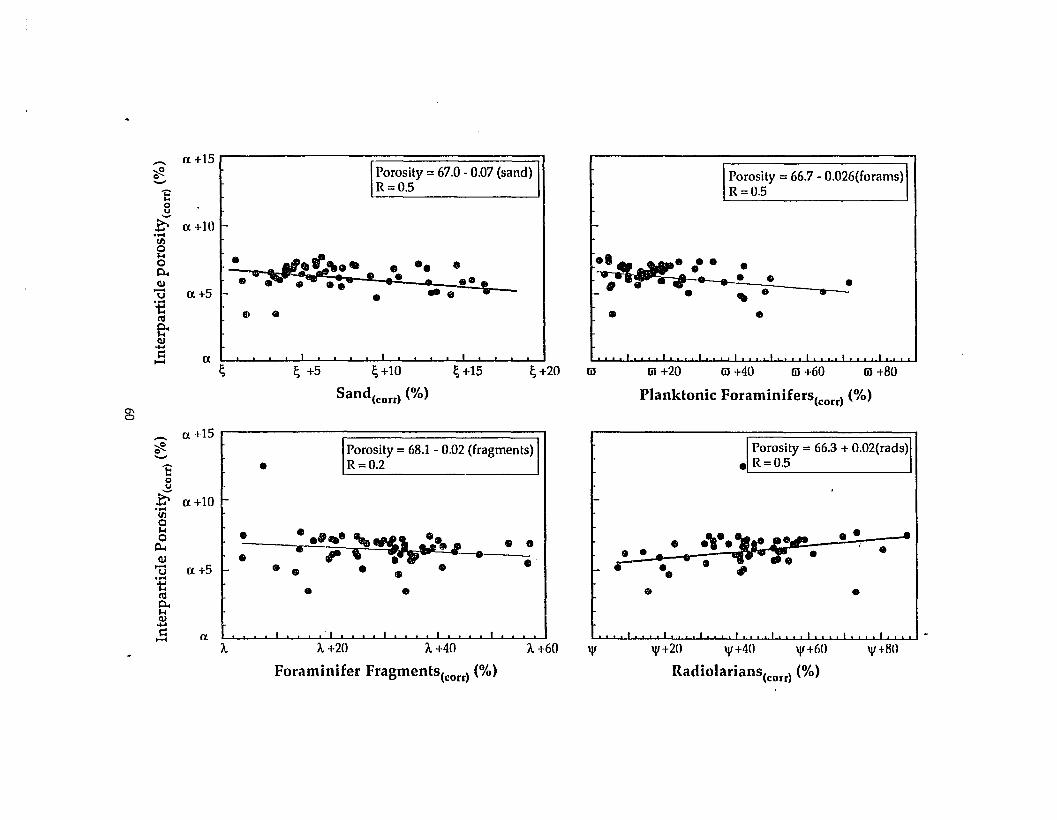
ct+l01-
\"Porosity =67.0 - 0.07 (sand) IR=O.5
(jJ +80
•
(jJ +60
•
(jJ +40
Porosity =66.7 - 0.026(forams)R=O.5
(jJ +20
Planktonic Foraminifers(corr) (%)
•
• •• •~ . . .~ ". . .,. . ,
(jJ~+20
I
~+15
I
!;+10
Sand(corr) (%)
I
!; +5
Jj ••. ~.".~... . ..~ '.. . .. ,
• • lilt.I- •
Cl •
!;ct
ct +5
1:ou
~....Uleop...Q)
ut!res~J.<Q)....~-
-"#-
0\o
I
'1/+80
•
'1/+20 '1/+40 '1/+60
Radiolarians(corr) (%)
Porosity = 66.3 + 0.02(rads)• R=O.5
•
I .... I."." I ... " I .... I .... I .... I
I-
• • • •• .....~S;.,. .~. •1-. •• • • •• #
'1/
• ••
•
Porosity = 68.1 - 0.02 (fragments)R=0.2
•
A. +20 A. +40 A. +60
Foraminifer Fragments(corr) (%)
•
• Q ..... '~~"I· .,. , ... .• I) ••
A.ct
CL +5
CL +10
'Eou
~....Uleo~
Q)
u....1::res0..J.<Q)....~
>-<
_ ct+15 1"#- I "
Figure 2-9. Compressional-wave velocity vs. percentage of coarse fraction
and three coarse fraction constituents (planktonic foraminifers,
foraminifer fragments, and radiolarians).
61
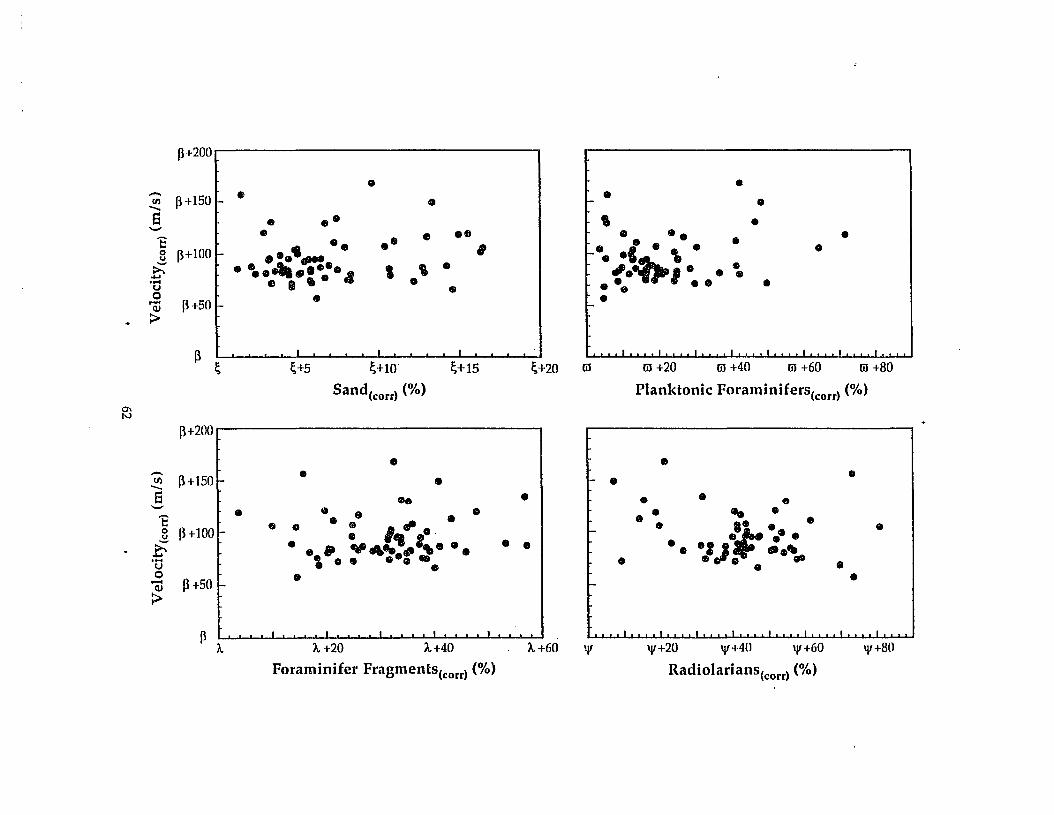
P+200
~ • •~ P+150 • • • •6 ••• ,.
- Cl e •• • •• •'E ...- At •• •• •
e p+100 • • •• fI*! ... O••C \~ .e.......... .. , ,. ,: _, . . ...... e III •• ... ,. •• •u ••
~ P+50· •~
P L""".!.""", ,·1 f"""",!"""",!""!""!,,,,!,,,,!~ ~+s ~+10' ~+lS ~+20 (iJ m+20 m+40 m+60 m+80
Sand(corr) (%) Planktonic Foraminifers(corr) (%)0\N
P+2oo~ • •
- • 0~ P+lS0 • •
6 .... • •- .. .. .~. e. • •~ n 100 G.·. II" • • ~.. ••• •u ,.+ • fI' • ••~ · · • ¥4"~~'. e. •• e • • ,) .....'... ... ... ... -.u •• •
~ P+SO • •~
P f, ,,,,,,,, I , , , , , , , • , I , , , , , , , , ,I. f, ,,,,,,,,,,,,,I, , , , , , , , , I , , , , , , , , , I , , , , !
A A +20 A+40 A+60 'I' '1'+20 '1'+40 '1'+60 0/+80
Foraminifer Fragments(corr) (%) Radiolarians(corr> (%)
Figure 2-10. Velocity vs. percentage of coarse fraction and three coarse
fraction constituents (planktonic foraminifers, foraminifer
fragments, and radiolarians) for sample depths <150 mbsf. Lines
through the data are least-squares fit, with equations shown.
63
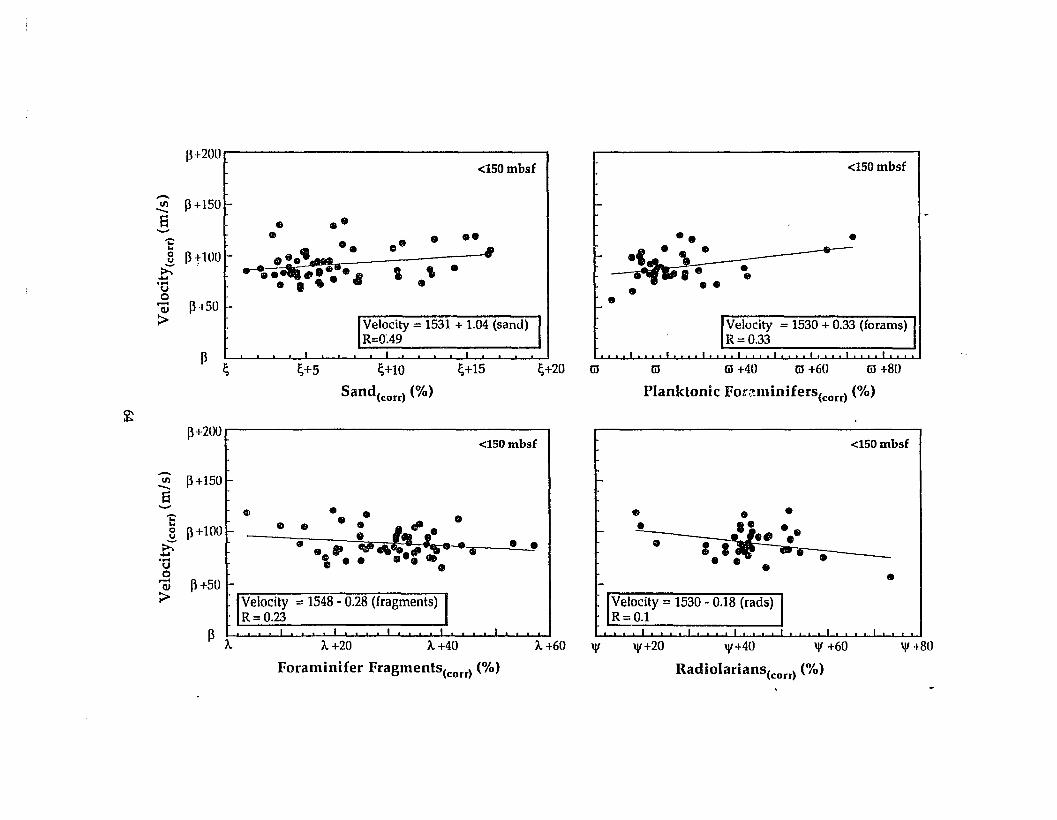
p+200<150mbsf <150mbsf
(jJ (jJ +40 (jJ +60 (jJ +80
Planktonic For.<tminifers(corr) (%)
(jJ1;+201;+15
e- • •• ,~ _O.}:;, , •
•
• •• •
•
1;+5 1;+10
Sand(corr) (%)
Velocity =1531 + 1.04 (sand)R=OA9
. 0-••
0..~D _
P I;
~ P+150El-'E.§. PtWO
.e-....uo
Q1 P+50:>
~
'l' +80
<150mbsf
I .... I .... I .... I .... I .... I
••• •• • •• ~•.,..-=------. ,)~---... -• • • •
Iv elOCity =1530 - 0.18 (rads)R=O.l
I-
I-
I-
'l' 'l' +20 'l' +40 'l' +60
Radiolarians(corr) (%)
<150mbsf
],,+20 ],,+40 ')..+60
Foraminifer Fragments(corr) (%)
ell ••e. •. ", •--...---• .J\.L4-~(. • ••,.. .... ..
"
I I , I I I , I I I I , I I , I , , I , I • , , , !Ilt""
P+50
p+100
--~ P+l50S'i:..ou
~oW....UoQJ
;>
P+200
Figure 2-11. Impedance vs. percentage of coarse fraction and three coarse
fraction constituents (planktonic foraminifers, foraminifer
fragments, and radiolarians) for sample depths <150 mbsf. Lines
through the data are least-squares fit, with equations shown.
65
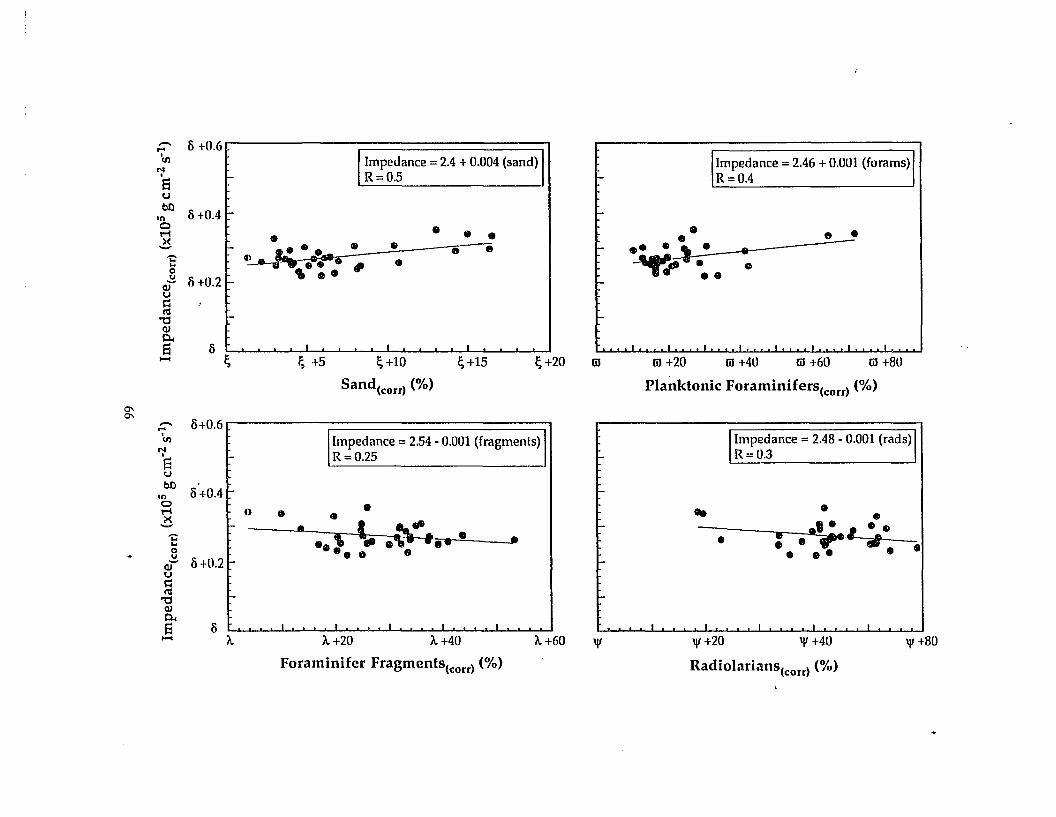
o+0.6~ I ,IImpedance =2.4 + 0.004 (sand)R=0.5
• •
Impedance = 2.46 + 0.001 (forams)R=O.4
•• •• II
••
(jJ +20 (jJ +40 (jJ +60 (jJ +8U
Planktonic Foraminifers(corr) (%)
(jJ
•ii••
~ +5 ~+10 ~+15 ~+20
Sand(corr) (%)
•(l • •
•, .
~o
0+0.2
0+0.4
-;:..ou
OJ~
Uc:::l1S
resOJPo.8
1-4
....'Ill
N
'8ueo
It)
ot'"4~
[Impedance = 2.54 - 0.001 (fragments)IR=0.25
Foraminifer Fragments(corr) (%)
'" +80
Impedance =2.48 - 0.001 (rads)R=0.3
• •.. .- I • •
• ! ••,- if. •• ••
'" +20 '" +40
Radiolarians(corr) (%)'"A+60
II
A +40II
A+20I
o. .•· l :t.f18
•• ) ...\' I.- • 1/1• 8 •
0\0\ - 0+0.6....,
IIIN,S
~
ueo
II') 0+0.41-0t'"4><- t--;:...0u
OJ~ 0+0.21-uc:::l1S
res I-OJPo.8 a
1-4 A

Figure 2-12. Total porosity, interparticle porosity, velocity and impedance vs.
relative percentage of nannofossils (expressed as a percentage of
fine fraction).
67
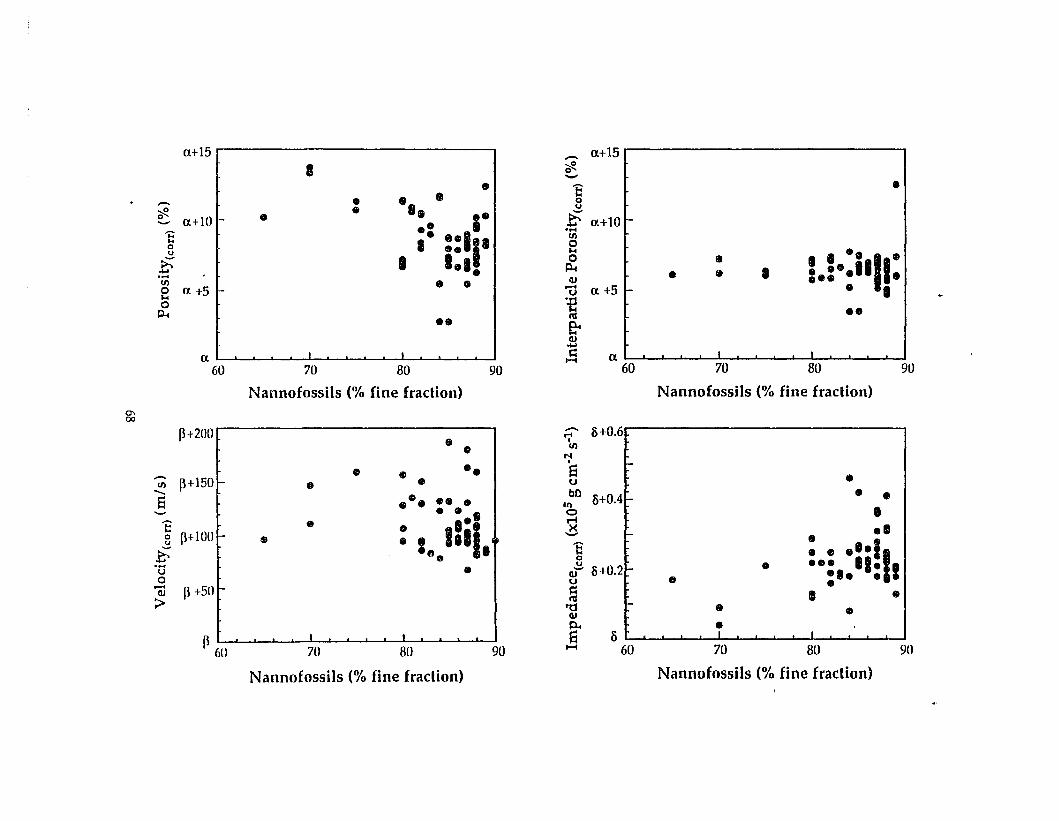
0.+15 _ 0.+15
I eft.-• 1: I •- • • • 0
~ • II ••u
~ 0.+10 • ~ 0.+101--;:; •• ....
,. ::11' til.. 00U J.o
a +5 f . .. I ·~ • 1.1.0 •.... III • It • 1.:0
•11 I-....
til • 0QJ
0 0. +5 - • •J.oU....
0 'tP-4 III •••• frQJ
0.' 1....
«I! , , , I ! , . , ,! , ! , ~ , , ! ! I ! ! ! ! !.....
60 70 80 90 60 70 80 9U
Nannofossils (% fine fraction) Nannofossils (% fine fraction)o-,oe
P+200 ;:;- ~+O,6
• I
• tilM•- • • • •• a
til p+150 • u •- bO •a •••••• 10 ~+0.4 •- • • • 0 •'E • '·1 ~ ••8 P+100 • : Ift.ll•• - •£ 1: ••."110.... u • ... I.. Iu • QJ"" HO,20 u .. ••• •- P+5U l:: •QJ • •> III
rt:J •QJ •Pro I
c, •, , , J ! I , I,
! I , , 1 Ei s70 80 90 1-4 60 70 8U 90
Nannofossils (% fine fraction) Nannofossils (% fine fraction)
Figure 2-13. Identified seismic reflectors at site 803 superimposed on
downhole profiles of impedance, calcium carbonate, and
percentage of three individual coarse fraction constituents
(planktonic foraminifers, foraminifer fragments, and
radiolarians).
69
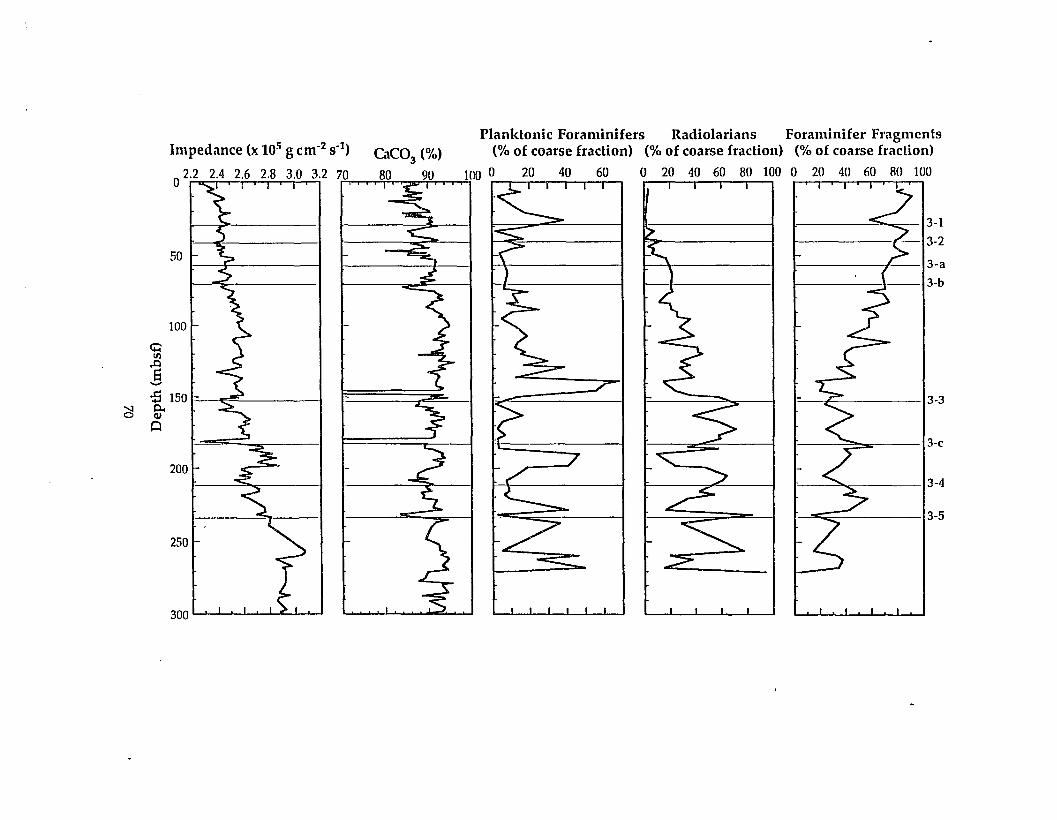
Planktonic Foraminifers Radiolarians Foraminifer Fragments(% of coarse fraction) (% of coarse fraction) (% of coarse fraction)
v vv /v lOO 0 20 40 60 0 20 40 60 SO 100 0 20 40 60 80 lOOiii , iii'::t&J iii' iii iii iii iii iii Ii' i • Iii' iii
300 I , , ! I , ' C I , '
50
100
Qtil
..0S-o£i 150 I- ~ I t: --- I ~ I 1= ====---- I 1= r- 13-3$ .... .
"'J p..a Q,/
0
'oJ > t=J
I lC It~ I t )= 3-c
;i 7/'
3-4
3-5~ . <, I t r I ~ .7 I ~ <; I ~ 7 I
250
CHAPTER 3
INFLUENCE OF MICROFOSSIL CONTENT
ON CONSOLIDATION PROPERTIES
Introduction
Calcareous sediments have been reported as exhibiting unique
engineering and compression behavior that can be related to the type and
preservation of their major microfossil constituents (Demars, 1982). For
example, carbonate sediments do not compact to as Iowa void ratio as
noncarbonate sediments (Morelock & Bryant, 1971; Rezak, 1974). Several
studies (e.g., Morelock and Bryant, 1971; Kelly et al., 1974; Nacci et al., 1975;
and Valent et al., 1982) have focused on the physical behavior of marine
sediments and the relationship of various physical property parameters to
calcium carbonate (CaC03) content. Many of these investigations examined
sediments with CaC03 contents ranging from 30% to 90% and found distinct
correlations between specific parameters and CaC03 content.
Ontong Java Plateau sediments generally exhibit CaC03 contents near
90% (Figure 3-1). In a comparison of CaC03 content profiles for the five sites
drilled during ODP Leg 130, we observe that the sites at greater water depths
(Le., Sites 804 and 803) have carbonate contents generally near 90%, whereas
shallower sites (i.e., 806 and 807) have carbonate contents near 95% (Kroenke
et al., 1991). Increased calcite dissolution deeper in the water column results
in sediments of deeper sites exhibiting more CaC03 dissolution than
sediments of the same age at shallower sites. A schematic showing the
71
relative water depths of the five sites drilled during ODP Leg 130 is presented
in Figure 3-2.
This study examines the consolidation behavior of these high
carbonate Ontong Java Plateau sediments, and attempts to relate the
observed behavior to sediment composition. In this study, we consider the
effects of carbonate content, grain size, intraparticle water, and cementation
on the observed consolidation behavior. Because the carbonate contents are
fairly uniform, we have also examined the data for indications that
variations in microfossil content (i.e., the relative abundance of intact
foraminifers) result in variations in the physical properties measured.
Consolidation Theory
Consolidation tests are used to assess the behavior of sediments under
mechanical loading. The process of consolidation involves the expulsion of
pore fluid and adjustment of the sediment structure as a result of the applied
stress. The rate and degree of consolidation have been observed (Demars,
1982; Valent et al., 1982) to vary for different sediment types and are
influenced by factors such as the depth and rate of burial, permeability of the
sediments, and the presence of diagenesis or cementation.
Consolidation involves two processes, the expulsion of pore fluid and
the adjustment of the sediment grains, that result in a decrease in sediment
volume with increasing overburden. One-dimensional consolidation
theory was first proposed by Terzaghi (1923). When a load is applied to the
saturated sediment, it is first carried by the pore fluid, resulting in an
instantaneous initial increase in pore pressure. Drainage is allowed to occur,
72
however, and dissipation of excess pore pressure occurs at a rate dependent
upon the permeability of the sediment, which is in turn affected by such
factors as sediment grain type, size and shape, number of connected pore
spaces, presence of cementation and diagenesis.
Primary consolidation is the consolidation stage characterized
predominantly by expulsion of pore fluid and subsequent reduction of pore
volume. As the excess pore pressure caused by a particular load dissipates,
the sediment grains assume the load, and adjust to a more compact structure.
This stage is referred to as secondary consolidation. The combined processes
of primary and secondary consolidation result in a reduction in sample
volume. The sediment grains are relatively incompressible, and the rate of
secondary consolidation depends mainly on grain type and cementation.
Primary consolidation (i.e., reduction of the pore volume) usually plays the
more significant role in total volume reduction, particularly in the short
term.
The one-dimensional consolidation test, in simple terms, consists of
the application of normal (vertical) pressures upon a small (often 6.2-cm
diameter), free-draining, confined, cylindrical sample. Loads are increased by
specified amounts and the rate and amount of volume decrease under each
load are recorded. Research has found that the best results are obtained
when the load is doubled producing a ratio of tlp/p =1 (Leonards, 1962).
Because the sample diameter is fixed, the change in sample volume can be
calculated from a measured change in sample height. Incremental loads are
applied and the change in sample height is measured with time. The results
of the tests are usually displayed as a plot of void ratio (e) versus the log of
73
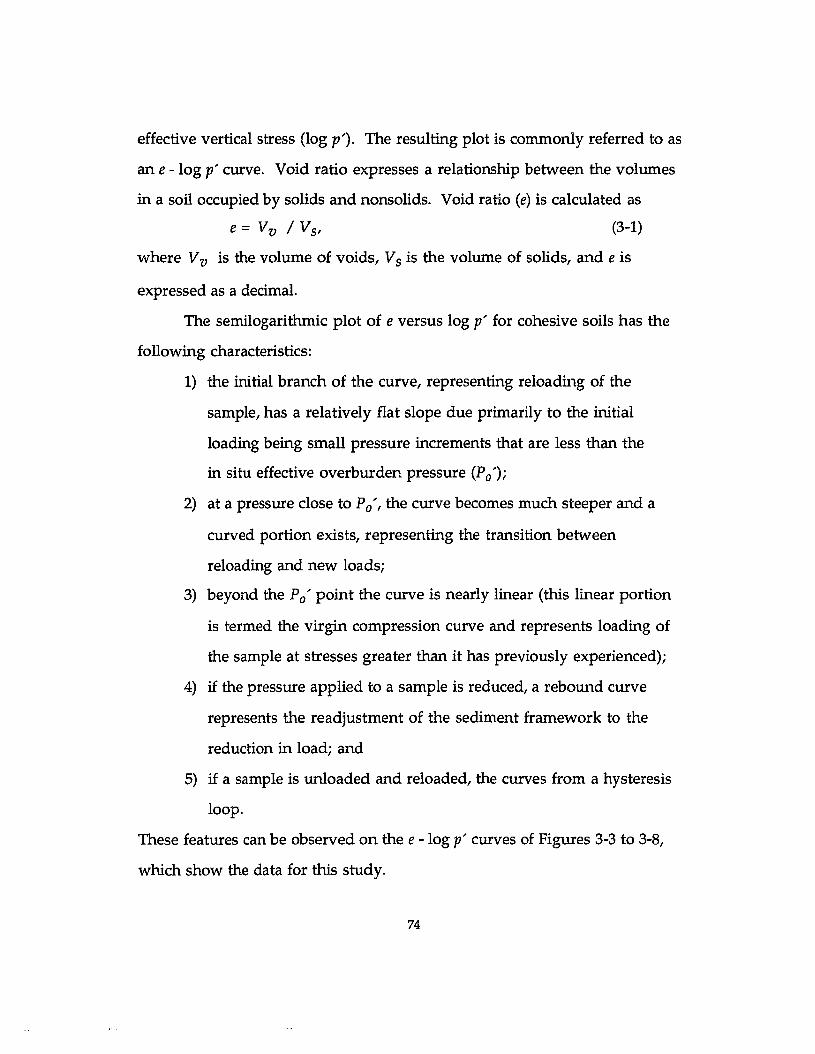
effective vertical stress (log p'). The resulting plot is commonly referred to as
an e -log p' curve. Void ratio expresses a relationship between the volumes
in a soil occupied by solids and nonsolids. Void ratio (e) is calculated as
e = Vv / V s, (3-1)
where Vv is the volume of voids, Vs is the volume of solids, and e is
expressed as a decimal.
The semilogarithmic plot of e versus log p: for cohesive soils has the
following characteristics:
1) the initial branch of the curve, representing reloading of the
sample, has a relatively flat slope due primarily to the initial
loading being small pressure increments that are less than the
in situ effective overburden pressure (Po');
2) at a pressure close to Po', the curve becomes much steeper and a
curved portion exists, representing the transition between
reloading and new loads;
3) beyond the Po' point the curve is nearly linear (this linear portion
is termed the virgin compression curve and represents loading of
the sample at stresses greater than it has previously experienced);
4) if the pressure applied to a sample is reduced, a rebound curve
represents the readjustment of the sediment framework to the
reduction in load; and
5) if a sample is unloaded and reloaded, the curves from a hysteresis
loop.
These features can be observed on the e -log p' curves of Figures 3-3 to 3-8,
which show the data for this study.
74
Two parameters derived from the shape of the e - log p' curve are the
compression index (Cc) and the expansion index (Ce). Cc is the slope of the
virgin compression portion of the e - log p' curve and is calculated as
c, =!1e I log (P2IPI), (3-2)
where PI and P2 are any pressures on the straight-line portion of the virgin
compression curve and !1e is the void ratio difference corresponding to
pressures pz and P2. Ce is calculated in a similar fashion as the slope of a
straight line approximation of the rebound portion of the e -log p' curve.
The e - log p' curve can also be used to estimate the sample's
preconsolidation pressure (the greatest load to which a sediment has been
subjected; abbreviated Pc'). This parameter is defined by Taylor (1948) as the
"maximum past pressure" and represents the degree of consolidation which
the sample has undergone in the sediment column. A graphical method,
derived by Casagrande (1936), is often used to determine Pc'. In soil
mechanics terminology, a deposit is said to be normally consolidated if the
effective overburden pressure (Po') is equal to Pc'. Po' is the buoyant weight
of the overlying sediment, or the weight of the overlying sediment minus
the weight of the pore water. The effective overburden pressure of a
sediment at a depth z can be calculated as Po' = Y z, where y is the effective
unit weight of the sediment.
The ratio of Pc' to Po' is termed the overconsolidation ratio (OCR).
Generally, an OCR greater than one (Pc'> Po') indicates an overconsolidated
soil, i.e., the soil has been subjected to an effective pressure greater than the
present overburden pressure. An OCR of 1 (Pc' =Po') is considered to
75
indicate a normally consolidated soil, and an OCR less than one (Pc' < Po~)
indicates underconsolidation.
The shape of the e -log p' curve is strongly influenced by the amount
of disturbance that occurred during sampling, preservation, storage, and
specimen preparation, and also by the soil type. Increasing the degree of
disturbance flattens the curves considerably. Sandy or coarse-grained
sediments also result in a more rounded curve, with a more gradual
transition from reload to virgin loads, as found by several studies for several
types of coarse-grained sediments (e.g., Nacci et al., 1974; Demars, 1982; and
Marsters, 1986).
Schmertmann (1955) found that the laboratory virgin compression
line may be expected to intersect the in situ virgin compression line at a void
ratio of approximately 0.42% of eo (in situ void ratio). Schmertmann
suggested a method for the reconstruction of the in situ consolidation line
which would eliminate the effects of disturbance on the slope of the virgin
compression curve. Cc can then be calculated as the slope of this corrected
curve.
Procedures
Consolidation Tests
We performed consolidation tests on nineteen samples from the
Ontong Java Plateau. Samples were obtained as whole-round sections of core
from oozes at all five sites drilled. Samples 10 em in length, still encased in
core liners, were sealed with several layers of beeswax to prevent desiccation.
The wax-encased samples were kept in a refrigerator on the ship, and
76
submerged in water in a refrigerator in the shore-based laboratory after being
hand-carried from the ship.
We cut and trimmed each sample just before placing it in the
consolidation cell, to minimize moisture loss. A 6.2-cm inside diameter, 4
cm high thin-walled ring with a sharpened cutting edge was pushed carefully
into the sediment sample encased by the liner. The sediment and embedded
ring were extruded from the liner, and the ends of the sample trimmed to a
smooth surface. We further trimmed the sample to approximately 2 em in
height, and then transferred it to the consolidation ring between two water
saturated porous stones. The inside wall of the consolidation ring was
polished stainless steel, minimizing friction between the wall and sample.
Sample trimmings were used to measure water content of the sample.
Calculation of an initial void ratio (ej) was made using the water content
data measured from trimmings and the known volume and weight data of
the actual sample.
Head (1986) discusses the general techniques of laboratory
consolidation testing. Specific procedures undertaken in our consolidation
tests are described as follows. The tests were performed in back-pressured
consolidometers. The decrease in hydrostatic pressure as a sediment core is
brought to the sea surface may result in dissolved gases being released as
bubbles in the pore water. These bubbles are extremely compressible
compared to the relatively incompressible pore water and sediment grains,
and can thus severely influence the consolidation test data. Such bubbles can
also reduce the effective permeability of the sample. Compressed air was
used to apply back pressure simultaneously to the saturating fluid and
77
sample. While such pressures cannot duplicate in situ pressures for high
hydrostatic environments, e.g., for the Ontong Java Plateau, they are
sufficient to drive the gasses back into solution. We applied back pressure to
the samples at the rate of 10 kPa per half hour and then allowed a 24-hour
period at the final back pressure for the sample to reach pore-water
equilibrium prior to beginning the test.
Each load sequence doubled the previous load, such that load
increments were 4, 8, 16, 32, 64, 128, 256,512, 1024,2048, and 4096 kPa (the
maximum load provided by the equipment). Drainage was allowed from
both the top and bottom of the sample. Transducers, attached to the top
loading platten, transmitted sample height data to a data logger and
computer, where a file of time elapsed and sample height was created for
each load increment. The computer also provided continuous plots of
square root of time versus sample height so that the end of primary
consolidation could be estimated as the data were being collected. When the
end of primary consolidation was judged to have been reached, we applied
the next load increment. When the load and unload increments were
completed, we carefully removed the samples from the cells. Index
properties were measured on the consolidation sample to provide end-of-test
data for calculation of final void ratio.
Sample height versus square root elapsed time data were used to
determine the height (H100) corresponding to 100% primary consolidation,
using the method of Taylor (1948). From this H100 value, void ratio is
calculated as
(3-3)
78
where ei is the initial void ratio and H; is the height of solids. Hs is
calculated as
n, = WJGsApw, (3-4)
where Ws is the weight of solids (corrected for salt), Gs is the specific gravity
of solids, A is the cross-sectional area of the sample, and Pw is the density of
water. Void ratio versus log effective vertical stress (applied load minus back
pressure) was plotted, and the Casagrande (1936) construction was used to
determine the effective preconsolidation pressure, Pc'.
Other Analyses
We used trimmings from the consolidation samples to perform grain
size, microfossil counts, and scanning electron microscope (SEM) analyses.
SEM samples were oriented in marked plastic cubes, sealed in wax, placed in
a plastic bag with a small piece of wet sponge, and refrigerated. Samples
selected for SEM analyses were embedded with low-viscosity resin using
several stages of embedding designed to preserve the structure of the
samples. However, it should be noted that the embedding procedure was not
successful for many of the samples, as the sediment disaggregated during the
embedding process. These samples could not be used for SEM analysis.
Hardened embedded samples were cut and polished, and examined using a
back-scatter electron detector.
Analysis of microfossil content and preservation was performed on
four consolidation samples. Dry samples were wet sieved through a screen
with 63-llm openings and the resultant coarse and fine fractions examined
separately. The dry sand fraction was split by microsplitter to about 1/128 to
79
1/256 of the original amount and the particles, which numbered about 1000,
were identified and counted. In the analysis of the coarse fraction,
microfossils greater than 50% complete were counted as whole specimens.
Light microscope slides were prepared for the study of the silt and clay
fraction. Estimates of the percent frequency of the components of the fine
fraction were made from scanning most of the slide at 600 magnification.
Further details of the procedures for these analyses are given in Chapter 2.
SEM, grain size, and microfossil count data from the above-described
analysis were augmented by smear slide data from the core descriptions
(Kroenke et al., 1991) where appropriate. Due to the high frequency of small
scale fluctuations in sediment properties (observed in grain size, carbonate
content, porosity, velocity, and other downhole data), we only used smear
slide data in cases where the smear slide depth and the consolidation sample
depth were within 10 em of each other. Laboratory methods for the
shipboard determination of carbonate and smear slide data are found in
Shipboard Scientific Party (1991b).
Results
e -log p: data for the 19 consolidation tests are presented in Figures 3-3
through 3-7; the data are organized by site (Site 803 through 807). Sample and
consolidation test data, including sample depths, effective overburden
pressures (Po'), effective preconsolidation pressures (Pc'), overconsolidation
ratios (OCR), compression indices (Cc), and expansion indices (Ce), are
summarized in Table 2-1.
80
The shape of the e -log p' curve is strongly influenced by the amount
of disturbance that occurred during sampling, preservation, storage, and
specimen preparation, and also by the soil type. Increasing the degree of
disturbance flattens the curves considerably. In addition, sandy or coarse
grained sediments results in a more rounded curve, with a more gradual
change in slope between the reloading and virgin compression portions of
the curve. In these cases, a specific point of maximum curvature could not
be defined, and a minimum and maximum value were selected, resulting in
a range for Pc' for the sample. The method suggested by Schmertmann (1955)
was used to obtain an undisturbed virgin compression curve, and Cc was
calculated as the slope of this corrected curve.
Testing problems have limited the data available from some of the
tests, as described below. Testing errors resulted in no data for pressures less
than 100 kPa for samples 2 and 12. Because of the effect on the slope of the
virgin compression curve and the inability to estimate Pc' from the two e
log p , plots, neither Pc' nor Cc data are reported for these two tests. A
malfunction of the DCDT used in collection of height data occurred for the
first several load increments of Test 3, so that only two values were obtained
on the virgin compression line. The unload portion of these three tests,
however, are discussed later in this chapter, and are also used for calculation
of a rebound correction in Chapter 4.
Sample 7 was obtained from XCB-cored sediment and consists of stiff
light reddish-brown ooze (Kroenke et al., 1991). We found it difficult to cut
and trim this sample, and some patching of the sample ends was required.
The sample was tested despite these difficulties because it was obviously
81
different from the other samples; however the e -log p' cu.rve must be
considered to be a "disturbed" curve. Much higher values for Cc and Ce
were measured for this sample than for any other. Since the effect of
disturbance is to flatten the slope of the virgin compression curve, the value
obtained for Cc can be considered to be a lower limit of the possibly higher
"undisturbed" value. The high value obtained indicates that this sample is
much more compressible than the others.
Our descriptive analyses of the samples indicated them to consist of
white calcareous ooze, ranging from soft for the near-surface samples to stiff
for the samples near 200 mbsf. Sample 7 is the exception; we observed it to be
a light reddish-brown stiff ooze throughout its length.
The results of microfossil analysis performed on consolidation
samples 10, 11, 12, and 15 are presented in Table 2-2. The percentages of
coarse and fine fractions for the four samples are presented in Table 2-2a.
The breakdown of coarse particles as a percentage of the number of coarse
particles is presented in Table 2-2b, and Table 2-2c shows the fine fraction
constituents as a percentage of the fine fraction.
SEM photos for consolidation samples 2, 6, 11, and 12 are presented as
Figure 3-8. Some damage to the sediment fabric in these SEM samples is
observed to have occurred during embedding of the samples with resin.
Discussion
Consolidation Test Data for Carbonates
In general, the consolidation test results from this study are consistent
with those of other researchers of carbonate sediments (Morelock and Bryant,
82
1971; Demars, 1982). The values of compression indices (Cc) for our samples
are in the range 0.4 to 0.7 (with the exception of sample 7, with a value of
1.14). Demars (1982) obtained Cc values in the range of 0.35 to 0.65 for
sediments with carbonate contents of 60% to 90% from the Eastern Atlantic, a
few hundred miles off the coast of North Africa. Morelock and Bryant (1971)
obtained values of Cc in the range of 0.45 to 0.6 for sediments with carbonate
contents of 80% to 85 % from the West Florida continental slope.
Expansion index (Ce) values are also similar to those measured by
other authors. This study obtained values of 0.01 to 0.06. Demars (1982)
obtained values ranging from 0.04 to 0.11 (for carbonate contents of 60% to
90%) and Morelock and Bryant (1971) obtained values from 0.02 to 0.07, for
sediments with carbonate contents of 80% to 85%.
Pc' and Stress History
The majority of the samples tested appear to be overconsolidated, i.e.,
Pc' is greater than Po'. The definition of "normally consolidated," however,
takes into consideration only mechanical loading of the sediments.
Hamilton (1964), Bryant et al. (1967), and Richards and Hamilton (1967)
suggest factors that cause unusual structural strength will result in apparent
overconsolidation. These factors include cementation of sediment grains,
influence of secondary compression, age of the deposit and slow rates of
deposition. Many authors (e.g., Morelock and Bryant, 1971; Kelly et al., 1974;
and Rezak, 1974) discuss the role of carbonate cementation and other
physico-chemical bonding as the cause of apparent overconsolidation in
carbonate sediments.
83
However, Nacci et al. (1974) believe that the variation in OCR with
carbonate content is misleading. They found that the general change in
shape of the curves that occurs as the carbonate content increases results in
changes in the estimated preconsolidation pressure (Pc'), which are less
related to stress history and aging effects than to changes in the compression
mechanisms.
We found no relationship between OCR and CaC03 content or
foraminifer content. It is possible that the difficulty in determining P/ for
these high carbonate sediments results in poor estimates of Pc' and,
subsequently, of OCR. If this is the case, Cc would also likely be affected. The
problem of determining appropriate Cc and Pc' for sediments with high
CaC03 content (and for other sediments that result in the observed e -Iog p'
curve) bears further study.
Shape of Consolidation Curves and Intraparticle Water
The presence of intraparticle water in calcareous sediments and the
possible effect on consolidation behavior has been discussed by Nacci et al.
(1974), Demars (1982), and Valent et al. (1982). Choquette and Pray (1970)
define intraparticle porosity as porosity within individual particles or grains.
Interparticle porosity is defined as the porosity between particles.
The effect of intraparticle porosity on the physical properties of
calcareous sediments is generally dependent on whether the intraparticle
water is released to the system through grain fracture and crushing. For
example, release of intraparticle water during consolidation test loading
would significantly alter the shape of the e -log p' curve (Demars, 1982).
84
Most studies have reported no significant crushing of whole microfossils
during consolidation tests of carbonate samples (Bhattacharyya and
Friedman, 1979; Demars, 1982; Valent et al., 1982; Lind, 1993). Bhattacharyya
and Friedman (1979) and Valent et al. (1982) suggested that the fine-grained
fraction carries the loads applied and protects the shells of foraminifers
against crushing. Both studies showed that a sediment sample containing a
greater percentage of intact foraminifers, Le., containing less percentage of
load-carrying matrix, exhibited more grain chipping, fracture, and crushing
during consolidation tests.
Evidence of grain crushing and release of intraparticle water that
would be expected in consolidation test curves would be virgin compression
curves that are concave upward and to the right. The release of intraparticle
water with grain breakage would temporarily but noticeably reduce the
strength of the sediment. Once the sample is compressed under increasing
loads, the resistance to deformation would increase and the curve would
become less steep (assuming, of course, that continuous release of
intraparticle water did not occur).
The consolidation test curves for our study do not show any
indication that breakage of foraminifer tests and release of intraparticle water
has occurred. Microfossil and SEM data provide estimates of the relative
percentages of intact foraminifers for some of our consolidation samples.
We see no difference in the general shape of the virgin compression portion
of the curve for sediments with lower or higher percentages of intact
foraminifers, indicating that these tests are not being broken at the pressures
used. SEM analysis of 4 samples taken from the consolidometers after testing
85
was completed also show no evidence of significant grain fracture or
crushing (Figure 3-8). This phenomenon is also observed for samples
obtained from much deeper in the sediment column (Lind, 1993). SEM
analysis of chalks, recovered from greater than 300 mbsf, show large numbers
of foraminifers still intact (Wilkens, 1991).
Correlations with Microfossil Content
As previously discussed, many authors have found correlations
between specific parameters and CaC03 content. This relationship between
sediment composition and consolidation characteristics is emphasized by the
behavior of Sample 7. The sample is described as a light reddish-brown ooze
and termed as a radiolarite by shipboard sedimentologists (Kroenke et al.,
1991). Shipboard smear slide analyses estimated the composition at this
depth (202 mbsf) as 30 to 40% radiolarians. Shipboard carbonate content
analyses indicated a minimum calcium carbonate content of 65-75% at this
depth. Sample 7 exhibits much higher compression and expansion indices
than any other sample; these properties are clearly related to the increased
siliceous fraction of this sample. Siliceous sediments have been shown to
exhibit high initial void ratios and compression indices greater than 2 (Lee et
al.,1990).
We have plotted compression index and expansion index versus
carbonate content in Figure 3-9. The data indicate that values for both
parameters decrease with increasing CaC03 content. This relationship
corresponds with that observed by other authors for sediments with a wide
range of carbonate contents (Morelock & Bryant, 1971; Demars, 1982;Silva
86
and Jordan, 1984; Rack et al., 1993). Compression indices have been shown to
be greater than 2 for siliceous sediments (Lee et al., 1990) and greater than 6
for clay sediments (Fukue et al., 1986;Crawford, 1986).
We also plotted compression index and expansion index versus
percentage of foraminifers (Figure 3-10). Although the compression index
data for which we have foraminifer counts are limited, a trend of decreasing
Cc with increasing foraminifer content can be discerned. More expansion
data are available, and the trend of decreasing Ce with increasing foraminifer
content is quite evident. This relationship between consolidation
parameters and microfossil content (or microfossil grain size) have been
observed in previous studies (Keller & Bennett, 1970; Hamilton, 1974; Lavoie
and Bryant, 1993). The observed relationships between consolidation
parameters and microfossil content are probably related to the volume of
compressible matrix. As previously discussed, evidence regarding grain
crushing indicates that the fine-grained fraction carries the applied loads. An
increase in the relative percentages of incompressible grains (e.g., intact
foraminifers or sand grains) would result in less compressible material and,
subsequently, lower c, and Ceo
Conclusions
Our study of the consolidation behavior and the relationship of
consolidation parameters to microfossil content for the high-carbonate
sediments from the Ontong Java Plateau has resulted in the following
conclusions:
87
1) In general, consolidation test parameters from this study, namely
compression and expansion indices, are consistent with those of
other researchers for sediments of similar carbonate contents;
2) The difficulty in determining accurate Pc' values for these granular
carbonate sediments precludes determining any relationships
between overconsolidation ratio and carbonate content or
microfossil content;
3) There were no effects of intraparticle water observed in the shape
of the consolidation curves, indicating that microfossil tests were
not broken and significant release of intraparticle water did not
occur during consolidation testing. This conclusion is supported by
the lack of foraminifer test crushing or breakage observed in the
SEM micrographs; and
4) Correlations between both compression and expansion indices and
carbonate and foraminifer contents were found. We found that
both parameters decrease with increasing carbonate content; this
relationship is linked to lower compressibility of a carbonate
sediment matrix relative to siliceous or clay sediments and is
consistent with the findings of other studies. The two
consolidation indices were also found to decrease with increasing
foraminifer content. This relationship is likely caused by a lower
relative volume of compressible matrix with increasing
percentages of relatively incompressible grains.
88
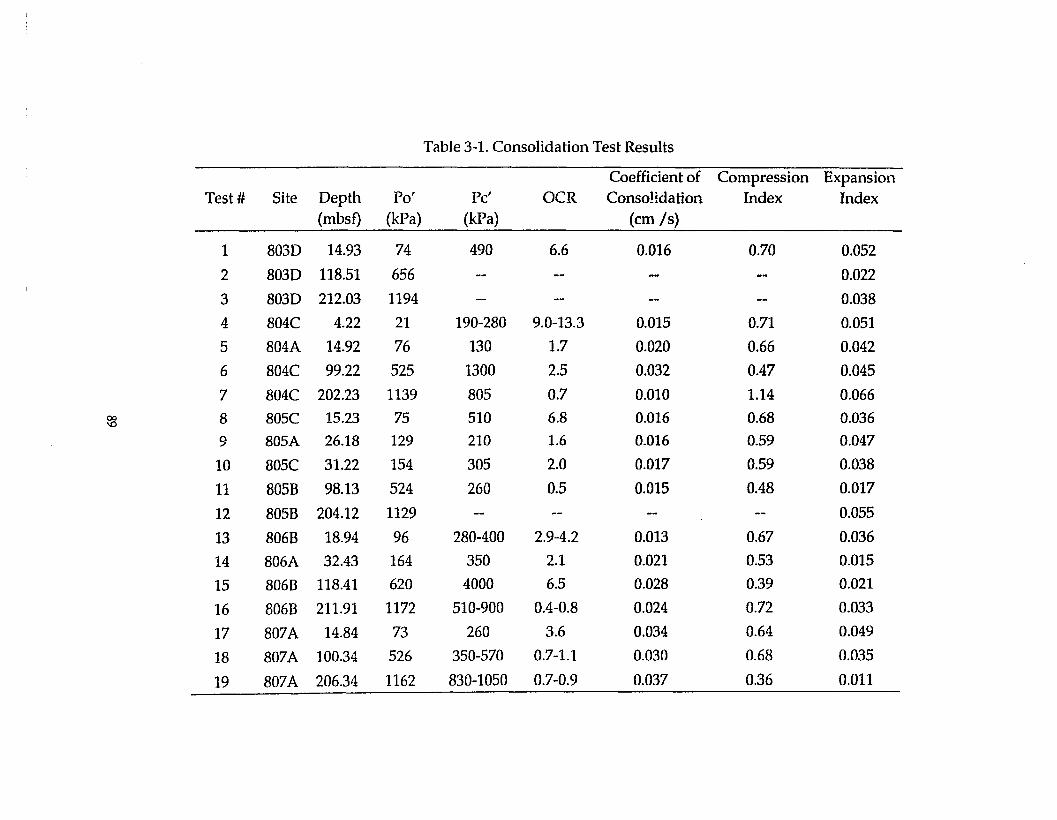
Table 3-1. Consolidation Test Results
Coefficient of Compression ExpansionTest # Site Depth Po' Pc' OCR Consolidation Index Index
(mbsf) (kPa) (kPa) (em Is)
1 803D 14.93 74 490 6.6 0.016 0.70 0.052
2 803D 118.51 656 -- -- -- -- 0.022
3 803D 212.03 1194 -- -- -- -- 0.038
4 804C 4.22 21 190-280 9.0-13.3 0.015 0.71 0.051
5 804A 14.92 76 130 1.7 0.020 0.66 0.042
6 804C 99.22 525 1300 2.5 0.032 0.47 0.045
7 804C 202.23 1139 805 0.7 0.010 1.14 0.06600 8 80SC 15.23 75 510 6.8 0.016 0.68 0.036\0
9 80SA 26.18 129 210 1.6 0.016 0.59 0.047
10 BOSC 31.22 154 305 2.0 0.017 0.59 0.038
11 805B 98.13 524 260 0.5 0.015 0.48 0.017
12 805B 204.12 1129 -- -- -- -- 0.055
13 806B 18.94 96 280-400 2.9-4.2 0.013 0.67 0.036
14 B06A 32.43 164 350 2.1 0.021 0.53 0.015
15 8068 118.41 620 4000 6.5 0.028 0.39 0.021
16 806B 211.91 1172 510-900 0.4-0.8 0.024 0.72 0.033
17 807A 14.84 73 260 3.6 0.034 0.64 0.049
18 807A 100.34 526 350-570 0.7-1.1 0.030 0.68 0.035
19 807A 206.34 1162 830-1050 0.7-0.9 0.037 0.36 0.011
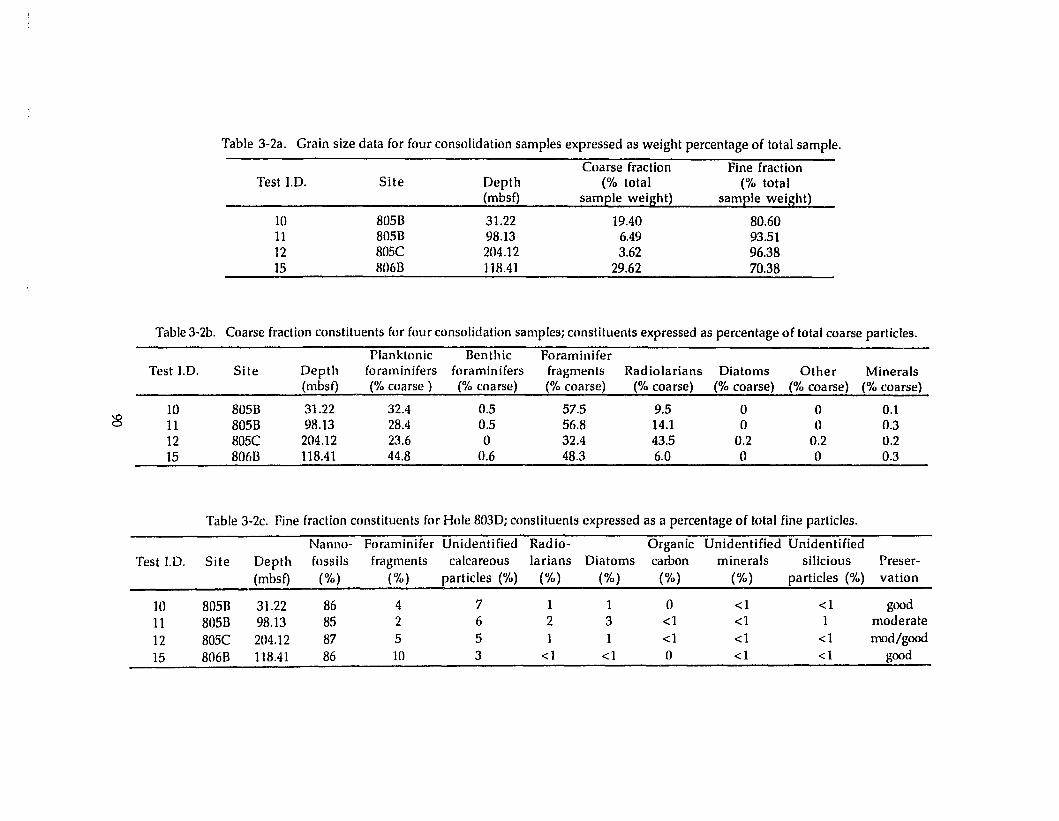
Depth(rnbsf)
SiteTest J.D.
Table 3-2a. Grain size data for four consolidation samples expressed as weight percentage of total sample.
Coarse fraction Fine fraction(% total (% total
samE!~eightL_ _~~mple weight)
10111215
805B805B80SC806B
31.2298.13204.12118.41
19.406.493.62
29.62
80.6093.5196.3870.38
Table 3-2b. Coarse fraction constituents for four consolidation samples; constituents expressed as percentage of total coarse particles.
Planktonic Benthic ForaminiferTest J.D. Site Depth foraminifers foraminifers fragments Radiolarians Diatoms Other Minerals
(mbsf) ('Yo coarse) (% coarse) (% coarse) (% coarse) (% coarse) (% coarse) (% coarse)
10 805B 31.22 32.4 0.5 57.5 9.5 0 0 0.1~ 11 805B 98.13 28.4 0.5 56.8 14.1 0 0 0.3
12 80SC 204.12 23.6 0 32.4 43.5 0.2 0.2 0.215 806B 118.41 44.8 0.6 48.3 6.0 0 0 0.3
Table 3-2c. Fine fraction constituents for Hole 803Djconstituents expressed as a percentage of total fine particles.
Nanno- Foraminifer Unidentified Radio- Organic Unidentified UnidentifiedTest J.D. Site Depth fossils fragments calcareous larians Diatoms carbon minerals silicious Preser-
(mbsf) (%) (%) particles (%) (%) (%) (%) (%) particles (%) vation
10 805B 31.22 86 4 7 1 1 0 <1 <1 good
11 805B 98.13 85 2 6 2 3 <1 <1 1 moderate
12 805C 204.12 87 5 5 1 1 <1 <1 <1 mod/good
15 806B 118.41 86 10 3 <1 <1 0 <1 <1 good
Figure 3-1. Calcium carbonate data for five site drilled during ODP Leg 130.
91
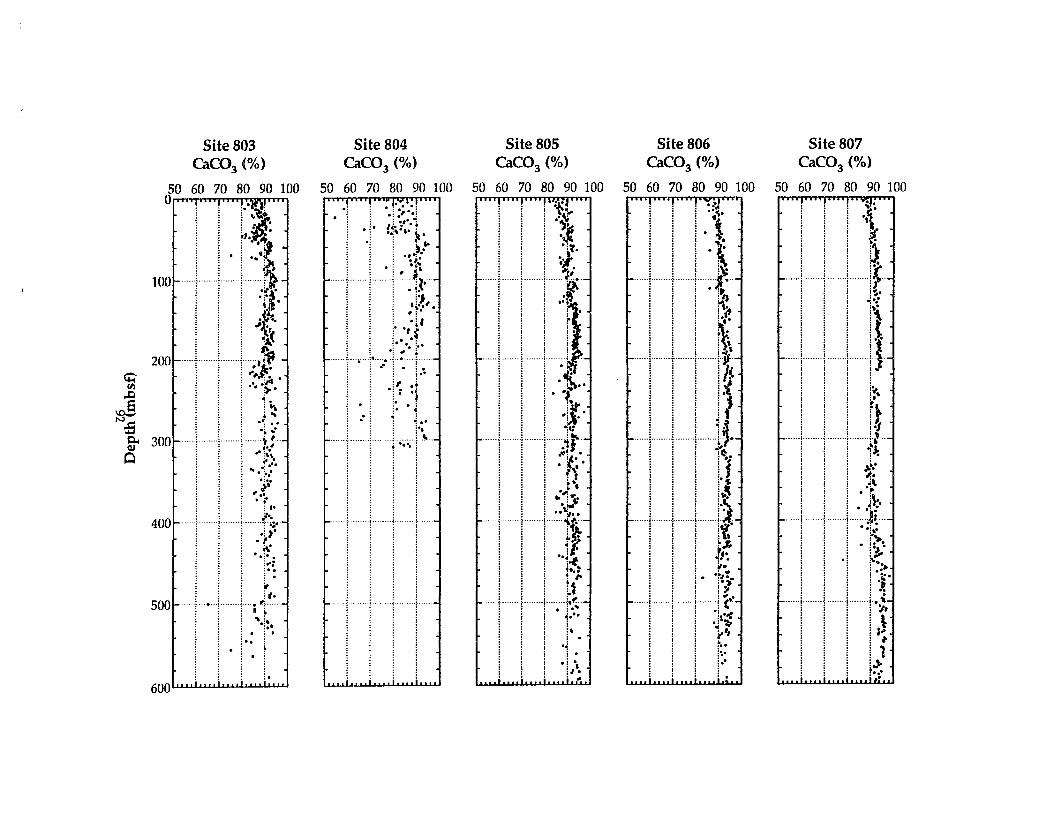
~VJ
,.0.sN..r::oW
g-o
Site 803csco, (%)
50 60 70 80 90 10001 ill I 'I ill! I I I.! I.m! ill Ii ! i·it~·: : : .
I i r· .j~ 1· 1-.'~
1001- .. ··~·· .... ·i·· ....·j ..····~·; : ; ·"1·i II¥! i i .~: 1 1 ~
2001-....·:· ..· .. \· ..·"j"?'~; : : ,."J;••l 1 j .'• •~.: : : ~ .: : : : "'.: : : ": : : .-; ..1 1 j .~ ..'
300~··· .j ! j..J.: : : : ..
400~····,·······!········I···.::r·: : : :..:: : : :' .: : : :.i ! ! ~
5001-··I··! ..·j"·i{''.1 1 1 "1:.: : :':': : :":: : 0: ~
j ~ l' ~: : : :.
.• 1 •••• 1 •••• 1
Site 804csco, (%)
50 60 70 80 90 100II Ii I , I iI I I " iU t.... I' I I • iI
.J.....··I· ..l~;t~a~~:
. .t·!
.' -,' ~'" ;
•• 0 ••• t. i, .:: 'i. .:
:' 1II
....~'l J..J~.! '., I
" ·11··
........ ;f'. .i
Site 805csco, (%)
50 60 70 80 90 100I" I.! I. iI!' "' "! "&~ "'iI
! ! i)~! i i ~l'. . .: : ! •: ; ; ·:t.
.J.....~,~~..-.:'~
.~-·11..: : :,.,
I I I ~~lt:.
1······j········I··~i; ; i I"
111>~! I l..t!~ l ~ ~•.iiii t~
. t J i ~~..-Iii 'VI I I ·f:I I I ·t:;
Site 806csco, (%)
50 60 70 80 90 100f'T'"'TT'"'T"'"' I 'I'V~I' i. i
iii ::~.: ; : c
t· . .· . .· . .! I !"l~· . .
·..·..i···· ..··i......··i· ..·~·f ..-:!J
~it~ ~ ~ S':.; : ; i~
...... j· ....···f·....···l· ..·..··j·1l-: : : : -'i
I I I I~': : : =1
······1······1········1·······~-i ! i l·t~ ! ! !~, , : :.!\.
. i l. ~ I.:.l-
I I I i~i ~ i 1;:
111';1l~ ~ ~ r~:! i ~ ~--
i i .L ... L:
Site 807csco, (%)
50 60 70 80 90 100I" " I' i , , IIi iii Ii Y:I: i.,
; : : ,.! ~ i -,\iii ';If
1111·iii !\{· . . .· . . .· . . .
Iflll-i I I ~,i i ! ! S.: : : :i
L.... ..l.~1 ~;..5!: ! -i ~..: I..l ..i.', .:~
I:~~~, ,,...i r-.j~ j .:l i'Ji i.• ·~i i "I,
. ..\i l .~
i i 1; ;.)-l t-.-...
Figure 3-2. Schematic showing the relative water depths of the five sites
drilled during ODP Leg 130 (taken from Kroenke et al., 1991).
93
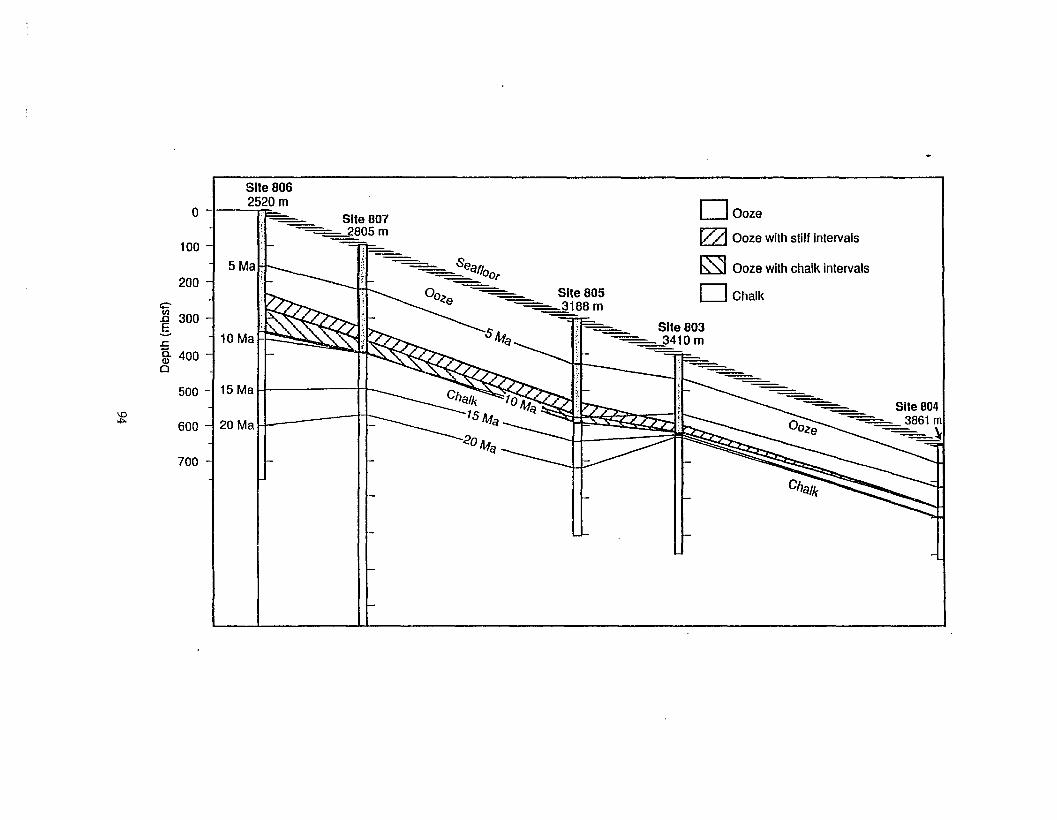
Site 8062520m
0
100
~ 5Ma200
e;:-
II 300E--- i 10 Ma.ca. 400Q)
0
500 ~ 15 Ma
\0~ 600 ~ 20 Ma
700
- Seq!I.-_OOr
OO<>e - Site 805- 318Bm
o Ooze
[Z2j Ooze with stilf intervals
I:sJ Ooze with chaik intervals
DChalk
- _ Site 804- 3861m
- ~
Figure 3-3. Void ratio versus effective vertical stress (e -log p~) for Samples
1, 2, and 3 from Site 803. The numbers in the legend are the
depth in meters below seafloor for each sample.
95
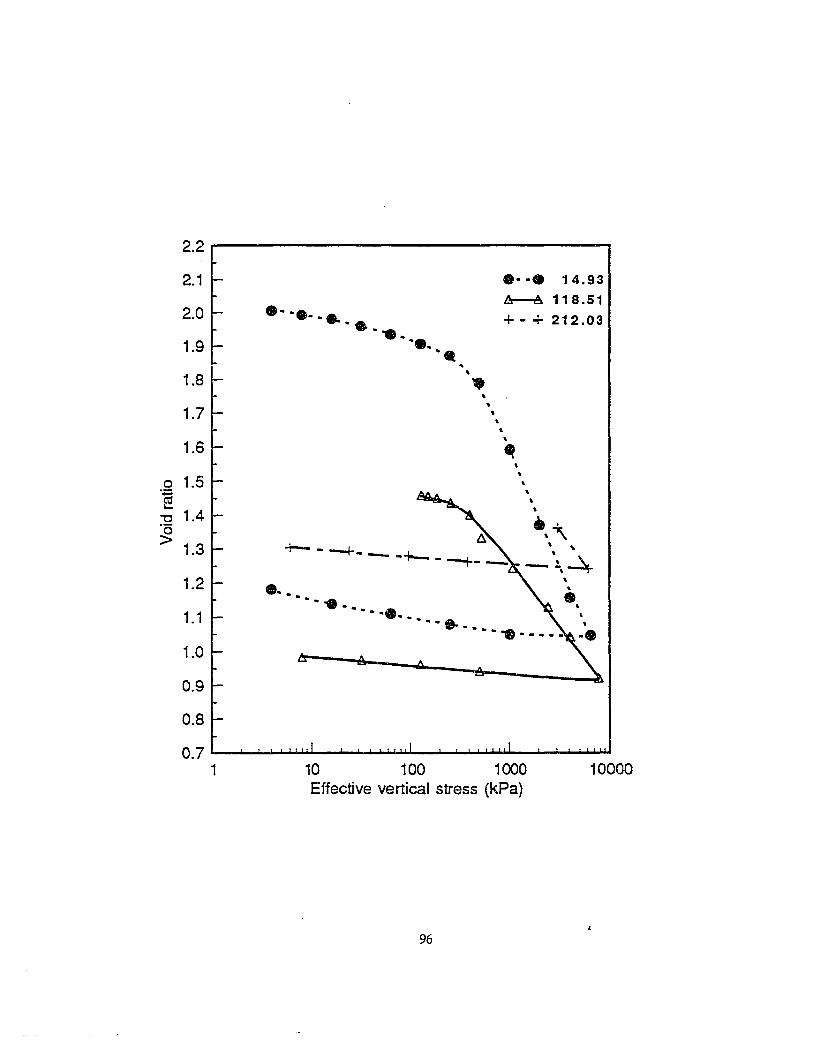
10000
e·.,
,,,•,,
e··. 14.93
~ 118.51
+ • .;- 212.03
,,•,,,
tt
.. ,..
10 100 1000Effective vertical stress (kPa)
e· . ........ ...
,8........ .,
...... -e. .. '......... \..... -e .. - • ... -e
2.2
2.1
2.0
1.9
1.8
1.7
1.6
0 1.5 .'';:;
~"'0 1.4'0> 1.3
1.2
1.1
1.0
0.9
0.8
0.71
96
Figure 3-4. Void ratio versus effective vertical stress (e -log p') for Samples
4,5,6, and 7 from Site 804. The numbers in the legend are the
depth in meters below seafloor for each sample.
97
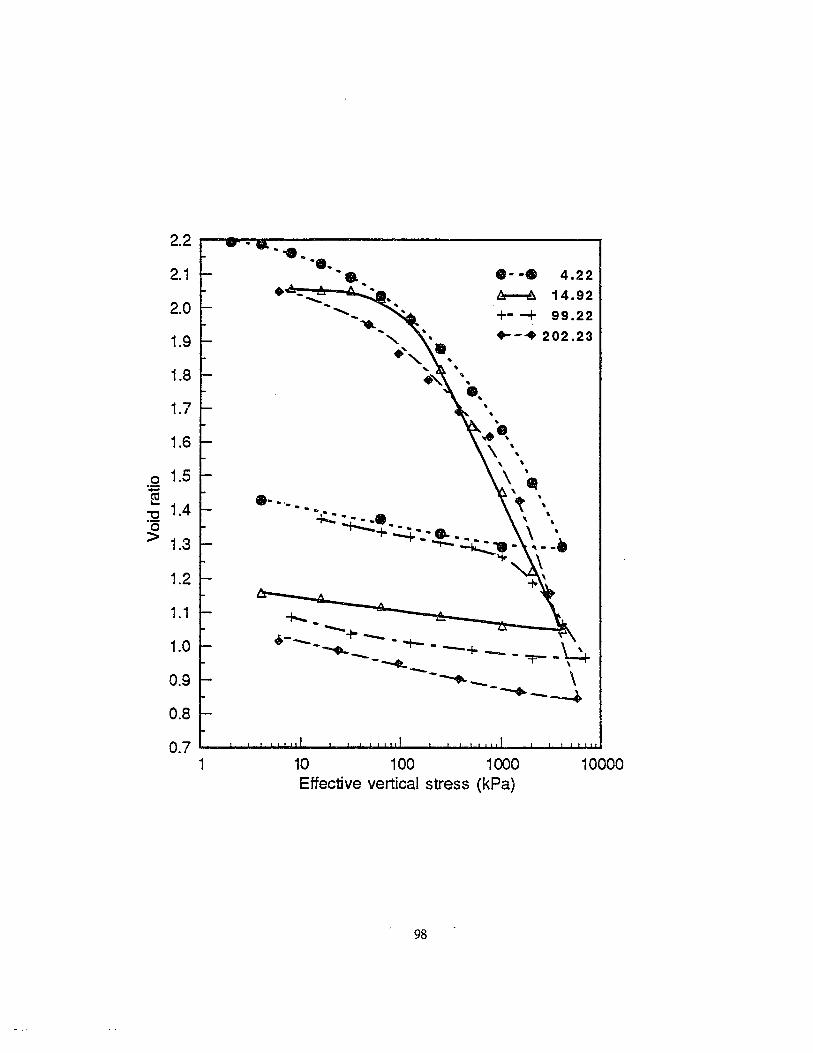
10000
e- -. 4.22~ 14.92
+- -+ 99.22
... - ... 202.23<,.... ." o.... o.
."" .. o.eO.
10 100 1000Effective vertical stress (kPa)
+- ..---.- ~- ..---.- ""i- .. -.,.. 4~- -----~ -. ,
----.- \---"'---..+
..... -tit.
' ..o.
o...,..~
\ ...., ..\ .., .
8, .', .... ...... \~ rr «; - ' '.""+-..:.,.. - • • .. .... \ ..
.......".- - .. -. 1..."-I-- ~l' .....
\,..'
2.2
2.1
2.0
1.9
1.8
1.7
1.6
0 1.5.+::
~1.4'"C
·0> 1.3
1.2
1.1
1.0
0.9
0.8
0.71
98
Figure 3-5. Void ratio versus effective vertical stress (e -log p') for Samples
8, 9, 10, 11, and 12 from Site 805. The numbers in the legend are
the depth in meters below seafloor for each sample.
99
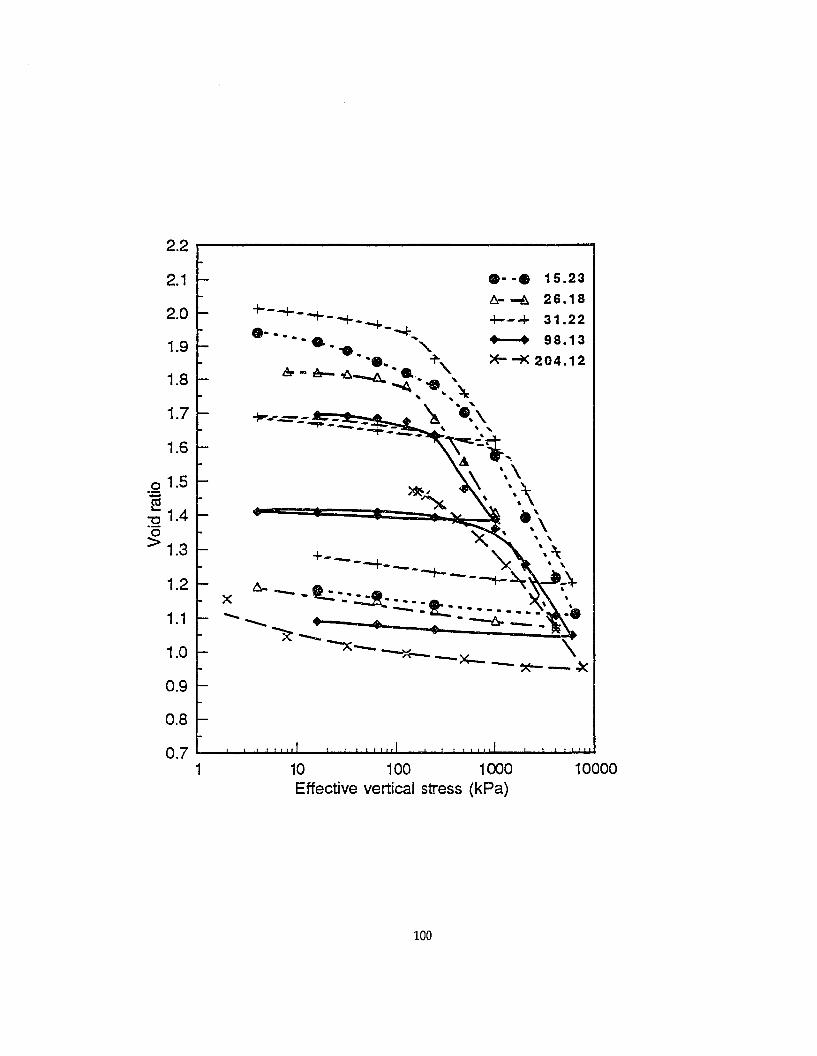
.- -. 15.231::.- ~ 26.18
-1--";" 31.22
...-.-. 98.13
*--K204.12
2.2
2.1
2.0
1.9
1.8
1.7
1.6
o 1.5.~
"'C 1.4'0> 1.3
100 100010 . I stress (kPa)Effective vertica
100

Figure 3-6. Void ratio versus effective vertical stress (e -log p') for Samples
13, 14, 15, and 16 from Site 806. The numbers in the legend are
the depth in meters below seafloor for each sample.
101
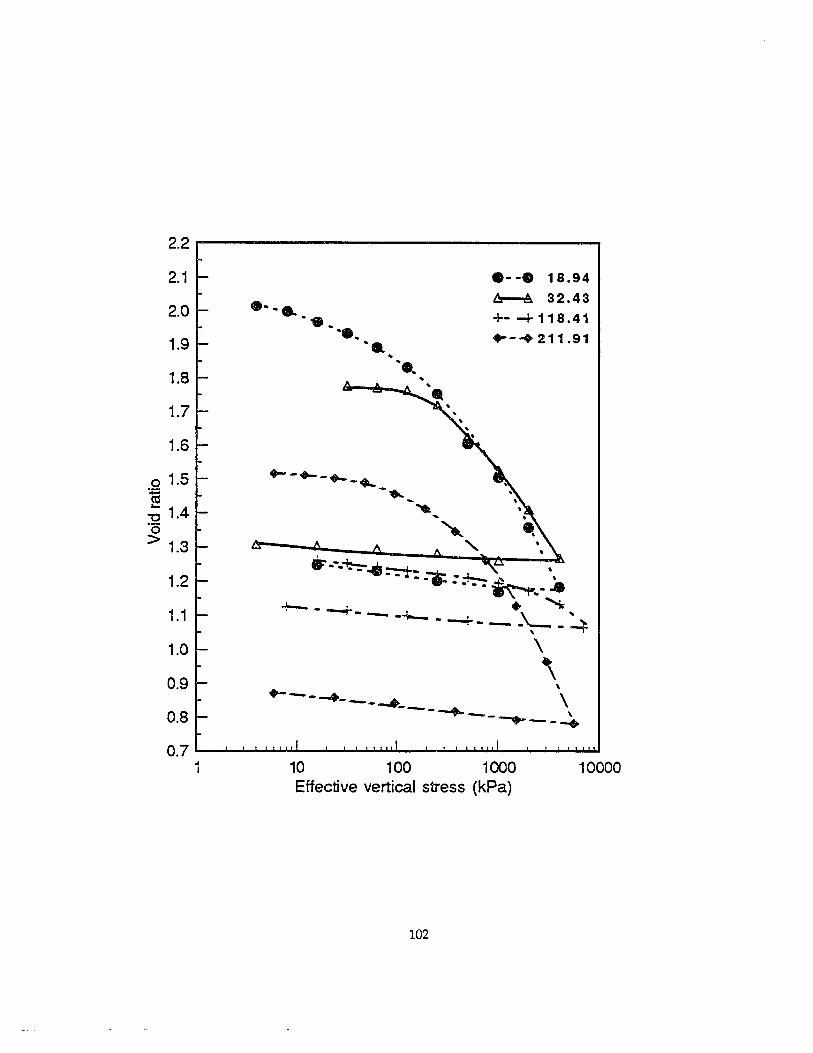
.·-e 18.94l!r---A 32.43
+- --+- 1 1 8 •4 1
'--"'211.91
.. -~ .l.~_ -2- _-+-- ~ ....................~..........
i ----1.. _ _ -L _4--!--- - ---1-- - - -r ,
' \
\ ,\ ,.---...._--......_---..._-.......-- ....
.... - .... -+-- ... - .....
-....-
....... ............ .. .....
1
2.2
2.1
2.0
1.9
1.8
1.7
1.6
1.2
1.1
1.0
0.9
0.8
0.7
o 1.5.~
~ 4-c 1.·0> 1.3
102
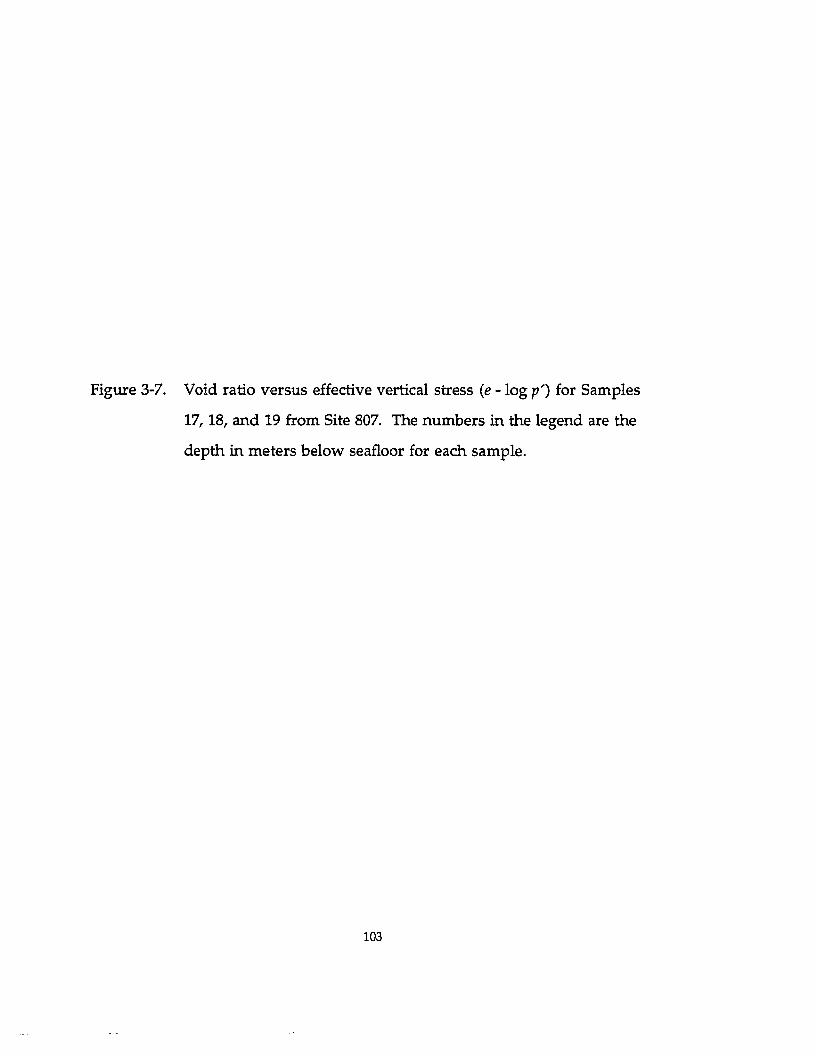
Figure 3-7. Void ratio versus effective vertical stress (e -log p') for Samples
17, 18, and 19 from Site 807. The numbers in the legend are the
depth in meters below seafloor for each sample.
103
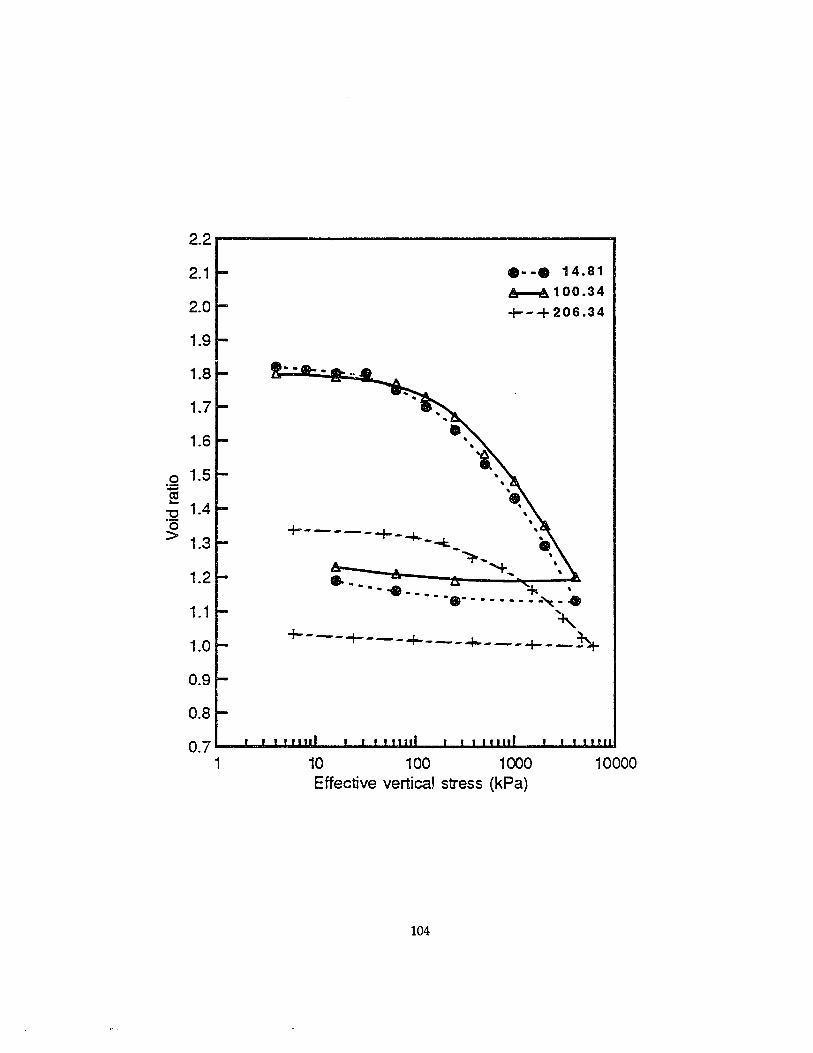
•••• 14.81
~100.34
+--+ 206.34
10 100 1000 10000Effective vertical stress (kPa)
.. • • • • .. =fot •••• - -•• - - - - • - - -""c. - •,
~---+ -I- ~--- ----I----+--..;::lt-
+-----+_-1......,...-~
-""::pt-
'""+- '
2.2 ..-------------------,
2.1
2.0
1.9
1.8
1.6
0 1.5.';:
e1.4"'C
·0> 1.3
1.2
1.1
1.0
0.9
0.8
0.71
104
Figure 3-8. SEM images of consolidation samples. Image A is the 99.22
mbsf sample from Hole 804C (consolidation test #6). Image B is
the 204.12 mbsf sample from Hole 80SB (consolidation test #12).
Image C is the 118.51 mbsf sample from Hole 803D
(consolidation test #2). Image D is the 98.13 mbsf sample from
Hole 80SB (consolidation test #11).
105
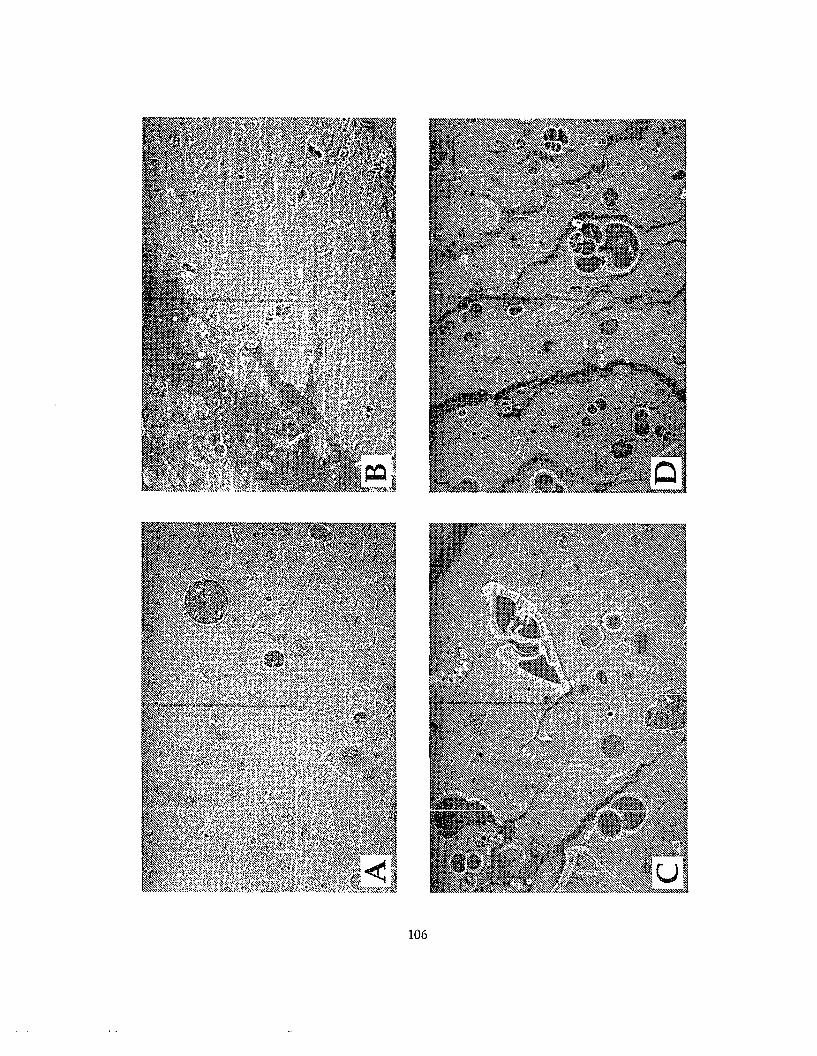
106

Figure 3-9. Compression index (Cc) and expansion index (Ce) versus
carbonate content.
107
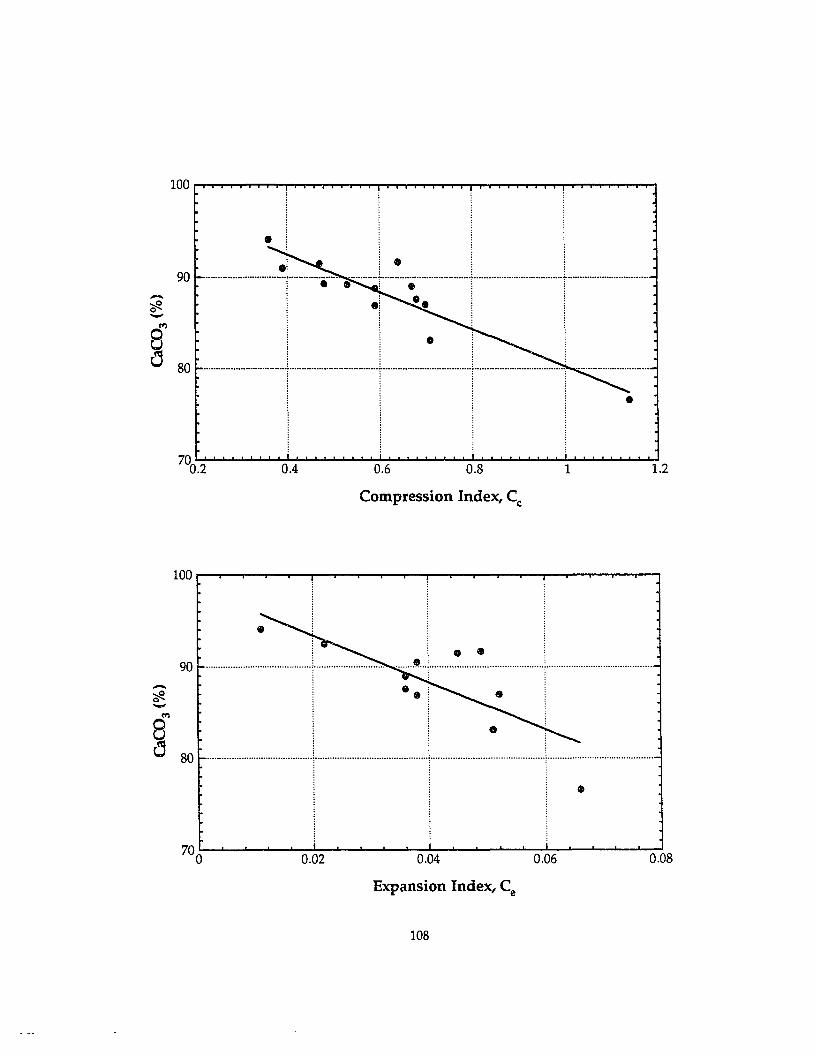
100 r-T'"T""T'" .,..,. ,......, ..-..-.-..-.-...-.- ..,...,...,...,. ........
•
-?fl.-~ i·. .90 -. ; .I · .---.---.--'-----.~--.---
00 ·----~r--~·-I---·---·!-··------- .0.4 0.6 0.8 1 1.2
Compression Index, Cc
100 r--............---,.-.....--r--.----,.-.....--r-...,...---,.-.....-......-.----,.-.....-......-.----,.--,
90-?fl...,8a 80
0.02 0.04
Expansion Index, Ce
108
0.06 0.08
Figure 3-10. Compression index (Cd and expansion index (Ce) versus
foraminifer content.
109
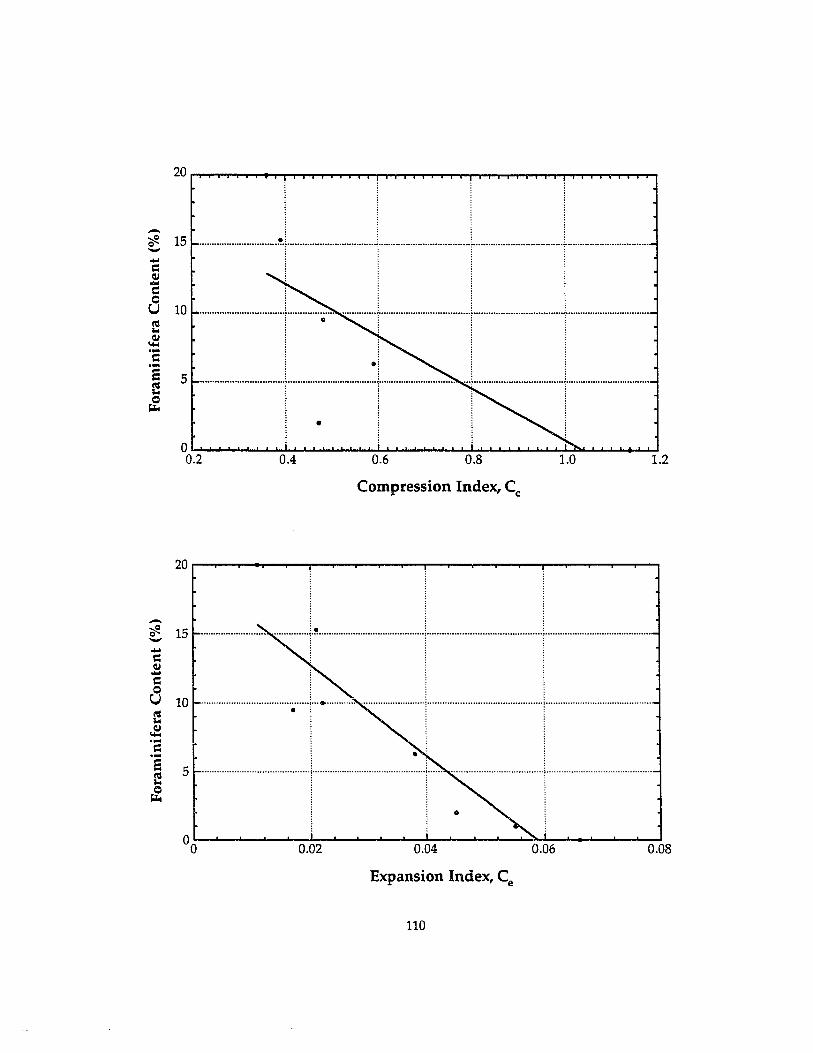
20 1"""""1"""I'"",..,........-.,."T""T..........,....,...,....,~~,..,...,r-T""r-T""I"""I'""....,.. .........,....,."T""T..........,....,~"'"T""'l,..,...,.-.-,...,...,
10 .
!' .5·_·-·_·-~----r--·--
O~......",.......",. ...L...l:I ~
0.2 0.4 0.6 0.8 1.2
Compression Index, Cc
0.080.040.02
·············T~······································· ; j •••••••••••••••••••••••••••••••••••••••••••
10 ; j ••••••••••• .. i·· ..·· · · ·········· ..·····
• , ! '.
: :5--:----r~-··················,····················---
-cfl. 15 .--c~-ceUlU...~'c'slU...
&::
Expansion Index, Ce
110
CHAPTER 4
POROSITY REBOUND OF ONTONG JAVA PLATEAU SEDIMENTS
Introduction
The essential problem in relating laboratory measurement of density
and porosity on samples from a borehole to in situ values is to determine or
estimate the increase in volume (rebound) resulting from the removal of the
sample from the pressures of the overlying sediments. Rebound of a
sediment occurs when the in situ overburden pressure is removed. The
correction of laboratory porosity data for rebound allows an approximation of
in situ porosities. In situ porosity (and in situ density) data are frequently
used to calculate sedimentation rates and for construction of synthetic
seismograms; therefore correction of shipboard porosity can be essential
where downhole logging data are missing or erroneous.
Hamilton (1976) presented a method, based on examining the
unloading curves of consolidation tests, for correcting laboratory porosity
data for rebound. Hamilton's (1976) carbonate model included all sediments
with a calcium carbonate content greater than 30%, and his generalized
downhole laboratory porosity profile is presented in Figure 4-1, along with
shipboard-measured porosities for site 806 from the Ontong Java Plateau
(Kroenke et al., 1991). The Ontong Java Plateau sediments, with calcium
carbonate contents generally near 90% (see Figure 3-1 in Chapter 3), exhibit
much different physical behavior.
Shipboard efforts to correct laboratory porosity data, using Hamilton's
rebound correction for carbonates, indicate that Hamilton's model is not
applicable to the Ontong Java Plateau sediments. Shipboard laboratory
111
porosity data and in situ porosity data (calculated from downhole density log
data) for Hole 803D are plotted in Figure 4-2. The laboratory porosity data
corrected using Hamilton's rebound model are also shown in Figure 4-2.
The Hamilton correction clearly overcompensates for the rebound of the
Ontong Java Plateau sediments. We have used rebound data from
consolidation tests performed on Ontong Java Plateau sediments to correct
shipboard laboratory data to approximate in-situ conditions.
Shipboard Procedures
The methods used to measure porosity in shipboard laboratory and
downhole logging programs are detailed in Kroenke, Berger, Janecek et al.
(1991). In general, we used one or two samples per 1.5-m section of core for
the laboratory determination of index properties. Wet samples were
weighed to ± a.01g using a motion-compensating balance and placed in an
oven at 1l0·C for 24 hr. Dry samples were removed from the oven, placed
in a desiccator, and also weighed to ± O.01g. Dry volumes were measured to
± 0.02 cm3 using a helium-displacement pycnometer. Porosity is the ratio of
the volume of voids to the total sample volume, expressed as a percentage.
Porosity (<I» was calculated from the downhole logging bulk density
data, using the equation:
(4-1)
where Pb = sediment bulk density, Pg = sediment grain density (2.72 g/cm3
assumed), and Pw =density of sea water (with in-situ temperature and
pressure effects accounted for).
112
Rebound Model from Consolidation Data
We have used the unload portions of the void ratio vs, log effective
stress (e-log p') curves from the 19 consolidation tests described in Chapter 3
to estimate the elastic rebound (increase in volume) that occurs when the
stress applied to the sample during the test is removed. The consolidation
tests were performed on samples from all five sites drilled during Leg 130,
and the sample data were presented in Table 3-1 of Chapter 3. The rebound
portion of an e-Iog p' curve results from the removal of pressure from the
sample. The assumption in utilizing these rebound data to correct laboratory
porosity to approximate in situ conditions is that the laboratory rebound of a
consolidation sample is analogous to removal of sediment samples from the
overburden pressures of a borehole. This assumption appears valid, because
several authors (Schmertmann, 1955; Hamilton, 1976) and this study
(Chapter 3) have noted that rebound curves for a particular sample are more
or less parallel regardless of sample disturbance or pressure from which
rebound started. Schmertmann (1955) discussed the probability that geologic
rebound (removal of overburden due to erosion), if similar plots could be
made, would also be parallel to laboratory test rebound.
It was assumed that the value of void ratio at atmospheric pressure is
insignificantly different from the value shown on the rebound curves of the
e-Iogp' plots at 1 kPa pressure. The rebound curve was extrapolated back to
1 kPa from the last unload increment (4 kPa for most tests); the curve
connecting the last several data points of the unload section is linear for
most of the tests (see e--Iog p' curves in Chapter 3). We then converted the
void ratio corresponding to the maximum stress applied during the
consolidation test and the void ratio at 1 kPa to fractional porosity values
113
using n =e / (1 + e). We calculated the porosity rebound as the difference in
these two values, expressed as a percentage. Porosity rebound from pressures
indicated to laboratory pressure for the 19 samples tested is shown in Figure
4-3. The regression equation is:
rebound =8.1E-04 P - 5.4E-08 p2, (4-2)
where P is pressure in kPa. The equation is constrained to zero rebound at
zero pressure.
Overburden pressure which causes sediments to decrease in volume
with increasing depth below seafloor is created only by the submerged weight
of the mineral grains. Overburden pressure is independent of depth of water
if free movement of water can take place so that water pressures in sediment
pore spaces can become hydrostatic. We calculated the effective unit weight
corresponding to the maximum stress for each test from the void ratio
obtained. We averaged this effective unit weight with a value of effective
unit weight calculated for the sediment at the top of the hole. We then
calculated the equivalent depth by dividing the maximum stress by this
average effective unit weight. Porosity rebound vs. equivalent depth is
presented in Figure 4-4. The regression equation is:
rebound = 5.4E-03 D - 2.5E-Q6 D2, (4-3)
where D is depth in meters below seafloor (mbsf),
The data indicate that the elastic rebound for these sediments is in the
1% to 4% range, for equivalent depths ranging from 200 to 1200 mbsf. These
values of porosity rebound are lower than those observed by Hamilton
(1976), who measured rebounds of 5% at an equivalent depth of 400 mbsf.
114
This difference in rebound behavior for the different sediment types gives
rise to the difficulty in using Hamilton's rebound correction equation for
Ontong Java Plateau sediments.
Examination of Figures 4-3 and 4-4 shows that Sample 7 appears to be a
higher-porosity outlier, exhibiting a rebound of 6%. This sample, from Hole
804C, was described as a light reddish-brown radiolarian ooze by shipboard
sedimentologists (Shipboard Scientific Party, 1991a). Shipboard smear slide
analyses estimate the composition at this depth as approximately 40%
radiolarians and approximately 60% nannofossils. The sample exhibits
considerably different consolidation and rebound characteristics than the
other samples at site 804 or other sites, as described in Chapter 3. Since the
major sediment type drilled during Leg 130 was white calcareous ooze, we
have omitted this sample from the calculation of a new curve fit (shown as
the heavier line in Figure 4-4) to provide the most reasonable rebound
correction for the majority of the Ontong Java Plateau sediments. The
equation then becomes
rebound =4.7E-Q3 D - 2.0E-Q6 D2. (4-4)
Correction of Shipboard Porosity Data
The correction of laboratory porosity data for rebound allows an
approximation of in situ porosities for zones where downhole logging data
are missing or erroneous. Downhole logging data are not available for all
sites or for at least the upper 100 m in logged holes. In Hole 803D, for
example, the downhole logging data are not useful above approximately 220
mbsf, due to a problem with the logging tool (Kroenke et al., 1991). The
115
laboratory and downhole log porosity data vs. depth below seafloor for Hole
803D were shown in Figure 4-2. There is a systemic difference between the
two data sets, characterized by higher laboratory porosities. This behavior
was observed for all sites and is attributed to the effects of removing the
laboratory samples from their in-situ positions. We have assumed downhole
logging data to approximate in-situ data, although there may be errors in the
downhole logging process and its interpretation.
Sediment rebound is a complicated phenomenon that we believe is
controlled by the contributions of two mechanisms. When a sediment
sample is removed from the total overburden stress state corresponding to
its in-situ position, an expansion of the sediment framework occurs due to
the decrease in the overburden stress state. The expansion that occurs during
retrieval of the core will depend on the sediment characteristics and the
length of the drainage path, and could be less than the maximum possible
expansion of the sediment. The second mechanism for porosity rebound is
pore fluid volume expansion caused by the release of hydrostatic pressure.
The expansion of the pore fluid is due to a change in seawater density and is
related in magnitude to the water depth (i.e., pressure) and the temperature
gradient. The increase of pore-water volume calculated for the water depths
for the sediments cored on the Ontong Java Plateau is in the range of 1% to
2%.
It is difficult to quantify how the two processes, namely (1) adjustment
of the sediment framework to the removal of overburden and (2) pore-water
expansion, contribute to the total porosity change. The response of the
sediment framework due to the removal of overburden pressure is
constrained to zero rebound at the seafloor. However, there is a small
116
increase in porosity of even the surface sediments upon removal from in
situ conditions because of the expansion of the pore fluids related to the
change in seawater density.
We believe that rebound may be controlled by different mechanisms
according to depth below seafloor. For sediments near the sediment/water
interface, porosity rebound is controlled by pore-water expansion, resulting
in 1% to 2% change in porosity, depending upon water depth. As depth
below seafloor increases, the effect of overburden on the sediment increases,
and the associated resulting elastic rebound when that overburden is
removed also increases. It is considered unnecessary that the porosity change
ascribed to each of these processes should be added to correct the laboratory
data. At least part of the pore fluid volume expansion is likely
accommodated by the elastic rebound due to the removal from overburden
that occurs concurrently. The pore fluid expansion from release of
hydrostatic pressure may also release residual effective stress maintained
within the sediment, resulting in a lowered tendency of the sediment
framework to expand along the rebound curve.
We emphasize that elastic rebound due to the removal of overburden
pressure is not solely the result of seawater density decrease and associated
pore fluid volume increase. The data for these carbonate oozes from
consolidation test results indicate that the elastic rebound with depth
(Figures 2 and 3) is up to 4% and close to the amount of pore-water
expansion caused by decrease in pore-water density. However, for other
sediment types, such as silicious sediments (Lee et al., 1990; Marsters and
Christian, 1990) and clays (Hamilton, 1976), the elastic rebound can reach up
to about 10% and far exceeds what could be accounted for by expansion of
117
pore waters. Expansion of pore waters is dependent upon water depth and
thermal gradient and is not influenced by sediment type or constituents. H
pore-water expansion were the only mechanism responsible for porosity
change in sediments upon removal from pressure, no variation in rebound
would occur with varying sediment type.
Corrected laboratory porosity data vs. depth for the upper 150 m of
Hole 8030 are presented in Figure 4-5. For clarity, we have used a solid line
to show the data corrected for rebound, using the porosity rebound vs. depth
relationship of Equation 4-4. The points are the data corrected only for
expansion of pore waters, using the methods detailed in Urmos et al. (1993).
Because measured laboratory porosities are greater than downhole log or in
situ values (Figure 4-2), the corrections involve a decrease in porosity. Near
the seafloor, the correction for seawater density is greater than that for
rebound, i.e., the correction for pore water expansion results in lower
porosities than the correction for rebound. With increasing overburden, the
correction for rebound increases until the two corrections merge (at a depth
between 100.7 and 123.2 mbsf for Hole 8030). Below this merge depth, the
correction for rebound becomes increasingly more significant with depth.
We have combined the two corrections into one by using the correction for
pore-water expansion in the upper sediments where it is more significant
than the rebound correction, and by using the rebound correction below the
midpoint of the depth range over which the two corrections merge.
Downhole log porosity and corrected laboratory porosity (corrected
using the rebound combination) vs. depth for the interval between 200 and
600 mbsf in Hole 803D are shown in Figure 4-6. The corrected laboratory data
provide a good fit to the downhole log data, with the exception of the depth
118
interval between 200 and 220 mbsf. Problems with the malfunction of the
downhole logging tool resulted in no data or erroneous downhole logging
data in the upper 220 m in this hole.
Similar downhole profiles of downhole log porosity and corrected
laboratory porosity for sediments from Hole 806B are shown in Figure 4-7.
Once again, the corrected laboratory data provide a good fit to the downhole
log data for depths greater than about 350 mbsf. Shipboard scientists (1991c)
reported the downhole logging data for the depth interval of 190 to 320 mbsf
to be unreliable.
As is evident from the above comparisons of downhole logging data
and corrected laboratory data, the rebound-corrected laboratory data can be
used in place of the downhole logging data when the logging data are
missing or erroneous. The combined seawater density/consolidation
rebound correction was used to correct shipboard porosities for use in
constructing synthetic seismograms (Mosher et al., 1993). A good match
between the synthetic seismograms and the field seismic record resulted
from the use of this correction.
Conclusions
The analyses of the consolidation behavior of calcareous sediments
from the Ontong Java Plateau have resulted in the following conclusions:
1. Rebound curves from consolidation tests on Ontong Java Plateau
samples yield porosity rebounds (resulting from release of effective
overburden stress) of 1% to 4% for these sediments (except one
radiolarian-rich sample) at equivalent depths of 200 to 1200 mbsf.
These values of rebound are significantly lower than those
119
reported for other sediment types, such as siliceous sediments and
clays, with reported rebounds up to about 10%.
2. A radiolarian-rich sample exhibits 6% rebound, which is consistent
with the higher porosity rebounds reported for siliceous sediments,
and illustrates the influence of sediment composition on porosity
rebound.
3. A rebound correction derived from the porosity rebound from
effective stress release has been combined with a correction for
pore-water volume expansion to correct the shipboard laboratory
porosity data to in-situ values. Comparison of the laboratory
porosity data corrected in this manner with the downhole log data
shows good agreement.
4. This rebound correction provides a more accurate correction for
Ontong Java Plateau sediments than Hamilton's (1976) carbonate
rebound correction, which is limited in its depth applicability and
includes sediments containing as little as 30% carbonate in the
model. Hamilton's correction is not applicable to Ontong Java
Plateau sediments, which generally contain 85% to 95% calcium
carbonate and exhibit markedly different rebound behavior. Based
on the observed variability in rebound for different sediments,
rebound corrections would be ideally performed only when
rebound data is available for a particular sediment type. However,
the rebound correction derived in this study for Ontong Java
Plateau sediments could likely be used for other high-carbonate
sediments.
120
Figure 4-1. Merged porosity (Holes 806B and 806C) vs. depth for Site 806
and generalized laboratory curve for calcareous sediments
(Hamilton, 1976), taken from Shipboard Scientific Party (1991c).
121
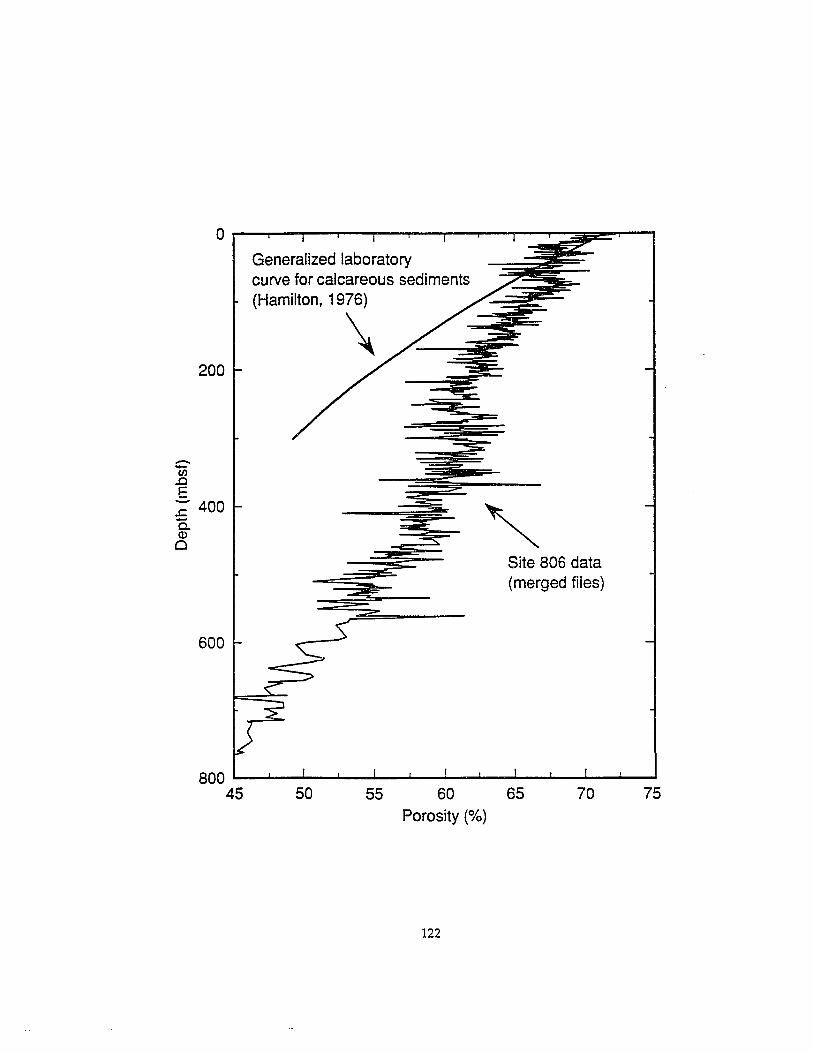
Generalized laboratorycurve for calcareous sediments(Hamilton, 1976)
\200
--en..0E- 400J::aCDo
600
Site 806 data(merged files)
757055 60 65Porosity (%)
50800 a......--'-_....-.----l_--J..._....I...----I._.....I.-_'"----'-_......----l_.....I
45
122
Figure 4-2. Hole 803D calculated downhole logging porosity (solid line) and
uncorrected shipboard laboratory porosity (dots). The shipboard
laboratory data corrected using Hamilton's model (crosses) are
also shown.
123
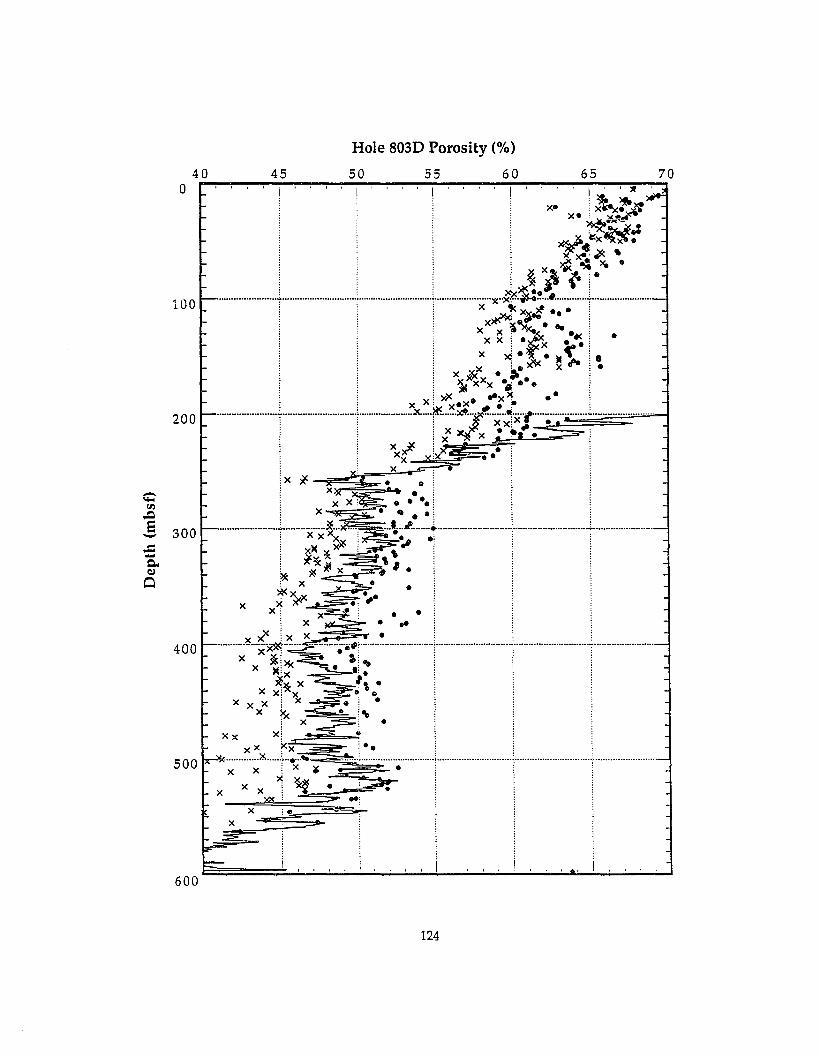
7065I I
Hole 803D Porosity (%)
50 55 6045. I . '":~ ~:X~~~
xo~~~~lx~Xa·.-~,;... ~ ,
i : i : ~_ ~t,~~~ •Ye e: : : : ~ jfr ,,- :
........................+ L \ ;( ~..~.~!...•.............+ .
! : x~:~x~••~• i: x x : .~:.: xX:· x·.:! x ~ •• lC~:.: : : X :.XI< xtl'e,.i : : x~ .~. :: : i 14 xxx e.. . ij i x! ><X • "xX •• :, : x: x~..~.· :........................1""" [ x, ~;..~x····~·~x"!~·..;··············~·· ..················_---: . x ~ : :i x~ ; !! xix ~ •
a40
200
300
100
.....ell..ce-
x•
400
500
x ;.x
600
124
Figure 4-3. Rebound in % porosity change from pressures indicated to
laboratory pressure for the 19 consolidation samples. The fit to
the data has the equation: rebound =8.1E-Q4 P - 5.4E-08p2,
where P is pressure in kPa.
125
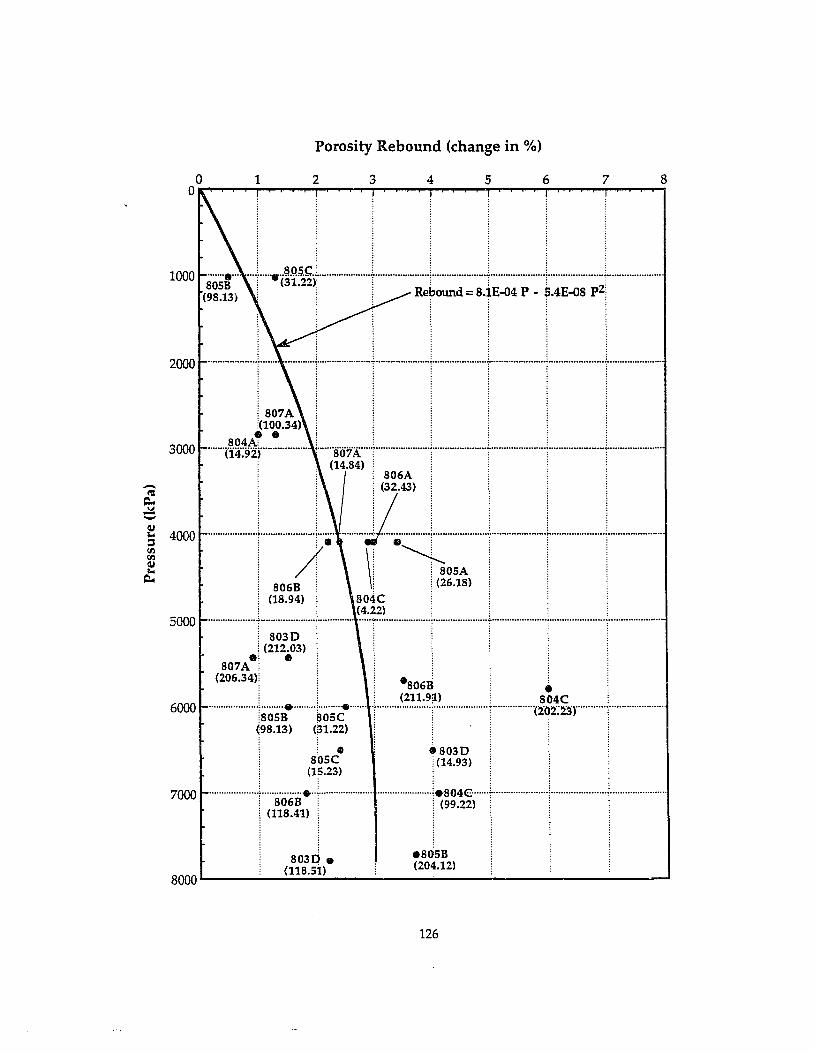
Porosity Rebound (change in %)
84321
: :
....L....•(~.~~~~ +.._ j + L. 1.. .
• •• ' Rebound e sr4P-5.'E~ ~!
.----- ....._- _·_·_--,·-····--r··_··_··r-···-·····__·····-······_···_·
: 807A:<100.34)• •804A "'"······"("14:92,..·················· ~ ······80'...:\····-;-···············..····;······················..·····················T·····················r···· .i . (14.84)i: ::i . : 806A : ::
I I . (;.43) : j:
__..L_.__.j..• _.....t.~--l--..L._ .._.._._.-A \: i 805A i : i
B06B ! ! !(26.18): : :(18.94): 804C : : : :
: (4.22) , :...................T ; ······· ·..·-;- : l.. ~ ; .
: 803D: (212.03)
0: •807A i ' ,
(206.34): • : :: S06B,..: i : (211.9~) i 804C :..·....········....·!805it··....··~O·5c..·....·· ·r·....·........·....···j....·........·..·....-r..··....··......(10Z;2jr..·····..T....··........·......(98.13) (31.22) :: :
: •• ~803D :805C :(14.93)
: (lr·23)
::::...................., ; ·· ·· ··..····;.S{)4€..·····-;-·······..·· ·· ·;···· · ; ..
: S06B : : (99.22) : : :
I(llS~:~o e est'(l1S.51) (204.12)
7000
6000
2000
1000
3000
-lU~~-~... 40000
<IJ<IJ~...=...
5000
126
Figure 4-4. Rebound in % porosity change versus depth (calculated from
pressures) for the 19 consolidation samples. The light solid line
is the fit to all 19 data points and has the equation: rebound =
5.4E-03 D - 2.5E-06 D2, where D is depth in meters. The heavy
line is the fit to the data excluding sample 7 and has the
equation: rebound = 4.1£-03 D - 2.0E-06 D2. Hamilton's (1976)
rebound curve for carbonates is also shown.
127
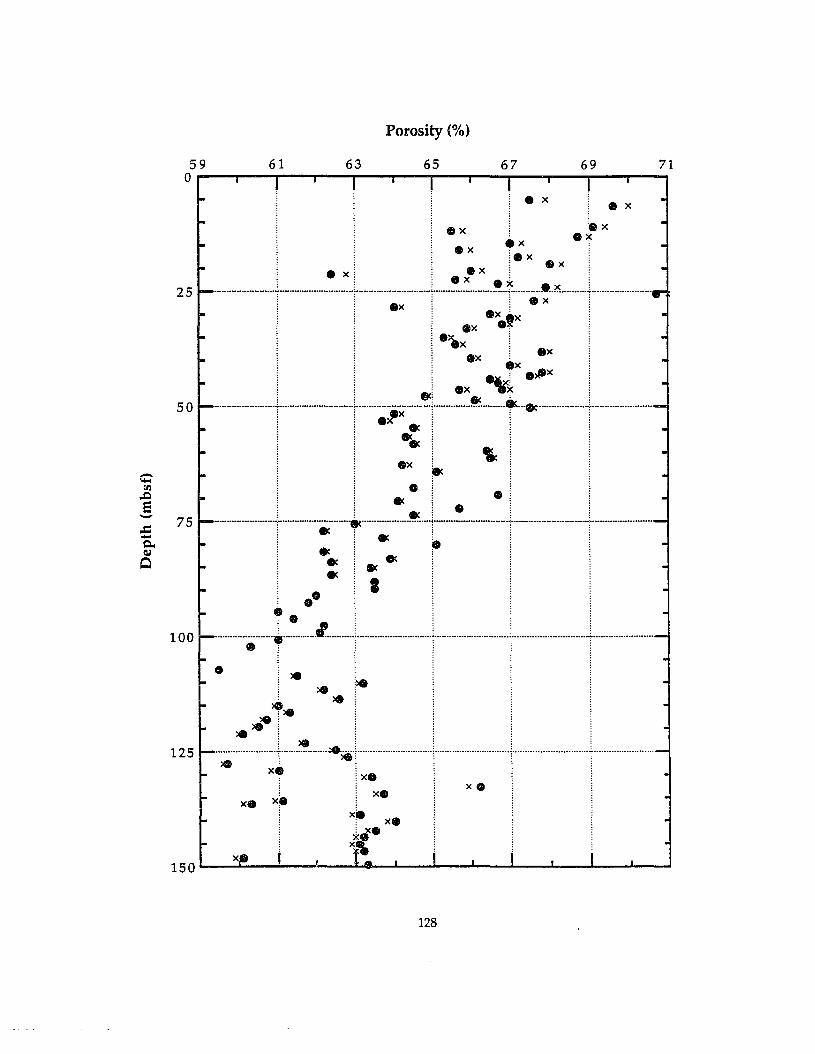
71
• x
ex
• x
ex. .>fIx
ox
e ex1tx
Ox
xC»
•ex
Porosity (%)
o
.-
xe
..~ r .-;;:"_:\_.:!_ l__'_xe . .. :::.: .·····················t························
•
150 __~_L_.r-_G ..1-_i.._.1-_l_...J..._-L_-L._J
125
100
.....en,.Q
e-
128
Figure 4-5. Hole 803D shipboard laboratory porosity data corrected for
rebound (solid line) and for seawater density (dots).
129
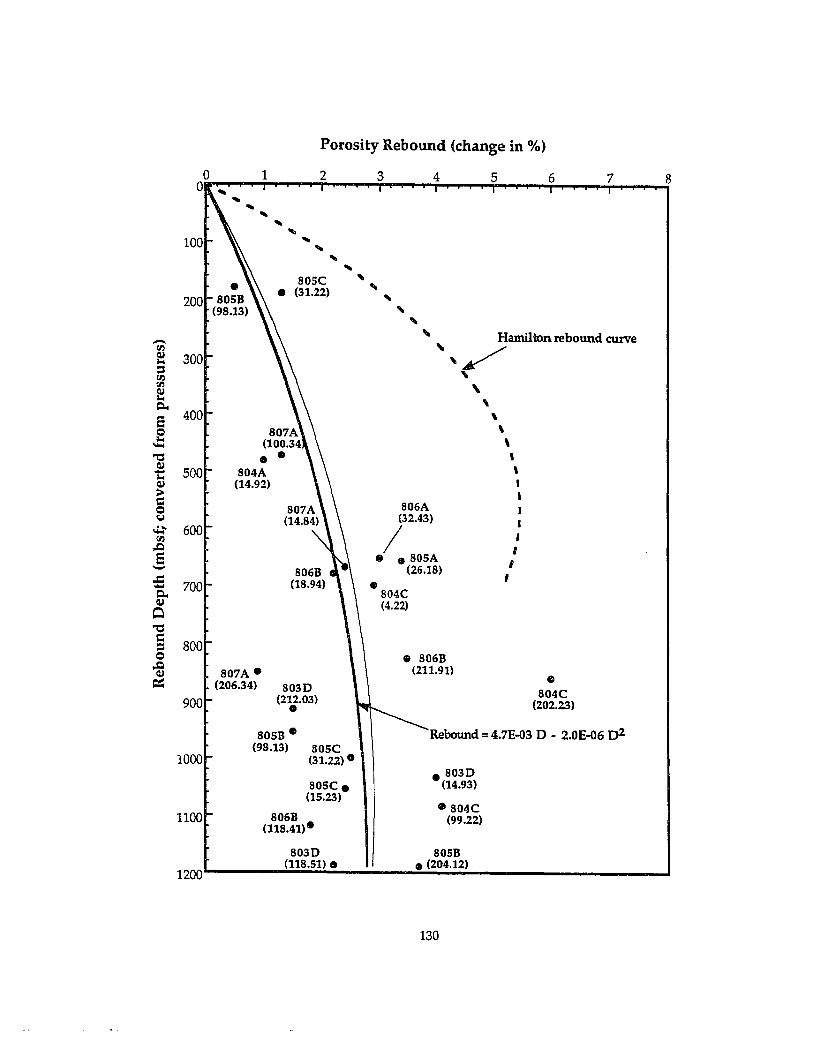
Porosity Rebound (change in %)
S03D- (14.93)
CI 804C(99.22)
Rebound = 4.7E-03 D - 2.0E-06 D2
805B• (204.12)
32
SOsC.(15.23)
806B(118.41)-
803D(118.51) •
1
80sB •(98.13) SOsC
(31.22) •1000
1100
... ... ... ... --.100 ... ... ... ...
" "200 " " " " Hamilton rebound curve- "tI)
... /~ 300:::l '\tI)tI)
\culo< ...Q.,
e 400 ...Q 807A \lo< (100.34 \.....
"0 • • \cu
500 804A \-lo<cu (14.92) I> IC S06A IQu (32.43) I~ 600 / ,
CI.l,.Q ,e • .80sA I- (26.18).c: ,- 700 •Q., S04Ccu (4.22)Q"0C
800:::lQ e 806B1l 807A •
(211.91)0c=:: (206.34) 8030 804C
900 (212.03) (202.23)fa
130
Figure 4-6. Hole 803D downhole log porosity (solid line) and shipboard
laboratory porosity corrected using combined rebound and
seawater-density correction (dots).
131
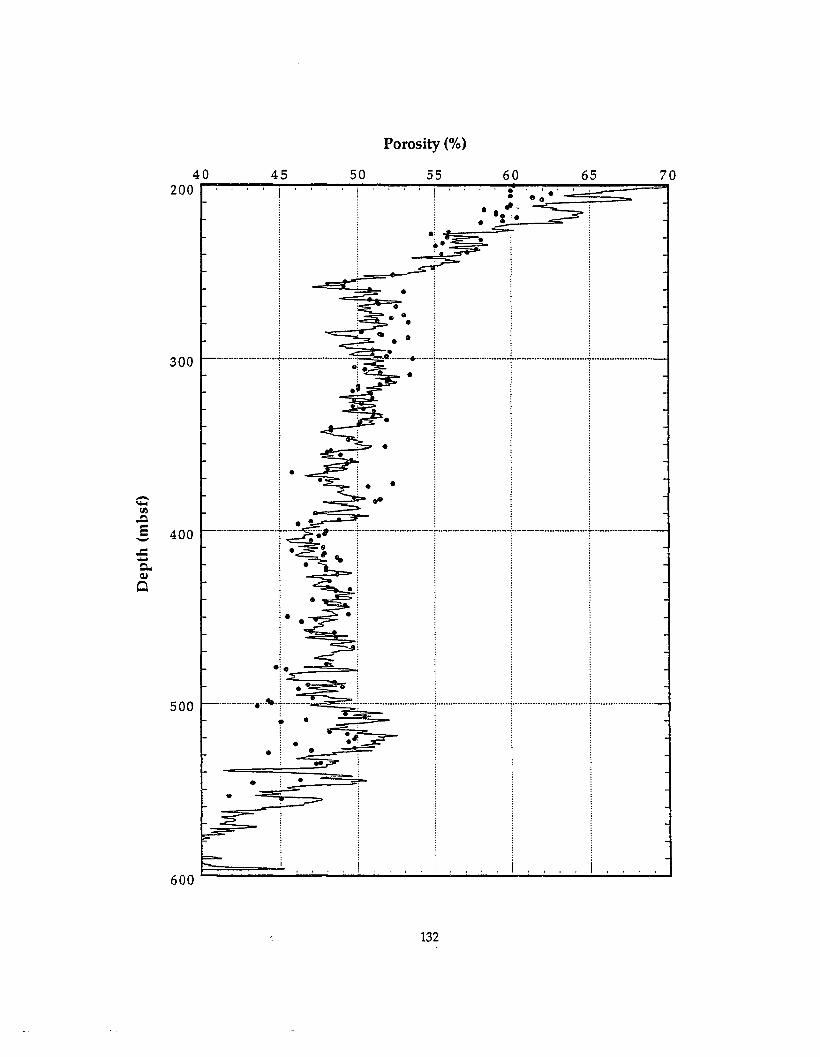
Porosity (%)
40 45 50 S5 60 6S 70200 I I ••
• ", .• IS :.
•
•
.......; ; _ .
"
.j ._====:=o~
··················~·t············
•r •'.~..~:-=:
500
300
400
.....~
~e-
•• •
600
132
Figure 4-7. Hole 806B downhole log porosity (solid line) and shipboard
laboratory porosity corrected using combined rebound and
seawater-density correction (dots).
133
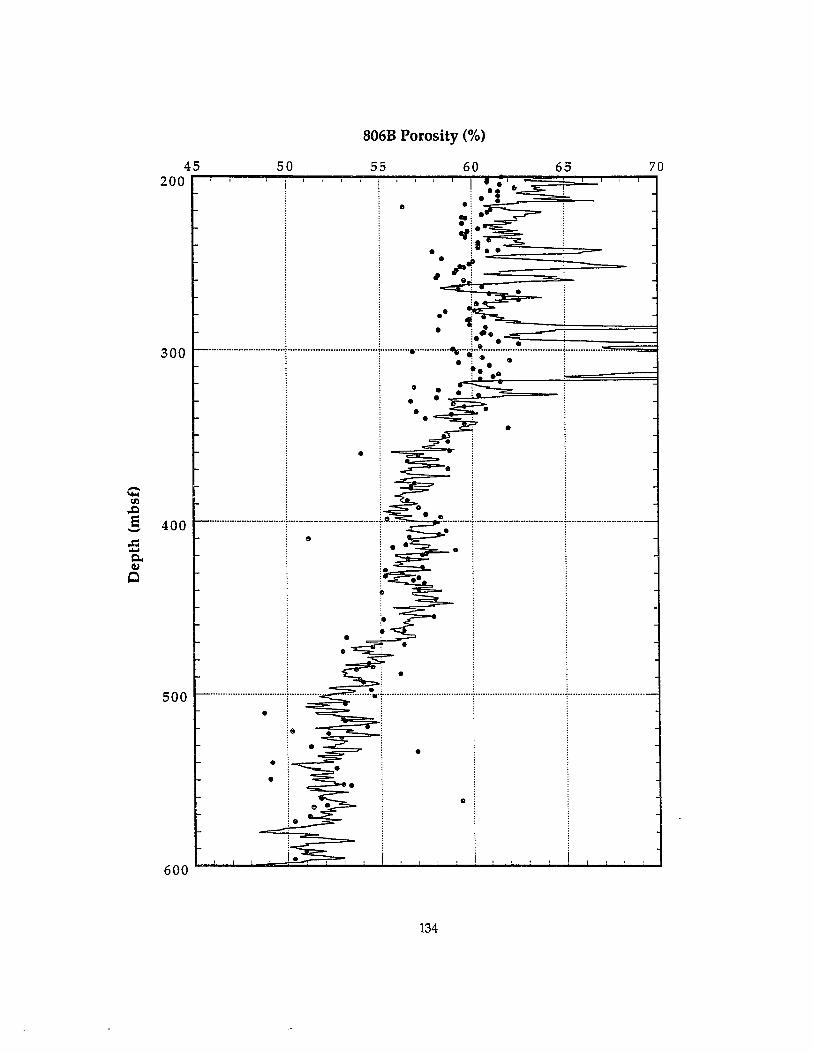
80GB Porosity (%)
45200
50 55
e
• e
60
•
65 70
•
•
e
•
c-..,...-.a,..._"!_-o-oo,------o-L-----
•
••
:.
-=---'=-:::.-; : ............................................... . '1" [ 1" ..
i • • ~~~~~~±~~~~::~~i i.·..~······························f······················· <•••••••••••••••••••••••••••~••i":.~~~ ~.·!···············T·················
Ii·: I
500
300
--tI)
,.Q
e 400-.t:: •..c..eu0
600•
134
CHAPTER 5
SUMMARY
This study has addressed several aspects of physical properties (e.g.,
porosity, velocity, acoustic impedance, compression index, expansion index,
and rebound) from the Ontong Java Plateau within the broad framework of
establishing relationships between physical properties and microfossil
content and preservation. The influence of microfossil content on physical
properties is evident.
For example, the study involving actual counts of microfossil
constituents (Chapter 2) indicated relationships between microfossil content
and interparticle porosity, velocity, and impedance. Several factors,
however, lead to problems in determining these relationships, including the
presence of varying amounts of intraparticle porosity and the influence of
incipient cementation on velocity. More accurate estimates of interparticle
porosity are needed, perhaps through analyses of sample SEM images, or a
statistical estimate based on the observed number of intact microfossil tests.
Many of the identified seismic reflectors (Shipboard Scientific Party,
1991a;Mosher et al., 1993) could be related to changes in the relative
percentages of microfossil constituents. In many cases, impedance contrasts
could be related to known paleoceanographic dissolution events.
Examination of data from studies such as Mayer (1993) and Berrera et al.
(1993) may provide additional information regarding the link between
impedance contrasts and paleoceanographic events.
The analysis of consolidation test data (Chapter 3) also indicated a
relationship between physical properties parameters, namely compression
135
index and expansion index, and microfossil content. We found that both
parameters decrease with increasing carbonate content, likely caused by the
incompressibility of carbonate grains relative to the compressibility of
siliceous or clay grains. Compression and expansion indices also decrease
with increasing carbonate content, likely caused by a lower relative volume
of compressible matrix with increasing percentages of relatively
incompressible grains. These results are consistent with those of other
studies for sediments with a range of carbonate contents.
We observed no evidence that microfossil tests were broken and
intraparticle water released during our consolidation testing. This
conclusion is supported by the lack of foraminifer test crushing or breakage
observed in the SEM micrographs, and was also found by Lind (1993) for
consolidation tests, using higher pressures, on ooze samples.
Many studies have used consolidation test data to interpret sediment
stress history. However, the difficulty in determining Pc' for these high
carbonate sediments results in poor estimates of Pc' and, subsequently, of
OCR. The compression index, Cc , is also likely affected. The problem of
determining appropriate Cc and Pc' for sediments with high CaC03 content
(and for other sediments that result in the observed e -log p' curve) bears
further study.
The observed relationship between expansion index and sediment
constituents led to the examination of sediment rebound for correction of
laboratory density and porosity to approximate in situ conditions (Chapter 4).
Rebound-eorrected laboratory data can be used in place of the downhole
logging data when the logging data are missing or erroneous. Many studies
have estimated in situ porosity using Hamilton's (1976) carbonate rebound
136
correction, which is limited in its depth applicability and includes sediments
containing as little as 30% carbonate in the model. Hamilton's correction is
not applicable to Ontong Java Plateau sediments, which generally contain
85% to 95% calcium carbonate and exhibit markedly different rebound
behavior.
Our rebound data from consolidation tests yielded porosity rebounds
of 1% to 4%, significantly lower than those reported for other sediment types,
such as siliceous sediments and clays, which have reported rebounds up to
about 10%. A radiolarian-rich sample exhibits 6% rebound, which is
consistent with the higher porosity rebounds reported for siliceous
sediments, and illustrates the influence of sediment composition on porosity
rebound. Based on the observed variability in rebound for different
sediments, rebound corrections ideally would be performed only when
rebound data is available for a particular sediment type. However, the
rebound correction derived in this study for Ontong Java Plateau sediments
could likely be used for other high-carbonate sediments.
137
REFERENCES
Bachman, R. T., 1984. Intratest porosity in foraminifera. J. Sediment. Petrol.,
54: 257-262.
Bassinot, F., Marsters, J. c., Mayer, L. A. and Wilkens, R. H., 1993a. Variations
of Porosity in Calcareous Sediments from the Ontong Java Plateau. In
W. H. Berger, L. W. Kroenke, L. A. Mayer et. al. (Eds.), Proc. OOP. Sci.
Results. College Station, TX (Ocean Drilling Program), 130: 653-661.
Bassinot, F. c., Marsters, J.c., Mayer, L.A., and Wilkens, R.H., 1993b. Velocity
anisotropy in calcareous sediments from Leg 130. In W. H. Berger, L.
W. Kroenke, L. A. Mayer etc al. (Eds.), Proc. ODP. Sci. Results. College
Station, TX (Ocean Drilling Program), 130: 663-672.
Berger, W. H., 1976. Biogenous deep-sea sediments: production, preservation
and interpretation. In J. P. Riley and R. Chester (Eds.), Treatise on
Chemical Oceanography: London (Academic Press), 265-388.
Berger, W. H. and Johnson, T. c., 1976. Deep-sea carbonates: dissolution and
mass wasting on Ontong-Java Plateau. Science, 192: 785-787.
Berger, W. H., and Mayer, L. A., 1977. Deep-sea carbonates: acoustic reflectors
and lysocline fluctuations. Geology, 6: 11-15.
Berrera, E. Baldauf, J., Lohmann, K. c., 1993. Strontium. isotope foraminifer
stable isotope results from Oligocene sediments at Site 803. In W. H.
Berger, L. W. Kroenke, L. A. Mayer et. al. (Eds.), Proc. OOP, Sci. Results.
College Station, TX (Ocean Drilling Program), 130: 269-279.
138
Bhattacharyya, A., and Friedman, G. M., 1979. Experimental compaction of
ooids and lime mud and its implication for lithification during burial.
Journal of Sedimentary Petrology, 49: 1279-1286.
Boyce, R. E., 1976. Definitions and laboratory techniques of compressional
sound velocity parameters and wet water content, wet bulk density
and porosity parameters by gravimetric and gamma ray attenuation
techniques. In S. O. Schlanger, E. D. Jackson, et aI. (Eds.), !nit. Repts.,
DSDP: Washington (U. S, Government Printing Office), 931-958.
Bryant, W. R., Cernack, P., and Morelock, J., 1967, Shear strength and
consolidation characteristics of marine sediments from the Western
Gulf of Mexico. In A. F. Richards (Ed.), Marine Geotechnique: Urbana
(University of lllinois Press), 41-64.
Casagrande, A., 1936, The determination of the preconsolidation load and its
practical significance. Proc. IntI. Conf. Mechanics, 3: 60-64.
Choquette, P. W., and Pray, L. c., 1970. Geologic nomenclature and
classification of porosity in sedimentary carbonates. AAPG Bull., 54:
207-250.
Crawford, C. B., 1986. State of the Art: Evaluation and Interpretation of Soil
Consolidation Tests. In R. N.Yong and F. C. Townsend, (Eds.),
Consolidation of Soils: Testing and Evaluation, Philadelphia, Par
(ASTM), STP 892: 71-103.
139
Demars, K. R, 1982, Unique engineering properties and compression
behavior of deep-sea calcarious sediments, In K. R Demars and R C.
Chaney (Eds.), Geotechnical Properties. Behayior. and Performance of
Calcareous Soils (American Society for Testing and Materials), STP
m:97-112.
Fukue, M., Okusa, S. and Nakamura, T., 1986. Consolidation of sand-clay
mixtures. In R N.Yong and F. C. Townsend, (Eds.), Consolidation of
Sand-Clay Mixtures, Philadelphia, Pa. (ASTM), STP 777: 627-641.
Gallagher, J. J., 1967. Influence of hollow shells on the porosity-sound
velocity relationship in some marine sediments (Abstract). J. Acoust.
Soc. Am., 42:1185.
Hamilton, E. L., 1964. Consolidation characteristics and related properties of
sediments from experimental mohole (Guadalupe site). Journal of
Geophysical Research, 69: 4257-4269.
Hamilton, E. L., 1976. Variations of density and porosity with depth in deep
sea sediments. Journal of Sedimentary Petrology, 46:280-300.
Hamilton, E. L., Bachman, R T., Berger, W. H., Johnson, T. c., and Mayer, L.
A., 1982. Acoustic and related properties of calcareous deep-sea
sediments. 1- Sediment. Petrol., 52:733-753.
Head, K. H., 1986, Manual of Soil Laboratory Testing, New York (John Wiley
& Sons).
140
Johnson, T. c., Hamilton, E. L., and Berger, W. H., 1977. Physical properties of
calcareous ooze: control by dissolution at depth. Mar. Geol.. 24:259-277.
Kelly, W. E., V. A. Nacci, M. C. Wang, and K. R. Demars, 1974. Carbonate
Cementation in Deep-Ocean Sediments. Proc. ASCE, 100:383-386.
Kroenke, L. W., [ouannic, c. and Woodward, P., 1983. Bathymetry of the
Southwest Pacific, Chart I: The Geophysical Atlas of the Southwest
Pacific, Mercator Projection, Scale 1:6,442,192 at 0 degrees. Suva, Fiji
(U.N. ESCAP/CCOP/SOPAC).
Kroenke, L. W., Resig, J. and Cooper, P. A., 1986. Tectonics of the
southeastern Solomon Islands:formation of the Malaita
Anticlinorium. In J. J. Vedder and D. L. Tiffin (Eds.), Geology and
Offshore Resources of Pacific Island Arcs, Solomon Islands Region.
(Circum-Pacific Council for Energy and Mineral Resources, Earth
Science Series), 4: 109-116.
Kroenke, L. W., Berger, W. H., Janecek, T. R. et al., 1991. Proc. ODP, !nit. Repts
.(13.Q).. College Station, TX (Ocean Drilling Program).
Lavoie, D. L. and Bryant, W. R., 1993. Permeability characteristics of
continental slope and deep-water carbonates from a microfabric
perspective. In R. Rezek and D. L. Lavoie (Eds.), Carbonate
Microfabrics, New York (Springer-Verlag), 117-128.
141
Lee, H. J., Kayen, R. E., and McArthur, W. G., 1990. Consolidation, triaxial
shear-strength, and index-property characteristics of organic-rich
sediment from the Peru continental margin: results from Leg 112. In E.
Suess, R. von Huene, et al. (Eds.), Proc. ODP, Sci. Results: College
Station, TX. (Ocean Drilling Program), 112: 639-651.
Leonards, G. A., 1962. Foundation Engineering. New York (McGraw-Hill
Book Company).
Lind, I., 1993. Loading experiments on carbonate ooze and chalk from Leg
130, Ontong Java Plateau. In W. H. Berger, L. W. Kroenke, L. A. Mayer
et. al. (Eds.), Proc. ODP. Sci. Results. College Station, TX (Ocean Drilling
Program), 130: 673-686.
Mahoney, J. J., 1987. An isotopic survey of Pacific oceanic plateaus:
implications for their nature and origin. In R. Batiza, B. Keating and P.
Fryer (Eds.), Seamounts. Islands. and Atolls: the Menard Volume.
AGU Monagraph 43:207-220.
Mahoney, J. J., Neal, C. R., Petterson, M. G., et al., 1993a. Formation of an
Ontong Java Plateau: speculations from field and geophysical
observations of the Ontong Java Plateau.~ 74:552.
Mahoney, J. J., Storey, M., Duncan, R. A., et al., 1993b. Geochemistry and
geochronology of the Ontong Java Plateau. In M. Pringle, W. Sager, w.
Sliter and S. Stein (Eds.), The Mesozoic Pacific. Washh,gton (AGU
Monogr.),77:233-261.
142
Mammerickx, J. and Smith, S. M., 1984. Bathymetry of the Northcentral
Pacific. Washington (The Geological Society of America).
Marsters, J. c.,1986.Geotechnical Analysis of Sediments from the Eastern
Canadian Continental Slope. South of St. Pierre Bank. M. Eng. Thesis,
Halifax (Technical University of Nova Scotia).
Marsters, J. c., and Christian, H. A., 1990. Hydraulic conductivity of
diatomaceous sediment from the Peru continental margin obtained
during ODP Leg 112. In E. Suess, R von Huene, et al. (Eds.), Proc. ODP,
Sci. Results: College Station, TX. (Ocean Drilling Program), 112: 633
638.
Marsters, J. C. and Manghnani, M. H., 1993. Consolidation test results and
porosity rebound of Ontong Java Plateau sediments. In W. H. Berger,
1. W. Kroenke, 1. A. Mayer et. al. (Eds.), Proc. ODP. Sci. Results.
College Station, TX (Ocean Drilling Program), 130: 687-693.
Marsters, J. c., Resig, J. M. and Wilcoxon, J. A" 1993. Relationships between
physical properties and microfossil content and preservation in
calcareous sediments of the Ontong Java Plateau. In W. H. Berger, 1.
W. Kroenke, 1. A. Mayer et. al. (Edx.), Proc. ODP, Sci. Results. College
Station, TX (Ocean Drilling Program), 130:641-652.
Mayer, 1. A., 1979. Deep sea carbonates: acoustic, physical, and stratigraphic
properties. J. Sediment. Petrol.. 49:819-836.
143
Mayer, L. A., Shipley, T. H., Theyer, F., et al., 1985. Seismic Modeling and
Paleoceanography at Deep Sea Drilling Project Site 574. In L. A. Mayer
and F. Theyer (Eds.), Initial Reports. DSDP. Washington (D. S. Govt.
Printing Office), 85:947-970.
Mayer, L. A., Shipley, T. H. and Winterer, E. L., 1986. Equatorial Pacific
seismic reflectors as indicators of global oceanographic events. Science.
233:711-714.
Mayer, L. A., Courtney, R. c., and Moran, K., 1987. Ultrasonic measurements
of marine sediment properties. Proc. Oceanogr.. 87:139.
Mayer, L. A., Shipley, T. H., Winterer, E. L., et al., 1991. Seabeam and Seismic
Reflection Surveys on the Ontong Java Plateau. In L. W. Kroenke, W.
H. Berger and T. R. Janecek (Eds.), Proc. Ocean Drilling Program. Initial
~. College Station, TX (Ocean Drilling Program), 130:45-75.
Mayer, L. A., Jansen, E., Backman, J. and Takayama, T., 1993. Climatic cyclicity
at Site 806: the GRAPE record. In W. H. Berger, L. W. Kroenke, L. A.
Mayer et. al. (Eds.), Proc. ODP, Sci. Results. College Station, TX (Ocean
Drilling Program), 130:623-639.
Moberly, R., Schlanger, S. O. and al., e., 1986. Site 586. In R. Moberly, S. O.
Schlanger et al. (Eds.), Init. Repts. DSDP. Washington (U.S. Govt.
Printing Office), 89:213-235.
144
Morelock, J., and Bryant, W. R, 1971. Consolidation of marine sediments. In
R Rezak, and H. J. Vernon (Ed.), Contributions on the Geological and
Geophysical Oceanography of the Gulf of Mexico, Houston, Texas A &
M University Oceanog. Studies (Gulf Publishing Co.), 181-202.
Morton, R W., 1975. Sound velocity in carbonate sediments from Whiting
Basis Puerto Rico. Mar. GeoL 19:1-17.
Mosher, D.C., Mayer, L.A., Shipley, T.H., Winterer, E.L., Hagen, R. A.,
Marsters, J.c., Bassinot, F., Wilkens, RH., and Lyle, M., 1993. Seismic
stratigraphy of the Ontong Java Plateau. In W. H. Berger, L. W.
Kroenke, L. A. Mayer et. al. (Eds.), Proc. PDP, Sci. Results. College
Station, TX (Ocean Drilling Program), 130:33-50.
Nacci, V. A., Kelly, W. E., Wang, M. c., and Demars, K. R, 1974. Strength and
stressstrain characteristics of cemented deep-sea sediments. In A. L.
Inderbitzen (Ed.), Deep Sea Sediments, Physical Mechanical Properties,
New York, N. Y. (Plenum Press), 129-150.
Nacci, V. A., Wang, M. C. and Demars, K. R, 1975. Engineering behaviour of
calcareous soils. Proc.. Civ. Eng. in the Oceans ill, 1: 380-400.
Noorany, I., 1984. Phase relations in marine soils. J. Geotech. Eng., 110:539
543.
Rack, F. R, Bryant, W. R. and Julson, A. P., 1993. Microfabric and Physical
Properties of Deep-Sea High Latitude Carbonate Oozes. In R. Rezek
and D. L. Lavoie (Eds.), Carbonate Microfabrics, New York (Springer
Verlag), 129-147.
145
Rezak, R., 1974. Deep-sea carbonates, In A. 1. Inderbitzen (Ed.), Deep Sea
Sediments, Physical Mechanical Properties, New York, N. Y. (Plenum
Press), 453-460.
Resig, J., Buyannanonth, V. and Roy, K., 1976. Foraminiferal stratigraphy and
depositional history of the Ontong Java Plateau. Deep Sea Res., 23:441
456.
Resig, J. M., Kroenke, 1. W. and Cooper, P. A., 1986. Elevation of the Pacific
Province, Solomon Islands, at the Pacific and Indo-Australia Plate
Boundary. In J. G. Vedder, K. S. Pound and S. Q. Boundy (Eds.),
Geology and Offshore Resources of Pacific Island Arcs, Central and
Western Solomon Islands Region. (Circum-Pacific Council for Energy
and Mineral Resources, Earth Science Series), 4:261-266.
Richards, A. F., and Hamilton, E. 1., 1967. Investigations of deep-sea
sediment cores, ill: Consolidation. Proc. Intern. Conf. Marine
Geotechnique, 93-117.
Schmertmann, J. H., 1955. The undisturbed consolidation behavior of clay,
Trans. Am. Soc. Civil Engineers, 120: 1201-1233.
Schreiber, B. c., 1968. Sound velocity in deep-sea sediments. J. Geophys. Res.,
73:1259-1268.
Schlanger, S. O. and Douglas, R. G., 1974. The pelagic ooze-chalk-limestone
transition and its implications for marine stratigraphy. Spec. PubIs. Int.
Ass. Sedimentology, 1: 117-148.
146
Shipboard Scientific Party, 1991a. Site 803. In L. W. Kroenke, W. H. Berger
and T. R. Janecek (Eds.), Proc. Ocean Drilling Program. Initial Rpts.
College Station, TX (Ocean Drilling Program), 130:101-176.
Shipboard Scientific Party, 1991b. Explanatory Notes. In L. W. Kroenke, W. H.
Berger and T. R. Janecek (Eds.), Proc. Ocean Drilling Program. Initial
RIlli.. College Station, TX (Ocean Drilling Program), 130:15-43.
Shipboard Scientific Party, 1991c. Site 803. In L. W. Kroenke, W. H. Berger
and T. R. Janecek (Eds.), Proc. Ocean Drilling Program. Initial Rpts.
College Station, TX (Ocean Drilling Program), 130: 291-367.
Silva, A. J. and Jordan, S. A., 1984. Consolidation properties and stress history
of some deep sea sediments. Sea Bed Mechanics, London, U. K.
(Graham and Trotman Ltd.), 25-39.
Tarduno, J. A., Sliter, W. V., Kroenke, L., et al., 1991. Rapid Formation of
Ontong Java Plateau by Aptian Mantle Plume Volcanism. Science.
254:399-403.
Taylor, D. W., 1948. Fundamentals of Soil Mechanics. New York (Wiley).
Terzaghi, K., 1923. Die Berechnung der Durchlassigkeitsziffer des Tones aus
dem Verlauf der Hydrodynamischen Spannungserscheinungen,
Wien, Sitzungsberichte (Akademie der Wissenschaften).
Urmos, J., 1991. Interparticle porosity for Site 803. Unpublished Data.
147
Urmos, J., Wilkens, R. H., Bassinot, F., Lyle, M., Marsters, J.e., Mayer, L. A.,
and Mosher, D. c., 1993. Laboratory and well-log velocity and density
measurements from the Ontong Java Plateau: new in-situ corrections
to laboratory data for pelagic carbonates. In W. H. Berger, L. W.
Kroenke, L. A. Mayer et. al. (Eds.), Proc. ODP, Sci. Results. College
Station, TX (Ocean Drilling Program), 130: 607-622.
Valent, P. J., Altschaeffl, A. G., and Lee, H. J., 1982. Geotechnical properties of
two calcareous oozes, In K. R. Demars and R. C. Chaney (Eds.),
Geotechnical Properties, Behayior, and Performance of Calcareous
Soils (American Society for Testing and Materials), STP 777: 79-95.
Wilkens, R. H. and Urmos, J., 1994. Physical properties and microstructure of
pelagic carbonates, Eos, 75: 336.
Yan, C. Y. and Kroenke, L. W., 1993. A plate-tectonic reconstruction of the
Southwest Pacific, 100 - 0 Ma. In W. H. Berger, L. W. Kroenke, L. A.
Mayer and e. al. (Ed.), Proc. ODP, Sci. Results. College Station, TX
(Ocean Drilling Program), 130: 697-710.
148