Embed Size (px)
Citation preview

UMENG – Mobile app developer services platform

UMENG BaaS platform: one-stop shop for mobile app developer
Infrastructure
App Development
App Operation
Data Storage, CDN, SNS Integration
Crush report, Cloud setting, Testing
Analytics, user feedback, Push notification

UMENG Analytics: Understand your app users

UMENG Analytics: Understand your app users

UMENG Analytics: distribution channel analysis
Measure channel performance, acquire high quality users

UMENG Analytics: User engagement

UMENG Analytics: Funnel analysis
Tracking user’s in-app conversion rate

UMENG Mobile Game Analytics: vertical solutions for mobile game developers

590 million active smart devices in China
Data Source: Umeng Analytics Platform www.umeng.com
245m
380m
500m
590m
2012Q4 2013Q1 2013Q2 2013Q3
Active Device Growth Trend in Mainland China
Active devices doubled in 12 months

Continuous increase of developers and APPs
Data Source: Umeng Analytics Platform www.umeng.com
22000 40000
72000
100000
130000
180000
0
60000
120000
180000
Dec 2011 May 2012 Oct 2012 Mar 2013 Jun 2013 Oct 2013
Trend of App Increase in China
New apps registered in UMENG platform increased 150% in 12 months

2010Camera 360 365 日� 开卷有益 �用�
2011美�秀秀 美�� 蘑菇街 航班管家
2012唱吧 滴滴搭 暴影音 PPTV
2013大姨� Zank 表情工厂 �程格子
Trends of mobile apps

Data Source: Umeng Analytics Platform www.umeng.com
Domestic Android brands boom
Data Source: Umeng Analytics Platform www.umeng.com
21.3%
10.1%
6.4%
6.3% 5.5%
4.9% 5.1%
4.1% 3.1%
3.8%
29.3%
Android Device Brand Distribution (Dec 2012)
Samsung
HTC
Lenovo
Huawei
ZTE
Coolpad
Xioami
Motorola
OPPO
Sony/Sony Ericsson
Others
23.2%
8.2%
7.4%
6.0% 5.8% 5.2%
4.3%
4.0%
3.3%
1.7%
30.8%
Android Device Brand Distribution (Oct 2013)
Samsung
Lenovo
Huawei
Xiaomi
HTC
Coolpad
ZTE
OPPO
BBK
K-TOUCH
Others
Low and middle end Android devices have achieved substantial growth, hoping to win their position in mainland market. Up to Oct 2013, Lenovo gets to the second place instead of HTC

62%
28%
10%
Android Device Lifecycle
0-‐6 months
7-‐14 months
15 months and above
90% of active Android devices in China have been used less than 14 months
Data Source: Umeng Analytics Platform www.umeng.com
62% of the Android devices have been used for 0 to 6 months, 28% have been used for 7 to 14 months, only 10% have a lifecycle longer than 14 months. In other words, 90% of the users would buy a new Android device 14 months after their previous purchase. ··he lifecycle of China’s Android devices is around 14 months!

Data Source: Umeng Analytics Platform www.umeng.com
Fall in the percentage of Jailbroken iOS devices!
Data Source: Umeng Analytics Platform www.umeng.com
0%
5%
10%
15%
20%
25%
30%
35%
40%
Jan
2013
Feb
2013
Mar
201
3
Apr
201
3
May
201
3
Jun
2013
Jul 2
013
Aug
201
3
Sep
201
3
Oct
201
3
iOS Jailbroken Rate Change in China
18.0%
6.6%
Domestic Oversea
iOS Jailbroken Rate Distribution Domestic vs Overseas
(Oct 2013)
September iOS7 released!
iOS jailbroken rate is 18% in mainland China , dropped from 42% one year ago

Data Source: Umeng Analytics Platform www.umeng.com
2G still takes the majority of Android mobile networks
31.6%
12.3%
20.7%
36.8%
46.9%
50.8%
Domestic
Oversea
Android Networks Distribution (Overseas vs Domestic)
2G 3G wifi
For those Android users, 3G is much more frequently used in overseas than in China. In Jun 2013, 36.1% users in China connect the internet using 2G network

0% 10% 20% 30% 40% 50% 60% 70% 80% 90%
100%
0% 10% 20% 30% 40% 50% 60% 70% 80% 90% 100%
App Do
wnloa
ded an
d Ac
3vated
(%)
User Coverage
Percentage of China Android users trying out new apps
66%!
Only 30% of users per month prefer to try out new apps
Data Source: Umeng Analytics Platform www.umeng.com
Only 30% of users try out new apps every month. In addition, the top 10% users who are the most curious and adventurous ones downloaded 66% of all the new apps.

} More than 100 Android app stores in China, very fragmented market with only 50% of activations coming from the Top 10 app stores.
} Only 5.6% activated app downloaded from Google Play. Signified dropped from 21% in 2010. This is due to the fact that Google services are absent and deactivated from devices sold in China.
数据来源: 友盟统计分析平台 www.umeng.com
78.2%
8.5%
4.2% 2.5% 0.6%
5.9%
Android Apps distributions by Channels
第三方应用商店
厂商应用商店
广告网络
官方下载(应用官网)
运营商应用商店
其他
Third party app stores
OEM app stores
Ads network
Ads network
Operator apps stores
Other
Android fragmentation- Distribution Channel

Data Source: Umeng Analytics Platform!
2013, the year of mobile game!
2012/08
2012/09
2012/10
2012/11
2012/12
2013/01
2013/02
2013/03
2013/04
2013/05
2013/06
2013/07
2013/08
MAU in Mobile Games
MAU increased 4.5X in 12 months

2012 2013
Average time spend increased 66%
2012 2013
Average daily session increased 50%
Users spend more times on mobile games!

iOS Users
iOS game users 31%
23%
iPad vs.iPhoneiPad iPhone
iOS Users
iOS game users 31%
23%
iPad vs.iPhoneiPad iPhone
iOS Users
iOS game users 31%
23%
iPad vs.iPhoneiPad iPhone
iPad opportunity for game developers!
Source: UMENG Analytics Platform www.umeng.com

iPad 2
iPad 3
iPad 4
iPad mini
iPhone 4
iPhone 4S
iPhone 5
Android
5.8
4.65
5.6
6.76.56.76.9Average game session length (Min)
Source: UMENG Analytics Platform www.umeng.com
iPad users are more engage in mobile games!

} 42.1% users first play Trivia/Casual games on their phone �
} 22.2% users first play Action/Arcade games. �
} Only 0..4% users first play role playing games �
42.1%
22.2%
13.3%
7.7%
7.5%
3.5% 1.5% 1.2% 0.6%
0.4%
The Distribution of Users' First Activated Games (Apr-2013)
Trivia
Action/Arcade
Chess/Card
Adventure
Sports/Flying/Music
Puzzle
Strategy
Educational/Family/Kids
Simulation
Role Playing
Source: UMENG Analytics Platform www.umeng.com
Casual gaming still big in China!

} At weekend users in first tier cities like photography apps most and the frequency has increased by 53% in 2013 first half, the following popular app categories are Games and Navigation with a 46% and 16% increase.
} Users in second tier cities prefer to play games at home, seeing a 54% increase in the first half year. Those photography and Video apps are also their favorite. To enjoy videos and playing games at home are their perfect relaxing life at weekends.!
Data Source: Umeng Analytics Platform www.umeng.com
Users’ Weekend Life: first tier cities for photo shooting; second and third tier cities watching videos at home
Top 3 Daily Use Frequency Growth Rate (Per User at Weekend)
First Tier Districts Second and Third Tier Districts
16%
46%
53%
Navigation
Game
Photo Management
17%
46%
54%
Video
Photo Management
Game

} Developers in China have shown great interest to the overseas app markets. 25% apps have been developed to compete in these markets.*
} Although 78% apps are for domestic users, developers in China come to take their place in overseas market, 20% developers having at least one app for the overseas markets.
Data Source: Umeng Analytics Platform www.umeng.com
Over1/5 mainland developers are aiming at overseas markets
Data Source: Umeng Analytics Platform www.umeng.com
* Note: An app is recognized as for overseas users if 75% of its sessions are from overseas..
25%
75%
Market Distribution of Mainland Apps (Domestic vs Overseas)
App for domestic users
App for overseas users
22%
78%
Market Interest of Mainland Developers (Domestic vs Overseas)
Developer for domestic users
Developer for overseas users

54% developers will use cross-platform technology within 2 years
} Larger amount of developers are considering to use cross-platform technology, and the ratio will be 54% within two years.
} PhoneGap is the most popular among all cross-platform technologies with 60% of developers who are using or intend to use it.
Data Source: Umeng Analytics
Data Source: Umeng Analytics
46.1%
12.8%
16.5%
24.7%
No interest
Next year
This year
Used
Interest to Use Cross-Platform Technology
57.5%
29.0%
21.0%
7.6% 5.6%
14.6%
PhoneGap Appcan Appmobi Sencha Rexsee Others
Distribution of Html5 Cross-Platform Being Used
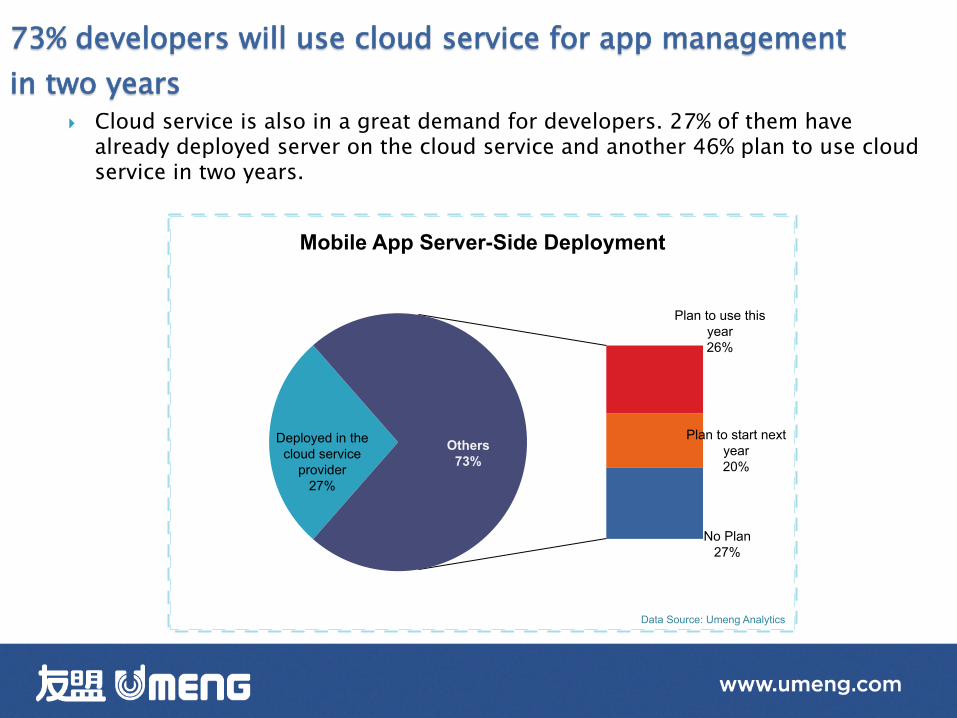
} Cloud service is also in a great demand for developers. 27% of them have already deployed server on the cloud service and another 46% plan to use cloud service in two years.
Data Source: Umeng Analytics
73% developers will use cloud service for app management in two years
Deployed in the cloud service
provider 27%
Plan to use this year 26%
Plan to start next year 20%
No Plan 27%
Others 73%
Mobile App Server-Side Deployment

UMENG Insight report

Working with more than 60,000 developers

30
} More information: www.umeng.com } 微博: 友盟 } 微信:友盟 } Blog: blog.umeng.com } Email: [email protected]
30
Thank you

31 31
Backup

Fina
nce
Busi
ness
Hea
lth
Soci
al n
etw
ork
Educ
atio
n
Vide
o
Phot
o
Them
e
28%29%44%50%
69%80%85%
147%
Trends of mobile apps

} In second season of 2013, the growth of active devices in China results in more than 500 million—340 million Android active devices and 150 million iOS active devices, doubled than half a year ago.
} Low and middle end Android devices have achieved substantial growth, hoping to win their position in mainland market. Up to Jun 2013, Lenovo gets to the second place instead of HTC.
} Only 30% of users try out new apps every month. In addition, the top 10% users who are the most curious and adventurous ones downloaded 66% of all the new apps.
} 90% of active Android devices in China have been used less than 14 months. } Developer team size in mainland China becomes bigger, and those teams
greater than or equal to 51 members has increased by 40%. 25% apps are aiming at the overseas markets.
} 30.5% iOS has been jailbroken in mainland China, 10% lower than that of last year, but still 17% higher than international standards.
* Note: Device in this report is refer to active device—with at least one session of an app on Umeng platform in a given time period, not the device shipments.
Key Findings


![[2014 Q1 Umeng Insight Report] The Third Tier - Revealing China's Largest User Base](https://img.pdfslide.us/doc/110x75/53f8dd3a8d7f7253318b490b/2014-q1-umeng-insight-report-the-third-tier-revealing-chinas-largest-user-base.jpg)