Embed Size (px)
Citation preview
Finance BI Pilot UM Analytics – Navigation to Central Developed Objects
UM Analytics - Navigation to Central Developed Objects.docx Page 1 of 14
Key Terms
Here are some key terms that will be referenced in this job aid. Hopefully these will help to clarify a few items as you navigate through the UM Analytics environment.
• Analysis – Think of an analysis as simply a query or collection of data fields that provide answers to various business related questions. For example, a Sponsored Award Deficit analysis is a query that provides a list of Sponsored Awards that are in deficit.
• Dimensions – Dimensions are data fields that correlate to chartfields that are used in the transaction system. Dimensions can be best described as the building blocks for the analysis. For example, the account dimension would be equivalent to the account chartfield. Members – Members refer to the actual values that are contained within a data field/dimension. The account dimension would contain account member values of 700000, 700100, 700102, etc.
• Attributes – Attributes are data fields that provide additional information about a dimension. The account dimension may have attributes that provide the account description, account type, etc..
• Hierarchies – Hierarchies are used to display the trees that exist in the financial system. Within OBIEE the hierarchies are flattened in a way which allows the customer to report on various levels within the tree without having to create multiple joins to other tables. An example of the hierarchy in the UM Analytics environment is the ‘UM Account CYFWD’, which is used to depict the financial UM_ACCOUNT_CYFWD.
• Objects – Objects are graphical representations of functions within the UM Analytics toolset. The ‘save’ object , provides the ability to save your work.
• Analysis – Query or collection of data which provides answers to business questions.
• Dashboard – Collection of queries presented in graphical and/or tabular form to answer business question(s).
• Dashboard Prompt – Function used to reduce results of dashboard to focus on business question(s).
• Filter – Function used to limit results of an analysis.
The following steps can be used as a blueprint for creating an analysis.
Finance BI Pilot UM Analytics – Navigation to Central Developed Objects
UM Analytics - Navigation to Central Developed Objects.docx Page 2 of 14
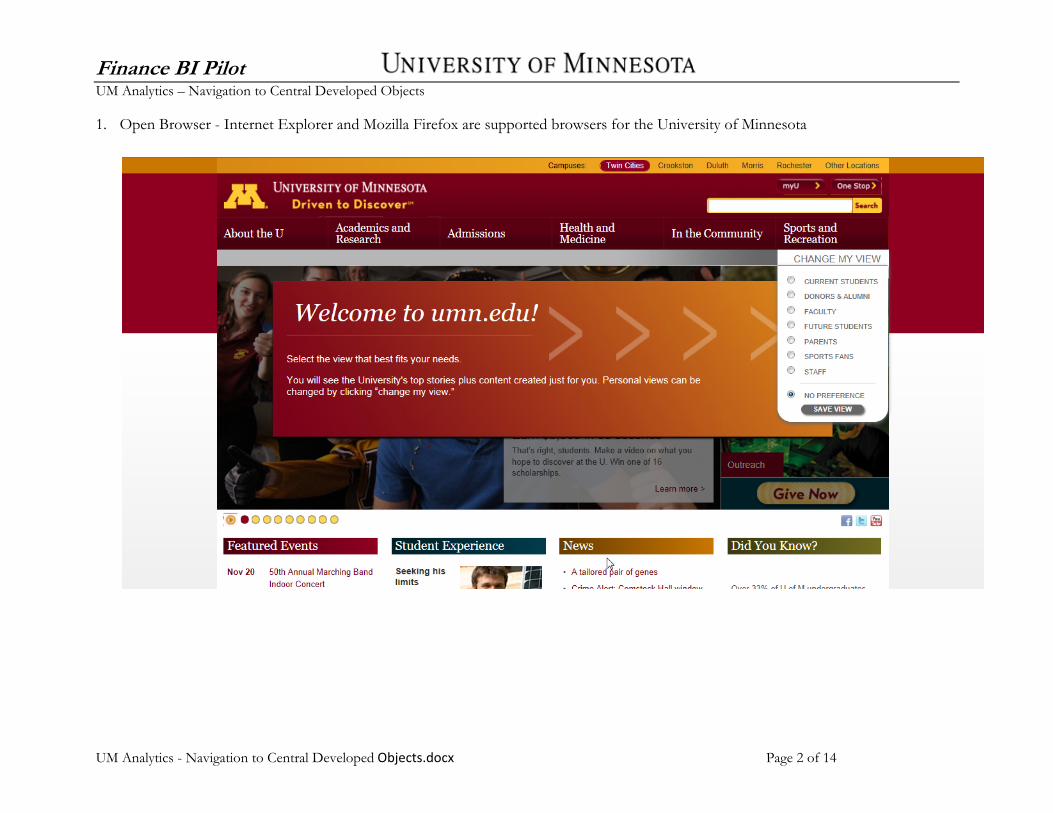
1. Open Browser - Internet Explorer and Mozilla Firefox are supported browsers for the University of Minnesota
Finance BI Pilot UM Analytics – Navigation to Central Developed Objects
UM Analytics - Navigation to Central Developed Objects.docx Page 3 of 14
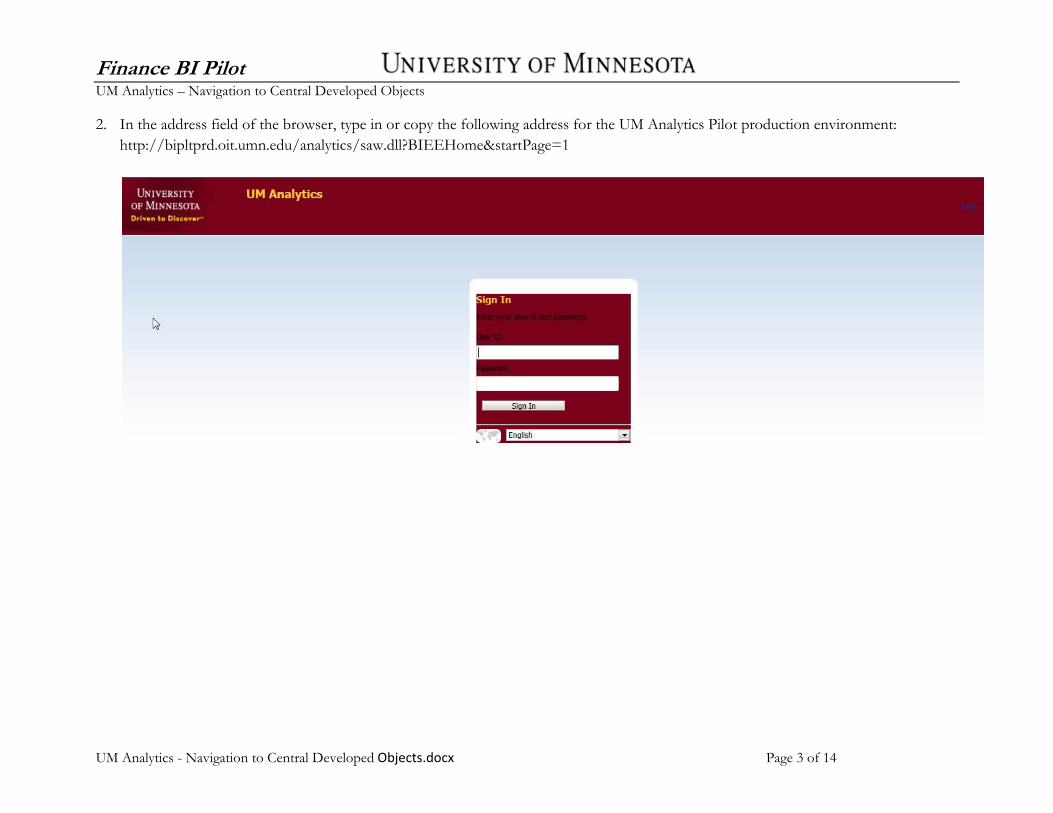
2. In the address field of the browser, type in or copy the following address for the UM Analytics Pilot production environment: http://bipltprd.oit.umn.edu/analytics/saw.dll?BIEEHome&startPage=1
Finance BI Pilot UM Analytics – Navigation to Central Developed Objects
UM Analytics - Navigation to Central Developed Objects.docx Page 4 of 14
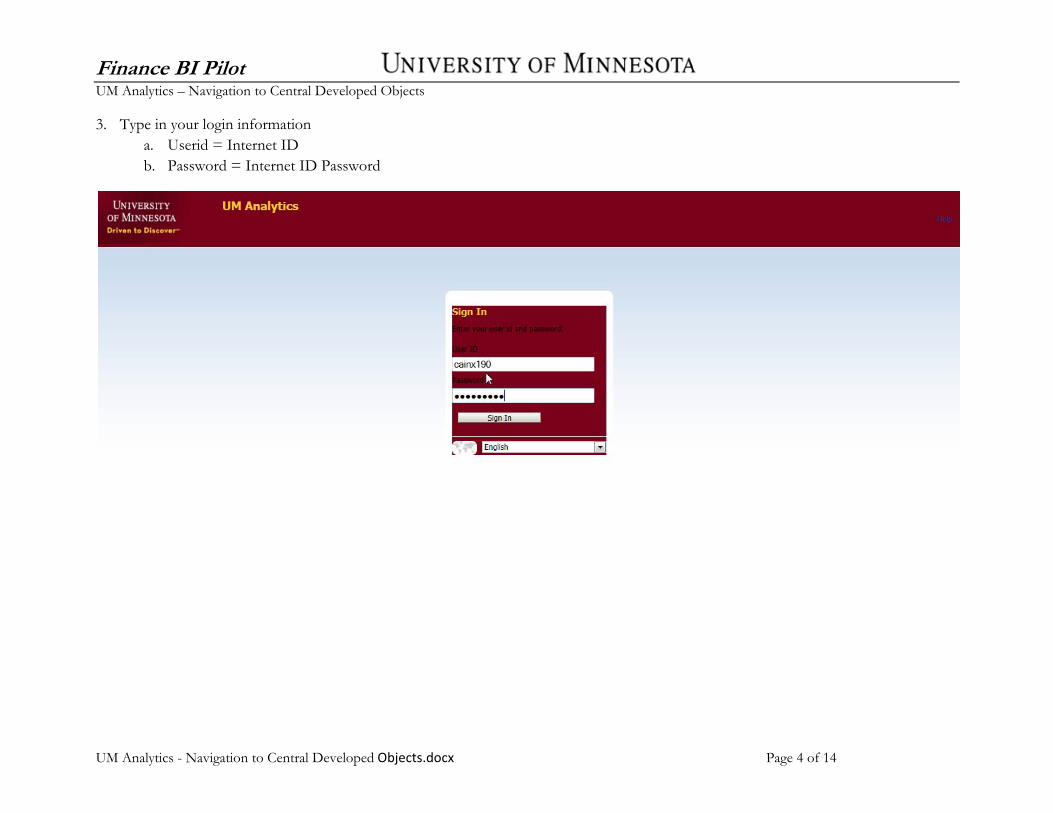
3. Type in your login information a. Userid = Internet ID b. Password = Internet ID Password

Finance BI Pilot UM Analytics – Navigation to Central Developed Objects
UM Analytics - Navigation to Central Developed Objects.docx Page 5 of 14
4. Upon logging into the UM Analytics environment, you will either be presented with a personal dashboard or the standard 'Home' page. The Home page is a task-oriented, centralized workspace combined with the University of Minnesota header, allowing access to various OBIEE objects, the related editors, help documentation, etc.
Finance BI Pilot UM Analytics – Navigation to Central Developed Objects
UM Analytics - Navigation to Central Developed Objects.docx Page 6 of 14
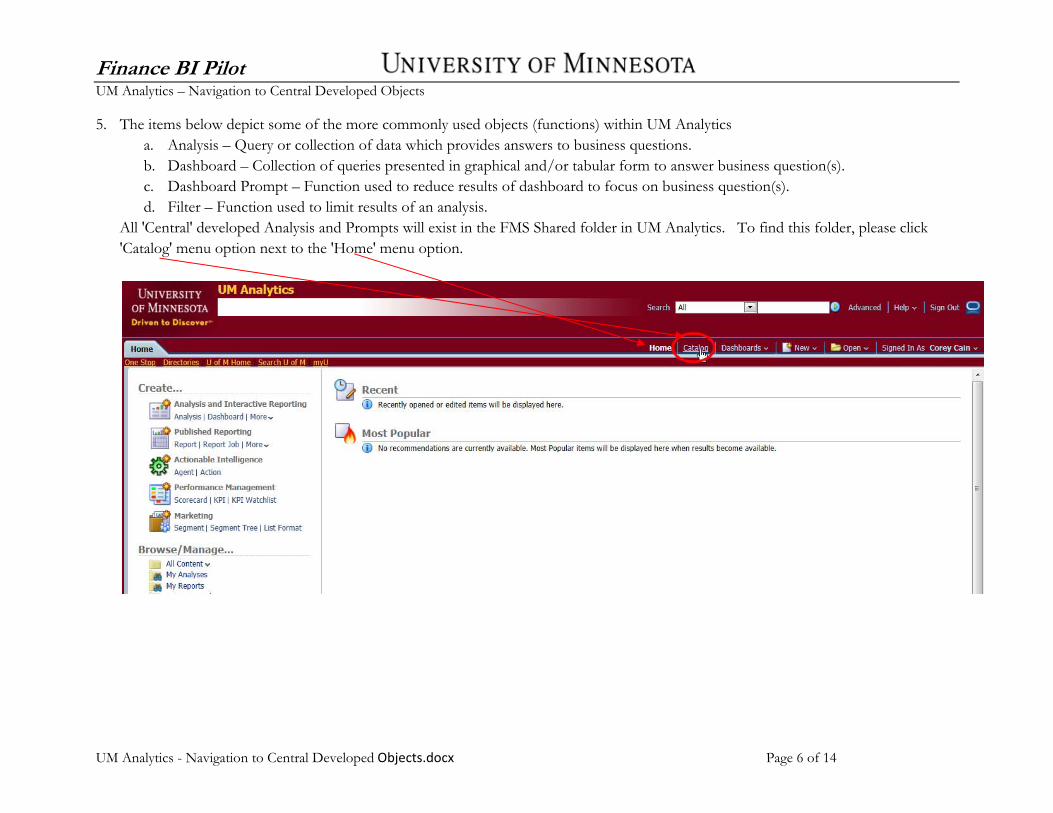
5. The items below depict some of the more commonly used objects (functions) within UM Analytics a. Analysis – Query or collection of data which provides answers to business questions. b. Dashboard – Collection of queries presented in graphical and/or tabular form to answer business question(s). c. Dashboard Prompt – Function used to reduce results of dashboard to focus on business question(s). d. Filter – Function used to limit results of an analysis.
All 'Central' developed Analysis and Prompts will exist in the FMS Shared folder in UM Analytics. To find this folder, please click 'Catalog' menu option next to the 'Home' menu option.
Finance BI Pilot UM Analytics – Navigation to Central Developed Objects
UM Analytics - Navigation to Central Developed Objects.docx Page 7 of 14
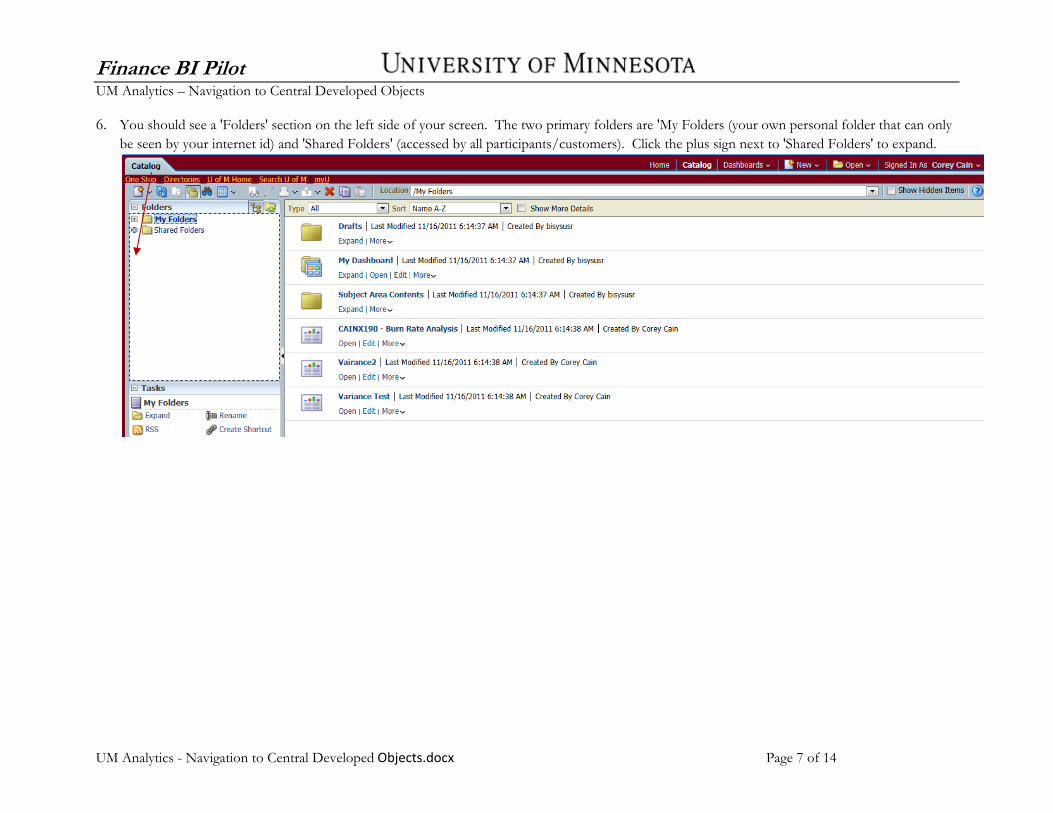
6. You should see a 'Folders' section on the left side of your screen. The two primary folders are 'My Folders (your own personal folder that can only be seen by your internet id) and 'Shared Folders' (accessed by all participants/customers). Click the plus sign next to 'Shared Folders' to expand.
Finance BI Pilot UM Analytics – Navigation to Central Developed Objects
UM Analytics - Navigation to Central Developed Objects.docx Page 8 of 14
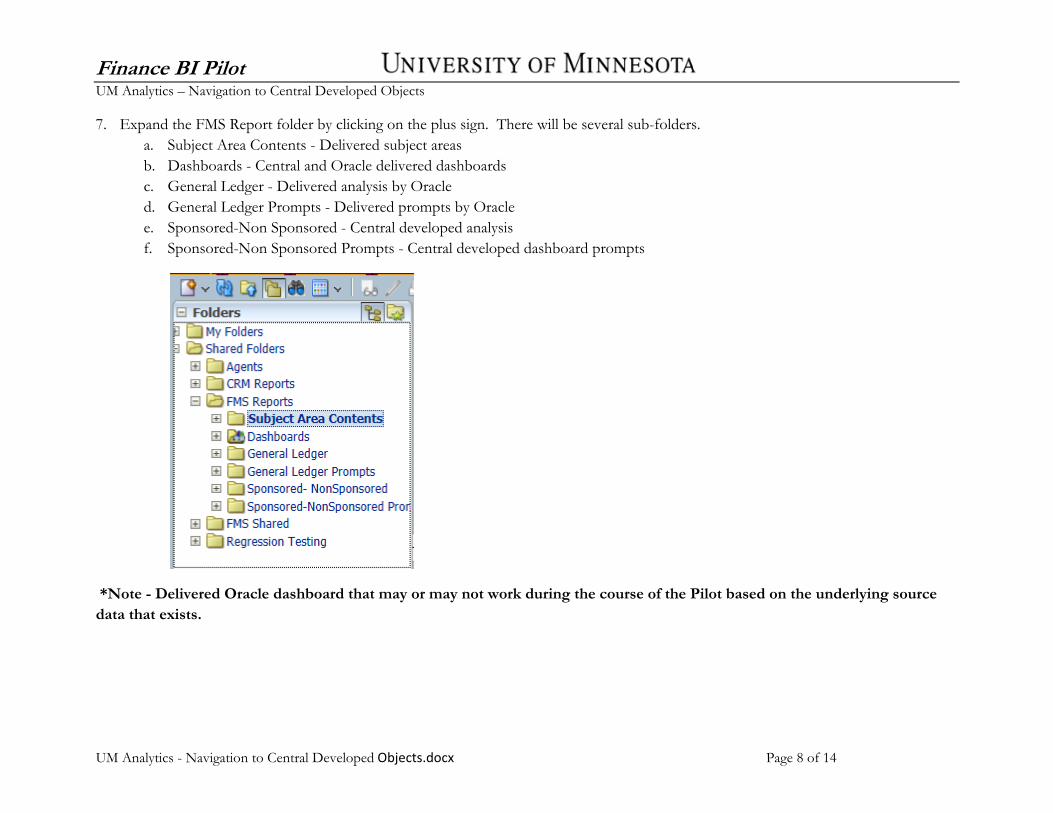
7. Expand the FMS Report folder by clicking on the plus sign. There will be several sub-folders. a. Subject Area Contents - Delivered subject areas b. Dashboards - Central and Oracle delivered dashboards c. General Ledger - Delivered analysis by Oracle d. General Ledger Prompts - Delivered prompts by Oracle e. Sponsored-Non Sponsored - Central developed analysis f. Sponsored-Non Sponsored Prompts - Central developed dashboard prompts
*Note - Delivered Oracle dashboard that may or may not work during the course of the Pilot based on the underlying source data that exists.
Finance BI Pilot UM Analytics – Navigation to Central Developed Objects
UM Analytics - Navigation to Central Developed Objects.docx Page 9 of 14
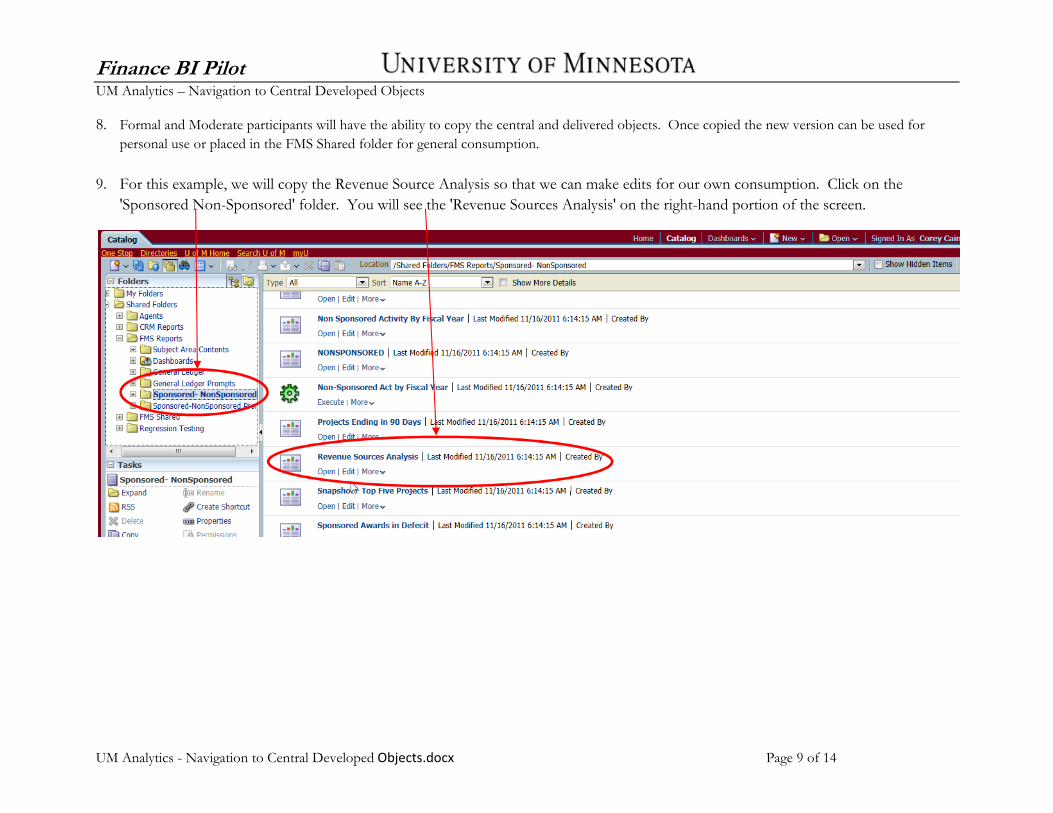
8. Formal and Moderate participants will have the ability to copy the central and delivered objects. Once copied the new version can be used for personal use or placed in the FMS Shared folder for general consumption.
9. For this example, we will copy the Revenue Source Analysis so that we can make edits for our own consumption. Click on the 'Sponsored Non-Sponsored' folder. You will see the 'Revenue Sources Analysis' on the right-hand portion of the screen.
Finance BI Pilot UM Analytics – Navigation to Central Developed Objects
UM Analytics - Navigation to Central Developed Objects.docx Page 10 of 14
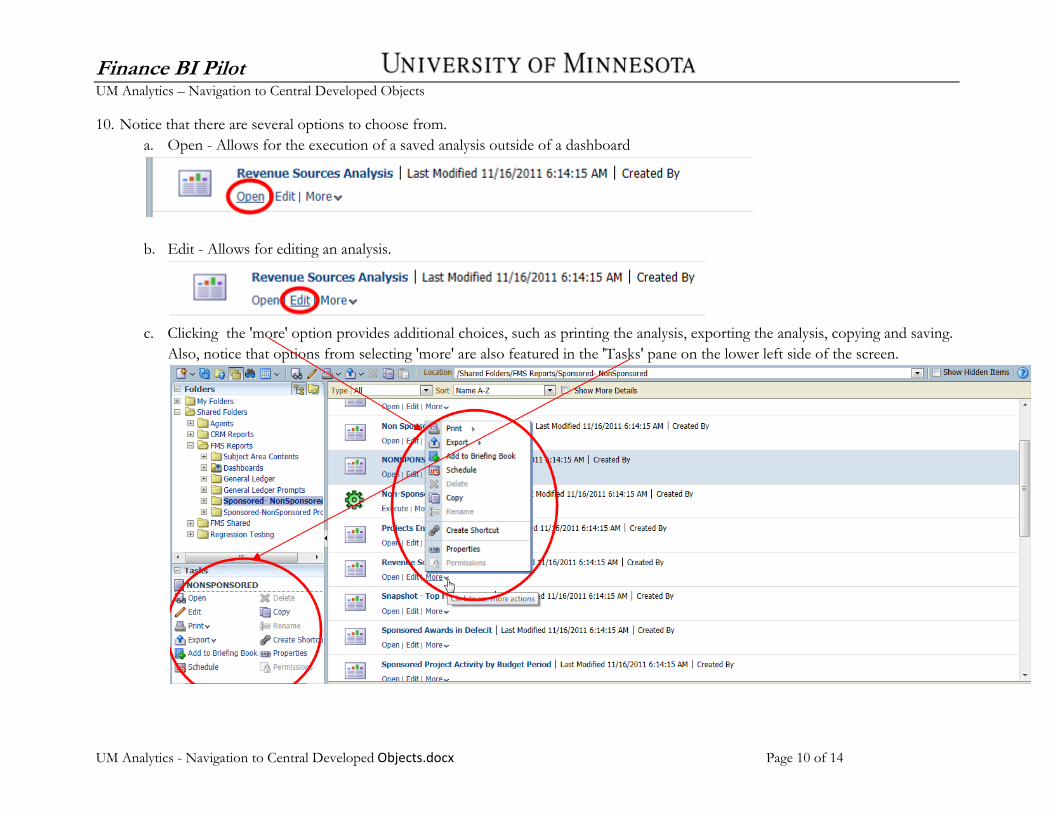
10. Notice that there are several options to choose from. a. Open - Allows for the execution of a saved analysis outside of a dashboard
b. Edit - Allows for editing an analysis.
c. Clicking the 'more' option provides additional choices, such as printing the analysis, exporting the analysis, copying and saving.
Also, notice that options from selecting 'more' are also featured in the 'Tasks' pane on the lower left side of the screen.
Finance BI Pilot UM Analytics – Navigation to Central Developed Objects
UM Analytics - Navigation to Central Developed Objects.docx Page 11 of 14
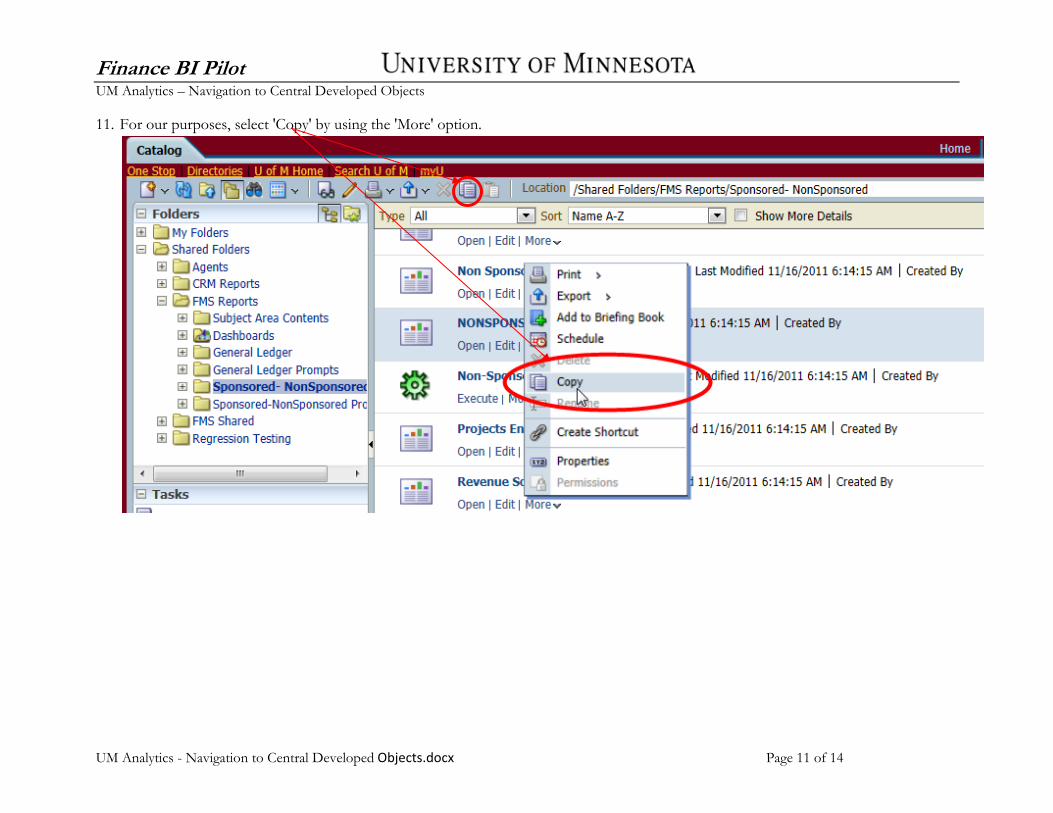
11. For our purposes, select 'Copy' by using the 'More' option.
Finance BI Pilot UM Analytics – Navigation to Central Developed Objects
UM Analytics - Navigation to Central Developed Objects.docx Page 12 of 14
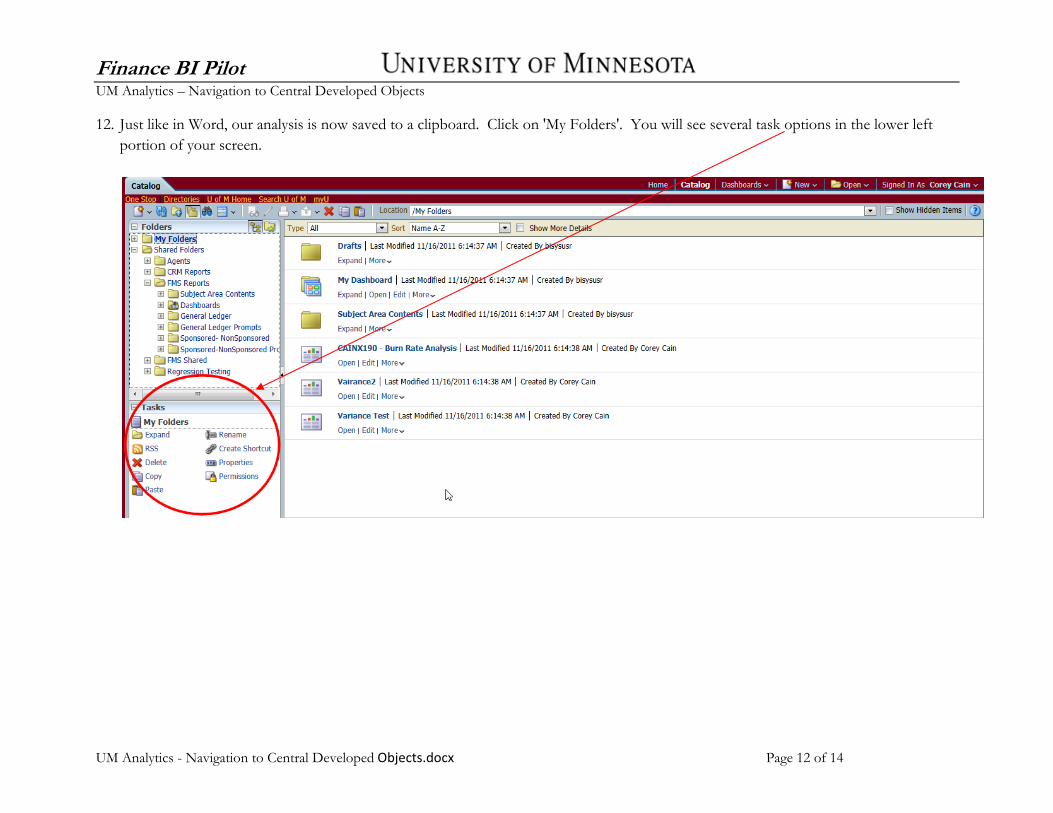
12. Just like in Word, our analysis is now saved to a clipboard. Click on 'My Folders'. You will see several task options in the lower left portion of your screen.
Finance BI Pilot UM Analytics – Navigation to Central Developed Objects
UM Analytics - Navigation to Central Developed Objects.docx Page 13 of 14
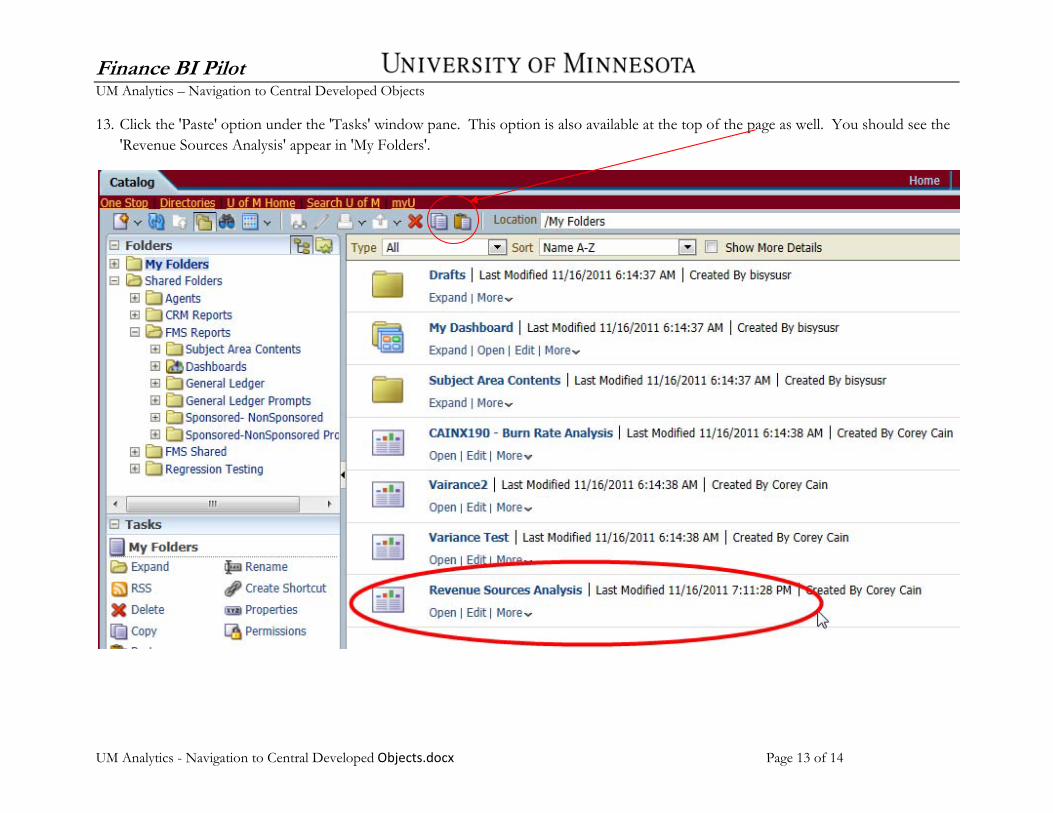
13. Click the 'Paste' option under the 'Tasks' window pane. This option is also available at the top of the page as well. You should see the 'Revenue Sources Analysis' appear in 'My Folders'.
Finance BI Pilot UM Analytics – Navigation to Central Developed Objects
UM Analytics - Navigation to Central Developed Objects.docx Page 14 of 14
14. You are now free to make any edits to the centrally developed analysis. However, any edits you make will not affect the original analysis or its associated dashboard. Those objects are controled by the 'Central' department.


![Leveraging Web Analytics for Automatically Generating Mobile Navigation Models [Mobile Services 2016]](https://img.pdfslide.us/doc/110x75/5885d2431a28ab42028b6c1b/leveraging-web-analytics-for-automatically-generating-mobile-navigation-models.jpg)