Embed Size (px)
Citation preview

Pure & App!. Chem., Vol. 59, No. 10, pp. 1343—1406, 1987.Printed in Great Britain.© 1987 IUPAC
INTERNATIONAL UNION OF PUREAND APPLIED CHEMISTRY
PHYSICAL CHEMISTRY DIVISIONCOMMISSION ON MOLECULAR STRUCTURE
AND SPECTROSCOPY*
A DESCRIPTIVE CLASSIFICATION OFTHE ELECTRON SPECTROSCOPIES
(Recommendations 1987)
Prepared for publication byH. Q. PORTER and D. W. TURNER
Physical Chemistry Laboratory, Oxford University, UK
*Membership of the Commission for varying periods during which the report was prepared(1981—85) was as follows:
Chairman: 1981—83 C.N.R. Rao (India); 1983—85 J. R. Dung (USA); Secretary: 1981—83 J. R.Dung (USA); 1983—85 H. A. Willis (UK); Titular Members: A. M. Bradshaw (FRG); B. G.Derendjaev (USSR); S. Forsen (Sweden); V. A. Koptyug (USSR); C. Sandorfy (Canada);J. F. J. Todd (UK); D. W. Turner (UK); Associate Members: R. D. Brown (Australia); J. G.Grasselli (USA); R. K. Harris (UK); H. Kon (USA); J. P. Maier (Switzerland); Yu N. Molin(USSR); W. B. Person (USA); H. Ratajczak (Poland); C. J. H. Schutte (R. South Africa);M. Tasumi (Japan); National Representatives: R. Cohn (Belgium); Y. Kawano (Brazil);G. Herzberg (Canada); J. Lu (Chinese Chemical Society); Z. Luz (Israel); B. Jezowska-Trzebiatowska (Poland); S. Ng (Malaysia); H. Thompsont (UK).tDeceased
Republication of this report is permitted without the need for formal IUPAC permission on condition that anacknowledgement, with full reference together with IUPAC copyright symbol (© 1987 IUPAC), is printed.Publication of a translation into another language is subject to the additional condition of prior approval from therelevant JUPAC National Adhering Organization.

CONTENTS
INTRODUCTION 1345
I. THE PHOTOELECTRON EMISSION SPECTROSCOPIES 1345
1. Ultraviolet Photoelectron Spectroscopy 1347
2. X—ray Photoelectron Spectroscopy 1348
3. Gamma—ray (or Depth—Selective) Photoelectron Spectroscopy 1350
4. Synchrotron Radiation Photoelectron Spectroscopy 1351
5. Imaging Photoelectron Spectroscopy 13606. Photoelectron Diffraction 1363
II. THE ELECTRON IMPACT SPECTROSCOPIES 1365
A. The Electron Scattering Spectroscopies 1365
1. High Resolution Electron Energy Loss Spectroscopy 1365
2. Electron Energy Loss Spectroscopy 1367
3. High Energy Electron Loss Spectroscopy 1368
4. Ionization Spectroscopy 1369
5. Electron Transmission Spectroscopy 1371
B. The Electron—induced Photon Emission Spectroscopies 1372
1. Inverse Photoemission Spectroscopy 1372
2. Bremsstrahlung Isochromat Spectroscopy 1374
3. Momentum—resolved Bremsstrahlung Spectroscopy 1375
III. THE APPEARANCE POTENTIAL SPECTROSCOPIES 1377
1. Soft X—ray Appearance Potential Spectroscopy 1377
2. Auger—Electron Appearance Potential Spectroscopy 1378
3. Disappearance Potential Spectroscopy 13804. Total (or Target) Current Spectroscopy 1381
5. X—ray Excited Electron Appearance Potential Spectroscopy 13826. Extended (Electron) Appearance Potential Fine—Structure Analysis 13837. Inelastic Electron Tunneling Spectroscopy 1384
IV. THE AUGER ELECTRON SPECTROSCOPIES 1385
1. Electron—excited Auger Electron Spectroscopy 1386
2. Angle—resolved Auger Electron Spectroscopy 1388
3. Spin—polarized Auger Electron Spectroscopy 13894. Ion—excited Auger Electron Spectroscopy 1390
5. Nuclear Auger Electron Spectroscopy 1391
6. X—ray—excited Auger Electron Spectroscopy 1392
V. THE ELECTRON COINCIDENCE SPECTROSCOPIES 1394
VI. THE HEAVY—PARTICLE—INDUCED ELECTRON SPECTROSCOPIES 1395
1. Ion Neutralization Spectroscopy 13962. Excited—atom Deexcitation Spectroscopy Using Incident Ions 13983. Resonance Ionization Spectroscopy 1399
4. Penning Ionization Spectroscopy 1399
VII. FIELD EMISSION ELECTRON SPECTROSCOPY 1400
1. Field Emission Energy Distribution Spectroscopy 1401
VIII.THERNIONIC EMISSION ELECTRON SPECTROSCOPY 1402
INDEX OF SPECTROSCOPIES AND ACRONYMS 1402
1344

A descriptive classification of the electronspectroscopies (Recommendations 1987)
Abstract - The publication supplements an earlier IUPAC publication onelectron spectroscopy and is intended to provide a source of reference forthose interested in discovering the extent to which one or other of theelectron spectroscopies might be of value in a particular area of work.The criterion for inclusion is principally that the use of an energyanalyser or monochromator passing selected energies of electrons forms anessential part of the experiment. The different methods are groupedaccording to the underlying physical process which is involved. Eachsection is described in detail with all of the sub-divisions which couldbe discerned as distinctly separate according to the experimental featureswhich are seen to be dominant.
INTRODUCTION
This publication supplements an earlier IUPAC publication on electron spectroscopy and isintended to provide a source of reference for those interested in discovering the extent towhich one or other of the electron spectroscopies might be of value in a particular area ofwork. It has special relevance, however, for those interested in applying electron spec-troscopy to structural studies in molecule chemistry and to analytical and structuralstudies of surfaces.
The criterion for inclusion is principally that the use of an energy analyser or mono-chromator passing selected energies of electrons forms an essential part of the experiment.The different methods can be grouped according to the underlying physical process which isinvolved. Each section is described in detail with all of the sub-divisions which could bediscerned as distinctly separate according to the experimental features which were seen tobe dominant. This coverage is complete up to January 1983.
In general each sub-division is accompanied by one or more references to leading reviewarticles. In some cases, however, where only a few experiments have been reported in aparticular area there may well be only one or two original papers to refer to.
In many cases the technique is essentially the same whether the area of work relates toisolated atoms or molecules in the gas phase or to the condensed phases, solid or liquid.Because electrons are weakly penetrating through matter the electron spectroscopies haveparticular value for the study of surfaces.
For consistency, all energies, whether for free electrons or photons or for excitationlevels of atoms, molecules or surfaces, are expressed in electron volts. (1 eV 1.60219 xl0-' J).
I. THE PHOTOELECTRON EMISSION SPECTROSCOPIES
Photoelectron emission from isolated atoms or molecules in the gas phase is predominantly adirect one-electron emission into the continuum and the electron energy spectrum maps theinitially occupied energy levels. Solid state photoemission is a more complex process thanthis. In the solid state the one-step process is replaced by a three-step process.Firstly, the electron is promoted from its initial state in the valence band or core levelsto a final state in the unoccupied conduction band. Then the electron must travel to thesurface and finally escape through the surface potential barrier. Thus, surface photo-electron emission is not a direct mapping of the initial density-of-states function, as inthe gas phase, but rather the final energy distribution represents a convolution of theinitial density-of-states with the density-of-states of the conduction band and someenergy-dependent surface escape function.
Some of the energy may appear in simultaneous excitation (a shake-up process) or evenfurther ionization (a shake-off process) instead of all of the energy of the photon beingemployed in the primary photoionization process. In both of these processes the primaryphotoelectron has less kinetic energy than expected and in the shake-off process an extraelectron appears in the spectrum. The probability of these processes is much less thanthat of primary photoionization.
1345

1346 COMMISSION ON MOLECULAR STRUCTURE AND SPECTROSCOPY
A similar process of particular importance for surface studies is resonant enhancedemission from a chemisorbed molecule. If the photon energy is varied until it is inresonance with a bound state-bound state transition from a core level of the molecule to anunoccupied valence level then the chemisorbed molecule is left in a highly excited neutralstate. This state can then decay by one of three channels:
C a). the promoted electron may escape to the substrate leaving a singly ionizedmolecule behind. This ionized molecule may then decay by Auger process.
( b). the promoted electron may return to the core hole and the excess energy thenionize an occupied valence level. The energy of this electron is exactly that ofan electron excited directly from the occupied valence levels. This is thenobserved as an enhancement of this line in the spectrum.
( c). an electron from the valence level can fill the core hole and another valenceelectron is then emitted. This final singly charged excited state is ashake-up state. As the final states in the above processes are different, thethree possibilities can be separated by recording the energy distributionspectrum.
The chemical shift. The binding energies of core states observed in molecular and insurface photoemission differ slightly for chemically bound states from those observed inthe corresponding free atoms in the gas phase. This binding energy shift is attributed toenvironmental effects and is thus a chemical shift, varying from one substance to another,and between like atoms in the same molecule.
Initial-state fine-structure. Spin-splitting of electronic states occurs in ferromagneticmaterials. This splitting can be investigated by measuring the spin-polarization of thephotoelectrons as a function of angle. This technique is known as Spin-PolarizedAngle-Resolved Photoelectron Spectroscopy (SPARPES).
Secondary Auger electrons. The secondary Auger electron spectrum resulting from primarycore hole creation by photons is considered with the Auger electron spectroscopies (Seebelow).
Final-state effects. In addition to the initial-state effects considered above, final-state effects may also contribute to the observed photoelectron emission: spin-orbitsplitting, electron correlation, electron-electron excitation, interference effects anddiffraction effects. Final-state effects arise when photoexcited electrons are elasticallyscattered by surrounding atomic cores and thus reflect the geometry and environment of thesource atom through diffraction and interference effects of the de Broglie electron waves.Thus, final-state effects are only significant in experiments in which the incident photonenergy is varied.
Interference effects can be observed by monitoring the modulation in the variation of thephotoelectron emission cross-section with photon frequency. These effects are the resultof interference between the outgoing photoelectron wave and the incoming component of thiswave which has been back-scattered from nearest-neighbour atoms. When X-rays are used thiseffect is known as Extended Absorption Fine Structure (EXAFS).
Photoelectron diffraction effects are observed in angle resolved spectra. Azimuthalelectron diffraction is observed at fixed photon energy and fixed polar angle and normalptotoelectron diffraction is observed when the photon energy is varied as some energy-related feature, such as a particular core-ionization, is monitored.
Unlike electron scattering which is non-resonant and in which each electron can be in-volved in several inelastic processes, photon absorption is a resonant process sothe signal-to-background ratio is much improved on similar electron-basedspectroscopies, such as Ionization Spectroscopy and the Auger Spectroscopies, whichare in other respects comparable. This is the main reason why the fixedphoton-frequency photoelectron spectroscopies hold such an important place in surfacescience.
These fixed photon-frequency spectroscopies are Ultraviolet Photoelectron Spectroscopy(UPES), Photoelectron Spectroscopy (XPES), XUV Photoelectron Spectroscopy (XUPS,XUVPES) and Gamma-ray Photoelectron Spectroscopy. Gamma-ray Photoelectron Spectroscopy isin fact a rather specialized technique for studying the elemental composition of a surfaceat depths of up to several hundred nanometres.
The only really effective variable-frequency photon source available, at present, is theelectron synchrotron. Thus, variable photon-frequency photoelectron spectroscopy isusually known as Synchrotron-Radiation Photoelectron Spectroscopy (SRPES).

Classification of the electron spectroscopies (Recommendations 1987) 1347
1.1 Ultraviolet Photoelectron Spectroscopy (UPES)
Ultraviolet photoelectron spectroscopy (UPES, UVPES or PES), unfortunately sometimes knownas photoemission spectroscopy, (see Note a) is also occasionally referred to asPhotoelectron Spectroscopy of the Outer Shell (PESOS).
Experimentally, a fixed frequency resonance light source (10 - 41 eV) and an electronenergy analyzer are required. The most commonly employed light sources are Hydrogen Lya(10.20 eV), Helium I (21.22 eV) and Helium II (40.81 eV). These energies are sufficient toprobe all valence electron levels. The observed energy resolution is limited by theanalyzer resolution in this spectroscopy and not the light source linewidth. An instru-mental energy resolution of 25 - 100 meV is usually adequate for solids, although ifchemisorbed species are to be studied there are advantages in using a resolution comparablewith gas phase work ("40 - 25 meV).
Although, as previously mentioned, the photoelectron energy distribution spectrum ofsurfaces is not a direct mapping of the occupied valence band density of states, it isstill possible to interpret the spectrum in this way. UPES, along with Surface PenningIonization Spectroscopy and Ion Neutralization Spectroscopy, is one of the mostchemically-sensitive surface spectroscopies. It is particularly useful for systems withsurface layers of different chemical composition to the bulk (e.g. oxide layers) or achemisorbed surface layer.
Angle-resolved detection adds a new dimension to this spectroscopy. The photoelectronintensity and its energy dependence are measured as a function of the collection angle withrespect to some fixed axes. This technique is called Angle-resolved UltravioletPhotoelectron Spectroscopy (ARUPS, ARPS), Aqgle-resolved Photoemission Spectroscopy (ARPESor ARP) or Angle-dispersed Electron Spectroscopy (ADES). In contrast UPS without anglediscrimination is sometimes referred to as Angle-Integrated Ultraviolet PhotoelectronSpectroscopy (AIUPS). However, this usage does not always refer to integration over 2itsteradians but often to integration over a considerably more limited range of solid angles.Originally a distinction was drawn between an angle-resolved spectroscopy, in which thephoton source and electron detector are fixed in position and the sample, if solid, isrotated, and angle-dispersed spectroscopy, in which the photon source and sample are fixedin position and the electron detector rotated. This distinction, although meaningful, wasnot strictly applied and has been lost. Most angle-resolved work today involves varyingthe position of the detector and keeping the sample orientation to the photon beam fixed.Angle-resolved studies are particularly important for systems with a high degree of sym-metry.
SUMMARY
NAME: Ultraviolet Photoelectron Spectroscopy
CLASS: Photoelectron Spectroscopies
ACRONYMS: UPES, IJVPES, UPS, UVPS, PES
ALTERNATIVE NAMES: Photoelectron Spectroscopy of the Outer Shell (PESOS)
RELATED TECHNIQUES: (Angle-Integrated) UltravioletPhotoelectron Spectroscopy (AIUPS)Angle-Resolved Ultraviolet Photoelectron
Spectroscopy (ARUPS, ARPES, ARPS, ADES)
INCIDENT: Fixed Energy IN Photons
ENERGY: within the range 4-40 eV
ENERGY RESOLUTION: "SO .001 eV
INCIDENT PHOTON FLUX: High
Note a. The earlier IUPAC report ('Nomenclature and Spectral Presentation in ElectronSpectroscopy resulting from Excitation by Photons: Recommendations 1975' Pure Appl.Chem., 45 (1976) 221-224) notes the possible confusion which this elision from photo-electron to photo- represents since photon emission is so close in appearance and sodifferent in meaning. The use of the term photoemission is therefore discouraged in thiscontext.

1348 COMMISSION ON MOLECULAR STRUCTURE AND SPECTROSCOPY
BEAN DIAMETER: "l mm-1O mm
ANGLE OF INCIDENCE: within the range 0-85° (not critical)
DETECTED: Electrons
ENERGY RANGE: 0 eV to within a few eV of the incident
photon energy
ANALYZER ENERGY RESOLUTION: "0 .010 - 0.1 eV (typical)
ELECTRON CURRENT AT DETECTOR: 4'lO - lo A
ANGLE OF EXIT: Polar and azimuthal angles fixed.Polar angle usually in range 10 - 80°Azimuthal angle not critical
ANGULAR RESOLUTION: not critical in UPSHigh ("3 - 5°) in ARUPS
SPECTRUM:ORDINATE: Photoelectron Count Rate
ABSCISSA: Analyzing Energy (Photoelectron Energy orIonization Energy)
SAMPLE: Atomic and molecular gasesSurface of non-volatile liquids and solutions
Single crystals ) with or without adsorbed
Polycrystalline materials ) layerThin conducting films on metal surfacesSemiconductor surfaces
APPLICATIONS: Valence Structure of Atoms, Molecules, Surfaces andChemisorbed Species
SELECTED REFERENCES:
(i) 'Ultraviolet Photoelectron Spectroscopy'J. W. RabalaisWiley-Interscience, New York, 1976.
(ii) 'Photoemission and the Electronic Properties of Surfaces?B. B. Feuerbacher, B. Fitton, R. F. Willis (editors)Wiley-Interscience, New York, 1978.
(iii) 'Handbook of X-ray and DV Photoelectron Spectroscopy'
D. Briggs (editor)Heyden, London, 1977.
(iv) 'Electron Emission Spectroscopy'W. Dekeyer, L. Fierinans, G. Vanderkelen and J. Vennik (editors)
Reidel, Dordrecht, 1973.
(v) 'Photoelectron Spectroscopy of Solids and their Surfaces'R. H. Williams, G. P. Srivastava, I. T. McGovern
Rep. Prog. Phys., 43 (1980) 1357.
1.2. X-ray Photoelectron Spectroscopy (XPS)
X-ray Photoelectron Spectroscopy (XPS) or Photoemission Spectroscopy (XPES) is also knownas Electron Spectroscopy for Chemical Applications (originally Analysis) (ESCA) or, lessfrequently, as Photoelectron Spectroscopy of the Inner Shell (PESIS). If the photon energyemployed is less than 300 eV the technique is sometimes referred to as Soft-X-ray Photo-electron Spectroscopy (SXPS) . XUV Photoelectron Spectroscopy (where XLJV refers to theextreme vacuum ultraviolTis sometimes used to refer to PES employing a photon source inthe frequency range between the ultraviolet and the X-ray regions.
A fixed-energy X-ray source and an electron energy-analyzer are required. The most commonX-ray anodes are magnesium and aluminium with photon energies of 1254 eV and 1487 eVrespectively. Other anode materials are sometimes employed with energies ranging from 132eV (Yttrium) to 4511 eV (Titanium) and 8048 eV (Copper). Dispersive electron energy

Classification of the electron spectroscopies (Recommendations 1987) 1349
analyzers are usually employed. The resolution of the observed spectrum is limited by thelinewidth of the X-ray source not the analyzer. For this reason X-ray monochromators areoften employed but this can lead to significant reduction in intensity.
The energy resolution of a typical X-ray photoelectron spectrum is "'l eV with high resolu-tion work (HRXPS) requiring an energy resolution of "50 eV. The development of highresolution XPS was the basis for the technique of X-ray Photoelectron Diffraction (XPD,XPED). (See Section 1.6).
Although angle-resolved measurements are not as important in XPES as in UPES or SRPES, theyare useful for discriminating between surface and bulk effects.
The main applications of XPS are based upon its elemental sensitivity, (since the charac-teristic lines of different elements are often widely separated in relation to theirwidths) and in addition the chemical shift information. Materials studied range from gasesto polymer surfaces and Langmuir-Blodgett films.
SUMMARY
NAME: X-ray Photoelectron Spectroscopy
CLASS: Photoelectron Spectroscopies
ACRONYMS: XPS, XPES
ALTERNATIVE NAMES: Electron Spectroscopy for Chemical
Analysis (ESCA)Photoelectron Spectroscopy of Inner Shell (PESIS)
RELATED TECHNIQUES: X-ray High Resolution Photoelectron Spectroscopy(RRXPS)
Angle-Resolved X-ray Photoelectron Spectroscopy(ARXPS)
INCIDENT: Fixed Energy X-ray Photons
ENERGY: within range 1 - 10 keV
ENERGY RESOLUTION: "'0.5 - 1.5 eV (without monochromatisation)"'0.1 - 0.5 eV (monochromatised)
INCIDENT PHOTON FLUX: Low
BEAM DIAMETER: "1 - 3mm
ANGLE OF INCIDENCE: within range 70 - 85° (not critical)
DETECTED: Electrons
ENERGY RANGE: 0 eV to within a few eV of incident photon
energy
ANALYZER ENERGY RESOLUTION: "1 eV (XPS, typical)"'0.1 eV or better (HRXPS,
High Resolution)
ELECTRON CURRENT AT DETECTOR: ,lOl9 - 1015 A
ANGLE OF EXIT: Polar and azimuthal angles fixedPolar angle usually in the range 10 - 80°Azimuthal angle not critical in XPS (but
see Photoelectron Diffraction)
SPECTRUM:ORDINATE: Photoelectron Count Rate
ABSCISSA: Analyzing Energy (Photoelectron Energy orBinding Energy)
SAMPLE: Atomic and molecular gases
Single crystals ) usually without adsorbed
Polycrystalline materials ) layer

1350 COMMISSION ON MOLECULAR STRUCTURE AND SPECTROSCOPY
Thin conducting films; Langmuir-Blodgett filmsSemiconductor surfacesPolymeric and some dielectric materialsSurfaces of some non-volatile liquids and solutions and
some frozen liquids
APPLICATIONS: Elemental Sensitivity and Chemical Shifts
SELECTED REFERENCES:
(i) 'Electron Spectroscopy for Atoms, Molecules and Condensed Matter'
K. SiegbahnRev. Modern Phys., 54 (1982) 709.
(ii) 'Handbook of X-ray and Ultraviolet Photoelectron Spectroscopy'
D. Briggs (editor)Heyden, London, 1977.
(iii) 'Photoelectron and Auger Spectroscopy'T. A. CarlsonPlenum, New York, 1975.
(iv) 'The Investigation of Polymer Surfaces by Means of ESCA'D. T. Clarkin 'Polymer Surfaces'.D. T. Clark and W. J. Feast (editors)Wiley-Interscience, New York, 1978.
1.3. Gamma-ray (or Depth-Selective) Photoelectron Spectrosoopy (DSPES)
This technique is also known as Depth-Selective Photoelectron Spectroscopy (DSPES). It isa rather specialized technique for studying the elemental composition and depth of thinsurface layers from several nanometres to several hundred nanometres.
Photoionization is performed with high energy monochromatic y-radiation, e.g., the 23.8 keVresonance lines of Tm 119.
The experiment is done on a sequence of vacuum evaporated layers on a low y-ray absorbersuch as beryllium. A layer of material is vacuum evaporated onto the substrate and thephotoelectron spectrum recorded. Then a second layer is deposited and the spectrumrecorded again. The difference in the electron count at a given energy then corresponds tothe number of electrons generated in the initial layer which have passed through thecovering layer. (Note that this conclusion requires identical layers). The thickness ofthe layers is calibrated by weighing. The attenuation of the photoelectrons is thenanalyzed in terms of the layer structure. The technique has been applied up to 20 layers(i.e., a thickness of "1 urn). The analysis of the resulting attenuated spectra is anadaptation of the more established technique of Depth-Selective Mossbauer Spectroscopy(DSMS). Mixed layers of different materials may be studied.
SUMMARY
NAME: Gamma-Ray Photoelectron Spectroscopy
CLASS: Photoelectron Spectroscopies
ACRONYMS: None
ALTERNATIVE NAMES: Depth-Selective Photoelectron Spectroscopy (DSPES)
INCIDENT: Fixed Frequency y-Ray Photon
ENERGY: 2.38 x l0 eV (resonance line of Tm 119)
ENERGY RESOLUTION: "l0 eV
DETECTED: Electron
ENERGY RANGE: 100 - 2.38 x l0 eV
ANALYZER ENERGY RESOLUTION: "10 eV (typical)

Classification of the electron spectroscopies (Recommendations 1987) 1351
SPECTRUM:ORDINATE: Photoelectron Count Rate
ABSCISSA: Analyzing Energy (Photoelectron Energy)
SAMPLE: Vacuum evaporated layers (several nanometres thick)sequentially deposited on a metallic substrate. Up to20 layers can be investigated.
APPLICATIONS: Electron Scattering and Surface Effects
SELECTED REFERENCE:
'Depth-Selective Photolectron Spectroscopy as a Method for StudyingThin Layers'
M. Grozdanov, Tsv. Bonchev, G. Georgiev,Bulgarian J. Phys. V, 5 (1978) 443.
1.4. Synchrotron Radiation Photoelectron Spectroscopy (SRPES)
The electron synchrotron is a wide energy range (X-ray to ultraviolet) ellipti-cally-polarized continuous radiation source. Several distinct techniques are ofsignificance:
(a). Energy Distribution Spectroscopy
(b). Total Photoelectron Yield Spectroscopy
(c). Partial Photoelectron Yield Spectroscopy
(d). Constant-Initial-State Photoelectron Spectroscopy
(e). Constant-Final-State Photoelectron Spectroscopy
(f). Angle-Resolved Synchrotron-Radiation Photoelectron Spectroscopy
(g). Resonance-Enhanced Photoelectron Spectroscopy
(h). Extended X-ray Absorption-Fine-Structure
(a). Energy distribution spectroscopy (EDS). This is the classical fixed energyphotoelectron spectroscopy with a continuous choice of excitation. Particularly useful isthe ability to work in the extreme vacuum ultraviolet region (450 - 200 eV) where no con-venient line sources are available. The technique is sometimes called Energy DistributionCurve Spectroscopy (EDCS). The major application of this spectroscopy is to differentiatebetween surface and bulk features in the energy distribution spectrum by varying thekinetic energy of the photoelectrons and hence their mean-free-path by changing the photon
energy.
Surface barrier induced states and the orientation of adsorbed molecules can be studied byvarying the direction of incident s- and p-polarized radiation with respect to the plane ofincidence. When combined with angle-resolved detection, (ARUPS), details of the symmetryof these surface features can be elucidated.
Magnetized ferromagnetic materials have been shown to emit preferentially electrons ofspecific spin polarization. This is proving to be a very powerful technique for the studyof the d-electron valence band. The combination of this Synchrotron-ARUPS technique withSpin-polarized Inverse Photoemission Spectroscopy (SPIPES) is particularly useful as itpermits the density of states of both the occupied and unoccupied parts of the valence bandto be measured.
Energy Distribution Spectroscopy can also be used to measure the variation with energy ofthe optical matrix elements.
SUMMARY
NAME: Energy Distribution Curve Spectroscopy

1352 COMMISSION ON MOLECULAR STRUCTURE AND SPECTROSCOPY
CLASS: Synchrotron-Radiation Photoelectron Spectroscopies
ACRONYMS: EDCS, EDS
INCIDENT: Photons of Fixed Selected Energy
ENERGY: within range 10 - 1000 eV (but a photon energyin the XLJV (50 - 200 eV) is often chosen)
ENERGY RESOLUTION: '0.0Ol - 0.3 eV (monochromatised,resolution depends on photon energy)
INCIDENT PHOTON FLUX: Medium to low (depending on photon
energy)
ANGLE OF INCIDENCE: within range 0 - 90° (not critical)
DETECTED: Electrons
ENERGY RANGE: 0 eV to within a few eV of incident photon
energy
ANALYZER ENERGY RESOLUTION: '0.025 - 0.1 eV
ELECTRON CURRENT AT DETECTOR: "4o19 - l0 A
ANGLE OF EXIT: Polar and Azimuthal angles fixedHigh angular discrimination in angular-
resolved experiments (ARUPS, ADES, ARXPS)Polar: 0 - 90° Azimuthal: 0 - 360°
SPECTRUM:
ORDINATE: Photoelectron Count Rate
ABSCISSA: Analyzing Energy (Photoelectron Energy)
SAMPLE: Atomic and molecular gases
Single crystals ) with or without adsorbed
Polycrystalline materials ) layerThin conducting filmsSemiconductor surfaces
SELECTED REFERENCES:
(i) 'Photoemission and the Electronic Properties of Surfaces'B. Feuerbacher, B. Fitton, R. F. Willis (editors)Wiley-Interscience, New York, 1978.
(ii) 'Photoemission Spectroscopy'B. Feuerbacher, B. Fittonin 'Electron Spectroscopy for Surface Analysis'H. Ibach (editor)Topics in Current Physics, Volume 4, Springer-Verlag, 1977.
(iii) 'Synchrotron Radiation: Overview'C. Kunzin 'Photoemission in Solids II',L. Ley and M. Cardona (editors)
Topics in Applied Physics, Volume 27, Springer-Verlag, 1979.
(b). Total yield spectroscopy or photoelectron yield spectroscopy. This is sometimes re-ferred to as Photoemission Yield Spectroscopy (PEYS) and is the measurement of all photo-electrons emitted at a particular photon energy as a function of that photon energy. Notethat if surface states or adsorbates are present they also contribute an absorptioncoefficient to the total yield. There are three contributions to the total photoelectronyield: primary photoionization, Auger electrons and direct recombination (autoionization)electrons. Structure in the yield curve is directly attributable to the absorptioncoefficients for each ionization process with some sharp features due to core excitonstates, arising from a promoted electron being confined to the vicinity of the core hole byCoulomb coupling with the hole.

Classification of the electron spectroscopies (Recommendations 1987) 1353
The total yield can also be recorded as a function of the light polarization angle. Thisis a measure of the vectorial photoeffect.
However, no electron energy analysis is involved.
SUMMARY
NAME: Total Yield Photoelectron Spectroscopy
CLASS: Synchrotron-Radiation Photoelectron Spectroscopies
ACRONYM: PEYS
INCIDENT: Variable Energy Photons
ENERGY RANGE: a scanned range of 10 - 100 eV within theoverall range 10 - 1000 eV
ENERGY RESOLUTION: "0.001 - 0.3 eV (monochromatised,
resolution depends on photon energy)
INCIDENT PHOTON FLUX: Medium to low (depending on photon
energy)
ANGLE OF INCIDENCE: within range 0 - 900 (not critical)
DETECTED: Electrons
ENERGY RANGE: 0 eV to within a few eV of incident photon
energy
ANALYZER ENERGY RESOLUTION: Not applicable. All electronenergies are collected
ELECTRON CURRENT AT DETECTOR: ,'l0l9 - lO A
ANGLE OF EXIT: A fixed angle is chosen (not critical)Angle-resolved experiments are not relevant
SPECTRUM:ORDINATE: Photoelectron Count Rate (Photoelectron Yield)
ABSCISSA: Photon Energy
SAMPLE: Atomic and molecular gasesPolycrystalline materialsThin conducting filmsAdsorbed layers on metal substrates
SELECTED REFERENCE:
'Surface Electronic States on NaCl (100) studied with Polarization-Dependent Photoelectron Yield Spectroscopy'U. Rehder, W. Gudat, R. G. Hayes, C. KunzProceedings 7th International Vacuum Congress and 3rd InternationalConference on Solid Surfaces (Vienna, 1977) p. 453.
(c). Partial yield spectroscopy. The surface sensitivity of the yield spectrum can bevaried by selecting those scattered photoelectrons which are within a certain energyinterval at emission. This is the partial Note that a confusion arises in the useof PYS for Partial Yield Spectroscopy as some workers use these initials for PhotoelectronYield Spectroscopy. If electrons with an energy distribution independent of the photonenergy are selected then the partial yield is proportional to total yield. Thismeasurement has no particular advantage over Total Yield Spectroscopy. If however highkinetic energy electrons whose energy distribution is dependent upon the photon energy areselected, their mean free path and hence escape depth are reduced as photon energy isincreased and so the influence of surface effects on the yield are enhanced. This isPartial Yield Spectroscopy or Partial Photoyield Spectroscopy. This spectroscopy is

1354 COMMISSION ON MOLECULAR STRUCTURE AND SPECTROSCOpy
similar to Constant-Final-State Synchrotron Spectroscopy but in that technique the aim isto investigate the primary excitation electrons not the energy-dependent yield. Closelyrelated to the photoelectron partial yield spectroscopy is Auger-Electron Partial YieldSpectroscopy (APYS) in which the yield from a particular Auger process is monitored as the
primary photon energy is varied.
SUMMARY
NAME: Partial Yield Photoelectron Spectroscopy
CLASS: Synchrotron-Radiation Photoelectron Spectros copies
ACRONYM: PYS
ALTERNATIVE NAME: Partial Photoyield Spectroscopy
INCIDENT: Variable Energy Photons
ENERGY RANGE: a scanned range of 10 - 100 eV within theoverall range 10 - 1000 eV. The scannedrange usually commences at the thresholdfor the process selected.
ENERGY RESOLUTION: "0.001 - 0.3 eV (monochromatised,resolution depends on photon energy)
INCIDENT PHOTON FLUX: Medium to low (depending on photon
energy)
ANGLE OF INCIDENCE: within range 0 - 900 (not critical)
DETECTED: Electrons
ENERGY: Only electrons within a selected energy window arecollected
ANALYZER ENERGY RESOLUTION: "0.025 - 0.1 eV (Energy Window)
ELECTRON CURRENT AT DETECTOR: ,l0l9 - 1014 A
SPECTRUM:ORDINATE: Photoelectron Count Rate (Partial Yield)
ABSCISSA: Photon Energy
SAMPLE: Single crystalsPolycrystalline materialsAdsorbed layers on metal substratesSemiconductor surfaces
SELECTED REFERENCES:
(i) 'Photoemission and the Electronic Properties of Surfaces'B. Feuerbacher, B. Fitton, R. F. Willis (editors)Wiley-Interscience, New York, 1978.
(ii) 'Photoemission Spectroscopy'B. Feuerbacher, B. Fittonin 'Electron Spectroscopy for Surface Analysis',H. Ibach (editor)Topics in Current Physics, Volume 4, Springer-Verlag, 1977.
(iii) 'Synchrotron Radiation: Overview'C. Kunzin 'Photoemission in Solids II'L. Ley and M. Cardona (editors)
Topics in Applied Physics, Volume 27, Springer-Verlag, 1979.
(iv) 'Partial Photoyield Study of Adsorbate-Substrate Interactions: 0 on Al'R. Z. Bachrach, A. Bianconi, S. A. FlodstromProceedings 7th International Vacuum Congress and 3rd InternationalConference on Solid Surfaces (Vienna, 1977) p. 1205.

Classification of the electron spectrOscoPies (Recommendations 1987) 1355
(d,e). Constant-Initial-State Spectroscopy (CISS), Constant-Final-State Spectroscopy(CFSS). (Strictly CIS-UPS and CFS-UPS). In discussing Constant-Initial-State and-Final-State Spectroscopies it may be helpful to stress that the initial state is the stateof the electron in the surface before irradiation and the final state is the unoccupiedstate in the conduction band to which the electron is promoted by the photon. This is thefirst stage of the photoelectron emission process previously described. Confusion arisesif the final state is taken to be the continuum state of the photoemitted electron. BothCISS and CFSS involve photon energies in the vacuum IN range 10 - 50 eV.
(d). Constant-initial-state Spectroscopy (CISS). In this technique the energy distributionspectrum of electrons from a specified level in the valence band (i.e., the constantinitial state) is recorded as the incident photon energy is scanned. To achieve thisexperimentally, the energy difference between the energy analyzer and the incident photonsis kept fixed as the photon energy is scanned. Thus, in effect, the initial state of thephotoelectrons is fixed while the final state is scanned. The CIS spectrum is thus amapping of the final states, i.e., the density of unoccupied states.
SUMMARY
NAME: Constant-Initial-State Photoelectron Spectroscopy
CLASS: Synchrotron-Radiation Photoelectron Spectroscopies
ACRONYMS: CISS, CIS-UPS
INCIDENT: Variable Energy Photons
ENERGY RANGE: a scanned range of "P5 - 20 eV within theoverall range 10 - 50 eV. The extent of thescanned range is fixed by the final statesand its position in the overall range isdecided by the selected initial state.
ENERGY RESOLUTION: "0.001 - 0.3 eV (monochromatised,resolution depends on photon energy)
INCIDENT PHOTON FLUX: Medium to low (depending on photon
energy)
ANGLE OF INCIDENCE: within range 0 - 900 (not critical)
DETECTED: Electrons
ENERGY: The energy difference between the photon energy andthe energy analyzer is kept constant. This energydifference corresponds to the energy gap between theselected initial state (in the valence band) and thelowest unoccupied energy level - the final state.
ANALYZER ENERGY RESOLUTION: "'0.025 - 0.1 eV (Energy Window)
ELECTRON CURRENT AT DETECTOR: \,lOl9 - 1014 A
SPECTRUM:
ORDINATE: Photoelectron Count Rate (Partial Yield)
ABSCISSA: Photon Energy
or
Photon Energy + Energy Difference(i.e., The FINAL STATE)
SAMPLE: Single crystals with or without adsorbed layer

1356 COMMISSION ON MOLECULAR STRUCTURE AND SPECTROSCOPY
SELECTED REFERENCES:
(i) 'Photoemission and the Electronic Properties of Surfaces?B. Feuerbacher, B. Fitton, R. F. Willis (editors)Wiley-Interscience, New York, 1978.
(ii) 'Photoemission Spectroscopy'B. Feuerbacher, B. Fittonin 'Electron Spectroscopy for Surface Analysis'H. Ibach (editor)Topics in Current Physics, Volume 4, Springer-Verlag, 1977.
(iii) 'Synchrotron Radiation: Overview'C. Kunzin 'Photoemission in Solids II',L. Ley and N. Cardona (editors)
Topics in Applied Physics, Volume 27, Springer-Verlag, 1979.
(e). Constant-final-state-spectroscopy (CFSS). In this technique the energy distributionspectrum of electrons from any initial valence band level which have been promoted to aspecified conduction band level (i.e., final state) is recorded as a function of theincident photon energy. In other words, the occupied initial states are scanned into aconstant final state. To achieve this experimentally the electron energy analyzer is heldat a fixed energy as the photon energy is scanned. The spectra obtained resemble theenergy distribution spectra obtained by scanning the analyzer energy at a fixed photonenergy. However the weighting of the features in the spectrum is different as the matrixelements are different. The CFS spectrum is a mapping of the initial states, i.e., thedensity of occupied states.
SuMMARY
NAME: Constant-Final-State Photoelectron Spectroscopy
CLASS: Synchrotron-Radiation Photoelectron Spectroscopies
ACRONYMS: CFSS, CFS-UPS
INCIDENT: Variable Energy Photons
ENERGY RANGE: a scanned range of "5 - 20 eV within theoverall range 10 - 50 eV. The extent of thescanned range is fixed by the extent of theoccupied levels of the valence band (theInitial States)
ENERGY RESOLUTION: "'0.001 - 0.3 eV (monochromatised,resolution depends on photon energy)
INCIDENT PHOTON FLUX: Medium to low (depending on photon
energy)
ANGLE OF INCIDENCE: within range 0 - 90° (not critical)
DETECTED: Electrons
ENERGY: The energy analyzer is held at a fixed energy(i.e., the Final State)
ANALYZER ENERGY RESOLUTION: "O.O25 - 0.1 eV (Energy Window)
ELECTRON CURRENT AT DETECTOR: vl0l9 - 1014 A
SPECTRUM:
ORDINATE: Photoelectron Count Rate (Partial Yield)
ABSCISSA: Photon Energy (i.e., the INITIAL STATE)

Classification of the electron spectroscopies (Recommendations 1987) 1357
SAMPLE: Single crystals with or without adsorbed layer
SELECTED REFERENCES:
(i) 'Photoemission and the Electronic Properties of Surfaces'B. Feuerbacher, B. Fitton, R. F. Willis (editors)
Wiley-Interscience, New York, 1978.
(ii) 'Photoemission Spectroscopy'B. Feuerbacher, B. Fittonin 'Electron Spectroscopy for Surface Analysis',H. Ibach (editor)
Topics in Current Physics, Volume 4, Springer-Verlag, 1977.
(iii) 'Synchrotron Radiation: Overview'C. Kunzin 'Photoemission in Solids II',L. Ley and M. Cardona (editors)
Topics in Applied Physics, Volume 27, Springer-Verlag, 1979.
(f). Angle-resolved synchrotron-radiation photoelectron spectroscopy (ARUPS and ARXPS).There are two techniques for recording angle-resolved spectra. Firstly, the energy dis-tribution spectrum may be recorded at fixed values of emission angle as the photon energyis scanned. Secondly, the energy window of the energy analyzer is fixed on some feature ofinterest and the polar or azimuthal angle is varied. ARUPS refers to angle-resolvedemission from the valence band and ARXPS to emission from core levels particularly in the
soft X-ray region.
SUMMARY
NAME: Angle-Resolved (Synchrotron-Radiation) Photoelectron Spectroscopy
CLASS: Synchrotron-Radiation Photoelectron Spectroscopies
ACRONYMS: ARUPS, ARPES, ARXPS
ALTERNATIVE NAME: Angle-Resolved Photoemission (ARP)
INCIDENT: Fixed Energy Photons
ENERGY: within range 10 - 1000 eV (elliptically polarized)
ENERGY RESOLUTION: O.OOl - 0.3 eV (monochromatised,
resolution depends on photon energy)
INCIDENT PHOTON FLUX: Medium to low
ANGLE OF INCIDENCE: Polar angle within range 0 - 900(not usually critical)Azimuthal angle not critical
DETECTED: Photoelectrons
ENERGY RANGE: 0 eV to within a few eV of incident photon
energy
ANALYZER ENERGY RESOLUTION: 0.l - 0.025 eV
ELECTRON CURRENT AT DETECTOR: ',io19 - l0l A
ANGLE OF EXIT: either azimuthal angle fixed and polar anglevaried (most common) or vice versa (seePhotoelectron Diffraction)
ANGULAR RESOLUTION: High (<50)

1358 COMMISSION ON MOLECULAR STRUCTURE AND SPECTRO5COPY
SPECTRUM:
ORDINATE: Photoelectron Current at stated polar (or
azimuthal) angle
ABSCISSA: Photoelectron Energy (above Fermi Level)
SAMPLE: Atomic and molecular gasesDefined faces of single crystalsChemisorbed layer
APPLICATIONS: Electronic structure of atoms and moleculesIdentification of surface states from bulk statesSymmetry of states
SELECTED REFERENCES:
(i) 'Angle-Resolved Photoemission as a Tool for the Study of Surfaces'E. W. Plummer and W. Eberhardtin Advances in Chemical Physics, Volume XLIX,I. Prigogine and S. A. RiceJohn Wiley & Sons, New York, 1982.
(ii) 'Angular Dependent Photoemission'N. V. Smithin 'Photoemission in Solids I'H. Cardona and L. Ley (editors)
Topics in Applied Physics, Volume 26, Springer-Verlag, 1978.
(g). Resonance-enhanced photoelectron spectroscopy. The mechanism of this process hasalready been discussed. Once the resonant frequency has been found, the photon energy isfixed and the energy distribution spectrum is recorded. This is a particularly powerfultechnique for investigating the nature of the adsorbate bond. Resonant processes are alsoobserved in clean crystal surfaces.
SUMMARY
NAME: Resonance-Enhanced Photoelectron Spectroscopy
CLASS: Synchrotron-Radiation Photoelectron Spectros copies
ACRONYM: None
ALTERNATIVE NAME: Resonant Photoelectron Spectroscopy
INCIDENT: Fixed Energy Photons
ENERGY: photon energy is varied until it is resonant witha bound state - bound state transition from a corelevel to an unoccupied valence level of a chemisorbedmolecule. The photon energy is then fixed. Photonenergies are usually in the range 0 - 20 eV.
ENERGY RESOLUTION: "0.001 - 0.3 eV (monochromatised,resolution depends on photon energy)
INCIDENT PHOTON FLUX: Medium to low (depending on photon
energy)
ANGLE OF INCIDENCE: Within range 0 - 900 (not critical)
DETECTED: Electrons
ENERGY RANGE: 0 eV to within a few eV of the incident
photon energy
ANALYZER ENERGY RESOLUTION: "0.025 - 0.05 eV
ANGLE OF EXIT: Fixed. Value not critical.
ELECTRON CURRENT AT DETECTOR: ,iol5 - l0 A

Classification of the electron spectroscopies (Recommendations 1987) 1359
SPECTRUN:
OR]IINATE: Photoelectron Count Rate (showing enhancedresonance lines)
ABSCISSA: Analyzing Energy (Photoelectron Energy)
SANPLE: Single crystals with/without a chemisorbed monolayer
SELECTED REFERENCES:
(i) 'Observation of Resonant Photoemission in an Adsorbed Molecule'G. Loubriel, T. Gustafsson, L. I. Johansson and S. J. OhPhys. Rev. Lett., 49 (1982) 571.
(ii) 'Surface 4d-4f Photon Absorption and Surface Mixed Valence in Sn Metal'J. w. Allen, L. I. Johansson, R. S. Bauer, I. Lindau and S.B.M. HagstromPhys. Rev. Lett., 41 (1978) 1499.
(iii) 'Two-Electron Resonance at the 3p Threshold of Cu and Ni'M. Iwan, F. J. Himpsel, D. E. EastmanPhys. Rev. Lett., 43 (1979) 1829.
(h). Extended X-ray absorption-fine-structure (EXAFS, SEXAFS). The mechanism of theprocess leading to this fine structure has already been discussed (see Note b.). Thesefinal state interference effects can be observed in several ways. One can measure theX-ray absorption transmission coefficient, the fluorescent X-ray yield, the Auger electronyield or the yield of a selected range of the inelastically scattered electrons as afunction of the photon energy in the X-ray region. EXAFS-like effects (i.e., final stateinterference structure) are also observed in elastic electron scattering, appearancepotential spectroscopy, electron energy loss spectroscopy and angle-resolved ultravioletphotoelectron spectroscopy. The techniques of relevance to electron spectroscopy are Augeryield analysis, known as Surface Extended Absorption-Fine-Structure (SEXAFS) andInelastic Electron yield analysis, known as Partial Yield EXAFS. The fine-structureextended to several hundred electron volts above the threshold for the process. Mostpartial Yield EXAFS and SEXAFS (Auger Partial Yield EXAFS) studies are performed on thestructure (oscillations with a period of about 30 eV) starting at '5O eV above threshold.Some work has been done on the X-ray Absorption Near-Edge Structure (XANES) and fine-structure (NEXAFS) using photoelectron spectroscopy (< 50 eV from threshold) but directX-ray absorption is more satisfactory in this region.
Closely related to EXAFS and SEXAFS is Angle-Resolved Photoemission or PhotoelectronExtended-Fine-Structure (ARPEFS) from adsorbate core levels. This angle-resolved structurecan be Fourier Transformed to give the differences in path-length between the primary(unscattered) photoelectron wave and the substrate-atom-scattered photoelectron wave.Comparison of this data with model calculations gives both the distance and vectordirection from the selected atom to nearby substrate atoms.
EXAFS studies are a probe of the local structure and symmetry of the surface. Thus un-like X-ray diffraction (XRD) or Low Energy Electron Diffraction (LEED), EXAPS can beapplied to systems which have local structure but not necessarily long range structure,such as non-crystalline materials. In particular, bond lengths and local symmetry may bemeasured.
SUMMARY
NAME: Surface Extended X-ray Absorption-Fine-Structure
CLASS: Synchrotron-Radiation Photoelectron Spectroscopies
ACRONYMS: SEXAFS, Surface EXAFS
ALTERNATIVE NAME: Auger Partial Yield EXAFS
Note b. Note that '5' in EXAFS does not denote 'spectroscopy' and that, in con-
sequence, usage which implies 'spectroscopy', e.g., Partial-Yield EXAFS, is inappropriate.

1360 COMMISSION ON MOLECULAR STRUCTURE AND SPECTROSCOPY
RELATED TECHNIQUE: Angle-Resolved Photoemission or PhotoelectronExtended-Fine-Structure (ARPEFS)
INCIDENT: Variable Energy Photons
ENERGY RANGE: a scanned range of 50 - several hundred eVwithin the overall range 50 - 2000 eV. Thescanned range usually commences about 50 eVabove the threshold for the selected Auger
process.
ENERGY RESOLUTION: "0.001 - 0.3 eV (monochromatised,resolution depends on photon energy)
INCIDENT PHOTON FLUX: Medium to low (depending on photon
energy)
ANGLE OF INCIDENCE: not critical
DETECTED: Auger Electrons
ENERGY: fixed at the energy of the electrons from the
selected Auger process
ANALYZER ENERGY RESOLUTION: '0.l - 0.5 eV (Energy Window)
ELECTRON CURRENT AT DETECTOR: 'l0l9 - 1014 A
SPECTRUM:
ORDINATE: Auger Electron Count Rate (Auger Partial Yield)
ABSCISSA: Photon Energy
SAMPLE: Single crystals ) with or without chemisorbed
Polycrystalline materials ) monolayersPolymeric and glassy materials
SELECTED REFERENCES:
(i) 'Developments in Extended X-ray Absorption Fine Structure Applied to
Chemical Systems'D. R. Sandstrom and F. W. LytleAnn. Rev. Phys. Chem., 30 (1979) 215.
(ii) 'EXAFS, Determination of Short Range Order and Local Structures inMaterials?D. C. Koningsberger and R. PrinsTrends Anal. Chem., 1 (1981) 16.
(iii) 'Direct Surface Structure Determination with Photoelectrons'J. J. Barton, C. C. Bahr, Z. Hussain, S. W. Robey, J. G. Tobin,L. E. Klebanoff and D. A. ShirleyPhys. Rev. Lett., 51 (1983) 272-275.
1.5. Imaging Photoelectron Spectroscopy (SESCA or PESM types)
Two techniques have been reported which permit both the energy analysis (spectroscopy) andspatial analysis (microscopy) of the photoelectrons emitted by a surface. In ScanningElectron Spectroscopy for Chemical Analysis (SESCA) a thin film or slice of specimen ismounted on a thin aluminum foil. An electron beam is then scanned over the back of the
foil producing X-rays which pass through the specimen liberating photoelectrons.
In Photoelectron Spectromicroscopy (PESM), on the other hand, no scanning or focussingelements are involved. The whole surface is irradiated from the front and the electron
emission mapped by a divergent axially symmetric magnetic field. Both X-ray andultraviolet radiation can be used in PESM.
(a). Scanning electron spectroscopy for chemical analysis (SESCA). The electron gunprovides a primary electron beam of high energy ("10 keV) and current (< 3 x 10 A) whichis focussed to a spot (< 0.5 pm diameter) and scanned across the aluminum foil by electro-

Classification of the electron spectroscopies (Recommendations 1987) 1361
static deflection. The emitted photoelectrons are collected and energy analyzed by a highresolution double pass cylindrical mirror analyzer. The lateral resolution is limited bythe foil thickness (about 2 pm) to approximately 15 pm.
SUMMARY
NAME: Scanning Electron Spectroscopy for Chemical Analysis
CLASS: Imaging Photoelectron Spectroscopies
ACRONYM: SESCA
INCIDENT: Fixed Energy Electrons
ENERGY: fixed within range 0.1 - 10 keV
ENERGY RESOLUTION: not critical
INCIDENT ELECTRON CURRENT: 3 x lO - 1 x 10¹⁰ A
BEAM DIAMETER: less than 0.5 x lO6 m
ANGLE OF INCIDENCE: electron beam is scanned acrossaluminum foil
DETECTED: Photoelectrons
ENERGY RANGE: 0 eV to within a few eV of the X-ray photon
energy
ANALYZER ENERGY RESOLUTION: "0.05 - 0.5 eV
ELECTRON CURRENT AT DETECTOR: ,lOl6 - 1019 A
ANGLE OF EXIT: normal to surface
SPECTRUM:
ORDINATE: Photoelectron Current
ABSCISSA: Photoelectron Energy (Binding Energy)
SAMPLE: Thin sections of materials (which may be insulating) onthin aluminum foils ("2 - 6 pm)
APPLICATIONS: Microscopy and imaging
SELECTED REFERENCES:
(i) 'Microanalyse et Microscopie Photolectroniques: X-Principe etPerformances Prvisibles'J. CasauxRev. Phys. Appl., 10 (1975) 263.
(ii) 'SESCA: Scanning Electron Spectroscopy for Chemical AnalysisC. T. }lovland
Proceedings 7th International Vacuum Congress and 3rd InternationalConference on Solid Surfaces (Vienna, 1977) p. 2363.
(b). Photoelectron spectromicroscopy (PESM). The whole surface is irradiated with eitherultraviolet radiation, soft X-ray radiation, slow metastable atoms or fast atoms. As theemitted photoelectrons travel along the divergent magnetic field lines the conservation ofangular momentum (or, more precisely, the conservation of orbital moment) causes thetransverse component of the electron's linear momentum to become axial so that when theelectron is energy analyzed all the electron's momentum is in the forward (axial)direction. Retarding field energy analysis can be performed with a retarding grid andtrochoidal energy analysis with a crossed electric field. The electrons are detectedby an electron multiplier or phosphor screen. The lateral resolution is determined by theelectron energy and the magnetic field strength and can reach 0.1 pm.

1362 COMMISSION ON MOLECULAR STRUCTURE AND SPECTROSCOPY
With soft X-rays as image generators elemental mapping can be perfomed and with ultravioletradiation molecular information maps can be produced by analysis of the valence photo-electron spectrum, (i.e., molecular or chemical mapping).
SUMMARY
NAME: Photoelectron Spectromicroscopy
CLASS: Imaging Photoelectron Spectroscopies
ACRONYM: PESM
INCIDENT: Fixed Energy Photons
ENERGY: fixed within range 4 eV - 10 keV
ENERGY RESOLUTION: "O.OOl eV (at "l eV energy) to "l.5 eV
(at 1487 eV)
INCIDENT PHOTON FLUX: High (at 20 eV energy) to low (above100 eV)
BEAM DIAMETER: 1 - 5 mm
ANGLE OF INCIDENCE: from grazing to 4,800
(not critical)
MAGNETIC FIELD STRENGTH: 1 - 7 tesla
DETECTED: Photoelectrons
ENERGY RANGE: 0 eV to within a few eV of incident photon
energy
ANALYZER ENERGY RESOLUTION: O.Ol5 - 0.1 eV
ELECTRON CURRENT AT DETECTOR: can be as high as 108 A
ANGLE OF EXIT: almost all angles of exit are collected andcollimated by magnetic field
SPECTRUM:
ORDINATE: Photoelectron Current
ABSCISSA: Photoelectron Energy
This is an angle-integrated photoelectron spectrum
SAMPLE: Polycrystalline materialsConducting filmsSemiconductor surfaces
APPLICATIONS: Microscopy and imaging, particularly of radiation sensitivematerials
SELECTED REFERENCES:
(i) Spectromicroscopy'G. Beamson, H. Q. Porter and D. W. TurnerNature, 290 (1981) 556.
(ii) 'Soft X-rays and Fast Atoms as Image Generators in Photoelectron
Microscopy'I. R. Plummer, H. Q. Porter, D. W. Turner, A. J. Dixon, K. Gehring,and M. KeenleysideNature, 303 (1983) 599-601.
Classification of the electron spectroscopies (Recommendations 1987) 1363
16. Photoelectron Diffraction (PD)
Diffraction effects have been observed in angle-resolved photoelectron spectroscopy. Thisdiffraction structure is very similar to that of Low Energy Electron Diffraction (LEED).The term X-ray Photoelectron Diffraction (XPD) is used for diffraction effects observed inan XPS experiment. Two experimental modes have been developed.
In Azimuthal Photoelectron Diffraction (APD) the sample is rotated about the surfacenormal, thus varying the azimuthal angle, and the energy-selected photoelectron intensityfrom the selected core level is recorded at a fixed polar angle and at fixed photon energy.This technique was developed initially to probe the azimuthal anisotropy of adsorbatesystems. The azimuthal profile is very dependent on both the polar angle selected and thephoton energy (i.e., the final state). Most APD experiments to date have involved photo-electrons with low kinetic energies so a synchrotron radiation source is usually employed,although it is not essential.
In Normal Photoelectron Diffraction (NPD) the energy-selected photoelectron intensity froma selected core level emitted normal to the surface is recorded as the photon energy sweptthrough a wide range. A synchrotron radiation source is thus essential for this experi-ment. The other requirement is that the core level selected has a smoothly varying photo-ionization cross-section over the range of photon energies. The data recorded are verysimilar to the I-V curves of the LEED experiment (in fact they are a coherent superpositionof several LEED beams).
Undoubtedly Photoelectron Diffraction will be compared with LEED. The experimentalrequirements of XPD make it unlikely that it will ever be as widely exploited as LEED. Theadvantages which PD has over LEED may be exploited in particular applications. Theseadvantages are: the essentially non-destructive nature of the photon probe; the fact thatthe initial state in APD may be easily selected (thus allowing diffraction in anadsorbate - adsorbent system, for example, to be purely adsorbate-specific); and, the factthat, in NPD, the adlayer-substrate separation can be accurately determined, which is notalways the case in LEED.
SUMMARY
NAME: Azimuthal Photoelectron Diffraction
CLASS: Synchrotron-Radiation Photoelectron Spectros copies
ACRONYMS: APD, PD, PED
ALTERNATIVE NAMES: X-ray Photoelectron Diffraction (XPD, XPED)
INCIDENT: Fixed Energy Photons
ENERGY: X-ray region (1 - 2 keV) (often sychrotron radiation)
ENERGY RADIATION: 'O.l - 0.5 eV
INCIDENT PHOTON FLUX: Low
BEAM DIAMETER: "jl - 3 mm
ANGLE OF INCIDENCE: within range 70 - 85°
DETECTED: Photoelectrons from selected core level
ENERGY: Photoelectrons of low kinetic energy usuallyselected (< 100 eV)
ANALYZER ENERGY RESOLUTION: " 0.1 eV
ELECTRON CURRENT AT DETECTOR: ,\,1O19 - 1015 A
ANGLE OF EXIT: Polar angle fixedAzimuthal angle varied (0 - 360°)by rotating sample about surface normal
SPECTRUM:ORDINATE: Photoelectron Current
ABSCISSA: Azimuthal Angle

1364 COMMISSION ON MOLECULAR STRUCTURE AND SPECTROSCOPY
SAMPLE: Single crystals ) with or without adsorbed
Polycrystalline materials ) layer
APPLICATIONS: Similar to LEED but less destructive and more surface sensitive
SELECTED REFERENCE:
'Angular-Resolved Ultraviolet Photoemission Spectroscopy and Its
Application to the Layer Components TaSe2 and Ta52'N. V. Smith and M. M. TraumPhys. Rev. B, 11 (1975) 2087.
SUMMARY
NAME: Normal Photoelectron Diffraction
CLASS: Synchrotron-Radiation Photoelectron Spectroscopies
ACRONYMS: NPD, PD, PED
ALTERNATIVE NAMES: X-ray Photoelectron Diffraction (XPD, XPED)Synchrotron Photoelectron Diffraction
INCIDENT: Variable Energy Photons
ENERGY RANGE: "2O0 - 1500 eV (scanned range may be lessthan this)
ENERGY RESOLUTION: "0.1 eV
INCIDENT PHOTON FLUX: Medium to low
ANGLE OF INCIDENCE: within range 45 - 85°
DETECTED: Photoelectron from selected core level
ENERGY RANGE: from "0 eV to several hundred eV
ANALYZER ENERGY RESOLUTION: "0.1 eV
ELECTRON CURRENT AT DETECTOR: 4,1019 - 1015 A
ANGLE OF EXIT: normal to surface
SPECTRUM:ORDINATE: Photoelectron Count Rate
ABSCISSA: Incident Photon Energy
SAMPLE: Single crystals ) with or without adsorbed
Polycrystalline materials ) layer
APPLICATIONS: Similar to LEED but less destructive
Only technique for accurately determining adlayer-substrateseparation geometry
SELECTED REFERENCES:
'Photoelectron-Diffraction Measurements of Sulfur and Selenium Adsorbedon Ni (001)'S. D. Kevan, D. H. Rosenblatt, D. R. Denley, B-C Lu and D. A. ShirleyPhys. Rev. B, 20 (1979) 4133.

Classification of the electron spectroscopies (Recommendations 1987) 1365
II. THE ELECTRON IMPACT SPECTROSCOPIES
The Electron Impact Spectroscopies can be subdivided into Electron Scattering Spec-troscopies in which the detected particles are electrons, and Electron-Induced PhotonEmission Spectroscopies in which the detected particles are photons.
ILA. The Electron Scattering SpectroscopiesThe secondary electron signal produced by a primary electron beam impinging on a surfaceconsists of several contributions. These are: coherent and incoherent elasticallyscattered electrons, inelastically scattered electrons, primary ionized electrons and Augerelectrons.
The coherent and incoherent elastically scattered electrons are the basis of electrondiffraction (LEED) and scanning electron microscopy (SEM) respectively. The primaryionized electrons and inelastically scattered electrons are detected and analyzed in theElectron Scattering Spectroscopies. The analysis of the Auger electrons is considered in alater section.
The spectroscopy based on the analysis of the ionized electrons is Ionization Spectroscopyand that based on the analysis of inelastically scattered electrons is Energy LossSpectros copy.
The very obvious dissimilarities between these electron induced spectroscopies and thecorresponding photon induced spectroscopies arise from the fact that photons can only takepart in one resonant absorption process but electrons can take part in many non-resonant
scattering processes.
The principle of electron-energy-loss spectroscopy is that a primary electron beam of fixedenergy is incident on a surface and the energy distribution of the secondary electrons isrecorded. The difference in energy between a primary and a secondary electron correspondsto the energy loss. The major channels by which energy losses can occur are
(a). single valence-band electron excitations to unoccupied states of atoms andmolecules and to states above the Fermi level in solids
(b). single core-electron excitations to unoccupied states about the Fermi level
(c). core-electron excitations to exciton states (formed by Coulomb coupling betweenthe core hole and the excited electron)
(d). collective excitation of surface plasmons (oscillatory modes in the conductionelectron gas)
(e). collective excitation of bulk plasmons
(f). excitation of surface phonons at clean surfaces
(g). excitation of the localized atomic vibrations in surface complexes formed bychemisorption of atoms or molecules
(h) local electron interference effects on core-ionization probabilities
ll.A.1. High Resolution Electron Energy Loss Spectroscopy (HREELS, HEELS)
There are three different energy ranges of the primary electrons employed in electronenergy loss spectroscopy. With primary electron energies in the range 4 - 10 eV thetechnique is Low Electron Energy Loss Spectroscopy (LEELS), also known as ResolutionElectron Energy Loss SpectroscopyfflkiELS or HEELS). The primary electron beam is passedthrough an electron energy monochromator and focussed on the surface. The secondaryelectrons are collected by an energy analyzer after losing energies of the order of one eVmainly by processes (d), (e) and (g). The spectrum is presented as electron flux versusenergy loss. The phonon excitation processes, (d) and (e), provide information on surfacerelaxation and dielectric behaviour. The chemisorption-dependent processes, (g), provideinformation on the nature of the adsorbed species, adsorbed states, adsorbed sites, natureof chemisorption bond, electronic rearrangements and reactive intermediates.
Most spectrometers employ thermionic cathodes to deliver a gun current of '2 x l0_10 A at"5 eV. Hemispherical, 127° and cylindrical mirror analyzers have all been used
1366 COMMISSION ON MOLECULAR STRUCTURE AND SPECTROSCOPY
successfully. Angle-dependent HREELS is now routine and the technique can be combined withLEED and AES.
HREELS has recently been applied to organic solid surfaces. With primary energies of 5 -40 eV, an energy resolution of "l5 meV and an angular resolution of "'5°, energy lossescorresponding to intramolecular vibrations, singlet and triplet excitons and a electronexcitations.
SUMMARY
NAME: High-Resolution Electron Energy Loss Spectroscopy
CLASS: Electron Scattering Spectroscopies
ACRONYMS: IIREELS, HEELS
ALTERNATIVE NAME: Low Energy Electron Loss Spectroscopy (LEELS)
INCIDENT: Fixed Energy Electrons
ENERGY: within range 1 - 50 eV (typically 4 - 10 eV)
ENERGY RESOLUTION: "0.Ol - 0.05 eV
INCIDENT ELECTRON CURRENT: "'l0 - lO A
BEAN DIAMETER: "'1 - 3 mm
ANGLE OF INCIDENCE: within range 45 - 85°
ANGULAR RESOLUTION: High (1 - 5°)
DETECTED: Scattered Primary Electrons
ENERGY RANGE: Energy loss from 0.02 eV to several eV
ANALYZER ENERGY RESOLUTION: "0.01 - 0.025 eV
ELECTRON CURRENT AT DETECTOR: of incident electroncurrent
ANGLE OF EXIT: near specular (i.e., approximately equalto angle of incidence)
ANGULAR RESOLUTION: High (1 - 5°)
SPECTRUM: ORDINATE: Electron Current
ABSCISSA: Electron Energy Loss (i.e., Incident ElectronEnergy - Analyzer Energy)
SAMPLE: Atomic and molecular gases and beams
Single crystals ) with or without adsorbed
Polycrystalline materials ) layerThin films on metal substrates
APPLICATIONS: Vibrational spectroscopy gas analysisPhonon and plasmon excitations of crystal surfacesVibrational excitation of adsorbed layer
SELECTED REFERENCES:
(i) 'Resonance in Electron Impact on Diatomic Molecules'G. J. SchulzRev. Modern Phys., 45 (1973) 423.
(ii) 'Electron Energy Loss Spectroscopy and Surface Vibrations'H. Ibach and D. L. MillsAcademic Press, New York, 1982.
Classification of the electron spectroscopies (Recommendations 1987) 1367
(iii) 'Study of Adsorbed Molecules by Electron Energy Loss Spectroscopy'C.N.R. Rao, A. Srinivasan, K. Jagannathanin mt. Rev. Phys. Chem., 1 (1981) 45.
(iv) 'Low Energy Electrons and Surface Chemistry'G. Ertl and J. Kuppers
Verlag Chemie, Weinheim (1974).
ILA.2. Electron Energy Loss Spectroscopy (EELS, ELS)
With primary electron energies in the range 50 - 200 eV the technique is known as(Electron) Energy Loss Spectroscopy (EELS or ELS), Inelastic Electron ScatteringSpectroscopy (lESS) or Characteristic (Energy) Loss Spectroscopy (CLS, CELS or CEELS).Here the major energy losses are through processes(, (d) and Ce) in the range 0 - 20 eV.
Electronic excitation processes of atoms and molecules in the gas phase are convenientlystudied. The technique is of particular value in the study of optically forbiddensinglet-triplet transitions which are allowed under electron impact. The sample receives acollimated beam of electrons usually via a monochromator but in most casesmonochromatization is not essential. The secondary electrons are usually collected over arelatively large solid angle and analyzed by a retarding grid structure in the case ofsolids. The predominant spectral features are the plasmon processes (d) and (e). Thesesometimes show structure due to the interaction of free-electron plasma oscillations withaddition oscillations attributed to adsorbed atom transitions. Plasmon excitations can bestudied in more detail by combining EELS with LEED to produce the technique Inelastic LowEnergy Electron Diffraction (ILEED). Primary electron energies of 10 - 1000 eV are used.
With higher energy resolution (''50 meV) surface vibrational modes, process (f), areobserved. At the higher primary energies, the loss structure shows features arising from
process (a) predominantly.
Energy Loss spectra are often presented as first or second derivatives of the electroncurrent with respect to the energy loss.
A recent extension of EELS is p- and Energy-Analyzed Secondary Electron EmissionSpectroscopy of ferromagnetic materials. The energy dependence of the spin polarization oflow energy (0.5 - 25 eV) secondary electrons when a 500 eV primary beam of electrons isincident on a surface of a ferromagnetic glass. The polarization of the lowest-energyelectrons is found to be a measure of the net valence-band spin density. This provides atechnique for observing surface magnetic structure with the very high spatial resolution of
scanning electron microscopy.
SUMMARY
NAME: Electron Energy Loss Spectroscopy
CLASS: Electron Scattering Spectroscopies
ACRONYMS: EELS, ELS
ALTERNATIVE NAMES: Inelastic Electron Scattering Spectroscopy (lESS)Characteristic (Energy) Loss Spectroscopy (CLS, CELS)
INCIDENT: Fixed Energy Electrons
ENERGY: within range 50 - 200 eV
ENERGY RESOLUTION: %O.5 - 1.0 eV (unmonochromatised)0.025 - 0.050 eV (with monochromatiser)
INCIDENT ELECTRON CURRENT: ,\,10l0 - lO A
BEAN DIAMETER: 'l - 5 mm
ANGLE OF INCIDENCE: within range 30 - 850
ANGULAR RESOLUTION: High (1 - 30)
DETECTED: Scattered Primary Electrons

1368 COMMISSION ON MOLECULAR STRUCTURE AND SPECTROSCOPY
ENERGY RANGE: Energy Losses from 0.005 eV to several eV
ANALYZER ENERGY RESOLUTION: Medium (0.1 - 0.2 eV) toUltrahigh (0.005 - 0.05 eV)
ELECTRON CURRENT AT DETECTOR: of incident electroncurrent
ANGLE OF EXIT: near specular (i.e., approximately equalto angle of incidence)
ANGULAR RESOLUTION: High (1 - 50) to
Ultrahigh ('lO- rad)
SPECTRUM:
ORI1INATE: Electron Current
ABSCISSA: Electron Energy Loss (i.e., Incident ElectronEnergy - Analyzer Energy)
SAMPLE: Atomic and molecular gases and beams
Single crystalsPolycrystalline materials
SELECTED REFERENCES:
(i) 'Resonance in Electron Impact on Atoms'G. J. SchulzRev. Modern Phys., 45 (1973) 378.
(ii) 'Electron Energy Loss Spectroscopy'H. Frotzheimin 'Electron Spectroscopy for Surface Analysis',H. Ibach (editor)
Topics in Current Physics, Volume 4, Springer-Verlag, 1977.
(iii) 'Characteristic Loss Spectroscopy'J. C. Rivierein 'Noderne Verfahren de Oberflchenanalyse'
Dechema-Monographien, Band 78, Nr. 1537-1548, p. 83.
(iv) 'Electron Energy Loss Spectroscopy and Surface Vibrations'H. Ibach and D. L. MillsAcademic Press, New York, 1982.
(v) 'Spin Polarization in Electron Scattering from Surfaces'D. T. Pierce, R. J. CelottaAdv. Electron. Electron Phys., 56 (1981) 219.
ll.A.3. High Energy Electron Loss Spectroscopy (HEELS)
Higher energy primary electrons (10 - 100 keV) produce electron energy loss more charac-teristic of the bulk than the surface due to the greater penetration depth of the elec-trons. Gross structure in the dielectric loss spectrum arises mainly from bulk phonon andplasmon processes. Sharp peaks due to ionization and excitation events are not observedbecause of the multiple inelastic scattering that the primary electrons undergo before andafter the event. However fine structure is observed in the ionization edge steps in thespectrum due to the interference of the electron waves of ionized core electrons back-scattered towards the original core hole by near neighbour atoms. This is known asExtended Electron-Energy-Loss Fine Structure (EXELFS) and is equivalent to the Extended
Absorption Fine Structure (EXAFS) associated with the photon absorption electronspectroscopies.
(a). Extended electron-energy-loss fine structure (EXELFS or EELFS). Experiments are
performed with a high energy (''8O keV), sharply focussed (0.3 nm), high current density ("3x l0- A m-2) primary electron beam. This involves fitting a field emission electron gunto a Scanning Transmission Electron Microscope (STEM). The specimen is a thin film ("lOma) and the electron energy analyzer monitoring the backscattered electrons has a resolu-tion of 3 - 10 eV. Energy losses for ionization edges are of the order of several hundredvolts.

Classification of the electron spectroscopies (Recommendations 1987) 1369
EXELFS provides similar local structural information to EXAFS, such as bond lengths, buthas an overall better performance and, of course, does not require a synchrotron. BothEXELFS and EXAFS are particularly appropriate for a wide range of materials, includingamorphous materials, and because of the local rather than extended structural informationthey provide are complementary to Low Energy Electron Diffraction (LEED).
SIJMNARY
NAME: Extended Electron-Energy-Loss Fine Structure
CLASS: Electron Scattering Spectroscopies
ACRONYMS: EXELFS, EXELFSS, EELFS, EELFSS
ALTERNATIVE NAME: Surface Extended-Energy-Loss Fine Structure (SEELFS)
INCIDENT: Fixed Energy Electrons
ENERGY: 10 - 80 keV (typically 30 keV)
ENERGY RESOLUTION: not critical
INCIDENT ELECTRON CURRENT: High current density("3 x lO- A m-2)
BEAM DIAMETER: "'0.3 nm
ANGLE OF INCIDENCE: approximately normal to surface
DETECTED: Scattered Incident Electrons
ENERGY RANGE: energy loss for ionization"200 - 4000 eV
ANALYZER ENERGY RESOLUTION: 3 - 10 eV
ANGLE OF EXIT: 450
SPECTRUM:ORDINATE: Backscattered Electron Current or its first or
second derivative with respect to incidentelectron energy (Energy Loss Function)
ABSCISSA: Incident Electron Energy
SAMPLE: Thin films
Single crystalsAmorphous materials
APPLICATIONS: Fourier transform of spectrum gives local structure
SELECTED REFERENCE:
'Extended Fine Structure on the Carbon Core Ionization Edge Obtainedfrom Nanometre-Sized Areas with Electron Energy Loss Spectroscopy'P. E. Batson, A. J. CravenPhys. Rev. Lett., 42 (1979) 893.
ILA.4. Ionization Spectroscopy (IS)
In Ionization Spectroscopy (IS) a core electron is excited to the Fermi level. Thetechnique is also known as Ionization Loss Spectroscopy (ILS) or Core-Level CharacteristicLoss Spectroscopy (CLS). The core electron excitation produces a weak edge (step) in thedistribution of backscattered electrons as a function of incident electron energy when theloss energy is equal to the binding energy of the core electron. These weak ionizationedges have to be distinguished from the more intense Auger electrons. This is achieved byusing the fact that the intensity of electrons scattered after core ionization processesdepends on the primary electron energy but the Auger electron signal does not.
1370 COMMISSION ON MOLECULAR STRUCTURE AND SPECTROSCOPY
There are two methods of recording the characteristic loss spectrum. In the first method,the primary beam energy is modulated by a small alternating voltage. The retarding voltageof a conventional retarding field analyzer is then swept in the usual way. The signal isdetected with a lock-in amplifier in phase with the primary modulation to select onlyfeatures whose energy loss is associated with the primary beam energy change.
In the second method, a cylindrical mirror analyzer of fixed band-pass energy is used. Theenergy loss features are then swept through this fixed energy window by varying the primary
energy.
Primary electron energies in the range 200 - 2000 eV and fairly large primary currents of"500 pA are usually employed. For comparison the primary current in Auger electronspectroscopy is 20 pA. The core-level characteristic loss spectrum is usually presentedas the second derivative of the energy loss function.
The spectrum shows that associated with each core level there is an edge that reflects thedensity of conduction band states near the Fermi energy. Thus Ionization Spectroscopyprovides information complementary to that from X-ray Photoelectron Spectroscopy. Thereis, however, one important distinction. In a direct excitation spectroscopy, such as XPS,the only limitation to the detail that can be detected in the density of states isinstrumental - the resolution of the instrument. In an indirect excitation spectroscopy,such as IS, the localized core electron overlaps only part of the conduction states. Theselected core level is a window through which we can view a very local density of states.It is a consequence of the uncertainty principle that a localized view will be fuzzy andthis is seen as a broadening introduced by the finite lifetime of the core hole.
SIJNNARY
NAME: IONIZATION SPECTROSCOPY
CLASS: Electron Scattering Spectroscopies
ACRONYM: IS
ALTERNATIVE NAMES: Ionization Loss Spectroscopy (ILS)Core-Level Characteristic Loss Spectroscopy (CLS)
INCIDENT: Variable Energy Electrons
ENERGY RANGE: 250 - 1000 eV
ENERGY RESOLUTION: "l eV
INCIDENT ELECTRON CURRENT: "5 x lo A
BEAN DIAMETER: '3 mm
ANGLE OF INCIDENCE: either "O° or 45°
DETECTED: Scattered Incident Electrons
ENERGY: 100 - 500 eV
ANALYZER ENERGY RESOLUTION: "1 eV
ELECTRON CURRENT AT DETECTOR: A
ANGLE OF EXIT: not critical (typically "45°)
SPECTRUM:ORDINATE: Second derivative of backscattered electron
current with respect to incident electron
energy (Energy Loss Function)
ABSCISSA: Incident Electron Energy
SAMPLE: Single crystalsPolycrystalline materialsSemiconductor surfaces

Classification of the electron spectroscopies (Recommendations 1987) 1371
SELECTED REFERENCES:
(i) 'Electron Excited Core Level Spectroscopies'J. Kirschnerin 'Electron Spectroscopy for Surface Analysis'H. Ibach (editor)
Topics in Current Physics, Volume 4, Springer-Verlag, 1977.
(ii) 'Inner Shell Ionization of Surface Atoms by Electron Impact'R. L. Gerlach, A. R. DuCharmeSurf. Sci., 29 (1972) 317.
ll.A.5. Electron Transmission Spectroscopy (ETS)
Electron Transmission Spectroscopy has been performed on thin films (1 - 10 nm) of organicmaterials with low energy electrons (0 - 15 eV). The sample is mounted on a stainlesssteel block at "80K. The current to the steel block is recorded as a function of incidentelectron energy. The transmission spectrum is presented as the first derivative of thiscurrent with respect to incident energy versus the incident energy. The spectrumapproximately represents the first derivative of the density of states of the vacant con-duction bands. The position of onset of the main peak giving the energy of the top of theconduction band. The conduction bands in molecular solids are formed from the freemolecule valence levels and additional structure can arise from intermolecular inter-actions. This is one of the few electron spectroscopies to be applied to molecularcrystals.
SUMMARY
NAME: Electron Transmission Spectroscopy
CLASS: Electron Scattering Spectroscopies
ACRONYM: ETS
INCIDENT: Variable Energy Electrons
ENERGY RANGE: 0 - 15 eV
ENERGY RESOLUTION: "O.l eV
INCIDENT ELECTRON CURRENT: - lO A
BEAN DIAMETER: 1 - 3 mm
ANGLE OF INCIDENCE: normal to surface
DETECTED: Transmitted Scattered Electrons
ENERGY RANGE: 'O - 15 eV
ANALYZER ENERGY RESOLUTION: Not applicable. No energyanalysis of transmittedelectrons
ELECTRON CURRENT AT DETECTOR: lO - lO of incidentelectron current
ANGLE OF EXIT: normal to surface
SPECTRUM:
ORDINATE: First derivative of transmitted electron currentwith respect to incident electron energy
ABSCISSA: Incident Electron Energy
SAMPLE: Thin films ("l - 10 nm) of molecular organic materialsmounted on stainless steel block (collector) at "8OK

1372 COMMISSION ON MOLECULAR STRUCTURE AND SPECTROSCOPY
SELECTED REFERENCE:
'Conduction Band Structure of Solid n-Alkanes Studied by Electron-
Transmission Spectra'K. Hiraoka and N. NaraChem. Phys. Lett., 94 (1983) 589.
II.B. The Electron-induced Photon Emission Spectroscopies
The photon emission spectra produced by primary electron beams impinging on a surfaceconsist of contributions from two distinct mechanisms.
The first of these is decay of the excited core-state by X-ray emission followingtransitions of valence or core electrons from occupied states to the unoccupied core state.If core-core transitions are involved the technique is Emission Spectroscopy (XES)(also known as Fluorescence (XRF)) or Energy-Dispersive (y Analysis) Spectroscopy( P!) and if valence-core transitions are involved the technique is Valence BandEmission Spectroscopy (VBXES) or Soft Emission Spectroscopy (SXES). If these regionsare combined for the purpose of elemental analysis this technique is known as ElectronProbe Micro Analysis (EPMA).
The second mechanism involves transitions from the free-electron-like states of the in-coming electrons, as they are accelerated by the potential inside the surface, tounoccupied states of the surface above its Fermi level with the consequent emission ofbremsstrahlung radiation.
At low electron and photon energies, both the energy and direction of the incident beam canprecisely defined. In this regime, both energy and momentum are conserved leading to
k -selected spectra and the technique is called Inverse Photoemission or PhotoelectronSpectroscopy (IPES or IPS) (see Note c.). Angle-resolved Inverse Photoemission studieslead to T -resolved Inverse Photoemission Spectroscopy (KRIPES) which can map theE(k11) relations in the unoccupied states. This complements Angle-resolved Ultra-violet Photoelectron Spectroscopy (ARUPS) which measures the E(k11) relations in theoccupied states. Spin-polarized electron sources can be used to study magnetic materialswith the technique known as Spin-polarized Inverse Photoemission Spectroscopy (SPIPES).
At higher electron and photon energies the spectrum arises from e i -integrated densityof states because of thermal and other broadening effects on k . In this regime thetechnique is called Bremsstrahlung or Characteristic Isochromat Spectroscopy (BIS).Bremsstrahlung spectra are recorded in the X-ray region (BIS) or ultraviolet region(UVBIS).
Recently, an experiment in momentum-resolved Bremsstrahlung Spectroscopy has been reported.Here as the incident electron energy in an IPES experiment is varied the photonspectrum (as opposed to an isochromat) is recorded. Spectral multiplexing techniques andhigh photon sensitivity permit photon polarization to be detected. Note that this is a low
electron energy ultraviolet photon inverse photoemission experiment NOT the higher energyX-ray continuum Bremsstrahlung spectroscopy.
ILB.1. Inverse Photoemission Spectroscopy (IPS)
Electrons of low energy ( few tens of eV) are incident on a clean surface. JtravioletBremsstrahlung radiation intensity at a fixed frequency is recorded. In k -resolvedInverse Photoemission Spectroscopy (KRIPES) the isochromat is recorded as a function ofangle of incidence of the electron beam. The spectra are usually presented as isochromatintensity versus energy of electron beam above Fermi energy. Unoccupied surface states canbe identified as structure in this spectrum arising when the free electron energy, E(k),matches an energy level of the surface. The dipole matrix element for this process is thesame as that for the photoelectron emission process. Thus this process is the timereversal of photoelectron emission.
IPES is very surface sensitive. It is a probe of the wave functions of the one-electronsurface states and, recently, of the lowest empty orbitals of adsorbate molecules.
Note c. These names though in common usage should ultimately be replaced by the term'Electron-Induced Photon Emission'.

Classification of the electron spectroscopies (Recommendations 1987) 1373
Spin-polarized Inverse Photoemission Spectroscopy (SPIPES) is a probe of the d-band spinstates of magnetic materials. The efficiency of GaAs spin- polarized electron sources haveled to the rapid development of this spectroscopy since 1979. It is simpler to performthan the complementary spin-polarized photoelectron emission spectroscopy. The inter-pretation of IPES is much easier than BIS as in IPES only the initial state is varied butin BIS both initial and final states are varied.
In general polycrystalline samples are preferred as this averages crystal orientationeffects so that the true density of states without initial state or angular effects isobserved.
SUMMARY
NAME: Inverse Photoemission Spectroscopy
CLASS: Electron-Induced Photon Emission Spectroscopies
ACRONYMS: IPS, IPES
ALTERNATIVE NAME: Ultraviolet Bremsstrahlung Spectroscopy (UVBIS)
RELATED TEChNIQUES: k>-resolved Inverse Photoemission Spectroscopy (KRIPES)
(i.e., Angle-resolved IPS)Spin-polarized Inverse Photoemission
Spectroscopy (SPIPES)
INCIDENT: Variable Energy Electrons
ENERGY RANGE: "40 - 20 eV, i.e., few tenths of an eV to"PlO eV above the Fermi Level
ENERGY RESOLUTION: 0.1 - 0.5 eV
INCIDENT ELECTRON CURRENT: A
BEAM DIAMETER: "1 mm
ANGLE OF INCIDENCE: varied from 0 - 300 (IPS)10 - 200 (fixed in range) in KRIPESand angle-resolved SPIPES
ANGULAR RESOLUTION: High
DETECTED: Fixed Energy Photons
ENERGY: within the range 6 - 10 eV
ANALYZER ENERGY RESOLUTION: 0.4 - 0.7 eV (in most casesresolution is limited to 'O.7
eV by the Geiger-Muller Detector)
PHOTON FLUX AT DETECTOR: from several hundred counts persecond to a few counts per second
ANGLE OF EXIT: not critical (usually about 45°)
ANGULAR RESOLUTION: usually low (10% of maximum 2ir steradians)but, if count rates permit, can beimproved to '6°
SPECTRUM:ORDINATE: Photon Flux (Isochromat Intensity)
ABSCISSA: Incident Electron Energy (usually presented asElectron Energy above Fermi Level)
SAMPLE: Defined faces of single crystals with or without an adsorbedlayer. For SPIPES the crystal must be ferromagnetic.

1374 COMMISSION ON MOLECULAR STRUCTURE AND SPECTROSCOPY
APPLICATIONS: Investigation of unoccupied electronic surface states andconduction band densities-of-states
SELECTED REFERENCES:
(i) 'New Probe for Unoccupied Bands at Surfaces'J. B. PendryPhys. Rev. Lett., 45 (1980) 1356.
(ii) 'Inverse Photoemission Observation of an Unoccupied Surface Stateon Pd (111)'P. D. Johnson and N. V. SmithPhys. Rev. Lett., 49 (1982) 290.
(iii) 'Empty Orbitals of Adsorbates Determined by Inverse UltravioletPhotoemission'F. J. Himpsel and Th. FausterPhys. Rev. Lett., 49 (1982) 1583.
(iv) 'Spin-Polarized Inverse Photoelectron Spectroscopy (SPIPES) ofSolid Surfaces: Ni (110)'J. Unguris, A. Seiler, R. J. Celotta, D. T. Pierce, P. D. Johnsonand N. V. SmithPhys. Rev. Lett., 49 (1982) 1047.
II.B.2. Bremsstrahlung Isochromat Spectroscopy (BIS)
19 Bremsstrahlung Spectroscopy the spectrum is formed by transitions into the one-electronk -integrated densities of states. As higher elect>ron and photon energies are employedthan in Inverse Photoemission the wave vector k is broadened by thermal and othercollective factors.
In Bremsstrahlung Isochromat Spectroscopy (BIS), Characteristic Isochromat Spectroscop(CIS) or Continuum Isochromat Spectroscopy (XIS) electrons of high energy (1 - 2 keVare incident on the surface and the photon intensity at constant wavelength is recorded asthe electron energy is varied. Usually the photon energy is close (< 50 eV) to theelectron energy. Extreme vacuum (40_12 Torr) is essential. Depth resolutions of afew nanometres can be achieved. As the photon energy observed is fixed as the electronenergy varies both initial and final states are varied in this spectroscopy.
This technique is used, in conjunction with XPS, to provide the one-electron density ofstates of f and d levels of transition metals and rare-earth metals. The XPS spectrumgives the filled part of the density of states and the BIS spectrum, if the initial andfinal states are matched, gives the unoccupied part of the density of states.
Note that the recent technique of momentum-resolved Bremsstrahlung spectroscopy is a low
energy inverse photoemission spectroscopy not an X-ray Isochromat Spectroscopy.
SUMNARY
NAME: Bremsstrahlung Isochromat Spectroscopy
CLASS: Electron-Induced Photon Emission Spectroscopies
ACRONYM: BIS
ALTERNATIVE NAMES: X-ray Bremsstrahlung Spectroscopy (XBIS)Characteristic Isochromat Spectroscopy (CIS)X-ray Continuum Isochromat Spectroscopy (XIS)
INCIDENT: Variable Energy Electrons
ENERGY RANGE: "l - 2 keV

Classification of the electron spectroscopies (Recommendations 1987) 1375
ENERGY RESOLUTION: 1 eV
DETECTED: Fixed Energy Photons
ENERGY: usually an isochromat energy corresponding to acharacteristic X-ray line used in XPS is chosenwithin the range 1 - 2 keV
ANALYZER ENERGY RESOLUTION: 'O.4 eV
PHOTON FLUX AT DETECTOR: Low (" few hundred counts persecond or less)
SPECTRUM:ORDINATE: Photon Flux (Isochromat Intensity)
ABSCISSA: Incident Electron Energy
SAMPLE: Single crystal and polycrystalline surfaces of transitionmetals and rare-earth metals. Usually under UHV conditionswithout an adsorbed layer.
APPLICATIONS: Measurement of the density-of-states function for the unoccupiedpart of the d- and f-valence bands of the above samples.Usually presented with the complementary XPS data for theoccupied part of the valence band. (For density-of-occupied-states function, from XPS, and the density-of-unoccupied-states function, from BIS, to be complementary the photonenergy in the XPS experiment and the isochromat energy in theBIS experiment must be the same).
SELECTED REFERENCES:
(i) 'Study of the 4f Levels in Rare-Earth Metals by High-Energy
Spectros copies'J. K. Lang, Y. Baer and P. A. CoxPhys. Rev. Lett., 42 (1978) 74.
(ii) 'Density of Unfilled One-Electron Levels on Elements Vanadium andIron through Zinc by Means of X-ray Continuum Isochromats'R. R. Turtle and R. J. LiefeldPhys. Rev. B, 7 (1973) 3411.
ll.B.3. Momentum-resolved Bremsstrahlung Spectroscopy (BS)
This is an Inverse Photoemission Spectroscopy not an X-ray Bremsstrahlung IsochromatSpectroscopy. The confusion in nomenclature is unfortunate.
In Bremsstrahlung Spectroscopy (BS) the incident electron energy is varied and simul-taneously a part of the photon spectrum is recorded. Thus, it is not an isochromatspectroscopy. This has been made possible by the recent development of multiplexed ultra-violet photon detectors based on electron microchannel plate multipliers with CsIevaporated on the front face to provide ultraviolet sensitivity. Thus, the energy of theinitial state of the electrons can be made constant by scanning, in effect, both electronand photon energy. Bremsstrahlung Spectroscopy is the Inverse PhotoemissionConstant-Initial-State Spectroscopy corresponding to the Synchrotron-RadiationConstant-Final-State Photoelectron Spectroscopy.
Since the parallel component (relative to the sample surface) of the wave vector of theincoming electron is unchanged in passing through the surface barrier and the momentum ofthe ultraviolet photon is small with respect to that of the electron, the parallelcomponent of the final state wave vector is known. The polarization of the photon givesadditional information about the symmetry of the states involved.
Bremsstrahlung Spectroscopy is very inefficient. The efficiency is 4O_8 photons perelectron in a photon energy interval of 1 eV and over a solid angle of 2ic. Angularrelationships have not yet been investigated. This is the only one of the electron-photon

1376 COMMISSION ON MOLECULAR STRUCTURE AND SPECTROSCOPY
spectroscopies to detect the photon polarization and the combination of this feature with aspin-polarized electron source will lead to exciting developments.
DETECTED: Photons
Angle-Resolved Bremsstrahlung Spectroscopy
Energy Electrons
ENERGY RANGE: "10 - 20 eV (i.e.,"'10 ev above Fermi
ENERGY RESOLUTION: "'0.25 eV
INCIDENT ELECTRON CURRENT: 4O A
BEAN DIAMETER: "1 mm
ANGLE OF INCIDENCE: within range 0 - 600(Angle-resolved BS involves varyingthis angle of incidence)
ANGULAR RESOLUTION: "'6°
ENERGY RANGE: 10 - 40 eV (scanned range may be less than
this)
ANALYZER ENERGY RESOLUTION: "'0.3 eV
PHOTON FLUX AT DETECTOR: Low (the selected range of thephoton spectrum is recordedsimultaneously with a multi-
channel detector). Depolarizationof the photons is detected.
SPECTRUM:
ORDINATE: Intensity of parallel component of photonwavevector
ABSCISSA: Incident Electron Energy relative to FermiLevel
Defined face of single crystal or polycrystalline material
Investigation of unoccupied electronic surface states
SAMPLE:
APPLICATIONS:
SELECTED REFERENCE:
'Spectrometer for Momentum-Resolved Bremsstrahlung Spectroscopy'Th. Fauster, F. J. Himpsel, J. J. Donelon and A. MarxRev. Sci. Instrum., 54 (1983) 68.
SUMMARY
NAME: Momentum-Resolved Bremsstrahlung Spectroscopy
CLASS: Electron-Induced Photon Emission Spectroscopies
ACRONYM: BS
RELATED TECHNIQUE:
INCIDENT: Variable
few tenths of an eV to
Level)

Classification of the electron spectroscopies (Recommendations 1987) 1377
III. THE APPEARANCE POTENTIAL SPECTROSCOPIES
These are electron spectroscopies based on the principle of measuring the thresholdenergies for the creation of excited states of matter. They range from inelastic electrontunneling spectroscopy, concerned with the thresholds for the excitation of molecularvibrations at energies less than 500 meV, to the nuclear resonance capture spectroscopiesat energies greater than 1 MeV. A particular feature is that no energy analysis of thedecay of the excited states is required. It is the energy of the exciting particle thatis recorded. The appearance potential spectroscopies used in surface studies all employdifferentiation to separate the structure due to threshold excitation from the backgroundof primary and scattered electrons.
The major appearance potential spectroscopies employed in surface studies are Soft
Appearance Potential Spectroscopy (SXAPS), pg Electron Appearance Potential SpectroscopyDisappearance Potential Spectroscopy (DAPS), Total Current Spectroscopy (TCS),
y Excited Electron Appearance Potential SpectroscopJAPS), Electron (or Extended)Appearance-Potential Fine-Structure Analysis or Spectroscop7Ai?FS, EAPFSS) and InelasticElectron Tunneling Spectroscopy (lETS). Where Appearance Potential Spectroscopy (APS) isreferred to without the particular form being specified it is conventionally assumed thatSXAPS is the technique.
111.1. Soft X-ray Appearance Potential Spectroscopy (SXAPS)
In this technique, also known as Appearance Potential Spectroscopy (XAPS) or Electronexcited Appearance Potential Spectroscopy (EXAPS), core holes are produced by anelectron beam incident on the surface. As the energy of this electron beam is increasedeach threshold for the production of a core hole by electron excitation or ionization ismarked by a sudden 'appearance' of soft x-ray fluorescence characteristic of the energylevel concerned. These characteristic soft X-rays are superimposed on a largebremsstrahlung background and at each threshold there is a step in the total X-ray flux.
The incident electron energy is usually modulated by adding a sine wave oscillation(usually 6 - 10 kllz) to the accelerating voltage. The X-ray fluorescence is not wavelengthanalyzed but the total flux is recorded. Although photomulpliers were initially used, thehigh S/N ratio needed to distinguish the threshold steps from the bremsstrahlung has led tothe use of cooled silicon diodes which have a detection efficiency of approximately unityand a lower intrinsic background. Background due to secondary electrons is removed by anegatively biassed grid and bremsstrahlung background is reduced by a thin aluminum foil.Signal-to-noise considerations are still important as the bremsstrahlung yield riseslinearly with the energy of the exciting electrons. The modulation signal and the totalfluorescence yield signal are input to a lock-in amplifier and the output of this amplifieris differentiated once or twice and plotted against the incident electron energy to give
the soft X-ray appearance potential spectrum.
Soft X-rays have energies in the range "6000 eV down to 100 eV. The electron energiesemployed in SXAPS are usually less than 1000 eV but may be up to 2000 eV. The main appli-cations of SXAPS are in elemental analysis of metals, semiconductors and insulators. Itcan also be employed in the study of adsorbed atom - surface atom bonds. SXAPS is the
highest energy-resolution appearance potential spectroscopy at the present time.
SUIINARY
NANE: Soft X-ray Appearance Potential Spectroscopy
CLASS: Appearance Potential Spectroscopies
ACRONYMS: SXAPS, XAPS
ALTERNATIVE NAMES: Electron-Excited X-ray Appearance Potential Spectroscopy
(EXAPS, EEXAPS)
INCIDENT: Variable Energy Electrons

1378 COMMISSION ON MOLECULAR STRUCTURE AND SPECTRO5COPY
ENERGY RANGE: 100 - 2000 eV (100 - 100 eV typical)
ENERGY RESOLUTION: "jl eV
INCIDENT ELECTRON CURRENT: - 2 x lO A
BEAM DIAMETER: "PlO mm
ANGLE OF INCIDENCE: approximately normal to surface
DETECTED: Soft X-ray Photons
ENERGY: approx. 50 - 1000 eV. No energy analysis.Total X-ray Flux recorded.
ANALYZER ENERGY RESOLUTION: not applicable. No energy
analysis.
ANGLE OF EXIT: almost all photons within the maximum 2nsteridians are collected
PHOTON FLUX AT DETECTOR: of incident electron current
SPECTRUM:
ORDINATE: Total X-ray Flux
ABSCISSA: Primary Electron Energy (Excitation Energy)
SAMPLE: Polycrystalline metal surfacesSemiconductor surfacesInsulating materials
APPLICATIONS: Mainly elemental analysisHigh surface and analytical sensitivity
SELECTED REFERENCES:
(i) ?ElectronExcited Core Level Spectroscopies'J. Kirschnerin 'Electron Spectroscopy for Surface Analysis?H. Ibach (editor)
Topics in Current Physics, Volume 4, Springer-Verlag, 1977.
(ii) 'Appearance Potential Spectroscopy and Related Techniques?A. M. BradshawSurface and Defect Properties of Solids, Volume 3 (1974), SpecialistPeriodical Reports, Chemical Society, London.
111.2. Auger-Electron Appearance Potential Spectroscopy (AEAPS)
This spectroscopy is also known as Electron-Excited Auger-Electron Appearance PotentialSpectroscopy (EAAPS) or Incident Energy Modulation Method Spectroscopy (IEMM).
As in SXAPS, core holes are produced by an electron beam incident on the surface. As theenergy of this electron beam is increased the threshold for the production of a core holeby electron excitation or ionization is reached. At the threshold for core hole productionthere is a sudden 'appearance' or increase in both the X-ray fluorescence yield and second-ary electron current. The additional photons and Auger electrons produced at the core holethreshold are isotropically directed unlike the background of quasielastically reflectedelectrons and inelastically scattered electrons which in the latter case tend to bedirected in the forward direction into the bulk of the sample. These soft X-ray photonsand Auger electrons can produce further secondary electrons so the secondary electroncurrent is greater after the threshold than before it.
The incident electron energy is modulated as described for SXAPS. A broadband filter isemployed to remove the background electrons for the Auger Signal. The modulation and theAuger electron signal are input to a lock-in amplifier and the output, differentiated once
or twice, is plotted against excitation energy to give the Auger electron appearance

Classification of the electron spectroscopies (Recommendations 1987) 1379
potential spectrum. In general AEAPS is lO - lO times more sensitive than SXAPS and '400times more sensitive than DAPS.
At low energies ( 100 eV) the technique suffers from artifacts due to diffraction effects.Thus, while SXAPS is usually employed on single crystals or metallic samples, AEAPS is moreusually employed on polycrystalline surfaces or films.
SUMMARY
NAME: Auger-Electron Appearance Potential Spectroscopy
CLASS: Appearance Potential Spectroscopies
ACRONYM: AEAPS
ALTERNATIVE NAMES: Incident Energy Modulation Method (IEMN)
INCIDENT: Variable Energy Electrons
ENERGY RANGE: 100 - 2000 eV
ENERGY RESOLUTION: "1 eV (typically)
INCIDENT ELECTRON CURRENT: A
BEAN DIAMETER: "PlO mm
ANGLE OF INCIDENCE: approximately normal to surface
DETECTED: Secondary Auger Electrons
ENERGY: 50 - 1400 eV
ANALYZER ENERGY RESOLUTION: Not applicable. A broad-bandenergy filter is used to
separate the high energy Augerelectron signal from the low
energy secondary electron signal
ANGLE OF EXIT: usually 2it steradians
ELECTRON CURRENT AT DETECTOR: 4O of incident electron
energy
SPECTRUM:
ORDINATE: Auger Electron Current
ABSCISSA: Primary Electron Energy (Excitation Energy)
SAMPLE: Polycrystalline metal surfacesSemiconductor surfaces
APPLICATIONS: Mainly elemental analysisHigh surface and analytical sensitivity
SELECTED REFERENCES:
(i) 'Introduction to Surface Spectroscopies'R. L. Park
Experimental Methods in Catalytic Research, Volume III, (1976) 1,R. B. Anderson, P. T. Dawson (editors).
(ii) 'Appearance Potential Spectroscopy and Related Techniques'A. N. BradshawSurface and Defect Properties of Solids, Volume 3 (1974),Specialist Periodical Reports, Chemical Society, London.

1380 COMMISSION ON MOLECULAR STRUCTURE AND SPECTROSCOPY
111.3. Disappearance Potential Spectroscopy (DAPS)
As with SXAPS and AEAPS core holes are created by a variable energy electron beam. At thethreshold of excitation the electrons in the primary beam, which create the core hole,disappear from the beam. In DAPS it is the attenuation of the primary beam which isstudied. As no secondary processes contribute to this attenuation DAPS observes theexcitation directly without any interference from the decay processes. The attenuation ofthe primary beam is small (l in lOs).
The electron gun in the DAPS experiment must provide a beam of variable energy (50 - 2000eV) with constant intensity and beam profile. This necessitates an electron optical lenssystem and a constant emission control circuit for the thermionic cathode. A simpleelectron energy analyzer is required to select the elastic part of the secondary electronsignal. The pass energy of the analyzer must vary with the energy of the primary beam.Cylindrical mirror analyzers or retarding field analyzers with large acceptance angles areusually employed. The large acceptance angle is necessary to minimize diffraction effectsand maximise the signal. To enhance the DAPS signal modulation can be applied. This isachieved by modulating ('0.l - 1.0 volt at 6-10 kllz) the target potential and the energy ofthe primary beam.
The applications of DAPS are mainly based on its elemental sensitivity. It is very surfacesensitive (1 - 3 atomic layers) and simpler to interpret than other elemental analysistechniques, offering only a few lines per element and no fine structure.
SUMMARY
NAME: Disappearance Potential Spectroscopy
CLASS: Appearance Potential Spectroscopies
ACRONYM: DAPS
INCIDENT: Variable Energy Electrons
ENERGY RANGE: 50 - 2000 eV (modulated with 0.1 - 1.0 voltA.C. at 6 - 10 kllz)
ENERGY RESOLUTION: "1 eV or better
INCIDENT ELECTRON CURRENT: A. Incident electronbeam current must be stable to1 in lO or better
BEAM DIAMETER: "P2 - 10 mm
ANGLE OF INCIDENCE: approximately normal to surface
DETECTED: Attenuation of Primary Electron Beam
ATTENTUATION OF PRIMARY BEAM: "1 in lO
ELECTRON CURRENT AT DETECTOR: "lO8 - lO A
SPECTRUM:ORDINATE: Electron Current at Sample (Target Current)
ABSCISSA: Primary Electron Energy (Excitation Energy)
SAMPLE: Polycrystalline metal surfacesSemiconductor surfaces
APPLICATIONS: Mainly elemental analysisHigh surface sensitivity

Classification of the electron spectroscopies (Recommendations 1987) 1381
SELECTED REFERENCES:
(i) 'Electron-Excited Core Level Spectroscopies'J. Kirschnerin 'Electron Spectroscopy for Surface Analysis'H. Ibach (editor)Topics in Current Physics, Volume 4, Springer-Verlag, 1977.
(ii) 'A Novel Electron Spectrometer for Surface Studies'J. Kirschner and P. Staib
Phys. Lett., 42a (1973) 335.
111.4. Total (or Target) Current Spectroscopy (TCS)
In TCS a beam of low energy electrons varied over the range 0 - 15 eV is incident on thesurface and the threshold of secondary electron processes are recorded by monitoring thecurrent to the target rather than by energy analysis of the secondary electrons. TCS isthus similar to DAPS but should not be confused with it. TCS is a very low energytechnique and all the secondary electrons originate in the valence band whereas DAPS is ahigher energy, core ionization technique. The TCS signal is displayed as a function ofincreasing energy, starting at zero incident energy. Thus, the low energy part of thespectrum is not influenced by the higher energy loss processes which take place simul-taneously and which are observed in some of the other low energy techniques, for exampleEELS. TCS seems particularly suited to the study of work functions, chemisorption,physisorption and excitons.
SUMMARY
NAME: Total Current Spectroscopy
CLASS: Appearance Potential Spectroscopy
ACRONYM: TCS
ALTERNATIVE NAME: Target Current Spectroscopy
INCIDENT: Variable Energy Electrons
ENERGY RANGE: 0 - 15 eV (modulated at 430 Hz, 0.15 eV)
ENERGY RESOLUTION: 'O.5 eV
INCIDENT ELECTRON CURRENT: 'lO A
ANGLE OF INCIDENCE: normal to surface
DETECTED: Change in Target Electron Current
FRACTIONAL TARGET CURRENT CHANGE: "1 in lO
ELECTRON CURRENT AT DETECTOR: 4O8 - A
SPECTRUM:ORDINATE: First derivative of target current with respect
to incident electron energy
ABSCISSA: Incident Electron Energy
SAMPLE: Single crystals ) with or withoutPolycrystalline materials ) adsorbed layerSemiconductor surface
APPLICATIONS: Study of chemisorption, physisorption and their effect onwork functions
Study of excitons

1382 COMMISSION ON MOLECULAR STRUCTURE AND SPECTROSCOPY
SELECTED REFERENCE:
'Total Current Spectroscopy'S. A. KomolovL. T. Chadderton, Surf. Sci., 90 (1979) 359-380.
111.5. X-ray Excited Electron Appearance Potential Spectroscopy (XEAPS)
This is a variable photon energy photoelectron spectroscopy. Monochromatic synchrotronradiation is incident on a surface and the photoelectron yield recorded as the frequency isvaried. The XEAP spectrum shows distinct threshold peaks for core ionization processes.The spectrum is similar to, but different from, the SXAP spectrum. The difference in thetwo spectra arises from the different net charges on the excited species. In XEAPS aneutral atom core electron is excited to above the Fermi level but in SXAPS an excitationof the cation is involved. Thus, there is a slight energy shift, of a few electron volts,in the observed structure in the two spectra.
SUMMARY
NAME: X-ray Excited Electron Appearance Potential Spectroscopy
CLASS: Appearance Potential Spectroscopies
ACRONYM: XEAPS
INCIDENT: Variable Energy Photons
ENERGY RANGE: 100 - 1000 eV (synchrotron radiation)
ENERGY RESOLUTION: 'O.OOl - 0.3 eV (monochromatised,
resolution depends on photon energy)
INCIDENT FLUX: Medium to low (depending on photon energy)
ANGLE OF INCIDENCE: not critical
DETECTED: Electrons
ENERGY: approximately 0 eV to within a few eV of photon energy
ANALYZER ENERGY RESOLUTION: Not applicable. Total Photo-electron Yield collected.
ELECTRON CURRENT AT DETECTOR: ,,lOl9 - 1015 A
SPECTRUM:ORDINATE: Photoelectron Current (Total Yield)
ABSCISSA: Photon Energy
SAMPLE: Polycrystalline metal surfaces
APPLICATIONS: Elemental analysisCore ionization effects
SELECTED REFERENCE:
'Electron and X-ray Appearance Potential Spectroscopy'J. Kanski, P. 0. Nilsson
Phys. Scr., 12 (1975) 103.

Classification of the electron spectroscopies (Recommendations 1987) 1383
111.6. Extended (Electron) Appearance Potential Fine-Structure Analysis (EAPFS)
This technique is based on the analysis of the fine structure close to the threshold forthe excitation of a core electron by a variable energy electron beam. Thus in terms ofexperimental technique EAPFS is similar to AEAPS and DAPS, but in terms of analysis ofresults EAPFS is analagous to the extended structure in X-ray absorption, EXAFS, and thatin inelastic electron energy scattering, EXELFS or SEELFS.
The structure results from the interference of the outgoing spherical wave of the scatteredelectron with the backscattered components from neighbouring atoms. There is an importantdifference between EAPFS and the other two fine structure analysis techniques, EXAFS andEXELFS. In EAPFS both the incident electron and the ejected core-electron must beaccommodated above the Fermi level. Thus, the final state is a two-electron-state. InEXAFS and EXELFS the final state is a one-electron-state.
The fine structure exists several hundred electron volts above the appearance potential butaway from the edge the structure becomes masked by the slowly varying elastic background.The spectrum is presented as the second derivative of the elastic electron current withrespect to the primary electron energy. The same Fourier transform technique as is used inEXAFS is used to extract the local geometry from the fine structure.
SUMMARY
NAME: Extended (Electron) Appearance Potential Fine-Structure Analysis
(or Spectroscopy)
CLASS: Appearance Potential Spectroscopies
ACRONYMS: EAPFS, EAPFSS
INCIDENT: Variable Energy Electrons
ENERGY RANGE: 200 - 2000 eV
ENERGY RESOLUTION: not critical
INCIDENT ELECTRON CURRENT: A
ANGLE OF INCIDENCE: approximately normal to surface
DETECTED: Elastically Scattered Electrons
ENERGY: same as incident electron energy
ANALYZER ENERGY RESOLUTION: "l eV
ANGLE OF EXIT: within range 20 - 800 (not critical)
ATTENUATION OF INCIDENT BEAM: "jl in lO
SPECTRUM: ORDINATE: Second derivative of the elastic electron currentwith respect to the incident electron energy
ABSCISSA: Incident electron energy
SAMPLE: Single crystalsPolycrystalline materialsMaterials with limited structure, e.g. glassesThin filmsAmorphous materials
APPLICATIONS: Fourier transform of spectrum gives local crystal structure
SELECTED REFERENCE:
'Extended Appearance-Potential Fine-Structure-Analysis: Oxygen onAl(100)'
M. L. den Boer, T. L. Einstein, W. T. Elam, R. L. Park, L. D. Roelofsand G. E. Laramore
Phys. Rev. Lett., 44 (1980) 496.

1384 COMMISSION ON MOLECULAR STRUCTURE AND SPECTROSCOPY
1117. Inelastic Electron Tunneling Spectroscopy (lETS)
The tunneling current across a metal-insulator-metal junction does not show normal ohmicbehaviour. The overlap between the initial and final many-electron states of the junctionmay be increased by coupling to vibrational modes of the insulator. This enhances thetunneling probability. When a potential difference is applied across the junction most ofthe current carrying electrons which tunnel from one metal surface to the other do soelastically. When the junction has a doped insulating layer a few of the electrons, aboutone in a thousand, interact with the dopant molecules by exciting their vibrational modes.A few of the vibrational modes are those associated with the insulating layer itself.These vibrational modes add a series of inelastic channels for tunneling. As the appliedpotential difference is increased, the junction current will. suddenly increase as eachthreshold for a vibrational mode is reached. Thus inelastic electron tunnelingspectroscopy is a threshold or appearance potential spectroscopy. All vibrational modesmay be excited without limitation by selection rules. Both infrared and Raman-active modesare excited together.
The experimental technique measured the junction tunneling current (I) as the appliedpotential difference (V) is varied from zero to about one volt. In practice an audiofrequency modulation voltage is applied to the junction in parallel with the appliedpotential difference and the tunnel current derivative, ôI/ôv, is detected with aphase-sensitive lock-in amplifier. This signal is then differentiated to give the secondderivative of the tunnel current, ô21/ôv2, which is plotted against applied potentialdifference, V, to give the inelastic electron tunneling spectrum.
The limiting resolution of the JET spectrum is proportional to 5.44 kT. However thisresolution can be improved by operating the spectrometer with superconducting metals in thejunction at liquid helium temperature. Lead, which superconducts at 7K, is the usual metalchosen. The vibrational frequencies recorded in JETS are slightly shifted due toimage-dipole effects in the insulator but these shifts can be calculated. The resolution,at a temperature of 1K, is usually "0.OOl eV (10 cm-1) over a spectral range of 300 - 400cm-1.
Applications of JETS in surface science depend on the observation of surface adsorbeddopant molecules. Extra vibrational modes due to surface bonding and the shifting orcomplete loss of the expected molecular vibrational modes have been observed. Most studiesare on small organic or inorganic molecules but the number of studies of larger organicmolecules and biological molecules (e.g., DNA, RNA and hemoglobin) is increasing rapidly.
SUMMARY
NAME: Inelastic Electron Tunneling Spectroscopy
CLASS: Appearance Potential Spectroscopies
ACRONYM: JETS
INCIDENT: Variable Energy Electrons
ENERGY RANGE: 0 - 1 eV
ENERGY RESOLUTION: not applicable
INCIDENT ELECTRON CURRENT: "jl pA (audio-frequency modulated)
TEMPERATURE: "l°K
DETECTED: Tunneling Current
CHANGE IN TUNNELING CURRENT: 1 in lO - 1 in lO
ELECTRON CURRENT AT DETECTOR: "1 pA (Tunnel Current)
SPECTRAL ENERGY RESOLUTION: "0.001 eV
SPECTRUM:ORDINATE: Second derivative of Tunnel Current (I) with
respect to applied Junction Voltage (v)
i.e.,a
ABSCISSA: Junction Voltage (V)

Classification of the electron spectroscopies (Recommendations 1987) 1385
SANPLE: Thin insulating layer (which may be doped with a molecularspecies) in a metal-insulating-metal junction
APPLICATIONS: Vibrational electron-energy-loss spectroscopy of insulatinglayer and the dopant species
SELECTED REFERENCES:
(i) 'Inelastic Electron Tunneling Spectroscopy'T. WolframSpringer-Verlag, 1978.
(ii) 'Surface Analysis Using Electron Beams'R. L. Park and M. den BoerCRC Critical Review in Solid State Sciences, (1976) 275.
(iii) 'Inelastic Electron Tunneling Spectroscopy: A Probe of theVibrational Structure of Surface Species'W. H. WeinbergAnn. Rev. Phys. Chem., 29 (1978) 115.
IV. THE AUGER ELECTRON SPECTROSCOPIES
Auger Electron Spectroscopy measures the energy distribution spectrum of the electrons('Auger electrons') emitted following the primary ionization of a core energy level. Thisionization can result from internal conversion in a radioactive element or from X-rayphotoionization, high energy electron ionization or positive-ion ionization (in particular,protons).
gç Spectroscopy, Emission Spectroscopy, Electron Spectroscopy andElectron Emission Spectroscopy are synonymous terms for the general technique. The mostcommonly used term is gç Electron Spectroscopy (AES). The different means of initiatingthe Auger process define different forms of AES with different spectral characteristics.Thus we have electron-excited, excited, ion-excited and nuclear Electron
Spectroscopies.
Ion Neutralization Spectroscopy (INS) is sometimes classed with Auger Spectroscopy as itinvolves Auger electron emission. However, we have chosen to classify INS as a particle-induced spectroscopy because of the similarities between the process involved in INS -
Auger Neutralization - and those processes involved in the neutral-particle-inducedspectroscopies - Auger deexcitation, Resonance Ionization and Resonance Neutralization.
The treatment of the secondary electron signal is common to all forms of AES. The signalis energy analyzed and recorded either at a fixed angle or as a function of angle ofemission. The signal is composed of narrow, low intensity, Auger electron peaks super-imposed upon an intense smoothly varying background composed of elastically andinelastically scattered primary electrons, core electrons ionized by the primary beam and
inelastically scattered Auger electrons. The sharp Auger electron peaks are usuallyenhanced with respect to the background by electronic differentiation of the secondaryelectron signal. The Auger electron spectrum is thus dN(r)/dc displayed as a function of cwhere N(c) is the energy distribution function.
The energies of the Auger electrons are characteristic of the elements present.
The most common electron energy analyzers employed are the cylindrical mirror analyzer(CHA) and the spherical-grid retarding field analyzer (RFA). Most Auger electron spec-trometers employ the higher efficiency CMA but the RFA is still useful in any apparatuswhich combines AES with LEED. High energy resolution AES requires preretardation ofelectrons before they enter the CMA as the energy resolution of this analyzer isproportional to the pass energy.

1386 COMMISSION ON MOLECULAR STRUCTURE AND SPECTROSCOPY
Auger electron spectra are interpreted by comparison with 'standard' spectra from samplesof known composition as the spectra are, in general, complex and composed of many lines.Auger electron spectra cannot be calculated accurately from first principles.
The major sources of error in AES are: electron beam or ion beam artifacts and radiationdamage, the effects of surface morphology on Auger yields and charging effects ininsulators and semiconductors.
The main applications of AES are qualitative and quantitative elemental analysis. Allelements except Hydrogen and Helium give Auger electrons, but if many elements are presentthe spectrum can be very complex. Quantitative work can be complicated by contributions ofbackscattered electrons to the Auger yield. The absolute detection limit is about 10_19 kgin a surface volume of about l0_0 m3. Thin surface layers (<2 nm) can also be analyzed.
Depth profiling is possible by removing the surface layers with ion sputtering. Dynamicprocesses can also be studied, in particular equilibrium surface segregation in alloys.Restrictions are imposed on the materials which can be investigated by their sensitivity toradiation damage and surface charging.
IV.1. Electron-excited Auger Electron Spectroscopy (EAES)
Electron Excited (or Induced or Initiated) pg Electron Spectroscopy (EEAES or EIAES orEAES) is the most common form of Auger Electron spectroscopy and, if the ionizing source isnot obvious from the context, then this technique is assumed by default. Thus electronexcited AES is often referred to simply as AES. Two particular forms of EAES are
recognized.
High-Lateral-Resolution AES involves a focussed electron beam of small diameter beingscanned across a surface to produce Auger electrons from a defined area. This is the
Scanning Microprobe (SAN) or High-Resolution AES Probe (AES-probe). If the probe isapplied to producing elemental distribution maps of a surface this technique becomesScanning Microscopy (SAN). If a cold cathode rather than a thermionic cathode, isemployed giving a smaller primary electron energy source the technique is calledHigh-Resolution Field Emission AES Probe (FE-AES-probe).
Energy Resolution AES, on the other hand, involves a fixed electron beam, of largerdiameter than that used in probe work, and with some refinements to the energy analyzer andcollector affords higher energy resolution than is typical in SAN.
In both the techniques electron beam energies are in the range 1 - 10 keV and currentdensities in excess of 10 A cm-2 are common. Beam currents of up to 1 x 10_6 A can beachieved with thermionic cathodes. Beam diameters for high energy resolution AES arecommonly 3 - 5 pm but high lateral resolutions of better than 0.3 pm can be achieved withthermionic cathodes and approximately 30 nm with cold cathodes. Further increase inlateral resolution seems to be limited by electron scattering effects which tend to enlargethe Auger analysis spot. The depth resolution of EAES is of the order of 0.4 - 4.0 nm.
Depth-Profiling Electron Spectroscopy involves the addition of argon ion bombardment,for the sequential removal of surface layers by sputtering.
SIJNNARY
NAME: (Electron-Excited) Auger Electron Spectroscopy
CLASS: Auger Electron Spectroscopies
ACRONYMS: AES, AEES, EAES, EEAES, EIAES
INCIDENT: Fixed Energy Electrons
ENERGY: within range 100 eV - 10 keV (typically withinrange 1000 - 2000 eV)
ENERGY RESOLUTION: not critical

Classification of the electron spectroscopies (Recommendations 1987) 1387
"1 eV (typical)"'0.01 eV high resolution
ELECTRON CURRENT AT DETECTOR: of incident electron
current (for solids)
ANGLE OF EXIT: Polar angle: 0 - 700Azimuthal angle: not critical
ORDINATE: First or second derivative of Secondary Electron
Current, N(E), with respect to the AnalyzerEnergy, E, i.e., dN(E)/dE or d2N(E)/dE2.
ABSCISSA: Analyzer Energy (Auger Electron Energy)
Atomic and molecular gases
Single crystals ) with or without
Polycrystalline materials ) adsorbed layerSemiconductor surfaces
APPLICATIONS: Elemental analysis
SUMMARY
NAME: Scanning Auger Microscopy
CLASS: Auger Electron Spectroscopies
ACRONYM: SAM
ALTERNATIVE NAMES: Scanning Auger (Electron) Microprobe (SAN)High-Resolution AES Probe (AES-probe)High-Resolution Field Emission AES Probe (FE-AES-probe)
Electron Microprobe Auger Spectroscopy (EMAS)
RELATED TECHNIQUES: Depth-Profiling Auger Electron Spectroscopy
INCIDENT: Fixed Energy Electrons
ENERGY: within range 2 - 15 keV
ENERGY RESOLUTION: "0.5 - 1 eV (not critical)
INCIDENT ELECTRON CURRENT: "lO10 A (currentdensities can be in excess of10 A cm-2)
BEAM DIAMETER: "0.3 - 5.0 pm (thermionic sources)"'300 - 30 nm (cold cathode sources)
ANGLE OF INCIDENCE: Electron beam is scanned across surface
DETECTED: Secondary Auger Electrons
INCIDENT ELECTRON CURRENT: - 5 x lO A
BEAN DIAMETER: "'0.1 - 1 mm
ANGLE OF INCIDENCE: within range 0 - 700
DETECTED: Secondary Auger Electrons
ENERGY RANGE: 20 - 2000 eV
ANALYZER ENERGY RESOLUTION:
SPECTRUM:
SAMPLE:

1388 COMMISSION ON MOLECULAR STRUCTURE AND SPECTROSCOPY
ENERGY: a particular Auger electron energy is selected withinthe energy range 200 - 2000 eV
ANALYZER ENERGY RESOLUTION: "'1 - 4 eV (typical) although someinstruments can operate to "0.01 eV
ELECTRON CURRENT AT DETECTOR: of incident current
ANGLE OF EXIT: .O - 600 (not critical)
ANGULAR RESOLUTION: Large
SPECTRUM: Presented as a map of surface distribution of a particularelement
X and Y axes: position coordinates
Z axis: Intensity of first derivative of Auger electroncurrent
SAMPLE: Polycrystalline materialsSemiconductor surfaces
APPLICATIONS: Elemental distributions
SELECTED REFERENCES:
(i) 'Auger Electron Spectroscopy'S. Hofmann
in Comprehensive Analytical Chemistry, Volume IX (1979),G. Svehla (editor)Elsevier, Amsterdam.
(ii) 'High Resolution Auger Spectroscopy of Solids and Surfaces'J. C. Fuggle
in Electron Spectroscopy: Theory, Techniques and Applications,Volume 4,C. R. Brundle and A. D. Baker (editors)Academic Press, New York, 1981.
(iii) 'Surface Analysis Using Charged-Particle Beams'P. Braun, F. Rudenauer and F. P. ViehbockAdv. Electron. Electron Phys., 57 (1981) 231.
IV.2. Angle-resolved Auger Electron Spectroscopy (ARAES)If the Auger electrons, produced as a result of electron ionization of a core level, arecollected as a function of their emission angle with respect to the surface the techniqueis referred to as Angle-Resolved Electron Spectroscopy (ARAF.S) or Angular-Dependent
Spectroscopy (ÀBAS). This term is applied both to true angular discrimination, inwhich the electron energy analyzer and collector are moved with respect to the surface, andto the simpler technique in which the portions of the analyzer and collector are fixed andthe surface is rotated to vary both the angle of collection and the angle of incidence ofthe primary radiation or particle beam.
SUMMARY
NAME: Angle-Resolved Auger Electron Spectroscopy
CLASS: Auger Electron Spectroscopies
ACRONYM: ARAES
INCIDENT: Fixed Energy Electrons
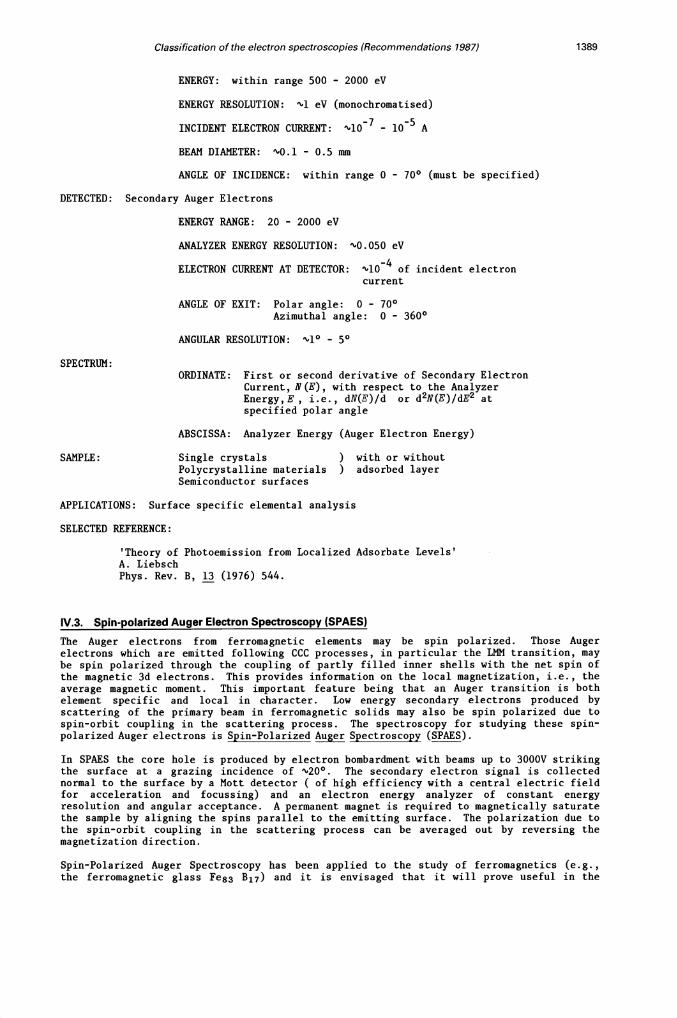
Classification of the electron spectroscopies (Recommendations 1987) 1389
ENERGY: within range 500 - 2000 eV
ENERGY RESOLUTION: "1 eV (monochromatised)
INCIDENT ELECTRON CURRENT: 'lO - lO A
BEAN DIAMETER: "O.l - 0.5 mm
ANGLE OF INCIDENCE: within range 0 - 70° (must be specified)
DETECTED: Secondary Auger Electrons
ENERGY RANGE: 20 - 2000 eV
ANALYZER ENERGY RESOLUTION: "0.050 eV
ELECTRON CURRENT AT DETECTOR: "lO of incident electroncurrent
ANGLE OF EXIT: Polar angle: 0 - 70°Azimuthal angle: 0 - 3600
ANGULAR RESOLUTION: (,l0 50
SPECTRUM:ORDINATE: First or second derivative of Secondary Electron
Current, N(PJ), with respect to the AnalyzerEnergy, E, i.e., dN(E)/d or d2N(E)/dE2 atspecified polar angle
ABSCISSA: Analyzer Energy (Auger Electron Energy)
SAMPLE: Single crystals ) with or without
Polycrystalline materials ) adsorbed layerSemiconductor surfaces
APPLICATIONS: Surface specific elemental analysis
SELECTED REFERENCE:
'Theory of Photoemission from Localized Adsorbate Levels'A. LiebschPhys. Rev. B, 13 (1976) 544.
IV.3. Spin-polarized Auger Electron Spectroscopy (SPAES)
The Auger electrons from ferromagnetic elements may be spin polarized. Those Augerelectrons which are emitted following CCC processes, in particular the LNN transition, maybe spin polarized through the coupling of partly filled inner shells with the net spin ofthe magnetic 3d electrons. This provides information on the local magnetization, i.e., theaverage magnetic moment. This important feature being that an Auger transition is bothelement specific and local in character. Low energy secondary electrons produced byscattering of the primary beam in ferromagnetic solids may also be spin polarized due to
spin-orbit coupling in the scattering process. The spectroscopy for studying these spin-polarized Auger electrons is Spin-Polarized Spectroscopy (SPAES).
In SPARS the core hole is produced by electron bombardment with beams up to 3000V strikingthe surface at a grazing incidence of 2O0. The secondary electron signal is collectednormal to the surface by a Mott detector ( of high efficiency with a central electric fieldfor acceleration and focussing) and an electron energy analyzer of constant energyresolution and angular acceptance. A permanent magnet is required to magnetically saturatethe sample by aligning the spins parallel to the emitting surface. The polarization due tothe spin-orbit coupling in the scattering process can be averaged out by reversing themagnetization direction.
Spin-Polarized Auger Spectroscopy has been applied to the study of ferromagnetics (e.g.,the ferromagnetic glass Fe83 B17) and it is envisaged that it will prove useful in the

1390 COMMISSION ON MOLECULAR STRUCTURE AND SPECTROSCOPY
study of magnetic alloys and compounds, where its elemental specificity will prove a usefuladjunct to the complementary techniques of spin-analyzed secondary electron emission and
spin-polarized photoelectron emission.
SUMMARY
NAME: Spin-Resolved Auger Electron Spectroscopy
CLASS: Auger Electron Spectroscopies
ACRONYM: SPARS
INCIDENT: Fixed Energy Electrons
ENERGY: within range 1000 - 3000 eV
ENERGY RESOLUTION: not critical
INCIDENT ELECTRON CURRENT: - lO A
BEAN DIAMETER: "O.l - 0.5 mm
ANGLE OF INCIDENCE: grazing (,2O0)
DETECTED: Secondary Auger Electrons
ENERGY RANGE: 100 - 2000 eV
ANALYZER ENERGY RESOLUTION: "P0.050 - 0.1 eV
ELECTRON CURRENT AT DETECTOR: Spin-resolved electrons aredetected by a Mott detector.These are less than 100%efficient so the detectedcurrent may be of the orderof lO_6 of the incidentelectron current
ANGLE OF EXIT: Normal to surface
SPECTRUM:ORDINATE: Secondary Electron Current (or its first derivative)
ABSCISSA: Analyzer Energy (Auger Electron Energy)
SAMPLE: Magnetically saturated ferromagnetic materials
APPLICATIONS: Measurement of d-valence band electron spin population
SELECTED REFERENCE:
'Spin-Polarized Auger Spectroscopy from Magnetically Ordered Solids'M. Landolt, D. MauriPhys. Rev. Lett., 49 (1982) 1783.
IV.4. Ion-excited Auger Electron Spectroscopy (IAES)If the core hole is produced by high energy ion collisions the technique is calledIon-(Excited or Induced or Initiated) Electron Spectroscopy (IAES). Usually heavyions are employed but Proton-Excited AES (PARS) has also been investigated.
An ion gun producing heavy inert gas ions with kinetic energies in excess of 5 keV andcurrent densities of the order of 100 pA cm-2 is required. The lateral resolution is ingeneral poorer than for EARS but the depth resolution is similar to that in EARS.

Classification of the electron spectroscopies (Recommendations 1987) 1391
SIJNMARY
NAME: Ion-Excited Auger Electron Spectroscopy
CLASS: Auger Electron Spectroscopies
ACRONYMS: IAES, IEAES, IIAES
RELATED TECHNIQUES: Proton-Excited Auger Electron Spectroscopy (PAES)Helium-Excited Auger Electron Spectrosc.opy (HAES)
INCIDENT: Fixed Energy Ions
ENERGY: within range 1 keV - 10 keV
ENERGY RESOLUTION: not critical
INCIDENT ION CURRENT: - l0 A
BEAM DIAMETER: "0.5 mm - 2.0 mm
ANGLE OF INCIDENCE: within range 20 - 60°
DETECTED: Secondary Auger Electrons
ENERGY RANGE: 100 - 2000 eV
ANALYZER ENERGY RESOLUTION: "jl eV (typical)
ELECTRON CURRENT AT DETECTOR: '40 - 106 A
ANGLE OF EXIT: within range 20 - 900
SPECTRUM:ORDINATE: Secondary Electron Current or its first derivative
with respect to analyzer energy
ABSCISSA: Analyzer Energy (Auger Electron Energy)
SAMPLE: Polycrystalline materials
APPLICATIONS: Elemental analysis
SELECTED REFERENCE:
'Low Energy Electron Spectrometry'K. D. Sevier
Wiley-Interscience, New York, 1971.
IV.5. Nuclear Auger Electron Spectroscopy (AES, AEES)
In the neighbourhood of an excited or radioactive nucleus the field of the nuclearmultipole will act on the core electrons and in some cases the excited nucleus can decay toits ground state by transferring energy to the core electron. This process is calledinternal conversion. This energy usually exceeds the ionization energy and thus a corehole is formed and Auger electron emission may occur. Nuclear Auger electrons may also beproduced by orbital electron capture. These processes do not really constitute a surfaceelectron spectroscopy but are of some importance in considering radiation damage in solids.
SUMMARY
NAME: Nuclear Auger Electron Spectroscopy
CLASS: Auger Electron Spectroscopies
ACRONYMS: AES, AEES

1392 COMMISSION ON MOLECULAR STRUCTURE AND SPECTROSCOPY
DETECTED: Secondary Auger Electrons
ENERGY RANGE: 20 - 2000 eV
ANALYZER ENERGY RESOLUTION: 1 - 5 eV
SPECTRUM:
SAMPLE:
APPLICATIONS:
SELECTED REFERENCES:
(i) 'Low Energy Electron Spectrometry'K. D. Sevier
Wiley-Interscience, New York, 1971.
(ii) 'Internal-Conversion-Electron Spectroscopy'0. DragonAdv. Electron. Electron Phys., 60 (1983) 1.
IV.6. X-ray-excited Auger Electron Spectroscopy (XAES)Because of the limited flux density of X-ray sources they are seldom employed in Augerelectron spectrometers. The importance of the X-ray excited Auger electron spectrum isthat it accompanies the photoelectron emission spectrum produced in an X-ray Photoelectron
Spectrometer. (or Photon)-Excited (or Induced or Initiated) Electron p-troscopy (XAES or XEAES) are synonymous terms.
SUMMARY
NAME: X-ray Excited Auger Electron Spectroscopy
CLASS: Auger Electron Spectroscopies
ACRONYMS: XAES, XEAES
ALTERNATIVE NAME: Photon (or Photo)-Excited Auger Electron
INCIDENT: Fixed Energy Photons
ENERGY: within range 1 - 10 keV
ENERGY RESOLUTION: "O.5 - 1.5 eV
INCIDENT PHOTON FLUX: Low
BEAM DIAMETER: "1 - 3 mm
ANGLE OF INCIDENCE: within range 70 - 85°
DETECTED: Auger Electrons
ENERGY RANGE: 50 - 2000 eV
ANALYZER ENERGY RESOLUTION: "O.l - 1.0 eV
ELECTRON CURRENT AT DETECTOR: %lOl9 - 1015 A
ORDINATE: Secondary Electron Current or its firstderivative with respect to analyzer energy
ABSCISSA: Analyzer Energy (Auger Electron Energy)
Naturally radioactive polycrystalline material
Elemental identification
Spectroscopy
(not critical)

Classification of the electron spectroscopies (Recommendations 1987) 1393
ANGLE OF EXIT: Polar angle: within range 10 - 800Azimuthal angle: not critical
SPECTRUM:ORDINATE: Secondary Electron Current or its first or
second derivative with respect to analyzer
energy
ABSCISSA: Analyzer Energy (Auger Electron Energy)
SAMPLE: Atomic and molecular gases
Single crystals ) with or without
Polycrystalline materials ) adsorbed layerThin conducting films; Langmuir-Blodgett filmsSemiconductor surfaces
APPLICATIONS: Some elemental analysis but mainly substrate (and adsorbate)valence band structure
SELECTED REFERENCES:
(i) 'X-ray-excited Auger and Photoelectron Spectroscopy'P. WeightmanRep. Prog. Phys., 45 (1982) 753.
(ii) 'High Resolution Auger Spectroscopy of Solids and Surfaces?J. C. Fuggle
in Electron Spectroscopy: Theory, Techniques, and Applications, Volume 4,C. R. Brundle and A. D. Baker (editors)Academic, New York, 1981.
It has been recently shown that Auger processes can be excited by the bremsstrahlungradiation which accompanies the characteristic line radiation from conventional magnesiumand aluminum anodes. This has proved useful in studying those Auger transitionsinaccessible to the line sources. Anodes with enhanced bremsstrahlung emission have beendesigned using heavy elements, such as tungsten, or oxide films, such as TiO2. Thetechnique is known as Continuous X-ray-Induced Electron Spectroscopy (CXAES) orBremsstrahlung-excited Spectroscopy. One particular application of this technique isin the determination of the Auger parameter for a wide range of transitions and so improve
the chemical interpretation of a given X-ray photoelectron spectrum.
SUMMARY
NAME: Continuous (or Continuum) X-ray-Induced Auger Electron Spectroscopy
CLASS: Auger Electron Spectroscopies
ACRONYM: CXAES
ALTERNATIVE NAME: Bremsstrahlung-Excited Auger Electron Spectroscopy
INCIDENT: X-ray Photons
ENERGY: a continuum of 30 - 100 eV between 1 and 2 keV
ENERGY RESOLUTION: Not applicable
INCIDENT PHOTON FLUX: Low
DETECTED: Secondary Auger Electrons
ENERGY RANGE: "200 - 4000 eV

1394 COMMISSION ON MOLECULAR STRUCTURE AND SPECTROSCOPY
ANALYZER ENERGY RANGE: "P1 eV
ELECTRON CURRENT AT DETECTOR: i0'9 i015 A
SPECTRUN:ORIIINATE: Secondary Electron Current
ABSCISSA: Analyzer Energy (Auger Electron Energy)
SAMPLE: Atomic and molecular gases
Single crystals ) with or without
Polycrystalline materials ) adsorbed layerSemiconductor surfaces
APPLICATIONS: Study of wide range of Auger transitions leading to improvedinterpretation of X-ray Photoelectron spectra
SELECTED REFERENCE:
'Continuous X-ray Induced Auger Electron Spectroscopy'J. Cazaux and Tran Minh DucJ. Electron Spectrosc. Relat. Phenom., 31 (1983) 13-23.
V. THE ELECTRON COINCIDENCE SPECTROSCOPIES
In a coincidence spectroscopy two or three particles (electrons, photons or ions)originating from a single event are detected. This event may be an excitation orionization process initiated by electrons or photons. Sophisticated timing electronicscapable of nanosecond resolution and up to three electron energy analyzers are required.
There are three classes of electron coincidence spectroscopy applicable to the gas phase,
namely: electron-electron, electron-photon, and electron-ion.
In electron-electron coincidence spectroscopy [(e,2e) spectroscopy] a monochromaticelectron beam is incident on atoms or molecules in a gas or a beam. The incident electronionizes an atom or molecule and the inelastically scattered incident electron and theionized electron are detected in coincidence.
There are two forms of electron-photon coincidence spectroscopy. The first of these [(e,p)spectroscopyl involves an electron beam incident on an atomic beam. The incident electronexcites the atom to a particular electronic energy level which then decays by fluorescentphoton emission. The inelastically scattered electron and the photon are detected incoincidence. The second form is photoelectron-photon coincidence spectroscopy in which anultraviolet photon ionizes a molecule forming one of several electronically excited ionicstates which can then decay by fluorescent photon emission. The photon and the photoelec-tron are then detected in coincidence.
In photoelectron-photoion coincidence spectroscopy (PIPECO) fixed energy photons areincident on a molecular gas. A photoelectron with a selected kinetic energy is detected incoincidence with the corresponding ion (or 'photoion') which is in a known electronicstate.
Finally there is the triple coincidence experiment - electron,photon,ion coincidencespectroscopy. A molecular gas is ionized by an electron beam to force an ion in apreselected electronic state. This ion can then decay by fluorescent photon emission. Theion, inelastically scattered electron and the fluorescence photon are then detected intriple coincidence.
SELECTED REFERENCES:
(i) 'Two-Parameter Coincidence Experiments'M. E. Gellender and A. D. Baker
in 'Electron Spectroscopy: Theory, Techniques and Applications'Volume 1, Academic Press, New York, 1977.

Classification of the electron spectroscopies (Recommendations 1987) 1395
(ii) '(e,2e) Spectroscopy'I. E. McCarthy and E. Weigold
Phys. Rep., 7•ç (1976) 275.
There are two coincidence techniques applicable to solids: Auger electron-photoelectroncoincidence and scattered electron-ionized electron coincidence.
In Auger-Electron-Photoelectron Coincidence Spectroscopy (APECS or AEPECS) a core hole iscreated by photoionization and the photoelectron and subsequent Auger electron are detectedand time correlated. Unlike Auger electron spectroscopy, APECS does not requiredifferentiation of the electron signals as the coincidence technique significantly reducesthe signal-to-background noise problem. APECS is more surface depth sensitive than eitherAES or XPS as both electrons involved in the process must escape without energy loss. Theobserved spectrum is very similar to the Auger electron spectrum but is modified by certainfeatures. For example, there is not satellite structure as the Auger electrons countedmust originate from the primary excitation selected. Some of the line broadening effectsassoicated with AES are also reduced, in particular that due to the finite lifetime of thecore hole. The information in the spectrum is a combination of a one-particle density-of-states, from the photoelectron emission process, and a two-particle density-of-states,from the Auger process.
SELECTED REFERENCE:
'Auger-Photoelectron Coincidence Measurements in Copper'II. W. llaak, G. A. Sawatzky and T. D. Thomas
Phys. Rev. Lett., 41 (1978) 1825.
In (e,2e) Spectroscopy of surfaces a core hole is created by electron-induced ionizationand the time correlation between the inelastically scattered electron and the ionizedelectron is plotted against the primary electron energy. Preliminary experiments have beenperformed on films of amorphous carbon, but these experiments had low resolution and lowcount rates. Once the technical difficulties have been overcome it should be possible toobtain the full four-dimensional (E,k) surface of a solid surface.
SELECTED REFERENCES:
(i) 'On the (e,2e) Reaction in Solids'N. R. AveryAlP Conf. Proc. (USA) No. 36 (1977) 195.
(ii) 'Study of Molecular Orbitals by Means of (e,2e) Spectroscopy OrientedMolecules'R. Camilloni, G. Stefani, R. Fantoni, A. Giardini-GuidoniJ. Electron Spectrosc. Relat. Phenom., 17 (1979) 209.
VI. THE HEAVY-PARTICLE-INDUCED ELECTRON SPECTROSCOPIES
Although fast neutral particles and ions can cause electron emission from a surface, theelectron energy distribution involved, probably complex, has not been analysed anddeveloped into an electron spectroscopy.
Low kinetic energy, ground state, neutral molecules can also stimulate electron emission.For example, exoelectron production by oxygen chemisorption on clean nickel and coppersurfaces has been investigated. No satisfactory energy analysis of this exoelectronspectrum has been reported. The formation of the chemisorption bond takes place via anexcited intermediate state which may then decay to the ground state by the emission of an

1396 COMMISSION ON MOLECULAR STRUCTURE AND SPECTROSCOPY
electron. However, even if all the energy released by the formation of the chemisorptionbond was available to a single electron, very few reactions would release enough energy forsubsequent ionization. In the special case of energetic reactions this low-energy,ground-state, neutral-induced exoelectron emission spectroscopy might prove a useful meansof monitoring reaction rates.
The only developed electron spectroscopies induced by particles are those involving lowkinetic energy atomic ions or metastable atoms incident on the surface. When one or otherof these particles approaches a surface several different processes are possible. Which ofthese dominate is decided by the relative potential energies of the electrons in theparticle and the surface. To a first approximation these are purely potential energyprocesses and the kinetic energy of the incident particle is not important provided it issmall.
The particle-surface interaction processes all involve an electron tunneling through theparticle-surface potential energy barrier by either a resonant or non-resonant mechanism.'Resonance' in this context implies that the two energy levels involved, one in theincident particle and one in the surface, have the same potential energy. Non-resonantprocesses involve two energy levels of different energy. This energy difference willappear as electronic excitation of either the incident particle or the surface states or asan Auger process in the incident particle or surface. The major processes which are ofrelevance to surface spectroscopy are resonance ionization, resonance neutralization,neutralization and Auger-deexcitation.
In resonance ionization an electron resonantly tunnels from the incident particle to anunoccupied surface valence state of the solid. In resonance neutralization an electronresonantly tunnels from an occupied surface valence state of the solid to the incidentparticle. Originally these terms were defined specifically for the ionization of incidentatoms and the neutralization of incident ions respectively, but the terms have now taken onthe wider meanings defined above. In neutralization an incident ion is neutralizedby an electron non-resonantly tunneling to neutralize the ion. The excess energyremaining, after the work function has been overcome, ejects an electron from the surface.In Agçr-deexcitation an incident neutral particle in an excited metastable state isdeexcited on interaction with the surface and the excess energy ejects an electron from thesurface.
The electron spectroscopies based on these processes are:
Ion Neutralization Spectroscopy (INS) is an incident-ion electron spectroscopy based on the
Auger neutralization process.
Excited-Atom Deexcitation Spectroscopy Incident Ions is an incident-ion electronspectroscopy based on the consecutive occurrence of the resonance neutralization and
Auger-deexcitation processes.
Resonance Ionization Spectroscopy is an incident-metastable-atom electron spectroscopybased on the consecutive occurrence of resonance ionization and Auger neutralization.
Surface Penning-Ionization Electron Spectroscopy (SPIES) is an incident-metastable-atomelectron spectroscopy based on the Auger deexcitation process.
Some workers refer to the general technique of using metastable atom sources asMetastable-Quenched Electron Spectroscopy (MQES) reserving the above terms for spectraproduced by the specific mechanisms named.
Vl.1. Ion Neutralization Spectroscopy (INS)
As slow light ions approach a surface they become polarized and provide a vacant energylevel into which a valence electron from the surface can tunnel overcoming the workfunction. The energy released by this neutralization is taken up by a second valenceelectron in an Auger-like transition. This process is therefore calledNeutralization.
This ionization occurs at or just above the surface. The energy of the emitted electrondepends both upon the valence level from which it comes and the level from which theneutralizing electron comes. The energy distribution function reflects the self con-volution of the valence band density-of-states and the density-of-states available to theemitted electron. As the emitted Auger electron has to tunnel through the surface barrierto escape, INS is very surface sensitive. In order that Auger neutralization be the major

Classification of the electron spectroscopies (Recommendations 1987) 1397
electron ejection process for the particular system it is necessary to ensure thatresonance tunneling processes do not occur. Thus the work function of the surface to beinvestigated must be greater than the ionization energy of the lowest lying excited stateof the ion.
In practice, beams of He+, Ne+ or Ar+ are used. The beam energy is of the order of 5 eVand, as the Auger electrons are of low energy, high-resolution electron energy analysis is
required. Ultra-high vacuum conditions are essential because of the high depthresolution of this technique.
The main application of INS is the study of adsorption and desorption phenomena onsurfaces. The results are directly comparable with those of Ultraviolet PhotoelectronSpectroscopy, UPS, particularly if one-electron processes are involved.
SUMMARY
NAME: Ion Neutralization Spectroscopy
CLASS: Particle-Induced Electron Spectroscopies
ACRONYM: INS
INCIDENT: Ions
SPECIES: Noble gas ions (He, Net, Art)
ENERGY: "5 - 10 eV (kinetic energy)
ENERGY RESOLUTION: Not applicable
INCIDENT ION CURRENT: Low ('%'lO A)
BEAM DIAMETER: "5 mm
ANGLE OF INCIDENCE: not critical (typically within therange 20 450)
DETECTED: Electrons
ENERGY RANGE: 0 - 16 eV
ANALYZER ENERGY RESOLUTION: 0.l eV
ELECTRON CURRENT AT DETECTOR: "lO'° A
ANGLE OF EXIT: not critical (0 - 90°)
SPECTRUM:ORDINATE: Electron Count Rate
ABSCISSA: Analyzer Energy (Electron Energy)
SAMPLE: Defined faces of single crystals usually with chemisorbed
layer
APPLICATIONS: Adsorption and desorption phenomena
SELECTED REFERENCES:
(i) 'The Interrelation of Physics and Mathematics in Ion-Neutralization
Spectroscopy'H. D. Hagstrum and G. E. BeckerPhys. Rev. B, 4 (1971) 4187.

1398 COMMISSION ON MOLECULAR STRUCTURE AND SPECTROSCOPY
(ii) 'Ion Neutralization Spectroscopy'H. B. Hagstrumin Techniques of Metals Research, Volume 6, Part 1, pages 309-335,R. F. Bunshah (editor)Wiley, New York, 1972.
V12. Excited-atom Deexcitation Spectroscopy Using Incident Ions
If a surface has a sufficiently low work function, incident atomic ions with low kineticenergy (15 eV) can be converted to excited atoms by resonance neutralization. Theseexcited atoms in turn eject electrons+ by the process of Auger-deexcitation (sometimescalled Penning Ionization). Usually He ions are used with kinetic energies f the orderof 10 eV. The low work function surface is produced by the adsorption of K ions on ametallic single-crystal surface such as nickel. This process reduces the nickel workfunction from 5.1 eV to 1.6 eV. The main applications of the technique to date arefirstly, to understand the energy considerations involved in the partition between theneutralization and deexcitation processes and secondly, to understand the relative surfacesensitivities of ultraviolet photoelectron spectroscopy, UPS, and ion neutralizationspectroscopy, INS.
SUMMARY
NAME: Excited-Atom Deexcitation Spectroscopy using Incident Ions
CLASS: Particle-Induced Electron Spectroscopies
ACRONYM: None
INCIDENT: Ions
SPECIES: Noble gas ions (usually He)
ENERGY: "5 - 10 eV (kinetic energy)
ENERGY RESOLUTION: Not applicable
INCIDENT ION CURRENT: Low (,,lO_1O A)
BEAM DIAMETER: '5 mm
ANGLE OF INCIDENCE: not critical (typically within therange 20 - 450)
DETECTED: Electrons
ENERGY RANGE: 0 - 16 eV
ANALYZER ENERGY RESOLUTION: ''O.O25 - 0.1 eV
ELECTRON CURRENT AT DETECTOR: \,lOl0 A
ANGLE OF EXIT: not critical (0 - 900)
SPECTRUM:ORDINATE: Electron Count Rate
ABSCISSA: Analyzer Energy (Electron Energy)
SAMPLE: Specially prepared low work function surfaces of singlcrystals. The work function is lowered by adsorbing Kions onto the surface.
APPLICATIONS: Fundamental investigation of the nature of the ionneutralization and excited atom deexcitation and theenergy considerations involved

Classification of the electron spectroscopies (Recommendations 1987) 1399
SELECTED REFERENCE:
'Excited-Atom Deexcitation Spectroscopy using Incident Ions'H. D. Hagstruni
Phys. Rev. Lett., 43 (1979) 1050-1053.
The next two techniques employ metastable helium atoms in the states 2'So and Theseare produced by electron impact on an atom beam from a nozzle. Their kinetic energies aretypically 60 meV (300 K). Highly excited helium atoms in Rydberg states and ions areremoved from the beam by inhomogeneous electric fields. Measurements show the beam to beapproximately 80% He (2150) and 20% He (23S1). The beam diameter is about 3 mm at thesample surface and the beam flux about 108 particles
VI.3. Resonance Ionization Spectroscopy
Metastable inert gas atoms of thermal kinetic energy (<0.1 eV) are incident on a surface.An electron then tunnels from the excited level of the atom to one of the degenerateunoccupied states of the surface (resonance ionization). This leaves a positive ion at thesurface. This ion then decays by the process of neutralization. Firstly, anelectron passes from the surface to the ground state of the positive ion to produce aground state atom. Then the hole created in the valence band is filled by another valenceelectron. Finally an Auger electron is emitted from the surface valence band. Theobserved spectrum is a self-convolution of the local density of states of the outermostsurface layer. This technique is also called resonance deexcitation of metastablenoble-gas atoms. The interpretation of the results is similar to that in Surface PenningIonization Spectroscopy and will be discussed under that heading.
VI.4. Penning Ionization Spectroscopy (PIS or SPIS)
Netastable helium atoms with thermal kinetic energies (<0.1 eV) enter a gas or are incidenton a surface. If the metastable state is sufficiently energetic, in relation to theionization energies of one or more atomic or molecular orbitals or to the surface workfunction of a solid, a valence electron is emitted by direct Auger-deexcitation of themetastable atom. For a solid the energy and angular distribution of the Penning electronsis characteristic of the electronic density of states of the valence band and the surfacetopology. If chemisorbed molecules are present, informations on the symmetries and spatialorientations of the ionized orbitals may be obtained.
The process involved in Penning Ionization Spectroscopy is similar to photoelectronemission but with different selection rules. SPIS can also be compared with ResonanceIonization Spectroscopy and Ion Neutralization Spectroscopy but SPIS is simpler tointerpret than either of these as there is no deconvolution of the surface density ofstates. Compared with ion neutralization and ultraviolet photoelectron emission, resonanceionization and surface Penning ionization are the more surface sensitive as the excitationoccurs at the position where the empty incident atom wave function overlaps with thesurface wave functions, whereas photoelectron emission, for example, occurs over the entireregion covered by the initial state wave function of the photoelectron.
SUMMARY
NAME: 1. Resonance Ionization Spectroscopy2. Penning Ionization Spectroscopy
CLASS: Particle-Induced Electron Spectroscopies
ACRONYMS: 1. None2. PIS, PIES, SPIS, SPIES
ALTERNATIVE NAMES: Metastable-Quenched Electron Spectroscopy (MQES)Metastable (Noble Gas) Deexcitation Spectroscopy (lIDS)
INCIDENT: Metastable Atoms
SPECIES: Noble gas atoms (typically He)

1400 COMMISSION ON MOLECULAR STRUCTURE AND SPECTROSCOPY
ENERGY: Thermal kinetic energy (<0.1 eV)
and,Metastable state potential energy(e.g., He*21S = 20.6 eV and He*23S = 19.8 eV)
ENERGY RESOLUTION: Not applicable
INCIDENT ATOM FLUX: Low
BEAN DIAMETER: "'5 - 8 mm
DETECTED: Electrons
ENERGY RANGE: 0 - "'20 eV
ANALYZER ENERGY RESOLUTION: "0.l eV
ELECTRON CURRENT AT DETECTOR: ,iol2 - lO° A
SPECTRUM:ORlINATE: Electron Count Rate
ABSCISSA: Analyzer Energy (Electron Energy)
SAMPLE: Atomic and molecular gasesSingle crystals with or without chemisorbed layer
APPLICATIONS: Electronic structure of atoms and molecules. (In particular
unoccupied levels).Valence band electronic structure of substrate and chemi-
sorbed layer
SELECTED REFERENCES:
(i) 'Penning Ionization'M. J. ShawContemp. Phys., 15 (1974) 445.
(ii) 'Probing the Local Density of States of Metal Surfaces by Deexcitationof Metastable Nobel Gas Atoms'W. Sesselmann, H. Conrad, G. Ertl, J. Kuppers, B. Woratschek and
H. HaberlandPhys. Rev. Lett., 50 (1983) 446.
(iii) 'V. Cermak Memorial Issue'J. Electron Spectrosc. Relat. Phenom., 23 (1981).
VII. FIELD EMISSION ELECTRON SPECTROSCOPY (FES)
Field Emission is the emission of electrons from a cold cathode upon application of anintense electric field. An electric field strength of the order of lO Vm-1 is requiredfor the electrons to tunnel through the surface barrier. To achieve these field strengthswith realistic applied voltages of a few thousand volts the emitting cathode is etched to avery sharp point. This system is the basis of Field Emission Microscopy (FEM) and, withthe addition of helium gas, Field Ion Microscopy (FIN). In Field Emission Microscopyhowever, the information about the surface contained in the electron energy distribution isforfeited in order to retain the spatial information for microscopy. However, if electronsfrom only a small area of the surface are collected and energy analyzed we have an electronspectroscopy. This is usually known as Field Emission Energy Distribution Spectroscopy(FEEDS) or Field Emission Spectroscopy (F1)Of recent interest is the spin polarizationof electrons by tunneling through the spin-dependent surface potential of a ferromagneticmaterial, This spin dependence occurs because in a ferromagnet, the density of themajority electron spins differs from that of the minority electron spins. This impliesthat the interaction between a given tunneling electron and the other electrons in thesurface (the exchange-correlation interaction) depends on the spin of the tunnelingelectron. The surface of a ferromagnetic material therefore acts as a spin filter forelectrons tunneling through it during field emission. This effect is known asField-Emitted Electron Polarization (Spectroscopy) (FEESP).

Classification of the electron spectroscopies (Recommendations 1987) 1401
vII.1. Field Emission Energy Distribution Spectroscopy (FEEDS)
The sample is a single crystal, etched to a point ("l0-7m in radius). The crystal is at apotential of several kilovolts to an earthed phosphor screen with a small probe hole in itfor electrons from a selected spot to pass through. The region of the surface to beanalyzed is selected by deflection plates near the cathode. Electrons passing through theprobe hole are decelerated by an electron lens system into an electron energy analyzer.The FEED spectrum is displayed as the electron intensity as a function of the differencebetween the electron energy and the Fermi energy of the surface. The measured energydistribution is the total energy distribution, not as was first thought the normal energydistribution, as the conservation of energy converts the transverse component of theelectron momentum at the surface into radial momentum (along the field lines) at the probehole. One particular advantage of FEED spectroscopy is that it is combined with FEMicroscopy so that particular faces of a crystal may be identified and selected before thespectrum is recorded. The FEED spectrum measures the one-dimensional density of surfacestates.
When an adsorbed species is present the interaction between the adsorbate and the surfacesubstrate leads to a 'virtual adsorbate level' (in fact a very narrow local density ofstates). This level which is narrow in the isolated adsorbate atom is therefore broadenedby the substrate interaction (as the lifetime of an electron in the adsorbate atom is nolonger infinite). When an electron tunneling from the substrate has the same energy as abound state in the adsorbate a resonance will occur which increases the tunnelingprobability and hence emission current by a factor of 102 - lOs. These resonance featuresin the spectrum can be used to detect single adsorbed atoms.
There are two substantial limitations to FEED spectroscopy. Firstly, only a limited numberof materials can be prepared as single crystals and then etched into suitable emittergeometries. Secondly, the tunneling probability decreases exponentially with increasedbinding energy in the valence band, so only the first 2 or 3 eV below the Fermi level canbe sampled.
SuMMARY
NAME: Field Emission Energy Distribution Spectroscopy
CLASS: Field Emission Electron Spectroscopies
ACRONYMS: FEED, FEEDS, FES
ALTERNATIVE NAME: Field Emission Spectroscopy (FES)
RELATED TECHNIQUE: Field-Emitted Electron Spin Polarization Spectroscopy
(FEESP)
ELECTRIC FIELD:9 -l
ELECTRIC FIELD STRENGTH: "'10 Vm
APPLIED VOLTAGE: - 10 kV
SAMPLE AREA: "10 - 100 nm
DETECTED: Electrons
ENERGY RANGE: "2 keV (scanned range of "10 eV)
ANALYZER ENERGY RESOLUTION: "0.020 eV
ELECTRON CURRENT AT DETECTOR: 1O8 - lO A
ANGLE OF EXIT: Forward with a wide spread
ANGULAR RESOLUTION: Very high (5 x lO rad)
SPECTRUM:
ORDINATE: Electron Current (Spin-analyzed Electron Currentin FEESP)
ABSCISSA: Analyzer Energy (Electron Energy)
SAMPLE: Defined faces of single crystals with or without a chemi-sorbed layer. FEESP requires a ferromagnetic material.

1402 COMMISSION ON MOLECULAR STRUCTURE AND SPECTROSCOPY
APPLICATIONS: Analysis of part of the valence band electronic states ofa surface and electronic levels of the adsorbate
SELECTED REFERENCES:
(i) 'Field Emission Energy Distribution of Clean Surfaces?P. Soven, E. W. Plummer and N. KarCRC Critical Reviews in Solid State Sciences, 6 (1976) 111-131.
(ii) 'Photoemission and Field Emission Spectroscopy'E. W. Pluinmerin Interactions on Metal Surfaces,R. Gomer (editor)
Topics in Applied Physics, Volume 4, Springer-Verlag, 1975.
(iii) 'Polarization of Electrons by Tunneling through a Surface Potential'D. NagySurf. Sci., 90 (1979) 102-108.
VIII. THERMIONIC EMISSION ELECTRON SPECTROSCOPY
Thermionic emission provides information on the energy barrier at the surface of amaterial, but the emitted electrons represent the tail of the Fermi distribution and thusprovide no direct information about energy levels. For this reason there is no electronspectroscopy based on thermionic emission.
INDEX OF SPECTROSCOPIES AND ACRONYMS
The earlier IUPAC report ('Nomenclature and Spectral Presentation in Electron Spectroscopy
resulting from excitation by photons: Recommendations 1975', Pure Appl. Chem., 45(1976) 221-224) discourages the use of acronyms and abbreviations and makes certainrecommendations for their usage where unavoidable. In particular, the acronym or abbrevia-tion should not be used in the title of a publication; the first appearance should followthe name of the spectroscopy to which it refers; the letters 'E' and 'S' should always mean'electron' and 'spectroscopy' or 'spectrum' and where the letter '5' appears in the acronymor abbreviation to mean 'spectroscopy' or 'spectrum' it should not be followed by the word
'spectroscopy' or 'spectrum'.
The presence of an acronym in this index should not be read as a recommendation for itsuse.
ADAS Angular-Dependent Auger Spectroscopy IV.2
ADES Angle-Dispersed Electron Spectroscopy 1.1,1.4
AEAPS Auger Electron Appearance Potential Spectroscopy 111.2
AEES Auger Electron Emission Spectroscopy IV
AEPECS Auger Electron-Photoelectron Coincidence Spectroscopy V
AES Auger Electron Spectroscopy, Auger Emission IV
Spectros copy
AIUPS Angle-Integrated Ultraviolet Photoelectron 1.1
Spectros copy
APD Azimuthal Photoelectron Diffraction 1.6
APECS Auger-Photoelectron Coincidence Spectroscopy V
APS Appearance Potential Spectroscopy III
APYS Auger-Electron Partial Yield Spectroscopy I.4.c

Classification of the electron spectroscopies (Recommendations 1987) 1403
ARAES IV
ARP I.l,I.4.fARPEFS I.4.h
ARPES ) 1.1,1.4ARPS )
ARUPS I.1,I.4.f
ARXPS I.2,I.4.f,I.6AS IV
BIS II.B.2
- IV.6
BS II.B.3
CEELS II.A.2
CELS II.A.2
CFSS I.4.e
CIS II.B.2
CISS I.4.d
CLS II.A.2, II.A.4
- II.A.4CXAES IV.6
DAPS 111.3
DSMS 1.3
DSPES 1.3
e,2e ) VE2E )
EAAPS 111.2
EAES IV.l
EAPFS ) 111.6EAPFSS)
EDCS I.4.a
EDS I.4aII .B
EEAES IV.1
EELFS II.A.3
EELS II.A.2
EEXAPS 111.1
EIAES IV.l
EIS II.A
Angle-Resolved Auger Electron Spectroscopy
Angle-Resolved Photoemission (Spectroscopy)
Angle-Resolved Photoemission (or Photoelectron)Extended Fine Structure (Spectroscopy)
Angle-Resolved Photoelectron Spectroscopy
Angle-Resolved Ultraviolet Photoelectron Spectroscopy
Angle-Resolved X-ray Photoelectron Spectroscopy
Auger Spectroscopy
Brernsstrahlung Isochromat Spectroscopy
Bremsstrahlung-Induced Auger Electron Spectroscopy
Bremsstrahlung Spectroscopy, Momentum-ResolvedBremsstrahlung Spectroscopy
Characteristic Electron Energy Loss Spectroscopy
Characteristic Energy Loss Spectroscopy
Constant-Final-State Spectroscopy
Characteristic Isochromat Spectroscopy
Constant-Initial-State Spectroscopy
Characteristic Loss Spectroscopy
Core-Level Characteristic Loss Spectroscopy
Continuous X-ray-Induced Auger Electron Spectroscopy
Disappearance Potential Spectroscopy
Depth-Selective M6ssbauer Spectroscopy
Depth-Selective Photoelectron Spectroscopy
Electron-Electron Coincidence Spectroscopy
Electron-Excited Auger-Electron Appearance Potential
Spectroscopy
Electron Excited Auger Electron Spectroscopy
Extended (or Electron) Appearance Potential Fine-Structure (Analysis or Spectroscopy)
Energy Distribution Curve Spectroscopy
Energy Distribution Spectroscopyor Energy-Dispersive (X-ray Analysis) Spectroscopy
Electron Excited Auger Electron Spectroscopy
Extended-Energy-Loss Fine-Structure (Spectroscopy)
Electron Energy Loss Spectroscopy
Electron Excited X-ray Appearance Potential
Spectroscopy
Electron Induced Auger Electron Spectroscopy
Electron Impact Spectroscopy

1404 COMMISSION ON MOLECULAR STRUCTURE AND SPECTROSCOPY
ELEED Elastic Low Energy Electron Diffraction IV.A.2
ELS Energy Loss Spectroscopy II.A
EMAS Electron Microprobe Auger Spectroscopy IV.l
EPMA Electron Probe Microanalysis II.B
ESCA Electron Spectroscopy for Chemical Applications 1.2
(or Analysis)
ETS Electron Transmission Spectroscopy or Electron II.A.5
Tunneling Spectroscopy
EXAFS ) Extended X-ray Absorption Fine-Structure I.4.hEXAFSS) (Spectroscopy)
EXAPS Electron Excited X-ray Appearance Potential 111.1
Spectros copy
- Exoelectron Emission Spectroscopy VI
EXELFS Extended Electron-Energy-Loss Fine-Structure II.A.3
(Spectroscopy)
- Excited-Atom Deexcitation Spectroscopy Using Incident VI.2Ions
FEED ) Field Emission Energy Distribution (Spectroscopy) VII.lFEEDS)
FEM Field Emission Microscopy VII
FES Field Emission Spectroscopy VII.l
FEESP Field-Emitted Electron Spin-Polarization VII
(Spectroscopy)
FIM Field Ion Microscopy VII
Gamma Ray Photoelectron Spectroscopy 1.3
HAES He+_Excited Auger Electron Spectroscopy IV.4
HEELS High Energy Electron Energy Loss Spectroscopy II.A.3
HEELS High Resolution Energy Loss Spectroscopy II.A.l
HIREELS High Resolution Electron Energy Loss Spectroscopy II.A.l
HRELS High Resolution Energy Loss Spectroscopy II.A.l
HRXPS High Resolution X-ray Photoelectron Spectroscopy 1.2
IAES Ion Excited Auger Electron Spectroscopy IV.4
IEAES Ion Excited Auger Electron Spectroscopy IV.4
IEMN Incident Energy Modulation Method (Spectroscopy) 111.2
TESS Inelastic Electron Scattering Spectroscopy II.A.2
lETS Inelastic Electron Tunneling Spectroscopy 111.7
IIAES Ion Induced Auger Electron Spectroscopy IV.4
ILEED Inelastic Low Energy Electron Diffraction II.A.2
ILS Ionization Loss Spectroscopy II.A.4
INS Ion Neutralization Spectroscopy VI.l
IPES Inverse Photoemission Spectroscopy II.B.l

Classification of the electron spectroscopies (Recommendations 1987) 1405
IPS Inverse Photoemission Spectroscopy II.B.l
IS Ionization Spectroscopy II.A.4
- Isochromat Spectroscopy II.B.2
KRIPES k>_resolved Inverse Photoemission Spectroscopy II.B.l
LEED Low Energy Electron Diffraction I.6,II.A
LEELS Low Energy Electron Loss Spectroscopy II.A.l
MDS Metastable (Noble Gas) Deexcitation Spectroscopy VI.3,VI.4
MQES Metastable-Quenched Electron Spectroscopy VI.3,VI.4
NEXAFS Near-Edge X-ray Absorption Fine-Structure I.4.h
(Spectroscopy)
NPD Normal Photoelectron Diffraction 1.6
PAES Proton Induced Auger Electron Spectroscopy IV.4
- Partial Yield EXAFS I.4.h
PD ) Photoelectron Diffraction 1.6
PED )
PES (Ultraviolet) Photoelectron (or Photoemission) 1.1
Spectroscopy
PESM Photoelectron Spectromicroscopy I.5.b
PEYS Photoelectron Yield Spectroscopy I.4.b
PESIS Photoelectron Spectroscopy of the Inner Shell 1.2
PESOS Photoelectron Spectroscopy of the Outer Shell 1.1
PIES Penning Ionization Electron Spectroscopy VI.4
PIPECO Photoion-Photoelectron Coincidence Spectroscopy V
PIS Penning Ionization Spectroscopy VI.4
P15 Partial Yield Spectroscopy I.4.c
- Resonance Ionization Spectroscopy VI.3
- Resonance-Enhanced Photoelectron Spectroscopy 1.4
- Resonant Photoelectron Spectroscopy 1.4
SAES Scanning Auger Electron Spectroscopy IV.l
SAM Scanning Auger Microscopy (or Microprobe) IV.l
- Secondary Electron Emission Spectroscopy II.A
SEELFS Surface Extended-Energy-Loss Fine-Structure II .A. 3
(Spectroscopy)
SEN Scanning Electron Microscopy or Surface II.AElectron Microscopy
SESCA Scanning Electron Spectroscopy for Chemical I.5.a
Applications
SEXAFS Surface Extended X-ray Absorption Fine-Structure I.4.h(Spectroscopy)
SPAES Spin Polarized Auger Electron Spectroscopy IV.3
SPARPES Spin-Polarized Angle-Resolved Photoelectron 1.1
Spectroscopy

1406 COMMISSION ON MOLECULAR STRUCTURE AND SPECTROSCOPY
SPIES Surface Penning Ionization Electron Spectroscopy VI.4
SPIPES Spin Polarized Inverse Photoemission Spectroscopy II.B.l
SPIS Surface Penning Ionization Spectroscopy VI.4
SPPES Spin-Polarized Photoelectron Spectroscopy 1.4
SRPES Synchrotron Radiation Photoelectron Spectroscopy 1.4
STEM Scanning-Transmission Electron Microscopy II.A.3.(a)
SXAPS Soft X-ray Appearance Potential Spectroscopy 111.1
SKES Soft X-ray Emission Spectroscopy II.B
SXPS Soft X-ray Photoelectron Spectroscopy 1.2
TCS (Total Current Spectroscopy ) 111.4(Target Current Spectroscopy )
UPES )
UPS ) Ultraviolet Photoelectron (or Photoemission) 1.1UVPES ) SpectroscopyUVPS )
IJVBIS Ultraviolet Bremsstrahlung Isochromat Spectroscopy II.B.l
VBXES Valence Band (-Core) X-ray Emission Spectroscopy II.B
XAES X-ray Excited Auger Electron Spectroscopy IV.6
XANES X-ray Absorption Near-Edge Structure (Spectroscopy) I.4.h
XAPS X-ray Appearance Potential Spectroscopy 111.1
XBIS X-ray Bremsstrahlung (Isochromat) Spectroscopy II.B.2
XEAES X-ray Excited Auger Electron Sepctroscopy IV.6
XEAPS X-ray Excited Electron Appearance Potential 111.5
Spectros copy
XES X-ray Emission Spectroscopy II.B
XIAES X-ray Induced Auger Emission Spectroscopy IV.6
XIS X-ray (Continuum) Isochromat Spectroscopy II.B.2
XPD ) X-ray Photoelectron Diffraction 1.6XPED
XPES ) X-ray Photoelectron (or Photoemission) Spectroscopy 1.2XPS )
XRD X-ray Diffraction 1.4
XRF X-ray Fluorescence Spectroscopy II.B
XUPS ) Photoelectron Spectroscopy in Region Between UV and 1.2XUVPES) X-ray