Embed Size (px)
Citation preview
HAL Id: hal-03007737https://hal.univ-lorraine.fr/hal-03007737
Submitted on 16 Nov 2020
HAL is a multi-disciplinary open accessarchive for the deposit and dissemination of sci-entific research documents, whether they are pub-lished or not. The documents may come fromteaching and research institutions in France orabroad, or from public or private research centers.
L’archive ouverte pluridisciplinaire HAL, estdestinée au dépôt et à la diffusion de documentsscientifiques de niveau recherche, publiés ou non,émanant des établissements d’enseignement et derecherche français ou étrangers, des laboratoirespublics ou privés.
Ultrasound imaging of congestion in heart failure –Examinations beyond the heart
Pierpaolo Pellicori, Elke Platz, Jeroen Dauw, Jozine ter Maaten, PieterMartens, Emanuele Pivetta, John Gf Cleland, John J.V. Mcmurray, Wilfried
Mullens, Scott Solomon, et al.
To cite this version:Pierpaolo Pellicori, Elke Platz, Jeroen Dauw, Jozine ter Maaten, Pieter Martens, et al.. Ultrasoundimaging of congestion in heart failure – Examinations beyond the heart. European Journal of HeartFailure, Oxford University Press (OUP), 2020, �10.1002/ejhf.2032�. �hal-03007737�

1
Ultrasound imaging of congestion in heart failure – Examinations beyond the heart
*Pierpaolo Pellicori1, *Elke Platz
2,*Jeroen Dauw
3,4, Jozine M Ter Maaten
3,5, Pieter
Martens3,4
, Emanuele Pivetta6, John GF Cleland
1, John J.V. McMurray
7, Wilfried Mullens
3,8,
Scott D. Solomon2, Faiez Zannad
9, **Luna Gargani
10, **Nicolas Girerd
9
*Equally first author
**Equally last author
Short title: Imaging of congestion
1 Robertson Institute of Biostatistics and Clinical Trials Unit, University of Glasgow.
2Cardiovascular Division, Brigham and Women's Hospital and Harvard Medical
School, Boston, MA, USA.
3 Department of Cardiology, Ziekenhuis Oost-Limburg (ZOL), Genk, Belgium
4Doctoral School for Medicine and Life Sciences, Hasselt University, Diepenbeek,
Belgium.
5Department of Cardiology, University Medical Center Groningen, Groningen, the
Netherlands
6Division of Emergency Medicine and High Dependency Unit, AOU Città della Salute e
della Scienza di Torino, Cancer Epidemiology Unit and CPO Piemonte, Department of
Medical Sciences, University of Turin, Turin, Italy.
7BHF Cardiovascular Research Centre, Institute of Cardiovascular and Medical
Sciences, University of Glasgow, Glasgow, UK.
8Biomedical Research Institute, Faculty of Medicine and Life Sciences, LCRC, Hasselt
University, Diepenbeek, Belgium.

2
9Université de Lorraine, INSERM, Centre d’Investigations Cliniques Plurithématique,
INSERM 1433, CHRU de Nancy, Institut Lorrain du Coeur et des Vaisseaux, Nancy,
France, and INI-CRCT (Cardiovascular and Renal Clinical Trialists) F-CRIN Network,
Nancy, France
10Institute of Clinical Physiology, National Research Council, Pisa, Italy
Conflict of interest. PM: has received a research grant from Vifor pharma and Fonds
Wetenschappelijk Onderzoek (grant number: 1127917N) and consultancy fees from
AstraZeneca, Boehringer-Ingelheim, Novartis and Vifor pharma.EPl: has received research
grants from NIH and the American Heart Association and her employer has received support
from Novartis for consulting work.NG: is funded by a public grant overseen by the French
National Research Agency (ANR) as part of the second “Investissements d’Avenir” program
FIGHT-HF (reference: ANR-15-RHU-0004) and by the French PIA project “Lorraine
Université d’Excellence”, reference ANR-15-IDEX-04-LUE, and received honoraria from
Novartis and Boehringer. LG has received research grants from the Italian Ministry of Health
and consultancy fees from GE Healthcare and Philips Heatlhcare.PP has received a research
grant (Scotland Grant) from Heart Research UK.
Corresponding author:
Dr. Pierpaolo Pellicori
Robertson Institute of Biostatistics and Clinical Trials Unit
University of Glasgow
University Avenue, Glasgow, G12 8QQ, UK.
Tel: +44 0 141 330 4744; Fax: +44 0 141 330 5094
Email: [email protected]

3
Abstract
Congestion, related to pressures and/or fluid overload, plays a central role in the
pathophysiology, presentation and prognosis of heart failure and is an important therapeutic
target. While symptoms and physical signs of fluid overload are required to make a clinical
diagnosis of heart failure, they lack both sensitivity and specificity, which might lead to
diagnostic delay and uncertainty. Over the last decades, new ultrasound methods for the
detection of elevated intracardiac pressures and/or fluid overload have been developed that
are more sensitive and specific, thereby enabling earlier and more accurate diagnosis and
facilitating treatment strategies. Accordingly, we considered that a state-of-the-art review of
ultrasound methods for the detection and quantification of congestion was timely, including
imaging of the heart, lungs (B-lines), kidneys (intrarenal venous flow), and venous system
(inferior vena cava and internal jugular vein diameter).
Key words: Ultrasound, heart failure, B-lines, inferior vena cava, intrarenal venous flow,
jugular vein.

4
Background
Congestion, related to pressure and/or volume overload, is fundamental to the
pathophysiology, presentation and prognosis of heart failure (HF) 1,2
. Early detection of
elevated cardiac or venous pressures is important, as intensification of treatment before signs
and symptoms worsen may reduce morbidity in patients with HF 3.
Despite their importance, the clinical identification and quantification of HF signs or
symptoms remains challenging even for experienced physicians4,5
. Clinical symptoms and
signs are late manifestations of congestion and are neither sensitive nor specific for HF.
Moreover, no agreement exists on how to grade signs of fluid overload6. The measurement of
natriuretic peptides, a measure of myocardial wall stretch, is recommended as a diagnostic
tool in the assessment of patients with suspected HF and provides important prognostic
information1. However, natriuretic peptide levels are influenced by many factors, including
age, body mass index and atrial fibrillation, and natriuretic peptide-guided treatment has not
been convincingly shown to improve outcomes in patients with HF7. Other costly and
invasive tools can monitor pulmonary artery pressure to help guide therapies. However, more
evidence is needed on patients’ selection and the cost-effectiveness of these devices 3,8. Non-
invasive technologies to assess fluid status such as weighing-scales, cardiac bio-impedance,
and remote dielectric sensing (ReDS) are being investigated but, apart from weight, have not
been widely adopted 9,10
.
Ultrasound continues to play a key role in the non-invasive assessment of cardiac structure
and function in patients with HF. The aim of this review is to describe ultrasound
measurements that move beyond the heart and are associated with either a) elevated venous
pressures (inferior vena cava and internal jugular vein diameter and intrarenal venous flow) or

5
b) extravascular fluid in the lungs (B-lines) that may be useful in the assessment and
monitoring of patients with known or suspected HF. In the next paragraphs we will describe
how to perform and interpret these techniques (central figure) and briefly summarise the
current state of evidence supporting their clinical use.
Cardiac ultrasound (echocardiography)
Transthoracic echocardiography (TTE) plays a central role in the diagnosis and management
of patients with HF. TTE is the most available method to measure left ventricular ejection
fraction (LVEF), which is used to categorise patients as HF with reduced (HFrEF) or
preserved LVEF (HFpEF), a distinction relevant for their management. TTE can also rapidly
exclude, or identify, the presence of significant valvular disease, previously undetected
congenital problems, and pleural or pericardial effusions. However, many people with
breathlessness do not have reduced LVEF or valve disease to account for their symptoms,
but left ventricular hypertrophy and impaired long-axis systolic dysfunction by global
longitudinal strain are common findings11
. The evaluation of mitral inflow, mitral annulus
motion by tissue Doppler imaging and left atrial volumes and function provide additional
estimates of left ventricular filling pressures 12
, but no universal agreement exists on how to
combine them to identify individuals at greater risk 1,13,14
. Pulmonary hypertension, right
ventricular dysfunction and greater severity of tricuspid regurgitation all indicate a worse
outcome and can be assessed on TTE, but their evaluation might be limited by poor acoustic
window or inability to obtain a clear Doppler signal 15
. As the comprehensive evaluation of
cardiac structure and function in HF goes beyond the scope of this review, the following
sections focus on the extracardiac ultrasound methods for the assessment of raised venous
pressures and extravascular lung fluid in HF 16
.

6
Inferior vena cava ultrasound
The inferior vena cava (IVC) is a compliant vessel, in anatomical continuation with the right
atrium. Any change in right atrial pressure is transmitted backward, and modifies IVC size: a
substantial and sustained increase in right atrial pressure, as seen in heart failure, would
eventually cause IVC distention. However, studies conducted in patients undergoing cardiac
catheterisation have only found modest correlations between right atrial pressure and IVC
diameter measured by echocardiography17
; these relations are even weaker in those who are
mechanically ventilated (table 1)18
.
How to perform IVC ultrasound
The diameter of the IVC should be measured with a phased array or curvilinear transducer
with the patient in supine position in the subcostal view at 1.0 to 2.0 cm from the junction
with the right atrium, using the long-axis view 19
. For accuracy, this measurement should be
made perpendicular to the long axis of the IVC.
How to quantify and interpret IVC ultrasound
Measurement of the IVC diameter and its changes with respiration is possible in most adults.
An IVC smaller than 21 mm that collapses >50% suggests normal right atrial pressures19
. IVC
diameter might detect increasing intravascular volume even prior to any change in symptoms
or body weight in ambulatory HF patients 10
, or monitor response to diuretics in hospitalised
patients with heart failure 20
. Persistent IVC engorgement predicts a poor outcome21-23
.
Whether diuretic therapy guided by serial IVC assessments, compared with usual care, might
decrease rehospitalisation in patients admitted for HF is currently under evaluation
(NCT03140566; NCT02892227). In ambulatory patients with HF who are already on
treatment, guidelines do not recommend monitoring cardiac function or ventricular filling

7
pressures routinely by echocardiography, unless there is substantial clinical deterioration.
However, up to half of HF patients with minimal symptoms, and without clinical signs of
congestion, have a dilated IVC and other abnormal ultrasonic markers of elevated intracardiac
pressures or extravascular lung fluid, which are also associated with elevated NPs and an
increase in mortality 24
.
Internal jugular vein ultrasound
An elevated jugular venous pressure (JVP) is a marker of volume or pressure overload and
right ventricular failure, and associated with an increase in mortality in patients with HF 25
.
Clinical evaluation of the JVP is subjective, requires clinical expertise and can be challenging
in obese patients. Therefore, identifying and quantifying JV distention is difficult and an
elevated JVP may be missed clinically 26,27
.
How to assess internal jugular vein by ultrasound
The internal jugular vein (IJV) is a superficial and distensible vessel, which lies close to the
carotid artery, under the sternocleidomastoid muscle and can be easily visualised with
ultrasound. Assessment of IJV should be performed with the patient reclining and head and
neck elevated at 45° (semi-recumbent position). Care should be taken to avoid IJV
compression during examination. When the patient is supine, the IJV is likely to be
distended, but in a sitting position JVP drops and the IJV often collapses. When central
venous pressure is low, it may be difficult to visualise the IJV; asking the patient to cough, or
to perform a Valsalva manoeuvre, will lead to engorgement, allowing it to be identified on
ultrasound.

8
The IJV can be imaged by placing a high frequency linear transducer (~10 MHz) just below
the angle of the jaw, in the area of the sternocleidomastoid muscle, and then moving it
inferiorly toward the angle of Louis (or manubriosternal junction). In most cases, the IJV is
identified less than 5 cm below the angle of the jaw. Subsequently, the IJV diameter and its
changes are measured continuously by M-mode, or in a 2-dimensional frame, at rest and
during a Valsalva manoeuvre. The ratio between the maximal diameter during the Valsalva
manoeuvre to that at rest (at the end of the expiratory phase) is called the JVD ratio (Figure
1). Measuring the JVD ratio can be done in almost all patients and inter-observer variability is
low 28
. Other authors have proposed measuring the cross-sectional area of the IJV, and how it
changes during the Valsalva manoeuvre, to identify patients with elevated right atrial pressure
29,30.
How to interpret images of the internal jugular vein
In people without HF, or in patients in whom congestion is adequately controlled, the
diameter of the IJV is small at rest (~ 0.10-0.15 cm), but increases several-fold during a
Valsalva manoeuvre (usually up to ~ 1 cm) 28,31.
. Because of limited vessel compliance, the
maximal IJV diameter that can be achieved during a Valsalva maneuver is similar in people
with or without HF. When intra-vascular congestion worsens, it increases the IJV diameter at
rest, leading to a reduced JVD ratio. A JVD ratio below 4 is abnormal and, when congestion
is severe, the ratio may decrease to <2 24,28,31
.
In ambulatory HF patients, a low JVD ratio is poorly related to measures of left ventricular
size or systolic function, but strongly associated with severe symptoms, elevated NPs, right
ventricular dysfunction and tricuspid regurgitation 28
. A low JVD ratio predicts a worse
outcome in terms of HF hospitalisations or deaths, independently of NT-proBNP 24,27,31
.

9
When IJV cross-sectional area, rather than its diameter, is used, a large variation during a
Valsalva manoeuvre identifies patients more likely to have normal right atrial pressure and
better outcomes 29,30
. Obviously, a Valsalva maneuver depends on the patient’s effort and
ability to follow instructions. For those who are acutely unwell, or cannot perform a Valsalva
maneuver, other techniques, such as passive leg raising, may increase central venous pressure
(CVP) but their effects on IJV diameter have not been assessed yet.
Renal venous ultrasound
Worsening renal function in acute HF is common and has been linked to elevated CVP,
leading to raised renal interstitial pressures, partial collapse of nephrons, ischemia and
neurohormonal activation32
. Recently, ultrasound techniques to assess renal blood flow in HF
have been described 33-36
. Although renal arterial flow can be assessed with Doppler
ultrasound and predicts HF progression 37
, an elevated CVP primarily affects renal venous
flow (RVF).
How to perform renal venous Doppler ultrasound
Doppler assessment of RVF is performed in the left lateral decubitus position, using a convex
or sector transducer (2.5-5 MHz) aligned with the lowest intercostal space rendering a
longitudinal view of the right kidney. Using color Doppler imaging with the flow scale
adjusted to low-flow velocities (preferably not more than 20 cm/s), the interlobar veins are
identified. The best aligned vein is then sampled with pulsed wave Doppler during an end-
expiratory breath-hold. The scale should again be adjusted, maximizing the amplitude of the
signal (usually around – 20 cm/s) and the ECG signal should be displayed to synchronize the
RVF signal with the cardiac cycle.

10
How to interpret renal venous Doppler
In normal conditions, the interlobar RVF is continuous with a small varying amplitude during
the cardiac cycle 38
. When CVP increases, the variation of amplitude increases with the
minimal velocity gradually approaching zero and eventually leading to an early discontinuous
flow or ‘pulsatile’ flow 39
(Figure 2). If CVP increases further, a biphasic pattern can be
recognized with two separate flow phases during a cardiac cycle. In very severe cases, the
RVF can become monophasic with a single flow phase in diastole. Analyzing the RVF pattern
thus allows a semi-quantitative assessment of the effects of CVP on renal hemodynamics.
Other more quantitative measures are the venous impedance index (VII) and the venous
discontinuity index (VDI). The VII is the ratio of the difference between maximum and
minimum velocity to the maximum velocity during a cardiac cycle with a number varying
from 0 (no variation in velocity) to 1 (minimum velocity is zero) 38
. As CVP increases the
variation in RVF amplitude, the VII also increases until flow becomes discontinuous and VII
becomes 1. Higher VDI, expressed as the percentage of no-flow time during a cardiac cycle,
is another measure of congestion. Of note, other conditions that increase CVP (i.e.
obstruction), intra-abdominal pressure (i.e. ascites) or intraparenchymal renal pressure (i.e.
obstructive uropathy) can also impair RVF 40
.
Despite its potential, to date, only a few studies have evaluated the role of RVF assessment in
HF management. For inpatients with HF (n=217), a monophasic pattern suggests very high
right atrial pressures (RAP) and a poor prognosis 33
. Another study evaluated the effect of
volume loading and diuretics on RVF in 50 patients with stable HFrEF or HFpEF 34
. After
volume loading, the VII increased substantially and the number of patients with discontinuous
RVF increased from 32% to 80% without any change in IVC estimated CVP, perhaps

11
suggesting that RVF is an earlier marker of the development of congestion. Interestingly,
patients with a lower VII (indicating less renal congestion) had a better diuretic response.
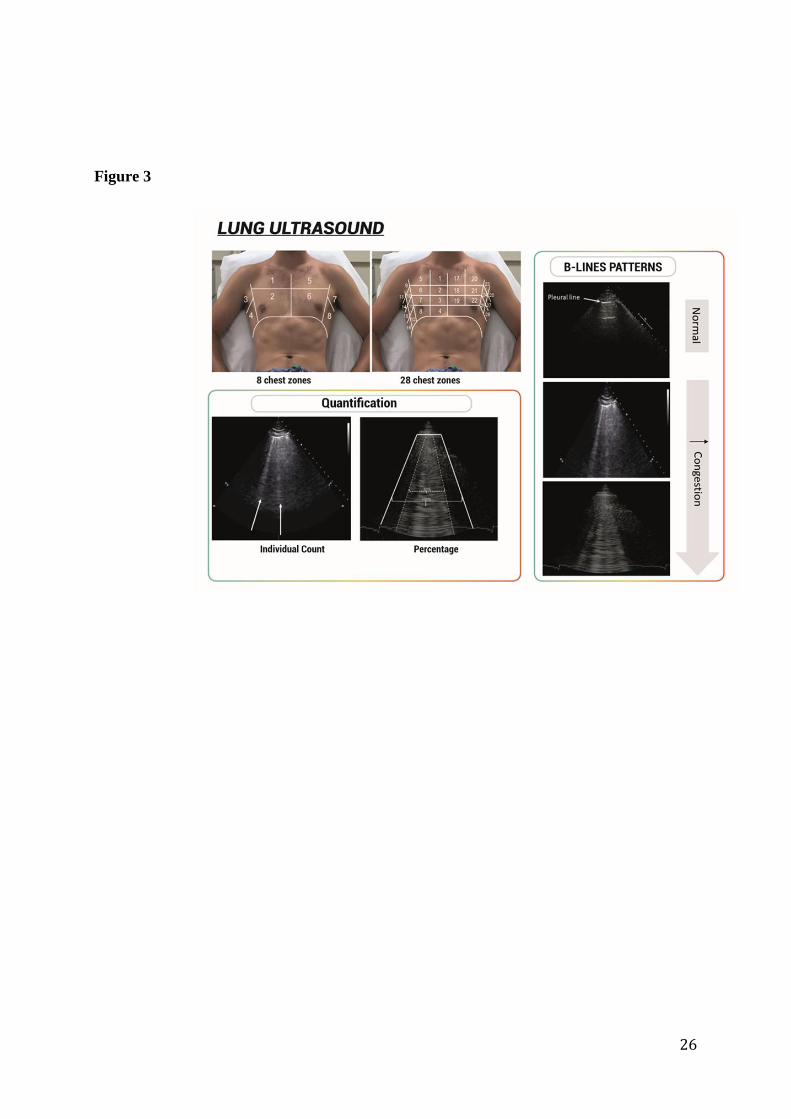
Lung ultrasound
Lung ultrasound (LUS) can be used for the identification and quantification of extravascular
lung fluid in patients with known or suspected HF, at rest or even with exercise41,42
. So called
‘B-lines’ are vertical lines that arise from the pleural line and extend to the far-field of the
ultrasound screen (Figure 3) 43
. B-lines are often observed in patients with HF, but can also
occur in other conditions, such as non-cardiogenic pulmonary oedema and interstitial lung
disease 44,45
.
How to perform lung ultrasound
Several LUS image acquisition protocols have been described, ranging from 4 to 28 chest
regions or “zones”, but the simplified 8-zone protocol is increasingly used both in the clinical
setting and for research. During LUS examination, patients are positioned either sitting
upright, semi-recumbent or supine. Patients should preferably be imaged in the same position
if serial examinations are being performed, as B-line number may be influenced by patient
position, with higher B-line counts in supine position 46
. A phased array or curvilinear
transducer is placed in an intercostal space in a chest zone either perpendicular (longitudinal,
sagittal) or in parallel orientation (transverse) to the ribs at an imaging depth of ~15-18 cm.
Once the gain settings are optimised for visualization of the pleural line and any B-lines, a 6
second clip is recorded with the patient breathing normally 47,48
. Large pleural effusions may
interfere with B-lines identification and should be reported, if seen on ultrasound.
How to quantify and interpret B-lines

12
LUS is more sensitive for the diagnosis of interstitial pulmonary oedema and heart failure
than the clinical examination or chest x-ray in patients with acute dyspnea (Figure 3) 49,50
.
There are several different approaches to quantifying B-lines. Broadly, these can be grouped
into two categories: score or count based methods. Score based methods consider a minimum
number of B-lines in one intercostal space as a “positive” zone (typically at least 3 B-lines)
and then adding up the number of positive zones 48,51
. B-lines can be counted either one by
one in one chest zone52,53
or, when confluent, their number can be estimated from the
percentage of space they occupy on the screen below the pleural line, divided by 10 (i.e. if
about 70% of the screen below the pleural line is occupied by B-lines, it would conventionally
count as 7 B-lines, up to a maximum of 10 per zone)54-57
. All these methods have
demonstrated good intra- and inter-reader agreement 58,59
. In patients with dyspnea presenting
to the emergency department, a cut off value of ≥3 B-lines in at least two zones per
hemithorax (of 6-8 evaluated zones in total) identifies patients with acute HF with higher
sensitivity (94-97%) and specificity (96-97%) than the physical examination and chest x-ray
(and NT-proBNP) (sensitivity 85%, specificity 89-90%) compared to chart review by two
physicians 49,51
. A high number of B-lines at the time of discharge from a hospitalisation for
acute HF or in ambulatory patients with chronic HF identifies those at high risk of subsequent
HF (re-) admissions or death in observational studies 24,53-56,60-64
. However, further
information on the optimal cut-off values for risk stratification in a variety of clinical settings
requires larger prospective studies. Other important methodological aspects of LUS image
acquisition and B-line quantification are detailed in a recent consensus document 65
. A brief
overview of a sample of the current evidence on LUS and other described techniques is
provided in Table 1.
Future directions

13
Comprehensive, semi-quantitative, assessment of venous pressures (inferior vena cava and
internal jugular vein diameter; intrarenal venous flow) and extravascular lung fluid (B-lines)
with ultrasound has several advantages and potential applications in patients with HF. It
requires relatively little training and can be rapidly done in about 15 minutes. It uses existing,
largely available, technology (ranging from high-end ultrasound systems to pocket size
devices), is non-invasive, does not involve radiation and allows for serial, quantifiable,
examinations at the point-of-care in a variety of clinical settings. However, many
echocardiographic laboratories currently lack the additional transducers needed for JVD
ultrasound (linear) and renal ultrasound (curvilinear; Table 1), and sonographers are currently
not trained in these new ultrasound techniques.
Currently, the European Society of Cardiology (ESC)-HF guidelines suggest that the IVC
diameter can be used to assess volume status in patients with HF, whilst LUS can assist with
the detection of extravascular lung fluid (class IIb, level of evidence: C, for both) 1. In
contrast, U.S. HF guidelines do not mention ultrasound as a tool for the evaluation of intra- or
extravascular volume status 66
. While the current level of evidence of the described ultrasound
methods varies, the inclusion of LUS for the detection of extravascular lung fluid in patients
with undifferentiated dyspnea could be considered in future HF guidelines 49,51
.
Further research is needed to gain a better understanding of the clinical utility of these novel
ultrasound methods. For instance, more accurate assessment of congestion might optimize
timing of discharge for patients hospitalized with HF or help tailor diuretic therapy for
ambulatory patients. In addition to physicians, HF nurses and other health care providers can
be trained to perform ultrasound examinations such as IVC ultrasound or LUS 67
. The role of
non-physicians in performing point-of-care ultrasound examinations to guide HF management
14
warrants further investigation. Ultimately, randomized trials are required to demonstrate that
treatment guided by sonographic assessment in HF is safe, improves symptoms and quality of
life and long-term outcomes. Trials are currently ongoing for LUS in patients during an
admission for acute HF (NCT03136198 and NCT03259165), after hospital discharge and in
the outpatient clinic; preliminary results are encouraging68-70
.
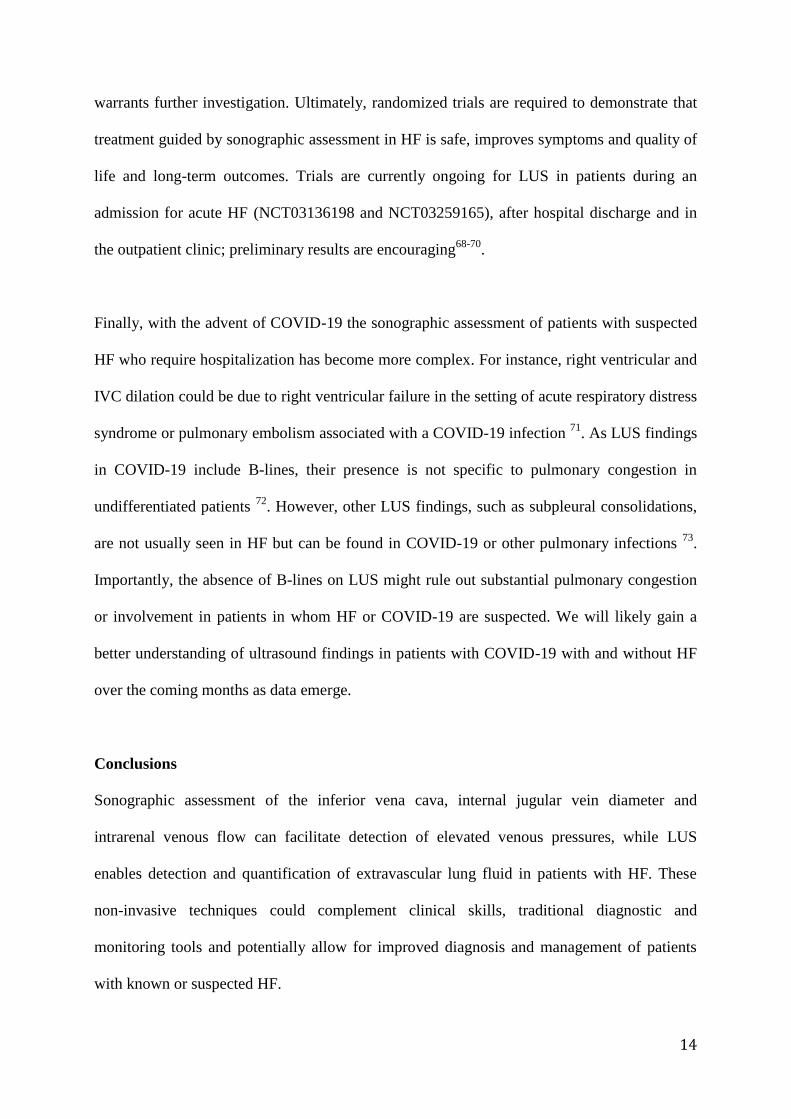
Finally, with the advent of COVID-19 the sonographic assessment of patients with suspected
HF who require hospitalization has become more complex. For instance, right ventricular and
IVC dilation could be due to right ventricular failure in the setting of acute respiratory distress
syndrome or pulmonary embolism associated with a COVID-19 infection 71
. As LUS findings
in COVID-19 include B-lines, their presence is not specific to pulmonary congestion in
undifferentiated patients 72
. However, other LUS findings, such as subpleural consolidations,
are not usually seen in HF but can be found in COVID-19 or other pulmonary infections 73
.
Importantly, the absence of B-lines on LUS might rule out substantial pulmonary congestion
or involvement in patients in whom HF or COVID-19 are suspected. We will likely gain a
better understanding of ultrasound findings in patients with COVID-19 with and without HF
over the coming months as data emerge.
Conclusions
Sonographic assessment of the inferior vena cava, internal jugular vein diameter and
intrarenal venous flow can facilitate detection of elevated venous pressures, while LUS
enables detection and quantification of extravascular lung fluid in patients with HF. These
non-invasive techniques could complement clinical skills, traditional diagnostic and
monitoring tools and potentially allow for improved diagnosis and management of patients
with known or suspected HF.

15
Acknowledgment:
The authors would like to thank Tristan Gigante (INICRCT, Nancy) for his assistance with
the illustrations for this manuscript.

16
References
1. Ponikowski P, Voors AA, Anker SD, et al. 2016 ESC Guidelines for the diagnosis and
treatment of acute and chronic heart failure: The Task Force for the diagnosis and treatment
of acute and chronic heart failure of the European Society of Cardiology (ESC). Developed
with the special contribution of the Heart Failure Association (HFA) of the ESC. Eur J Heart
Fail. 2016;18:891-975.
2. Harjola VP, Mullens W, Banaszewski M, et al. Organ dysfunction, injury and failure
in acute heart failure: from pathophysiology to diagnosis and management. A review on
behalf of the Acute Heart Failure Committee of the Heart Failure Association (HFA) of the
European Society of Cardiology (ESC). Eur J Heart Fail. 2017;19:821-836.
3. Abraham WT, Adamson PB, Bourge RC, et al. Wireless pulmonary artery
haemodynamic monitoring in chronic heart failure: a randomised controlled trial. Lancet.
2011;377:658-666.
4. Lok CE, Morgan CD, Ranganathan N. The accuracy and interobserver agreement in
detecting the 'gallop sounds' by cardiac auscultation. Chest. 1998;114(5):1283-8.
5. Breidthardt T, Moreno-Weidmann Z, Uthoff H, et al. How accurate is clinical assessment
of neck veins in the estimation of central venous pressure in acute heart failure? Insights from
a prospective study. Eur J Heart Fail. 2018;20(7):1160-1162. d
6. Gheorghiade M, Follath F, Ponikowski P, et al. Assessing and grading congestion in
acute heart failure: a scientific statement from the acute heart failure committee of the heart
failure association of the European Society of Cardiology and endorsed by the European
Society of Intensive Care Medicine. Eur J Heart Fail 2010;12:423-433.
7. Felker GM, Anstrom KJ, Adams KF, et al. Effect of Natriuretic Peptide-Guided
Therapy on Hospitalization or Cardiovascular Mortality in High-Risk Patients With Heart
Failure and Reduced Ejection Fraction: A Randomized Clinical Trial. JAMA. 2017;318:713-
720.
8. Mullens W, Sharif F, Dupont M, Rothman AMK, Wijns W. Digital health care solution for
proactive heart failure management with the Cordella Heart Failure System: results of the
SIRONA first-in-human study. Eur J Heart Fail. 2020 May 31. doi: 10.1002/ejhf.1870. Epub
ahead of print. PMID: 32476191.
9. Amir O, Ben-Gal T, Weinstein JM, et al. Evaluation of remote dielectric sensing (ReDS)
technology-guided therapy for decreasing heart failure re-hospitalizations. Int J Cardiol. 2017
Aug 1;240:279-284.
10. Dovancescu S, Pellicori P, Mabote T, Torabi A, Clark AL, Cleland JGF. The effects of
short-term omission of daily medication on the pathophysiology of heart failure. Eur J Heart
Fail. 2017;19:643-649
11. Pellicori P, Kallvikbacka-Bennett A, Khaleva O, et al. Global longitudinal strain in
patients with suspected heart failure and a normal ejection fraction: does it improve diagnosis
and risk stratification? Int J Cardiovasc Imaging. 2014 Jan;30(1):69-79.
12. Pieske B, Tschope C, de Boer RA, et al. How to diagnose heart failure with preserved
ejection fraction: the HFA-PEFF diagnostic algorithm: a consensus recommendation from the
Heart Failure Association (HFA) of the European Society of Cardiology (ESC). Eur Heart J.
2019;40:3297-3317.
13. Nagueh SF, Smiseth OA, Appleton CP, et al. Recommendations for the Evaluation of
Left Ventricular Diastolic Function by Echocardiography: An Update from the American
Society of Echocardiography and the European Association of Cardiovascular Imaging. Eur
Heart J Cardiovasc Imaging. 2016;17:1321-1360.

17
14. Huttin O, Fraser AG, Coiro S, et al. Impact of Changes in Consensus Diagnostic
Recommendations on the Echocardiographic Prevalence of Diastolic Dysfunction. J Am Coll
Cardiol. 2017 Jun 27;69(25):3119-3121.
15. Damy T, Goode KM, Kallvikbacka-Bennett A, et al. Determinants and prognostic
value of pulmonary arterial pressure in patients with chronic heart failure. Eur Heart J.
2010;31:2280‐ 2290. doi:10.1093/eurheartj/ehq245
16. Mitchell C, Rahko PS, Blauwet LA, et al. Guidelines for Performing a Comprehensive
Transthoracic Echocardiographic Examination in Adults: Recommendations from the
American Society of Echocardiography. J Am Soc Echocardiogr. 2019;32:1-64.
17. Kircher BJ, Himelman RB, Schiller NB. Noninvasive estimation of right atrial
pressure from the inspiratory collapse of the inferior vena cava. Am J Cardiol.
1990;66(4):493-496.
18. Nagueh SF, Kopelen HA, Zoghbi WA. Relation of mean right atrial pressure to
echocardiographic and Doppler parameters of right atrial and right ventricular function.
Circulation. 1996;93:1160-1169.
19. Lang RM, Badano LP, Mor-Avi V, et al. Recommendations for cardiac chamber
quantification by echocardiography in adults: an update from the american society of
echocardiography and the European association of cardiovascular imaging. J Am Soc
Echocardiogr. 2015;28:1-39 e14.
20. Laffin LJ, Patel AV, Saha N, et al. Focused cardiac ultrasound as a predictor of
readmission in acute decompensated heart failure. Int J Cardiovasc Imaging. 2018;34:1075-
1079.
21. Goonewardena SN, Gemignani A, Ronan A, et al. Comparison of hand-carried
ultrasound assessment of the inferior vena cava and N-terminal pro-brain natriuretic peptide
for predicting readmission after hospitalization for acute decompensated heart failure. JACC
Cardiovasc Imaging. 2008;1:595-601.
22. Cubo-Romano P, Torres-Macho J, Soni NJ, et al. Admission inferior vena cava
measurements are associated with mortality after hospitalization for acute decompensated
heart failure. J Hosp Med. 2016;11:778-784.
23. Pellicori P, Carubelli V, Zhang J, et al. IVC diameter in patients with chronic heart
failure: relationships and prognostic significance. JACC Cardiovascular imaging. 2013;6:16-
28.
24. Pellicori P, Shah P, Cuthbert J, et al. Prevalence, pattern and clinical relevance of
ultrasound indices of congestion in outpatients with heart failure. Eur J Heart Fail.
2019;21:904-916.
25. Drazner MH, Rame JE, Stevenson LW, Dries DL. Prognostic importance of elevated
jugular venous pressure and a third heart sound in patients with heart failure. N Engl J Med.
2001;345:574-581.
26. McGee SR. Physical examination of venous pressure: a critical review. Am Heart J..
1998;136:10-18.
27. Pellicori P, Clark AL, Kallvikbacka-Bennett A, et al. Non-invasive measurement of
right atrial pressure by near-infrared spectroscopy: preliminary experience. A report from the
SICA-HF study. Eur J Heart Fail. 2017;19:883-892.
28. Pellicori P, Kallvikbacka-Bennett A, Zhang J, et al. Revisiting a classical clinical sign:
jugular venous ultrasound. Int J Cardiol. 2014;170:364-370.
29. Simon MA, Kliner DE, Girod JP, Moguillansky D, Villanueva FS, Pacella JJ.
Detection of elevated right atrial pressure using a simple bedside ultrasound measure. Am
Heart J. 2010;159:421-427.

18
30. Simon MA, Schnatz RG, Romeo JD, Pacella JJ. Bedside Ultrasound Assessment of
Jugular Venous Compliance as a Potential Point-of-Care Method to Predict Acute
Decompensated Heart Failure 30-Day Readmission. J Am Heart Assoc. 2018;7:e008184.
31. Pellicori P, Kallvikbacka-Bennett A, Dierckx R, et al. Prognostic significance of
ultrasound-assessed jugular vein distensibility in heart failure. Heart. 2015;101:1149-1158.
32. Tang WH, Mullens W. Cardiorenal syndrome in decompensated heart failure. Heart.
2010;96:255-260.
33. Iida N, Seo Y, Sai S, et al. Clinical Implications of Intrarenal Hemodynamic
Evaluation by Doppler Ultrasonography in Heart Failure. JACC Heart fail. 2016;4:674-682.
34. Nijst P, Martens P, Dupont M, Tang WHW, Mullens W. Intrarenal Flow Alterations
During Transition From Euvolemia to Intravascular Volume Expansion in Heart Failure
Patients. JACC Heart fail. 2017;5:672-681.
35. Puzzovivo A, Monitillo F, Guida P, et al. Renal Venous Pattern: A New Parameter for
Predicting Prognosis in Heart Failure Outpatients. Cardiovasc Dev Dis. 2018;5(4).
36. de la Espriella-Juan R, Nunez E, Minana G, et al. Intrarenal venous flow in cardiorenal
syndrome: a shining light into the darkness. ESC heart failure. 2018;5:1173-1175.
37. Ciccone MM, Iacoviello M, Gesualdo L, et al. The renal arterial resistance index: a
marker of renal function with an independent and incremental role in predicting heart failure
progression. Eur J Heart Fail. 2014;16:210-216.
38. Jeong SH, Jung DC, Kim SH, Kim SH. Renal venous doppler ultrasonography in
normal subjects and patients with diabetic nephropathy: value of venous impedance index
measurements. J Clin Ultrasound. 2011;39:512-518.
39. Tang WH, Kitai T. Intrarenal Venous Flow: A Window Into the Congestive Kidney
Failure Phenotype of Heart Failure? JACC Heart fail. 2016;4:683-686.
40. Bateman GA, Cuganesan R. Renal vein Doppler sonography of obstructive uropathy.
AJR Am J Roentgenol. 2002;178:921-925.
41. Scali MC, Cortigiani L, Simionuc A, Gregori D, Marzilli M, Picano E. Exercise-induced
B-lines identify worse functional and prognostic stage in heart failure patients with depressed
left ventricular ejection fraction. Eur J Heart Fail. 2017 Nov;19(11):1468-1478.
42. Simonovic D, Coiro S, Carluccio E, et al. Exercise elicits dynamic changes in
extravascular lung water and haemodynamic congestion in heart failure patients with
preserved ejection fraction. Eur J Heart Fail. 2018 Sep;20(9):1366-1369.
43. Volpicelli G, Elbarbary M, Blaivas M, et al. International evidence-based
recommendations for point-of-care lung ultrasound. Intensive Care Med. 2012;38:577-591.
44. Copetti R, Soldati G, Copetti P. Chest sonography: a useful tool to differentiate acute
cardiogenic pulmonary edema from acute respiratory distress syndrome. Cardiovasc
ultrasound. 2008;6:16.
45. Wang Y, Gargani L, Barskova T, Furst DE, Cerinic MM. Usefulness of lung
ultrasound B-lines in connective tissue disease-associated interstitial lung disease: a literature
review. Arthritis Res Ther. 2017;19:206.
46. Frasure SE, Matilsky DK, Siadecki SD, Platz E, Saul T, Lewiss RE. Impact of patient
positioning on lung ultrasound findings in acute heart failure. Eur Heart J Acute Cardiovasc
Care. 2015;4:326-332.
47. Platz E, Pivetta E, Merz AA, Peck J, Rivero J, Cheng S. Impact of device selection
and clip duration on lung ultrasound assessment in patients with heart failure. Am J Emerg
Med. 2015;33:1552-1556.
48. Pivetta E, Baldassa F, Masellis S, Bovaro F, Lupia E, Maule MM. Sources of
Variability in the Detection of B-Lines, Using Lung Ultrasound. Ultrasound Med Biol.
2018;44:1212-1216.

19
49. Pivetta E, Goffi A, Nazerian P, et al. Lung ultrasound integrated with clinical
assessment for the diagnosis of acute decompensated heart failure in the emergency
department: a randomized controlled trial. Eur J Heart Fail. 2019;21:754-766.
50. Buessler A, Chouihed T, Duarte K, et al. Accuracy of Several Lung Ultrasound
Methods for the Diagnosis of Acute Heart Failure in the ED: A Multicenter Prospective
Study. Chest. 2020;157:99-110.
51. Pivetta E, Goffi A, Lupia E, et al. Lung Ultrasound-Implemented Diagnosis of Acute
Decompensated Heart Failure in the ED: A SIMEU Multicenter Study. Chest. 2015;148:202-
210.
52. Platz E, Campbell RT, Claggett B, et al. Lung Ultrasound in Acute Heart Failure:
Prevalence of Pulmonary Congestion and Short- and Long-Term Outcomes. JACC Heart fail.
2019;7:849-858.
53. Platz E, Lewis EF, Uno H, et al. Detection and prognostic value of pulmonary
congestion by lung ultrasound in ambulatory heart failure patients. Eur Heart J.
2016;37:1244-1251.
54. Coiro S, Porot G, Rossignol P, et al. Prognostic value of pulmonary congestion
assessed by lung ultrasound imaging during heart failure hospitalisation: A two-centre cohort
study. Sci rep. 2016;6:39426.
55. Coiro S, Rossignol P, Ambrosio G, et al. Prognostic value of residual pulmonary
congestion at discharge assessed by lung ultrasound imaging in heart failure. Eur J Heart
Fail. 2015;17:1172-1181.
56. Gargani L, Pang PS, Frassi F, et al. Persistent pulmonary congestion before discharge
predicts rehospitalization in heart failure: a lung ultrasound study. Cardiovasc Ultrasound.
2015;13:40.
57. Gargani L. Ultrasound of the Lungs: More than a Room with a View. Heart fail clin.
2019;15:297-303.
58. Jambrik Z, Monti S, Coppola V, et al. Usefulness of ultrasound lung comets as a
nonradiologic sign of extravascular lung water. Am J Cardiol. 2004;93:1265-1270.
59. Gargani L, Sicari R, Raciti M, et al. Efficacy of a remote web-based lung ultrasound
training for nephrologists and cardiologists: a LUST trial sub-project. Nephrol Dial
Transplant. 2016;31:1982-1988.
60. Dwyer KH, Merz AA, Lewis EF, et al. Pulmonary Congestion by Lung Ultrasound in
Ambulatory Patients With Heart Failure With Reduced or Preserved Ejection Fraction and
Hypertension. J Card Fail. 2018;24:219-226.
61. Palazzuoli A, Ruocco G, Beltrami M, Nuti R, Cleland JG. Combined use of lung
ultrasound, B-type natriuretic peptide, and echocardiography for outcome prediction in
patients with acute HFrEF and HFpEF. Clin Res Cardiol. 2018;107:586-596.
62. Platz E, Merz AA, Jhund PS, Vazir A, Campbell R, McMurray JJ. Dynamic changes
and prognostic value of pulmonary congestion by lung ultrasound in acute and chronic heart
failure: a systematic review. Eur J Heart Fail. 2017;19:1154-1163.
63. Miglioranza MH, Picano E, Badano LP, et al. Pulmonary congestion evaluated by
lung ultrasound predicts decompensation in heart failure outpatients. Int J Cardiol.
2017;240:271-278.
64. Cogliati C, Casazza G, Ceriani E, et al. Lung ultrasound and short-term prognosis in
heart failure patients. Int J Cardiol. 2016;218:104-108.
65. Platz E, Jhund PS, Girerd N, et al. Expert consensus document: Reporting checklist for
quantification of pulmonary congestion by lung ultrasound in heart failure. Eur J Heart Fail.
2019;21:844-851.
66. Yancy CW, Jessup M, Bozkurt B, et al. 2017 ACC/AHA/HFSA Focused Update of
the 2013 ACCF/AHA Guideline for the Management of Heart Failure: A Report of the

20
American College of Cardiology/American Heart Association Task Force on Clinical Practice
Guidelines and the Heart Failure Society of America. Circulation. 2017;136:e137-e161.
67. Gundersen GH, Norekval TM, Haug HH, et al. Adding point of care ultrasound to
assess volume status in heart failure patients in a nurse-led outpatient clinic. A randomised
study. Heart. 2016;102:29-34.
68. Rivas-Lasarte M, Alvarez-Garcia J, Fernandez-Martinez J, et al. Lung ultrasound-
guided treatment in ambulatory patients with heart failure: a randomized controlled clinical
trial (LUS-HF study). Eur J Heart Fail. 2019.21:1605-1613.
69. Marini C, Fragasso G, Italia L, et al. Lung ultrasound-guided therapy reduces acute
decompensation events in chronic heart failure. Heart. 2020 Jun 22:heartjnl-2019-316429.
doi: 10.1136/heartjnl-2019-316429. Epub ahead of print. PMID: 32571960.
70. Araiza-Garaygordobil D, Gopar-Nieto R, Martinez-Amezcua P, et al. A randomized
controlled trial of lung ultrasound-guided therapy in heart failure (CLUSTER-HF study). Am
Heart J. 2020 Sep;227:31-39.
71. Bikdeli B, Madhavan MV, Jimenez D, et al. COVID-19 and Thrombotic or
Thromboembolic Disease: Implications for Prevention, Antithrombotic Therapy, and Follow-
up. J Am Coll Cardiol. 2020;S0735-1097(20)35008-7.
72. Lomoro P, Verde F, Zerboni F, et al. COVID-19 pneumonia manifestations at the
admission on chest ultrasound, radiographs, and CT: single-center study and comprehensive
radiologic literature review. Eur J Radiol Open. 2020;7:100231.
73. Gargani L, Aboumarie HS, Volpicell Gi, Corradi F, Pastore MC, Cameli M.Why when
and how to use lung ultrasound during the COVID-19 pandemic: enthusiasm and caution. Eur
Heart J Cardiovasc Imaging 2020. In press
74. Magnino C, Omedè P, Avenatti E, et al.; RIGHT1 Investigators. Inaccuracy of Right
Atrial Pressure Estimates Through Inferior Vena Cava Indices. Am J Cardiol. 2017;120:1667-
1673.
75. Lee SL, Daimon M, Kawata T, et al. Estimation of right atrial pressure on inferior vena
cava ultrasound in Asian patients. Circ J. 2014;78:962-6.
76.Agricola E, Bove T, Oppizzi M, et al."Ultrasound comet-tail images": a marker of
pulmonary edema: a comparative study with wedge pressure and extravascular lung water.
Chest. 2005;127:1690-5
77. Hubert A, Girerd N, Le Breton H, et al. Diagnostic accuracy of lung ultrasound for
identification of elevated left ventricular filling pressure. Int J Cardiol. 2019;281:62-68.
78. Miglioranza MH, Gargani L, Sant'Anna RT, et al. Lung ultrasound for the evaluation of
pulmonary congestion in outpatients: a comparison with clinical assessment, natriuretic
peptides, and echocardiography. JACC Cardiovasc Imaging. 2013;6:1141-51.
79. Anderson KL, Jenq KY, Fields JM, Panebianco NL, Dean AJ.Diagnosing heart failure
among acutely dyspneic patients with cardiac, inferior vena cava, and lung ultrasonography.
Am J Emerg Med. 2013;31:1208-14.
80. Gargani L, Frassi F, Soldati G, Tesorio P, Gheorghiade M, Picano E. Ultrasound lung
comets for the differential diagnosis of acute cardiogenic dyspnoea: a comparison with
natriuretic peptides. Eur J Heart Fail. 2008;10:70-7.
81. Öhman J, Harjola VP, Karjalainen P, Lassus J. Focused echocardiography and lung
ultrasound protocol for guiding treatment in acute heart failure. ESC Heart Fail. 2018;5:120-
128.
82. Pellicori P, Cleland JG, Zhang J, et al. Cardiac Dysfunction, Congestion and Loop
Diuretics: their Relationship to Prognosis in Heart Failure. Cardiovasc Drugs
Ther. 2016;30:599-609.
83. Lee HF, Hsu LA, Chang CJ, et al. Prognostic significance of dilated inferior vena cava in
advanced decompensated heart failure. Int J Cardiovasc Imaging. 2014;30:1289-95.

21
84. Curbelo J, Aguilera M, Rodriguez-Cortes P, Gil-Martinez P, Suarez Fernandez C.
Usefulness of inferior vena cava ultrasonography in outpatients with chronic heart failure.
Clin Cardiol. 2018;41:510-517.
85. Palazzuoli A, Ruocco G, Franci B, Evangelista I, Lucani B, Nuti R, Pellicori P.Ultrasound
indices of congestion in patients with acute heart failure according to body mass index. Clin
Res Cardiol. 2020 Apr 15. doi: 10.1007/s00392-020-01642-9. Online ahead of print.

22
Inferior vena cava JVD ratio Venous Renal Doppler Lung ultrasound (B-lines)
Ultrasound transducer Phased array or curvilinear Linear Curvilinear Phased array or curvilinear
Correlation with invasive
cardiac hemodynamics
Moderate (17,18, 74-76)
No data Moderate (33)
Moderate (77,78)
Correlation with natriuretic
peptides
Low to moderate (23,24)
Low to moderate (24,28,31)
Moderate (33)
Moderate to good (24, 54,78)
Diagnostic value* Little evidence (79)
Not enough evidence Not enough evidence Yes (49,51,79,80)
Monitoring Yes (10,20-22)
No data Yes (34)
Yes (56,81)
Prognostic value Yes (20-24, 82-85).
Yes (24,27,31)
Yes (33,35)
Yes (24, 53-56, 60-64)
Intra-reader agreement
[mean difference, 95% limits
of agreement]
-- 0.42 (-1.26, 2.11) (28)
Reproducibility (34)
Venous impedance index:
4+13%
Count method: 0.05 B-lines/8
zones (-1.3, 1.4) (45)
Inter-reader agreement
[mean difference, 95% limits
of agreement]
-0.04 mm (-2.48, 2.40)(23)
-0.22 (-1.24, 0.80) (28)
Reproducibility (34)
Venous impedance index:
5+12%
Count method: -0.3 B-lines/8
zones (-1.9,1.3)(53)
Count-percentage method: 0.03 B-
lines/zone (−1.52,1.45)
(59)
Score method: Cohen’s Kappa
0.70-0.81/zone(48)
Limitations Body habitus/obesity,
Mechanical ventilation,
Inability to perform a deep
inspiration.
Inability to perform Valsalva,
It varies with patient’s position
Obesity,
Severe breathlessness
Some diseases may increase B-
lines (e.g. interstitial lung disease,
acute respiratory distress
syndrome), or limit their
visualization (pneumothorax, large
pleural effusion, morbid obesity).
Table 1. Novel sonographic methods that quantify congestion in patients with heart failure: evidences and limitations. *For acute heart failure

23
Figure Legends
Central illustration: Ultrasound framework for the comprehensive evaluation of cardiac and
venous pressure, and extravascular lung fluid
Figure 1. Jugular Vein Diameter (JVD) Ultrasound. With the patient reclining and head
and neck elevated at 45°, the internal jugular vein is identified and its diameter (JVD) is
measured at rest (at the end of expiratory phase, figure on the left) and during a Valsalva
manoeuvre (figure on right). The ratio between the maximum diameter during Valsalva to that
at rest is the JVD ratio. In the panel on the right, different examples of JVD patterns at rest
and during Valsalva are shown, in patients without congestion (normal JVD ratio: >4; on the
top) and in those with increasing congestion (mid and bottom).
Figure 2. Renal Venous Doppler. Once one of the interlobar veins has been identified, its
venous flow can be assessed with pulsed Doppler. Four distinct venous flow patterns can be
recognised (normal continuous, discontinuous pulsatile, discontinuous biphasic and
discontinuous monophasic), according to increasing renal congestion (top to bottom). The
bottom panel illustrates two proposed methods for renal flow quantification (venous
impedance index and venous discontinuity index).
Figure 3. Lung Ultrasound. In the top left panel, the 8 (left) and 28 (right) chest zones
methods are shown. Count method: B-lines are counted in each zone and summed to obtain
their total count. B-lines can be counted individually as seen (bottom left panel, figure on the
left). Alternatively, when confluent, their number can be estimated from the percentage of
space they occupy on the screen below the pleural line, divided by 10 (bottom left panel,

24
figure on the right, in which confluent B-lines occupy about 60% of the screen below the
pleural line: conventionally, this equates to 6 B-lines). Score method: ≥3 B-lines in one
intercostal space per zone is considered a “positive” zone (bottom left panel, figure on the
right). Different B-lines patterns are shown in the panel on the right: a normal lung should
appear “dark” on lung ultrasound below the pleural line (top), but as pulmonary congestion
develops and increases, more B-lines are seen.
Central Figure

25
Figure 1
Figure 2
26
Figure 3