Embed Size (px)
Citation preview
PTTI Proceedings, Spectroscopy and Opt. Frequency, Ver. 2, Jan. 3, 1996 1
ULTRASENSITIVE HIGH RESOLUTION LASER SPECTROSCOPY AND ITS
APPLICATION TO OPTICAL FREQUENCY STANDARDS
Jun Ye, Long-Sheng Ma and John L. Hall
JILA, University of Colorado and National Institute of Standards and Technology
Campus Box 440, University of Colorado, Boulder, CO 80309
ABSTRACT
Advanced laser stabilization techniques have enabled us to lock laser frequencies onto
line centers of natural atomic/molecular resonances with unprecedented precision and
accuracy. In this paper we discuss our effort in utilizing these techniques to establish
visible optical frequency standards. A novel approach of cavity-enhanced frequency
modulation spectroscopy is demonstrated to enjoy a record high sensitivity (5 x 10-13
integrated absorption), working with weak but rich molecular overtone transitions. The
resultant high signal-to-noise ratio allows a Nd:YAG laser to be stabilized on the
overtone transition at the level of 1 x 10-14
in 800 seconds. For the work of coherent
optical frequency connection, we present our recent development of a 3 THz-span optical
frequency comb generator.
INTRODUCTION
Establishing frequency standards in the optical domain has been an extremely active field
since the invention of the laser. Ultimate invariance tests on many fundamental physical
postulates and constants can be approached only with the highest available optical spectral
resolution, precision and sensitivity offered by the frequency-based metrology. In addition,
optical frequency references are invaluable in optical communications and they also provide a
direct link between the units of length and time. Owing to its higher operating frequency, it is
natural to expect an optical resonance quality factor Q to be a few orders higher than those in
microwave domain. Therefore optical frequency standards can potentially be more stable and
accurate. Of perhaps a great long-term interest is the prospect of being able to bring into the
microwave domain the superior stability and accuracy of suitable optical frequency sources.
To effectively use a laser as a stable and accurate optical local oscillator, active control of
its frequency is needed due to the strong coupling between the laser frequency and its cavity. The
laser’s fast linewidth needs to be reduced to produce not only the short term stability but also a
long coherent time necessary for interrogation of narrow atomic or molecular transitions. Short
term stability is usually achieved by stabilizing the optical phase/frequency relative to a passive
reference, such as a high finesse stable Fabry-Perot cavity. The passive reference cavity is
preferred over the pre-selected atomic or molecular resonance because of its linear response to
the field and a high S/N. Frequency stability at the 10-16
level has been measured with a cavity-
stabilized laser.1 Tunability of such a cavity/laser system can be fulfilled by techniques such as
the frequency-offset optical phase-locked-loop (PLL).2
Long term stability and reproducibility of the local oscillator (laser) can be obtained by
locking to pre-selected natural resonances. Special optical techniques were invented to eliminate
common sources of line broadening such as the Doppler effect. Development in the high
PTTI Proceedings, Spectroscopy and Opt. Frequency, Ver. 2, Jan. 3, 1996 2
resolution laser spectroscopy has provided a number of sophisticated methods, such as saturated
absorption spectroscopy, two photon spectroscopy, optical Ramsey fringes, optical double
resonance, quantum beat and laser cooling and trapping.3 Usually one or several atomic or
molecular transitions are located within the tuning range of the laser to be stabilized. The use of
molecular ro-vibrational lines for laser stabilization are successful in infrared, such as the
methane-stabilized HeNe at 3.39 m, and osmium-tetroxide-stabilized CO2 lasers at 10 m.
They now typically offer an accuracy of 10-12
.4 Until recently the molecular iodine transitions
have been used exclusively as the frequency references in the visible spectrum and the accuracy
is limited to 10-11
. However, the rapid progress in the field of cooling and trapping of atoms and
ions has promised a major advance of the high resolution spectroscopy. Indeed we have already
witnessed a new visible standard based on an intercombination transition of cold Ca atoms.5 An
optical transition linewidth as narrow as a few tens of Hz (Q of 1013
) has also been observed
using a cooled and trapped single 199Hg+ ion at 282 nm.6 These narrow transitions provided by
free atoms or ions could offer an ultimate optical frequency standard free from virtually all of the
conventional shifts and broadenings to the part in 1016
level.
We can clearly see that systems involved with laser cooling and trapping offer the highest
quality optical frequency sources. On the other hand, considerations of a practical system should
always include its cost, size and degree of complexity. Compact and low cost systems are
competitive even though their performance may be behind by a factor of a decade or two
compared with the ultimate system. It is our intention here to introduce just a such system which
involves a solid-state laser (Nd:YAG) stabilized either on an I2 transition at 532 nm (after
frequency doubling) or directly on an overtone transition of HCCD molecule at 1.064 m. The
stability of the system has already been demonstrated at the level of 10-14
at 800 s.
Stabilizing lasers on molecular overtone resonances is a particularly exciting prospect.
These vibrational-overtone lines provide rich spectra of reference grids in the visible domain
while they maintain the same ~ kHz linewidths as their fundamental counterparts, limited by
molecular fluorescent decay at the vibration frequency. Molecular ro-vibrational lines are also
less sensitive to external perturbations. However, owing to the extreme weakness of these
otherwise attractive overtone transitions, (For example, in our stabilization work of Nd:YAG
laser, the employed HCCD overtone transition strength is only about one millionth of the I2 line.)
they were not adopted as suitable frequency references in the visible until recently.7,8
In this
paper we present our recent development of a new cavity-enhanced frequency modulation
spectroscopy which has enabled us to achieve record high detection sensitivities. The resulting
excellent signal-noise ratio (S/N) for these weak but narrow overtone lines has opened the door
for realizing thousands of high quality frequency references in the visible and near infrared.
The realization of the stable frequency sources in the optical range has resulted in parallel
development of absolute and precise frequency measurement in the visible and near-infrared
spectral region. A few frequency synthesis chains have been developed to phase-coherently
connect the frequency of optical references to the cesium primary standard. (For example, see
references 9 and 10.) These synthesis chains are complex systems and can only cover some
discrete frequency marks in the optical spectrum. Difference frequency of many teraHertz could
still remain between a targeted frequency and a known reference. Over the years several
approaches have been proposed and tested, in searching for reliable and simpler solutions to
PTTI Proceedings, Spectroscopy and Opt. Frequency, Ver. 2, Jan. 3, 1996 3
make coherent transfer over large optical frequency gaps. Some recent popular schemes include:
frequency interval bisections,11
optical-parametric oscillations (OPO),12
optical comb
generations,13,14
sum-and-difference in near infrared,15
and four wave mixing in laser diodes.16
All these techniques rely on the principle of difference-frequency synthesis, in contrast to the
frequency harmonic generation method normally used in traditional frequency chains. To deal
with relatively smaller frequency gaps on the order of a few teraHertz, optical frequency comb
generators certainly provides the most direct and simple approach. An electro-optic crystal is
strongly excited by velocity-matched microwave fields to produce a significant phase modulation
index of the light passing through the crystal. This electro-optic modulator is then placed inside a
low-loss optical cavity which resonates with the carrier frequency and all subsequently generated
sidebands. This approach greatly enhances the modulation efficiency and the result is a rich
spectrum of equally spaced lines spanning a few THz. In this article we will present the comb
generator developed in our laboratory and discuss its use in our frequency measurement schemes.
NOISE-IMMUNE CAVITY-ENHANCED OPTICAL HETERODYNE MOLECULAR
SPECTROSCOPY (“NICE-OHMS”)
The P(5) line of the (2 + 33) overtone band of 12
C2HD molecule lies within the tuning
range of the Nd:YAG laser at 1.064 m. Its transition dipole moment is 0.069 milliDebye (1
Debye = 3.33564 x 10⁻³⁰
Cm, a typical atomic transition dipole moment.) and the linear
absorption is calculated to be 8.7 x 10⁻⁷
/cmTorr. This weak transition strength makes it difficult
to obtain the necessary level of nonlinear interaction between the light and the molecules to yield
the sub-Doppler saturated absorption linewidth. For metrology work, we usually use a low gas
pressure (a few milliTorr, 1 Torr = 133 Pa) to avoid excessive pressure related shifts and
broadenings. When the pressure is sufficiently low the average molecules will be in a free-flight
regime, where they pass through the light field without suffering any collisions. Even in this case,
the corresponding saturation power (the molecules see the light field as a -pulse) is calculated to
be 51 W. Under these circumstances, placing molecules inside a high finesse cavity17
is
beneficial in several aspects. The cavity extends the effective cell length by a factor of
(Finesse2/) while it builds up sufficient internal power for saturation. This helps to limit both
the source and detection power to reasonable levels. The geometrical self-cleaning and matching
of the two counter-propagating waves inside the cavity are important for obtaining narrow and
unshifted resonance lines.18
In addition, the cavity itself provides a ready reference for short-term
laser stabilization.
The use of the sharp cavity resonance, however, presents a challenge for a simple and yet
effective modulation recovery scheme in signal detection. One direct method is to lock the laser
on the cavity and dither the cavity resonance around the molecular resonance. Indeed this
technique is employed when we want to calibrate the size of the saturated absorption signal.
However, the modulation frequency is by far too low to get away from the technical noise.
Additionally, the narrow cavity resonance effectively converts any small laser frequency noise
into amplitude noise, thus deteriorating the detection signal-to-noise ratio (S/N). In our new
modulation and detection scheme, we frequency modulate the input laser beam at exactly the
splitting frequency of the cavity free-spectral-range (FSR). The cavity transmitted light is
subsequently detected and demodulated. The small frequency variations of the laser will still lead
PTTI Proceedings, Spectroscopy and Opt. Frequency, Ver. 2, Jan. 3, 1996 4
to some amplitude fluctuations and small optical phase shifts of the transmitted carrier, but they
will also have exactly the same effects on the sidebands which are transmitted on adjacent or
nearby cavity axial orders. Therefore the transmitted light still accurately represents an FM
spectral triplet, with minimal AM conversion due to the relative laser/cavity frequency jitter.
Thus the detection noise level can approach the intrinsic AM noise of the laser at the modulation
frequency. When the intracavity molecular resonance is present around one of the three cavity
modes which accept the triplet light field, it will weaken and phase-shift the corresponding FM
component to upset the FM balance and thereby create an rf heterodyne signal in the cavity
transmission.
In short, the aforementioned modulation strategy allows the cavity to greatly enhance the
molecular signal without any noise penalty. Therefore the detection sensitivity is directly
enhanced by the factor of (Finesse2/), comparing with the conventional FM spectroscopy.19
We
refer to this modulation/detection scheme as noise-immune cavity-enhanced optical heterodyne
molecular spectroscopy, ie. “NICE-OHMS”.
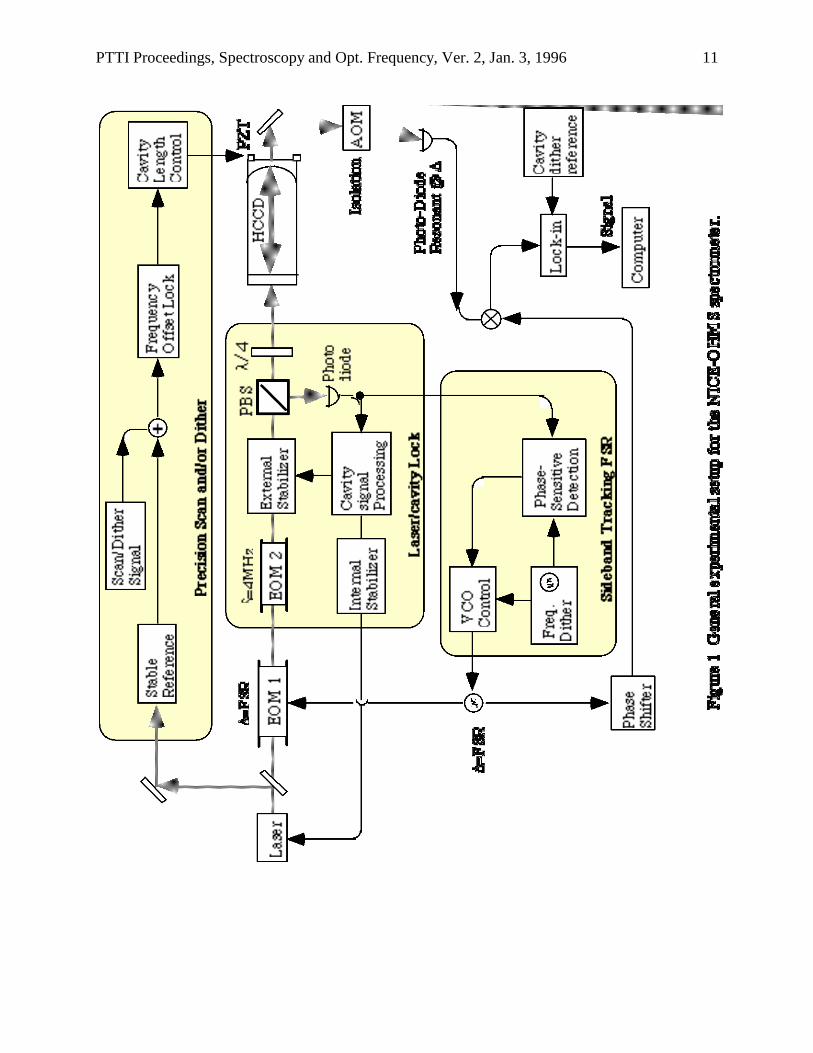
Figure 1 shows the general experimental setup. Although the extreme accuracy of
laser/cavity locking is no longer required for the detection of molecular signal, the laser linewidth
relative to the cavity needs to be sufficiently narrowed so that its full power spectrum can be
efficiently coupled into the cavity. Additionally, this laser/cavity locking loop serves as the short
term stabilizer for the laser frequency. The cavity discrimination signal is derived from the
Pound-Drever-Hall rf sideband technique.20
The electro-optic modulator 2 (EOM2) produces the
4 MHz FM sidebands which are detected in cavity reflection. The frequency servo action is
carried out by the laser’s internal piezo-electric transducer (PZT) and an external stabilizer,21
which uses just an acousto-optic modulator (AOM). The AOM provides sufficient servo
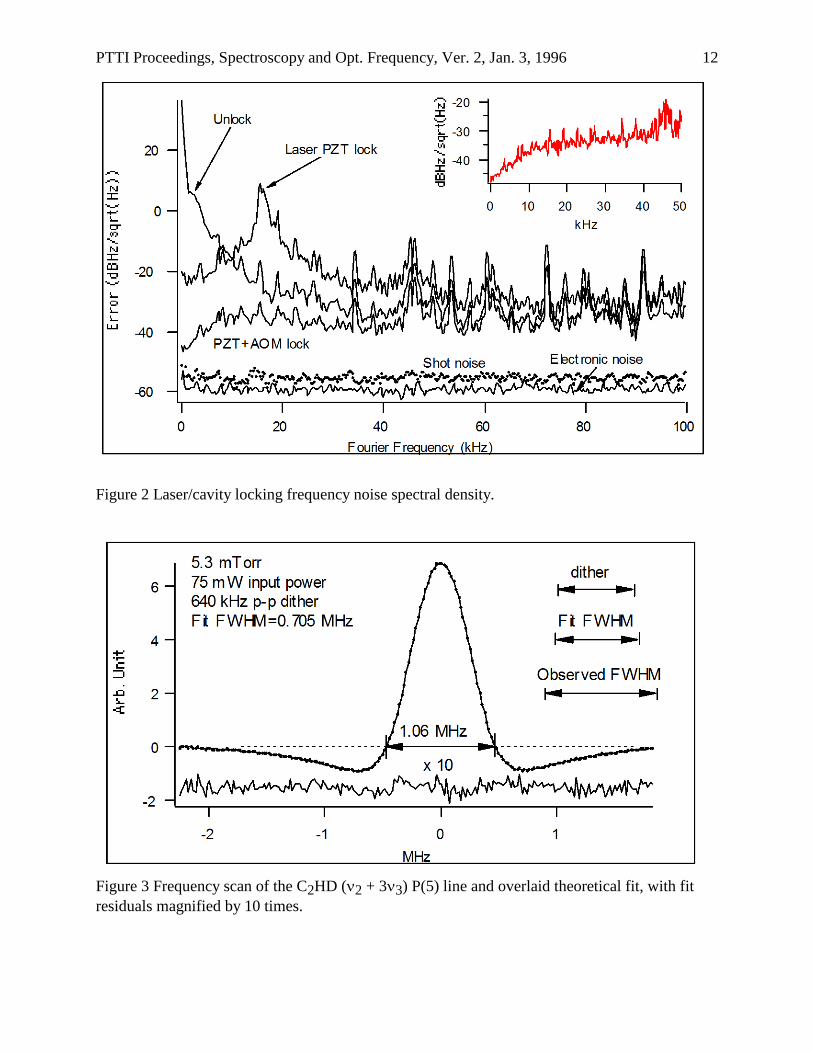
bandwidth while the PZT corrects any slow deviations of the laser frequency. Figure 2 illustrates
the frequency noise spectral densities of the cavity error signal when the laser is unlocked, locked
by the laser PZT only, and locked by the combined effort of the PZT and the AOM. The superior
servo system with the PZT and AOM produces a frequency noise spectral density of only ~ -34
dBHz/√Hz (20 mHz/√Hz). This indicates the laser’s linewidth relative to the cavity is a mere 1.3
mHz.22
This locking performance can be further improved as the shot noise limited frequency
noise spectral density is shown to be only 0.2 mHz/√Hz.
It is important to have a precision scanning capability for our spectrometer to perform high
resolution studies of the signal lineshape, linewidth, and the line center. This is accomplished by
the frequency offset locking loop shown in Fig. 1. The stable reference is provided by a second
Nd:YAG laser which is frequency doubled and locked on an I2 transition at 532 nm.23
The
heterodyne beat signal between the two lasers is phase locked to a synthesizer. To improve S/N
and baseline stability, we modulate the cavity frequency around the molecular resonance by an
FM dither on the synthesizer and use an audio lock-in for signal recovery. The same synthesizer
is then frequency stepped by a computer to force the cavity/laser system to scan out the molecular
resonance. Signal averaging over many scans (~ one minute each) is available with the long-term
stability of the laser/I2 system in the sub-10 Hz domain.
Phase modulation of the laser beam at the FSR frequency is generated by the resonantly-
coupled EOM1 and detected in cavity transmission by an InGaAs p-i-n diode in a resonant rf
tank circuit. The modulation signal is provided by a low phase noise crystal voltage-controlled-
oscillator (VCO). Modulation index of ~0.5 is chosen so that the central carrier still effectively
PTTI Proceedings, Spectroscopy and Opt. Frequency, Ver. 2, Jan. 3, 1996 5
saturates the molecular absorption while the sidebands are large enough to give a strong
heterodyne cross term. An isolation AOM directly after the cavity prevents optical feedback from
the detector. Subsequent phase sensitive demodulation yields the molecular dispersion signal.
During the cavity scan, its FSR will change slightly. To maintain the noise-immune property, we
actively track the VCO frequency to the cavity FSR by applying a small frequency dither on the
VCO which is then also detected in cavity reflection.
Synthesized HCCD gas (81% / 19% HCCD / HCCH by integration of the 1H NMR
spectrum, ~ 55% chemical purity by a residual gas analyzer) is placed inside a cavity with a FSR
of 319.695 MHz and finesse of 31,900. One mirror is flat, the other has a 1 m radius of curvature.
The intracavity beam waist is ~ 0.410 mm, dictating the room temperature transit time limit of
270 kHz FWHM.24
For our 10 mTorr sample gas, the linear absorption through our 46.9 cm long
cavity (single pass) is 1.6 x 10⁻⁷
, leading to an absorption coefficient of 6.2 x 10⁻⁷
/ Torr.cm for
pure HCCD, in good agreement with the available band strength data.25
The cavity has a resonant
transmission efficiency of 41% which decreases by 1.3 x 10⁻³
near the Doppler profile peak (a
contrast of 0.32%). Tuning onto the saturation resonance increases the maximum transmission by
138 x 10-6
, corresponding to a saturation depth of 10.6%. From a 75 mW input light, the cavity
has a power buildup to 300 W, giving a saturation parameter of ~0.46 at 10 mTorr.
In our frequency stabilization experiment, we usually use the central carrier to interact with
the molecules. This central component is intrinsically sensitive to only the dispersion part of the
molecular resonance, independent of the detection phase of the rf local oscillator.19
The
additional dither modulation on the cavity resonance itself requires an audio lock-in to further
process the rf-demodulated signal and the resultant signal lineshape shows a derivative form of
dispersion. Figure 3 shows a typical scan of the overtone resonance with 5.3 mTorr sample gas
and a 640 kHz peak-to-peak cavity dither. The lineshape model is based on Wahlquist’s
modulation-broadening formalism for a dispersion signal.26
The fit residual, after a 10 times
magnification, indicates a well-understood lineshape in our spectrometer. The transition
linewidth of 705 kHz (after removal of the modulation broadening by the fit) is due to the power-
and pressure-broadenings of the 270 kHz transit time linewidth. The power-broadening
contribution to the linewidth can be removed by knowing the saturation level at the operating
pressure. The pressure broadening (FWHM) rate is then determined to be 34.7 ±0.8 MHz/Torr.
The zero-pressure, zero-intensity extrapolated linewidth is 290 ±7 kHz, very near the value of
270 kHz set by the transit time. We can summarize these results by an expression for the
saturation intensity: Isat = 6103 (T + 34.7 P)2 W/mm
2, where T is the FWHM (in MHz)
associated with transit-time, and P is the pressure in Torr. The equivalent saturation power in the
free-flight regime is 117 W inside, reduced to 29.3 mW input by the cavity enhancement of 4000.
We have also measured a pressure shift of the line center ~ +250 (± 20%) Hz/mTorr with our
current sample gas.
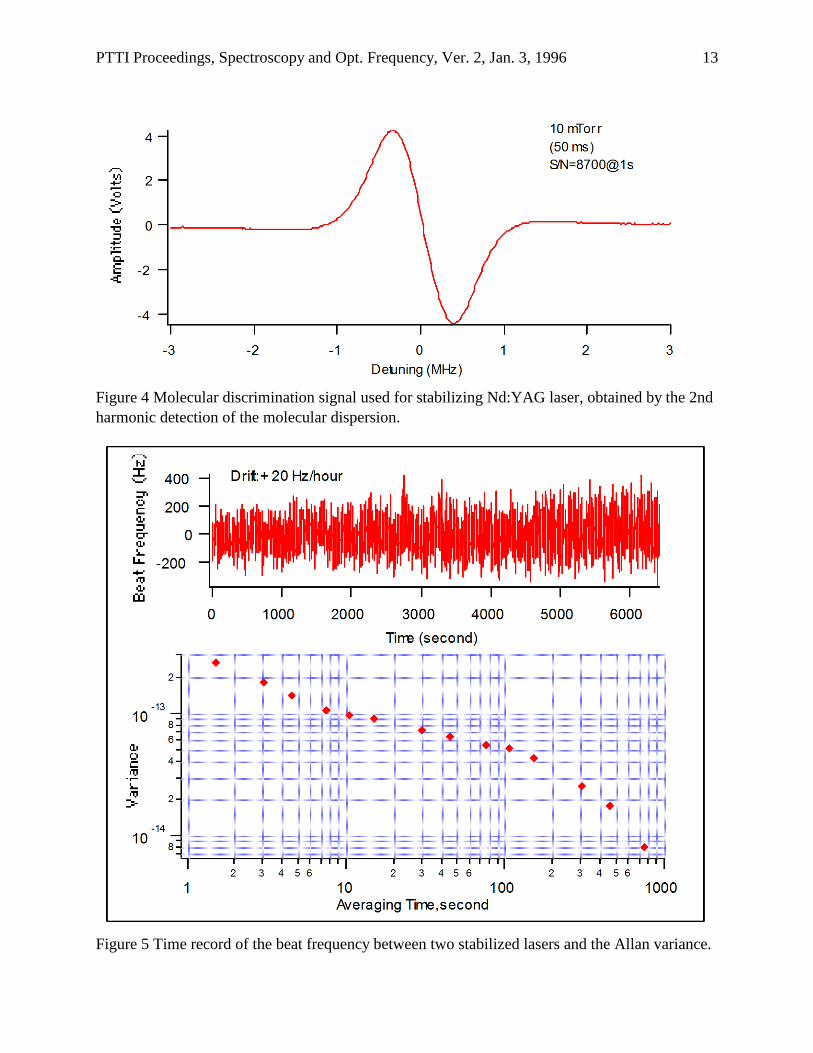
To obtain a proper discrimination lineshape of the molecular resonance for the laser to lock
onto, we use the 2nd harmonic detection on the audio lockin to obtain a second derivative of
dispersion. This is shown in figure 4 with 10 mTorr gas. With the saturated absorption in the 1.7
x10-8 domain, we obtained a S/N of 8700 at 1 s averaging, ~ 2 times above the calculated shot
noise limit. This corresponds to a noise-equivalent detection sensitivity of 2 x 10-12
for integrated
PTTI Proceedings, Spectroscopy and Opt. Frequency, Ver. 2, Jan. 3, 1996 6
absorption at 1-s averaging. (Recently we have further improved this sensitivity to 5 x 10-13
.)
This level of S/N set the frequency rms noise when the laser is locked on the molecular line.
FREQUENCY STABILIZATION RESULTS
For testing the quality of this C2HD overtone resonance as an optical frequency standard at
1.064 m, we lock the laser/cavity system onto the line and measure the heterodyne beat against
the known Nd:YAG/I2 reference system.23
The molecular error signal is integrated and then fed
onto the cavity PZT to maintain the proper cavity length. We find 10 mTorr is the optimum gas
pressure for a maximum slope of the molecular locking error signal, by taking into account the
combined parameters of linear absorption, saturated absorption hole depth and the pressure
broadened linewidth. In figure 5 The counted beat frequency vs. time shows a drift ~ 20 Hz/h.
The second Nd:YAG laser (after frequency doubling) is locked on I2: R(56) 32-0, component
a10.23
With the mean value of the beat frequency between the two lasers at 5252.2261 ±0.0026
MHz, we determine the absolute frequency of the P(5) line in the (2 + 3 3) band of 12
C2HD to
be 281,635,363.962 MHz ± 20.2 kHz. The 20 kHz uncertainty is mainly due to the limited
knowledge of the absolute frequency of the Nd:YAG/I2 , a secondary standard. At 1-s averaging
we obtain a frequency noise of ±100 Hz, in direct agreement with the S/N available at 1.064 m.
(The Nd:YAG/I2 reference system has a 20 Hz rms, 8 x10-14 frequency noise at 1 second as
tested with a second I2 spectrometer.) The corresponding Allan variance of y = 3.4 x10-
13/√improves to 1 x10
-14 at a longer integration time (> 800 s), a promising indicator for an
ultrastable frequency reference. The visible noise bump around ~ 200 s on the Allan variance
diagram is associated with the lab room temperature cycling period.
Linewidth narrowing is offered by slow molecules since the natural life-time of the
overtone transition is about 300 times longer than our current transit time.27
The cavity input
power is reduced 75 times from our maximum available power to 1 mW. A low power is
necessary so that the low Rabi frequency leads to appreciable saturation only for the slowest
molecules. In our < 2 mTorr sample gas, the mean-free-path of molecules is ~ 30 times longer
than the transverse field dimension, thereby creating the so-called transit-time regime. The
saturation now becomes inhomogeneous, with molecules from different transverse velocity
groups contributing different intensities and widths. Slow molecules which spend their whole
life-time inside the field will have a constant and velocity-independent saturation parameter,
controlled primarily by the collisional broadening. Considering their shorter interaction times,
faster moving molecules will see a reduced saturation and will mostly contribute to the wings of
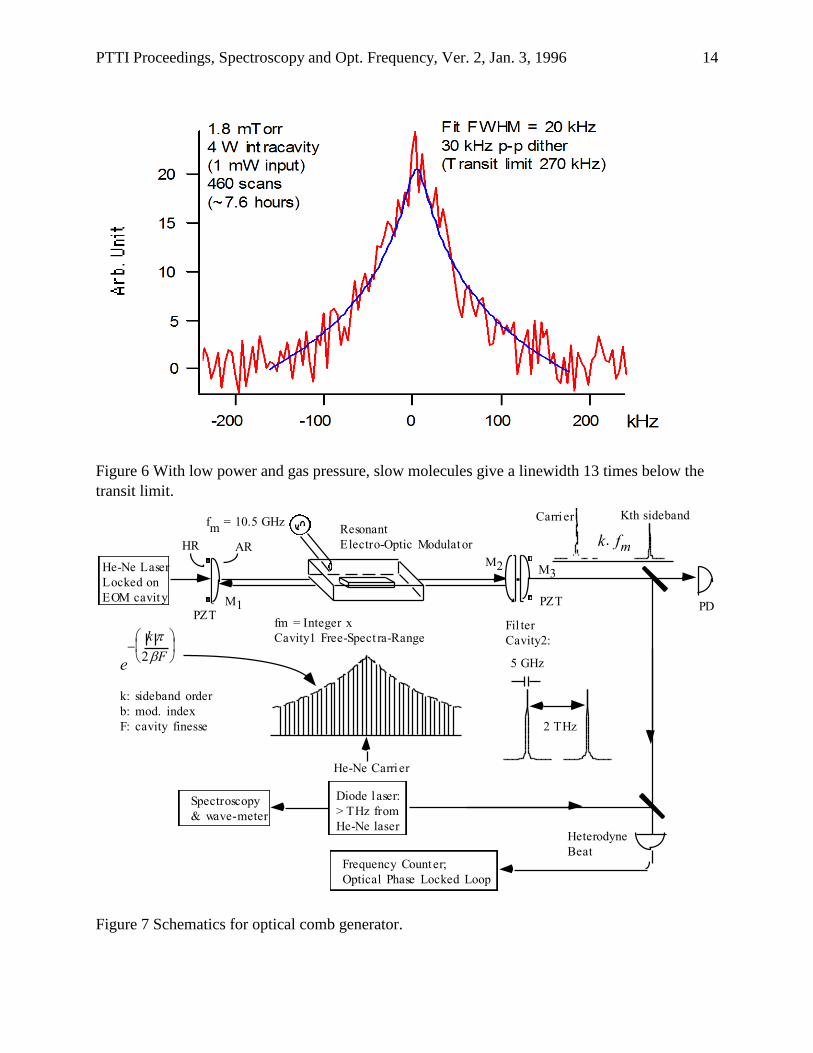
the resonance. Figure 6 shows a resonance with a linewidth of ~ 20 kHz, without correction for
the modulation broadening by a 30 kHz peak-to-peak dither of the cavity. This is thirteen times
narrower than that set by the room temperature transit-time-limit, and is mainly limited by the
relatively high pressure (1.8 mTorr). At present the limited S/N associated with the low power
has prevented us from taking full advantage of this narrow linewidth. With an improved system
this approach will enable us to access the information of free molecules with minimized second
order Doppler shift, thereby creating an optical frequency standard of potentially high accuracy.
OPTICAL FREQUENCY COMB GENERATORS
PTTI Proceedings, Spectroscopy and Opt. Frequency, Ver. 2, Jan. 3, 1996 7
An optical frequency comb (OFC) generator is a simple system employing only one laser.
Yet it offers a unique property of supplying a comb of equally spaced spectral lines around the
carrier. These lines are modulation sidebands generated by an electro-optic modulator (EOM). To
enhance the optical-rf field interactions, the EOM is placed inside a low loss optical cavity in
resonance with the carrier and all the sidebands. In other words, the rf modulation frequency
equals to an integer multiple of the cavity free-spectral-range (FSR). In principle, the span of the
generated comb is limited only by the system dispersion, which can be carefully compensated
following designs in ultra-fast laser systems. A 4-THz wide OFC has already been observed at
1.5 m,28
showing the possibility of shifting 2% of the optical frequency in a single step. We
note in passing that an appropriately low noise rf oscillator should be used to drive the EOM so
that high order sidebands do not quickly collapse due to the multiplied phase noise amplitude.
The power spectrum of the OFC is shown28
to be proportional to an exponential function.
Denoting Pk as the power of the kth sideband, we have:Pk exp k F , where is the
modulation index of the EOM and F is the finesse of the crystal-loaded cavity. To improve the
efficiency of the comb generator and to have a single pure spectral line output for optical
frequency metrology, we replace the cavity output mirror with a short filter cavity to resonantly
output an individual sideband from the comb. If the free-spectral-range (FSR) of this filter cavity
is larger than the comb width, then the filter will be resonance-free until one reaches the desired
sideband. Therefore the filter cavity will not alter the comb generation process until a good match
occurs between its resonance and a sideband, beyond which the comb spectrum will be sharply
cut off. The filtered single spectral line can be conveniently detected by heterodyne mixing with a
tunable laser source. Since we extract the full power of the chosen sideband out of the comb
generator while keeping the carrier and all other sidebands trapped inside, we can expect an
important improvement of the detection signal-to-noise ratio (S/N). Using a filter cavity not only
resonantly increases the signal size of the desired sideband output but also reduces the detected
noise level as the larger DC powers distributed among the carrier and lower order sidebands are
not detected.
In this experiment we use a prototype EOM.29
It consists of a broadband antireflection
coated Mg:LiNbO3 crystal (2x1x35.4-mm) embedded in a resonant microwave cavity. The cavity
design employs a waveguide geometry to force the match between the microwave phase velocity
and the optical group velocity through the crystal. The microwave resonance at 10.5 GHz has a
bandwidth of ~0.3 GHz and a Q factor of 230. A modulation index of ~ 0.8 is obtained with a
microwave power of 0.6 W. This EOM is placed inside our three-mirror cavity, as shown in
Fig.7. All three mirrors are identical lens substrates with an effective focal length of 25 cm. The
convex faces are antireflection coated at 633 nm while the flat faces are coated to have high
reflectivity, about 99.6%. With two such mirrors (M1 and M2) we build a cavity with a finesse of
680 and a transmission efficiency of 20%, implying a transmission coefficient (T) of 0.2% for
each mirror. The cavity FSR is 1/16 of the EOM rf frequency. When loaded with the cold crystal,
the finesse and efficiency drop to 200 and 2%, respectively, corresponding to a 1.1% one way
loss through the modulator. Turning on the rf power to the EOM further drops the cavity
efficiency to 0.15% for the overall modulated output, due to the increased mismatch of input
coupling when sideband generations enhance the carrier loss. The filter cavity formed by mirrors
M2 and M3 had a finesse of 400, a FSR of ~ 2 THz, and an efficiency ~ 30%, and increases the
PTTI Proceedings, Spectroscopy and Opt. Frequency, Ver. 2, Jan. 3, 1996 8
output power of the selected sideband by a factor of 150. The PZT mounted on the filter cavity
output mirror M3 is used to tune the filter bandpass frequency. Approximately 150 W power of
a polarization-stabilized He-Ne laser is incident on the comb generator. Part of the output light
from the OFC generator is monitored by a DC photo detector while the other part is sent to an
avalanche photo diode (APD) for heterodyne mixing with an external-cavity tunable diode laser
at 633 nm.
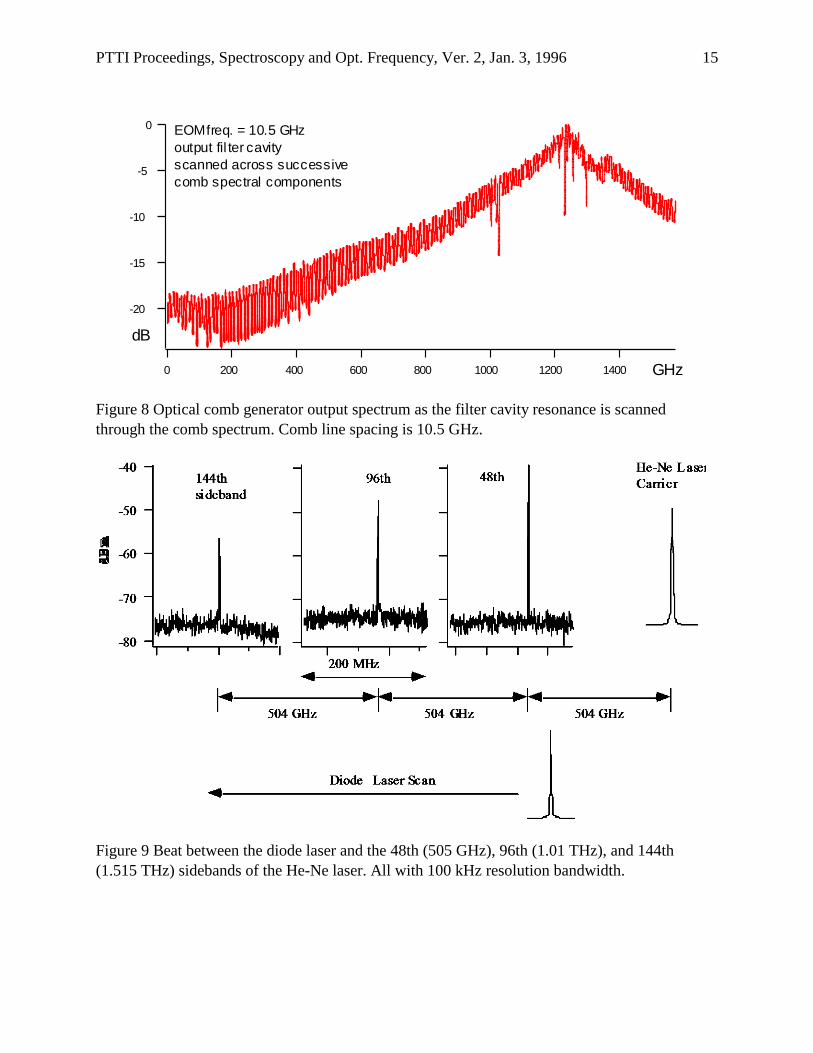
Figure 8 shows the DC-monitored output spectrum of our OFC generator as we
continuously tune the filter cavity resonance over part of the comb spectrum. A comb span wider
than 1 THz is clearly visible from one side of the carrier frequency. The filter cavity has a
FWHM of ~ 5 GHz. This gave just enough resolution to resolve individual sidebands spaced
10.5 GHz apart. Based on the observation that high order (~100th) sidebands still have a good
S/N, we expect to see a much wider comb with a filter cavity having a larger FSR. (It will also
need a higher finesse to maintain its resolution.) The slope on this comb spectrum is roughly
16dB/THz.
About 15 W power from an external cavity tunable 633 nm diode laser is used for the
heterodyne detection of the OFC sideband. Figure 9 shows the resulting beat spectrum. The filter
cavity resonance is subsequently tuned onto the 48th (505 GHz), 96th (1.01 THz) and 144th
(1.515 THz) sideband of the He-Ne laser. In a 100 kHz bandwidth we obtain S/N of 35 dB, 26
dB and 20 dB, respectively. The noise floor is fixed by the shot noise of the detected light power,
multiplied by the APD’s excessive noise factor. These beat signals can be easily counted via a
tracking-filter comprised of a voltage-controlled rf oscillator phase locked onto the beat signal.
As the filter cavity selects out a particular sideband, it causes little effect on the lower order
sidebands being generated inside the comb generator. However, once the energy in a sideband is
coupled out, the comb generation beyond that is strongly reduced. This mechanism is confirmed
in the following way. We park the filter cavity resonance on top of the 48th sideband, then we
position the diode laser frequency successively to be in line with the 47th, 48th, and 49th
sideband. Heterodyne detection shows that a fraction of the 47th sideband power leaked out due
to the finite width of the pass-filter (-17.7 dB below the 48th sideband). The magnitude of the
49th sideband is further down by 5.6 dB, -23.3 dB relative to the desired 48th sideband. This
good spectral purity will improve further using a filter cavity of higher efficiency or better
finesse.
CONCLUSIONS
The experimental demonstration of the noise-immune cavity-enhanced optical heterodyne
molecular spectroscopy (NICE-OHMS) has firmly established itself among the most sensitive
detection methods currently available. Its powerful utilities in the laser frequency stabilization
and ultra-high resolution spectroscopy are also indispensable for realizing thousands of
molecular overtone transitions in the visible and near-IR as high-quality optical
frequency/wavelength references. The work of Nd:YAG laser frequency stabilization using the
P(5) transition in the C2HD (2 + 33) overtone band at 1.064 m has achieved similar results to
that using iodine transitions with modulation transfer spectroscopy,23
despite the fact that the
C2HD transition is a million times weaker than that of iodine. Slow molecules optically selected
should provide more accurate information about the resonance linecenter of free molecules. The
relative stability of this system is already better than most visible frequency standards, including
PTTI Proceedings, Spectroscopy and Opt. Frequency, Ver. 2, Jan. 3, 1996 9
those recommended by CIPM/CCDM in 1992.4 Potential improvements on our system would be
to use larger mode-size and higher finesse cavities to further enhance the spectrometer resolution
and sensitivity.
We have realized a wide span (> 3 THz) optical frequency comb generator. We improve the
comb generator efficiency by replacing the output mirror with a short filter cavity to allow
efficient escape of the selected comb component. With limited power available from a He-Ne
laser, we are able to demonstrate a 1.5 teraHertz heterodyne beat signal with a S/N of 20 dB at
100 kHz bandwidth. We intend to use this OFC generator to bridge gaps between stronger and
spectrally narrower iodine molecule absorption lines around 633 nm and the R(127) transition
where the He-Ne laser is traditionally stabilized. An interesting Neon transition (1S5 -> 2P8) at
633.6 nm can also be measured in its absolute frequency. We are also planning to revisit our
frequency chain for measuring the green iodine transitions at 532 nm.23
We are in the process of establishing grids of molecular ro-vibrational lines as frequency
references over the red part of the visible spectrum. As the spacing between adjacent rotational
lines usually lies anywhere between a few hundred GHz to a few THz, this OFC generator
covering a few THz frequency gap becomes an essential part of our phase coherent frequency
chains.
ACKNOWLEDGMENTS
The authors are grateful to Bruce Tiemann who synthesized the HCCD sample gas. We also
thank Tim Day for providing the 10.5 GHz resonant EOM. This work was supported in part by
the National Institute of Standards and Technology and in part by the U.S. Office of Naval
Research, the U.S. Air Force Office of Scientific Research, and the National Science Foundation.
REFERENCES
1. CH. Salomon, D. Hills and J. L. Hall, J. Opt. Soc. Am. B 5, 1576 (1988).
2. R. Barger and J. L. Hall, Phys. Rev. Lett. 22, 4 (1969).
3. J. L. Hall, in Frequency-Stabilized Lasers and Their Applications, Y. C. Chung, ed., Proc.
SPIE 1837, 2 (1993).
4. T. Quinn, Metrologia 30, 523 (1994).
5. H. Schnatz, B. Lipphardt, J. Helmcke, F. Riehle and G. Zinner, Phys. Rev. Lett. 76,
18(1996).
6. J. C. Bergquist, W. M. Itano and D. J. Wineland, Frontiers in Laser Spectroscopy, 359
(1994).
7. M. de Labachelerie, K. Nakagawa and M. Ohtsu, Opt. Lett. 19, 840 (1994).
8. J. Ye, L-S. Ma and J. L. Hall, Opt. Lett. 21, 1000 (1996).
9. D. A. Jennings, C. R. Pollock, F. R. Petersen, R. E. Drullinger, K. M. Evenson,
J. S. Wells, J. L. Hall and H. P. Layer, Opt. Lett. 8, 136 (1983).
10. C. O. Weiss, G. Kramer, B. Lipphardt and E. Garcia,
IEEE J. Quantum Electron. QE-24, 1979 (1988).
11. H.R. Telle, D. Meschede and T.W. Hänsch, Opt. Lett. 15, 532 (1990).
12. N.C. Wong, Opt. Lett. 15, 1129 (1990).
13. M. Kourogi, K. Nakagawa and M. Ohtsu, IEEE J. Quant. Electron. QE-29,2693 (1993).
PTTI Proceedings, Spectroscopy and Opt. Frequency, Ver. 2, Jan. 3, 1996 10
14. L.R. Brothers, D. Lee and N.C. Wong, Opt. Lett. 19, 245 (1994).
15. D.A. Van Baak and L. Hollberg, Opt. Lett. 19, 1586 (1994).
16. Ch. Koch and H. R. Telle, J. Opt. Soc. Am. B 13, 1666 (1996).
17. P. Cerez, A. Brillet, C. Man-Pichot and R. Felder, IEEE Trans. Instrum. & Meas. 29, 352 (1980).
18. J. L. Hall and C. J. Bordé, Appl. Phys. Lett. 29, 788 (1976).
19. G. C. Bjorklund, Opt. Lett. 5, 15 (1980);
J. L. Hall, L. Hollberg, T. Baer and H. G. Robinson, Appl. Phys. Lett. 39, 680 (1981).
20. R. W. P. Drever, J. L. Hall, F. V. Kowalski, J. Hough, G. M. Ford, A. J. Munley
and H. Ward, Appl. Phys. B 31, 97 (1983).
21. J. L. Hall and T. W. Hänsch, Opt. Lett. 9, 502 (1984).
22. D. Hils and J. L. Hall, in “Frequency Standards and Metrology,” Ed. A. De Marchi,
Springer-Verlag, Berlin (1989).
23. P. Jungner, M. Eickhoff, S. Swartz, J. Ye, J. L. Hall, and S. Waltman,
IEEE Trans. Instrum. & Meas. 44, 151 (1995); M. L. Eickhoff and J. L. Hall, IEEE Trans.
Instrum. & Meas. 44, 155 (1995).
24. C. J. Bordé, J. L. Hall, C. V. Kunasz, and D. G. Hummer, Phys. Rev. A 14, 236 (1976).
25. M. Temsamani, J. Vander Auwera, and M. Herman, Mol. Phys. 79, 359 (1993).
26. See R. L. Smith, J. Opt. Soc. Am. 61, 1015 (1971).
27. S. N. Bagayev, V. P. Chebotayev, A. K. Dmitriyev, A. E. Om, Yu. V. Nekrasov, and B. N.
Skvortsov, Appl. Phys. B 52, 63 (1991); and Ch. Chardonnet, F. Guernet, G. Charton, and
Ch. J. Bordé, Appl. Phys. B 59, 333 (1994).
28. M. Kourogi, K. Nakagawa and M. Ohtsu, IEEE J. Quant. Electron. QE-29, 2693 (1993).
29. Designed by T. Day and built at New Focus Corp.
PTTI Proceedings, Spectroscopy and Opt. Frequency, Ver. 2, Jan. 3, 1996 11
PTTI Proceedings, Spectroscopy and Opt. Frequency, Ver. 2, Jan. 3, 1996 12
Figure 2 Laser/cavity locking frequency noise spectral density.
Figure 3 Frequency scan of the C2HD (2 + 33) P(5) line and overlaid theoretical fit, with fit
residuals magnified by 10 times.
PTTI Proceedings, Spectroscopy and Opt. Frequency, Ver. 2, Jan. 3, 1996 13
Figure 4 Molecular discrimination signal used for stabilizing Nd:YAG laser, obtained by the 2nd
harmonic detection of the molecular dispersion.
Figure 5 Time record of the beat frequency between two stabilized lasers and the Allan variance.
PTTI Proceedings, Spectroscopy and Opt. Frequency, Ver. 2, Jan. 3, 1996 14
Figure 6 With low power and gas pressure, slow molecules give a linewidth 13 times below the
transit limit.
Figure 7 Schematics for optical comb generator.
fm
= 10.5 GHzResonant
Electro-Optic Modulator
He-Ne Laser
Locked on
EOM cavity
fm = Integer x
Cavity1 Free-Spect ra-Range
He-Ne Carri er
e
k
2F
k: sideband order
b: mod. index
F: cavity finesse
5 GHz
2 THz
Fil ter
Cavity2:
Diode l aser:
> THz from
He-Ne laserHeterodyne
BeatFrequency Counter;
Optical Phase Locked Loop
Kth sideband
k fm
Carri er
PZTPZT
Spectroscopy
& wave-meter
ARHR
PDM1
M2 M3
PTTI Proceedings, Spectroscopy and Opt. Frequency, Ver. 2, Jan. 3, 1996 15
Figure 8 Optical comb generator output spectrum as the filter cavity resonance is scanned
through the comb spectrum. Comb line spacing is 10.5 GHz.
Figure 9 Beat between the diode laser and the 48th (505 GHz), 96th (1.01 THz), and 144th
(1.515 THz) sidebands of the He-Ne laser. All with 100 kHz resolution bandwidth.
-20
-15
-10
-5
0
1400120010008006004002000
EOM freq. = 10.5 GHz
output fil ter cavity
scanned across successive
comb spectral components
dB
GHz