Embed Size (px)
Citation preview
Ultrahigh-pressure polyamorphism in GeO2 glass withcoordination number >6Yoshio Konoa,1, Curtis Kenney-Bensona, Daijo Ikutaa, Yuki Shibazakib, Yanbin Wangc, and Guoyin Shena
aHigh Pressure Collaborative Access Team, Geophysical Laboratory, Carnegie Institution of Washington, Argonne, IL 60439; bFrontier Research Institute forInterdisciplinary Sciences, Tohoku University, Aoba-ku, Sendai 980-8578, Japan; and cCenter for Advanced Radiation Sources, The University of Chicago,Chicago, IL 60637
Edited by Alexandra Navrotsky, University of California, Davis, CA, and approved February 17, 2016 (received for review December 9, 2015)
Knowledge of pressure-induced structural changes in glasses isimportant in various scientific fields as well as in engineering andindustry. However, polyamorphism in glasses under high pressureremains poorly understood because of experimental challenges.Here we report new experimental findings of ultrahigh-pressurepolyamorphism in GeO2 glass, investigated using a newly devel-oped double-stage large-volume cell. The Ge–O coordination num-ber (CN) is found to remain constant at∼6 between 22.6 and 37.9 GPa.At higher pressures, CN begins to increase rapidly and reaches 7.4at 91.7 GPa. This transformation begins when the oxygen-packingfraction in GeO2 glass is close to the maximal dense-packing state(the Kepler conjecture = ∼0.74), which provides new insights intostructural changes in network-forming glasses and liquids with CNhigher than 6 at ultrahigh-pressure conditions.
high pressure | polyamorphism | glass | oxygen packing
Understanding the structural response of network-formingglasses to pressure is of great interest not only in condensed
matter physics, geoscience, and materials science, but also inengineering and industry. As prototype network-forming glasses,silica (SiO2) and germania (GeO2) have been the most exten-sively studied (1–5). These two glasses have similar structuralchange pathways at high pressures. At ambient pressure, bothglasses are composed of corner-linked AO4 tetrahedra, with atom A(Si or Ge) in fourfold coordination (6). Under compression, thecoordination gradually changes from 4 to 6 over a wide pressurerange [∼15–40 GPa for SiO2 glass (2, 4) and ∼5–15 GPa for GeO2glass (1, 3, 5)].A recent study (7) found that evolution of network-forming
structural motifs in glasses and liquids at high pressures can be ra-tionalized in terms of oxygen-packing fraction (OPF). Fourfold-coordinated structural motifs in SiO2 and GeO2 glasses are stableover a wide range of OPF between 0.40 and ∼0.59. The fourfold-coordinated structural motifs become unstable when the OPF ap-proaches the limit of random loose packing of hard spheres (0.55–0.60) (8, 9). When OPF >∼0.60, coordination number (CN)gradually increases with OPF to the limit of random close packing(0.64) (8, 9), where CN increases sharply to 6 with almost-constantOPF ∼0.64. Higher-pressure data for SiO2 glass suggest the exis-tence of another stability plateau for sixfold-coordinated structuralmotifs, with OPF of up to ∼0.72 (7).The highest coordination that has been experimentally de-
termined so far in SiO2 and GeO2 glasses is 6. X-ray diffractionmeasurement for SiO2 glass confirmed that sixfold-coordinationstructural motifs are stable up to 100 GPa (4). For GeO2 glass,X-ray and neutron diffraction data are limited to 18 GPa (1, 3, 5).X-ray absorption spectroscopic measurements were conducted to64 GPa (10, 11). Ref. 11 showed no major change in X-ray ab-sorption fine structure up to 64 GPa, although a slight discon-tinuous change in density is observed around 40–45 GPa.Some simulation studies predicted the existence of structural
motifs with CN >6 above ∼100 GPa for SiO2 liquid (12) andglass (13) and above ∼60 GPa for GeO2 glass (13), with no ex-perimental confirmation so far. A study (14) of SiO2 glass using
Brillouin scattering in a diamond anvil cell (DAC) showed a kinkin the pressure dependence of shear-wave velocity at ∼140 GPa andwas interpreted as evidence of ultrahigh-pressure polyamorphism inSiO2. However, no structural information is available under suchhigh pressures. In this study, we developed a new double-stage cell,which enables us to study structure of GeO2 glass at in situ high-pressure conditions up to 91.7 GPa.Large-volume samples are vital for accurate measurements on
the structure of glasses at high pressures using X-ray diffractionbecause of the weak X-ray scattering from amorphous materials.In such measurements, a large diffraction angle is essential foraccurately determining the structure factor with sufficiently largecoverage of momentum transfer Q (Q = 4πEsinθ/12.398, where Eis X-ray energy in keV and θ is the diffraction angle), and forhigh resolution in the reduced pair distribution function in realspace. Recently, generation of pressure up to 94 GPa has beenachieved in a DAC with 1-mm culet size anvils (15). However,this large-volume DAC is designed for neutron diffraction mea-surement; it is difficult to apply this apparatus for X-ray diffractionmeasurement because of limited solid-angle access. Similarly, therehave been attempts to generate high pressures by inserting diamondanvils inside multianvil large-volume presses (16, 17). However,multianvil presses generally have even more limited solid-angleaccess for X-ray diffraction signals.We have developed a new double-stage Paris–Edinburgh (PE)-
type large-volume press to generate high pressures with largesample volume (Fig. 1A). A pair of second-stage diamond anvilsis introduced into the first-stage PE anvils. This combination ofopposed anvils (both first- and second stage) provides a largeopening in the horizontal plane for X-ray diffraction measurement.To reduce absorption of the gasket surrounding the sample, weused a cubic boron nitride + epoxy (10:1 in weight ratio) inner
Significance
A new double-stage large-volume cell was developed to com-press large GeO2 glass samples to near 100 GPa and to conductmultiangle energy-dispersive X-ray diffraction measurementfor in situ structure measurements. We find new experimentalevidence of ultrahigh-pressure polyamorphism in GeO2 glasswith coordination number (CN) significantly >6. The structuralchange to CN higher than 6 is closely associated with thechange in oxygen-packing fraction. Our results provide directstructural evidence for ultradense network-forming glassesand liquids. The observed ultrahigh-pressure polyamorphismmay also exist in other network-forming glasses and liquids aswell, such as SiO2 and other silicate and germanate systems.
Author contributions: Y.K. and G.S. designed research; Y.K., C.K.-B., and Y.S. performedresearch; Y.K., D.I., Y.W., and G.S. analyzed data; and Y.K. wrote the paper.
The authors declare no conflict of interest.
This article is a PNAS Direct Submission.1To whom correspondence should be addressed. Email: [email protected].
This article contains supporting information online at www.pnas.org/lookup/suppl/doi:10.1073/pnas.1524304113/-/DCSupplemental.
3436–3441 | PNAS | March 29, 2016 | vol. 113 | no. 13 www.pnas.org/cgi/doi/10.1073/pnas.1524304113
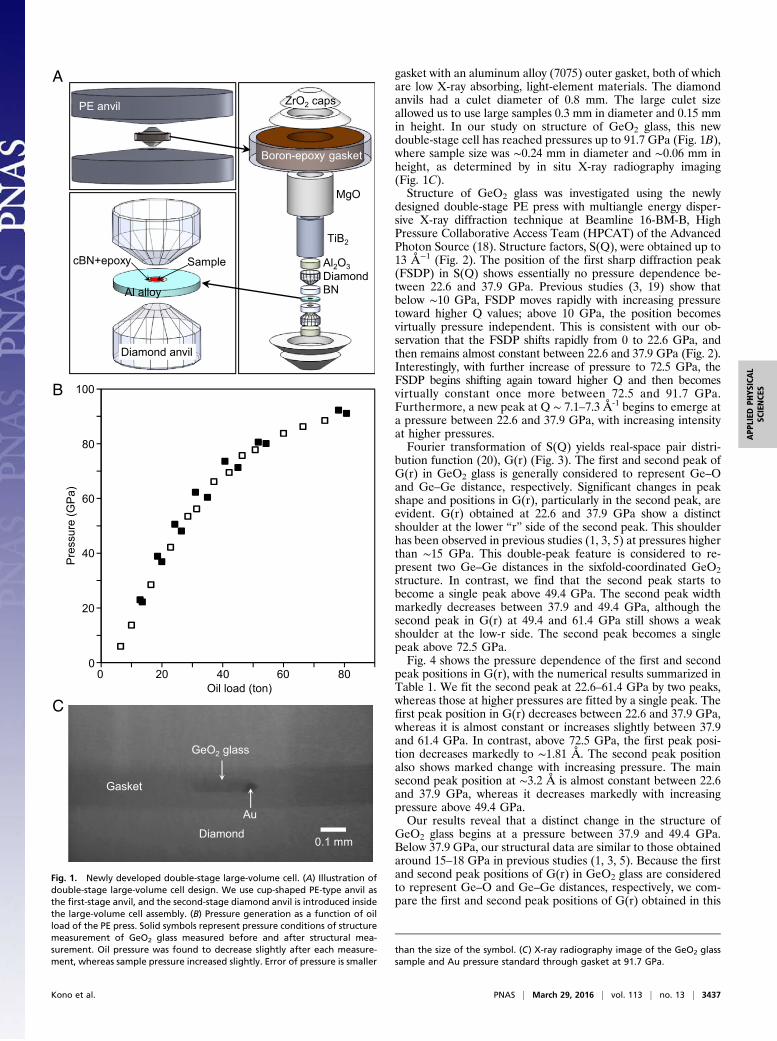
gasket with an aluminum alloy (7075) outer gasket, both of whichare low X-ray absorbing, light-element materials. The diamondanvils had a culet diameter of 0.8 mm. The large culet sizeallowed us to use large samples 0.3 mm in diameter and 0.15 mmin height. In our study on structure of GeO2 glass, this newdouble-stage cell has reached pressures up to 91.7 GPa (Fig. 1B),where sample size was ∼0.24 mm in diameter and ∼0.06 mm inheight, as determined by in situ X-ray radiography imaging(Fig. 1C).Structure of GeO2 glass was investigated using the newly
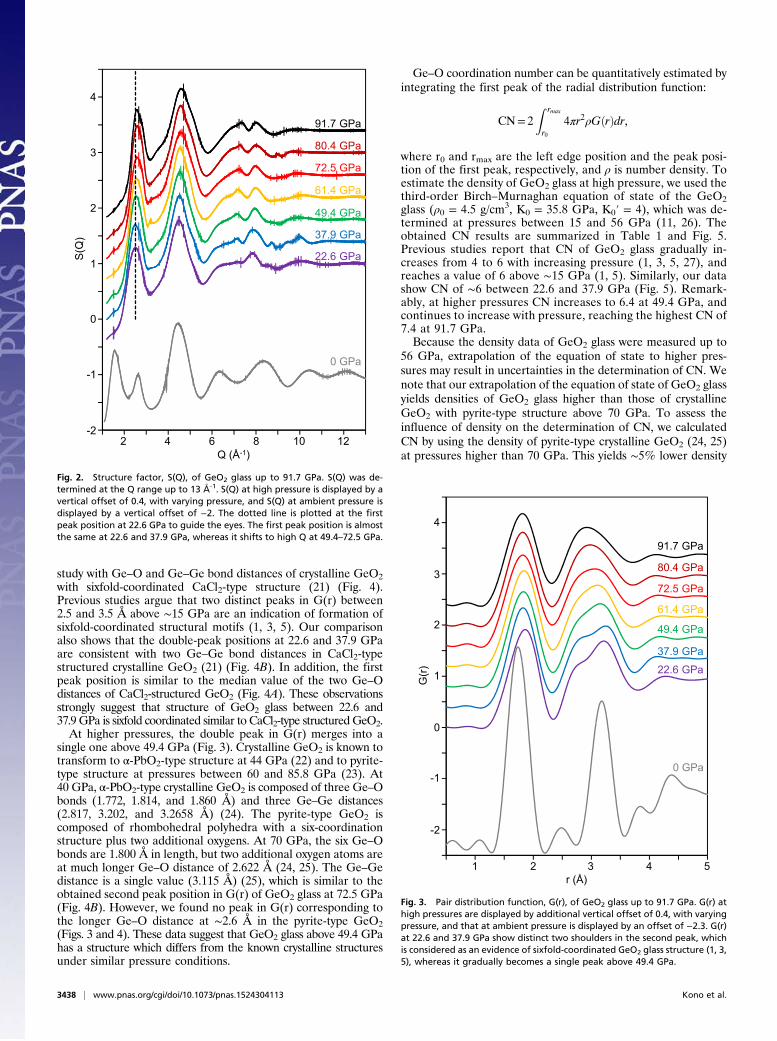
designed double-stage PE press with multiangle energy disper-sive X-ray diffraction technique at Beamline 16-BM-B, HighPressure Collaborative Access Team (HPCAT) of the AdvancedPhoton Source (18). Structure factors, S(Q), were obtained up to13 Å−1 (Fig. 2). The position of the first sharp diffraction peak(FSDP) in S(Q) shows essentially no pressure dependence be-tween 22.6 and 37.9 GPa. Previous studies (3, 19) show thatbelow ∼10 GPa, FSDP moves rapidly with increasing pressuretoward higher Q values; above 10 GPa, the position becomesvirtually pressure independent. This is consistent with our ob-servation that the FSDP shifts rapidly from 0 to 22.6 GPa, andthen remains almost constant between 22.6 and 37.9 GPa (Fig. 2).Interestingly, with further increase of pressure to 72.5 GPa, theFSDP begins shifting again toward higher Q and then becomesvirtually constant once more between 72.5 and 91.7 GPa.Furthermore, a new peak at Q ∼ 7.1–7.3 Å-1 begins to emerge ata pressure between 22.6 and 37.9 GPa, with increasing intensityat higher pressures.Fourier transformation of S(Q) yields real-space pair distri-
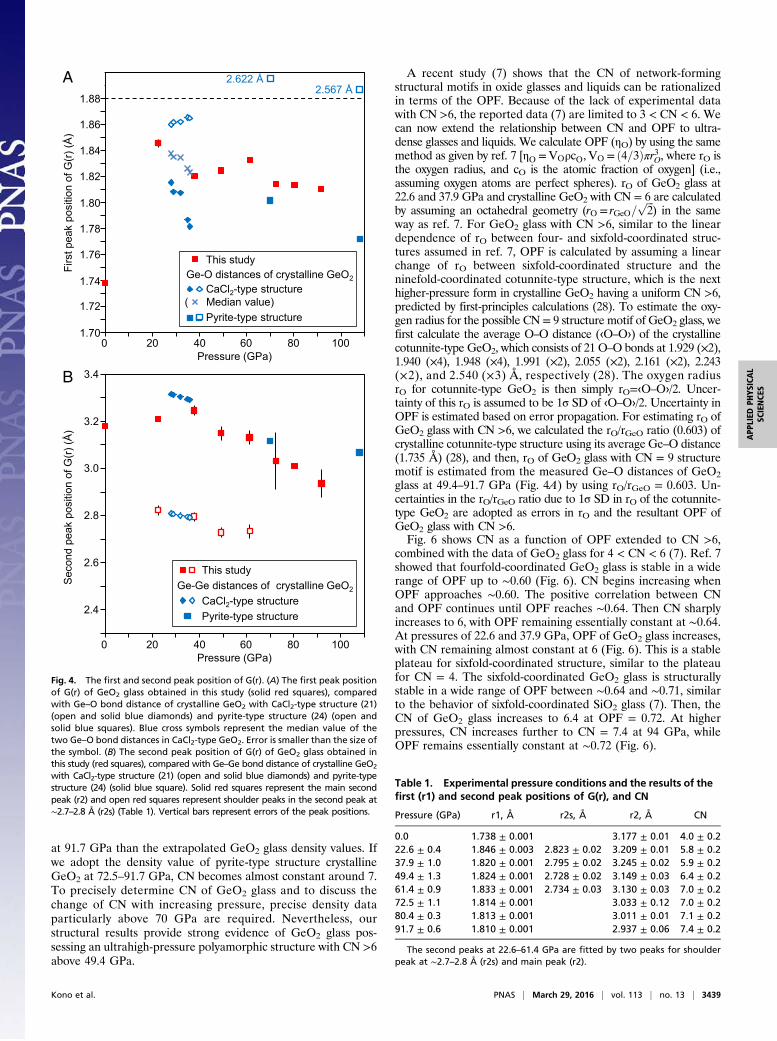
bution function (20), G(r) (Fig. 3). The first and second peak ofG(r) in GeO2 glass is generally considered to represent Ge–Oand Ge–Ge distance, respectively. Significant changes in peakshape and positions in G(r), particularly in the second peak, areevident. G(r) obtained at 22.6 and 37.9 GPa show a distinctshoulder at the lower “r” side of the second peak. This shoulderhas been observed in previous studies (1, 3, 5) at pressures higherthan ∼15 GPa. This double-peak feature is considered to re-present two Ge–Ge distances in the sixfold-coordinated GeO2structure. In contrast, we find that the second peak starts tobecome a single peak above 49.4 GPa. The second peak widthmarkedly decreases between 37.9 and 49.4 GPa, although thesecond peak in G(r) at 49.4 and 61.4 GPa still shows a weakshoulder at the low-r side. The second peak becomes a singlepeak above 72.5 GPa.Fig. 4 shows the pressure dependence of the first and second
peak positions in G(r), with the numerical results summarized inTable 1. We fit the second peak at 22.6–61.4 GPa by two peaks,whereas those at higher pressures are fitted by a single peak. Thefirst peak position in G(r) decreases between 22.6 and 37.9 GPa,whereas it is almost constant or increases slightly between 37.9and 61.4 GPa. In contrast, above 72.5 GPa, the first peak posi-tion decreases markedly to ∼1.81 Å. The second peak positionalso shows marked change with increasing pressure. The mainsecond peak position at ∼3.2 Å is almost constant between 22.6and 37.9 GPa, whereas it decreases markedly with increasingpressure above 49.4 GPa.Our results reveal that a distinct change in the structure of
GeO2 glass begins at a pressure between 37.9 and 49.4 GPa.Below 37.9 GPa, our structural data are similar to those obtainedaround 15–18 GPa in previous studies (1, 3, 5). Because the firstand second peak positions of G(r) in GeO2 glass are consideredto represent Ge–O and Ge–Ge distances, respectively, we com-pare the first and second peak positions of G(r) obtained in this
Oil load (ton)
Pre
ssur
e (G
Pa)
0 20 806040
100
40
0
20
60
80
GeO2 glass
Au
Gasket
Diamond0.1 mm
PE anvil
Diamond anvil
ZrO2 caps
Boron-epoxy gasket
MgO
TiB2
BNDiamond
Al alloy
cBN+epoxy Sample Al2O3
A
B
C
Fig. 1. Newly developed double-stage large-volume cell. (A) Illustration ofdouble-stage large-volume cell design. We use cup-shaped PE-type anvil asthe first-stage anvil, and the second-stage diamond anvil is introduced insidethe large-volume cell assembly. (B) Pressure generation as a function of oilload of the PE press. Solid symbols represent pressure conditions of structuremeasurement of GeO2 glass measured before and after structural mea-surement. Oil pressure was found to decrease slightly after each measure-ment, whereas sample pressure increased slightly. Error of pressure is smaller
than the size of the symbol. (C) X-ray radiography image of the GeO2 glasssample and Au pressure standard through gasket at 91.7 GPa.
Kono et al. PNAS | March 29, 2016 | vol. 113 | no. 13 | 3437
APP
LIED
PHYS
ICAL
SCIENCE
S
study with Ge–O and Ge–Ge bond distances of crystalline GeO2with sixfold-coordinated CaCl2-type structure (21) (Fig. 4).Previous studies argue that two distinct peaks in G(r) between2.5 and 3.5 Å above ∼15 GPa are an indication of formation ofsixfold-coordinated structural motifs (1, 3, 5). Our comparisonalso shows that the double-peak positions at 22.6 and 37.9 GPaare consistent with two Ge–Ge bond distances in CaCl2-typestructured crystalline GeO2 (21) (Fig. 4B). In addition, the firstpeak position is similar to the median value of the two Ge–Odistances of CaCl2-structured GeO2 (Fig. 4A). These observationsstrongly suggest that structure of GeO2 glass between 22.6 and37.9 GPa is sixfold coordinated similar to CaCl2-type structured GeO2.At higher pressures, the double peak in G(r) merges into a
single one above 49.4 GPa (Fig. 3). Crystalline GeO2 is known totransform to α-PbO2-type structure at 44 GPa (22) and to pyrite-type structure at pressures between 60 and 85.8 GPa (23). At40 GPa, α-PbO2-type crystalline GeO2 is composed of three Ge–Obonds (1.772, 1.814, and 1.860 Å) and three Ge–Ge distances(2.817, 3.202, and 3.2658 Å) (24). The pyrite-type GeO2 iscomposed of rhombohedral polyhedra with a six-coordinationstructure plus two additional oxygens. At 70 GPa, the six Ge–Obonds are 1.800 Å in length, but two additional oxygen atoms areat much longer Ge–O distance of 2.622 Å (24, 25). The Ge–Gedistance is a single value (3.115 Å) (25), which is similar to theobtained second peak position in G(r) of GeO2 glass at 72.5 GPa(Fig. 4B). However, we found no peak in G(r) corresponding tothe longer Ge–O distance at ∼2.6 Å in the pyrite-type GeO2(Figs. 3 and 4). These data suggest that GeO2 glass above 49.4 GPahas a structure which differs from the known crystalline structuresunder similar pressure conditions.
Ge–O coordination number can be quantitatively estimated byintegrating the first peak of the radial distribution function:
CN= 2Z rmax
r04πr2ρGðrÞdr,
where r0 and rmax are the left edge position and the peak posi-tion of the first peak, respectively, and ρ is number density. Toestimate the density of GeO2 glass at high pressure, we used thethird-order Birch–Murnaghan equation of state of the GeO2glass (ρ0 = 4.5 g/cm3, K0 = 35.8 GPa, K0′ = 4), which was de-termined at pressures between 15 and 56 GPa (11, 26). Theobtained CN results are summarized in Table 1 and Fig. 5.Previous studies report that CN of GeO2 glass gradually in-creases from 4 to 6 with increasing pressure (1, 3, 5, 27), andreaches a value of 6 above ∼15 GPa (1, 5). Similarly, our datashow CN of ∼6 between 22.6 and 37.9 GPa (Fig. 5). Remark-ably, at higher pressures CN increases to 6.4 at 49.4 GPa, andcontinues to increase with pressure, reaching the highest CN of7.4 at 91.7 GPa.Because the density data of GeO2 glass were measured up to
56 GPa, extrapolation of the equation of state to higher pres-sures may result in uncertainties in the determination of CN. Wenote that our extrapolation of the equation of state of GeO2 glassyields densities of GeO2 glass higher than those of crystallineGeO2 with pyrite-type structure above 70 GPa. To assess theinfluence of density on the determination of CN, we calculatedCN by using the density of pyrite-type crystalline GeO2 (24, 25)at pressures higher than 70 GPa. This yields ∼5% lower densityQ (Å-1)
S(Q
)
22.6 GPa
37.9 GPa
49.4 GPa
61.4 GPa
72.5 GPa
80.4 GPa
91.7 GPa
2 1086 124
0 GPa
-2
2
-1
1
4
0
3
Fig. 2. Structure factor, S(Q), of GeO2 glass up to 91.7 GPa. S(Q) was de-termined at the Q range up to 13 Å-1. S(Q) at high pressure is displayed by avertical offset of 0.4, with varying pressure, and S(Q) at ambient pressure isdisplayed by a vertical offset of −2. The dotted line is plotted at the firstpeak position at 22.6 GPa to guide the eyes. The first peak position is almostthe same at 22.6 and 37.9 GPa, whereas it shifts to high Q at 49.4–72.5 GPa.
r (Å)
G(r)
1 432 5
22.6 GPa
37.9 GPa
49.4 GPa
61.4 GPa
72.5 GPa
80.4 GPa
91.7 GPa
0 GPa
-2
2
-1
1
4
0
3
Fig. 3. Pair distribution function, G(r), of GeO2 glass up to 91.7 GPa. G(r) athigh pressures are displayed by additional vertical offset of 0.4, with varyingpressure, and that at ambient pressure is displayed by an offset of −2.3. G(r)at 22.6 and 37.9 GPa show distinct two shoulders in the second peak, whichis considered as an evidence of sixfold-coordinated GeO2 glass structure (1, 3,5), whereas it gradually becomes a single peak above 49.4 GPa.
3438 | www.pnas.org/cgi/doi/10.1073/pnas.1524304113 Kono et al.
at 91.7 GPa than the extrapolated GeO2 glass density values. Ifwe adopt the density value of pyrite-type structure crystallineGeO2 at 72.5–91.7 GPa, CN becomes almost constant around 7.To precisely determine CN of GeO2 glass and to discuss thechange of CN with increasing pressure, precise density dataparticularly above 70 GPa are required. Nevertheless, ourstructural results provide strong evidence of GeO2 glass pos-sessing an ultrahigh-pressure polyamorphic structure with CN >6above 49.4 GPa.
A recent study (7) shows that the CN of network-formingstructural motifs in oxide glasses and liquids can be rationalizedin terms of the OPF. Because of the lack of experimental datawith CN >6, the reported data (7) are limited to 3 < CN < 6. Wecan now extend the relationship between CN and OPF to ultra-dense glasses and liquids. We calculate OPF (ηO) by using the samemethod as given by ref. 7 [ηO =VOρcO,VO = ð4=3Þπr3O, where rO isthe oxygen radius, and cO is the atomic fraction of oxygen] (i.e.,assuming oxygen atoms are perfect spheres). rO of GeO2 glass at22.6 and 37.9 GPa and crystalline GeO2 with CN = 6 are calculatedby assuming an octahedral geometry (rO = rGeO=
ffiffiffi2
p) in the same
way as ref. 7. For GeO2 glass with CN >6, similar to the lineardependence of rO between four- and sixfold-coordinated struc-tures assumed in ref. 7, OPF is calculated by assuming a linearchange of rO between sixfold-coordinated structure and theninefold-coordinated cotunnite-type structure, which is the nexthigher-pressure form in crystalline GeO2 having a uniform CN >6,predicted by first-principles calculations (28). To estimate the oxy-gen radius for the possible CN = 9 structure motif of GeO2 glass, wefirst calculate the average O–O distance (‹O–O›) of the crystallinecotunnite-type GeO2, which consists of 21 O–O bonds at 1.929 (×2),1.940 (×4), 1.948 (×4), 1.991 (×2), 2.055 (×2), 2.161 (×2), 2.243(×2), and 2.540 (×3) Å, respectively (28). The oxygen radiusrO for cotunnite-type GeO2 is then simply rO=‹O–O›/2. Uncer-tainty of this rO is assumed to be 1σ SD of ‹O–O›/2. Uncertainty inOPF is estimated based on error propagation. For estimating rO ofGeO2 glass with CN >6, we calculated the rO/rGeO ratio (0.603) ofcrystalline cotunnite-type structure using its average Ge–O distance(1.735 Å) (28), and then, rO of GeO2 glass with CN = 9 structuremotif is estimated from the measured Ge–O distances of GeO2glass at 49.4–91.7 GPa (Fig. 4A) by using rO/rGeO = 0.603. Un-certainties in the rO/rGeO ratio due to 1σ SD in rO of the cotunnite-type GeO2 are adopted as errors in rO and the resultant OPF ofGeO2 glass with CN >6.Fig. 6 shows CN as a function of OPF extended to CN >6,
combined with the data of GeO2 glass for 4 < CN < 6 (7). Ref. 7showed that fourfold-coordinated GeO2 glass is stable in a widerange of OPF up to ∼0.60 (Fig. 6). CN begins increasing whenOPF approaches ∼0.60. The positive correlation between CNand OPF continues until OPF reaches ∼0.64. Then CN sharplyincreases to 6, with OPF remaining essentially constant at ∼0.64.At pressures of 22.6 and 37.9 GPa, OPF of GeO2 glass increases,with CN remaining almost constant at 6 (Fig. 6). This is a stableplateau for sixfold-coordinated structure, similar to the plateaufor CN = 4. The sixfold-coordinated GeO2 glass is structurallystable in a wide range of OPF between ∼0.64 and ∼0.71, similarto the behavior of sixfold-coordinated SiO2 glass (7). Then, theCN of GeO2 glass increases to 6.4 at OPF = 0.72. At higherpressures, CN increases further to CN = 7.4 at 94 GPa, whileOPF remains essentially constant at ∼0.72 (Fig. 6).
Pressure (GPa)
Firs
t pea
k po
sitio
n of
G(r)
(Å)
0 20 806040 100
Pressure (GPa)
Sec
ond
peak
pos
ition
of G
(r) (Å
)
0 20 806040 100
This studyGe-O distances of crystalline GeO2
CaCl2-type structure( Median value)
Pyrite-type structure
This studyGe-Ge distances of crystalline GeO2
CaCl2-type structurePyrite-type structure
3.4
3.0
2.4
2.6
2.8
3.2
1.86
1.80
1.70
1.74
1.72
1.76
1.78
1.82
1.84
1.88
2.622 Å2.567 Å
A
B
Fig. 4. The first and second peak position of G(r). (A) The first peak positionof G(r) of GeO2 glass obtained in this study (solid red squares), comparedwith Ge–O bond distance of crystalline GeO2 with CaCl2-type structure (21)(open and solid blue diamonds) and pyrite-type structure (24) (open andsolid blue squares). Blue cross symbols represent the median value of thetwo Ge–O bond distances in CaCl2-type GeO2. Error is smaller than the size ofthe symbol. (B) The second peak position of G(r) of GeO2 glass obtained inthis study (red squares), compared with Ge–Ge bond distance of crystalline GeO2
with CaCl2-type structure (21) (open and solid blue diamonds) and pyrite-typestructure (24) (solid blue square). Solid red squares represent the main secondpeak (r2) and open red squares represent shoulder peaks in the second peak at∼2.7–2.8 Å (r2s) (Table 1). Vertical bars represent errors of the peak positions.
Table 1. Experimental pressure conditions and the results of thefirst (r1) and second peak positions of G(r), and CN
Pressure (GPa) r1, Å r2s, Å r2, Å CN
0.0 1.738 ± 0.001 3.177 ± 0.01 4.0 ± 0.222.6 ± 0.4 1.846 ± 0.003 2.823 ± 0.02 3.209 ± 0.01 5.8 ± 0.237.9 ± 1.0 1.820 ± 0.001 2.795 ± 0.02 3.245 ± 0.02 5.9 ± 0.249.4 ± 1.3 1.824 ± 0.001 2.728 ± 0.02 3.149 ± 0.03 6.4 ± 0.261.4 ± 0.9 1.833 ± 0.001 2.734 ± 0.03 3.130 ± 0.03 7.0 ± 0.272.5 ± 1.1 1.814 ± 0.001 3.033 ± 0.12 7.0 ± 0.280.4 ± 0.3 1.813 ± 0.001 3.011 ± 0.01 7.1 ± 0.291.7 ± 0.6 1.810 ± 0.001 2.937 ± 0.06 7.4 ± 0.2
The second peaks at 22.6–61.4 GPa are fitted by two peaks for shoulderpeak at ∼2.7–2.8 Å (r2s) and main peak (r2).
Kono et al. PNAS | March 29, 2016 | vol. 113 | no. 13 | 3439
APP
LIED
PHYS
ICAL
SCIENCE
S
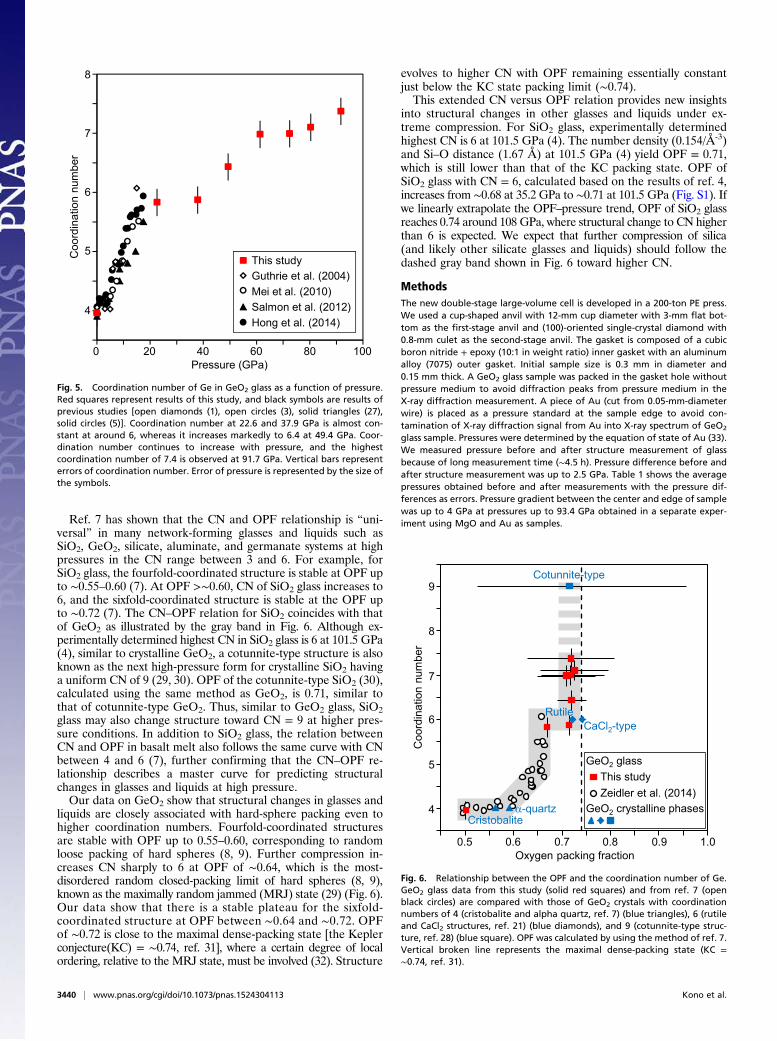
Ref. 7 has shown that the CN and OPF relationship is “uni-versal” in many network-forming glasses and liquids such asSiO2, GeO2, silicate, aluminate, and germanate systems at highpressures in the CN range between 3 and 6. For example, forSiO2 glass, the fourfold-coordinated structure is stable at OPF upto ∼0.55–0.60 (7). At OPF >∼0.60, CN of SiO2 glass increases to6, and the sixfold-coordinated structure is stable at the OPF upto ∼0.72 (7). The CN–OPF relation for SiO2 coincides with thatof GeO2 as illustrated by the gray band in Fig. 6. Although ex-perimentally determined highest CN in SiO2 glass is 6 at 101.5 GPa(4), similar to crystalline GeO2, a cotunnite-type structure is alsoknown as the next high-pressure form for crystalline SiO2 havinga uniform CN of 9 (29, 30). OPF of the cotunnite-type SiO2 (30),calculated using the same method as GeO2, is 0.71, similar tothat of cotunnite-type GeO2. Thus, similar to GeO2 glass, SiO2glass may also change structure toward CN = 9 at higher pres-sure conditions. In addition to SiO2 glass, the relation betweenCN and OPF in basalt melt also follows the same curve with CNbetween 4 and 6 (7), further confirming that the CN–OPF re-lationship describes a master curve for predicting structuralchanges in glasses and liquids at high pressure.Our data on GeO2 show that structural changes in glasses and
liquids are closely associated with hard-sphere packing even tohigher coordination numbers. Fourfold-coordinated structuresare stable with OPF up to 0.55–0.60, corresponding to randomloose packing of hard spheres (8, 9). Further compression in-creases CN sharply to 6 at OPF of ∼0.64, which is the most-disordered random closed-packing limit of hard spheres (8, 9),known as the maximally random jammed (MRJ) state (29) (Fig. 6).Our data show that there is a stable plateau for the sixfold-coordinated structure at OPF between ∼0.64 and ∼0.72. OPFof ∼0.72 is close to the maximal dense-packing state [the Keplerconjecture(KC) = ∼0.74, ref. 31], where a certain degree of localordering, relative to the MRJ state, must be involved (32). Structure
evolves to higher CN with OPF remaining essentially constantjust below the KC state packing limit (∼0.74).This extended CN versus OPF relation provides new insights
into structural changes in other glasses and liquids under ex-treme compression. For SiO2 glass, experimentally determinedhighest CN is 6 at 101.5 GPa (4). The number density (0.154/Å-3)and Si–O distance (1.67 Å) at 101.5 GPa (4) yield OPF = 0.71,which is still lower than that of the KC packing state. OPF ofSiO2 glass with CN = 6, calculated based on the results of ref. 4,increases from ∼0.68 at 35.2 GPa to ∼0.71 at 101.5 GPa (Fig. S1). Ifwe linearly extrapolate the OPF–pressure trend, OPF of SiO2 glassreaches 0.74 around 108 GPa, where structural change to CN higherthan 6 is expected. We expect that further compression of silica(and likely other silicate glasses and liquids) should follow thedashed gray band shown in Fig. 6 toward higher CN.
MethodsThe new double-stage large-volume cell is developed in a 200-ton PE press.We used a cup-shaped anvil with 12-mm cup diameter with 3-mm flat bot-tom as the first-stage anvil and (100)-oriented single-crystal diamond with0.8-mm culet as the second-stage anvil. The gasket is composed of a cubicboron nitride + epoxy (10:1 in weight ratio) inner gasket with an aluminumalloy (7075) outer gasket. Initial sample size is 0.3 mm in diameter and0.15 mm thick. A GeO2 glass sample was packed in the gasket hole withoutpressure medium to avoid diffraction peaks from pressure medium in theX-ray diffraction measurement. A piece of Au (cut from 0.05-mm-diameterwire) is placed as a pressure standard at the sample edge to avoid con-tamination of X-ray diffraction signal from Au into X-ray spectrum of GeO2
glass sample. Pressures were determined by the equation of state of Au (33).We measured pressure before and after structure measurement of glassbecause of long measurement time (∼4.5 h). Pressure difference before andafter structure measurement was up to 2.5 GPa. Table 1 shows the averagepressures obtained before and after measurements with the pressure dif-ferences as errors. Pressure gradient between the center and edge of samplewas up to 4 GPa at pressures up to 93.4 GPa obtained in a separate exper-iment using MgO and Au as samples.
Pressure (GPa)
Coo
rdin
atio
n nu
mbe
r
0 20 806040 100
4
7
5
6
8
Hong et al. (2014)Salmon et al. (2012)Mei et al. (2010)Guthrie et al. (2004)This study
Fig. 5. Coordination number of Ge in GeO2 glass as a function of pressure.Red squares represent results of this study, and black symbols are results ofprevious studies [open diamonds (1), open circles (3), solid triangles (27),solid circles (5)]. Coordination number at 22.6 and 37.9 GPa is almost con-stant at around 6, whereas it increases markedly to 6.4 at 49.4 GPa. Coor-dination number continues to increase with pressure, and the highestcoordination number of 7.4 is observed at 91.7 GPa. Vertical bars representerrors of coordination number. Error of pressure is represented by the size ofthe symbols.
Oxygen packing fraction
Coo
rdin
atio
n nu
mbe
r
4
7
5
6
8
GeO2 crystalline phases
This studyZeidler et al. (2014)
GeO2 glass
0.5 0.90.70.6 1.00.8
Cristobalite-quartz
RutileCaCl2-type
9Cotunnite-type
Fig. 6. Relationship between the OPF and the coordination number of Ge.GeO2 glass data from this study (solid red squares) and from ref. 7 (openblack circles) are compared with those of GeO2 crystals with coordinationnumbers of 4 (cristobalite and alpha quartz, ref. 7) (blue triangles), 6 (rutileand CaCl2 structures, ref. 21) (blue diamonds), and 9 (cotunnite-type struc-ture, ref. 28) (blue square). OPF was calculated by using the method of ref. 7.Vertical broken line represents the maximal dense-packing state (KC =∼0.74, ref. 31).
3440 | www.pnas.org/cgi/doi/10.1073/pnas.1524304113 Kono et al.
Structure of GeO2 glass was investigated using the multiangle energy-dispersive X-ray diffraction technique (18). We used unfocused white X-rays.The size of incident white X-ray is 0.1 mm in both horizontal and verticaldirections. We collected series of energy-dispersive X-ray diffraction patternsat 2θ angles of 4°, 5°, 7°, 9°, 12°, 16°, 21°, and 29° using a Ge solid-statedetector (Canberra). Total exposure time to obtain the X-ray diffractionpatterns for eight 2θ angles was about 4.5 h. Structure factor was derivedfrom the observed energy-dispersive X-ray diffraction patterns using theprogram aEDXD (18). The Kaplow-type correction using an optimizationprocedure (34) was applied in determining final structure factor and pairdistribution function. The iteration in the optimization process is typically 3.
ACKNOWLEDGMENTS. We acknowledge two anonymous reviewers for valu-able comments. This study was performed at HPCAT (Sector 16), AdvancedPhoton Source, Argonne National Laboratory. This research is supported byDepartment of Energy (DOE)-National Nuclear Security Administration underAward DE-NA0001974 and DOE-Office of Basic Energy Sciences under AwardDE-FG02-99ER45775. Advanced Photon Source is a US DOE Office of ScienceUser Facility operated for the DOE Office of Science by Argonne NationalLaboratory under Contract DE-AC02-06CH11357. The PE cell program is partlysupported by GeoSoilEnviroCARS, which is supported by the National ScienceFoundation–Earth Sciences (EAR-1128799) and Department of Energy-GeoSciences(DE-FG02-94ER14466). Y.W. acknowledges support from National Science Founda-tion EAR-1214376.
1. Guthrie M, et al. (2004) Formation and structure of a dense octahedral glass. Phys RevLett 93(11):115502.
2. Benmore CJ, et al. (2010) Structural and topological changes in silica glass at pressure.Phys Rev B 81(5):054105.
3. Mei Q, et al. (2010) High-pressure x-ray diffraction measurements on vitreous GeO2
under hydrostatic conditions. Phys Rev B 81(17):174113.4. Sato T, Funamori N (2010) High-pressure structural transformation of SiO2 glass up to
100 GPa. Phys Rev B 82(18):184102.5. Hong X, Ehm L, Duffy TS (2014) Polyhedral units and network connectivity in GeO2 glass
at high pressure: An X-ray total scattering investigation. Appl Phys Lett 105(8):081904.6. Kohara S, Suzuya K (2005) Intermediate-range order in vitreous SiO2 and GeO2. J Phys
Condens Matter 17(5):S77.7. Zeidler A, Salmon PS, Skinner LB (2014) Packing and the structural transformations in
liquid and amorphous oxides from ambient to extreme conditions. Proc Natl Acad SciUSA 111(28):10045–10048.
8. Scott GD, Kilgour DM (1969) The density of random close packing of spheres. J Phys DAppl Phys 2(6):863.
9. Song C, Wang P, Makse HA (2008) A phase diagram for jammed matter. Nature453(7195):629–632.
10. Baldini M, et al. (2010) High-pressure EXAFS study of vitreous GeO2 up to 44 GPa. PhysRev B 81(2):024201.
11. Hong X, Newville M, Duffy TS, Sutton SR, Rivers ML (2014) X-ray absorption spec-troscopy of GeO2 glass to 64 GPa. J Phys Condens Matter 26(3):035104.
12. Karki BB, Bhattarai D, Stixrude L (2007) First-principles simulations of liquid silica:Structural and dynamical behavior at high pressure. Phys Rev B 76(10):104205.
13. Brazhkin VV, Lyapin AG, Trachenko K (2011) Atomistic modeling of multiple amor-phous-amorphous transitions in SiO2 and GeO2 glasses at megabar pressures. Phys RevB 83(13):132103.
14. Murakami M, Bass JD (2010) Spectroscopic evidence for ultrahigh-pressure poly-morphism in SiO2 glass. Phys Rev Lett 104(2):025504.
15. Boehler R, et al. (2013) Large-volume diamond cells for neutron diffraction above90 GPa. High Press Res 33(3):546–554.
16. Endo S, Ito K (1980) Electrical resistance of αFe2O3 under ultrahigh static pressure.Solid State Commun 36(2):189–190.
17. Kunimoto T, Irifune T, Sumiya H (2008) Pressure generation in a 6-8-2 type multi-anvilsystem: A performance test for third-stage anvils with various diamonds. High PressRes 28(3):237–244.
18. Kono Y, Park C, Kenney-Benson C, Shen G, Wang Y (2014) Toward comprehensivestudies of liquids at high pressures and high temperatures: Combined structure,elastic wave velocity, and viscosity measurements in the Paris–Edinburgh cell. PhysEarth Planet Inter 228(0):269–280.
19. Hong X, et al. (2007) Intermediate states of GeO2 glass under pressures up to 35 GPa.Phys Rev B 75(10):104201.
20. Kaplow R, Strong SL, Averbach BL (1965) Radial density functions for liquid mercuryand lead. Phys Rev 138(5A):A1336–A1345.
21. Haines J, Leger JM, Chateau C, Pereira AS (2000) Structural evolution of rutile-typeand CaCl2-type germanium dioxide at high pressure. Phys ChemMiner 27(8):575–582.
22. Prakapenka VB, et al. (2003) α-PbO2-type high-pressure polymorph of GeO2. Phys RevB 67(13):132101.
23. Ono S, Tsuchiya T, Hirose K, Ohishi Y (2003) High-pressure form of pyrite-type ger-manium dioxide. Phys Rev B 68(1):014103.
24. Łodziana Z, Parlinski K, Hafner J (2001) Ab initio studies of high-pressure transfor-mations in GeO2. Phys Rev B 63(13):134106.
25. Shiraki K, Tsuchiya T, Ono S (2003) Structural refinements of high-pressure phases ingermanium dioxide. Acta Crystallogr B 59(Pt 6):701–708.
26. Hong X, Shen G, Prakapenka VB, Rivers ML, Sutton SR (2007) Density measurementsof noncrystalline materials at high pressure with diamond anvil cell. Rev Sci Instrum78(10):103905.
27. Salmon PS, et al. (2012) Density-driven structural transformations in network formingglasses: A high-pressure neutron diffraction study of GeO2 glass up to 17.5 GPa. J PhysCondens Matter 24(41):415102.
28. Dekura H, Tsuchiya T, Tsuchiya J (2011) First-principles prediction of post-pyrite phasetransitions in germanium dioxide. Phys Rev B 83(13):134114.
29. Oganov AR, Gillan MJ, Price GD (2005) Structural stability of silica at high pressuresand temperatures. Phys Rev B 71(6):064104.
30. Wu S, et al. (2011) Identification of post-pyrite phase transitions in SiO2 by a geneticalgorithm. Phys Rev B 83(18):184102.
31. Hales TC (2005) A proof of the Kepler conjecture. Ann Math 162:1065–1185.32. Torquato S, Stillinger FH (2010) Jammed hard-particle packings: From Kepler to
Bernal and beyond. Rev Mod Phys 82(3):2633.33. Tsuchiya T (2003) First‐principles prediction of the P‐V‐T equation of state of gold and
the 660‐km discontinuity in Earth’s mantle. J Geophys Res: Solid Earth 108(B10):2462.34. Shen G, Prakapenka VB, Rivers ML, Sutton SR (2003) Structural investigation of
amorphous materials at high pressures using the diamond anvil cell. Rev Sci Instrum74(6):3021–3026.
Kono et al. PNAS | March 29, 2016 | vol. 113 | no. 13 | 3441
APP
LIED
PHYS
ICAL
SCIENCE
S