Embed Size (px)
Citation preview
1
Supplementary Information for
Ultra-large scale syntheses of monodisperse
nanocrystals via a simple and inexpensive route
JONGNAM PARK1, KWANGJIN AN1, YOSUN HWANG2, JE-GEUN PARK2, HAN-
JIN NOH3, JAE–YOUNG KIM3, JAE-HOON PARK3, NONG-MOON HWANG4,
AND TAEGHWAN HYEON*1
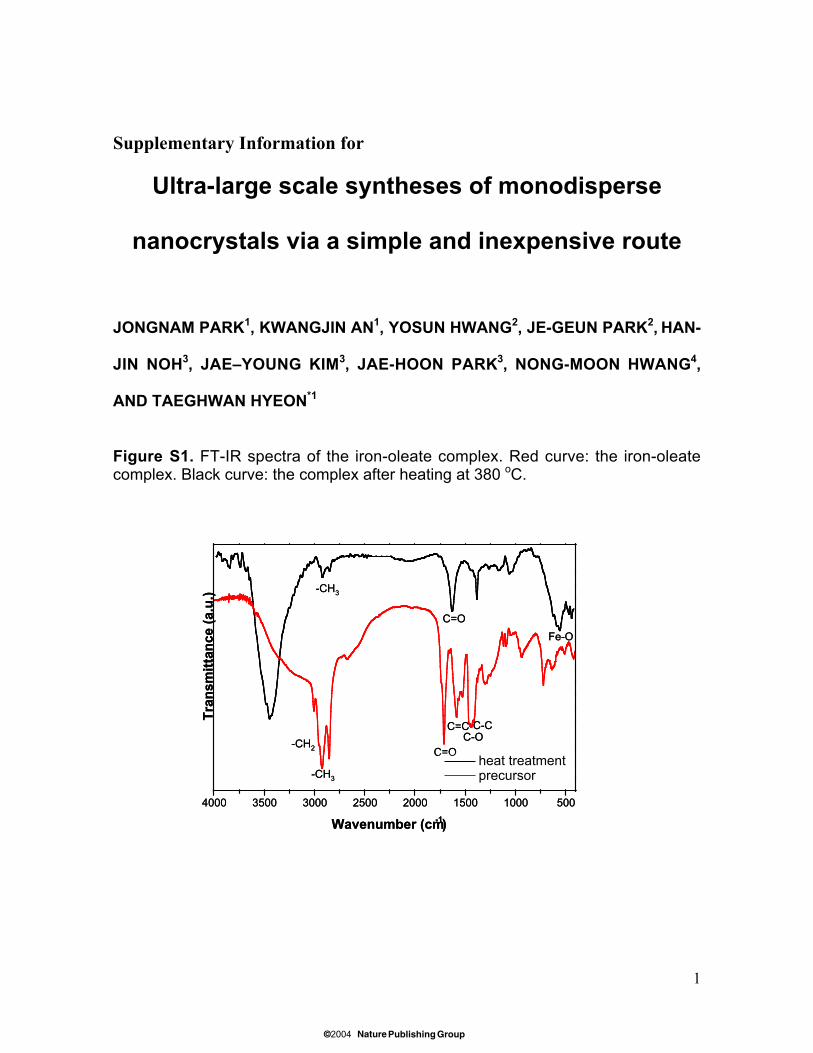
Figure S1. FT-IR spectra of the iron-oleate complex. Red curve: the iron-oleatecomplex. Black curve: the complex after heating at 380 oC.
4000 3500 3000 2500 2000 1500 1000 500
heat treatment precursor
Wavenumber (cm-1)
Tra
nsm
itta
nce
(a.
u.)
C=C
C=O-CH2
-CH3
C-OC-C
Fe-O
C=O
-CH3
4000 3500 3000 2500 2000 1500 1000 500
heat treatment precursor
Wavenumber (cm-1)
Tra
nsm
itta
nce
(a.
u.)
C=C
C=O-CH2
-CH3
C-OC-C
Fe-O
C=O
-CH3
© 2004 Nature Publishing Group
2
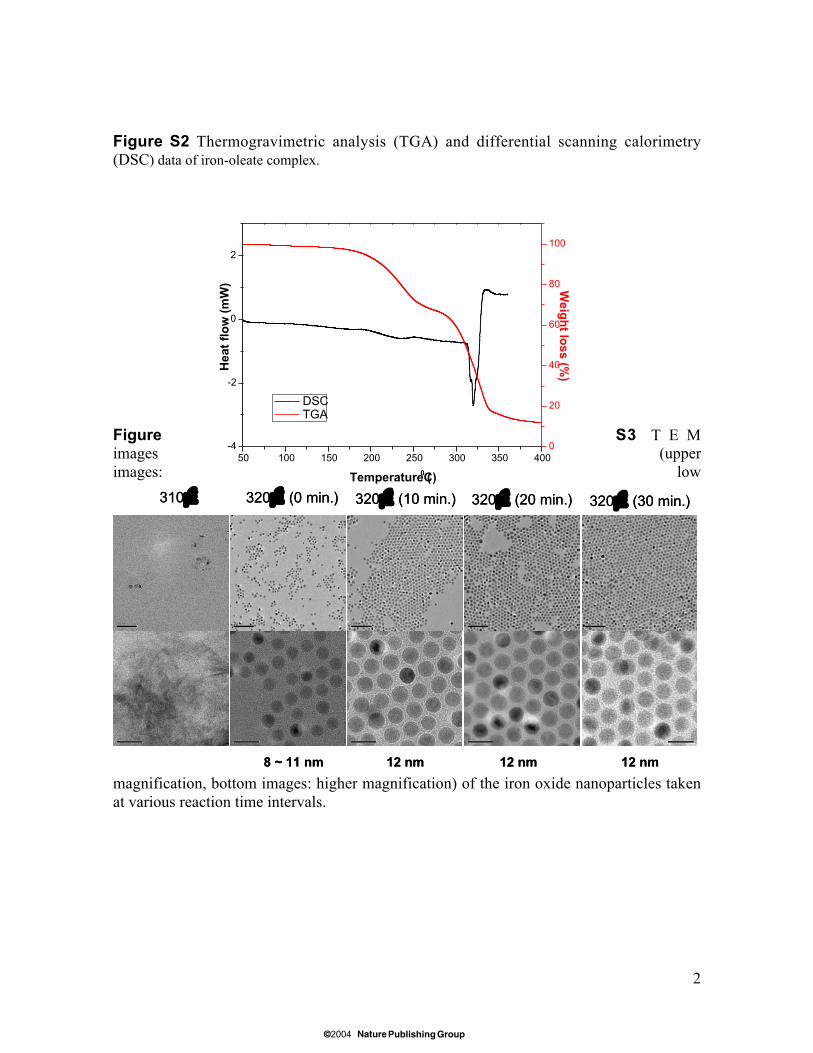
Figure S2 Thermogravimetric analysis (TGA) and differential scanning calorimetry(DSC) data of iron-oleate complex.
Figure S3 T E Mimages (upperimages: low
magnification, bottom images: higher magnification) of the iron oxide nanoparticles takenat various reaction time intervals.
320¡É (0 min.) 320¡É (10 min.) 320¡É (20 min.) 320¡É (30 min.)310¡É
12 nm12 nm12 nm8 ~ 11 nm
320¡É (0 min.) 320¡É (10 min.) 320¡É (20 min.) 320¡É (30 min.)310¡É
12 nm12 nm12 nm8 ~ 11 nm
50 100 150 200 250 300 350 400-4
-2
0
2
DSC TGA
Temperature ( 0C)
Hea
t fl
ow
(m
W)
0
20
40
60
80
100W
eigh
t loss (%
)
© 2004 Nature Publishing Group
3
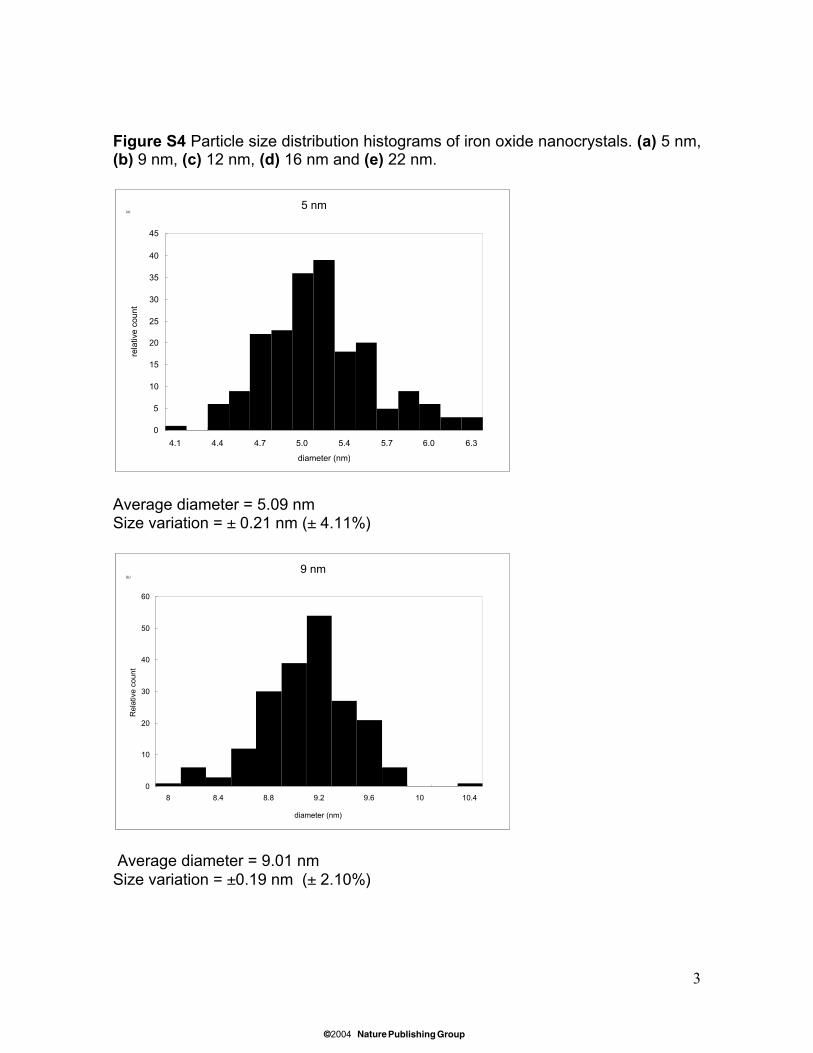
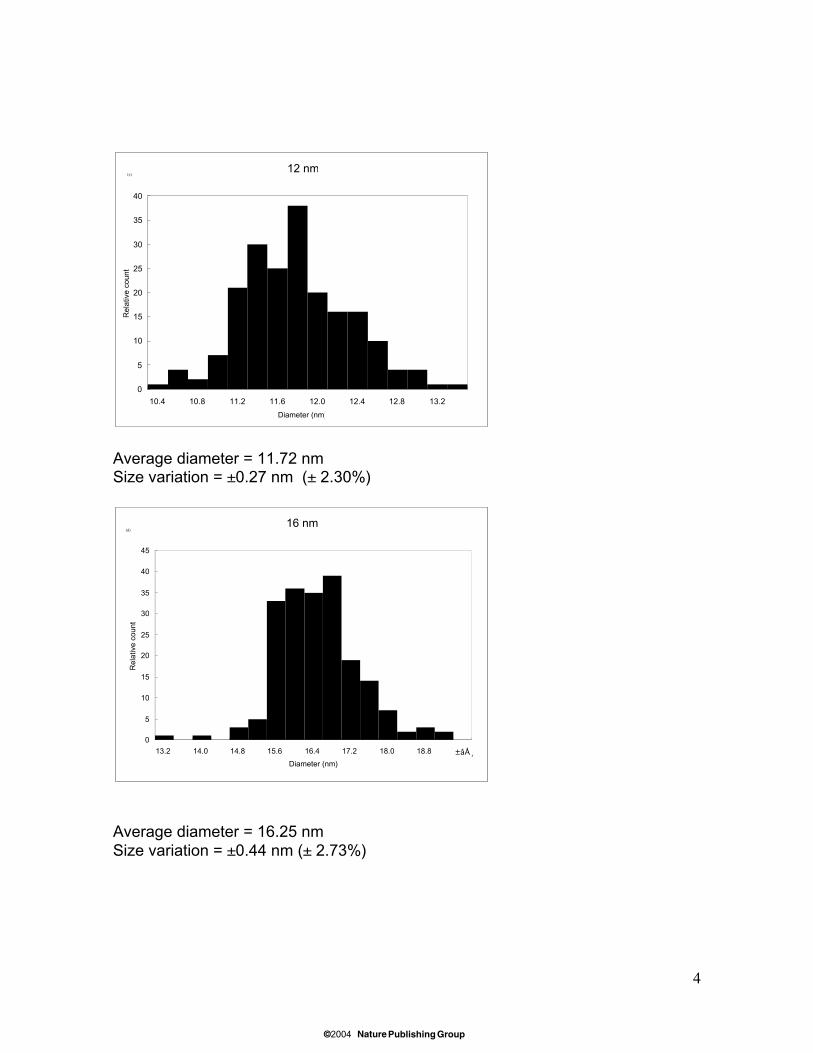
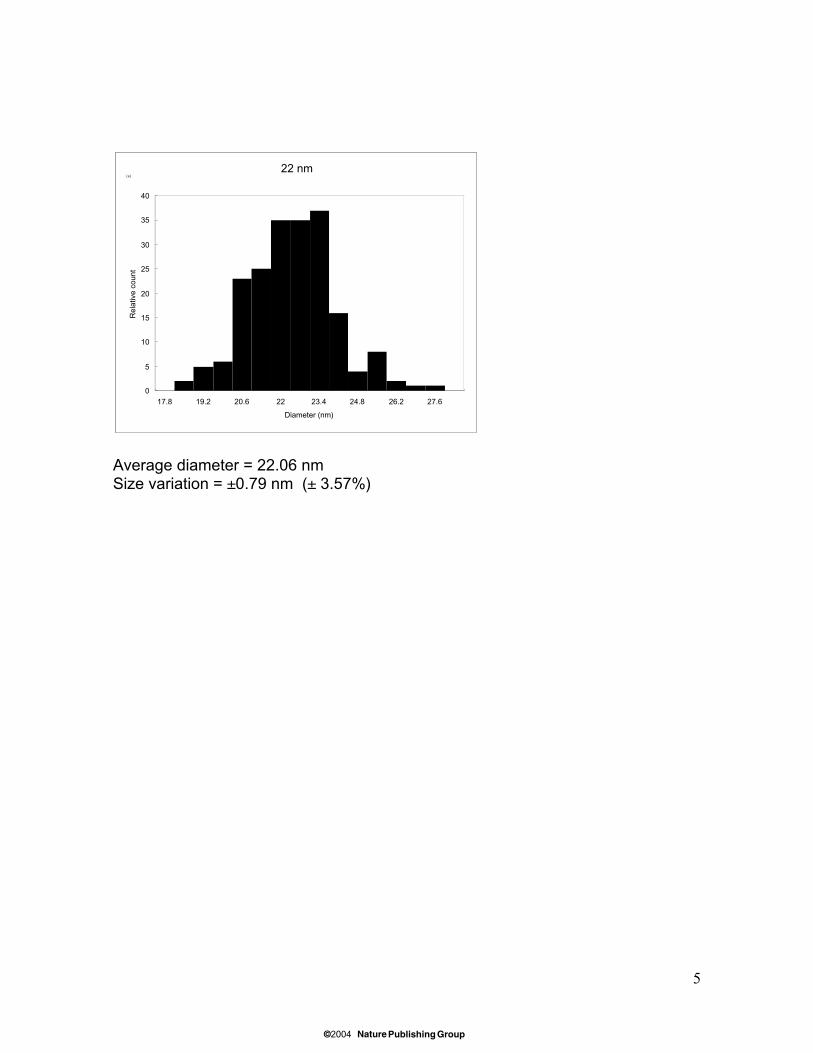
Figure S4 Particle size distribution histograms of iron oxide nanocrystals. (a) 5 nm,(b) 9 nm, (c) 12 nm, (d) 16 nm and (e) 22 nm.
Average diameter = 5.09 nmSize variation = ± 0.21 nm (± 4.11%)
Average diameter = 9.01 nmSize variation = ±0.19 nm (± 2.10%)
5 nm
0
5
10
15
20
25
30
35
40
45
4.1 4.4 4.7 5.0 5.4 5.7 6.0 6.3
diameter (nm)
rela
tive
coun
t
(a) 5 nm
0
5
10
15
20
25
30
35
40
45
4.1 4.4 4.7 5.0 5.4 5.7 6.0 6.3
diameter (nm)
rela
tive
coun
t
(a)
9 nm
0
10
20
30
40
50
60
8 8.4 8.8 9.2 9.6 10 10.4
diameter (nm)
Rel
ativ
e co
unt
(b) 9 nm
0
10
20
30
40
50
60
8 8.4 8.8 9.2 9.6 10 10.4
diameter (nm)
Rel
ativ
e co
unt
(b)
© 2004 Nature Publishing Group
4
Average diameter = 11.72 nmSize variation = ±0.27 nm (± 2.30%)
Average diameter = 16.25 nmSize variation = ±0.44 nm (± 2.73%)
16 nm
0
5
10
15
20
25
30
35
40
45
13.2 14.0 14.8 15.6 16.4 17.2 18.0 18.8 ±âŸDiameter (nm)
Rel
ativ
e co
unt
(d) 16 nm
0
5
10
15
20
25
30
35
40
45
13.2 14.0 14.8 15.6 16.4 17.2 18.0 18.8 ±âŸDiameter (nm)
Rel
ativ
e co
unt
(d)
12 nm
0
5
10
15
20
25
30
35
40
10.4 10.8 11.2 11.6 12.0 12.4 12.8 13.2
Diameter (nm)
Rel
ativ
e co
unt
(c) 12 nm
0
5
10
15
20
25
30
35
40
10.4 10.8 11.2 11.6 12.0 12.4 12.8 13.2
Diameter (nm)
Rel
ativ
e co
unt
(c)
© 2004 Nature Publishing Group
5
Average diameter = 22.06 nmSize variation = ±0.79 nm (± 3.57%)
22 nm
0
5
10
15
20
25
30
35
40
17.8 19.2 20.6 22 23.4 24.8 26.2 27.6
Diameter (nm)
Rel
ativ
e co
unt
(e) 22 nm
0
5
10
15
20
25
30
35
40
17.8 19.2 20.6 22 23.4 24.8 26.2 27.6
Diameter (nm)
Rel
ativ
e co
unt
(e)
© 2004 Nature Publishing Group
6
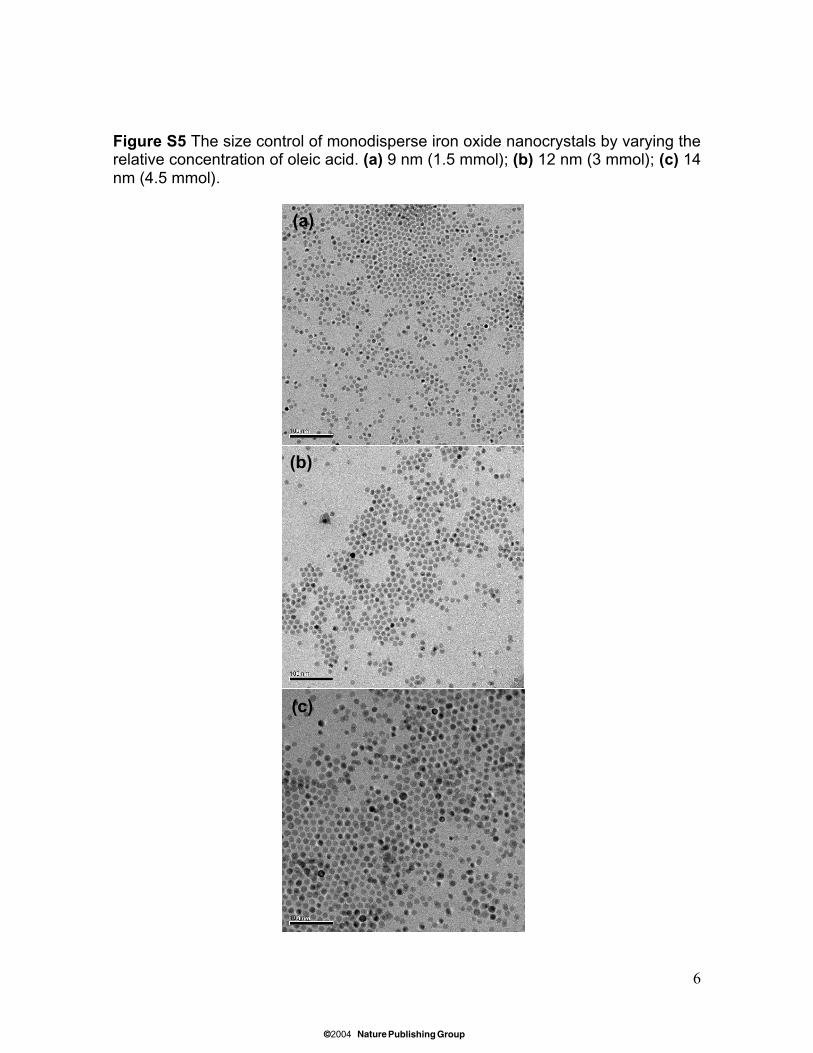
Figure S5 The size control of monodisperse iron oxide nanocrystals by varying therelative concentration of oleic acid. (a) 9 nm (1.5 mmol); (b) 12 nm (3 mmol); (c) 14nm (4.5 mmol).
(a)
(b)
(c)
(a)(a)
(b)(b)
(c)(c)
© 2004 Nature Publishing Group
7
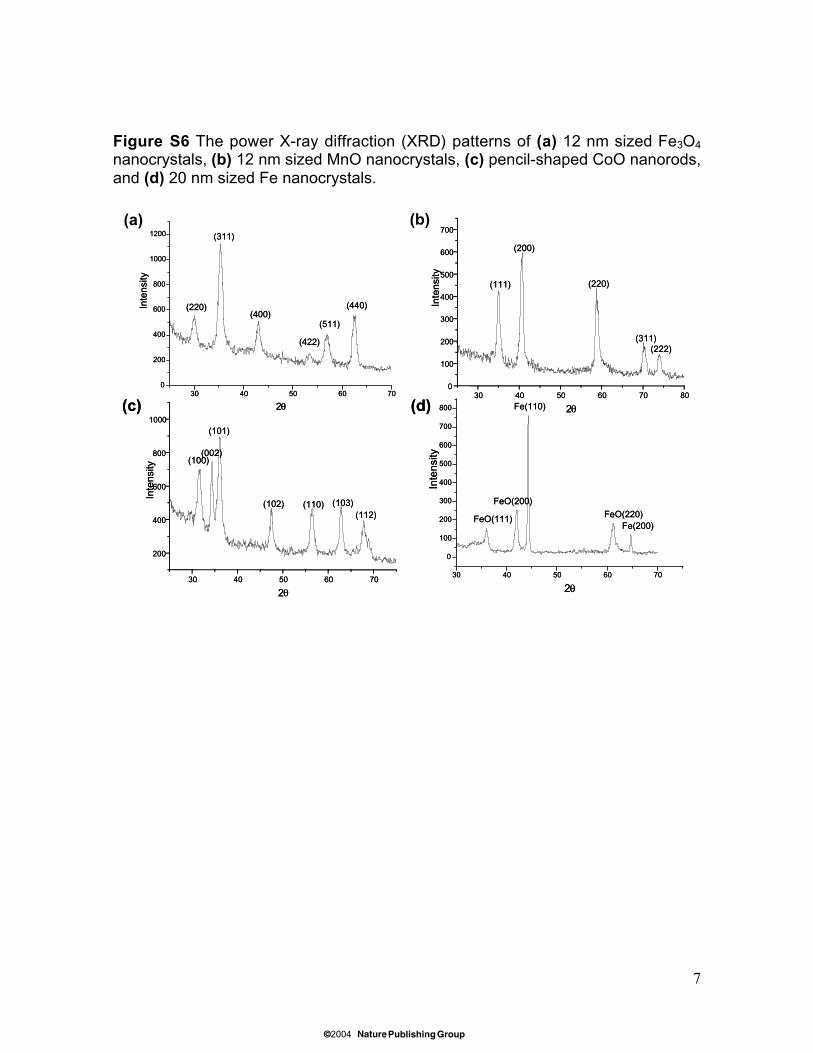
Figure S6 The power X-ray diffraction (XRD) patterns of (a) 12 nm sized Fe3O4
nanocrystals, (b) 12 nm sized MnO nanocrystals, (c) pencil-shaped CoO nanorods,and (d) 20 nm sized Fe nanocrystals.
30 40 50 60 700
200
400
600
800
1000
1200
Intensity
2θ
(220)
(311)
(400)
(422)
(511)
(440)
(a) (b)
30 40 50 60 70 800
100
200
300
400
500
600
700
Intensity
2θ
(111)
(200)
(220)
(311)(222)
(c)
30 40 50 60 70
200
400
600
800
1000
Intensity
2θ
(100)(002)
(101)
(102) (110) (103)(112)
30 40 50 60 70
0
100
200
300
400
500
600
700
800
FeO(220)Fe(200)
Fe(110)
FeO(200)
Intensity
2θ
FeO(111)
(d)30 40 50 60 70
0
200
400
600
800
1000
1200
Intensity
2θ
(220)
(311)
(400)
(422)
(511)
(440)
(a) (b)
30 40 50 60 70 800
100
200
300
400
500
600
700
Intensity
2θ
(111)
(200)
(220)
(311)(222)
(c)
30 40 50 60 70
200
400
600
800
1000
Intensity
2θ
(100)(002)
(101)
(102) (110) (103)(112)
30 40 50 60 70
0
100
200
300
400
500
600
700
800
FeO(220)Fe(200)
Fe(110)
FeO(200)
Intensity
2θ
FeO(111)
(d)
© 2004 Nature Publishing Group
8
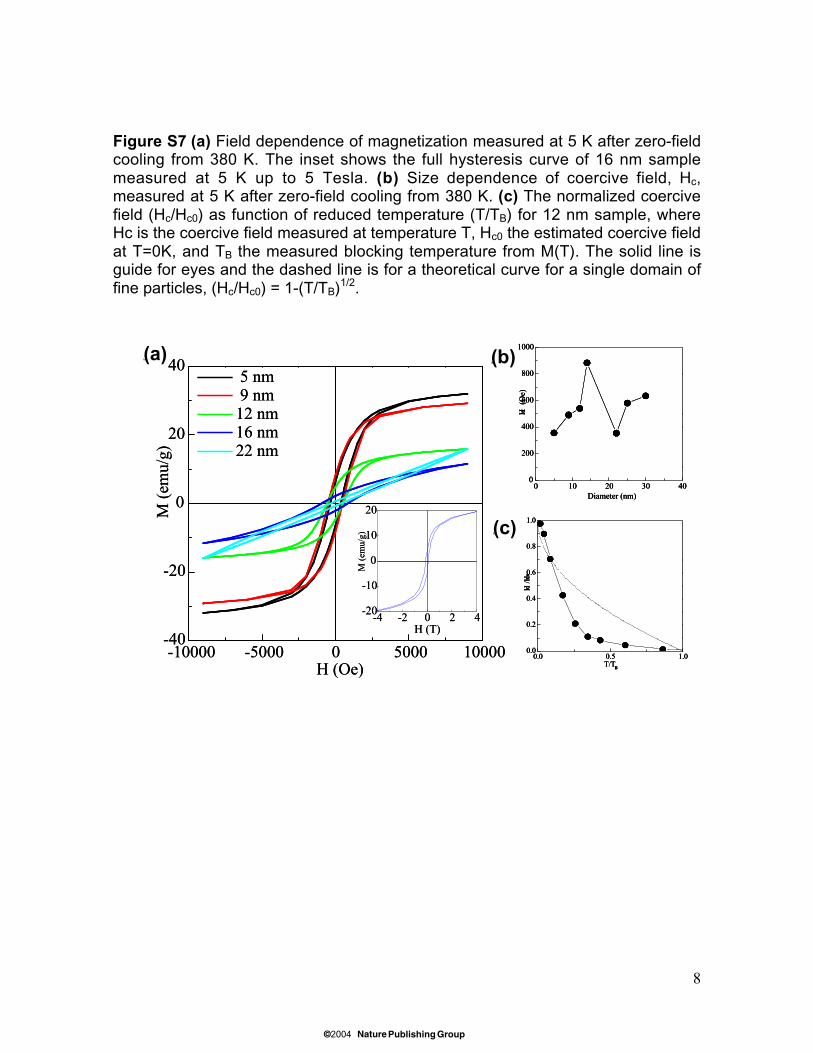
Figure S7 (a) Field dependence of magnetization measured at 5 K after zero-fieldcooling from 380 K. The inset shows the full hysteresis curve of 16 nm samplemeasured at 5 K up to 5 Tesla. (b) Size dependence of coercive field, Hc,measured at 5 K after zero-field cooling from 380 K. (c) The normalized coercivefield (Hc/Hc0) as function of reduced temperature (T/TB) for 12 nm sample, whereHc is the coercive field measured at temperature T, Hc0 the estimated coercive fieldat T=0K, and TB the measured blocking temperature from M(T). The solid line isguide for eyes and the dashed line is for a theoretical curve for a single domain offine particles, (Hc/Hc0) = 1-(T/TB)1/2.
-10000 -5000 0 5000 10000-40
-20
0
20
40
-4 -2 0 2 4-20
-10
0
10
20
5 nm 9 nm 12 nm 16 nm 22 nm
M (
emu/
g)
H (Oe)
M (
emu/
g)
H (T)
0.0 0.5 1.00.0
0.2
0.4
0.6
0.8
1.0HC
/HC0
T/TB
0 10 20 30 400
200
400
600
800
1000
Diameter (nm)
HC
(O
e)
(a) (b)
(c)
-10000 -5000 0 5000 10000-40
-20
0
20
40
-4 -2 0 2 4-20
-10
0
10
20
5 nm 9 nm 12 nm 16 nm 22 nm
M (
emu/
g)
H (Oe)
M (
emu/
g)
H (T)
0.0 0.5 1.00.0
0.2
0.4
0.6
0.8
1.0HC
/HC0
T/TB
0 10 20 30 400
200
400
600
800
1000
Diameter (nm)
HC
(O
e)
(a)(b)
(c)
0.0 0.5 1.00.0
0.2
0.4
0.6
0.8
1.0HC
/HC0
T/TB
0 10 20 30 400
200
400
600
800
1000
Diameter (nm)
HC
(O
e)
(a)(b)
(c)
© 2004 Nature Publishing Group
9
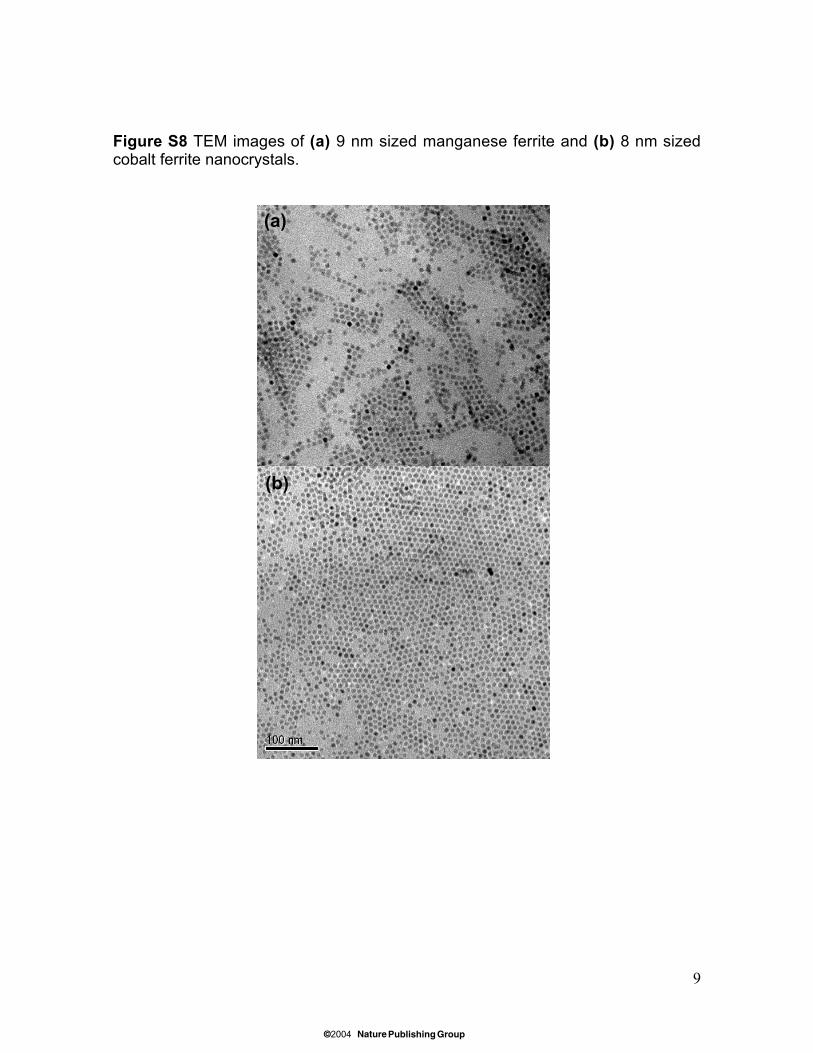
Figure S8 TEM images of (a) 9 nm sized manganese ferrite and (b) 8 nm sizedcobalt ferrite nanocrystals.
(a)
(b)
© 2004 Nature Publishing Group
10
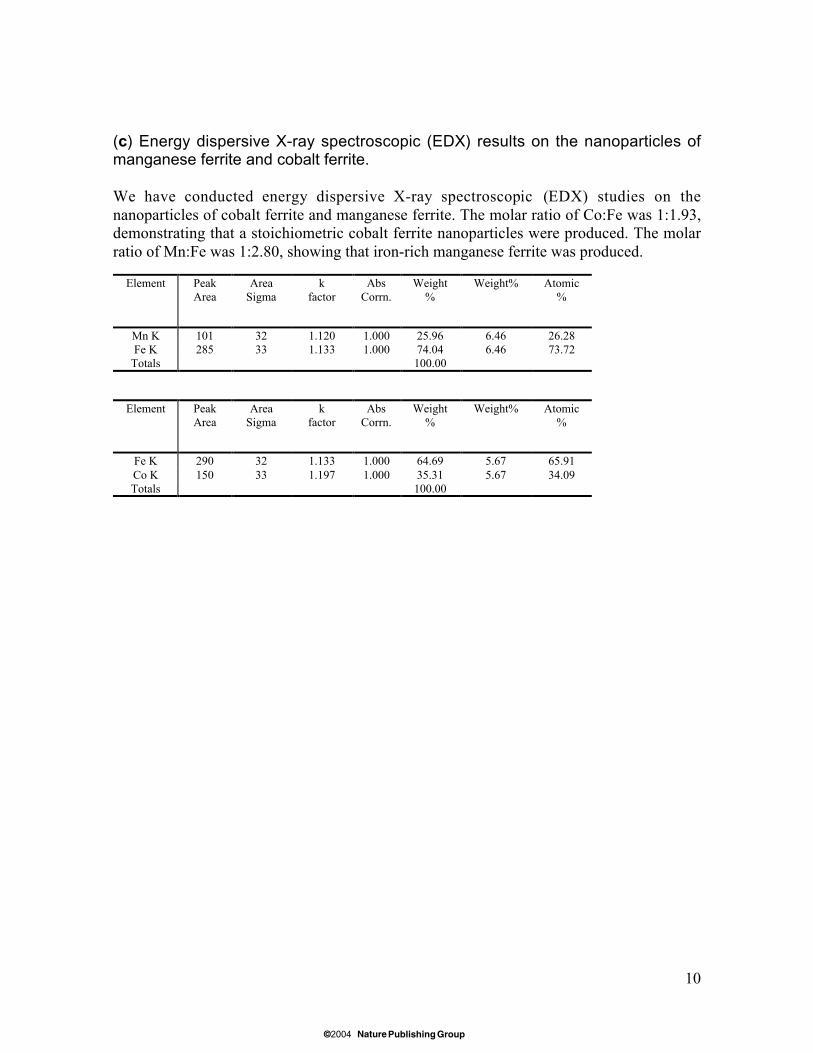
(c) Energy dispersive X-ray spectroscopic (EDX) results on the nanoparticles ofmanganese ferrite and cobalt ferrite.
We have conducted energy dispersive X-ray spectroscopic (EDX) studies on thenanoparticles of cobalt ferrite and manganese ferrite. The molar ratio of Co:Fe was 1:1.93,demonstrating that a stoichiometric cobalt ferrite nanoparticles were produced. The molarratio of Mn:Fe was 1:2.80, showing that iron-rich manganese ferrite was produced.
Element PeakArea
AreaSigma
kfactor
AbsCorrn.
Weight%
Weight% Atomic%
Mn K 101 32 1.120 1.000 25.96 6.46 26.28Fe K 285 33 1.133 1.000 74.04 6.46 73.72
Totals 100.00
Element PeakArea
AreaSigma
kfactor
AbsCorrn.
Weight%
Weight% Atomic%
Fe K 290 32 1.133 1.000 64.69 5.67 65.91Co K 150 33 1.197 1.000 35.31 5.67 34.09Totals 100.00
© 2004 Nature Publishing Group
11
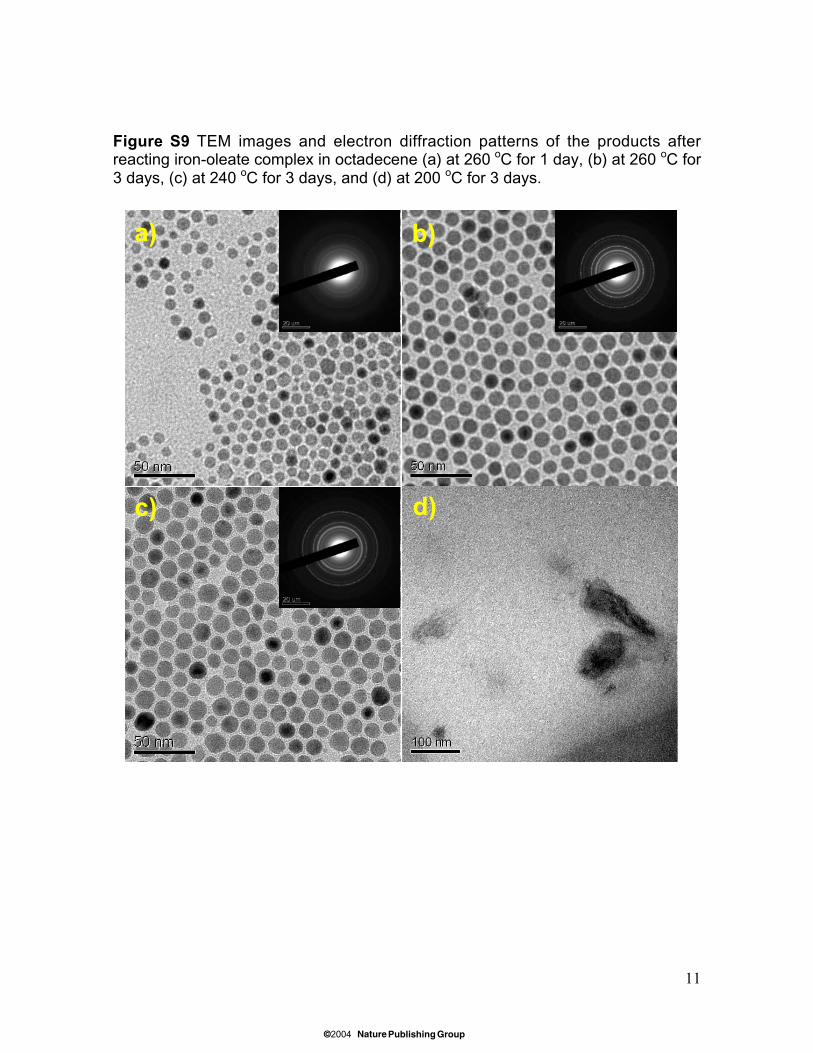
Figure S9 TEM images and electron diffraction patterns of the products afterreacting iron-oleate complex in octadecene (a) at 260 oC for 1 day, (b) at 260 oC for3 days, (c) at 240 oC for 3 days, and (d) at 200 oC for 3 days.
a) b)
c) d)
a) b)
c) d)
© 2004 Nature Publishing Group
12
0 50 100 150 200 250 300 350 400 450
0
20
40
60
80
100
Rel
ativ
e In
tens
ity (
%)
Temperature (oC)
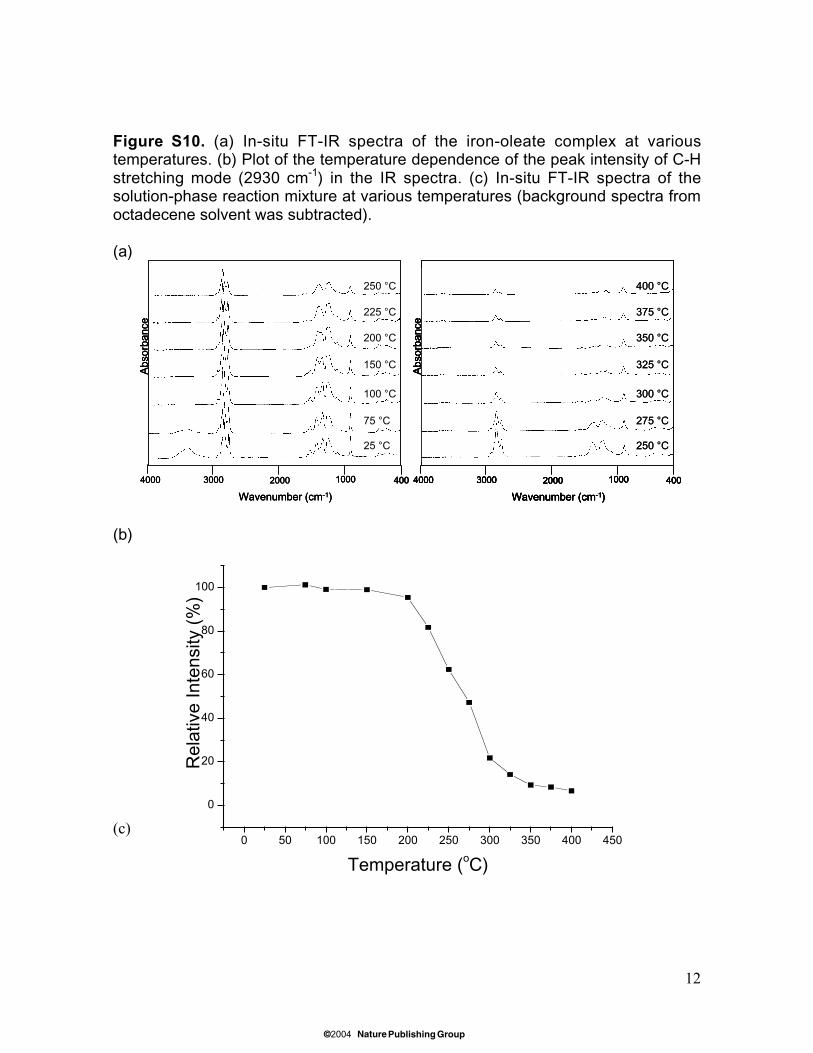
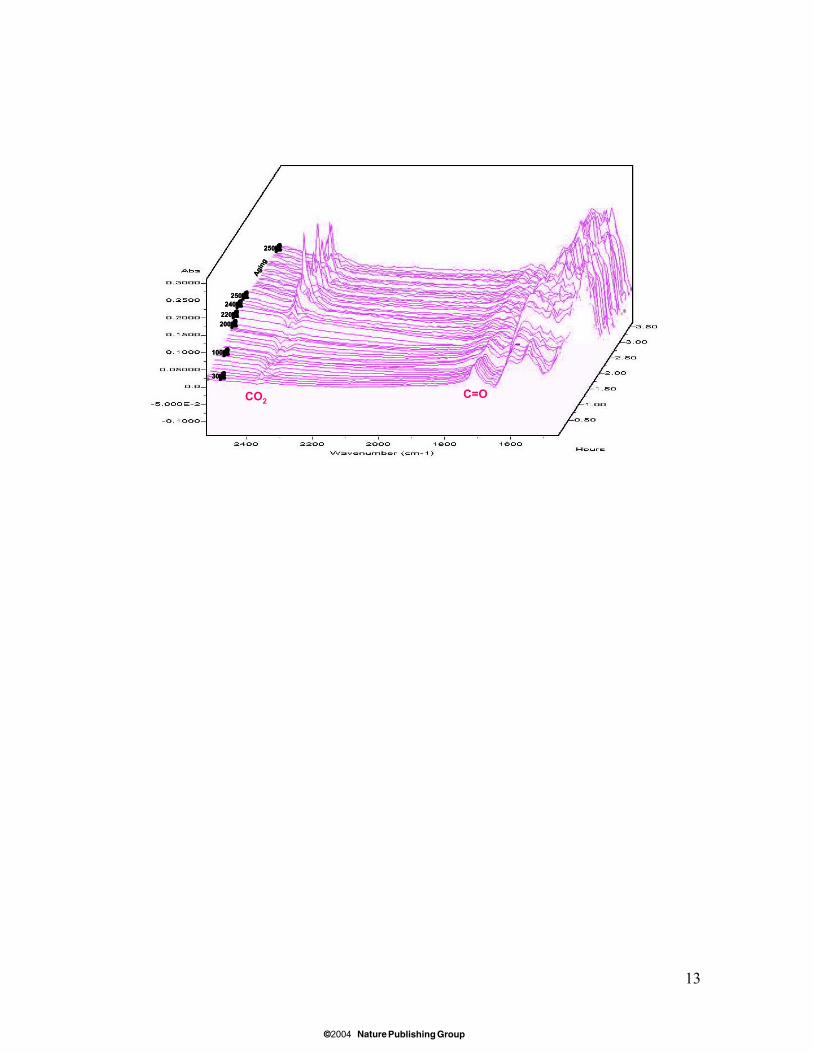
Figure S10. (a) In-situ FT-IR spectra of the iron-oleate complex at varioustemperatures. (b) Plot of the temperature dependence of the peak intensity of C-Hstretching mode (2930 cm-1) in the IR spectra. (c) In-situ FT-IR spectra of thesolution-phase reaction mixture at various temperatures (background spectra fromoctadecene solvent was subtracted).
(a)
(b)
(c)
4000 3000 2000 1000
Wavenumber (cm-1)
Abs
orba
nce
25 °C
75 °C
100 °C
150 °C
200 °C
225 °C
250 °C
4000 4003000 2000 1000
Wavenumber (cm-1)
Abs
orba
nce
250 °C
275 °C
300 °C
325 °C
350 °C
375 °C
400 °C
4004000 3000 2000 1000
Wavenumber (cm-1)
Abs
orba
nce
25 °C
75 °C
100 °C
150 °C
200 °C
225 °C
250 °C
4000 3000 2000 1000
Wavenumber (cm-1)
Abs
orba
nce
25 °C
75 °C
100 °C
150 °C
200 °C
225 °C
250 °C
4000 4003000 2000 1000
Wavenumber (cm-1)
Abs
orba
nce
250 °C
275 °C
300 °C
325 °C
350 °C
375 °C
400 °C
400 4000 4003000 2000 1000
Wavenumber (cm-1)
Abs
orba
nce
250 °C
275 °C
300 °C
325 °C
350 °C
375 °C
400 °C
400 4000 4003000 2000 1000
Wavenumber (cm-1)
Abs
orba
nce
4000 4003000 2000 1000
Wavenumber (cm-1)
Abs
orba
nce
250 °C
275 °C
300 °C
325 °C
350 °C
375 °C
400 °C
400
© 2004 Nature Publishing Group
13
250¡É
220¡É200¡É
250¡É240¡É
30¡É
100¡É
Aging
CO2 C=O
250¡É
220¡É200¡É
250¡É240¡É
30¡É
100¡É
Aging
250¡É
220¡É200¡É
250¡É240¡É
30¡É
100¡É
Aging
CO2 C=O
© 2004 Nature Publishing Group